Article

Nonlinear Analysis of Prestressed Steel-Reinforced Concrete Beams Based on Bond–Slip Theory

1
College of Civil Engineering and Architecture, Guangxi University, Nanning 530004, China
2
Guangxi Key Laboratory of Disaster Prevention and Mitigation and Engineering Safety, Nanning 530004, China
*
Author to whom correspondence should be addressed.
Buildings 2024, 14(9), 2648; https://doi.org/10.3390/buildings14092648
Submission received: 8 July 2024 / Revised: 9 August 2024 / Accepted: 25 August 2024 / Published: 26 August 2024
(This article belongs to the Section Building Materials, and Repair & Renovation)

Abstract

:
In this study, a static load test of prestressed steel-reinforced concrete simply supported beams was carried out utilizing three test beams to investigate the bond–slip effect between the section steel and concrete in prestressed steel-reinforced concrete beams. Finite element models of three beams considering two different bond–slip constitutive relations and without considering bond–slip performance were developed in ABAQUS. The influence of shear bolt nails on the bond slip between the section steel and concrete was analyzed, and the load–slip curves of the three test beams were also computed. Generally, the results showed that the finite element calculations considering the bond–slip effect are more consistent with the experimental calculations, and the bond–slip constitutive relationship proposed by Yang Yong is more suitable for the numerical simulation of prestressed steel-reinforced concrete beams. When the effective prestress is increased from 222.15 KN to 279.61 KN, the ultimate bearing capacity increases by 14.8%. When the concrete strength is increased from 37.21 MPa to 47.97 MPa, the ultimate bearing capacity increases by 15.2%. When the stirrup ratio is 0.50%, compared with 0.25%, the ultimate bearing capacity increases by 7.8%. When the steel content is 5.41%, compared with 3.37%, the ultimate bearing capacity increases by 9.1%. The results of this study can provide a reference for future research and engineering applications of bond slip between section steel and concrete in prestressed steel-reinforced concrete beams in the future.

1. Introduction

The significant relative slip in the later loading stage of prestressed steel-reinforced concrete structures or conventional structures has always been an inevitable problem. Although the relative slip between section steel and concrete can be limited to a certain extent by placing shear connectors on the section steel flange, it is inconvenient or impossible to arrange shear connectors due to beam section size limitations or environmental considerations. If the bond–slip effect between the section steel and the concrete can be adequately considered in the design stage, the use of shear connectors can be reduced or even eliminated to an extent. This approach will essentially decrease the construction difficulty and project cost. Charles [1] evaluated the change in the bond stress along the anchorage length using steel–concrete push-out testing, obtained the corresponding distribution trend, and established a calculation formula for the bond failure load. Li [2] studied the bond strength of section steel concrete under the four influencing factors of the concrete strength grade, protective layer thickness, transverse stirrup ratio, and longitudinal steel ratio through pull-out testing and fitted a calculation formula of the bond strength through mathematical induction. Lorenc et al.’s [3] research shows that the presence of prestressing improves the yield-bearing capacity and ultimate bearing capacity of members by increasing the strength grades and decreasing the ductility of the members. Li [4] conducted an experimental study on the load-carrying capacity and crack development of prestressed profile concrete beams and proposed a load-carrying capacity and crack width calculation formula. Choulli’s [5,6] experimental research indicated that the failure mode of prestressed high-strength concrete I-beams is mainly the bending shear, in which the concrete strength has the most significant impact on the shear capacity. In addition, the experimental shear capacity of a specimen is consistent with the calculation results. Nie [7] carried out relevant experiments on eight prestressed steel–concrete composite beams and proposed a theoretical calculation method for the ultimate bearing capacity considering the bond–slip effect. Wu et al. [8] fitted the bond–slip constitutive relationship between the average bond stress between steel and concrete and the end slip through push-out testing. Kim [9] observed that the application of prestressing at the flange of section steel increases the stiffness and flexural strength. In addition, he provided a mathematical methodology for determining the flexural capacity of this kind of beam structure. The research results of Su [10] indicate that the ABAQUS connector element can reasonably simulate the bond–slip behavior of the steel plate and concrete interface. The normal stress has a significant effect on the peak and residual-stage bonding force but has little effect on the peak slip. The concrete strength has a significant effect on the peak slip and residual bonding force but has little effect on the peak slip and the residual bonding force. Yu et al. [11] presented a novel partially precast prestressed steel-reinforced concrete beam. And through research, it has been found that the prestressing timing has a limited effect on the mechanical behavior of PPPSRC beams because the cracking load difference and the peak load difference in different prestressing timings were both within 5%. The prestress ratio and location strongly affect the anti-cracking capacity of PPPSRC beams. The cracking load can be increased by 166% and 33% when a higher prestress ratio and UHPC are applied, respectively. Although this relationship was not very accurate, it could reflect the bond–slip correlation at different locations within the same steel section. In order to improve the mechanical properties of reinforced concrete structures, Chen et al. [12,13,14] have taken a series of measures in their research, such as the use of recycled aggregates, geopolymers, etc., and the precise control of the dosage of additives, as well as the use of vacuum infusion to ensure the compactness of concrete, and the use of GFRP reinforcement to improve the load-bearing capacity of concrete members. Izadifar et al. [15] proposed a comprehensive interface interaction and investigated the model CSH gel structure represented by tobermorite in concrete production, which plays a crucial role in the mechanical properties and durability of hydrated cement. Many scholars [16,17,18,19,20,21,22,23,24,25,26] have studied the various mechanical properties of prestressed steel-reinforced concrete members and even proposed relevant calculation theories. However, targeted research on the bond–slip effect between section steel and concrete has not led to the formation of a sufficiently accurate and integral theoretical system.
The multicomponent finite element models of three test beams are created in ABAQUS based on the bond–slip constitutive relation B proposed by Yang Yong [27], according to the push-out test results of 16 section steel concrete columns [28], and bond–slip constitutive relation A presented by Liu Can [29], utilizing the beam type test results of section steel concrete. A static load test of prestressed steel-reinforced concrete beams, which included three test beams, is carried out to verify the accuracy of the finite element simulation. The test results are compared with the finite element calculations [30], and the applicability of the two bond–slip constitutive relations in prestressed steel-reinforced concrete structures is evaluated. In contrast, several models are built to analyze the influence of shear bolt nails on the bonding slip between the section steel and concrete, and the load–slip curves of the three test beams are calculated and analyzed. Finally, the effects of different prestresses, concrete strengths, stirrup ratios, and steel contents on the bonding slip between the section steel and concrete are addressed. The flowchart of the specific technical approach of this study is shown in Figure 1.

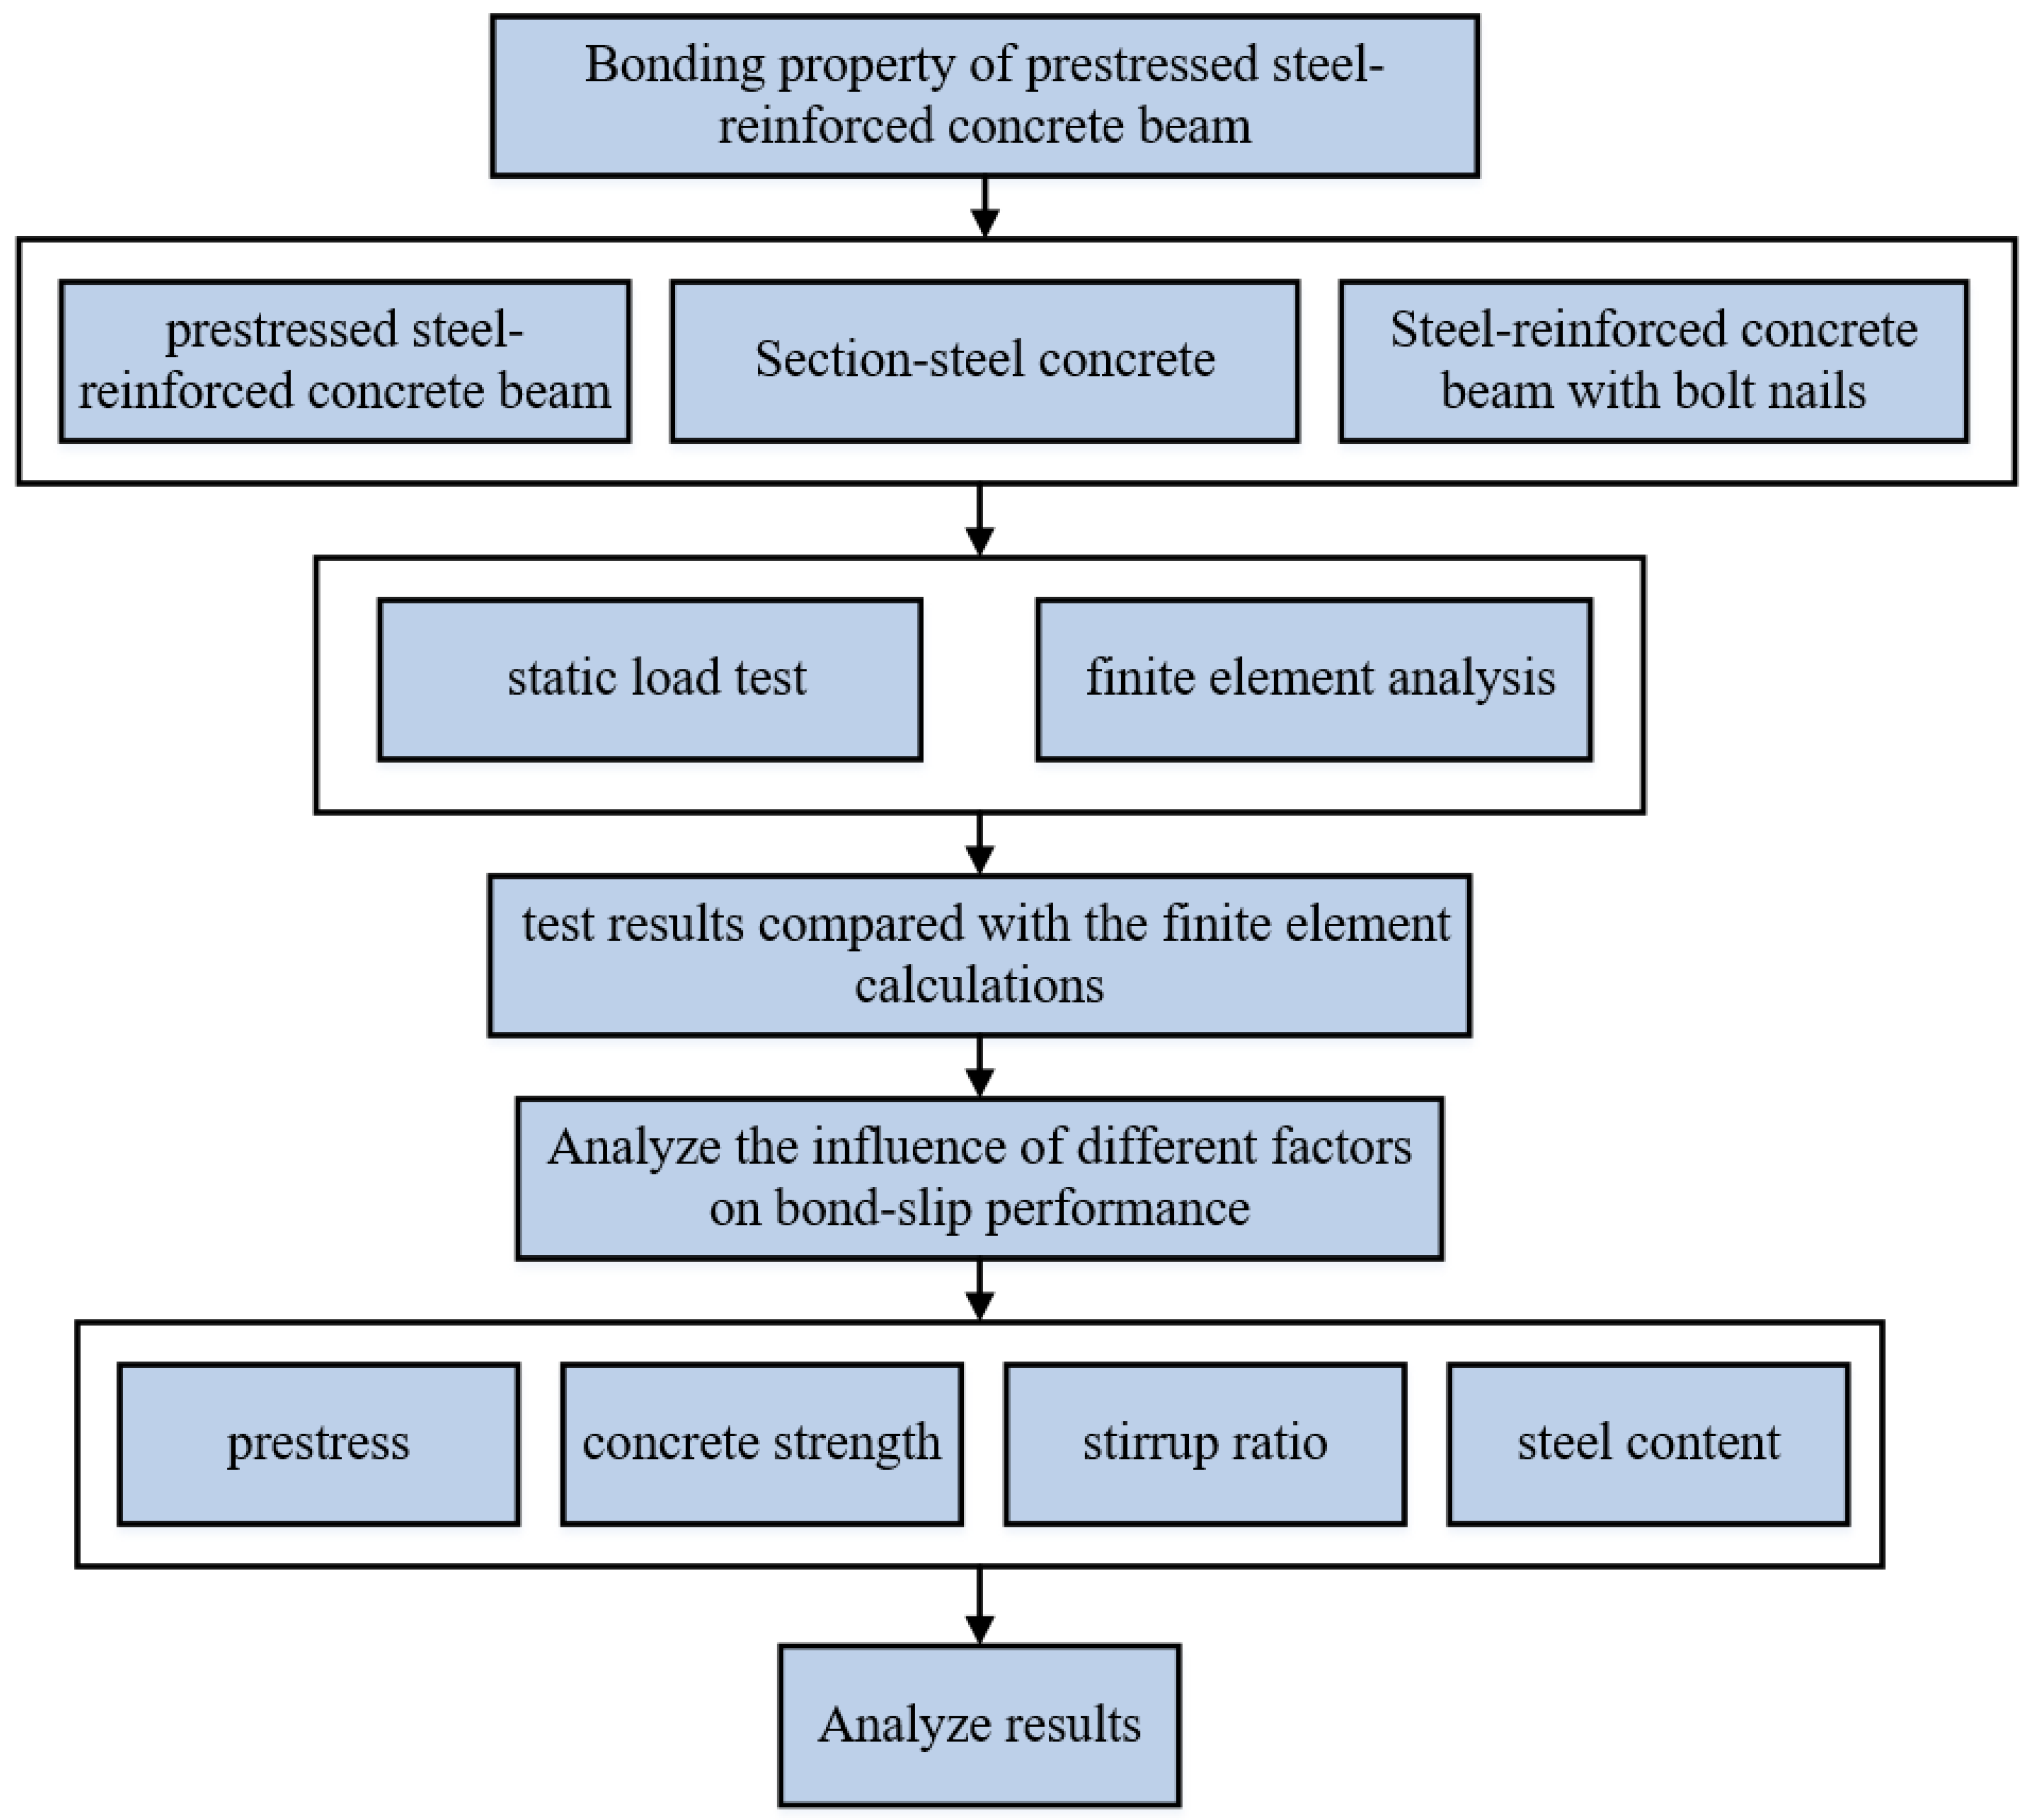
2. Experimental Program

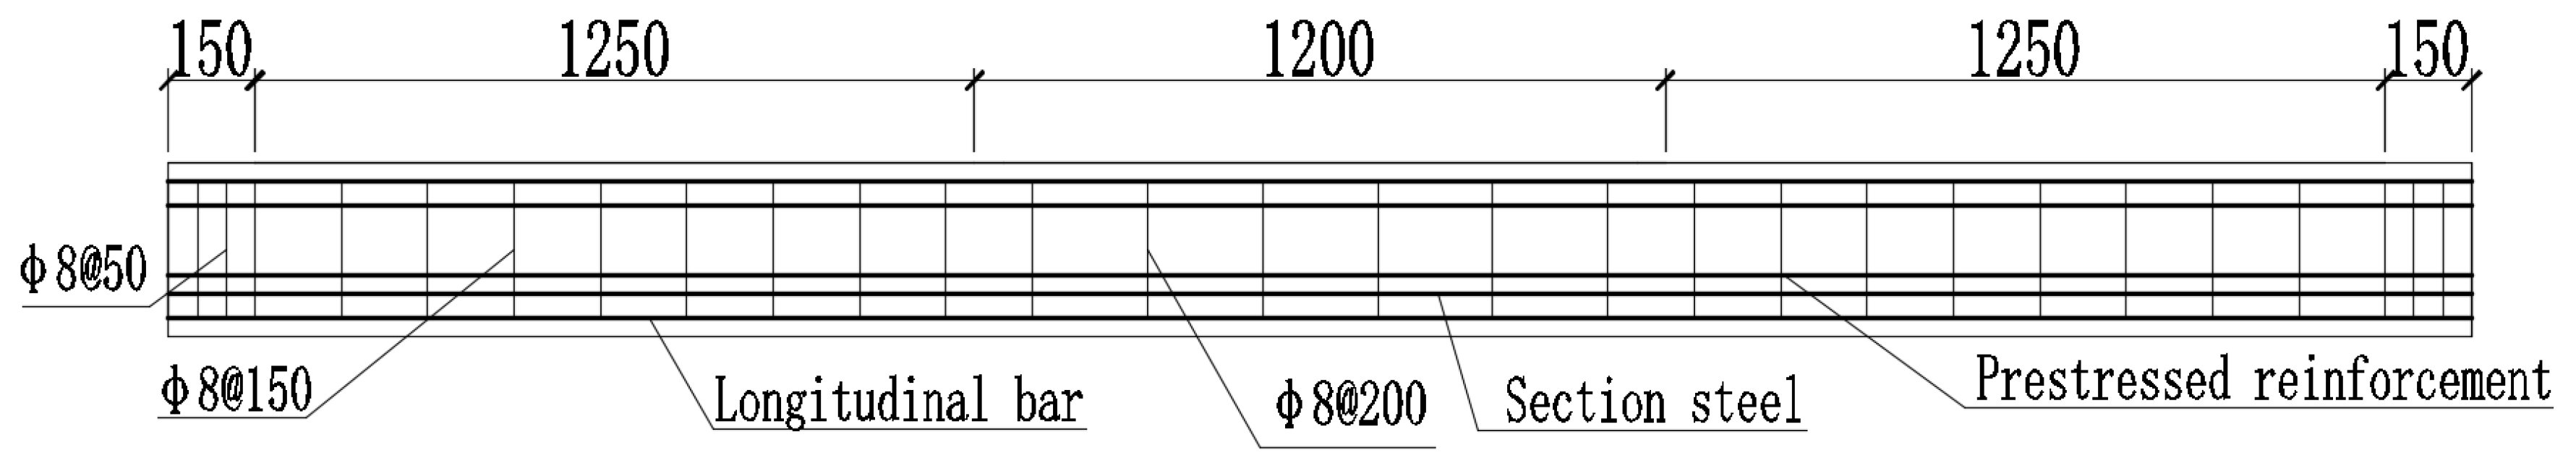
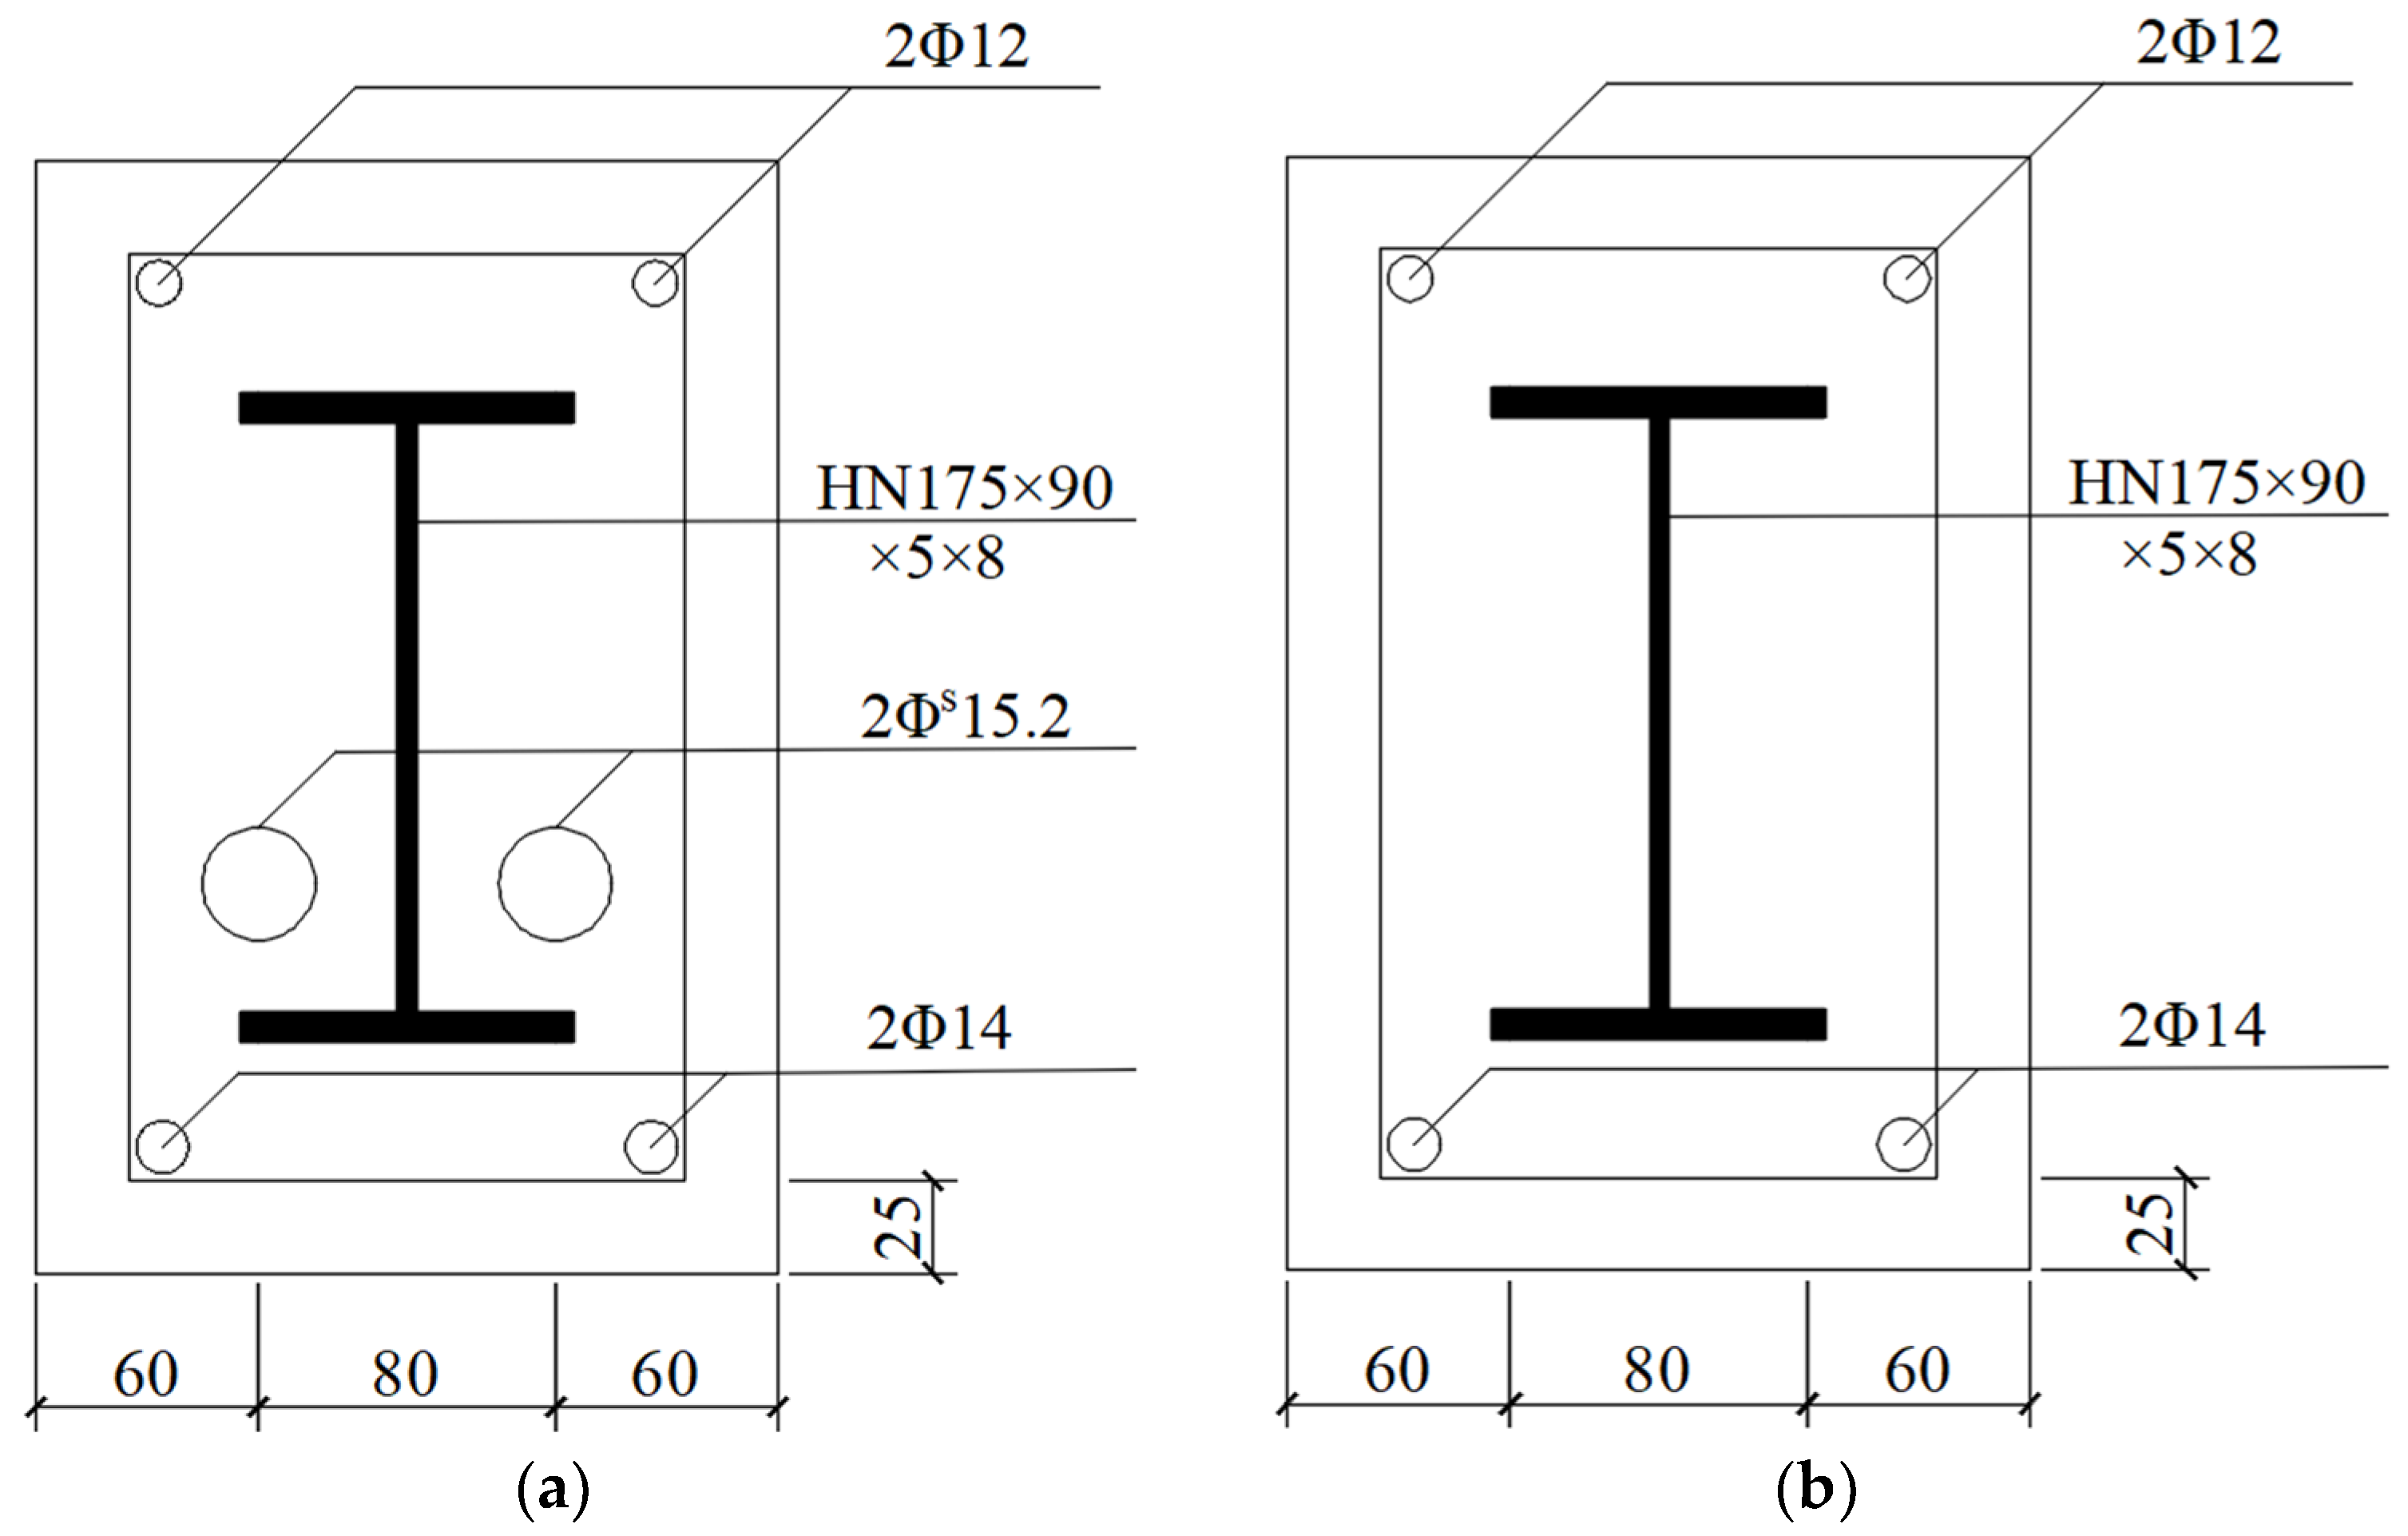
2.1. Specimen Design

The following three beam specimens are designed in this paper: (1) a prestressed steel-reinforced concrete beam (PSRCB), (2) a section steel concrete beam (SRCB-A), and (3) a section steel concrete beam with bolt nails (SRCB-B). C40 commercial concrete is used during the pouring process, and the tensile longitudinal reinforcement is constructed of φ14 mm, while the longitudinal reinforcement for compression is φ12 mm. A stirrup made of φ8 mm and two 1860 high-efficiency low-relaxation steel strands (278 mm2) are utilized for each test beam. The center distance of the steel strand is 80 mm, and the distance from the center of the steel strand to the bottom is 105 mm.
The three beams had the same section size: b × h = 200 mm × 300 mm with H-sections of HN175 mm × 90 mm × 5 mm × 8 mm. Figure 2 and Figure 3 show that the test piece is a simply supported post-tensioned prestressed steel-reinforced concrete beam. The steel strand assumes straight-line reinforcement. Six shear bolt nails are arranged on the upper flange of the steel section in the bending shear section, as demonstrated in Figure 4 and Figure 5.
Table 1 and Table 2 show the measured mechanical property indices of the concrete and steel of the test beam. The formwork for the test beam is shown in Figure 6.

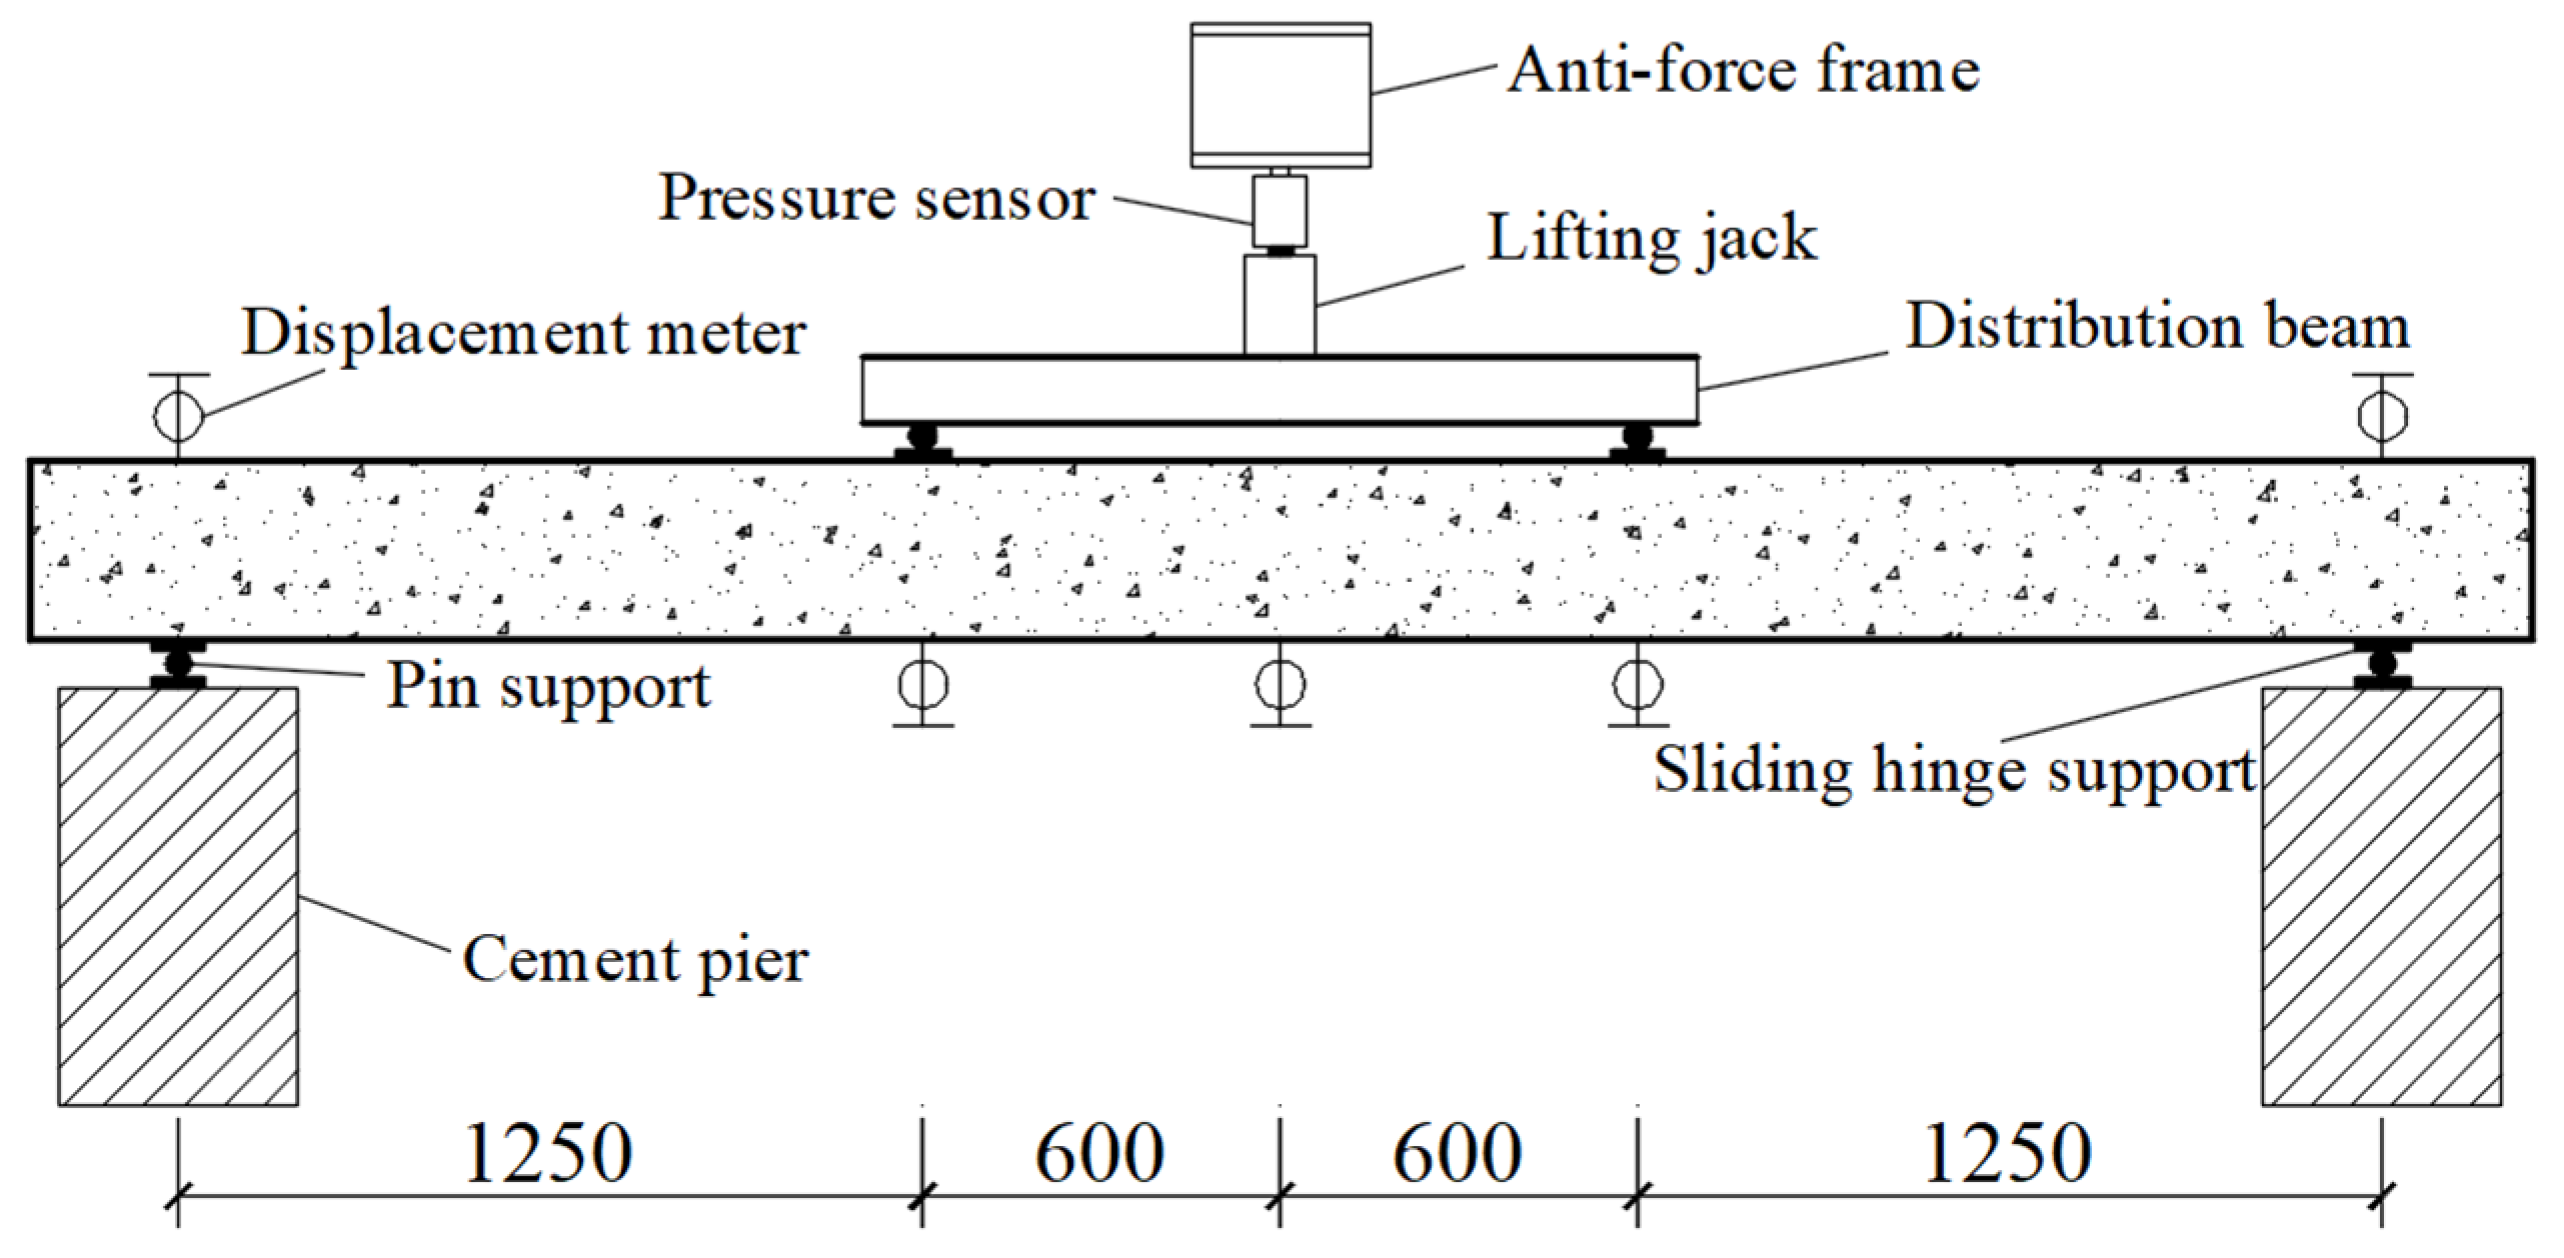
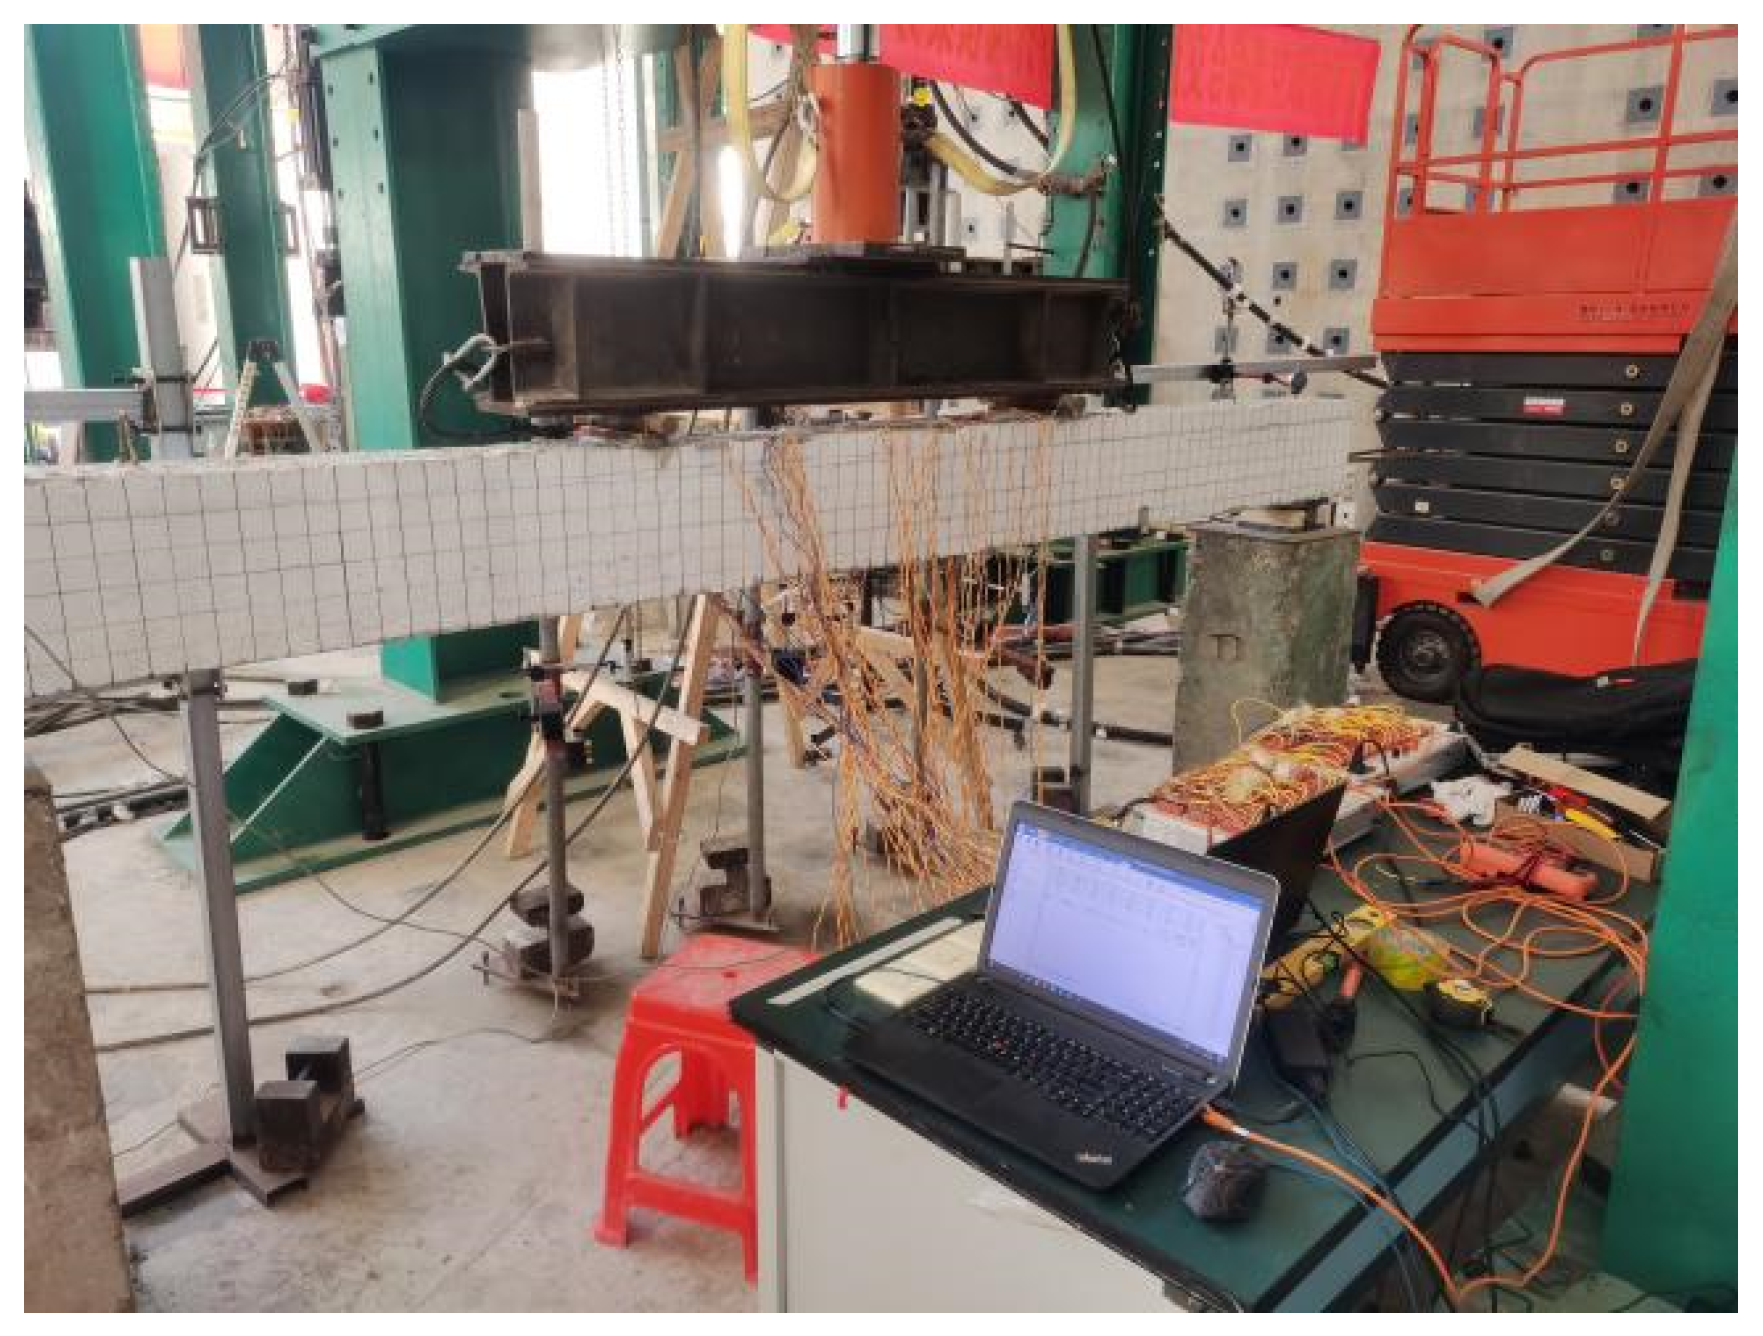
2.2. Loading Equipment and Measuring Instrumentations

The content tested in the experiment includes the longitudinal reinforcement strain, concrete strain, section steel strain, deflection, development of concrete cracks, cracking load, and ultimate load.
A total of 20 resistance strain gauges with a gauge length of 100 mm are installed at the surface of two sections of the pure bending section of each specimen—4 in the compressive area, 6 in the tensile area, and 10 on the side face—to measure the strain distribution of the concrete under each level of load. Additionally, 7 resistance strain gauges with a gauge length of 2 mm are placed in the pure bending section of each reinforcement to determine the strain of the reinforcement under various levels of load. The strain distribution of the profile steel under each load level is estimated using resistance strain gauges (2 mm long) set at the upper and lower flanges and webs of the profile steel. The change in the deflection of the specimen is observed by five displacement meters situated for each specimen. These meters are placed at various points along the beam span in the middle, the loading point, and the support location. Preparation for the test includes drawing a 50 mm × 50 mm grid positioning line, observing the crack development after each level of loading, numbering each gap according to the sequence of crack development, drawing and numbering the cracks that develop on the beam, drawing the crack trends of the new cracks, and marking the load level when the cracks reach a certain height.
The three specimens are subjected to a static load on the portal reaction frame in the test hall of the large-scale structural test and research platform of Guangxi University. The external load is applied by a hydraulic jack controlled with a capacity of 1000 kN by an electric oil pump, which is measured using a load sensor. Figure 7 shows a schematic diagram of the loading device, and Figure 8 represents the actual device.
The test beam adopts a two-point centralized and symmetrical synchronous step-loading mode. The length of the pure bending section in the mid-span is 1.2 m. Sensors, jacks, and other components are mounted under the reaction frame steel beam. The test beam frame is placed on two supporting points and is loaded monotonically. The applied load is based on the calculated ultimate load of the beam as a reference. After each load level is added, the load must be maintained for 10 min, and the data are collected after the load has stabilized. When the deformation is large and continues after loading, the current level is increased. After determining that the load drop value of the current level does not exceed 5% of the load value, it is possible to consider that the load of the current level is steady, and the next level’s load is applied until the concrete is crushed.
The data collected from the dh3816n static strain testing and analysis system on the resistance strain gauges distributed on the surface of concrete and steel sections during the experiment showed that before the specimen cracks, the average strain of the three test beams can better conform to the plane section assumption, and the concrete strain in the mid-span section exhibits a good linear relationship with the stress. When the load increases to the point of concrete cracking, the concrete strain in the mid-span section no longer satisfies the linear relationship because cracks have formed. As a result, the influence of concrete cracks and internal force redistribution has occurred in the beam body, and the plane section assumption is no longer satisfied. At this point, the section steel strain of the mid-span section can still retain a strong linear relationship.

3. Numerical Analysis of Prestressed Steel-Reinforced Concrete Beams

3.1. Determination of the Bond–Slip Constitutive Relationship

As a new structural system, prestressed steel-reinforced concrete has exceptional mechanical performance. Although the bearing capacity can be calculated theoretically, it is necessary to use numerical simulation methods such as finite element analysis to carry out nonlinear structural analysis to obtain a more comprehensive understanding of the mechanical characteristics of prestressed steel-reinforced concrete. While the experiment is more time-consuming, numerical analysis methods such as the finite element method are more efficient than other methods and do not require much manual labor or material resources. Hence, models of the three test beams are established in ABAQUS to simulate the above static load tests of prestressed steel-reinforced concrete beams. The nonlinear finite element analysis also considers the bond–slip effect between steel and concrete to obtain accurate calculation results.
Currently, no reliable bond–slip constitutive relationship curve has been proposed for prestressed steel-reinforced concrete beams. Therefore, in this paper, the bond–slip constitutive relation curve obtained by Yang Yong [27] according to the push-out test results of 16 section steel concrete beams and the bond–slip constitutive relation curve deduced by Liu Can [29] according to section steel concrete beam test results are used for numerical simulation to explore the applicability of the two constitutive relations in prestressed steel-reinforced concrete beams.

3.2. Establishment of a Spring Element

As a result of the three-dimensional interaction between profile steel and concrete, it is necessary to use nonlinear spring elements in three directions to simulate the bond–slip effect. The normal direction is perpendicular to the connecting surface, the longitudinal tangential direction is parallel to the axial direction and parallel to the connecting surface, and the transverse tangential direction is perpendicular to the axial direction and parallel to the connecting surface, as shown in Figure 9. The force–deformation (F-D) curve of each spring characterizes its performance. The bond–slip constitutive relationship between the section steel and concrete in all directions is responsible for forming the F-D curve.
(1)
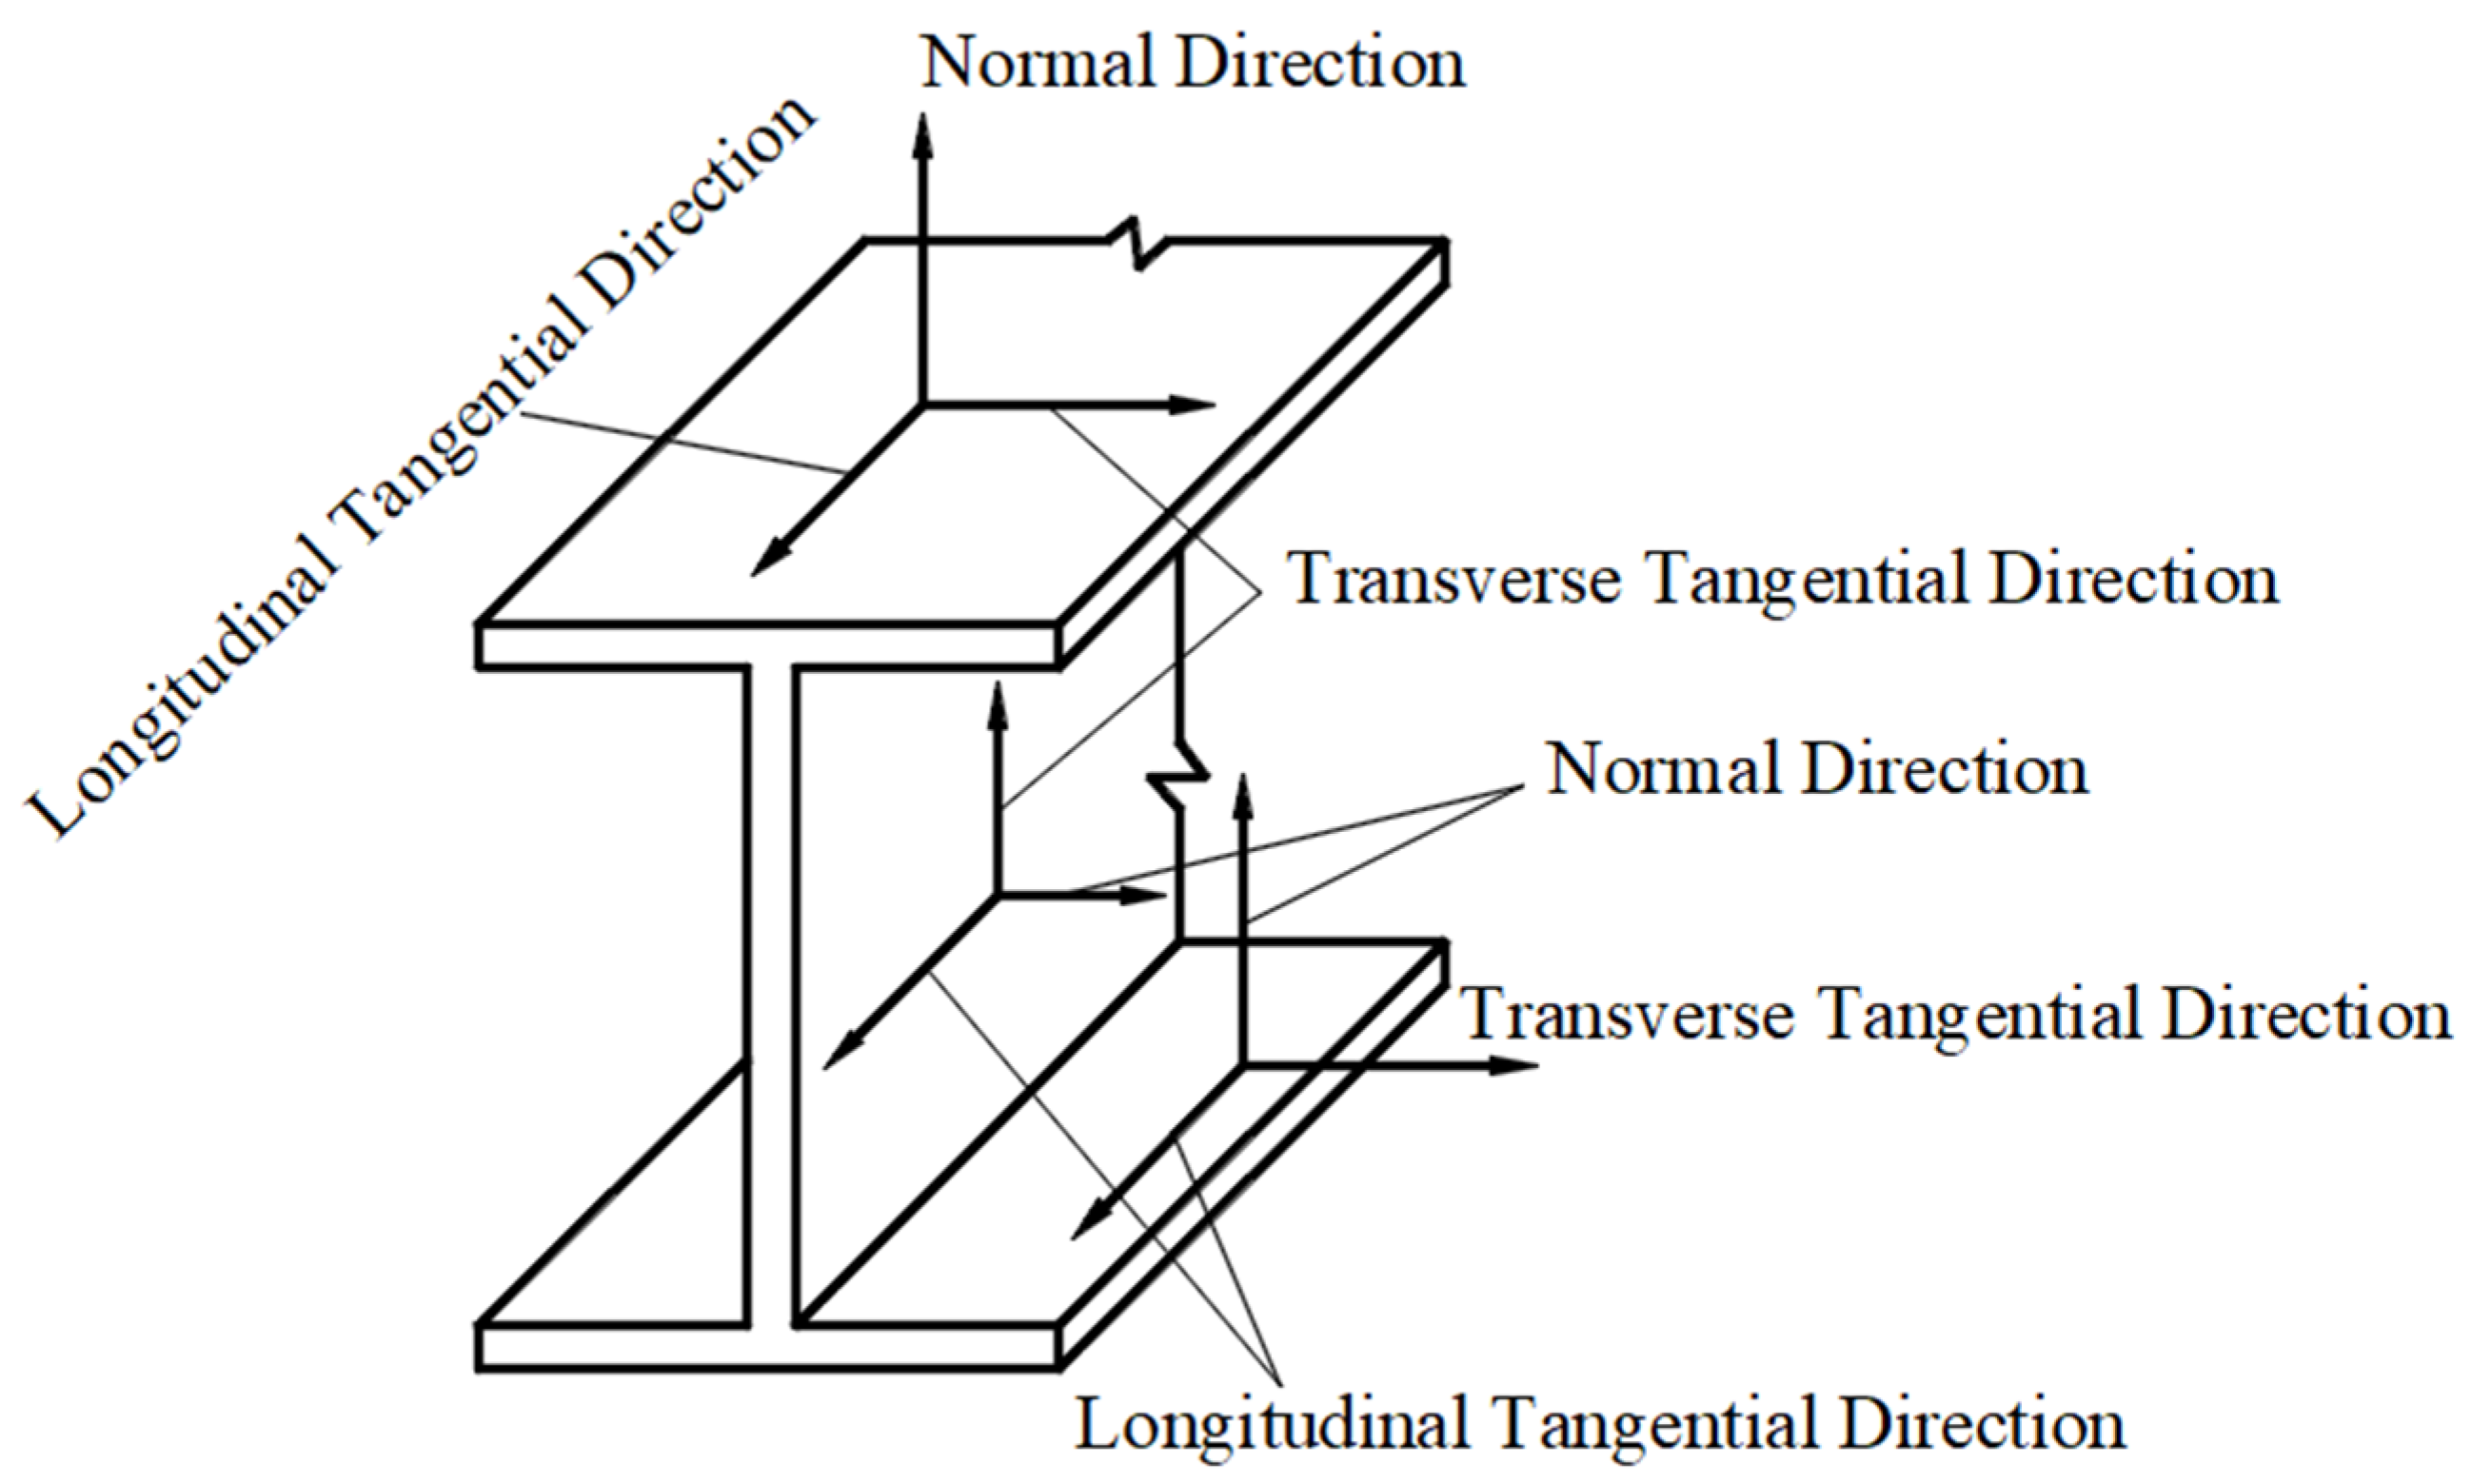
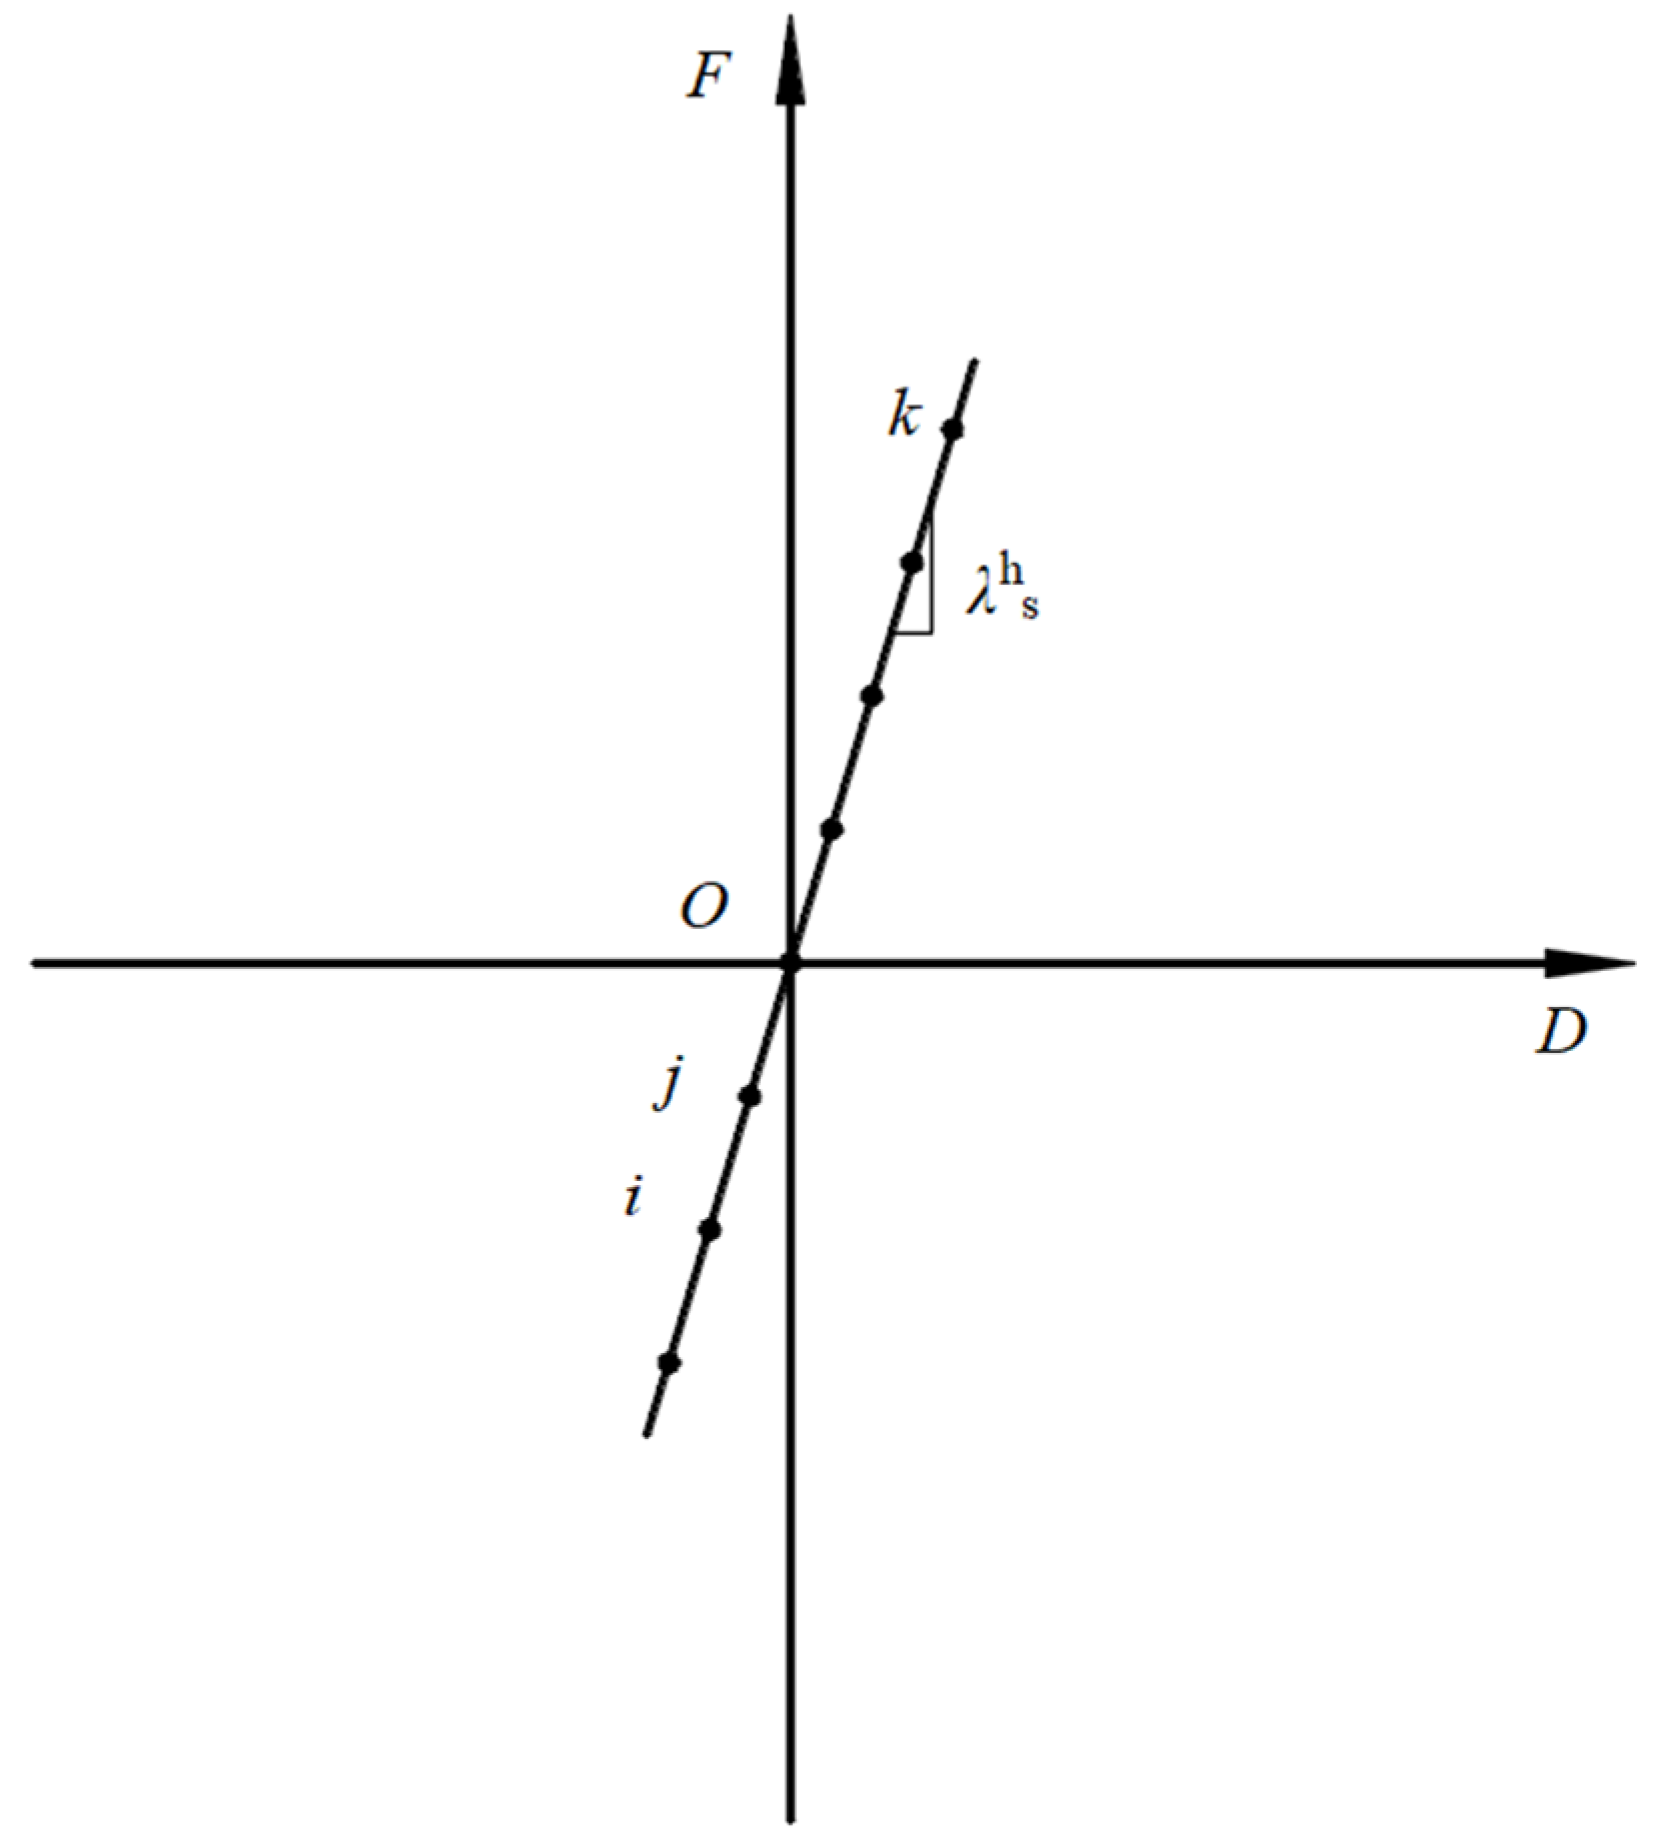
Normal direction: Considering that when the section steel and concrete slips greatly, the normal displacement is much less than the longitudinal displacement, the bonding action in this direction can be simplified as a spring with a high stiffness coefficient, according to the suggestions given in the literature [31]. As shown in Figure 10, the F-D curve is a broken line passing through the origin: in the third quadrant, it is a line with a steep slope, which indicates a significant stiffness coefficient, and in the first quadrant, it is a line coincident with the D axis.
(2)
Transverse tangential: It can be assumed that the bond–slip effects of the transverse tangential and longitudinal tangential effects are identical for the profile steel flange; hence, the same F-D relationship curve can be used. Because of the anchoring impact of the flange on the section steel web, the lateral slip will be greatly reduced. Therefore, the same treatment method for the normal direction can be adopted; the F-D curve is defined as a line with a steep slope passing through the origin, as shown in Figure 11.
(3)
Longitudinal tangential: The bond–slip effect between the section steel and the concrete in this direction is the main component of the bond slip. The longitudinal tangential bond–slip constitutive relationship was discussed in the previous section. According to the relationship curve, the F-D curve of the nonlinear spring element can be derived, and its mathematical expression is as follows:
F = τ ( D , X i ) × A i
where A i is the area occupied by the spring unit on the connecting surface, as shown in Figure 12.
However, it should be noted that the bond–slip constitutive relationship curve of the longitudinal tangent, which is employed in this paper, does not pass through the origin of the coordinate axes. For the nonlinear spring element, the F-D curve may be configured in ABAQUS to be a curve that passes through the coordinate origin to facilitate a convergent calculation. The initial slip point in the bond–slip constitutive relationship curve with a nonzero point must thus be replaced by a closer point. Finally, the fitted curve passes through the coordinate origin.

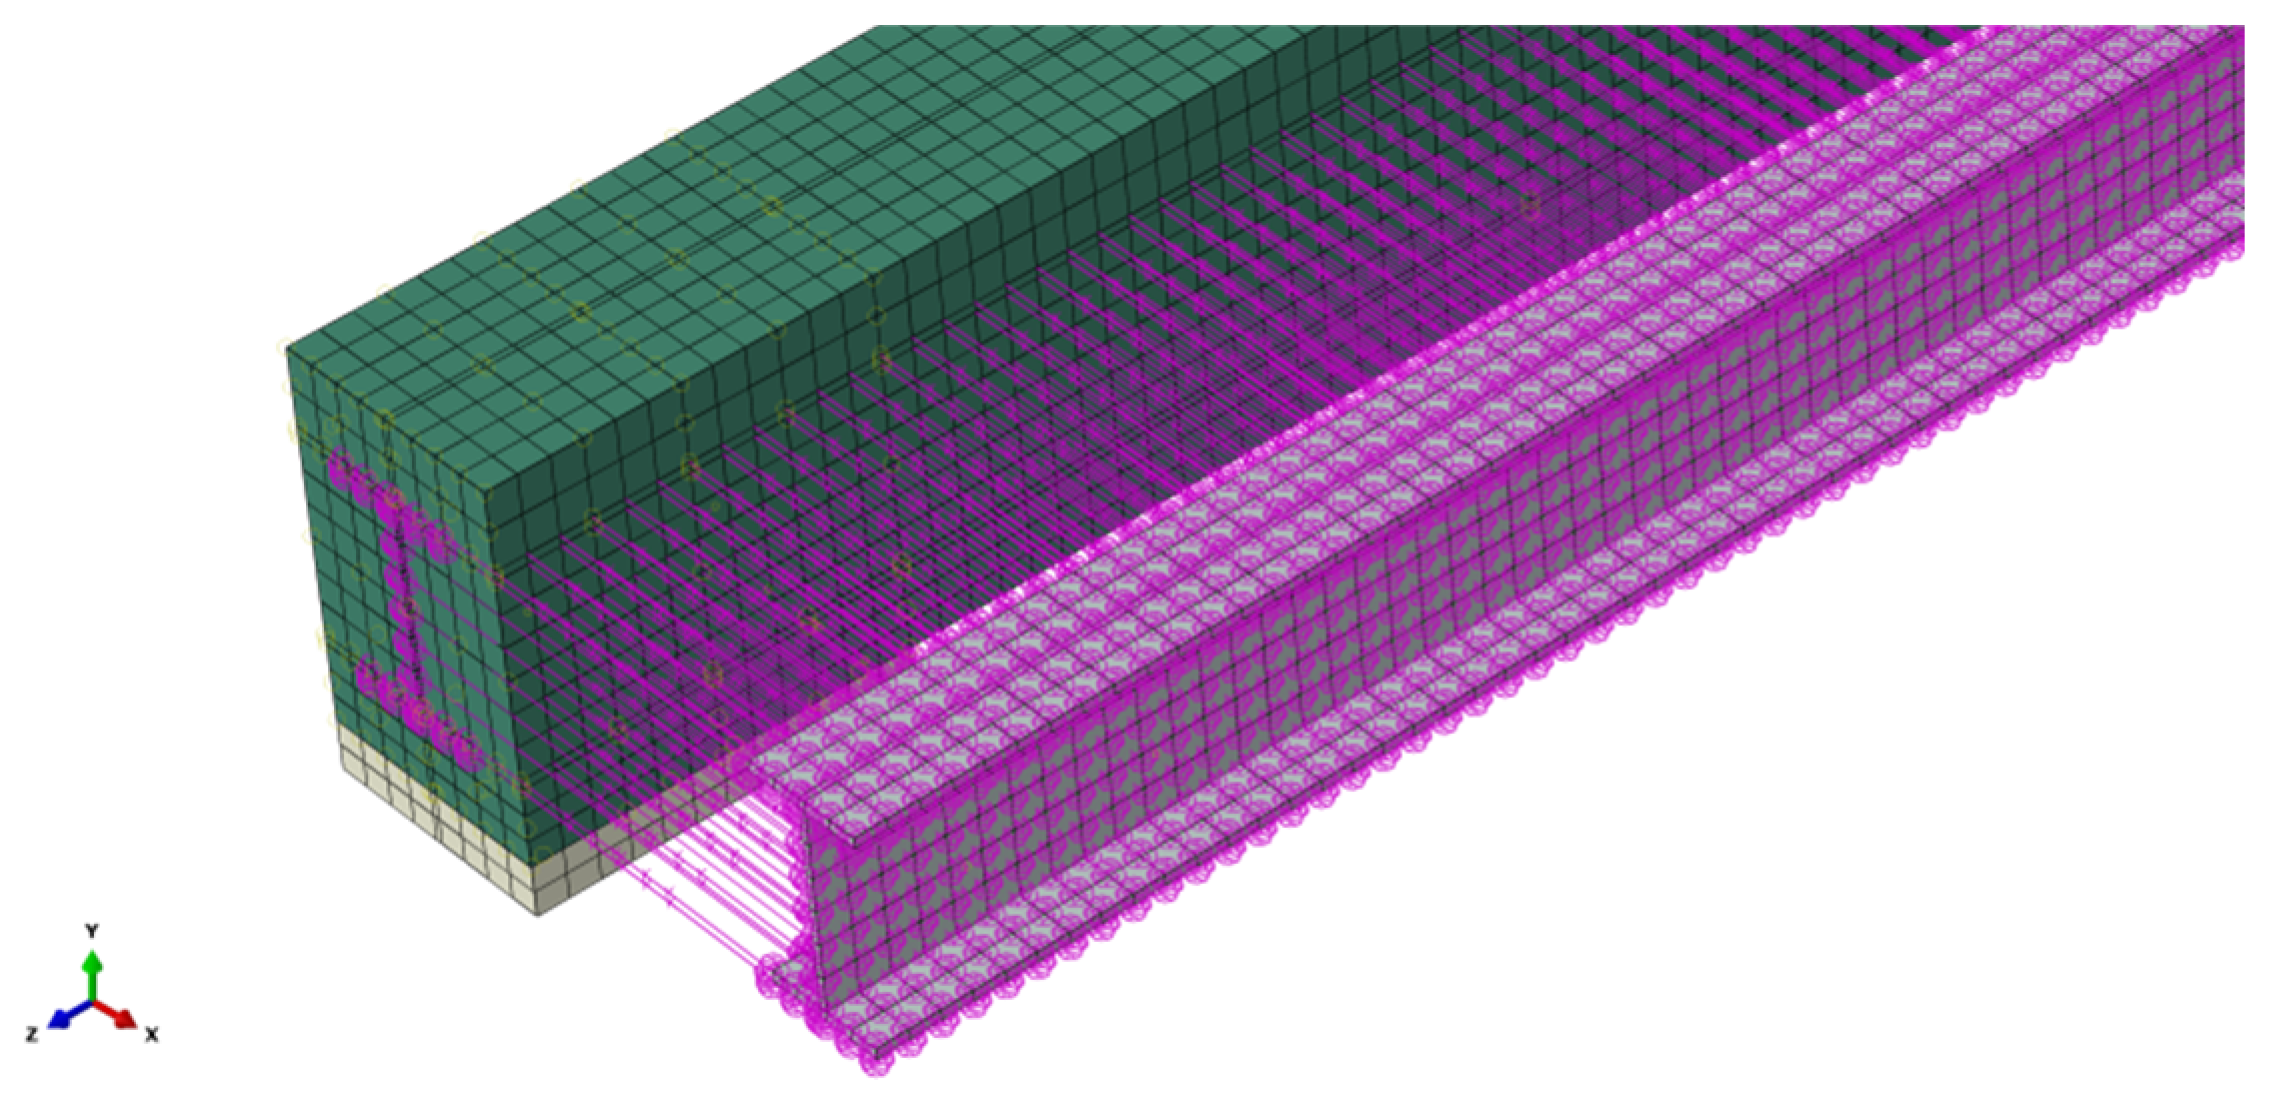
3.3. Model Establishment

To produce more accurate reinforcement stress estimates, a separate modeling method is adopted in this paper, and the concrete, prestressed reinforcement, longitudinal reinforcement, and stirrup are treated as different units. The C3D8R element is used in simulating the concrete element, section steel element, and bolt nail element-level steel spacer element. The ordinary steel bars and prestressed steel bars are simulated by two-node three-dimensional truss elements (T3D2). The spring2 element emulates the bond–slip effect between the section steel and concrete in prestressed steel-reinforced concrete beams [32].
As the model is subjected to increasing damage under external loading, in addition to crack extension, the concrete material in the model experiences irreversible stiffness degradation as well as strength degradation [33]. The way of stiffness degradation of the material is described in ABAQUS by defining the damage factor as follows [34,35,36]:
d = 1 σ t r u e E c ε c / t p l ( 1 / b c / t 1 ) + σ t r u e E c
In the above equation, d represents the value of the tensile and compressive stress loss. When d = 0, it represents that the elastic modulus is not damaged; when d = 1, it represents that the elastic modulus is completely degraded. ε c / t p l represents the equivalent plastic strain. b c / t represents the ratio coefficient of the inelastic strain and equivalent plastic strain, which is taken in the range of 0.1–0.5 for tensile, and in the range of 0.5–0.9 for compressive.
σ t r u e represents the true stress of concrete, which is calculated as follows:
ε t r u e = ln 1 + ε
σ t r u e = σ t 1 + ε
ε i n = ε t r u e σ t r u e E c
ε c / t p l = b c / t ε i n
In the above equation, ε t r u e is the real strain; ε i n is the inelastic strain. From the above, it can be seen that the damage that occurs in the concrete will give the finite element simulation results a great impact, so in the whole process of calculation, the damage factor is not to be ignored in the influence of factors. So, the concrete plastic damage model is selected to establish the concrete damage model, and the stiffness degradation mode of the material is described by defining the damage factor in ABAQUS.
Since the relative slip between the steel sections and the concrete is much larger than that between the reinforcement and the concrete in prestressed profile concrete beams, the bond–slip effect between the reinforcement and the concrete can be neglected and simulated by using a shared node.
When creating a finite element model, each component of the test beam model is first established independently: the concrete, section steel, steel bar, nonlinear spring element that simulates the bond–slip effect between section steel and concrete, bending shear bolt nails, and support pads. A finite element model is developed and constructed according to the parameter design of each of the three test beams, in which the effective prestress is 279.61 kN, the concrete strength is 37.21 MPa, the hoop ratio is 0.25%, and the steel content of the section steel is 3.37%. The material properties were subsequently set to match the material parameters in Table 1 and Table 2. This paper uses the International System of Units (SI) for modeling and analysis. It is important to note that when simulating the bonding effect, spring elements with different parameters must be arranged between the steel and concrete according to the bonding stress distribution, and it is necessary to extract the nodes at each position to ensure that the spring elements are correctly placed. The common nodes of the contact surface between the steel and concrete are derived in ABAQUS with a program coded in Python. After that, we set the analysis step, apply the load and boundary conditions utilizing the loading system of the test beam, divide the mesh, and finally submit the task for calculation. Steel pads with a thickness of 40 mm are located at the loading point and the support, and the elastic modulus of the steel pad is ten times greater than that of the steel. This procedure is conducted to avoid stress concentration and improve the convergence of the calculation procedure.
When setting the boundary conditions, based on the actual constraint effect of a simply supported beam, a constraint U1 = U2 = U3 = UR3 = 0 is set on a steel cushion block at the bottom of the beam to release rotation in the x and y directions, forming hinge support. Set constraints U1 = U2 = UR3 = 0 on another steel cushion block, and increase the release of translational motion in the z-direction compared to the other end, forming a sliding support.
In the meshing stage, in order to ensure the independence of the mesh and better convergence of the calculation process, the concrete, steel sections, reinforcement, bending and shear section bolt nails, bearing pads, and other components are meshed separately, and the mesh is adjusted before the finite element model is assembled. The specific finite element model is shown in Figure 13 and Figure 14.

4. Comparison between the Simulation and Test Results

As mentioned previously, in this study, numerical simulations of the three test beams are carried out with ABAQUS 2016 finite element analysis software. By adjusting the calculation accuracy and the number of substeps, the calculation results can converge well. Based on the reinforcement stress diagram, section steel stress diagram, and concrete strain diagram in the calculation results, it can be concluded that the simulated damage process of the test beam was basically the same as that of the static load test: firstly, the concrete in the tensile zone of the test beam cracked, and with the increasing load, the reinforcement in the tensile zone first started to yield, and then the lower flanges of the embedded steel sections also yielded, and with the increasing height of the yielding area, the concrete in the compression zone finally reached the ultimate compressive strain, and the destruction of the test beam was declared.

4.1. Finite Element Calculation Results

(1)
Calculation results of longitudinal reinforcement stresses
The results of the longitudinal reinforcement stress calculation in the test beams are shown in Figure 15. With the continuous increase in the external load, the lower longitudinal reinforcement gradually began to be tensile, the upper longitudinal reinforcement was gradually compressed, and finally, the two parts of the longitudinal reinforcement of the three test beams reached the yield stress of 400 MPa. Among them, the reinforcement located in the middle of the span in the purely bending section was the first to reach the yield stress, and the longitudinal stress distribution of the reinforcement showed a gradual trend of decreasing towards the end of the beam.
(2)
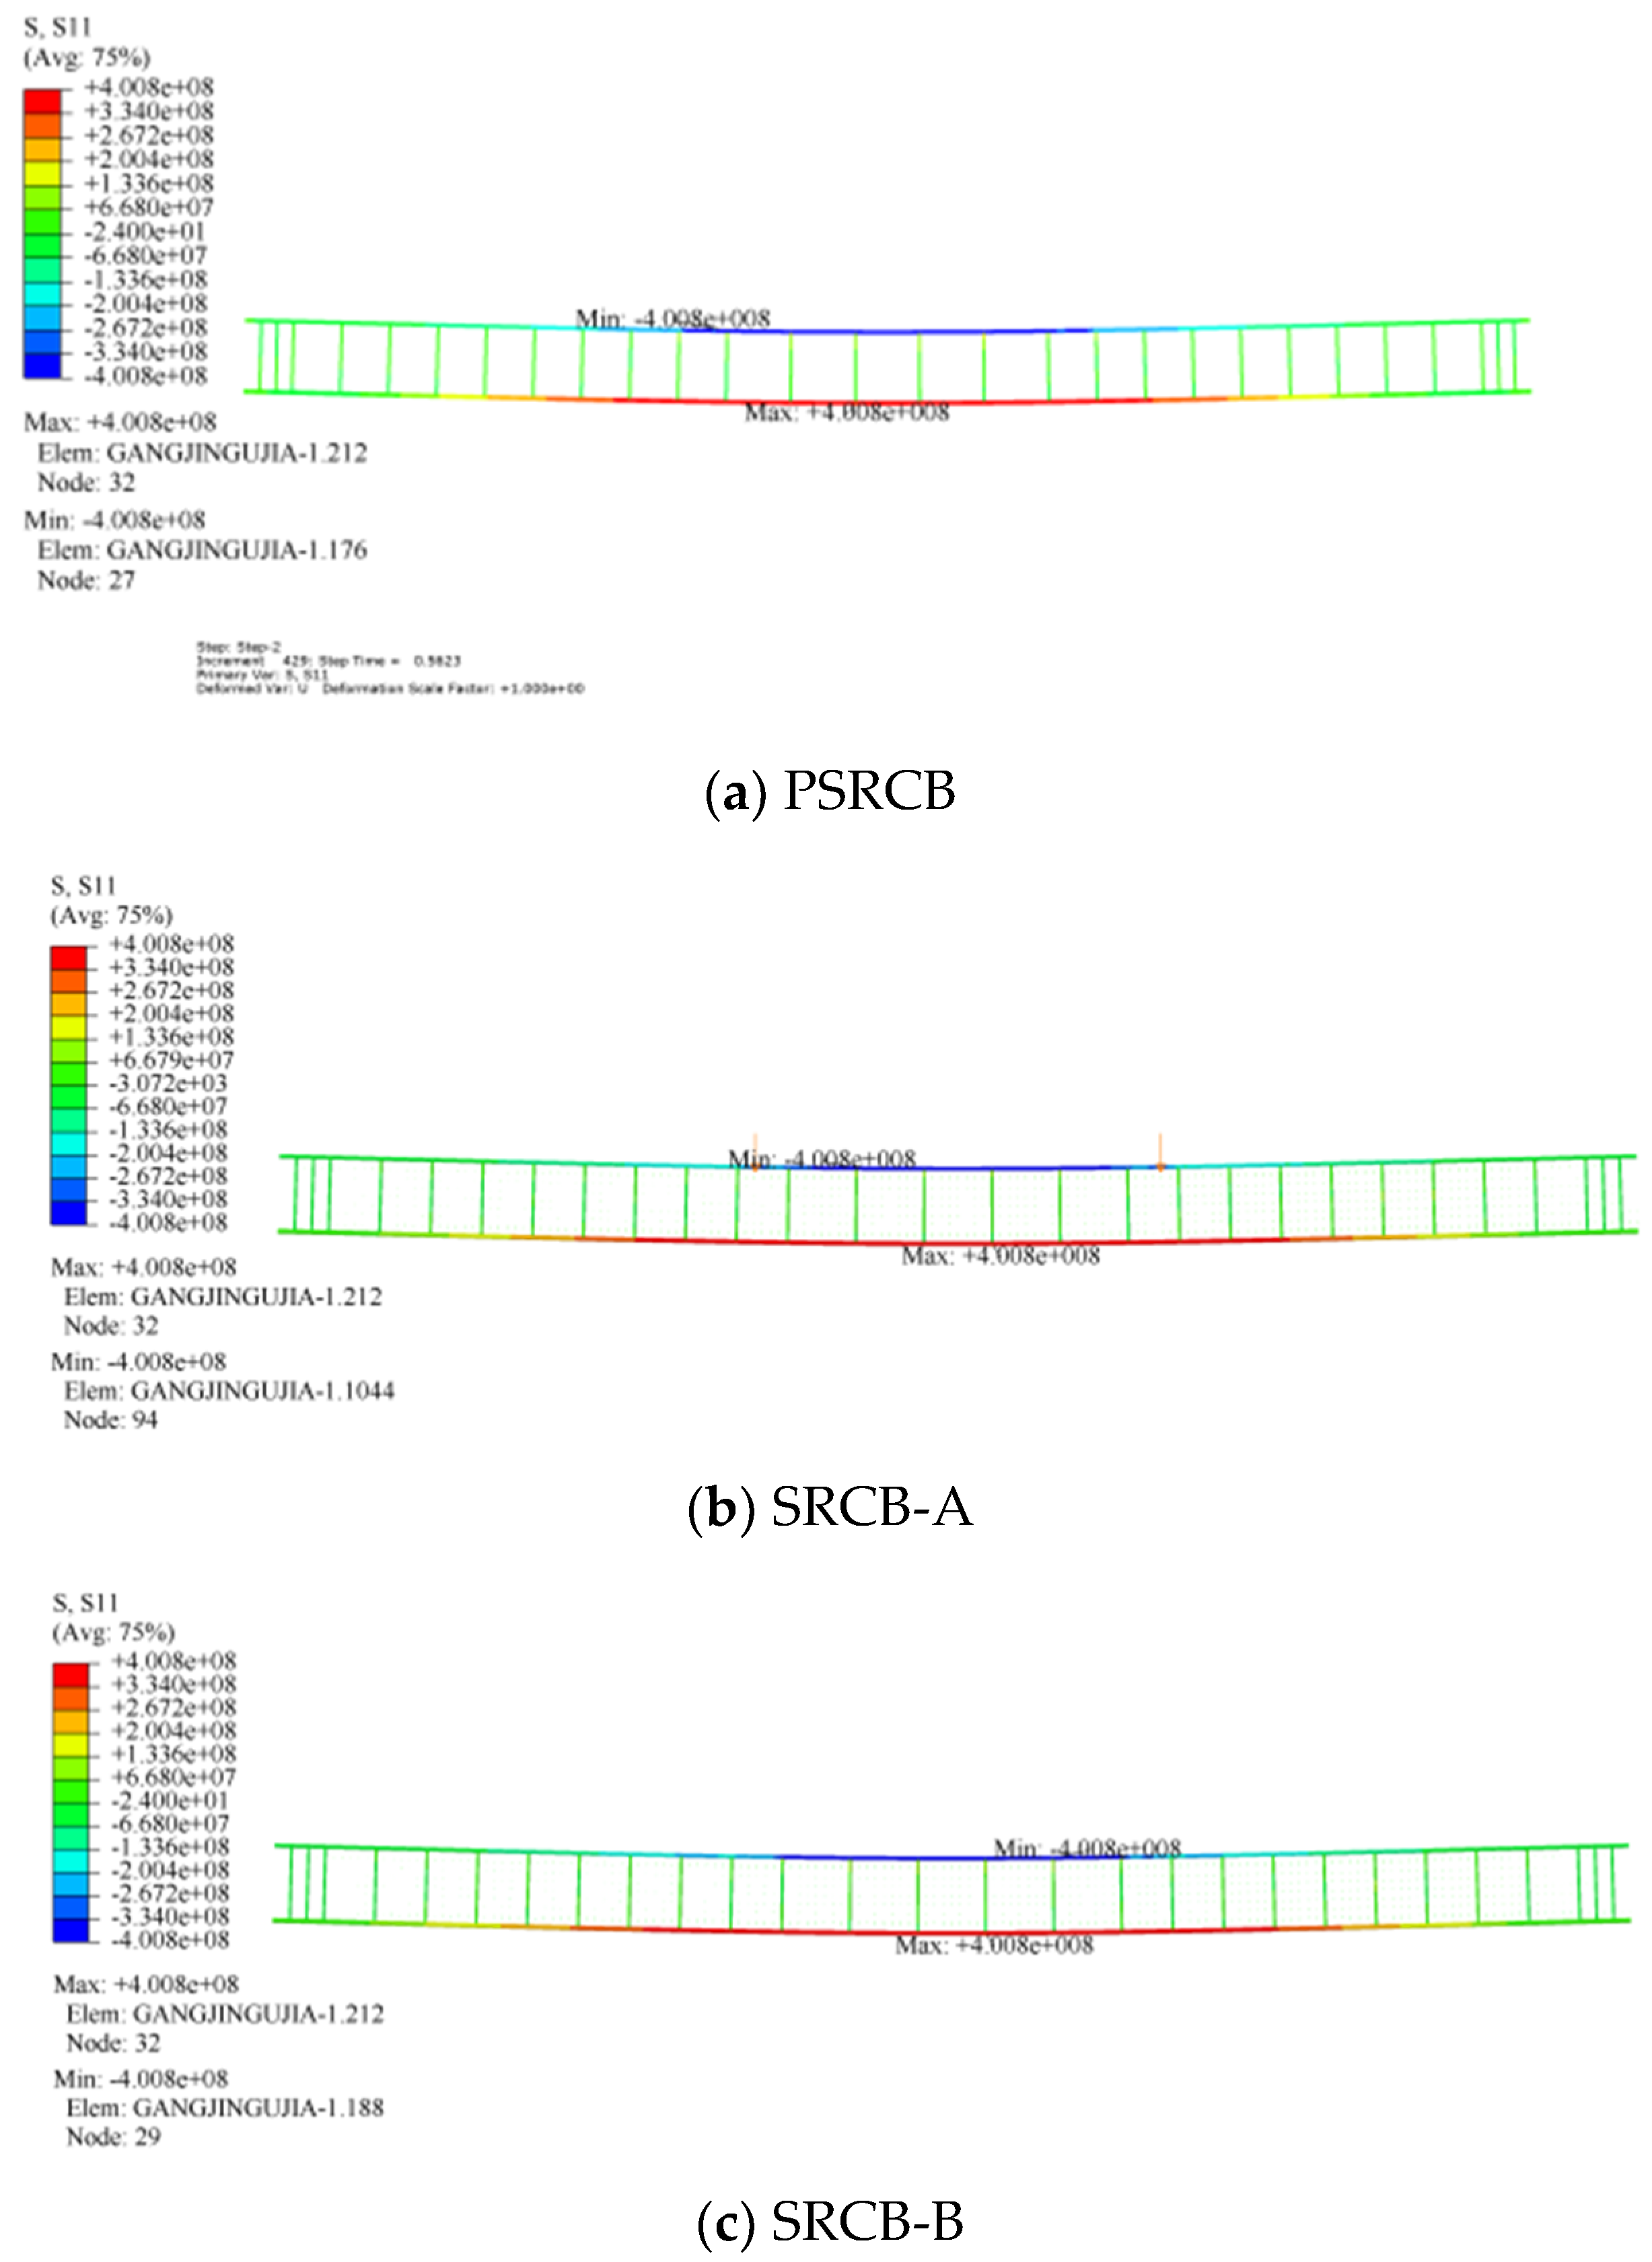
Calculation results of axial stress of steel sections
As shown in Figure 16, from the axial stress diagrams of the section steel in the PSRCB calculation results of the test beams, it can be seen that the yield height of the section steel of the three test beams increased gradually with the increase in the load, while the section steel failed to reach the full cross-section yield until the destruction of the test beams.
(3)
Calculation results of the total axial strain of concrete in the mid-span section
As shown in Figure 17, when the total strain at the lower edge of the concrete is greater than the ultimate tensile strain of the concrete 1.18 × 10⁻⁴, it means that the concrete has cracked at this time, and the cracking loads of the three test beams judged on the basis of this are PSRCB: 74.65 kN, SRCB-A: 22.15 kN, and SRCB-B: 25.26 kN. When the total axial strain of the concrete at the upper edge of the concrete has reached the ultimate compressive strain of concrete 1.73 × 10⁻³, the concrete in the compression zone is crushed at this time, marking that the test beams have been damaged, based on which the ultimate loads of the three test beams were judged to be PSRCB: 194.74 kN, SRCB-A: 187.42 kN, and SRCB-B: 190.73 kN, respectively.
In addition, it can be seen from the figure that due to the bond–slip effect between the steel section and concrete, there is a restraining effect of the steel section flange and web on the concrete, which makes the total axial stress of the concrete in this part of the concrete obviously small, indicating that the lower flange of the steel section has the role of inhibiting the development of concrete cracks.

4.2. Bearing Capacity

The simulation and testing results are shown in Table 3 and Table 4. It can be seen that the computed cracking loads of the prestressed steel-reinforced concrete beams in the case of taking the bond–slip effect into account show better matching to the testing values as compared to the case omitting the bond slip. In addition, the most realistic behavior was observed in the case of the bond–slip effect with the model of considering bond–slip effect B, for which the accuracy ratio was between 0.934 and 0.97. On the other hand, comparing the calculated ultimate loads of the prestressed steel-reinforced concrete beams to the experimental values reveals that when the model considers the bond–slip effect B, the accuracy ratio is the best, with a range between 0.968 and 0.994. The finite element model is more consistent with the experimental results when the bond–slip constitutive relationship proposed by Yang Yong is used. The difference between the calculated and experimental values is approximately 5%. Thus, the validity of the established finite element model is verified. Moreover, the finite element method can accurately simulate the bond slip between the section steel and concrete in the test beam. Compared with ordinary section steel concrete beams, section steel concrete beams with shear bolt nails arranged in bending and shear sections can still maintain a high stiffness when approaching the ultimate bearing capacity because the bond slip between the section steel and concrete is limited, which caused an impact in which the ultimate bearing capacity is elevated.
It can also be seen from the results that the results calculated according to the finite element model analysis are greater than the test results; this difference may be caused by the non-uniformity of the material properties of the three test beams, in which the measured material strengths of the reinforcement and section steel are slightly greater than the actual material strengths.

4.3. Load–Deflection Curve

The nonlinear finite element analysis results and test results of the load–displacement curves of the three test beams are compared and analyzed in this section, as shown in Figure 18. It can be seen from the figure that the load–displacement curve calculated by ABAQUS is consistent with the displacement curve measured in the static load test and can be roughly divided into four stages. In the first part of the curve, the beam specimen bears the load until the concrete in the tensile area cracks. Prior to cracking, the beam behaves elastically, and the load–displacement curve follows a straight line. According to the second section of the curve, the test beam continues to bear the load after the concrete in the tensile area cracks until the lower flange of the reinforcement and section steel in the tensile area yields. Because the section stiffness decreases with the increasing cracking of the concrete, the first turning point occurs. However, for the PSRCB, the change in the curve slope is not obvious due to the presence of the section steel and prestress. In addition, after cracking, since the stiffness of the test beam in the ABAQUS finite element model is greater than that in the static load test, the displacement calculated under the same load is less than the actual displacement in the test, which can be seen from the offset generated by the two curves obtained from the test and calculation. In the third part of the curve, the tensile steel bar and the section steel yield successively, which means that the test beam enters the elastic–plastic working stage. The stiffness of the test beam decreases rapidly at this time, and the second section appears due to the yielding of the lower flange of the section steel. This is indeed a turning point, but the section steel has not yielded entirely, so the bearing capacity still maintains a rising trend until it reaches the ultimate load. In the fourth part of the curve, the bearing capacity is reduced because the concrete in the compression zone has been damaged, and since the steel section can continue to bear the load, the test beam can still maintain relatively good plastic properties in the finite element calculation.
The results also show that the load–displacement curves of the section steel and concrete are consistent during the initial loading because there are no or minor bond–slip effects between the steel and concrete materials. With the increasing load, the shear stress on the contact surface between these materials reaches a specific value, at which point slip is initiated. Through comparison, it is found that the load–deflection curve of the finite element model considering bond–slip constitutive relation B is more consistent with the test results.
Although the load–displacement curve obtained by the finite element analysis is consistent with the load–displacement curve obtained by the static load test, there are still some differences between them, mainly due to (1) the ability of the simulation to converge, the addition of the support cushion block, and the utilization of displacement elements in the numerical model to increase its overall stiffness; (2) the inadequacy of the material constitutive relationship used in ABAQUS to simulate the strengthening stage of steel and the descending stage of concrete; and (3) the errors that arise in specimen fabrication and static load testing. Nevertheless, the deviation of the calculation results from the test results is within the allowable error range of the project, so the correctness and feasibility of the finite element model can be verified. On the other hand, based on the results of the present study, the slip phenomenon between the steel and concrete contact surfaces in the static load test is best represented using the connection element in the finite element model.
In summary, the finite element model established by bond–slip constitutive relation B is in better agreement with the experimental results than the finite element model established by bond–slip constitutive relation A, indicating that bond–slip constitutive relation B is more suitable for the numerical simulation of prestressed steel-reinforced concrete beams. Moreover, the difference between the two is within the allowable error range of the project, which shows the applicability of the finite element model to simulate the prestressed steel-reinforced concrete beams. We also use this finite element model to simulate crack development.

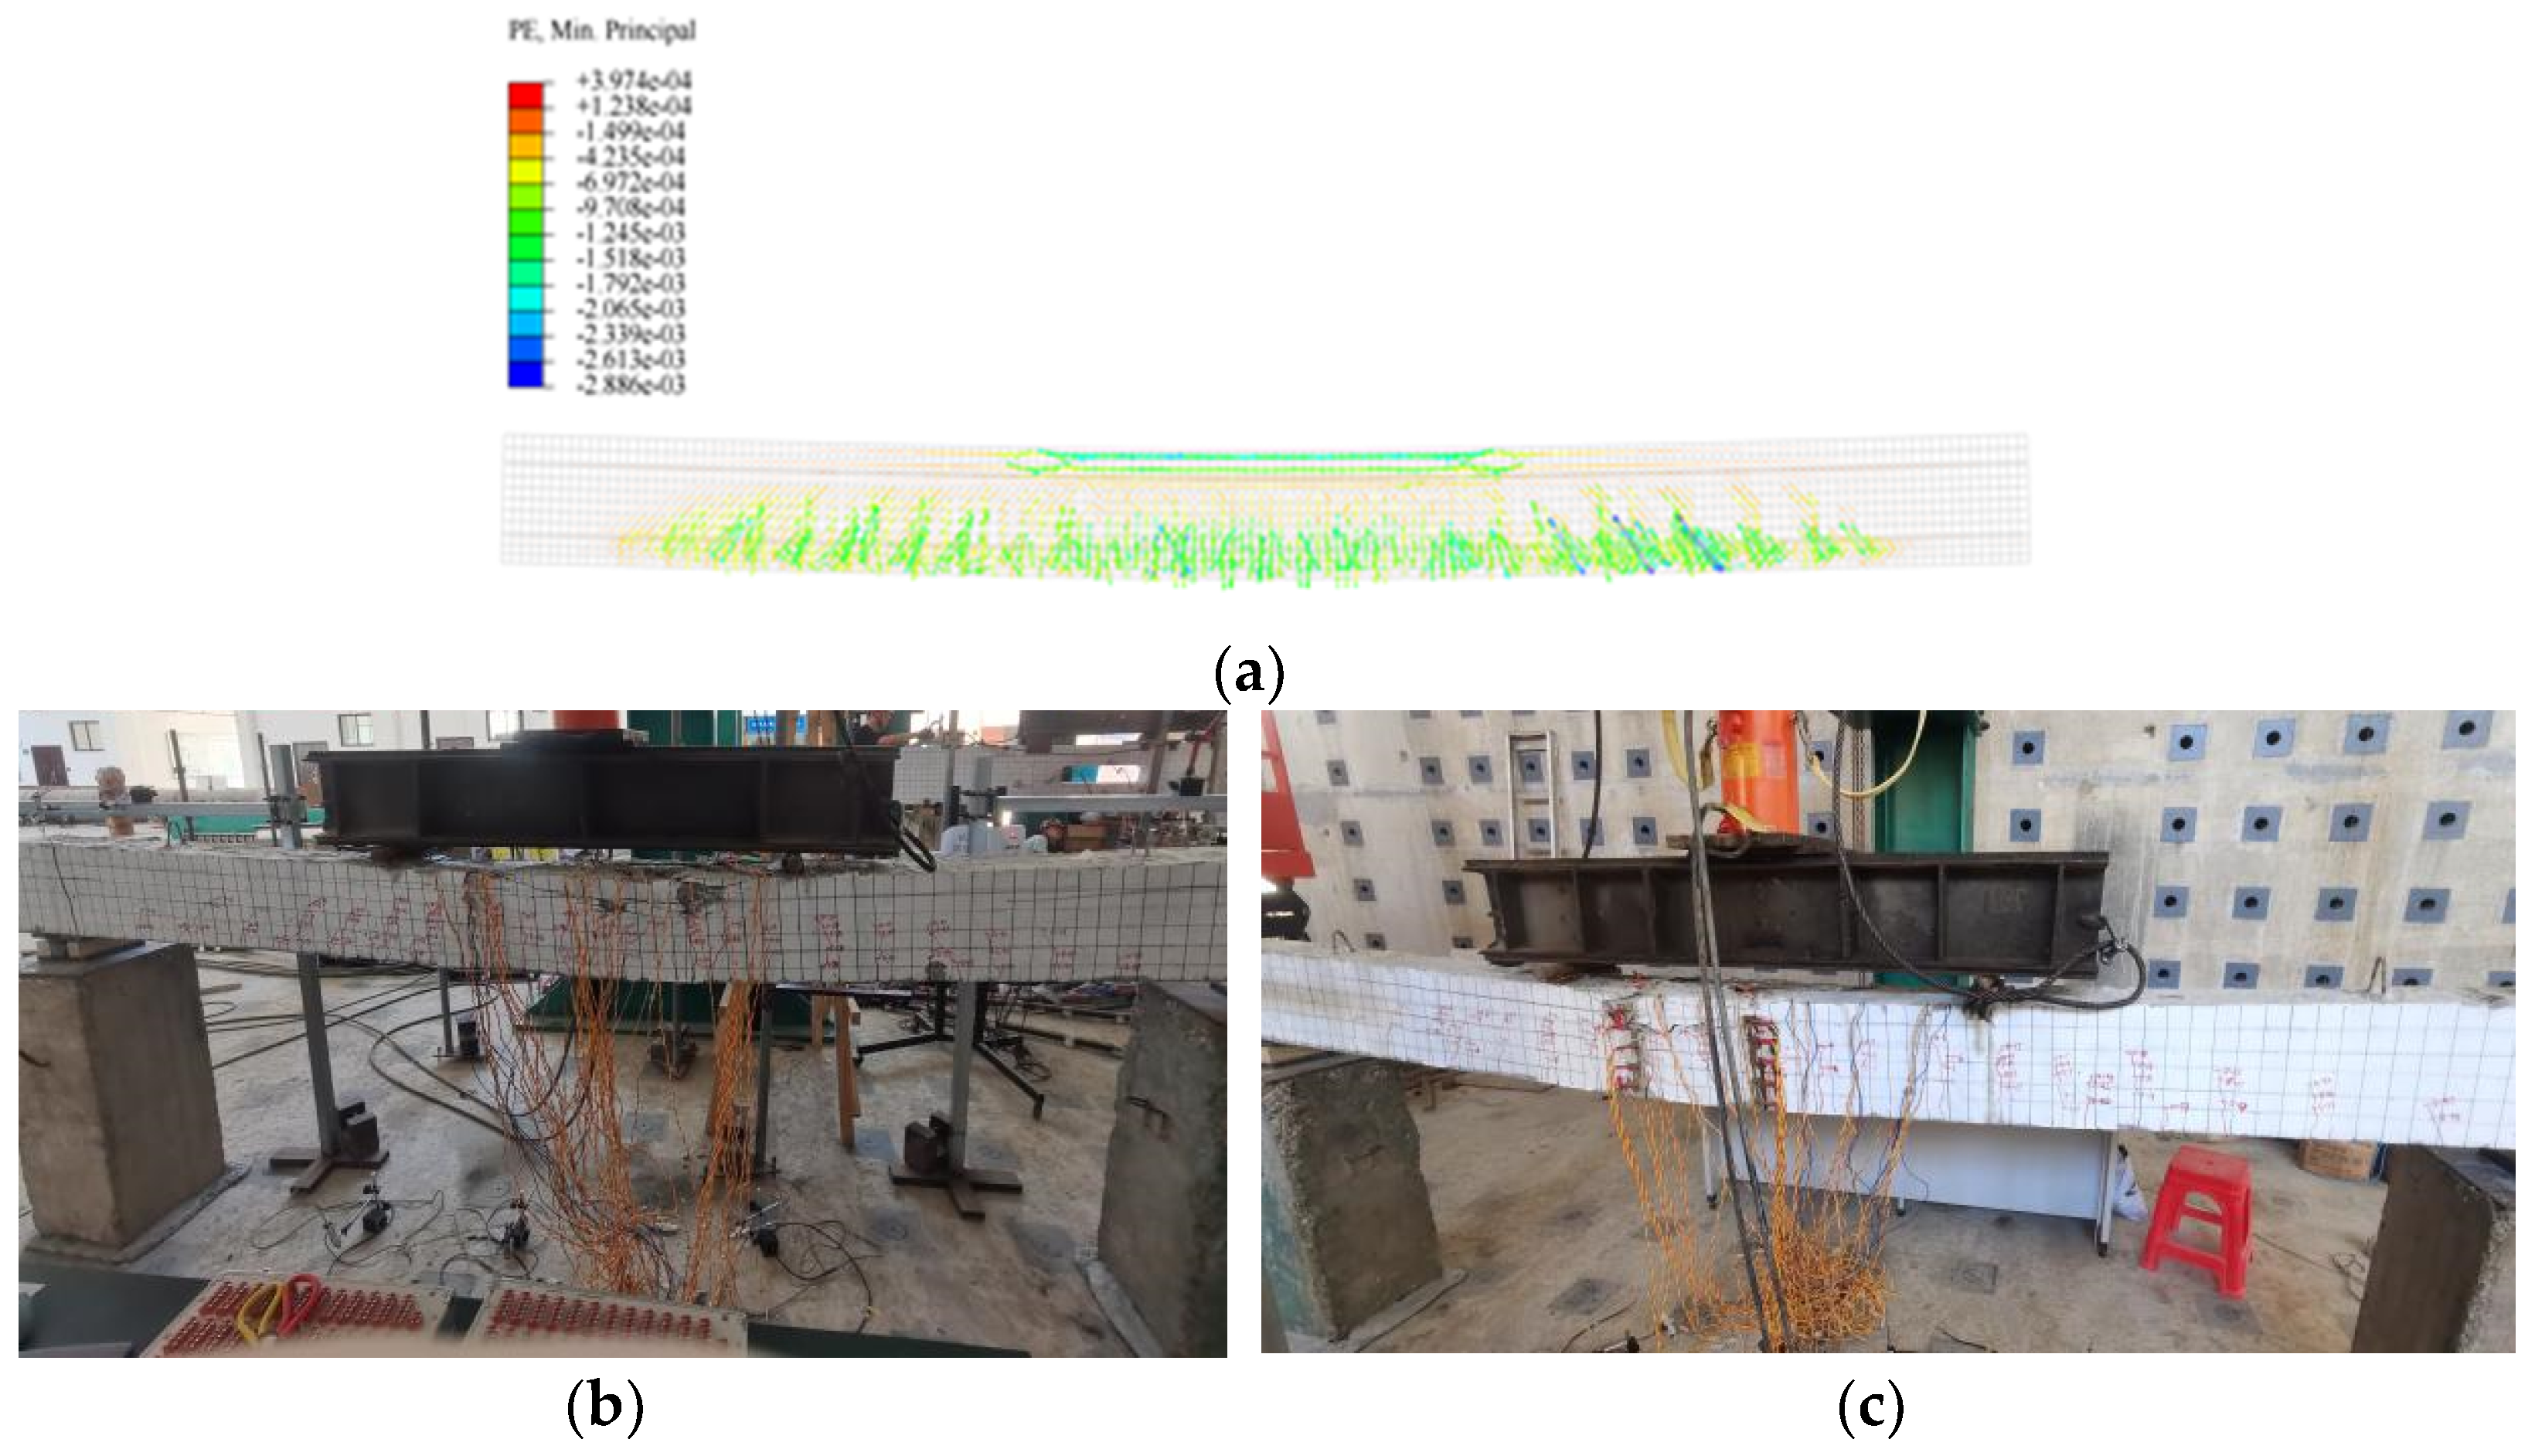
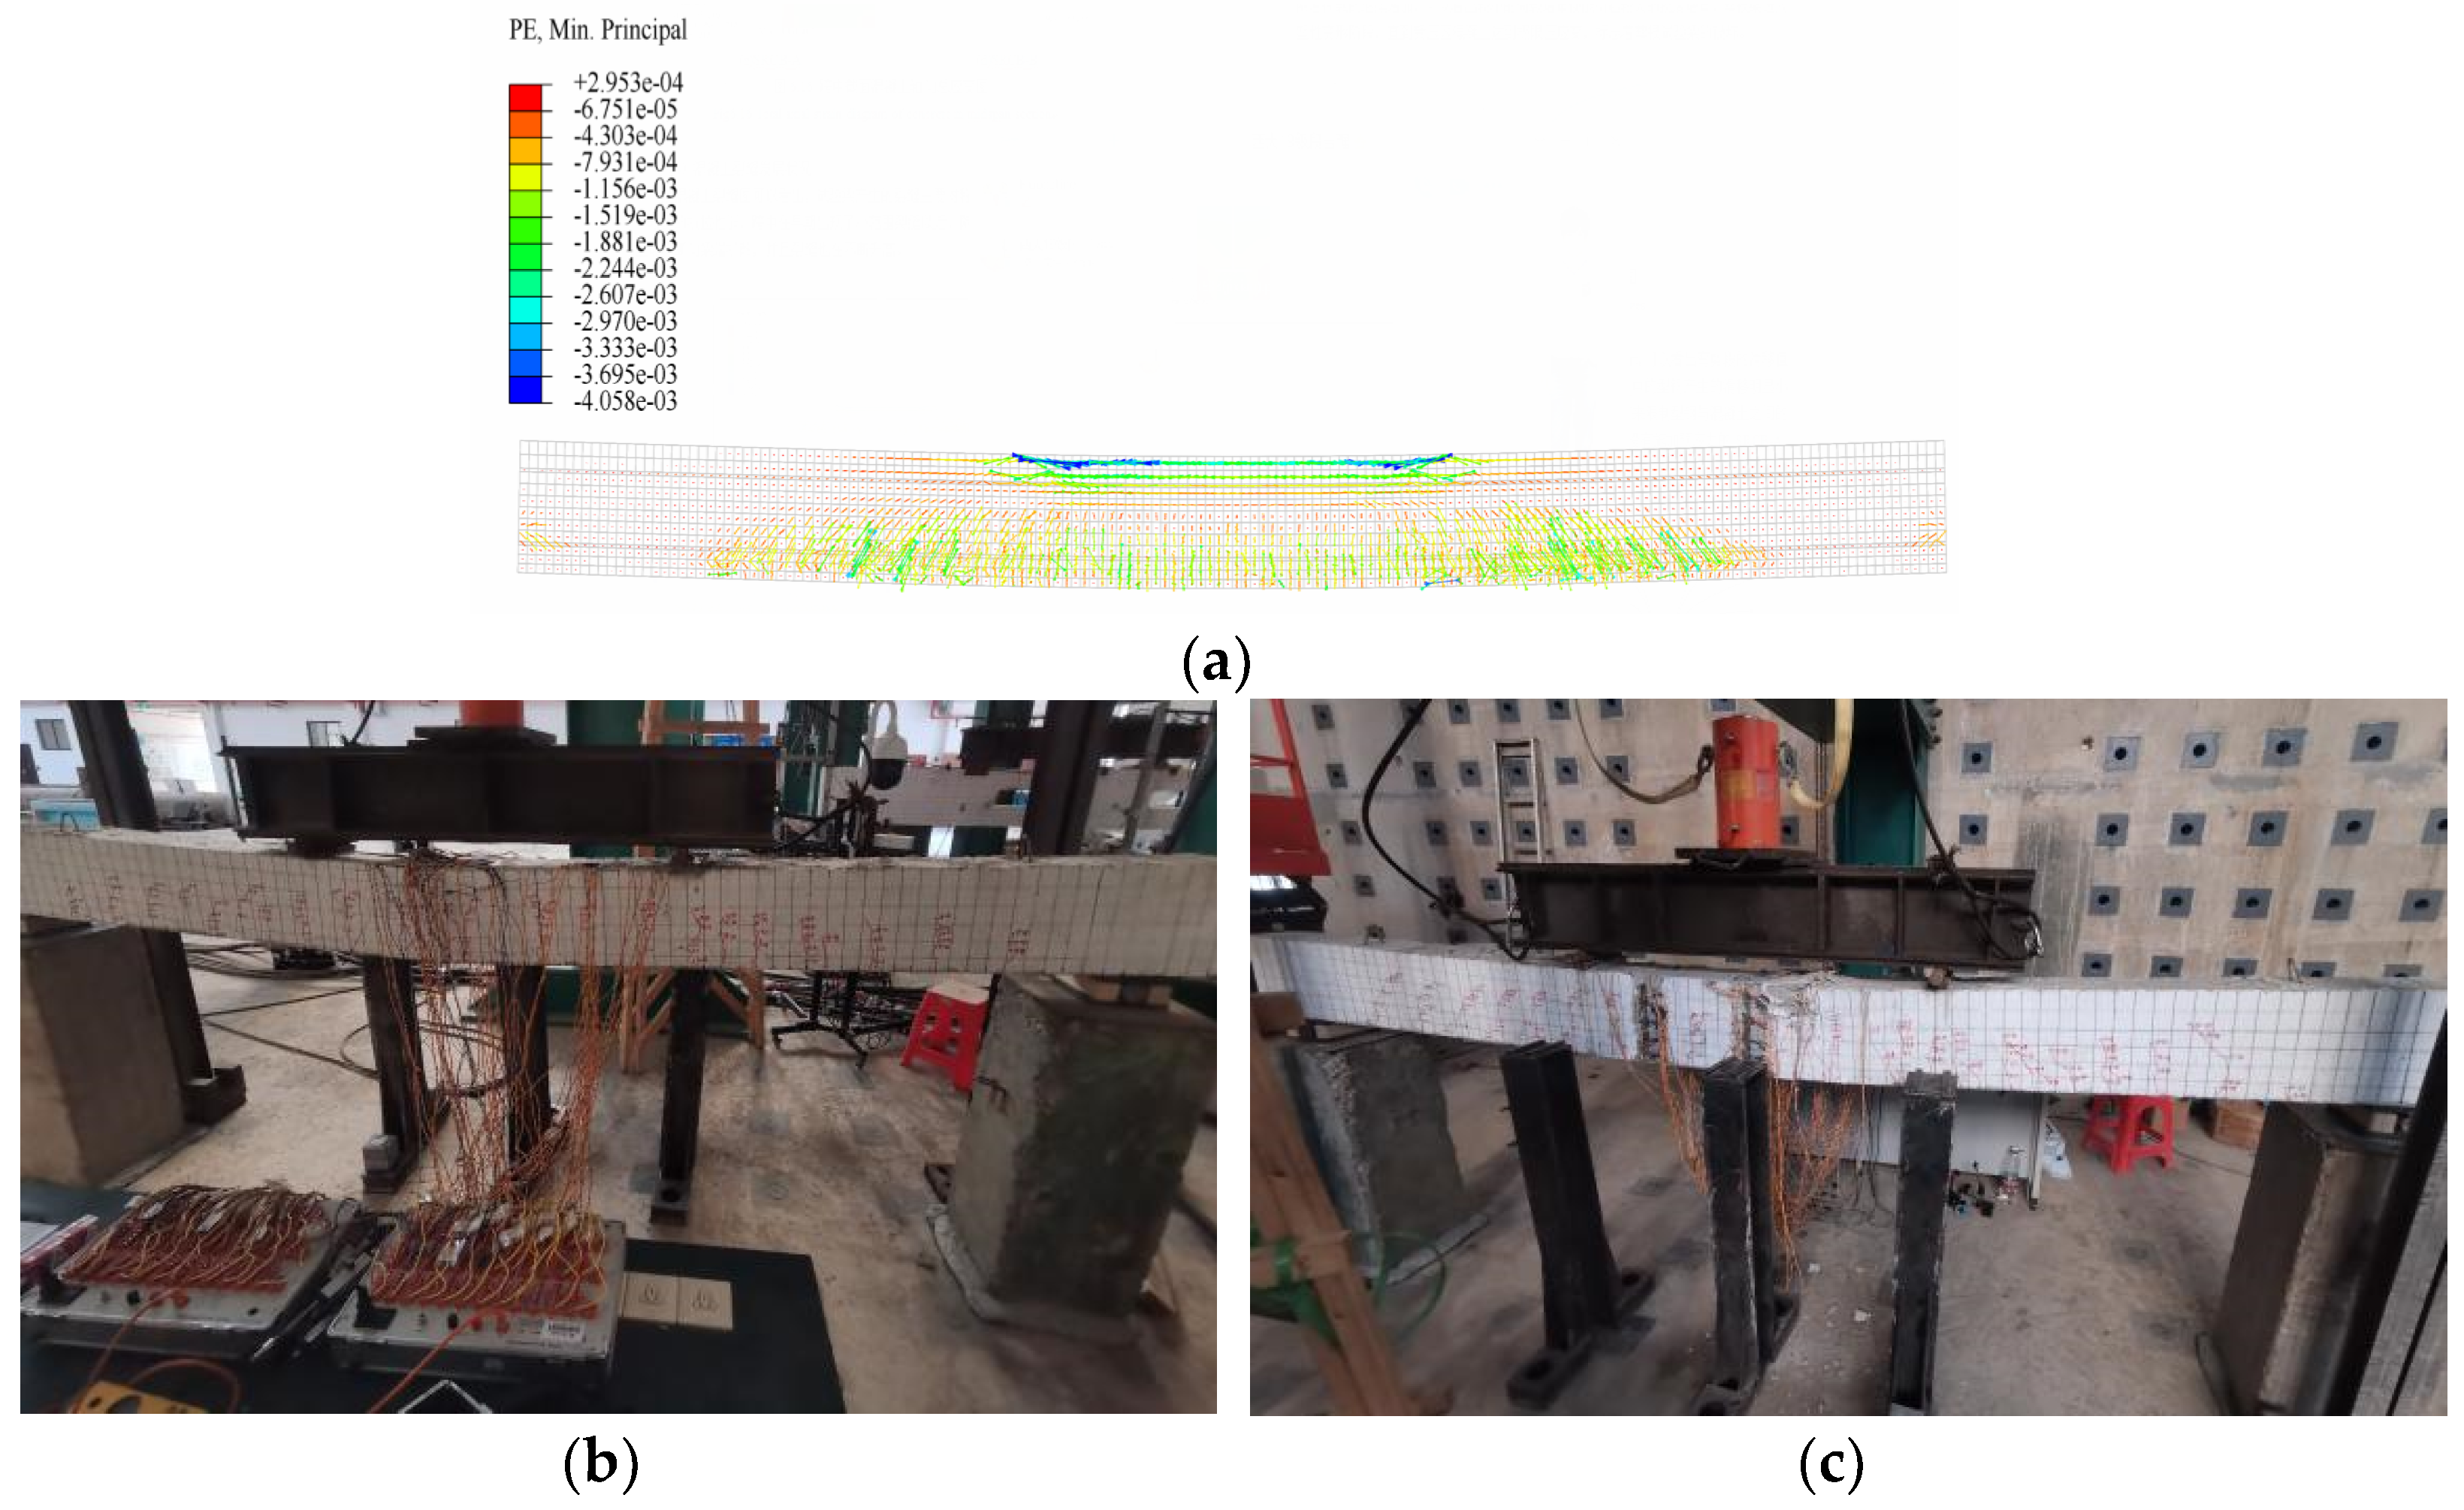
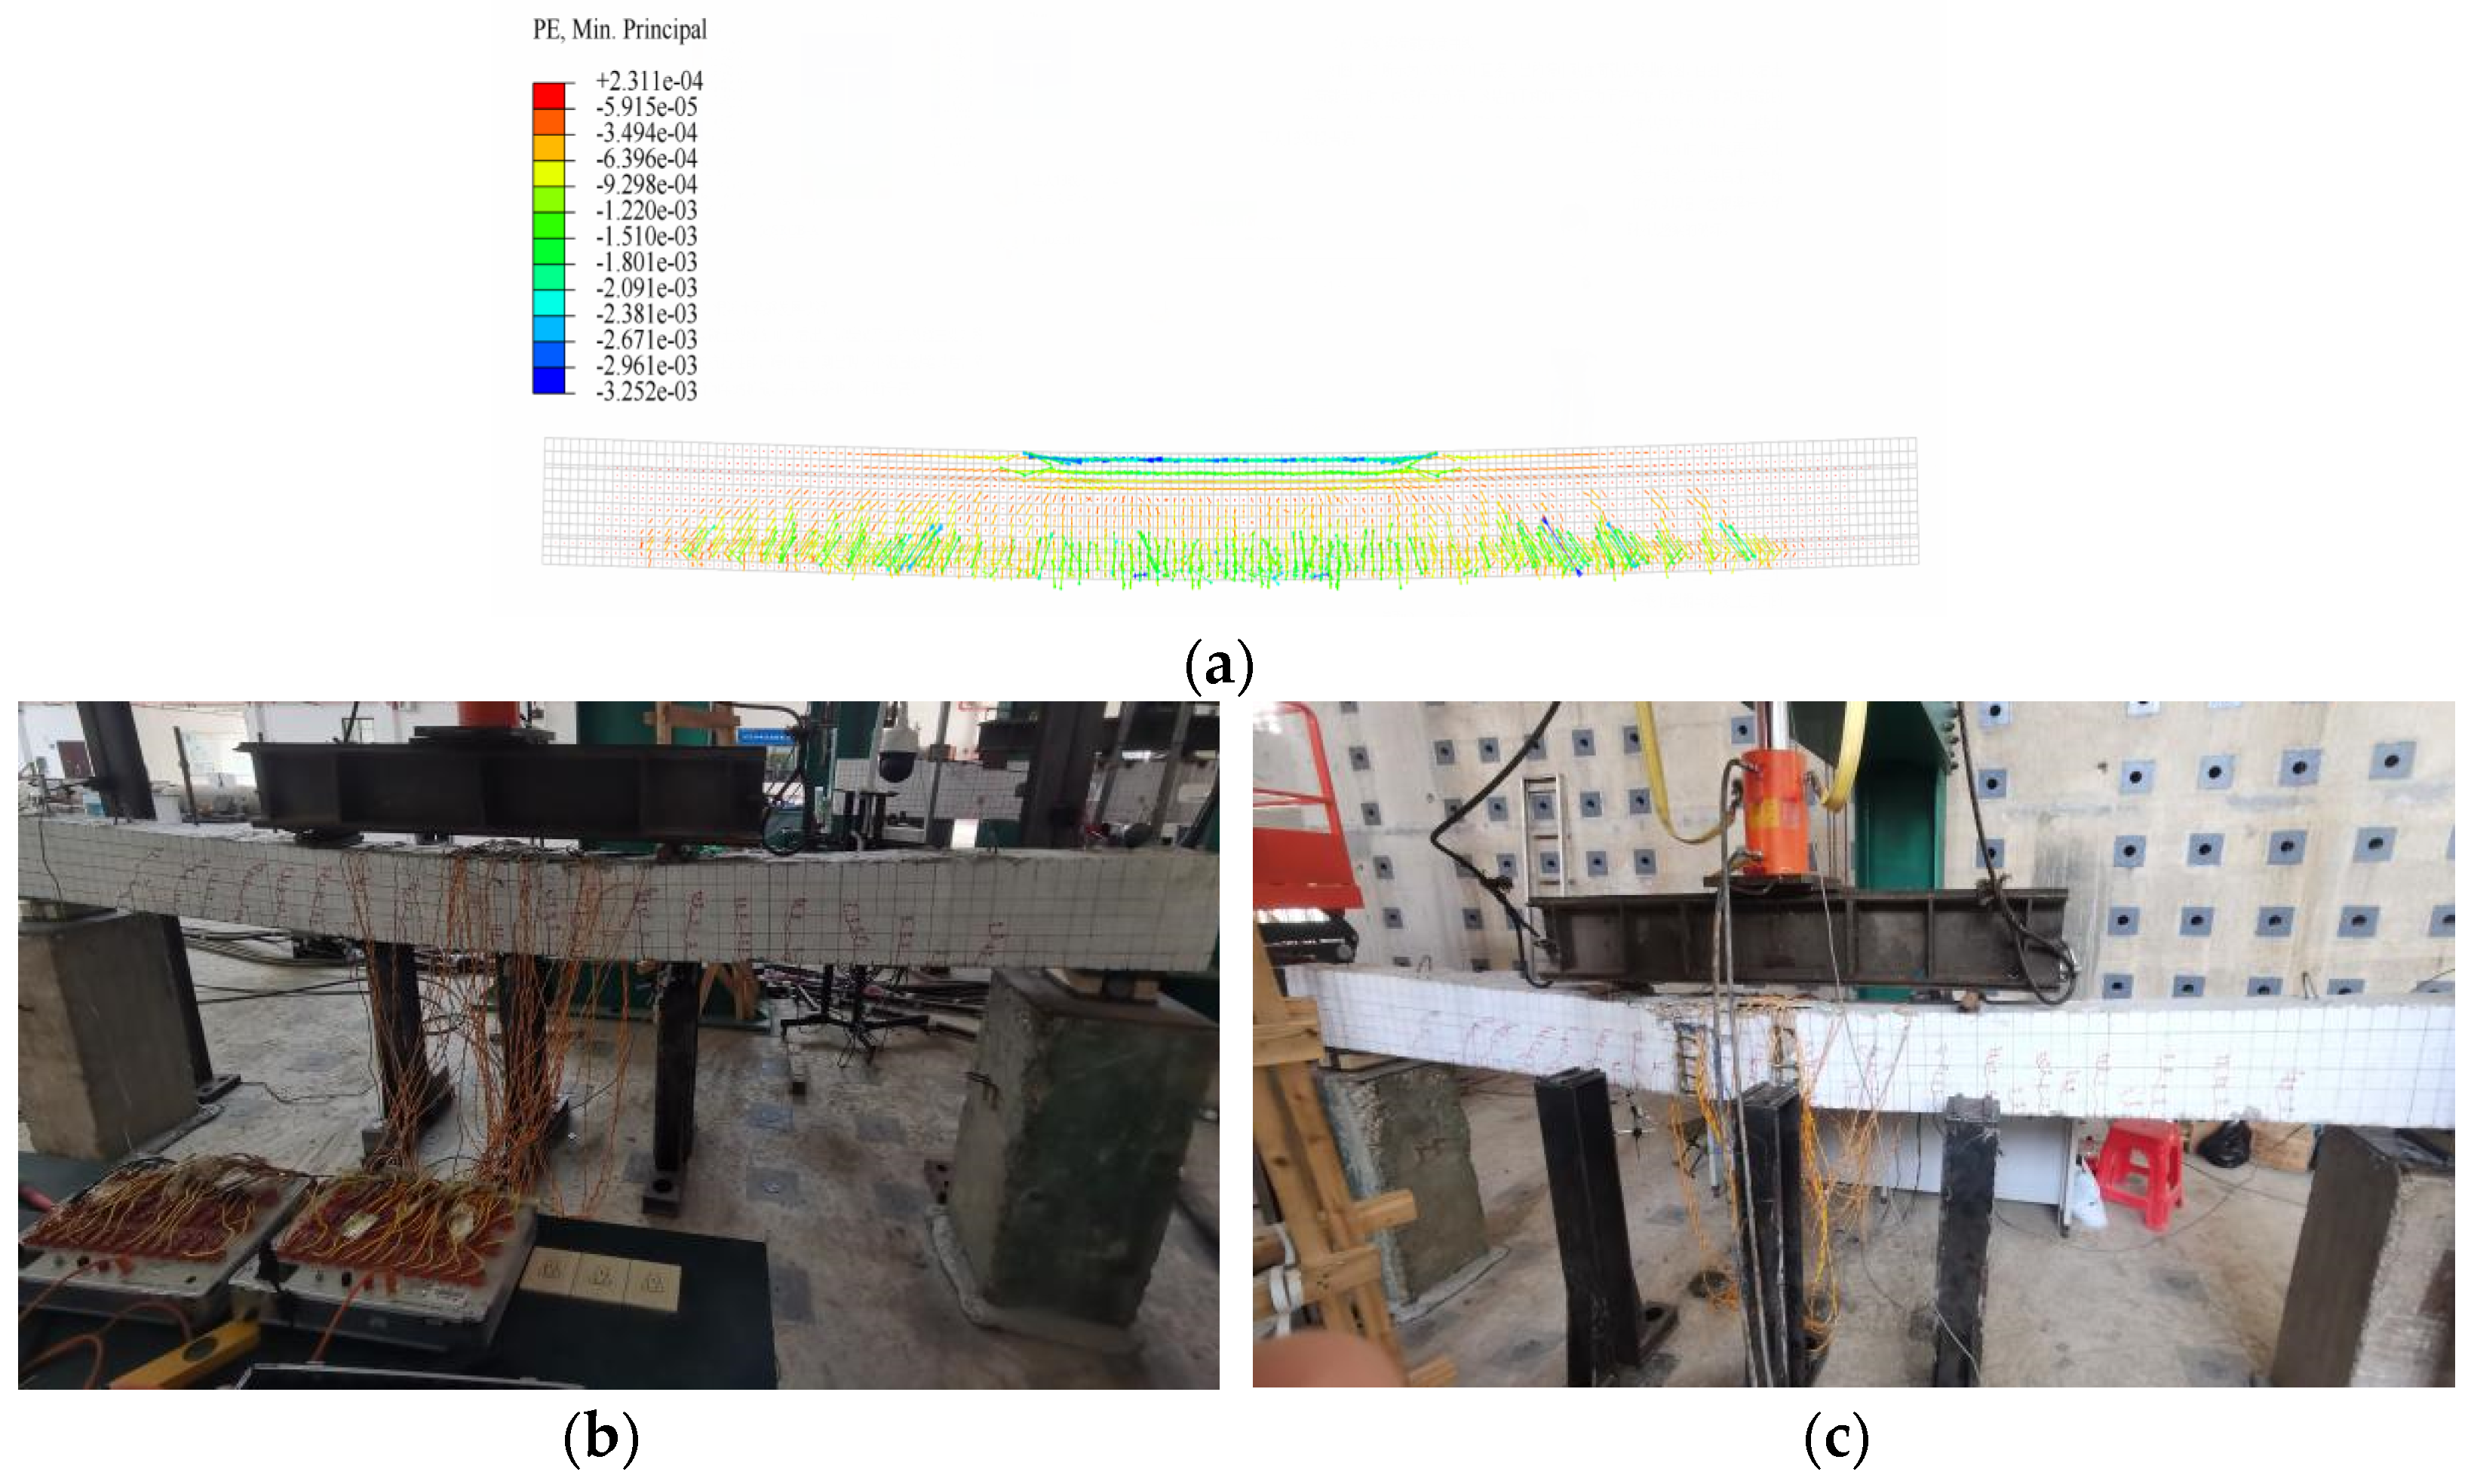
4.4. Failure Propagation and Crack Development

As shown in Figure 19, Figure 20 and Figure 21, (a) shows the finite element calculation results of concrete crack development, (b) and (c) shows the development of cracks during the concrete experiments, in terms of the crack development process, the test results for each specimen are consistent with the finite element calculation results; the crack development starts with a small number of small cracks appearing at the mid-span of the bending section. Thereafter, with the increasing load, the cracks in the bending section begin to develop upward, and cracks in the bending shear section also begin to appear. Unlike in ordinary reinforced concrete, in the tested specimens, all the cracks remain parallel and are aligned vertically. When the cracks develop to half of the beam height, the crack development in the case of the PSRCB becomes slower than that in the other two specimens due to the existence of prestressing. Nevertheless, with the continuous increase in the yield strength of the tensile reinforcement and the yield height of the section steel, the crack development in the three specimens accelerates again. When the load is close to the ultimate load, the shear connector fails, and the slip between the section steel and the concrete is close to the maximum, resulting in stress concentration in the concrete around the section steel flange. Once the tensile strain of this part of the concrete exceeds the ultimate tensile strain, splitting cracks are generated immediately and develop rapidly with the increasing load to cover both sides of the test beam. Finally, the concrete in the compressive area collapses.
Comparing the simulated crack development of the finite element model established by bond–slip constitutive relation B with the phenomenon observed in the experiment, it can be found that the results are consistent, which further illustrates that the finite element model simulates the prestressed steel-reinforced concrete beam effectively.

5. Application Analysis of a Finite Element Model of a Prestressed Steel-Reinforced Concrete Beam

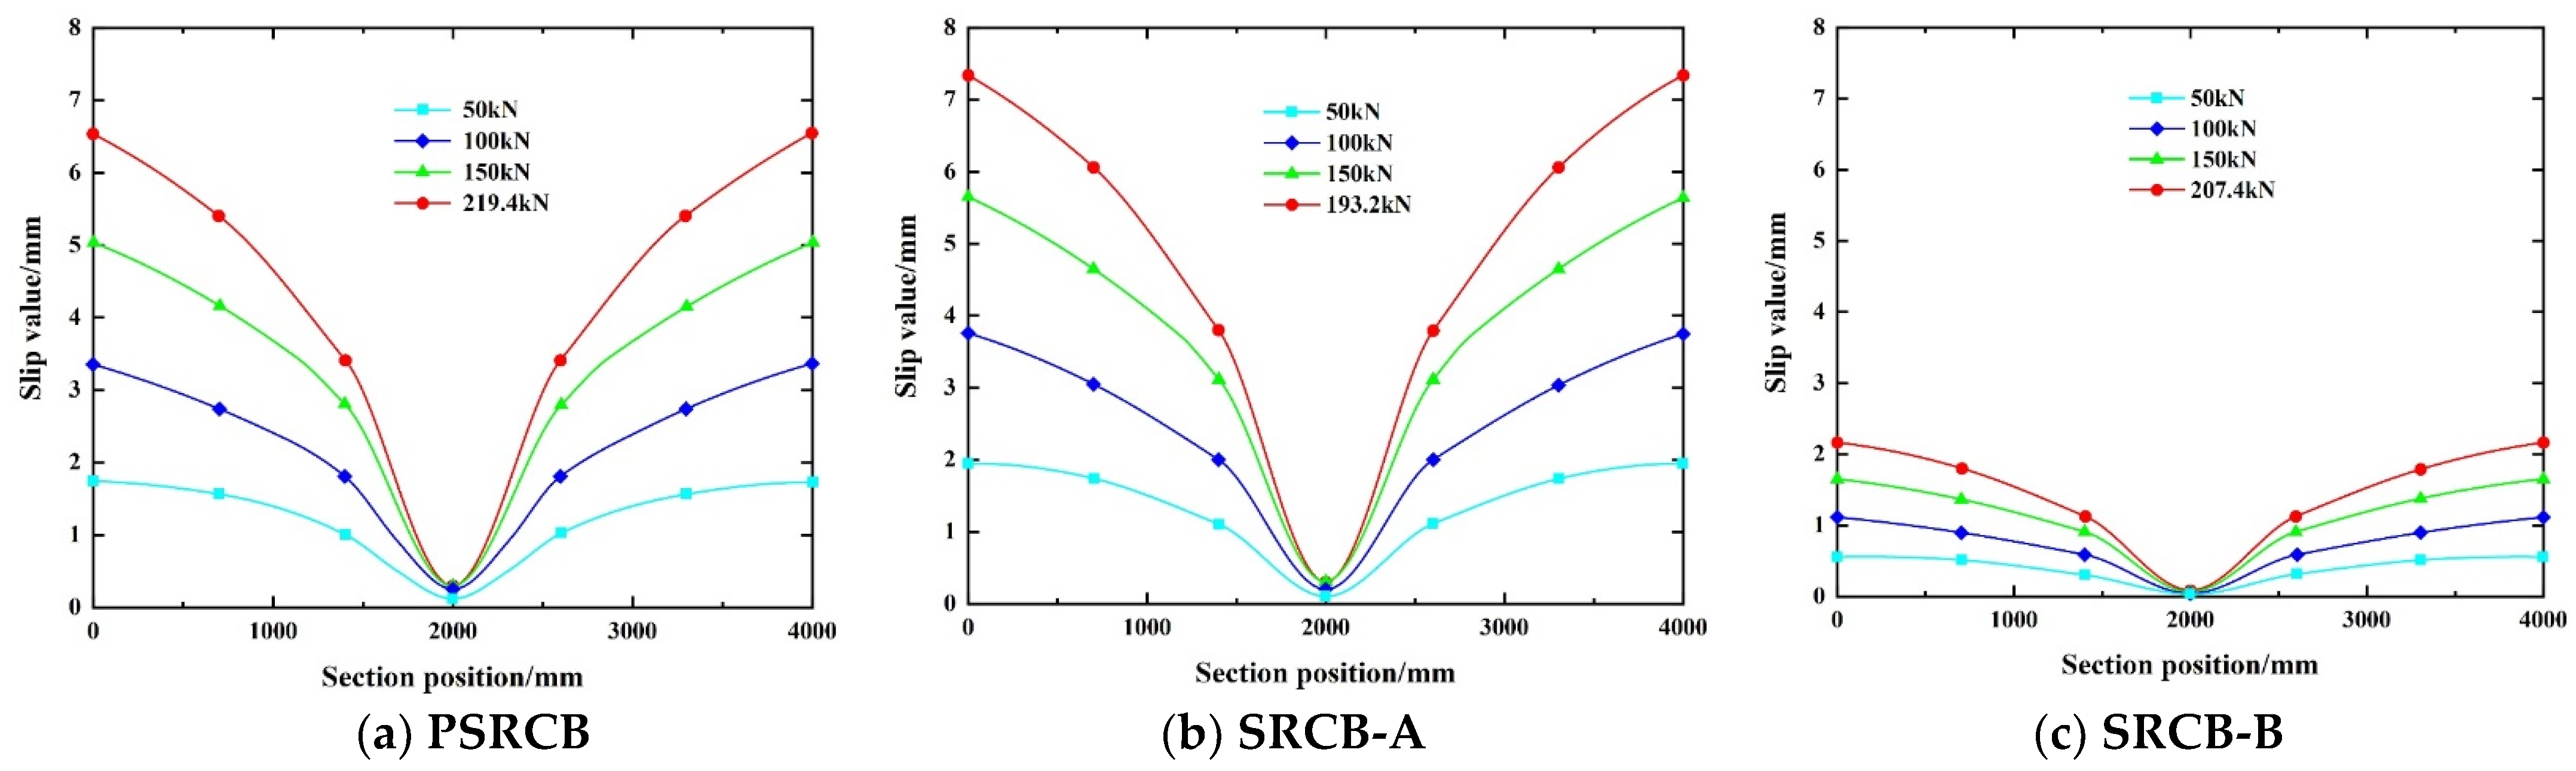
5.1. Slip Distribution at Different Sections of the Test Beam

Firstly, the finite element model is established using bond–slip constitutive relation B to analyze the effect of setting bolt nails in section steel concrete. The three test beams are simulated, and the slip curves at different section positions are obtained. As shown in Figure 22, the slip of the bending shear section is significantly greater than that of the pure bending section, and the slip generated by the section steel in PSRCB-B with shear bolt nails is significantly less than that of the two test beams without bolt nails, indicating that it is reasonable and feasible to arrange shear bolt nails in the bending shear section to limit the slip between the section steel and concrete. In addition, the slip of the PSRCB specimen is slightly less than that of the SRCB-A specimen without prestressing, indicating that prestress can also limit the bond slip between the section of steel and concrete to a certain extent.

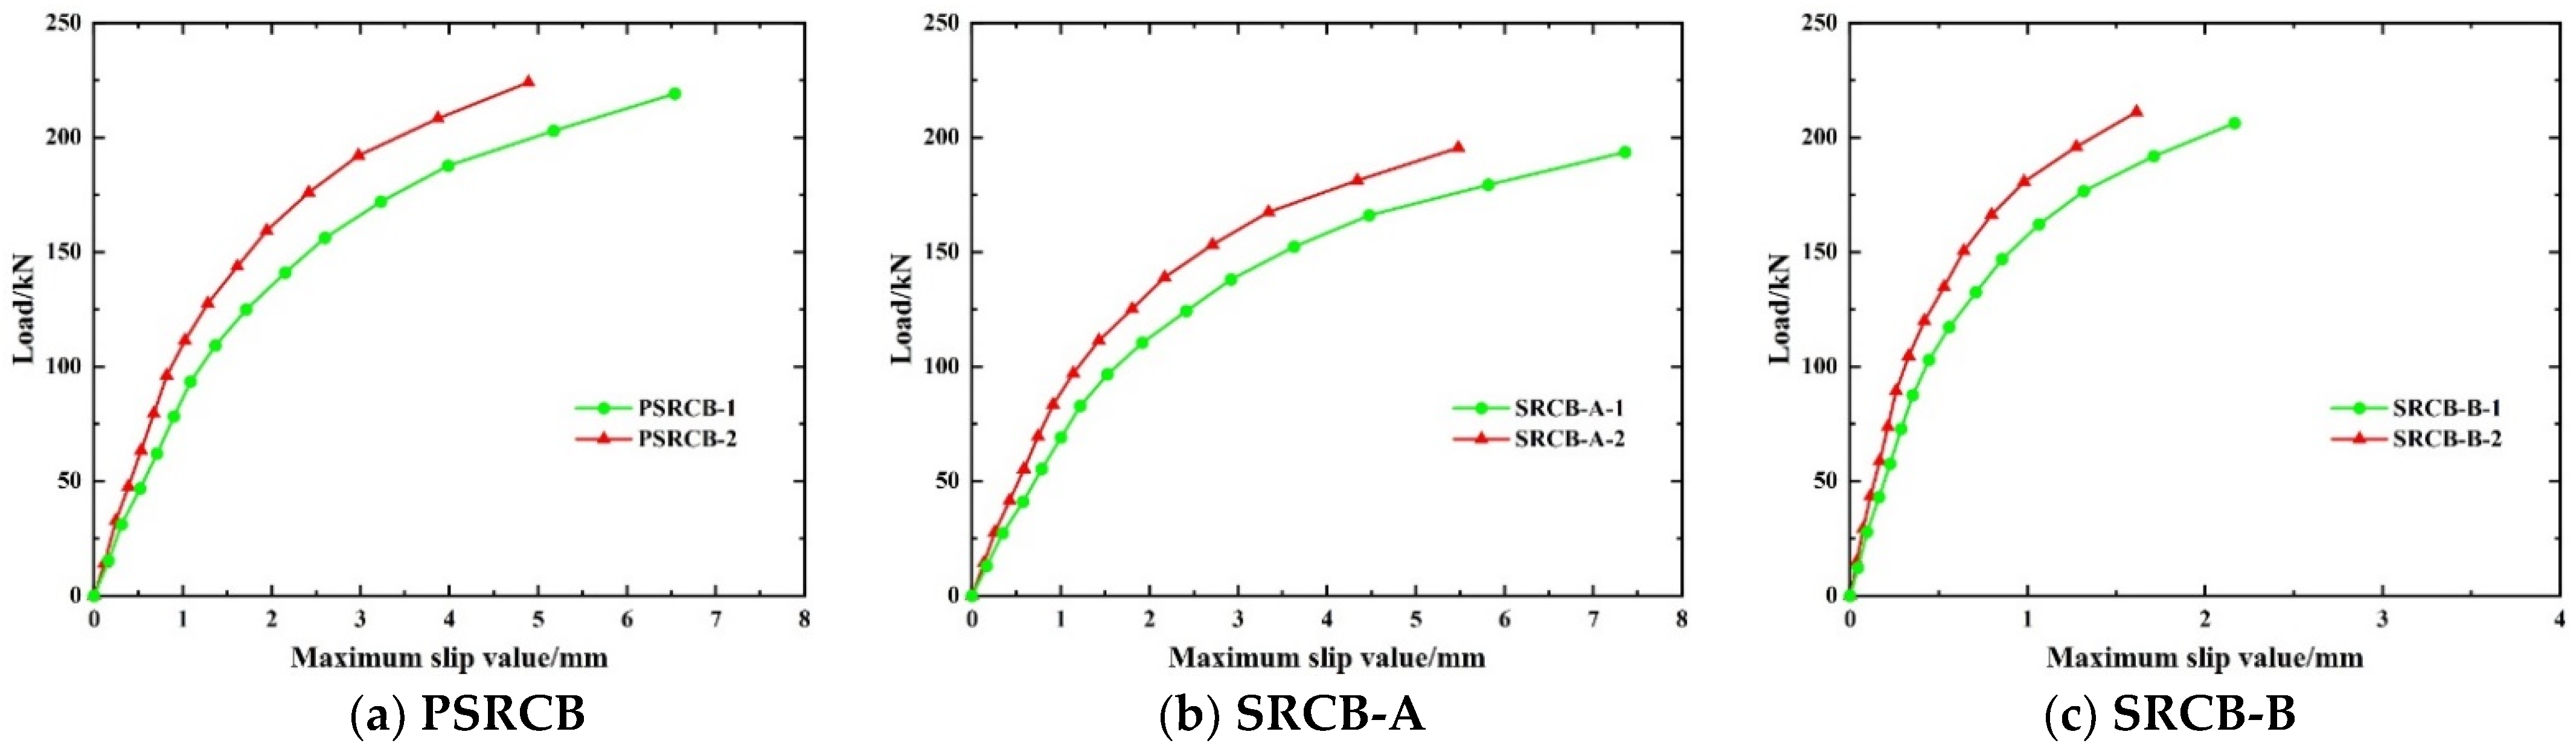
5.2. Load–Slip Curve

The finite element models of three test beams are established using bond–slip constitutive relation A and constitutive relation B, and the relationship between the load and slip is calculated and analyzed. The load–slip curves of the three test beams are shown in Figure 23. The slip between the section steel and concrete is small at the initial stage of the loading process, and the slip increases dramatically as the load level increases in intensity. When the ultimate load approaches a certain load, the slip reaches the maximum value and tends to stabilize. In addition, the slip calculated by the finite element model of the bond–slip constitutive relationship proposed by Liu Can, according to the beam test, is generally less than that determined from the finite element model of the bond–slip constitutive relationship suggested by Yang Yong.

5.3. Analysis of the Influencing Factors of the Bond–Slip Effect on Prestressed Steel-Reinforced Concrete Beams

Moreover, to determine the factors that influence the bond–slip effect on the contact surface between the section steel and the concrete, four sets of 16 prestressed steel-reinforced concrete simply supported beam models are additionally designed for nonlinear finite element analysis. As stated previously, it can be concluded that the bond–slip constitutive relation proposed by Yang Yong is more suitable for simulating the bond–slip effect in prestressed steel-reinforced concrete. Therefore, this bond–slip principal relationship is chosen for finite element modeling. And the ultimate bearing capacity and model’s load–slip curve with and without considering the bond–slip effect under different prestresses, concrete strengths, hoop ratios, steel contents, and other influencing factors are compared and analyzed.
Primarily, the first group of models consists of prestressed steel-reinforced concrete simply supported beam models with different degrees of prestress. Table 5a indicates that the parameter design and other parameters in the model remain unchanged. The second set of models mainly comprises prestressed steel-reinforced concrete simply supported beam models with various concrete strengths. The parameter design is shown in Table 5b, and all the other parameters are left unaltered. The third type of model essentially consists of prestressed steel-reinforced concrete simply supported beam models with different hoop ratios; the parameters are listed in Table 5c, and the rest of the parameters are not changed. The final group consists of prestressed steel-reinforced concrete simply supported beam models with diverse steel contents. The parameter design is listed in Table 5d, and the others abide by the same.

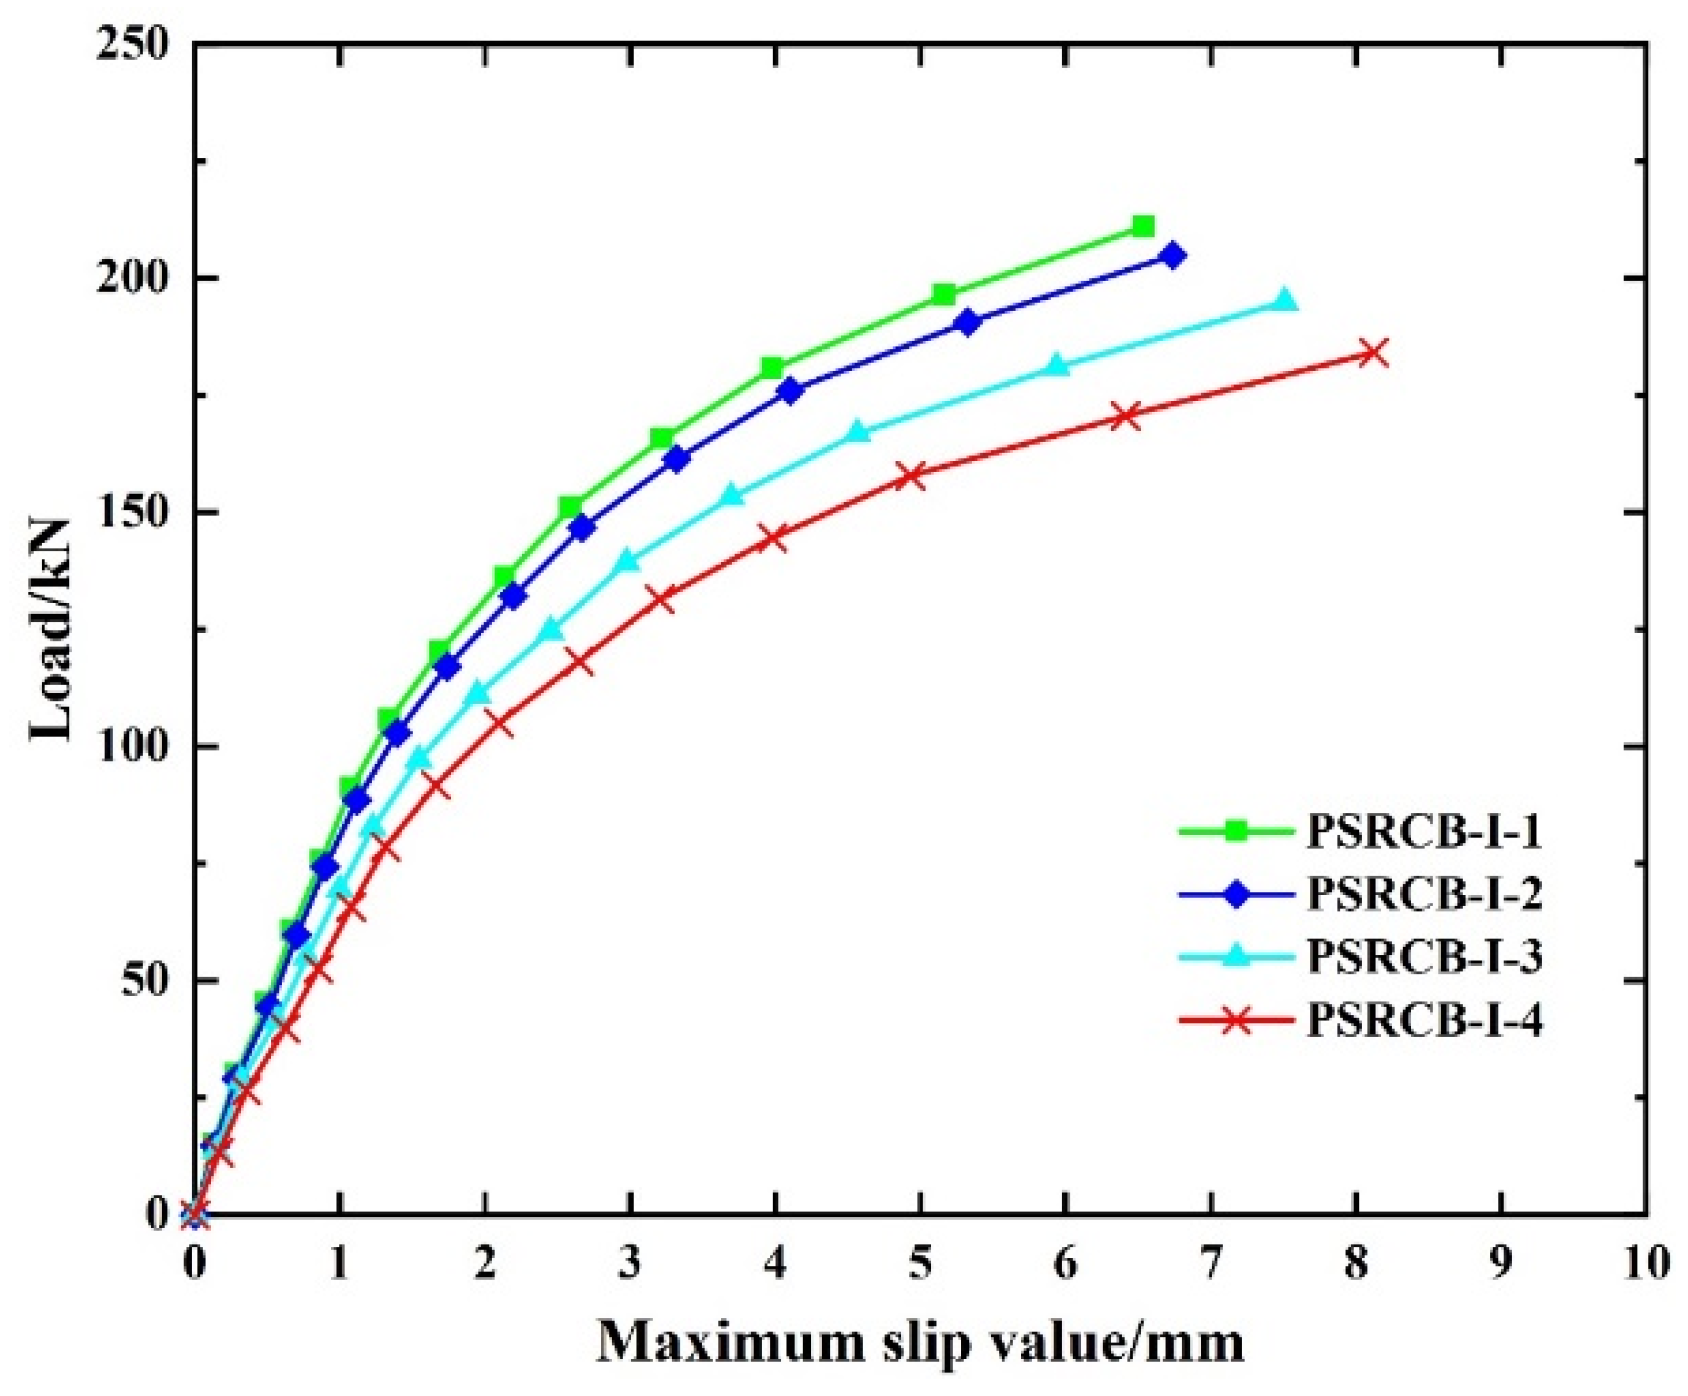
5.3.1. Influence of Different Prestresses on the Load–Slip Curves

For the first group of models, the ultimate bearing capacity results of the prestressed steel-reinforced concrete simply supported beam models under different prestresses are shown in Table 6. With the increasing effective prestress, the ultimate bearing capacity gradually expands. When the effective prestress is 279.61 kN, compared with 222.15 kN, the ultimate bearing capacity increases by 14.8% when the influence of the bond slip is considered. It can be seen from the table that under different prestresses, the influence of the bond slip between the section steel and concrete on the ultimate bearing capacity increases with the decreasing prestressing force. As illustrated in Figure 24, an increase in the prestress causes the maximum slip in the model to increase. In practice, this trend gradually decreases with the increasing load. This phenomenon may arise because the applied prestress affects the initial slip between the steel and the concrete. In ABAQUS, the slip between the section steel and concrete occurs at the beginning of prestressing, and the slip affects the overall stiffness of the beam members. Thus, the deviation between the calculated results and the model with good bond–slip performance becomes more extensive, increasing the maximum slip value.

5.3.2. Effect of Different Concrete Strengths on the Load–Slip Curve

For the second group of models, the ultimate bearing capacity results of the prestressed steel-reinforced concrete simply supported beam models under different concrete strengths are shown in Table 7. With the increasing concrete strength, the ultimate bearing capacity gradually increases. When the concrete strength is 47.97 MPa, compared with 37.21 MPa, and considering the influence of the bond slip, the ultimate bearing capacity increases by 15.2%. It can be seen from the table that with the increasing concrete strength, the influence of the bond slip on the ultimate moment of the prestressed steel-reinforced concrete beam gradually decreases. Figure 25 shows that with the increasing concrete strength, the maximum slip in the model also tends to decrease. This is attributed to the fact that high-strength concrete can improve the stiffness of members and increase the shear stress needed to initiate relative slip between the section steel and concrete to improve the bonding performance between the section steel and concrete.

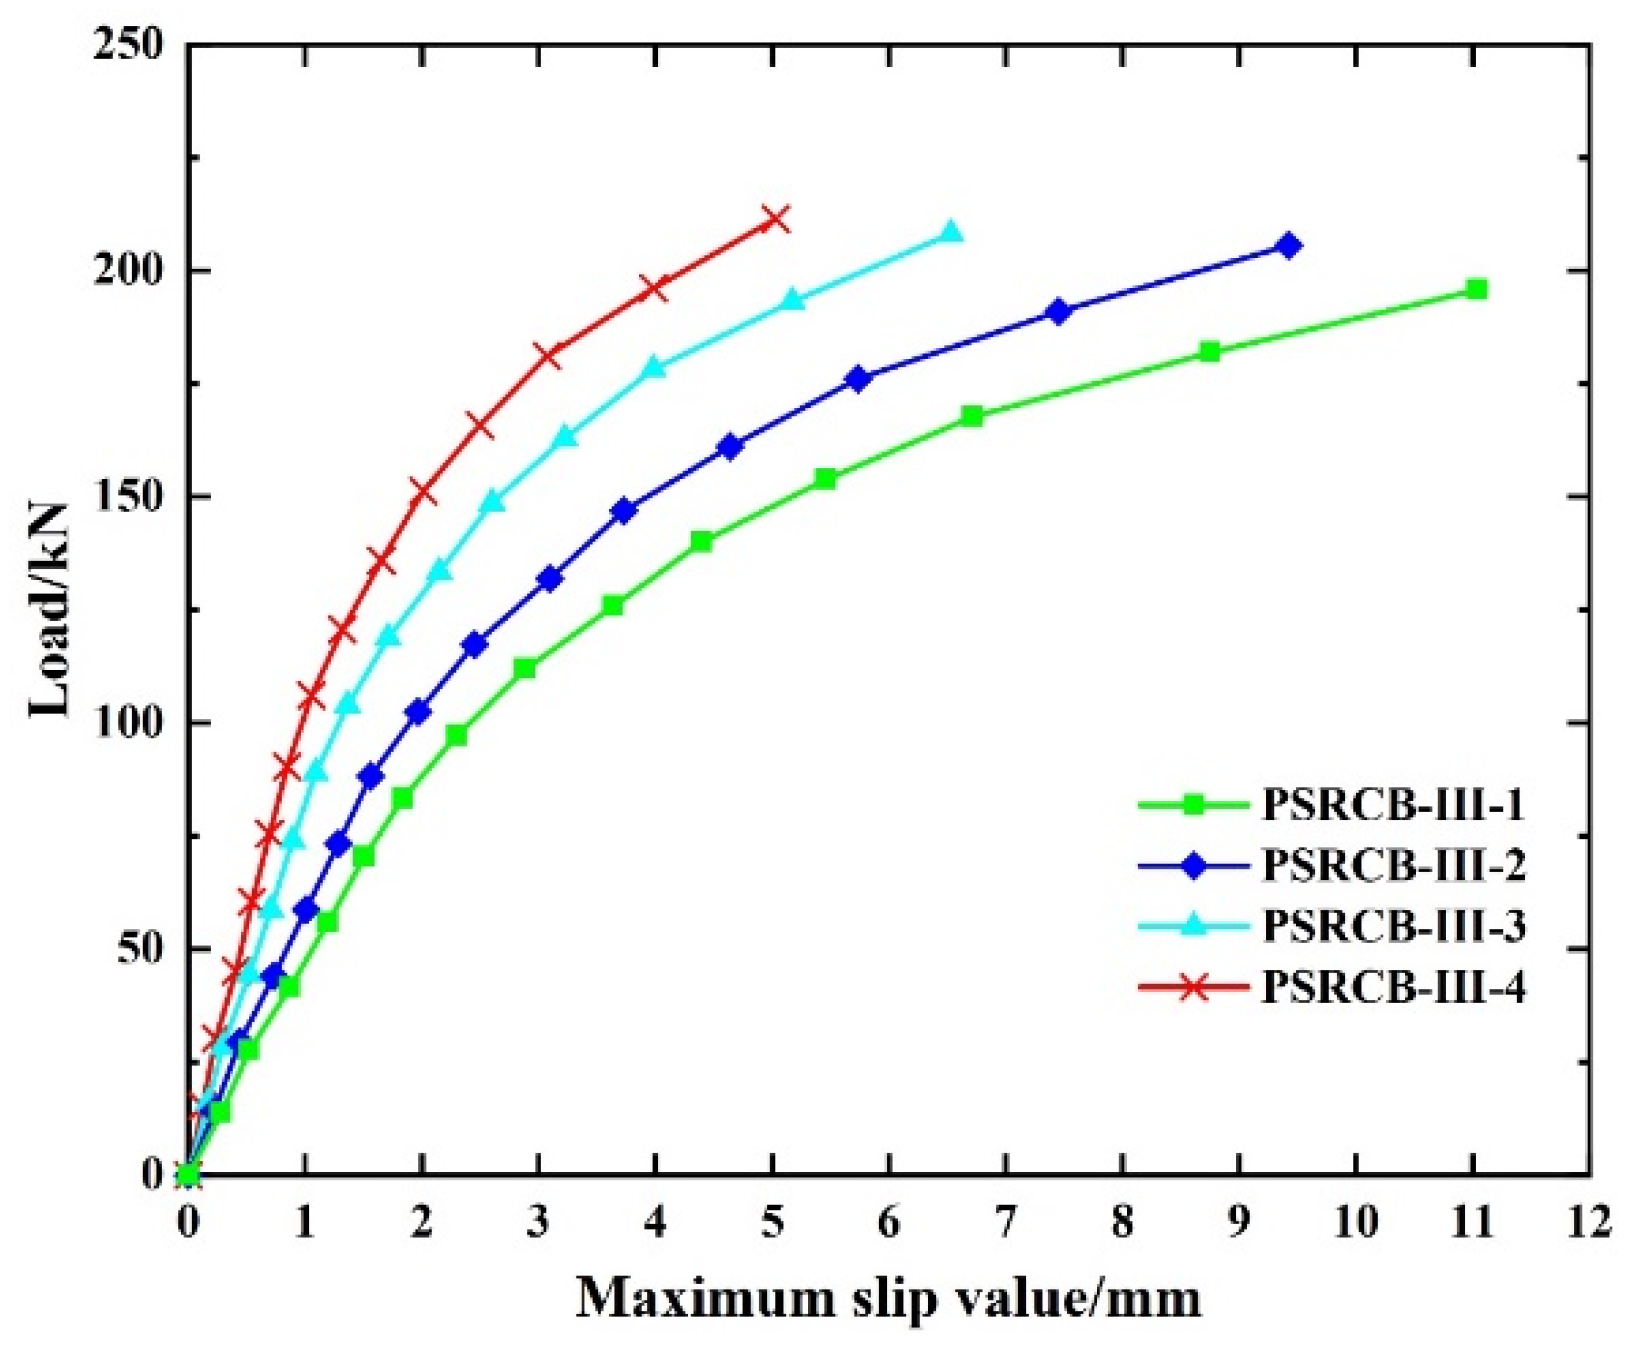
5.3.3. Influence of Different Stirrup Ratios on the Load–Slip Curve

For the third group of models, the ultimate bearing capacity results of the prestressed steel-reinforced concrete simply supported beam models under different stirrup ratios are shown in Table 8. With the increase in the stirrup ratio, the ultimate bearing capacity gradually increases. When the stirrup ratio is 0.50%, compared with 0.25%, the ultimate bearing capacity increases by 7.8% when considering the influence of the bond slip. With the increasing stirrup ratio, the influence of the bond slip on the ultimate bearing capacity of the prestressed steel-reinforced concrete simply supported beam model gradually decreases, and as shown in Figure 26, the maximum slip also tends to decrease. This is because the restraint effect of stirrups on concrete affects the slip between the section of steel and the concrete. Therefore, appropriately increasing the stirrup ratio can effectively control the relative slip on the contact surface between the section steel and the concrete.

5.3.4. Influence of Different Steel Contents on the Load–Slip Strength Curve

As an example, Table 9 shows the ultimate bearing capacity results of the prestressed steel-reinforced concrete simply supported beam models under different steel contents for the fourth set of models. The ultimate bearing capacity increases as the steel content of the section steel increases. When the steel content is 5.41%, compared with 3.37%, the ultimate bearing capacity increases by 9.1% when considering the influence of the bond slip. It can be seen from the data in Table 9 that with the increasing steel content, the change in the ultimate load of the prestressed steel-reinforced concrete simply supported beam model caused by the bond slip gradually increases, as shown in Figure 27. The maximum slip also increases with the increasing steel content. This is because the stirrup ratio and longitudinal reinforcement ratio remain constant. Moreover, as the steel content increases and the thickness of the concrete protective layer decreases, the concrete cannot effectively restrict the slip between the concrete and the section steel, which eventually leads to an increase in the limit load deviation and the slip caused by the bond slip.

6. Limitations

There are three potential limitations of this study.
(1)
The results of the bearing capacity calculated according to the finite element model analysis are greater than the test results; this difference may be caused by the non-uniformity of the material properties of the three test beams, in which the measured material strengths of the reinforcement and section steel are slightly greater than the actual material strengths. Subsequently, a lot of experiments are still needed to identify the problems and measures in the subsequent work.
(2)
For the bond–slip constitutive relationship, this study only applies it, and in future work, we intend to revise and improve it through experiments and simulations.
(3)
In the study of the effect of a different prestress, concrete strength, stirrup ratio, and steel content of section steel on the ultimate bearing capacity of section steel and concrete, the specific effect of simultaneous changes in a variety of parameters was not taken into account, which can be investigated by simulation and experiments in the subsequent work.

7. Conclusions

Based on the results of the static load testing performed on three prestressed steel-reinforced concrete beams, finite element models with and without bond slip are constructed in ABAQUS, and nonlinear numerical simulation analysis is carried out. The conclusions are as follows:
(1)
The test results are compared with the numerical simulation results to verify the accuracy of the finite element model. The calculation results of the finite element model considering the bond–slip constitutive relationship proposed by Yang Yong, among other constitutive relationships tested, are more consistent with the test results, indicating that this bond–slip constitutive relationship is more suitable for the numerical simulation of prestressed steel-reinforced concrete beams.
(2)
To establish a finite element model for calculation, it is appropriate to place bolt nails in the bending and shearing sections to restrict slip between the steel and concrete. The load–slip curve of the steel–concrete beam is also obtained, which reflects the bond slip of the steel–concrete after bearing the load.
(3)
Different finite element models are built to investigate the effects of various prestressing forces, concrete strengths, stirrup ratios, and steel contents of section steel on the ultimate bearing capacity of section steel-reinforced concrete beams and the bond–slip motion between them. The resulting load–slip curves are subsequently applied to the corresponding design curves.
(4)
These findings can serve as a starting point for future research and engineering applications of the bond–slip impact between the steel and concrete in prestressed steel-reinforced concrete beams.

Author Contributions

Conceptualization, N.D. and Y.D.; methodology, N.D. and Y.D.; data analysis, L.D.; writing—original draft preparation, N.D., W.L. and L.D.; writing—review and editing, Y.D. All authors have read and agreed to the published version of the manuscript.

Funding

This research was funded by the National Natural Science Foundation of China (Grant no. 52268048) and the Guangxi Science and Technology Major Project of China (Gui Ke AA22068066).

Institutional Review Board Statement

Not applicable.

Informed Consent Statement

Not applicable.

Data Availability Statement

The testing and analysis data used to support the findings of this study are included within the article.

Conflicts of Interest

The authors declare no conflicts of interest.

References

  1. Charles, C. Bond Stress of Embedded Steel Shapes in Concrete, Composite and Mixed Construction, New York, 1984: New York. 1984. Available online: https://www.semanticscholar.org/paper/Bond-Stress-of-Embedded-Steel-Shapes-in-Concrete-Roeder/3a33436753bef939df4b8adf718bc2c7dd8b73f0 (accessed on 12 June 2024).
  2. Li, H. Experimental Study of the Basic Properties of the Bond between Steel Sections and Concrete. Master’s Thesis, Xi’an University of Architecture and Technology, Xi’an, China, 1994. (In Chinese). [Google Scholar]
  3. Lorenc, W.; Kubica, E. Behavior of composite beams prestressed with external tendons: Experimental study. J. Constr. Steel. Res. 2006, 62, 1353–1366. [Google Scholar] [CrossRef]
  4. Li, F. Experimental Research on the carrying capacity of the Prestressed Steel Reinforced Concrete Beam. Master’s Thesis, Chongqing University, Chongqing, China, 2007. (In Chinese). [Google Scholar]
  5. Choulli, Y. Shear Behavior of Prestressed i-Beams Made with High-Strength Self Compacting Concrete. Ph.D. Thesis, Technical University of Catalonia, Barcelona, Spain, 2005. [Google Scholar]
  6. Choulli, Y.; Marí, A.R.; Cladera, A. Shear behaviour of full-scale prestressed i-beams made with self compacting concrete. Mater. Struct. 2008, 41, 131–141. [Google Scholar] [CrossRef]
  7. Nie, J.G.; Cai, C.S.; Zhou, T.R.; Li, Y. Experimental and Analytical Study of Prestressed Steel–Concrete Composite Beams Considering Slip Effect. J. Struct. Eng. 2007, 133, 530–540. [Google Scholar] [CrossRef]
  8. Wu, K.; Xue, J.; Zhao, H. Study on shear performance of SRC-RC transfer column with short column failure pattern. Ind. Constr. 2010, 40, 51–54. (In Chinese) [Google Scholar] [CrossRef]
  9. Kim, K.S.; Lee, D.H.; Choi, S.M.; Choi, Y.H.; Jung, S.H. Flexural behavior of prestressed composite beams with corrugated web: Part I. Development and analysis. Compos. Part B Eng. 2011, 42, 1603–1616. [Google Scholar] [CrossRef]
  10. Su, X.; Zhang, Q. Bond-slip Behavior of Steel-concrete Interface Under Normal Stress. J. Archit. Civ. Eng. 2019, 36, 9. (In Chinese) [Google Scholar] [CrossRef]
  11. Yu, Y.; He, J.; Yang, Y.; Yang, H.; Yu, J.; Xue, Y. Experimental study and design method on mechanical behaviour of partially precast prestressed steel reinforced concrete beams. Eng. Mech. 2023, 40, 1–11. (In Chinese) [Google Scholar]
  12. Chen, Z.; Wu, C.; Luo, X.; Xu, W.; Liang, W.; Tang, Y. Spatio-temporal autogenous shrinkage and cracking behavior of core concrete in full-scale CFST: Insights from the world’s largest span arch bridge. Thin-Walled Struct. 2024, 200, 111899. [Google Scholar] [CrossRef]
  13. Tang, Y.; Feng, W.; Chen, Z.; Mai, J.; Zheng, J.; Yang, Y. Behaviour of steel-reinforced recycled aggregate concrete-filled GFRP tubular short columns under eccentric axial compression. Thin-Walled Struct. 2024, 199, 111818. [Google Scholar] [CrossRef]
  14. Chen, Z.; Zhang, L.; Tang, Y.; Chen, B. Pioneering lunar habitats through comparative analysis of in-situ concrete technologies: A critical review. Constr. Build. Mater. 2024, 435, 136833. [Google Scholar] [CrossRef]
  15. Izadifar, M.; Dolado, J.S.; Thissen, P. Theoretical Elastic Constants of Tobermorite Enhanced with Reduced Graphene Oxide through Hydroxyl vs Epoxy Functionalization: A First-Principles Study. J. Phys. Chem. C Nanomater. Interfaces 2023, 127, 18117–18126. [Google Scholar] [CrossRef]
  16. Baker, A.L.L. A plastic theory of design for ordinary reinforced and prestressed concrete including moment redistribution in continuous members. Mag. Concr. Res. 1949, 1, 57–66. [Google Scholar] [CrossRef]
  17. Naaman, A.E. Stress at Ultimate in Unbonded Post-Tensioned Tendons-Partl: Evaluation of the State-of-the-Art. ACI Struct. J. 1991, 88, 641–651. [Google Scholar]
  18. Fu, C.; Li, Y.; Liang, S. Experimental study on simply supported prestressed steel reinforced concrete beams. J. Build. Struct. 2007, 28, 62–73. (In Chinese) [Google Scholar] [CrossRef]
  19. Zhang, B. Experimental Study on Bending Performance of Unbonded Prestressed Section Concrete Beams. Master’s Thesis, Hunan University, Changsha, China, 2013. (In Chinese). [Google Scholar] [CrossRef]
  20. Xu, H.; Deng, Z. Experimental research on flexural behavior of prestressed ultra-high performance steel fiber concrete beams. J. Build. Struct. 2014, 35, 58–64. (In Chinese) [Google Scholar] [CrossRef]
  21. Jia, J.; Meng, G.; Zhu, W. Experimental study on flexural capacity of prestressed steel reinforced ultra-high strength composite concrete beams. J. Build. Struct. 2014, 35, 1–10. (In Chinese) [Google Scholar] [CrossRef]
  22. Meng, G. Study on Flexural Performance of Partially Prestressed Steel Skeleton Ultra-High-Strength Concrete Beams. Ph.D. Thesis, Dalian University of Technology, Dalian, China, 2014. (In Chinese). [Google Scholar]
  23. Su, J.Z.; Ma, X.L.; Chen, B.C.; Sennah, K. Full-scale bending test and parametric study on a 30-m span prestressed ultra-high performance concrete box girder. Adv. Struct. Eng. 2019, 23, 1276–1289. [Google Scholar] [CrossRef]
  24. Huang, Z.; Huang, X.; Li, W. Bond-slip behaviour of H-shaped steel embedded in UHPFRC. Steel Compos. Struct. 2021, 38, 563–582. [Google Scholar] [CrossRef]
  25. Li, H.; Duan, J.; Guo, X. Numerical Simulation of Steel-Reinforced Reactive Powder Concrete Beam Based on Bond-Slip. Materials 2021, 14, 4176. [Google Scholar] [CrossRef]
  26. Yu, X.; Mu, Z.; Xing, G. Computational modelling of bending capacity of in vivo unbonded prestressed concrete beams. J. Xi’an Univ. Archit. Technol. Nat. Sci. Ed. 2021, 53, 40–46. (In Chinese) [Google Scholar]
  27. Yang, Y. Research on the Basic Theory and Application of Bonded Slip of Section Steel and Concrete. Ph.D. Thesis, Xi’an University of Architecture and Technology, Xi’an, China, 2003. (In Chinese). [Google Scholar]
  28. Antonio, R.G.C.; José, C.J.; Antonio, H.J.; Mariano, R.Á. Nonlinear Analysis of Rotational Springs to Model Semi-Rigid Frames. Entropy 2022, 24, 953. [Google Scholar] [CrossRef] [PubMed]
  29. Liu, C. Experimental Study of Bonding Properties of Strong Concrete. Master’s Thesis, Hunan University, Changsha, China, 2002. (In Chinese). [Google Scholar] [CrossRef]
  30. Liu, B.; Bai, G. Finite element modeling of bond-slip performance of section steel reinforced concrete. Comput. Concr. 2019, 24, 237–247. [Google Scholar] [CrossRef]
  31. Zhu, B. Principles and Applications of the Finite Unit Method, 3rd ed.; China Water&Power Press: Beijing, China, 2009. (In Chinese) [Google Scholar]
  32. Lou, T. Finite Element Modeling and Analytical Study on the Behavior of Beams Prestressed with Unbonded Tendon. Ph.D. Thesis, Zhejiang University, Hangzhou, China, 2005. (In Chinese). [Google Scholar]
  33. Te, R. Research on Technology Application of Key Nodes in Prefabricated Building Shear Wall Structure. Master’s Thesis, Shenyang Jianzhu University, Shenyang, China, 2020. (In Chinese). [Google Scholar] [CrossRef]
  34. Birtel, V.; Mark, P. Parameterised finite element modelling of RC beam shear failure. In Proceedings of the 2006 ABAQUS Users’ Conference, Boston, MA, USA, 23–25 May 2006. [Google Scholar]
  35. Zhang, J.; Wang, Q.; Hu, S.; Wang, C. Parameters Verification of Concrete Damaged Plastic Model of ABAQUS. Build. Struct. 2008, 38, 4. (In Chinese) [Google Scholar] [CrossRef]
  36. Yang, K.; Sun, L.; Li, W.; Chen, L.; Xie, Z. Cross section design of and mechanical performance investigation into RPC hollow members. Eng. Mech. 2016, 33, 10. (In Chinese) [Google Scholar] [CrossRef]
Figure 1. Technology flowchart.
Buildings 14 02648 g001
Figure 2. Reinforcement arrangement drawing of the test beam (unit: mm).
Buildings 14 02648 g002
Figure 3. Reinforcement arrangement drawing of the test beam section: (a) prestressed steel-reinforced concrete beam; (b) ordinary section steel concrete beam. (unit: mm).
Buildings 14 02648 g003
Figure 4. Distribution diagram of bolt nails in the bending shear section on the upper flange of section steel (unit: mm).
Buildings 14 02648 g004
Figure 5. The bolt nails located at the upper flange of the section steel in the bending shear section.
Buildings 14 02648 g005
Figure 6. Test beam formwork.
Buildings 14 02648 g006
Figure 7. Prototype diagram of loading device (unit: mm).
Buildings 14 02648 g007
Figure 8. Loading device diagram.
Buildings 14 02648 g008
Figure 9. Schematic diagram of the nonlinear spring element.
Buildings 14 02648 g009
Figure 10. F-D curve of normal spring.
Buildings 14 02648 g010
Figure 11. F-D curve of transverse tangential spring.
Buildings 14 02648 g011
Figure 12. Calculation diagram of Ai.
Buildings 14 02648 g012
Figure 13. Nonlinear spring element model.
Buildings 14 02648 g013
Figure 14. Model of section steel with bolt nails.
Buildings 14 02648 g014
Figure 15. Stress diagram for longitudinal stress reinforcement.
Buildings 14 02648 g015
Figure 16. Equivalent stress diagram of section steel.
Buildings 14 02648 g016aBuildings 14 02648 g016b
Figure 17. Total axial strain diagram of concrete in mid-span section.
Buildings 14 02648 g017
Figure 18. Comparison of load–deflection curves.
Buildings 14 02648 g018
Figure 19. Comparison between the crack diagram of the PSRCB and finite element calculation results.
Buildings 14 02648 g019
Figure 20. Comparison between the crack diagram of the SRCB-A and finite element calculation results.
Buildings 14 02648 g020
Figure 21. Comparison between the crack diagram of the SRCB-B and finite element calculation results.
Buildings 14 02648 g021
Figure 22. Slip curve at different sections of the test beam.
Buildings 14 02648 g022
Figure 23. Nonlinear calculation of the load–slip curve of the test beam.
Buildings 14 02648 g023
Figure 24. Load–slip curves for different prestressing forces.
Buildings 14 02648 g024
Figure 25. Load–slip curves for different concrete strengths.
Buildings 14 02648 g025
Figure 26. Load–slip curves for different stirrup ratios.
Buildings 14 02648 g026
Figure 27. Load–slip curves for different steel contents.
Buildings 14 02648 g027
Table 1. Mechanical properties of the concrete.
Strength Grade of Concretefcu/MPafc/MPaft/MPaEc/MPa
C4042.2127.312.853.44 × 104
Table 2. Mechanical properties of steel.
Steel TypeNominal Diameter/mmYield Strength/MPaUltimate Strength/MPa
Steel strand15.215741889
HPB3008337461
HRB40012403564
HRB40014409578
Q345347504
Table 3. Cracking load of the specimen.
Cracking Load/kN
Specimen
Type
Test ValueCalculated Value (Without Bond Slip)Calculated Value (Bond–Slip Constitutive Relation A)Calculated Value (Bond–Slip Constitutive Relation B)Test Value/Calculated Value (Without Bond Slip)Test value/Calculated Value (Bond–Slip Constitutive Relation A)Test Value/Calculated Value (Bond–Slip Constitutive Relation B)
PSRCB72.485.9178.3374.650.8430.9240.970
SRCB-A21.327.1723.6822.150.7830.8990.962
SRCB-B23.631.3727.4525.260.7520.8600.934
Note: Bond–slip constitutive relation A is the bond–slip constitutive relation proposed by Liu Can according to the beam test, and bond–slip constitutive relation B is the bond–slip constitutive relation proposed by Yang Yong according to the push-out test.
Table 4. The ultimate load of the specimen.
Ultimate Load/kN
Specimen
Type
Test ValueCalculated Value (Without Bond Slip)Calculated Value (Bond–Slip Constitutive Relation A)Calculated Value (Bond–Slip Constitutive Relation B)Test Value/Calculated Value (Without Bond Slip)Test Value/Calculated Value (Bond–Slip Constitutive Relation A)Test Value/Calculated Value (Bond–Slip Constitutive Relation B)
PSRCB193.6207.86200.78194.740.9310.9640.994
SRCB-A182.6201.93193.24187.420.9040.9450.974
SRCB-B184.7205.57197.40190.730.8980.9360.968
Table 5. (a) Prestress strength. (b) Concrete strength. (c) Stirrup ratio. (d) Steel content.
(a)
Model numberPSRCB-I-1PSRCB-I-2PSRCB-I-3PSRCB-I-4
Effective preload279.61 kN260.47 kN241.34 kN222.15 kN
(b)
Model numberPSRCB-II-1PSRCB-II-2PSRCB-II-3PSRCB-II-4
Concrete strength37.21 MPa40.99 MPa44.51 MPa47.97 MPa
(c)
Model numberPSRCB-III-1PSRCB-III-2PSRCB-III-3PSRCB-III-4
Hoop ratio0.25%0.34%0.42%0.50%
(d)
Model numberPSRCB-IV-1PSRCB-IV-2PSRCB-IV-3PSRCB-IV-4
Steel content3.37%3.94%4.70%5.41%
Table 6. Comparison of the ultimate bearing capacity results of the models under different prestresses.
Model NumberBond Slip Is Not Considered
N 1 ( k N )
Bond Slip Is Considered
N 2 ( k N )
Deviation
N 1     N 2 N 1
PSRCB-I-1227.84210.967.41%
PSRCB-I-2223.12204.848.19%
PSRCB-I-3215.94195.109.65%
PSRCB-I-4207.76183.6911.59%
Table 7. Comparison of ultimate bearing capacity of the model under different concrete strengths.
Model NumberBond Slip Is Not Considered
N 1 ( k N )
Bond Slip Is Considered
N 2 ( k N )
Deviation
N 1     N 2 N 1
PSRCB-II-1227.84210.967.41%
PSRCB-II-2234.98220.915.97%
PSRCB-II-3242.38230.844.76%
PSRCB-II-4252.78243.063.85%
Table 8. Comparison of ultimate bearing capacity of models with different stirrup ratios.
Model NumberBond Slip Is Not Considered
N 1 ( k N )
Bond Slip Is Considered
N 2 ( k N )
Deviation
N 1     N 2 N 1
PSRCB-III-1222.48195.6412.06%
PSRCB-III-2226.70205.279.45%
PSRCB-III-3227.18207.958.46%
PSRCB-III-4227.84210.967.41%
Table 9. Comparison of ultimate bearing capacity of models with different steel contents.
Model NumberBond Slip Is Not Considered
N 1 ( k N )
Bond Slip Is Considered
N 2 ( k N )
Deviation
N 1     N 2 N 1
PSRCB-IV-1215.42204.235.19%
PSRCB-IV-2227.84210.967.41%
PSRCB-IV-3238.21217.558.67%
PSRCB-IV-4245.02222.899.03%
Disclaimer/Publisher’s Note: The statements, opinions and data contained in all publications are solely those of the individual author(s) and contributor(s) and not of MDPI and/or the editor(s). MDPI and/or the editor(s) disclaim responsibility for any injury to people or property resulting from any ideas, methods, instructions or products referred to in the content.

