
Dynamic Performance Analysis of Precast Segment Column Reinforced with CFRP Subject to Vehicle Collision
Abstract
:1. Introduction
2. Numerical Model Validation
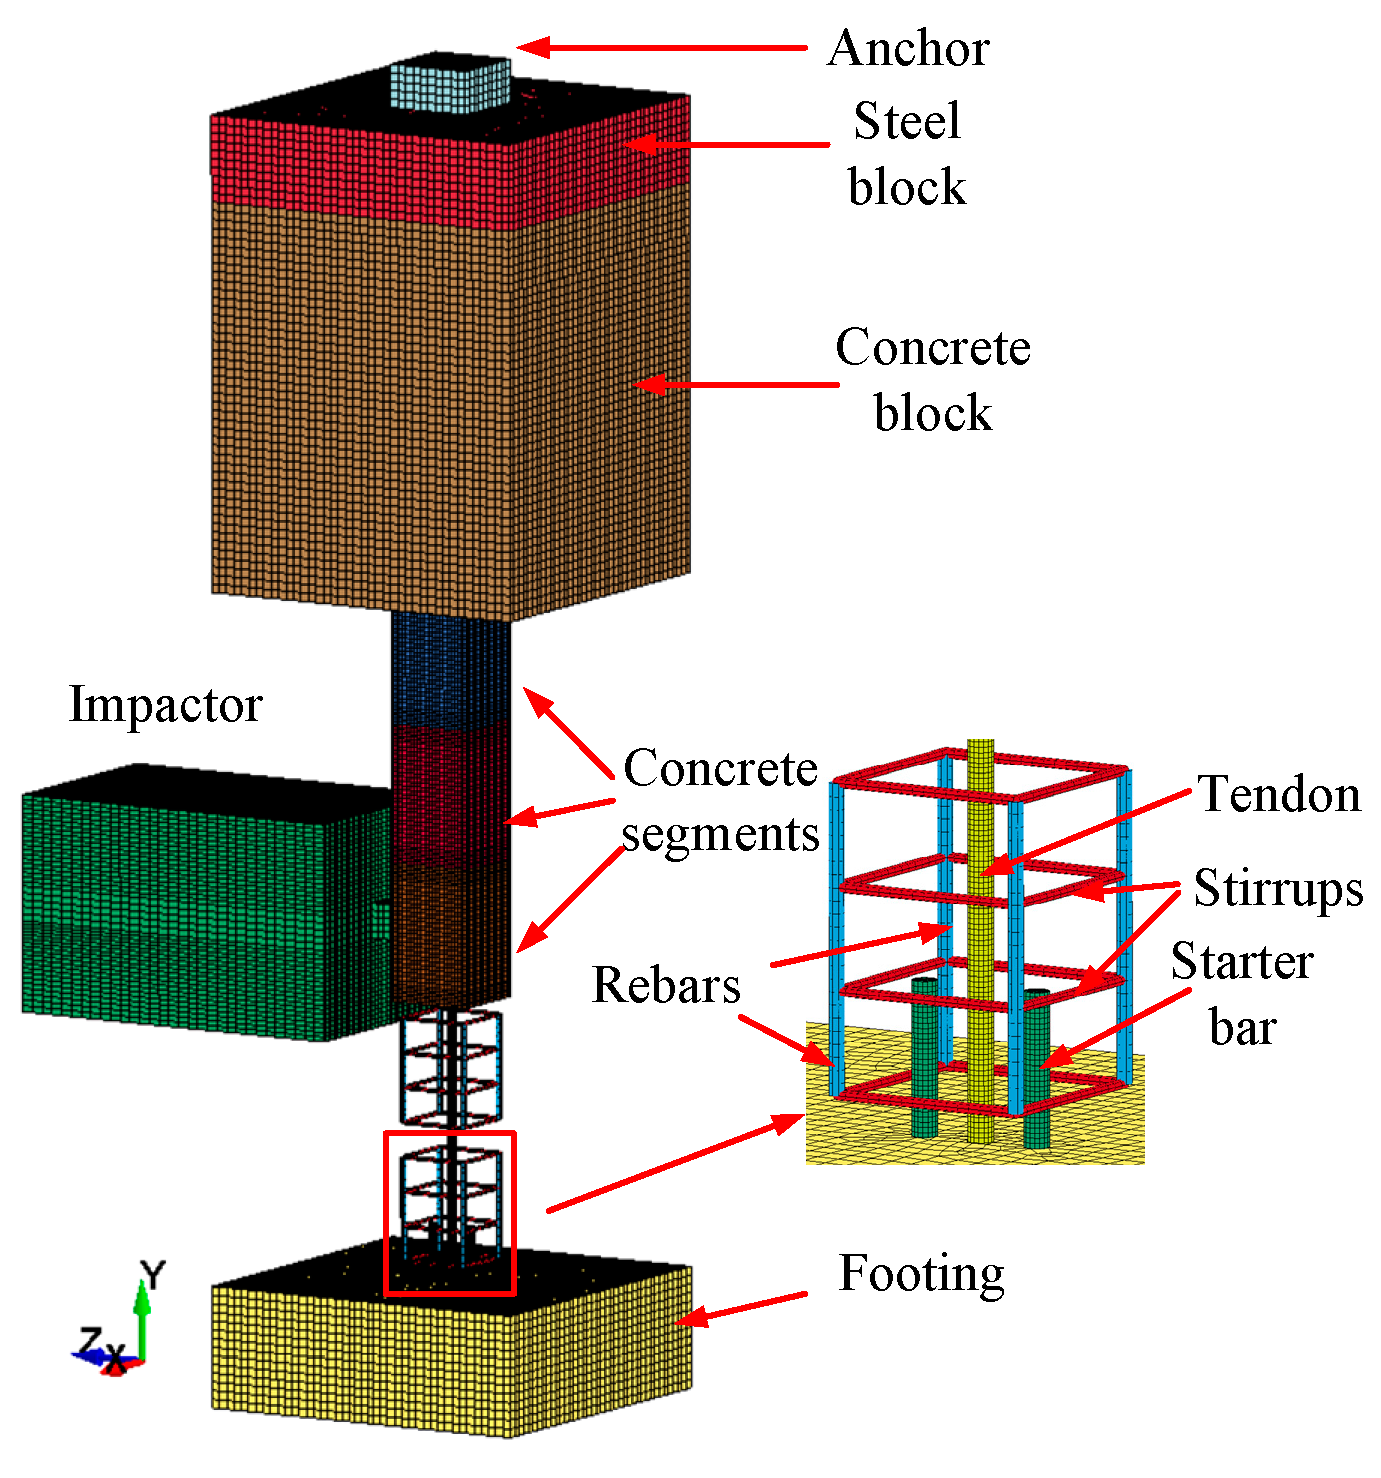
2.1. Precast Segment Column
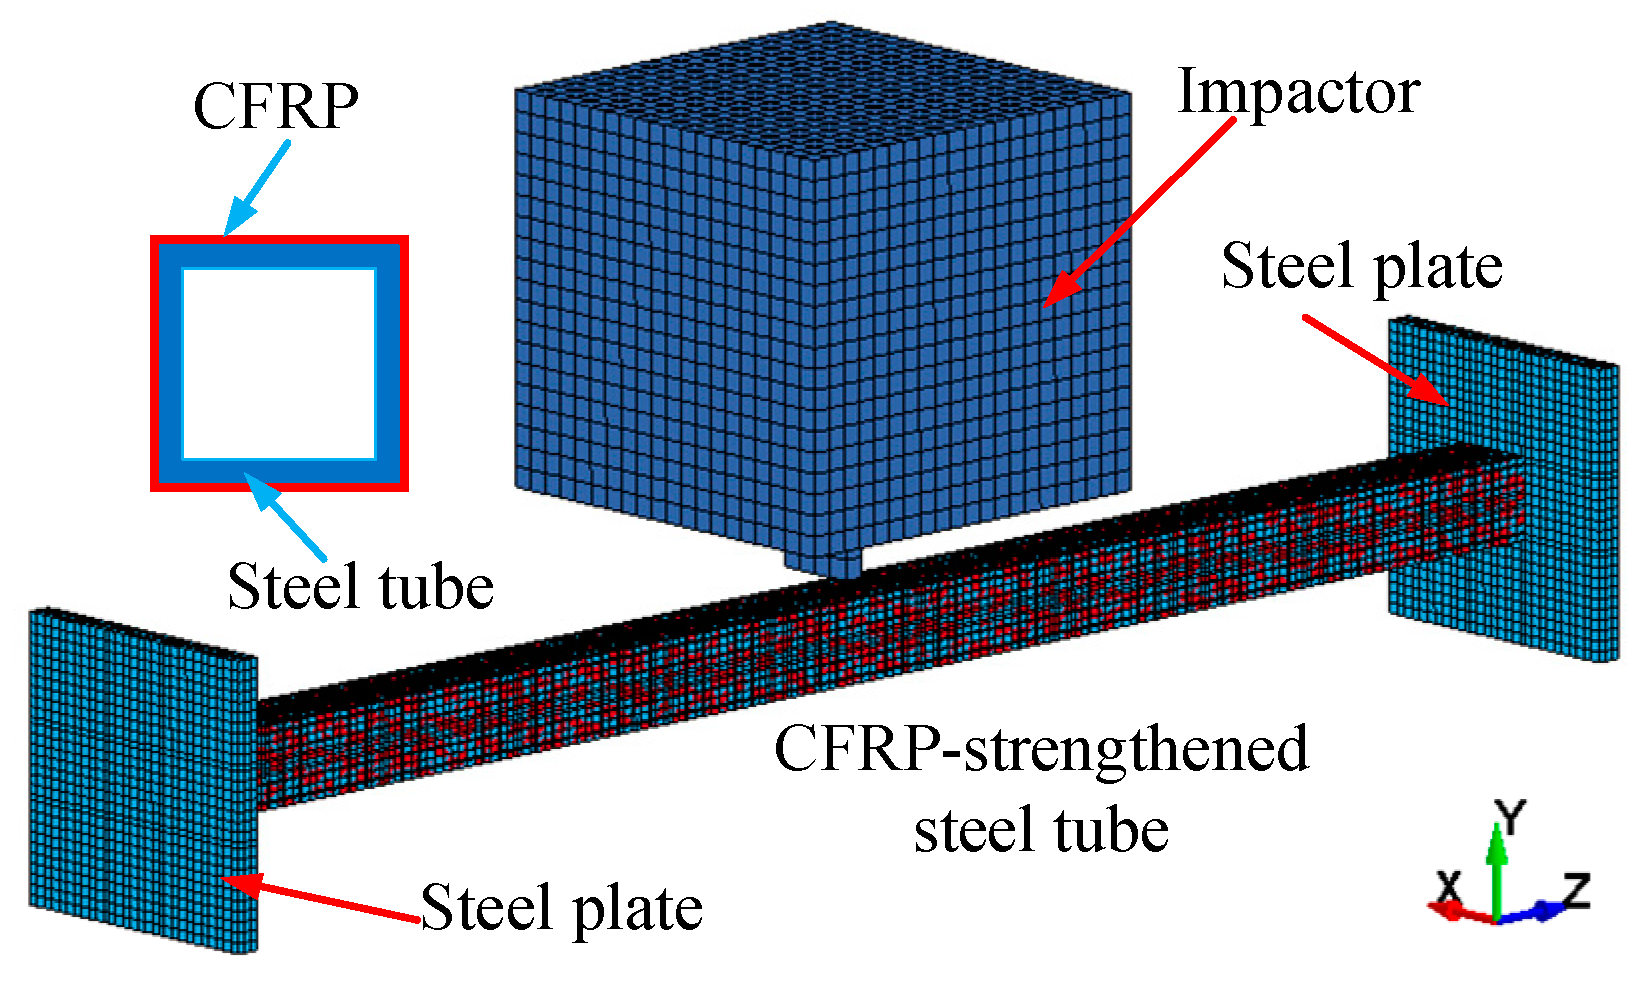
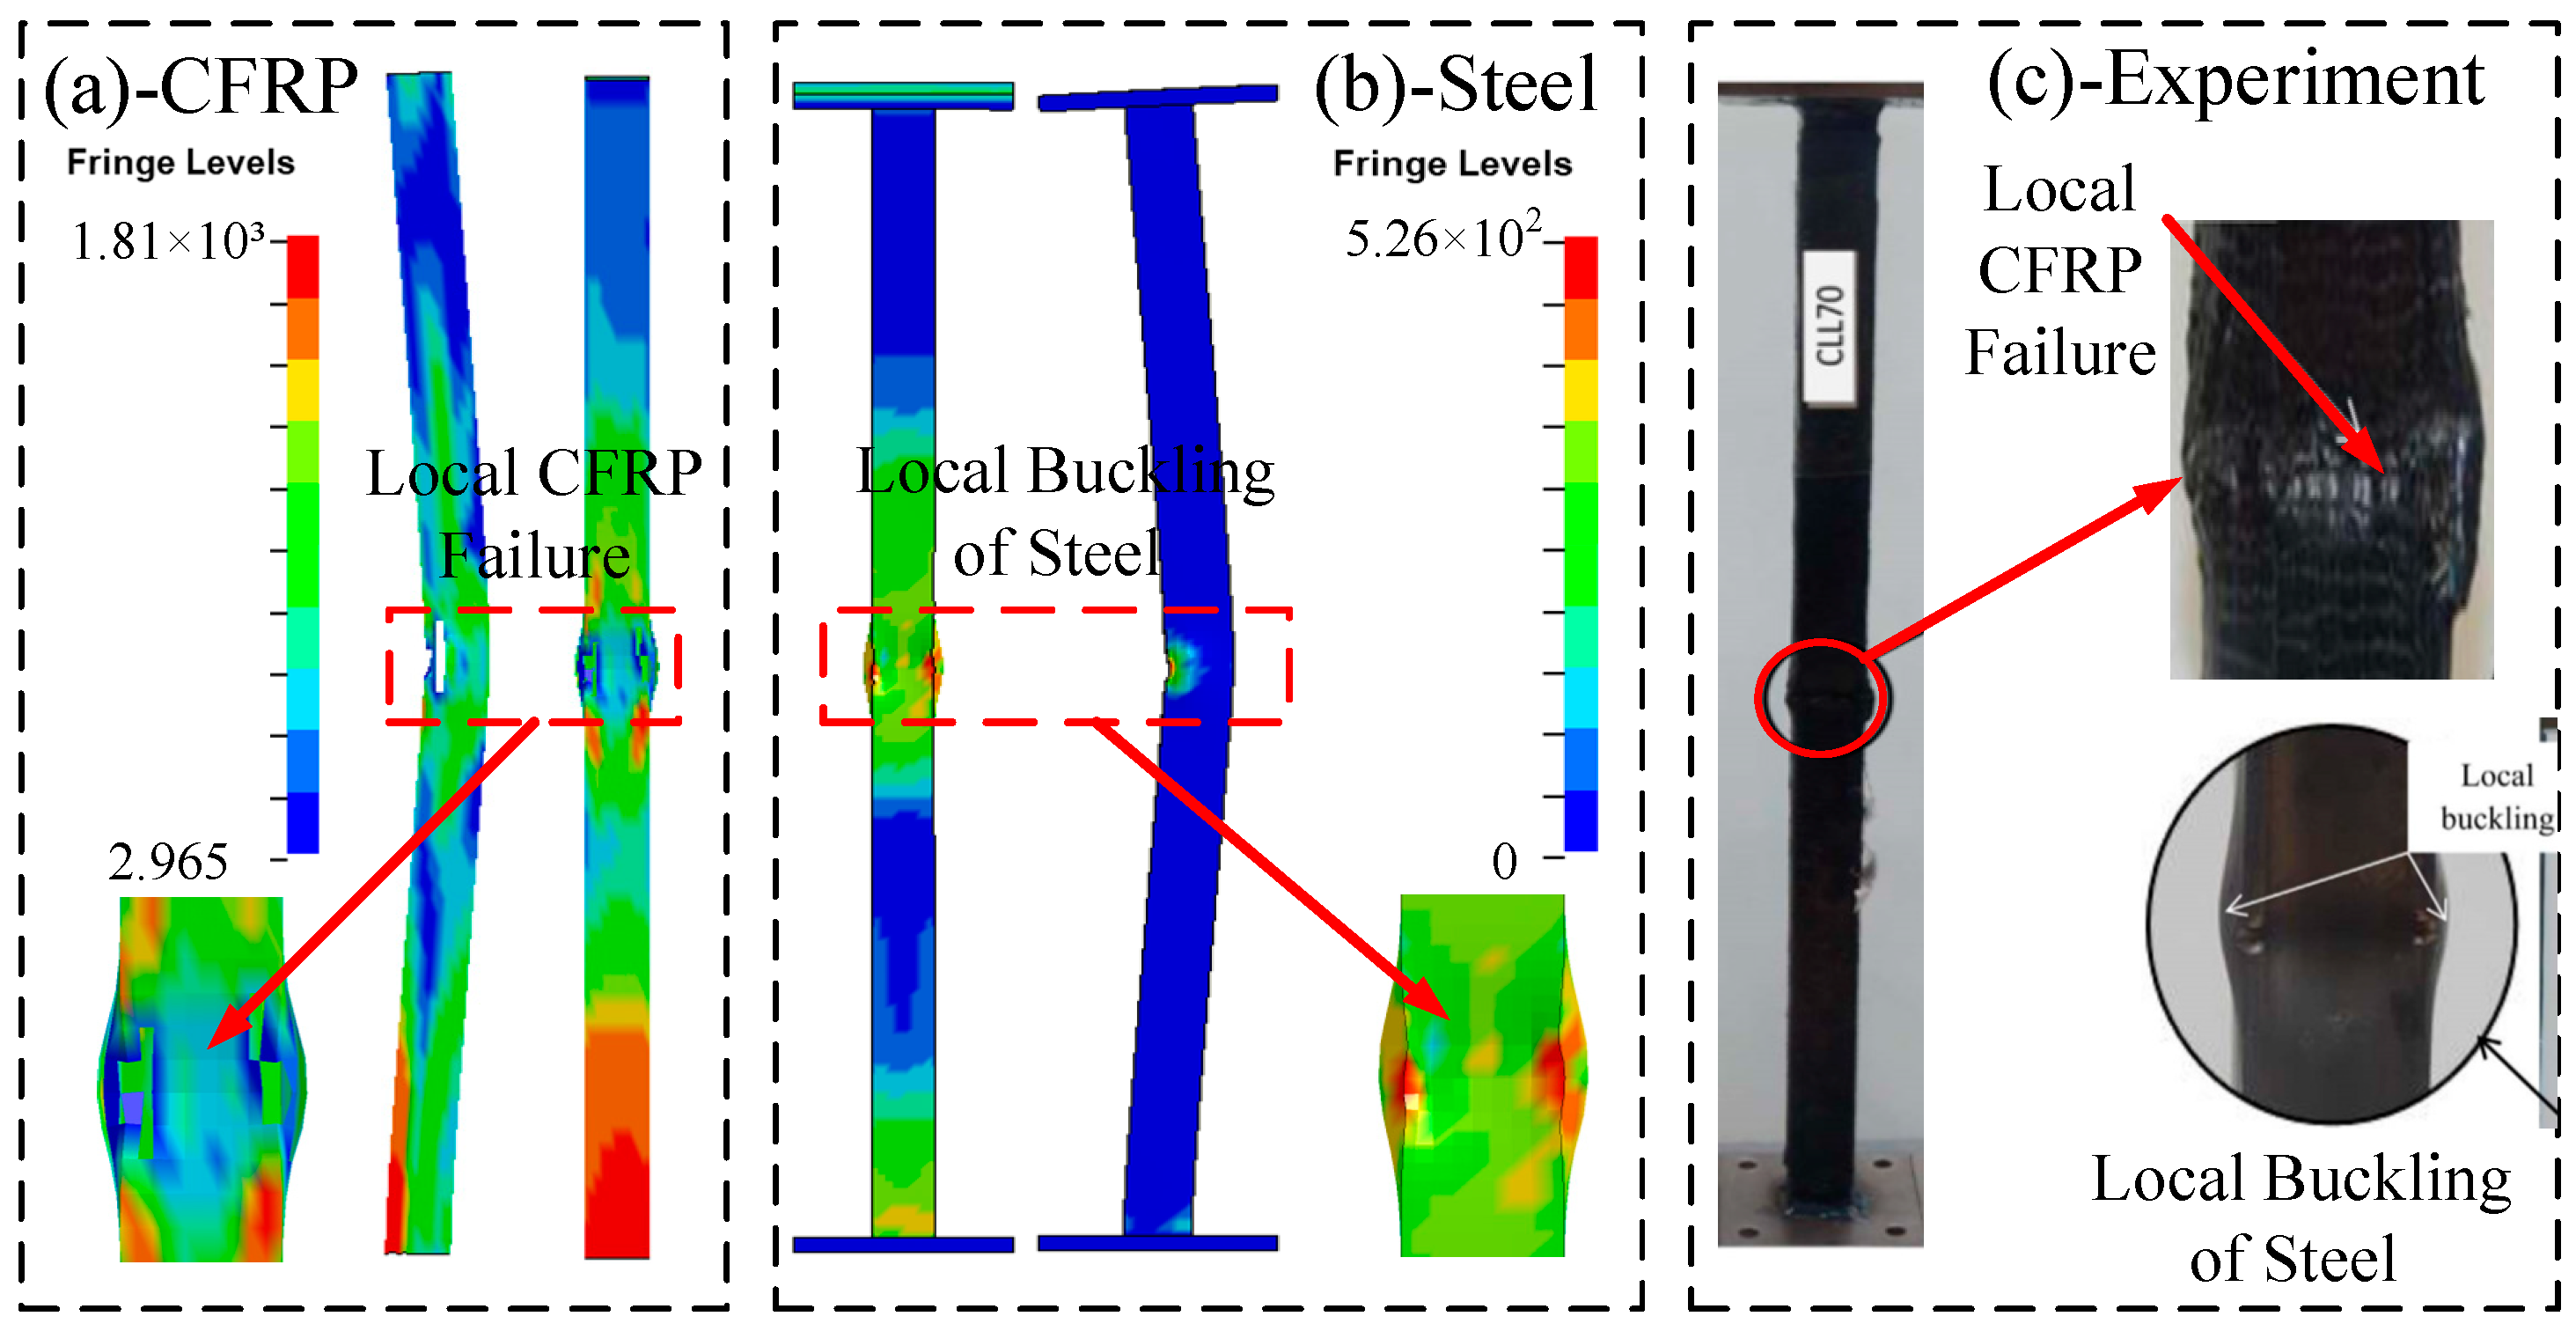
2.2. Steel Column Reinforced with CFRP
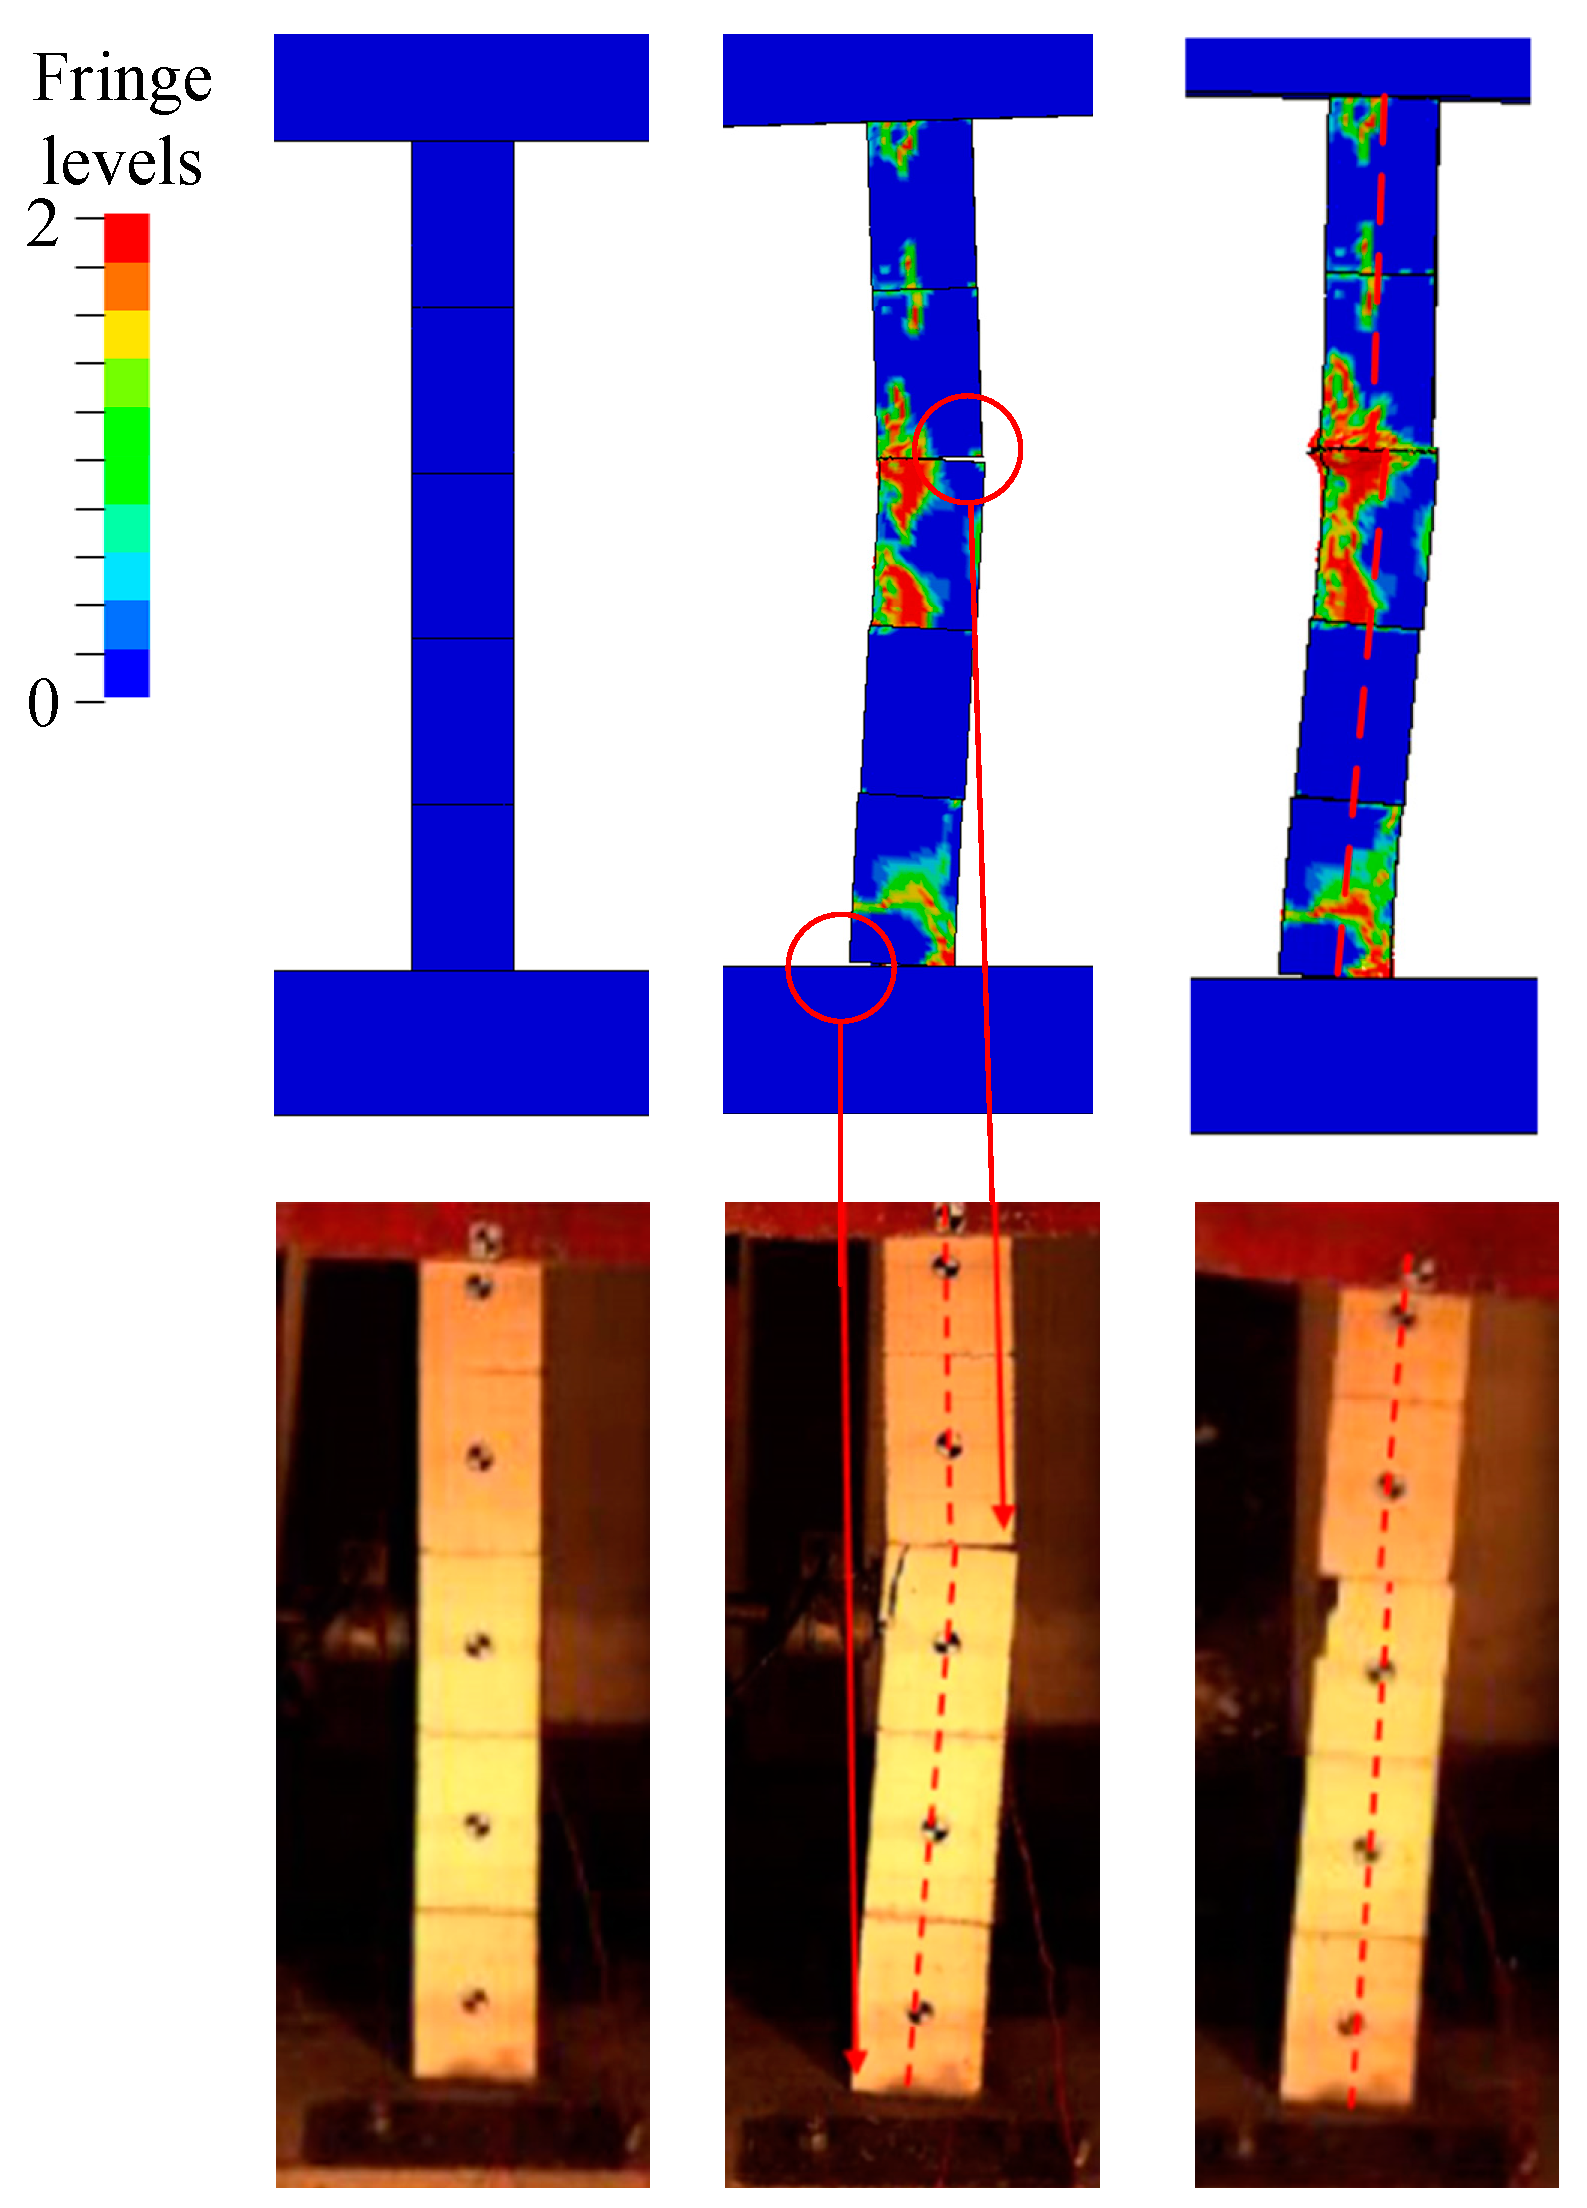
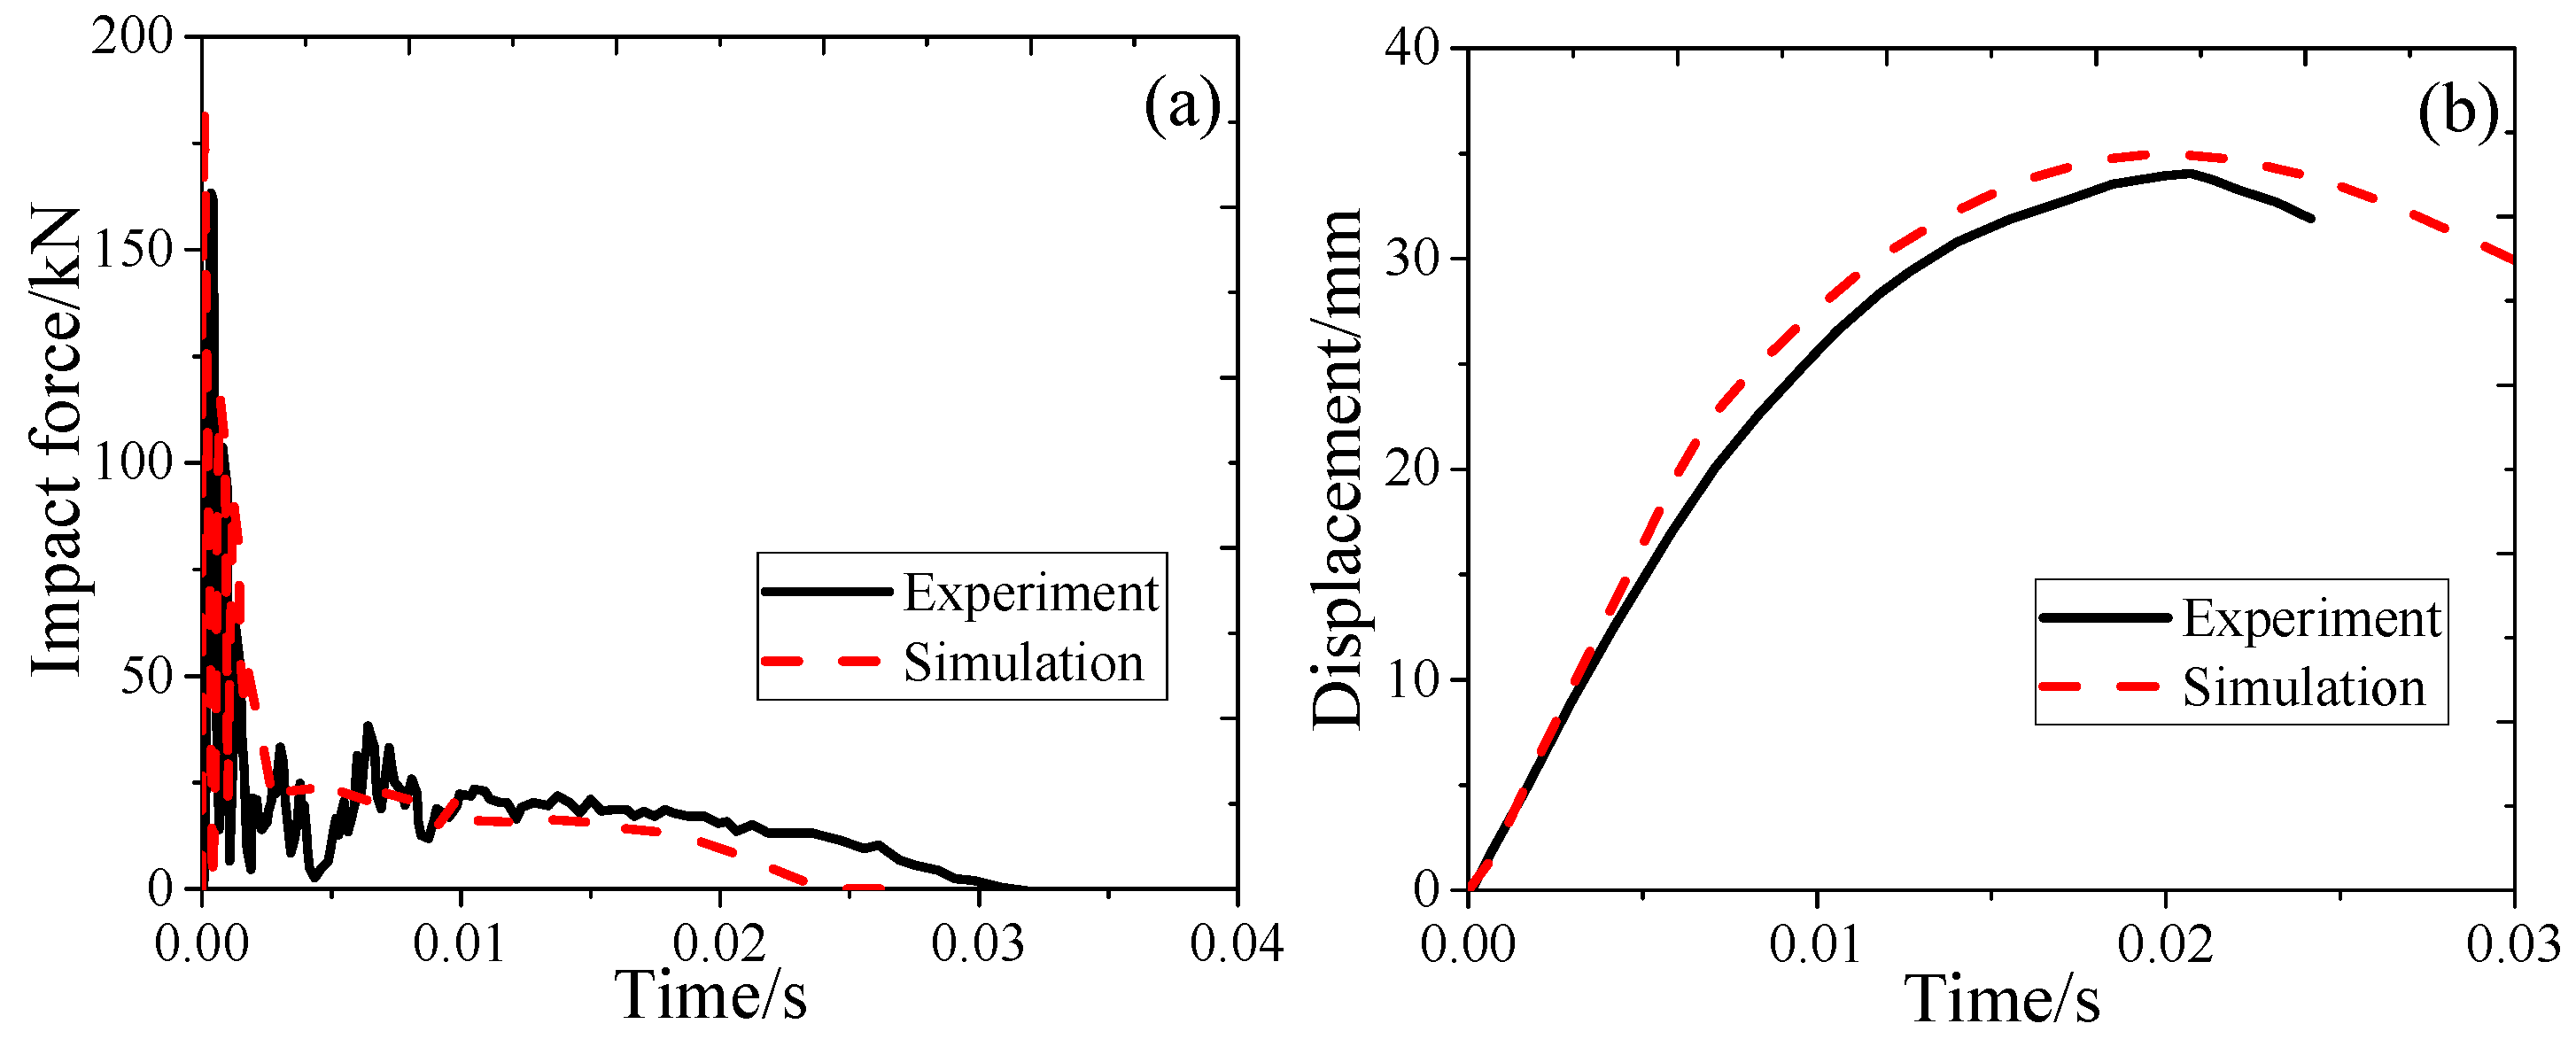
2.3. Results and Validation
3. Numerical Model of Bridge under Vehicle Collision
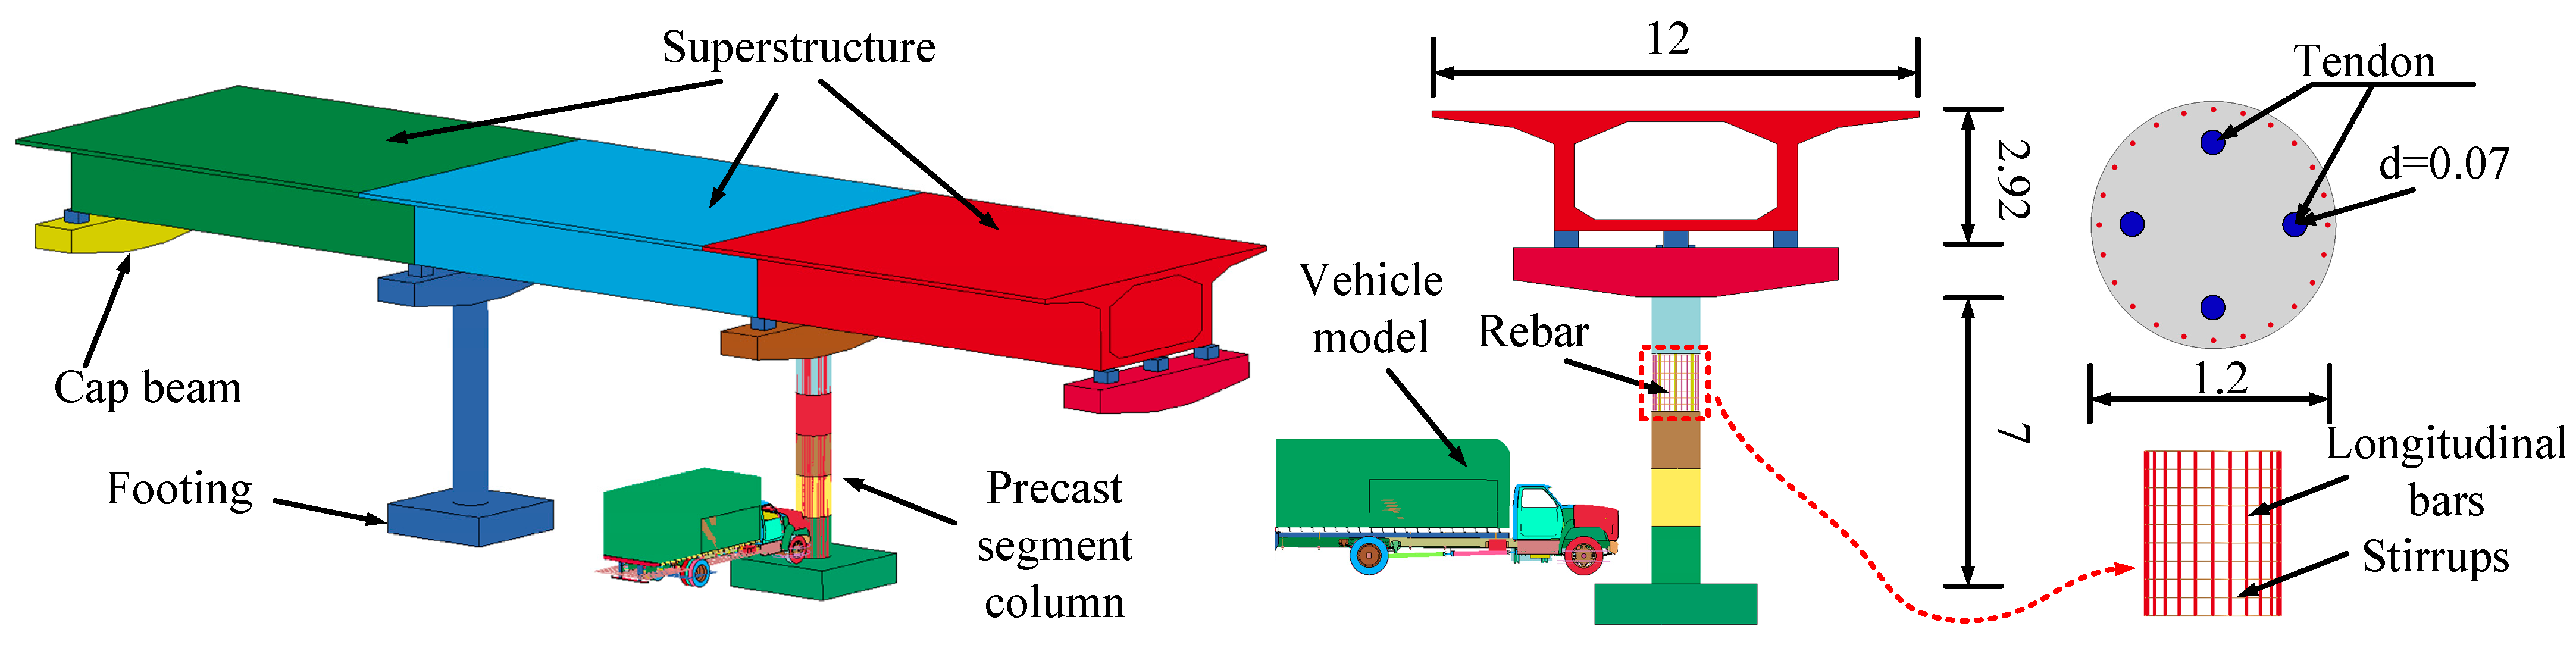
3.1. Bridge Model
3.2. Vehicle Model
4. Results of PSC with and without CFRP
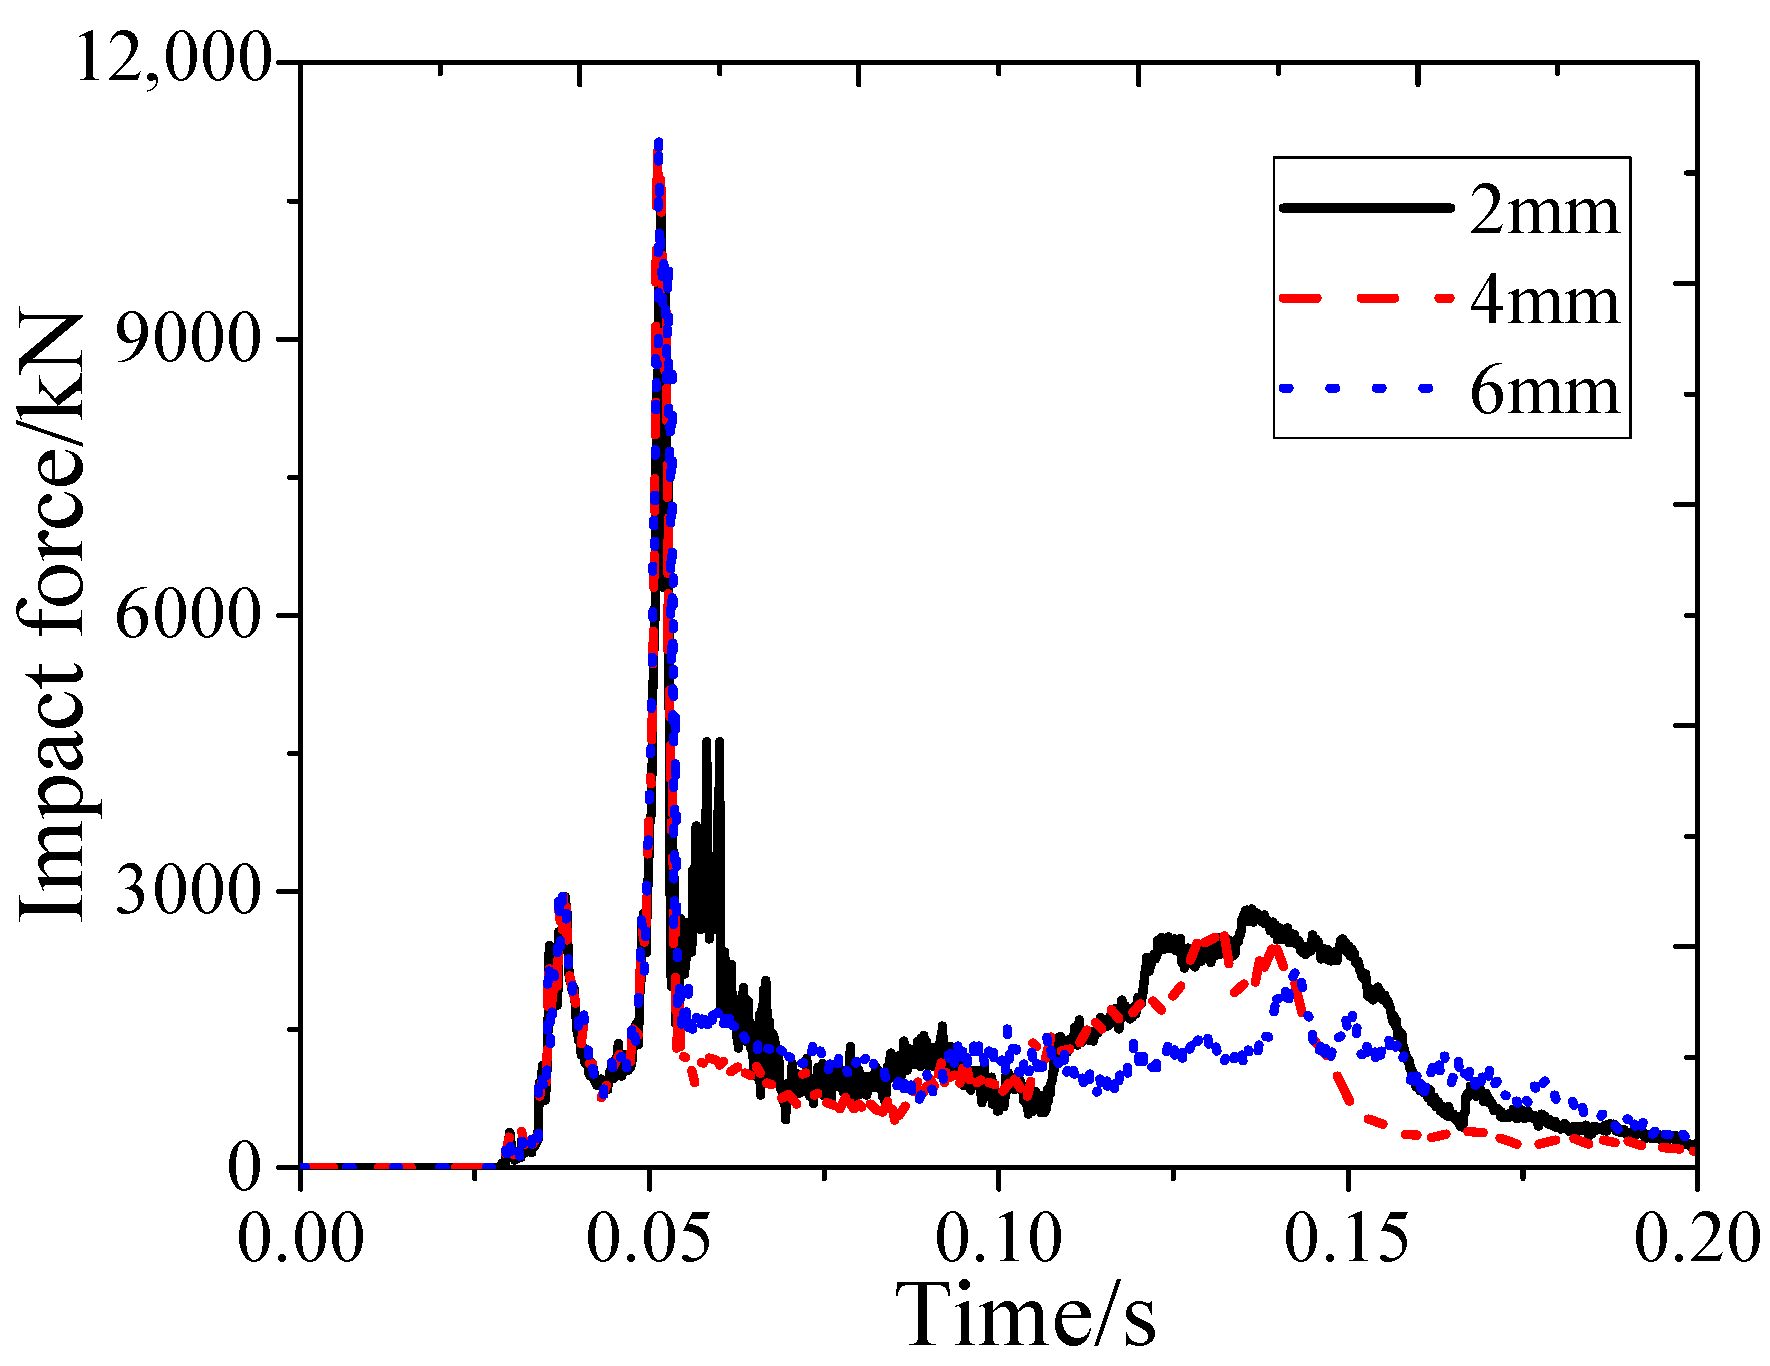
4.1. Impact Force
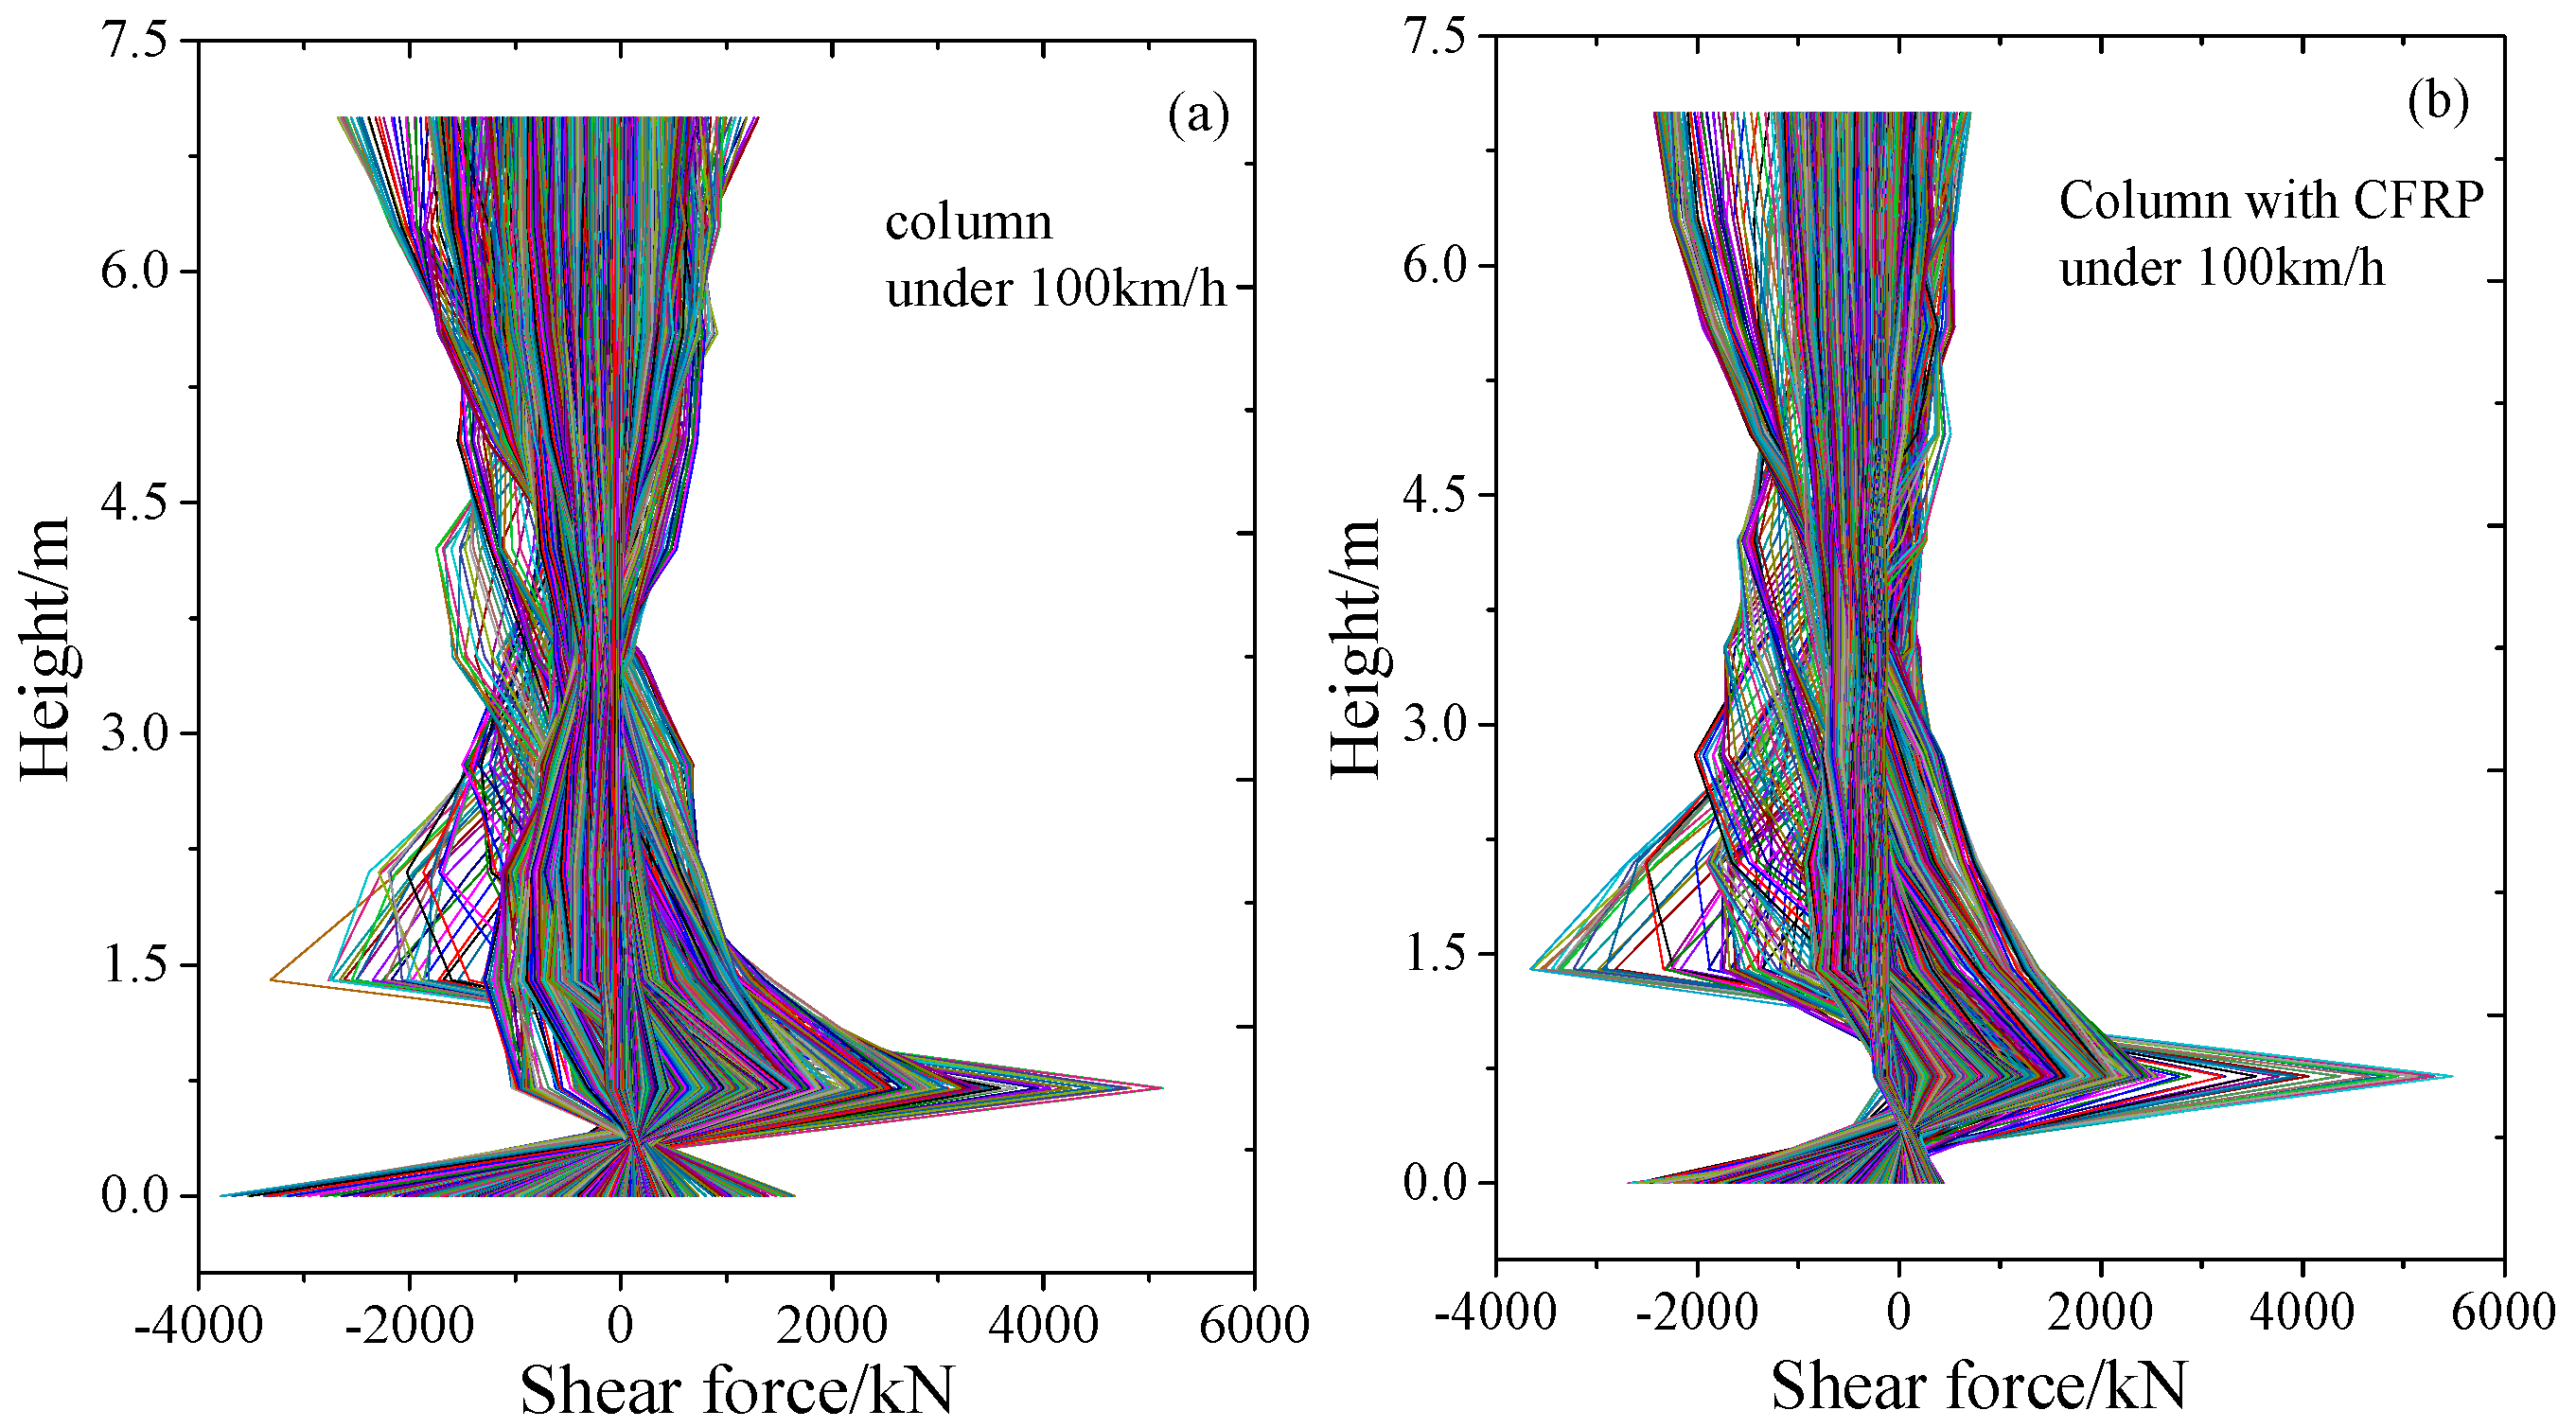
4.2. Shear Force
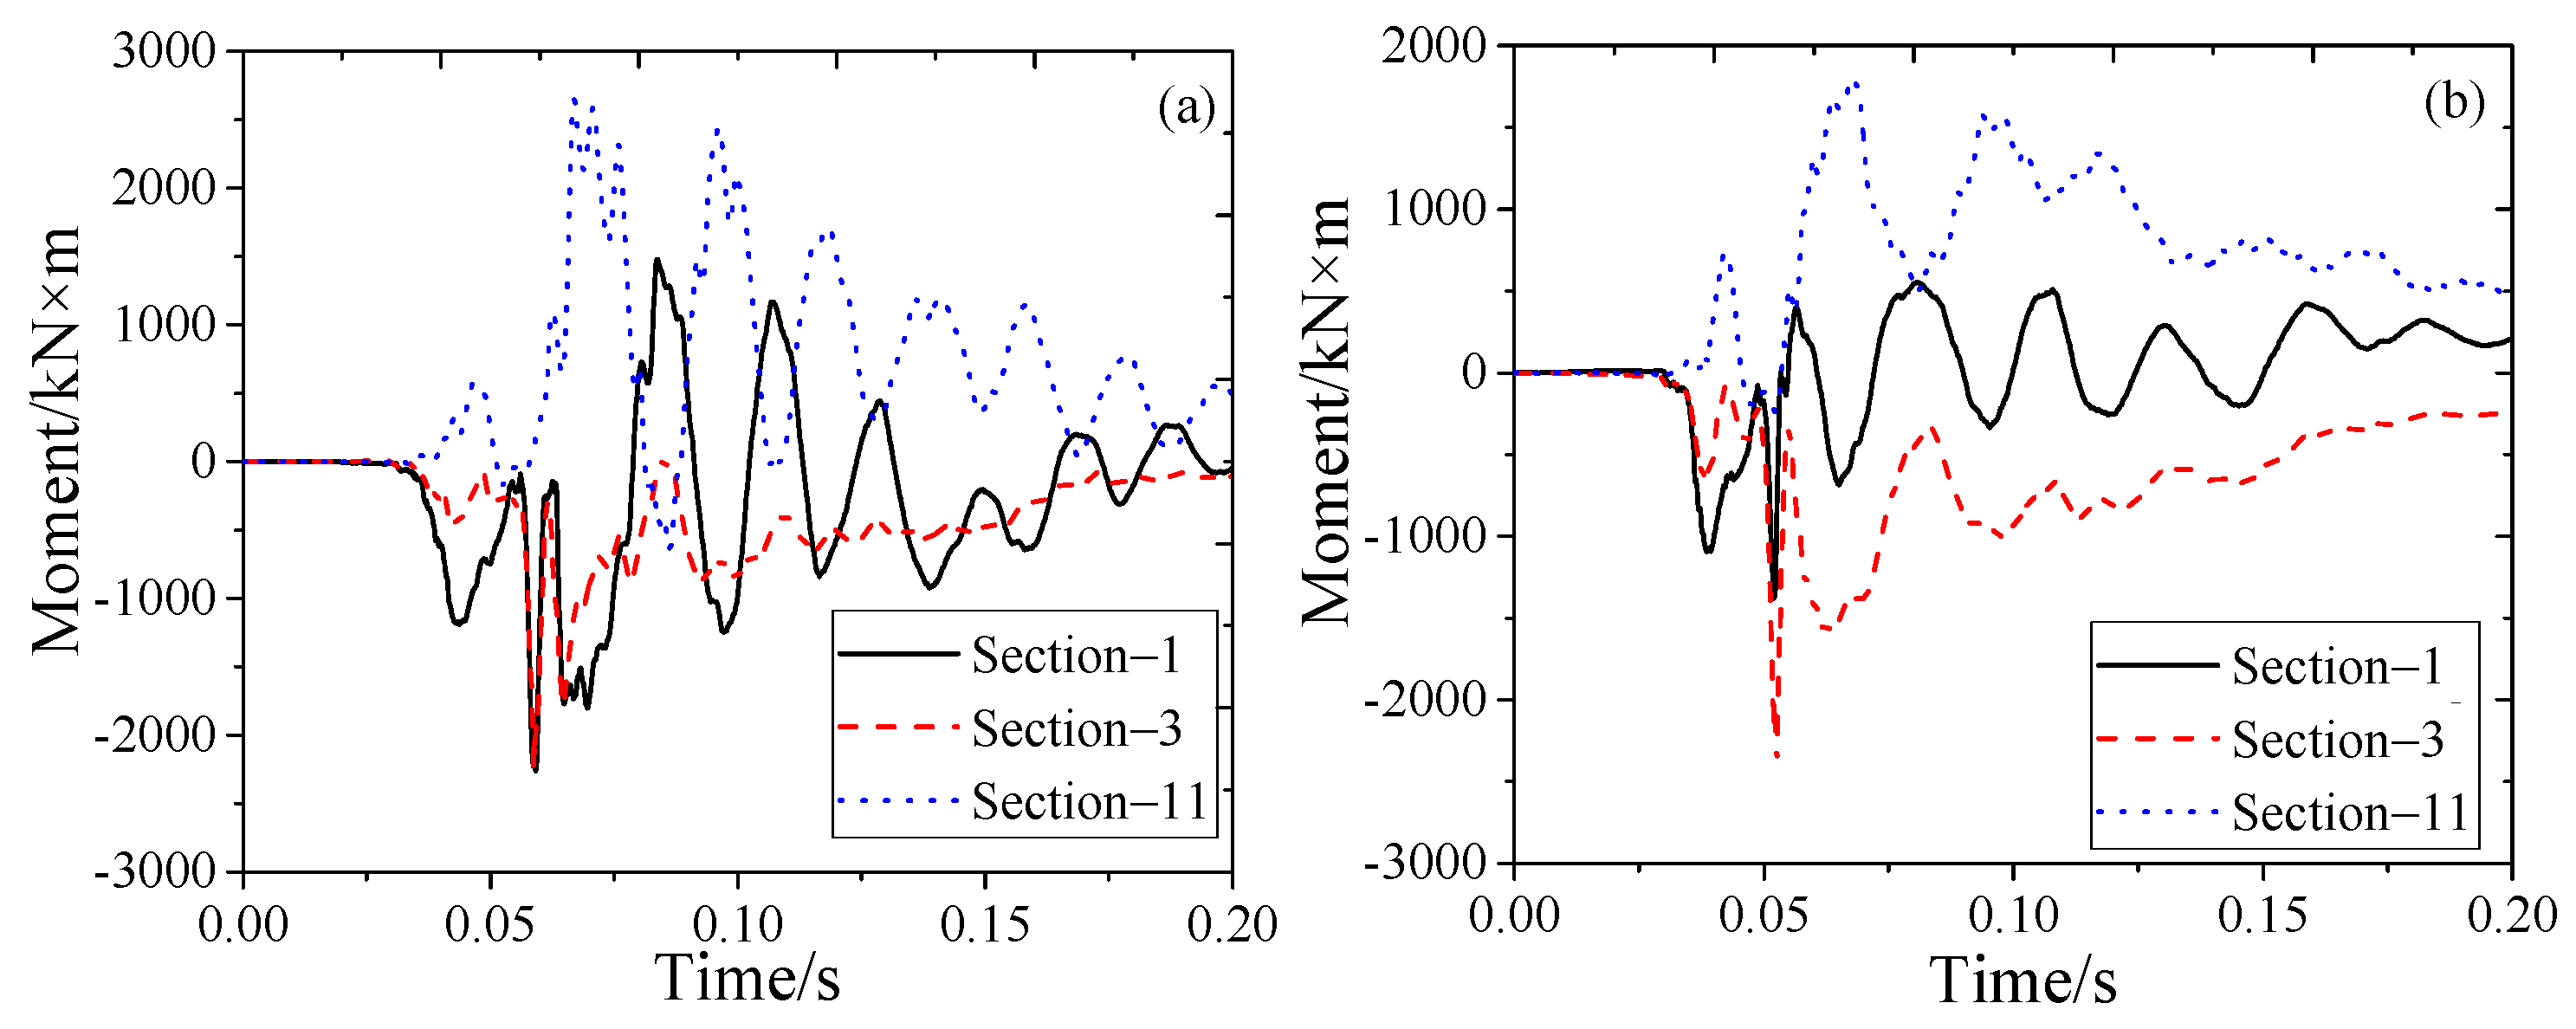
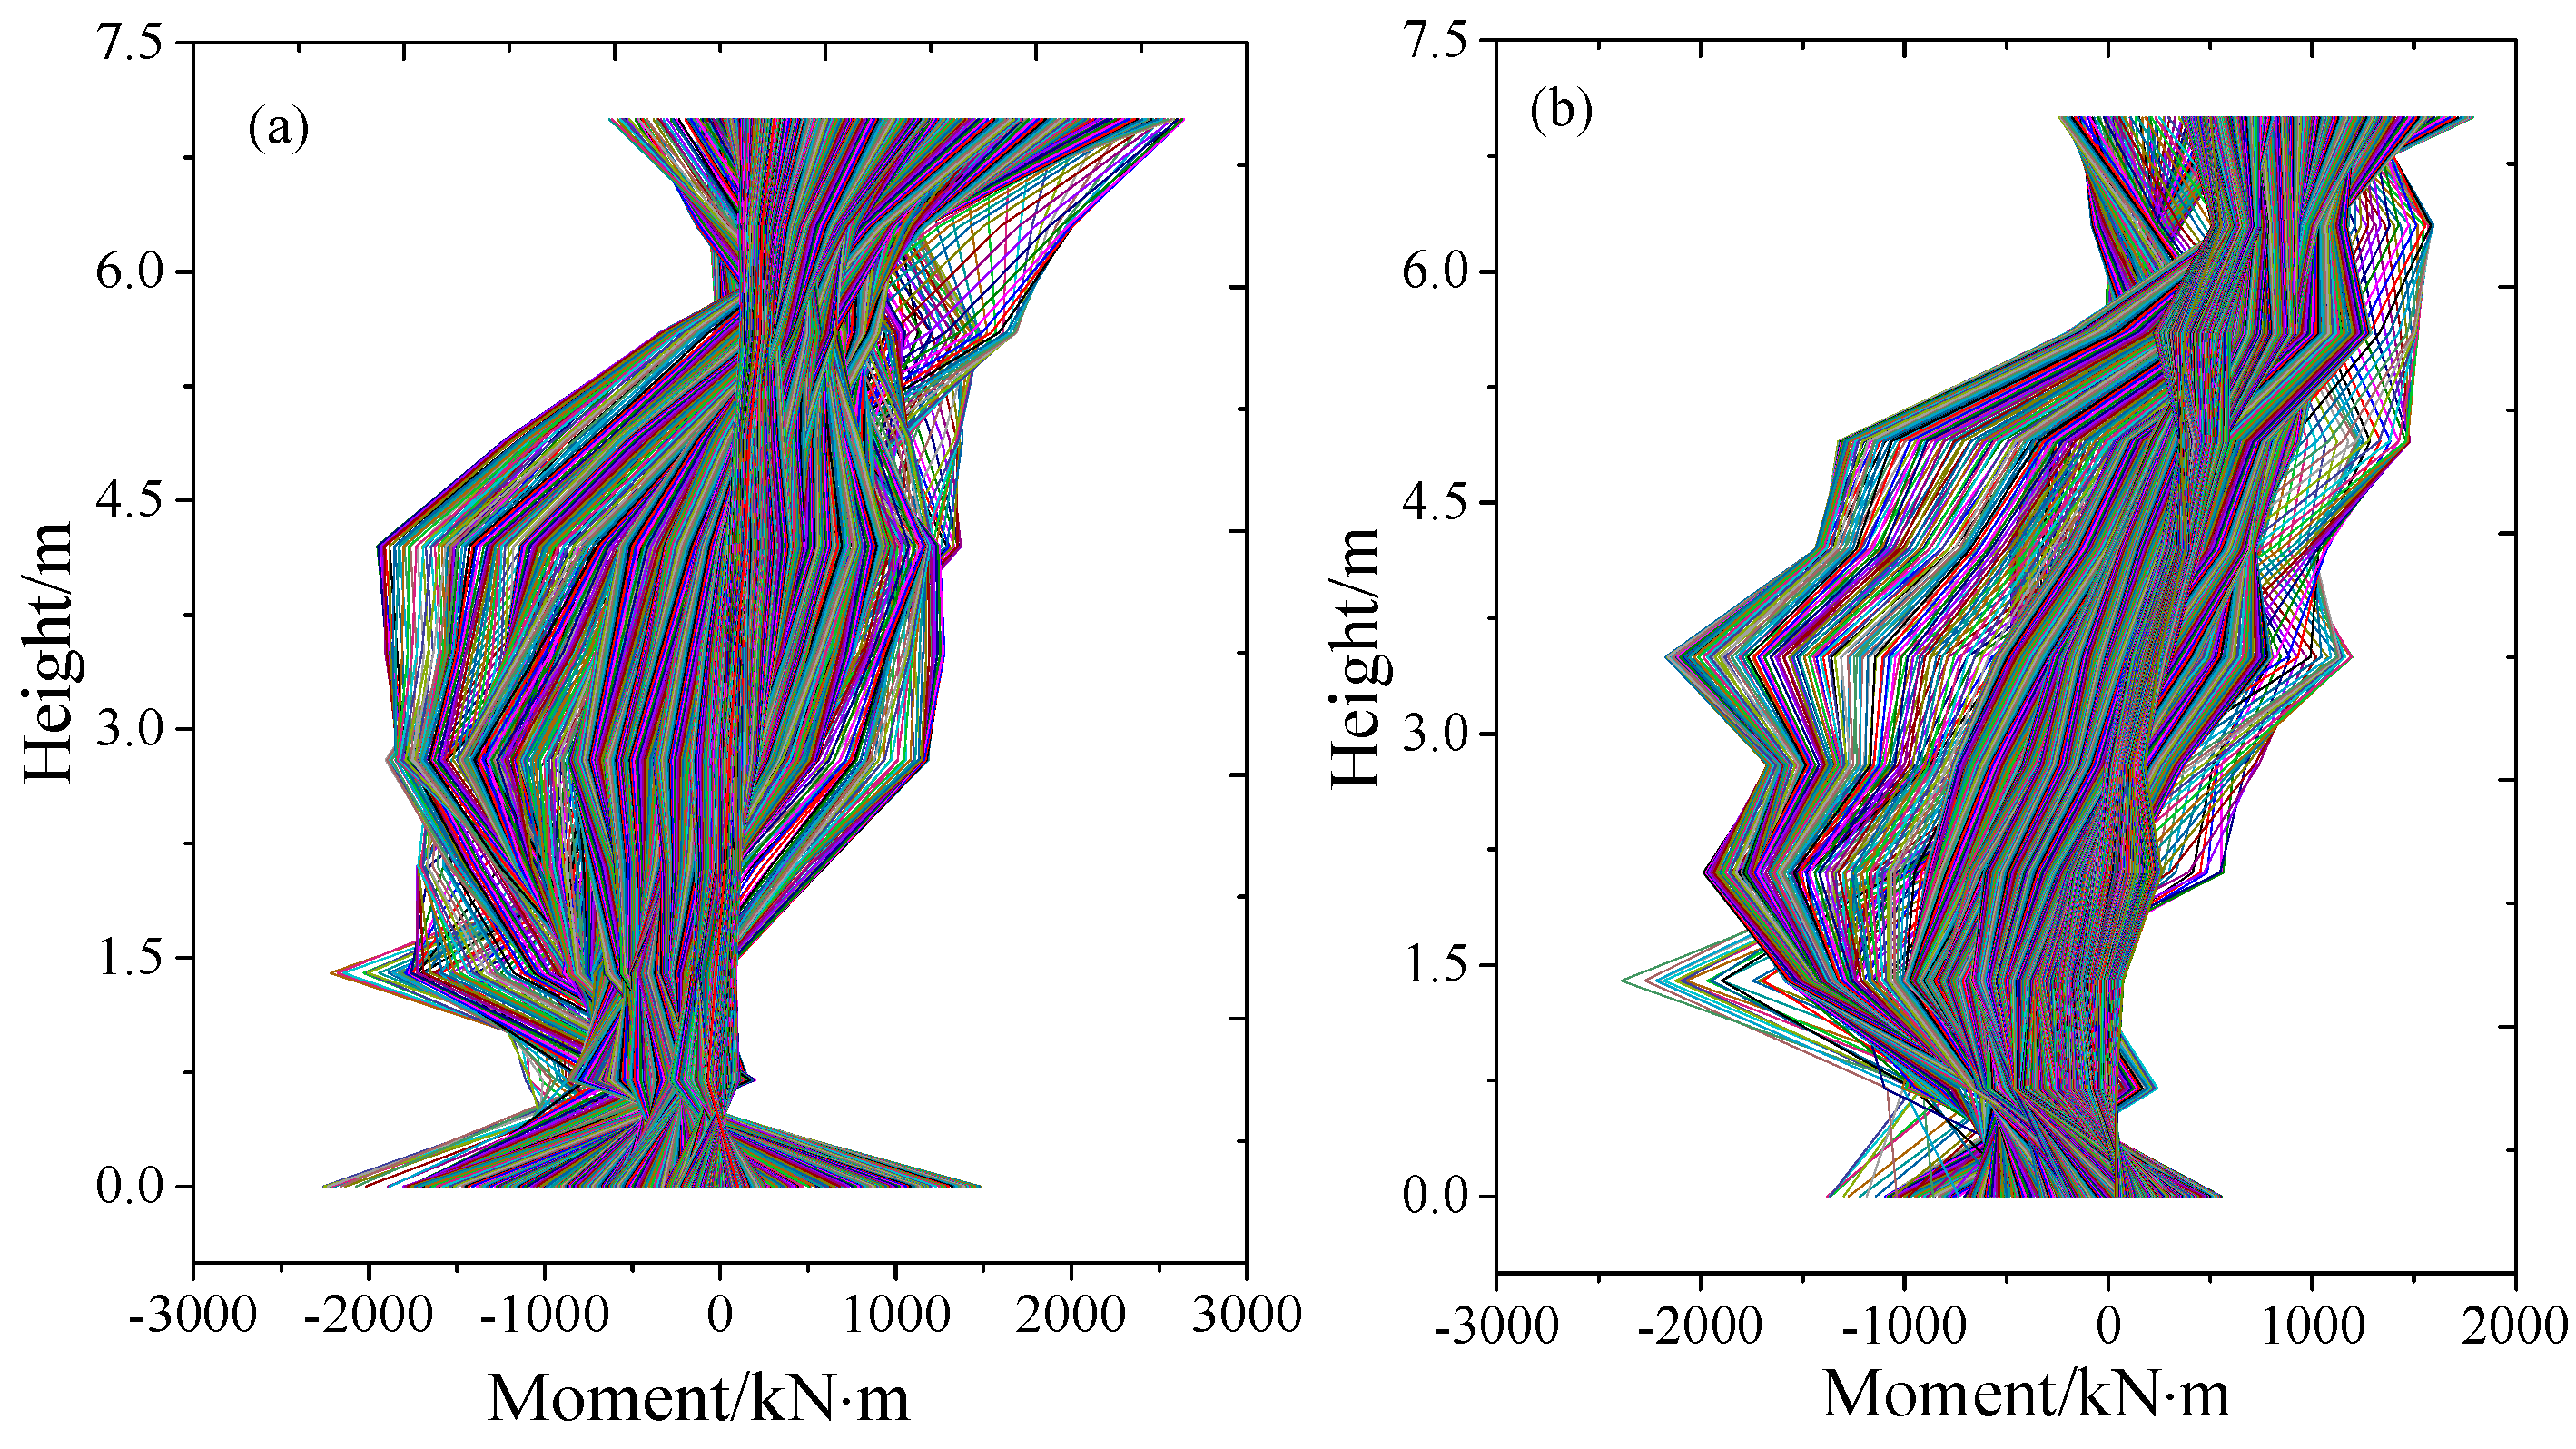
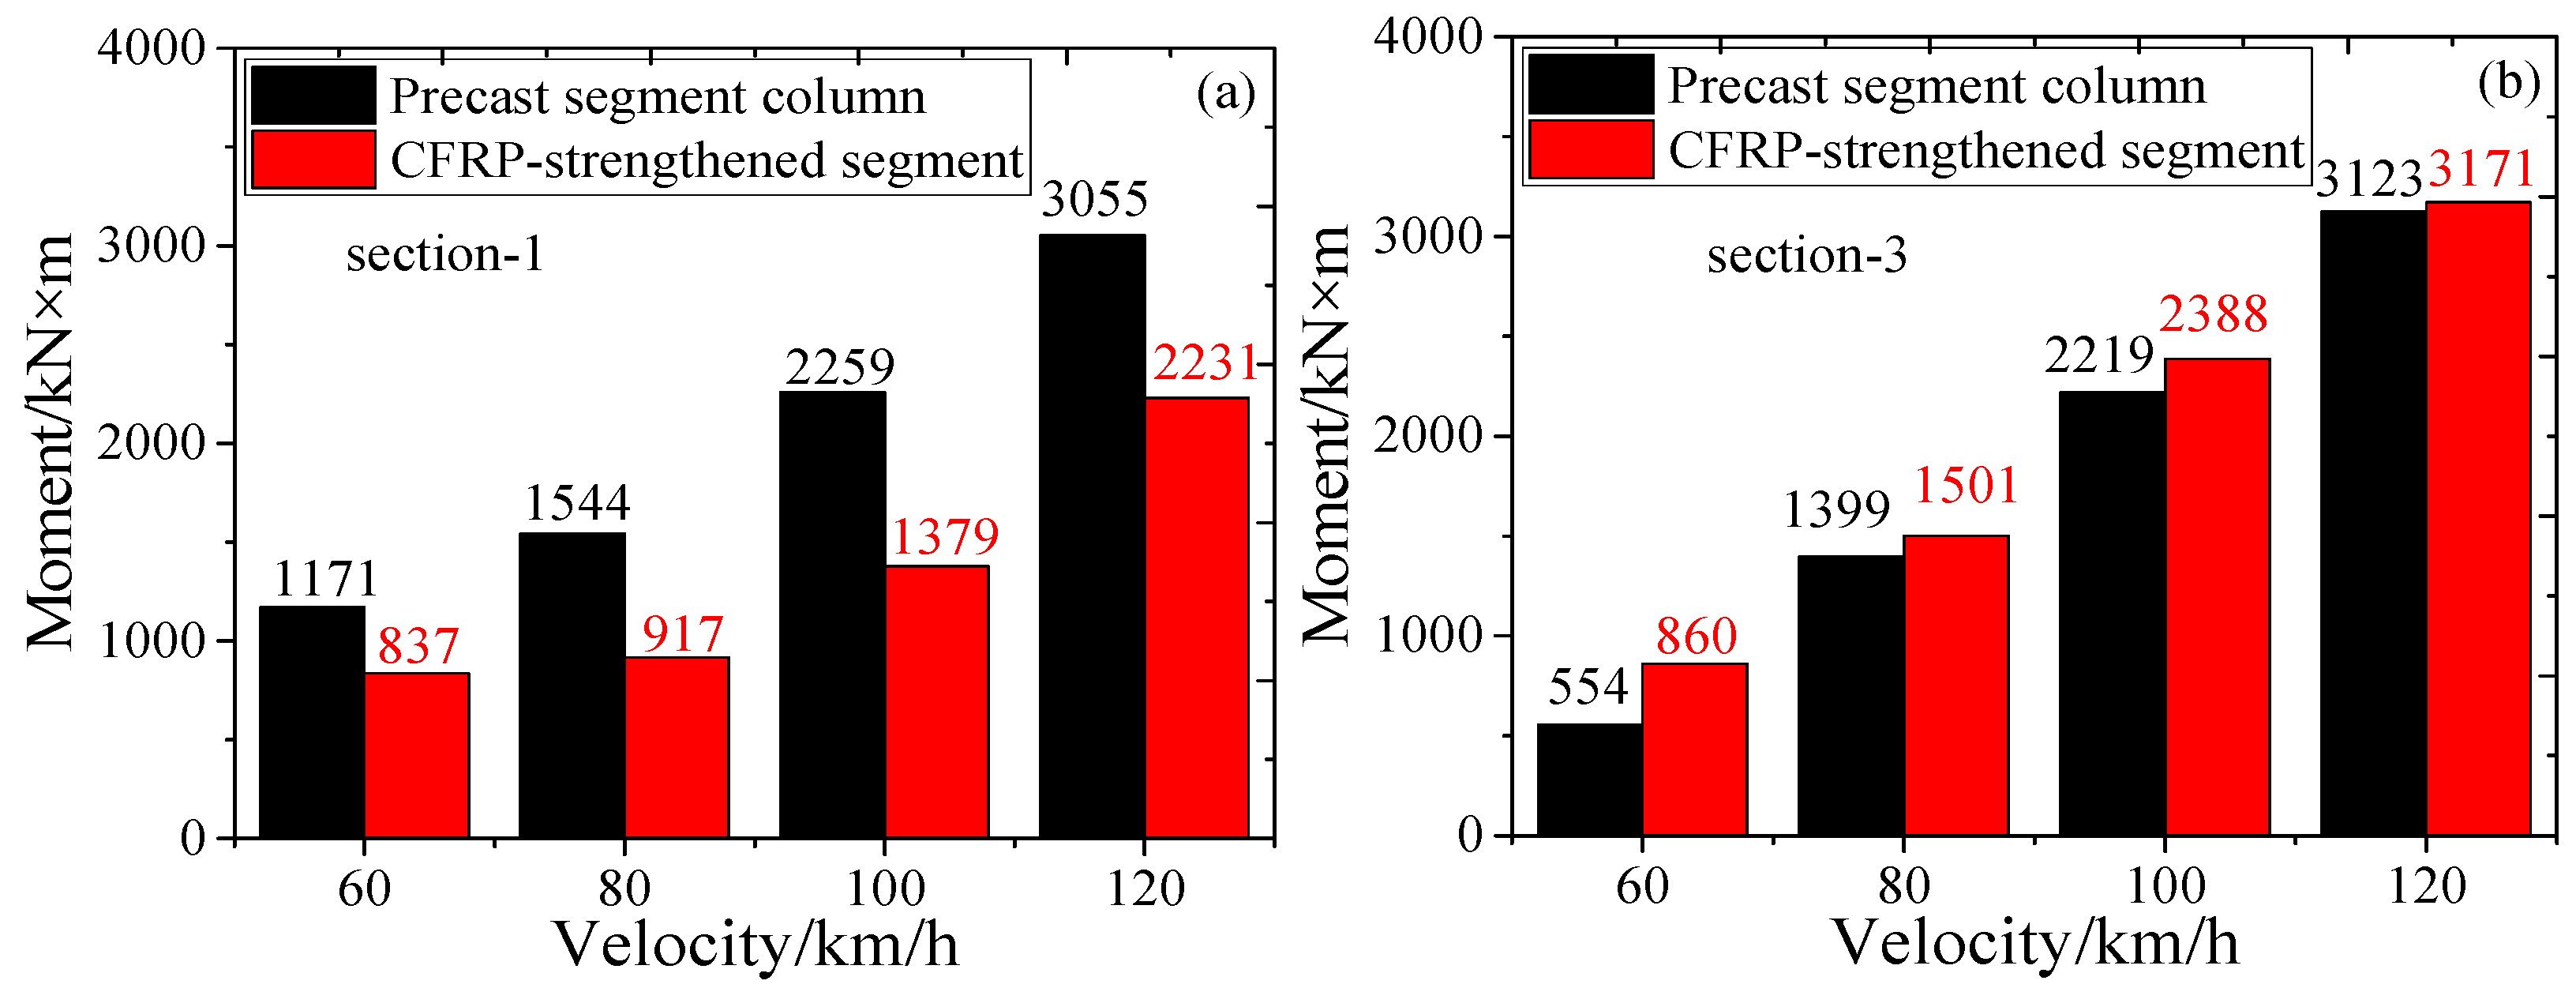
4.3. Bending Moment
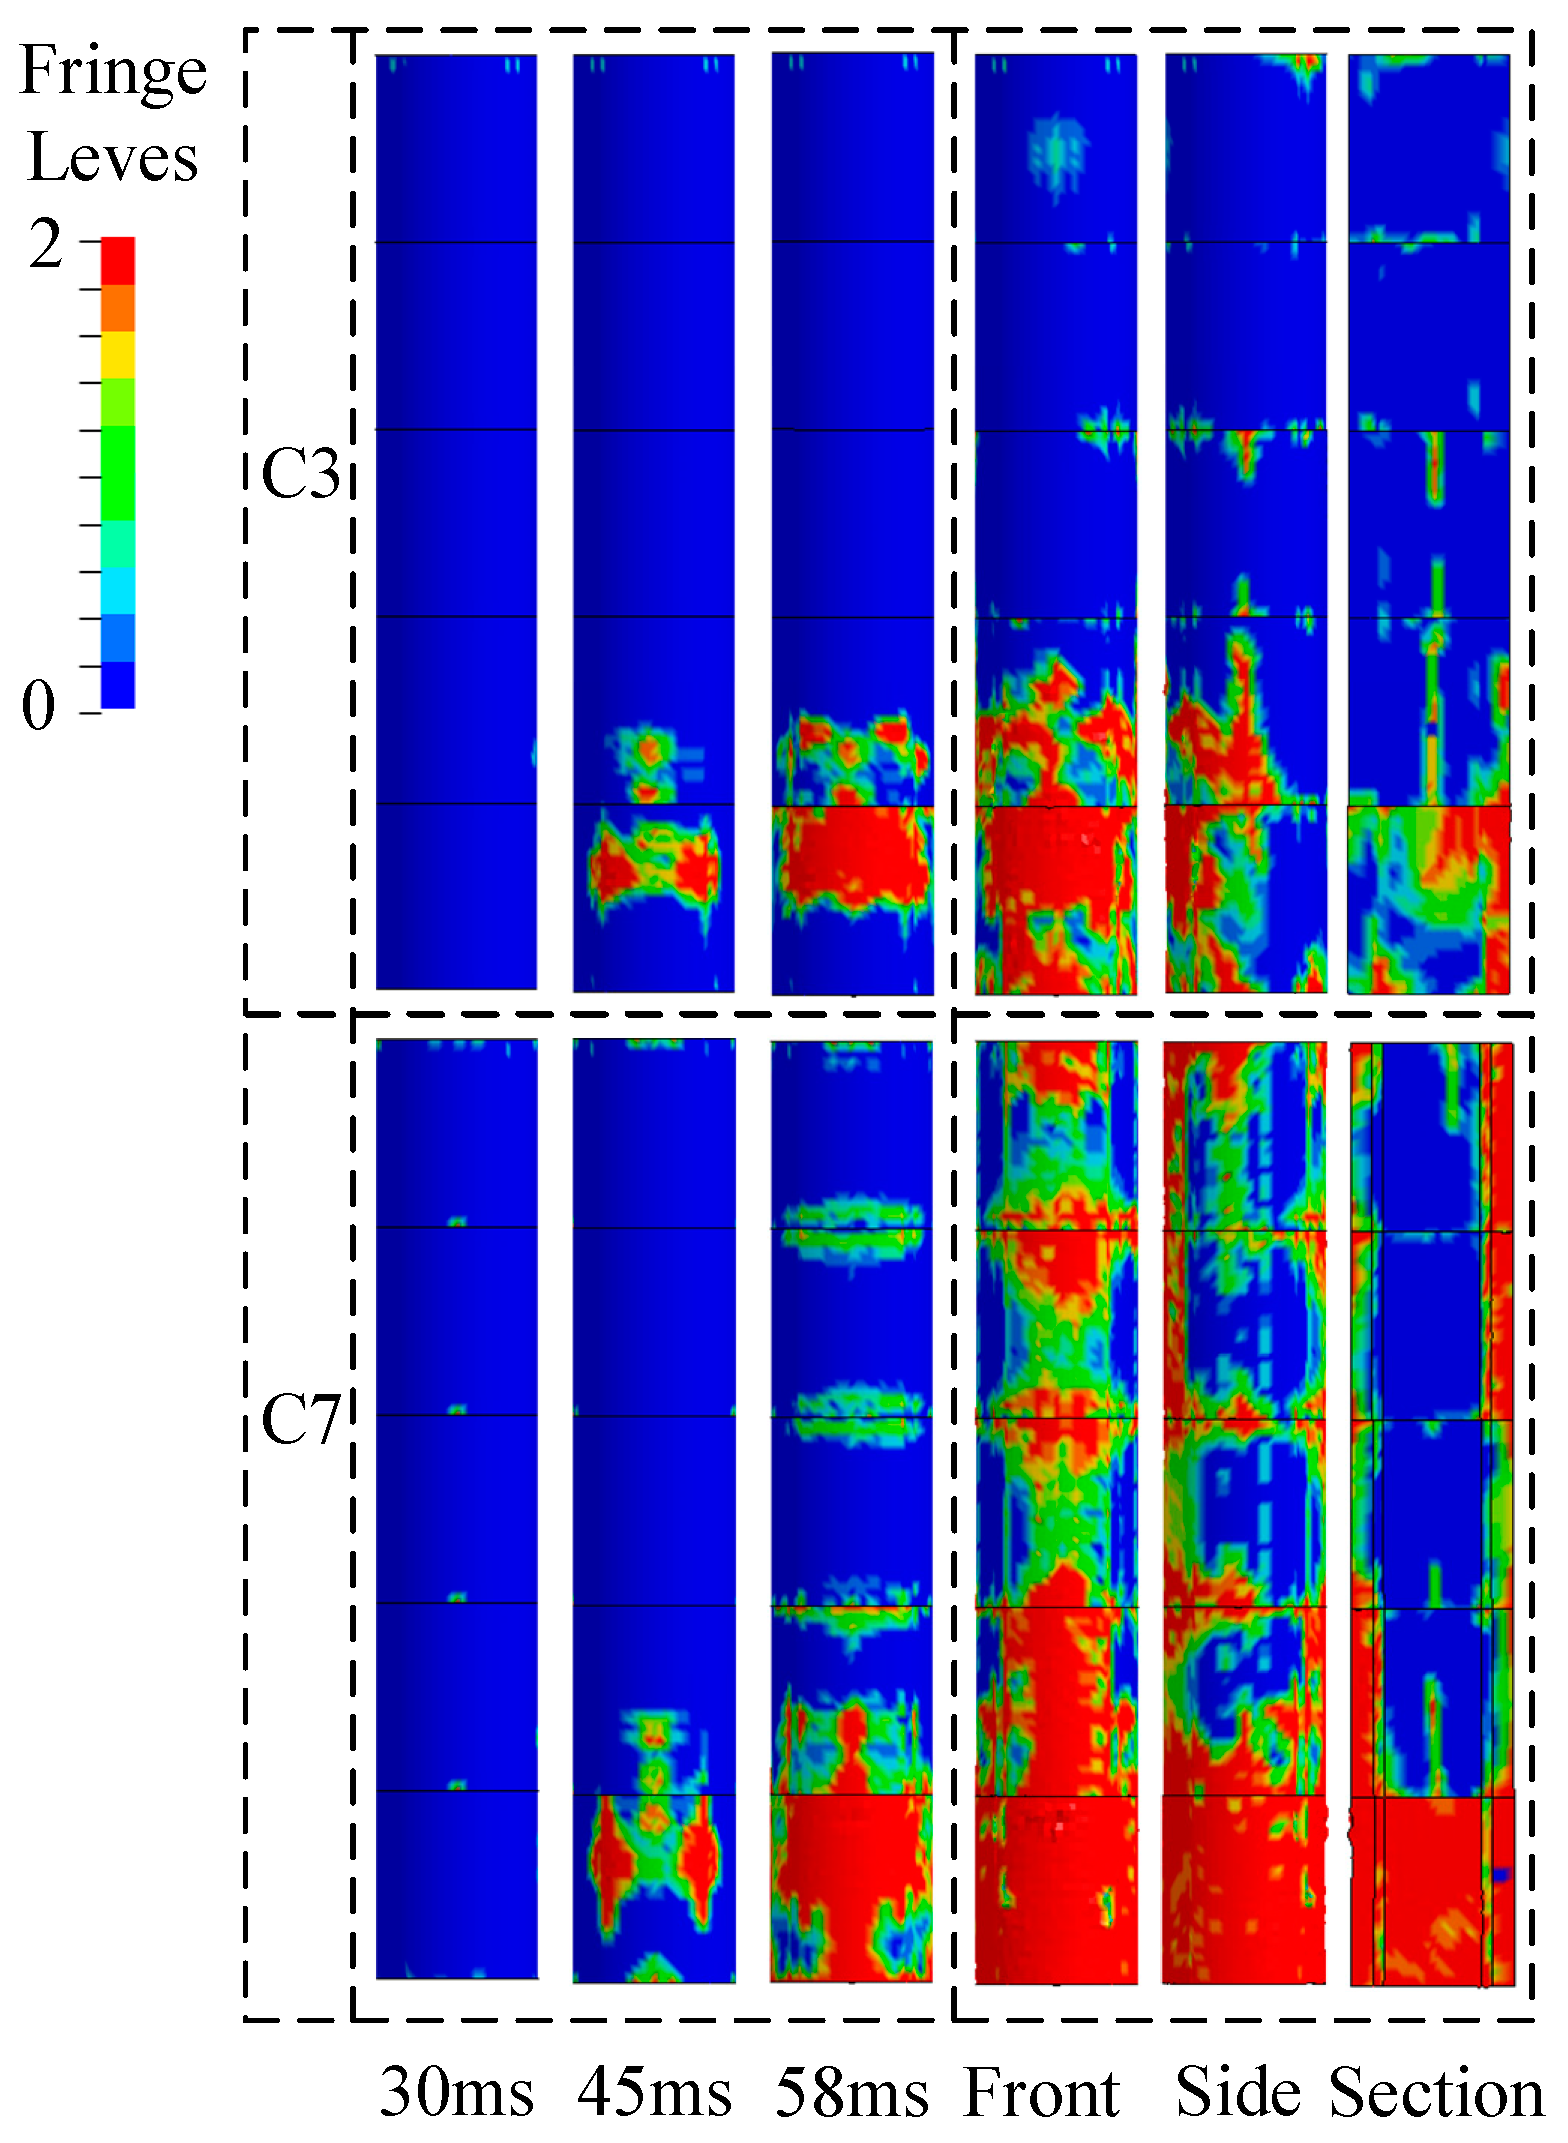
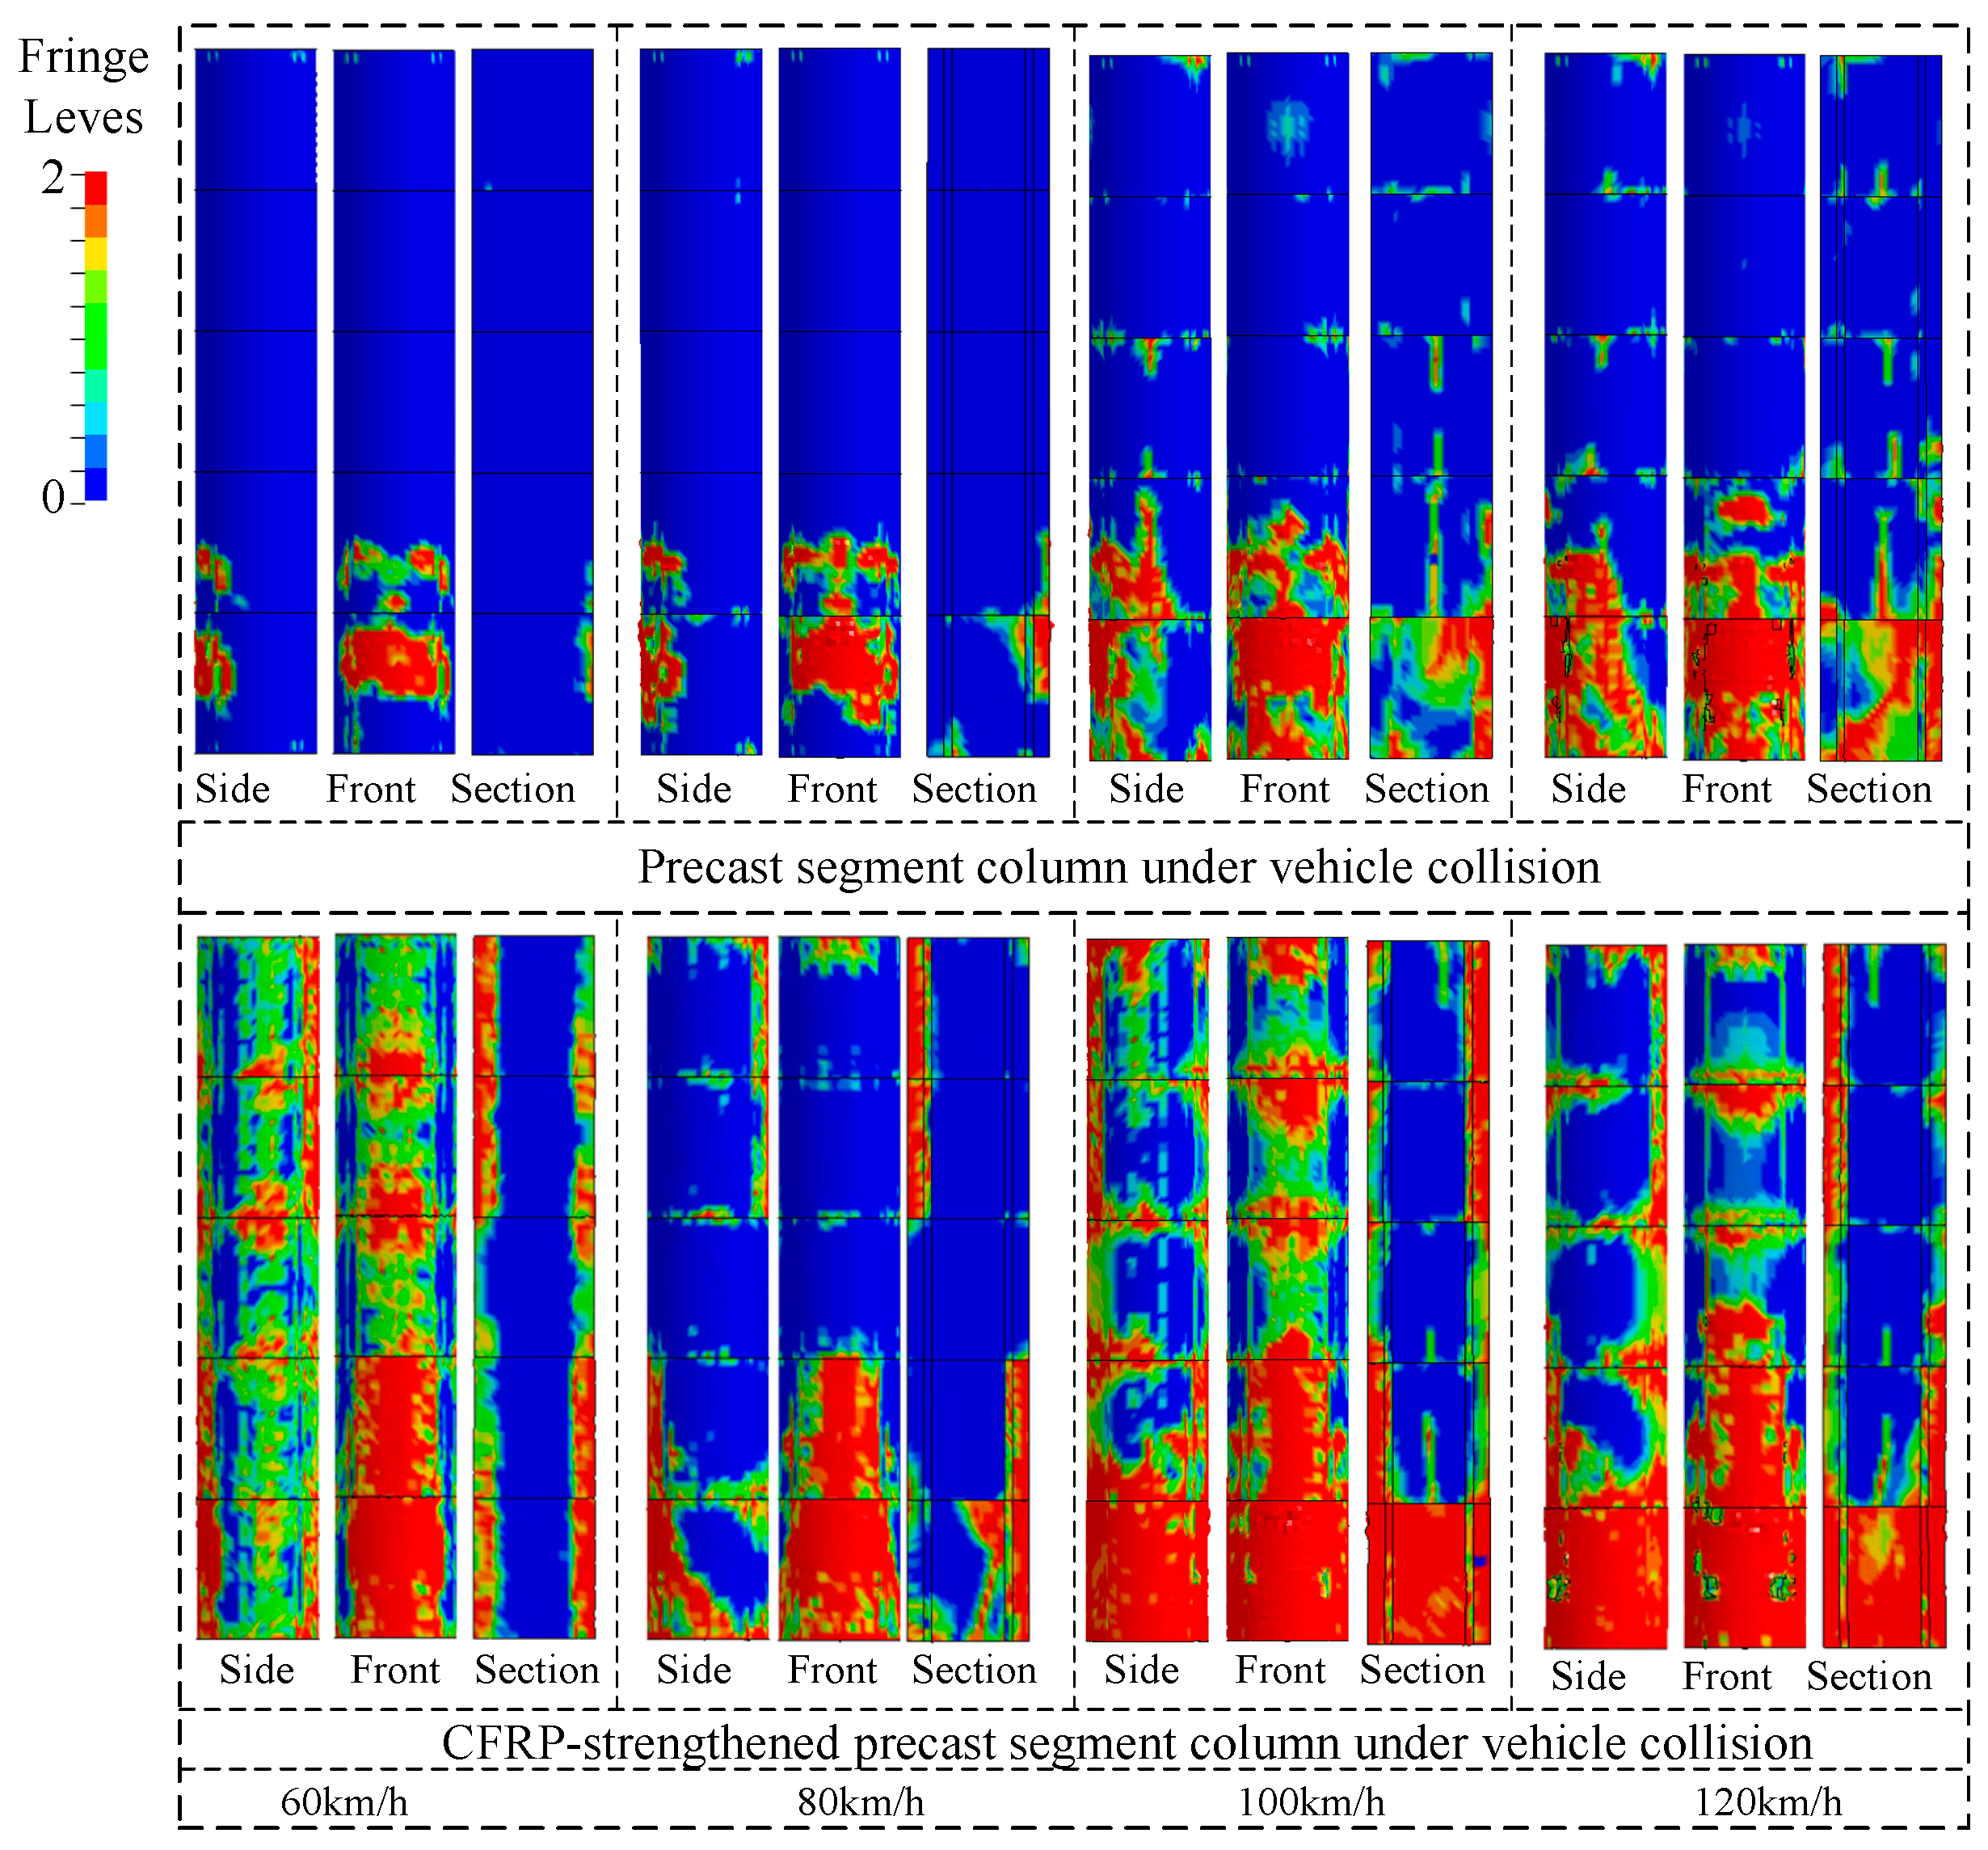
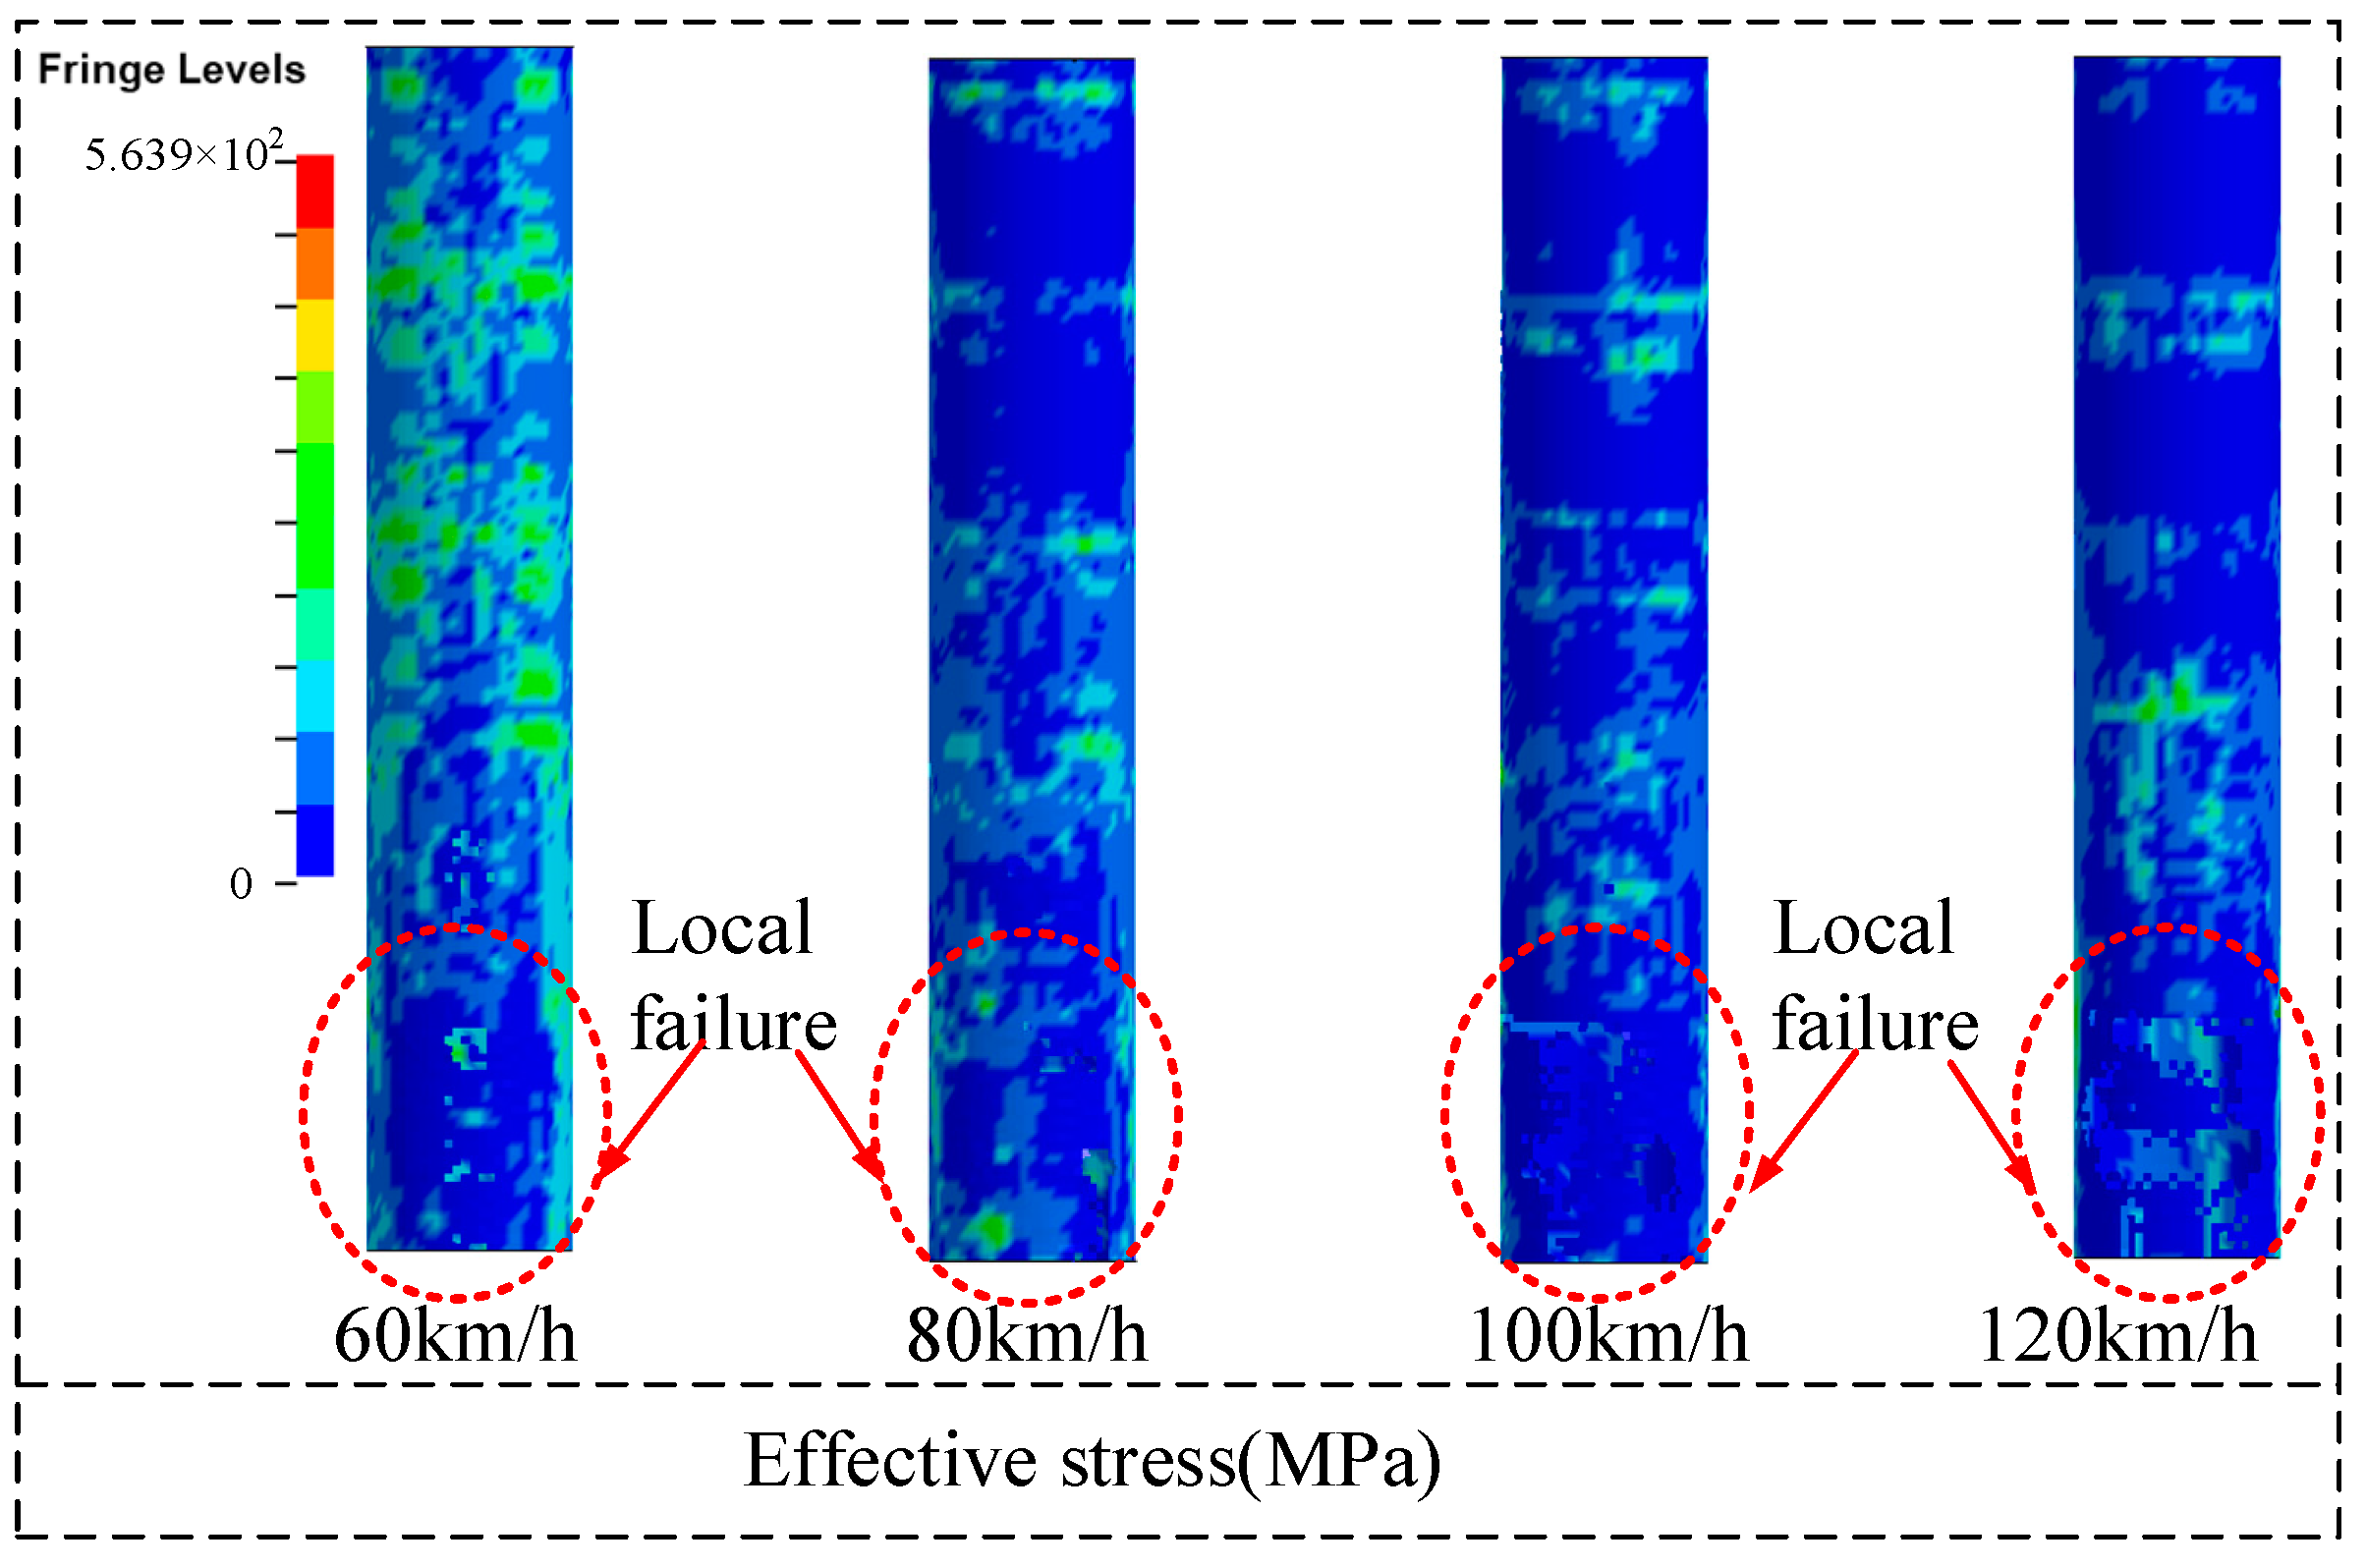
4.4. Failure Modes
5. Results of CFRP-Strengthened Piers under Different Factors
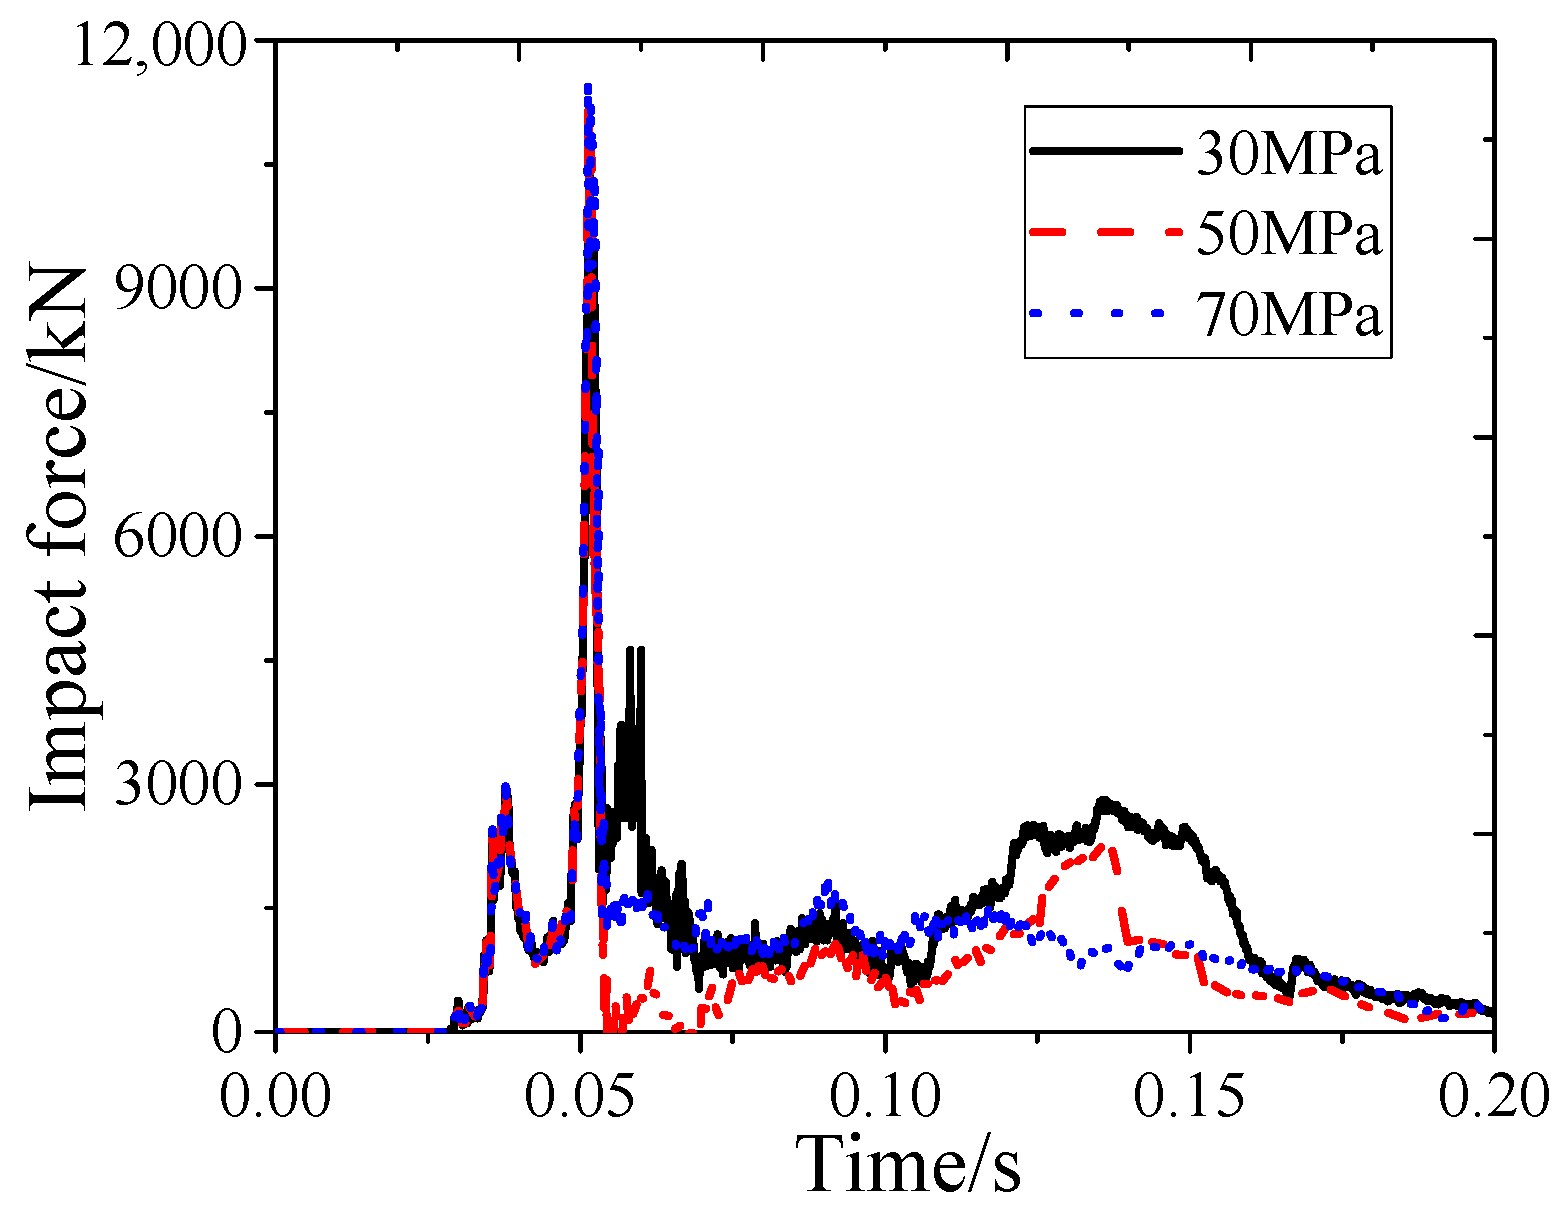
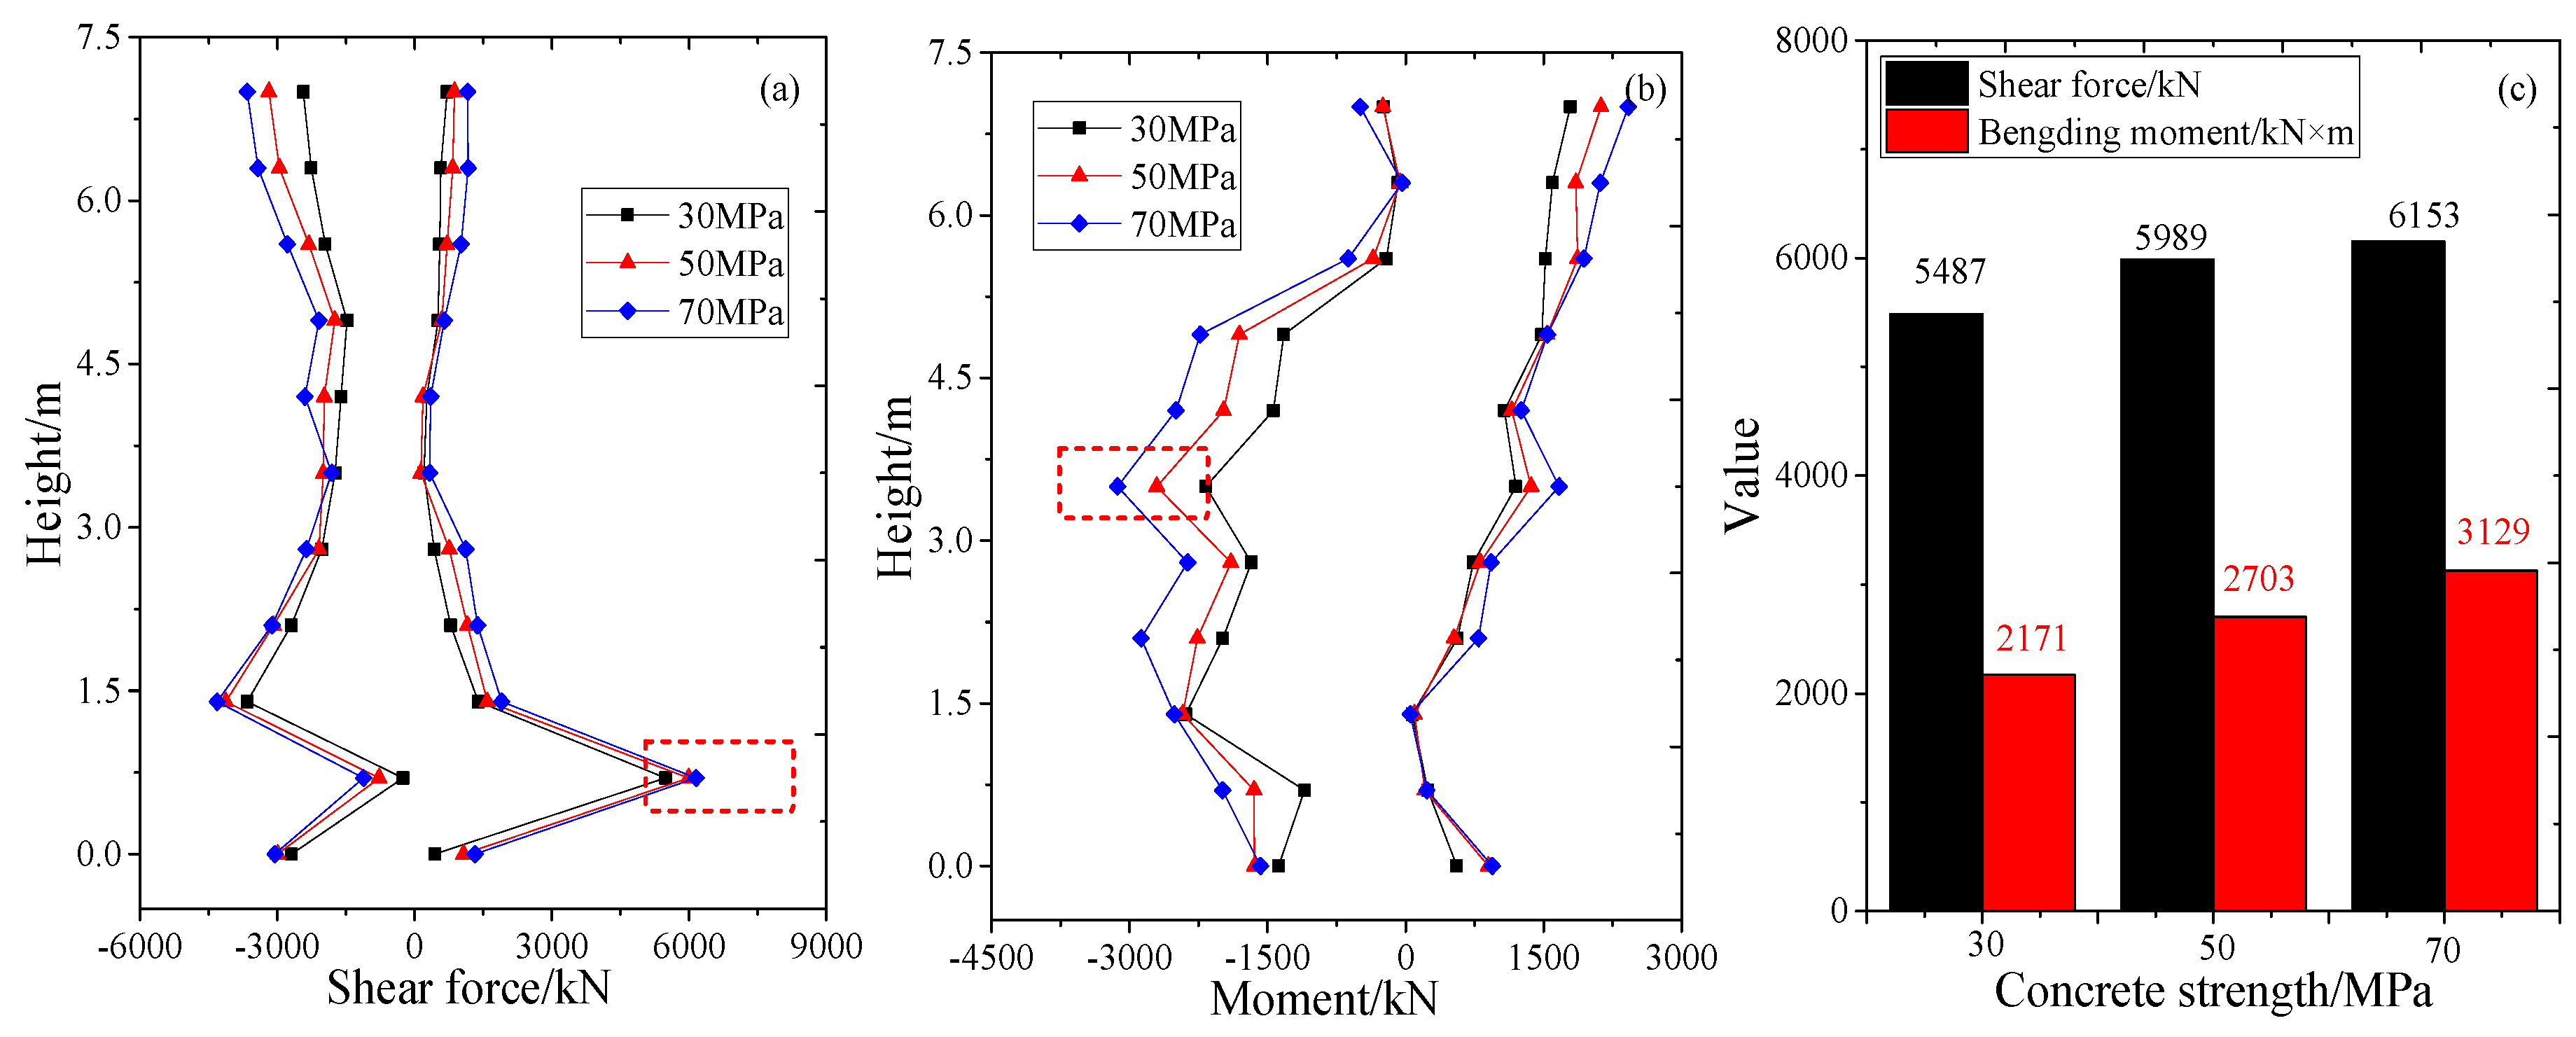
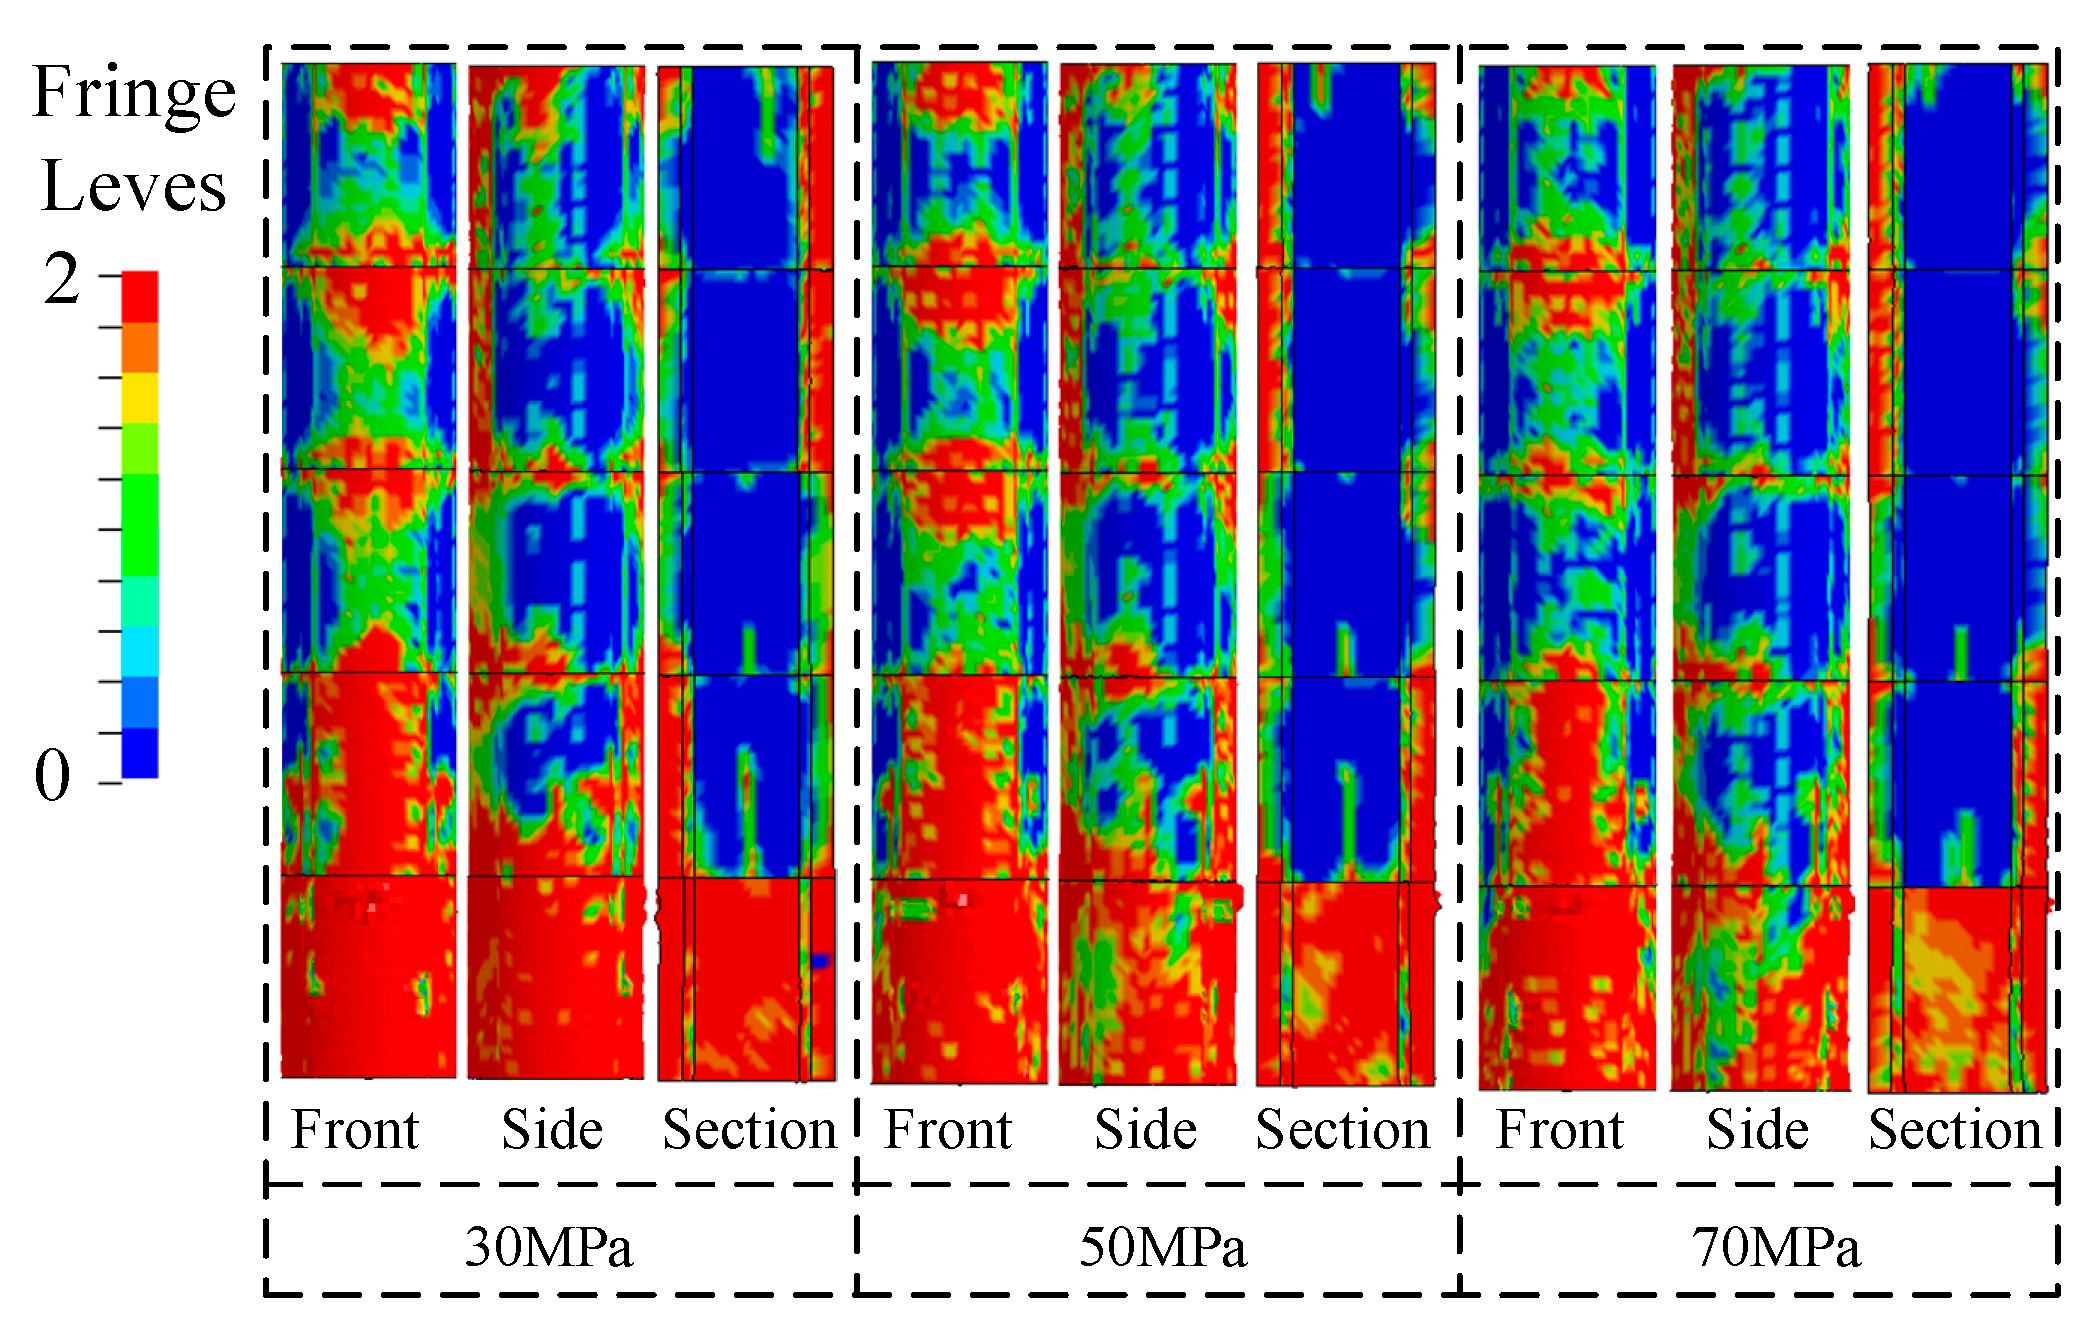
5.1. Influence of Concrete Strength
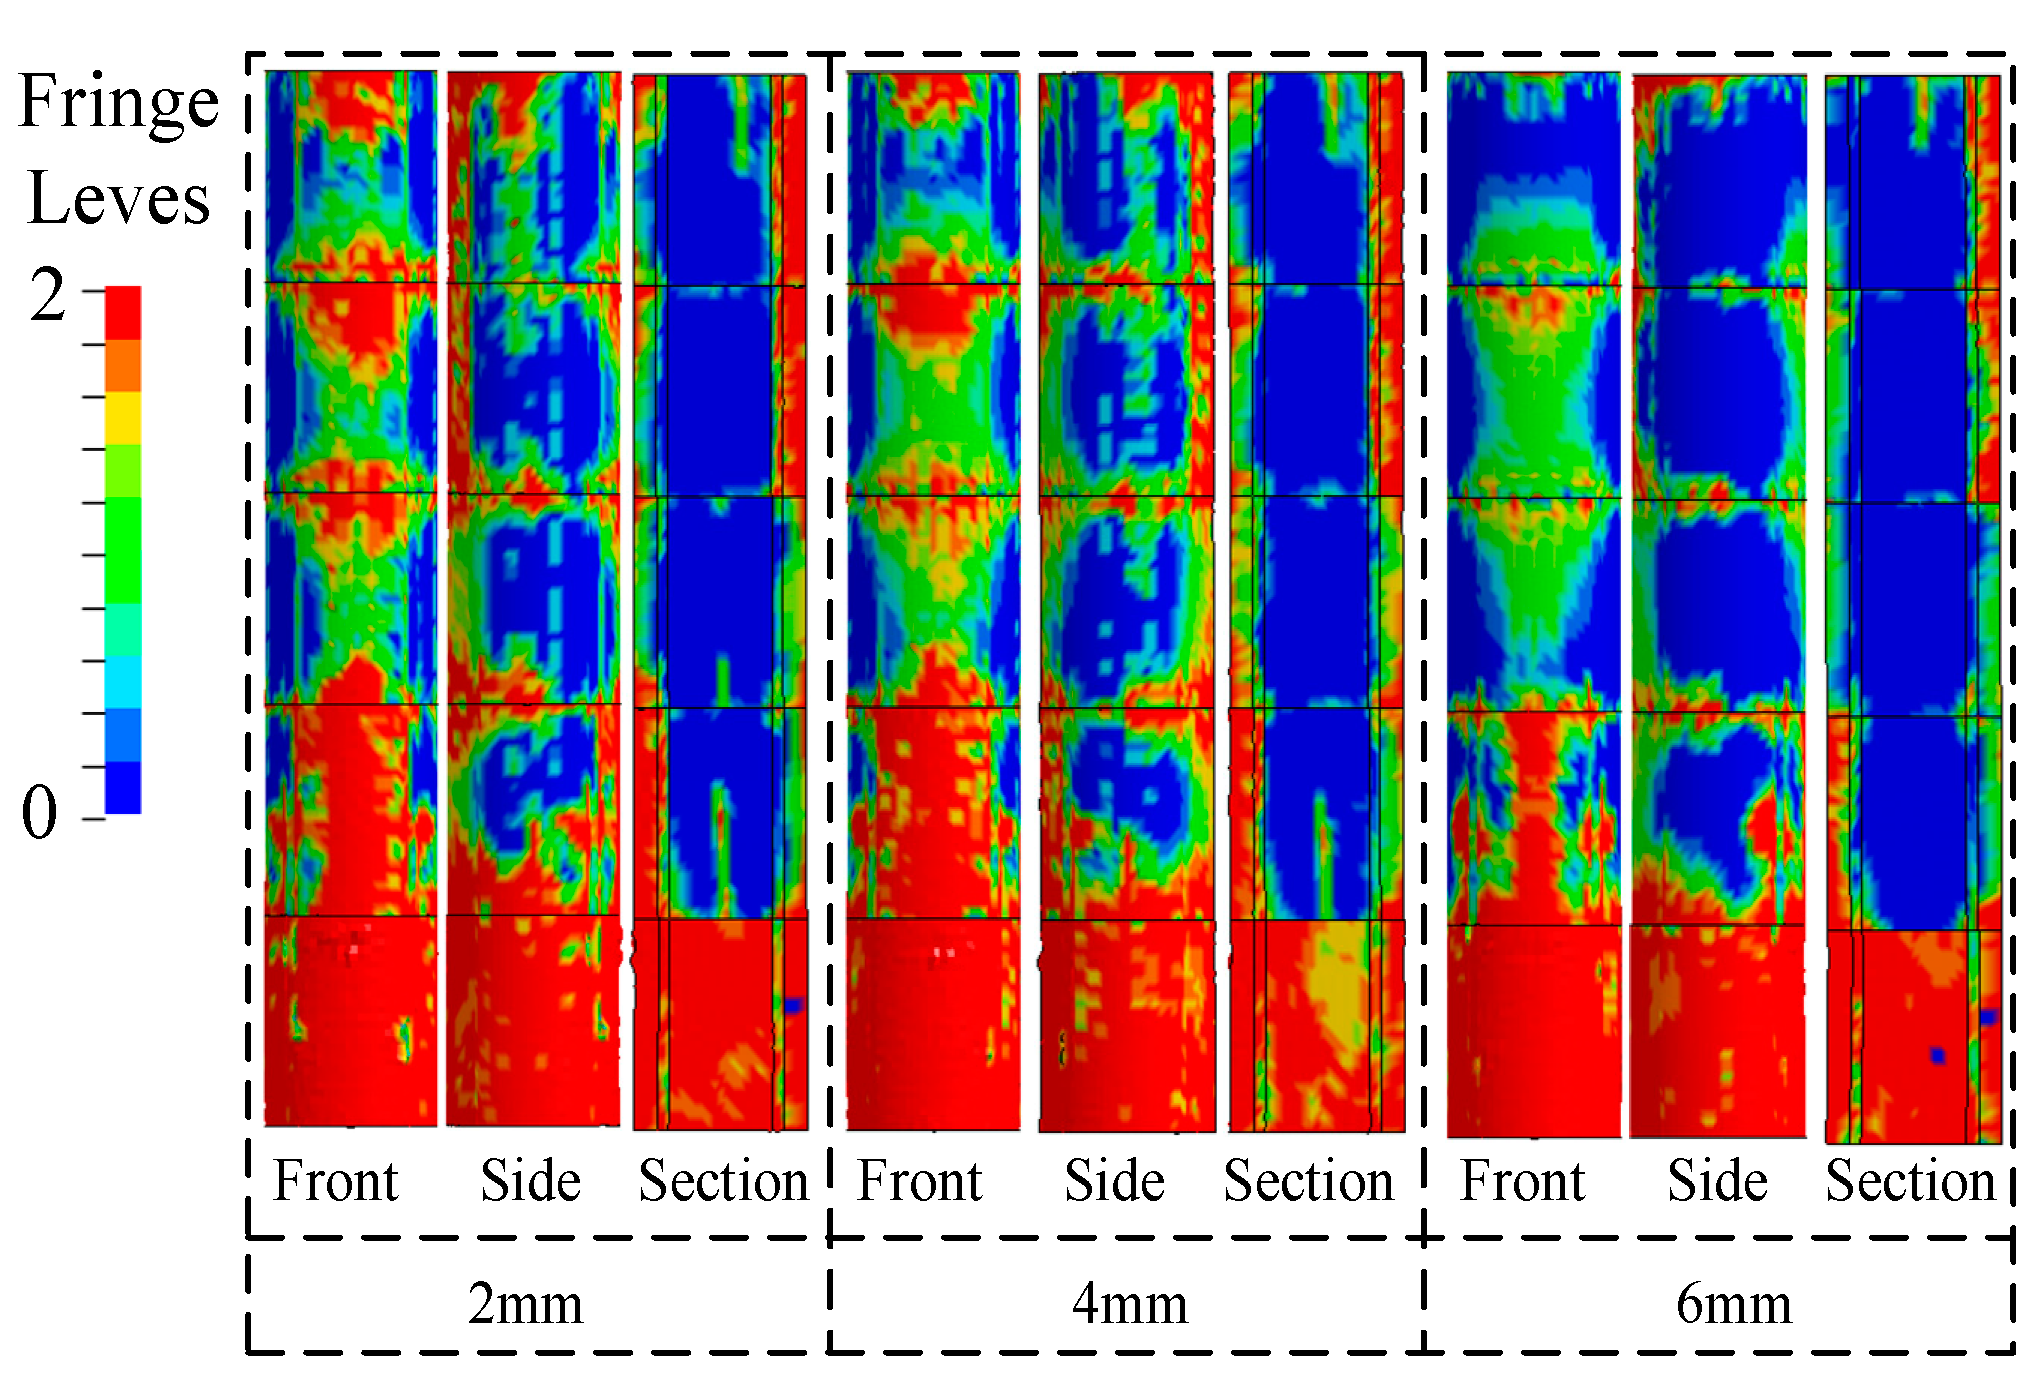
5.2. Influence of CFRP Thickness
6. Conclusions
- (1)
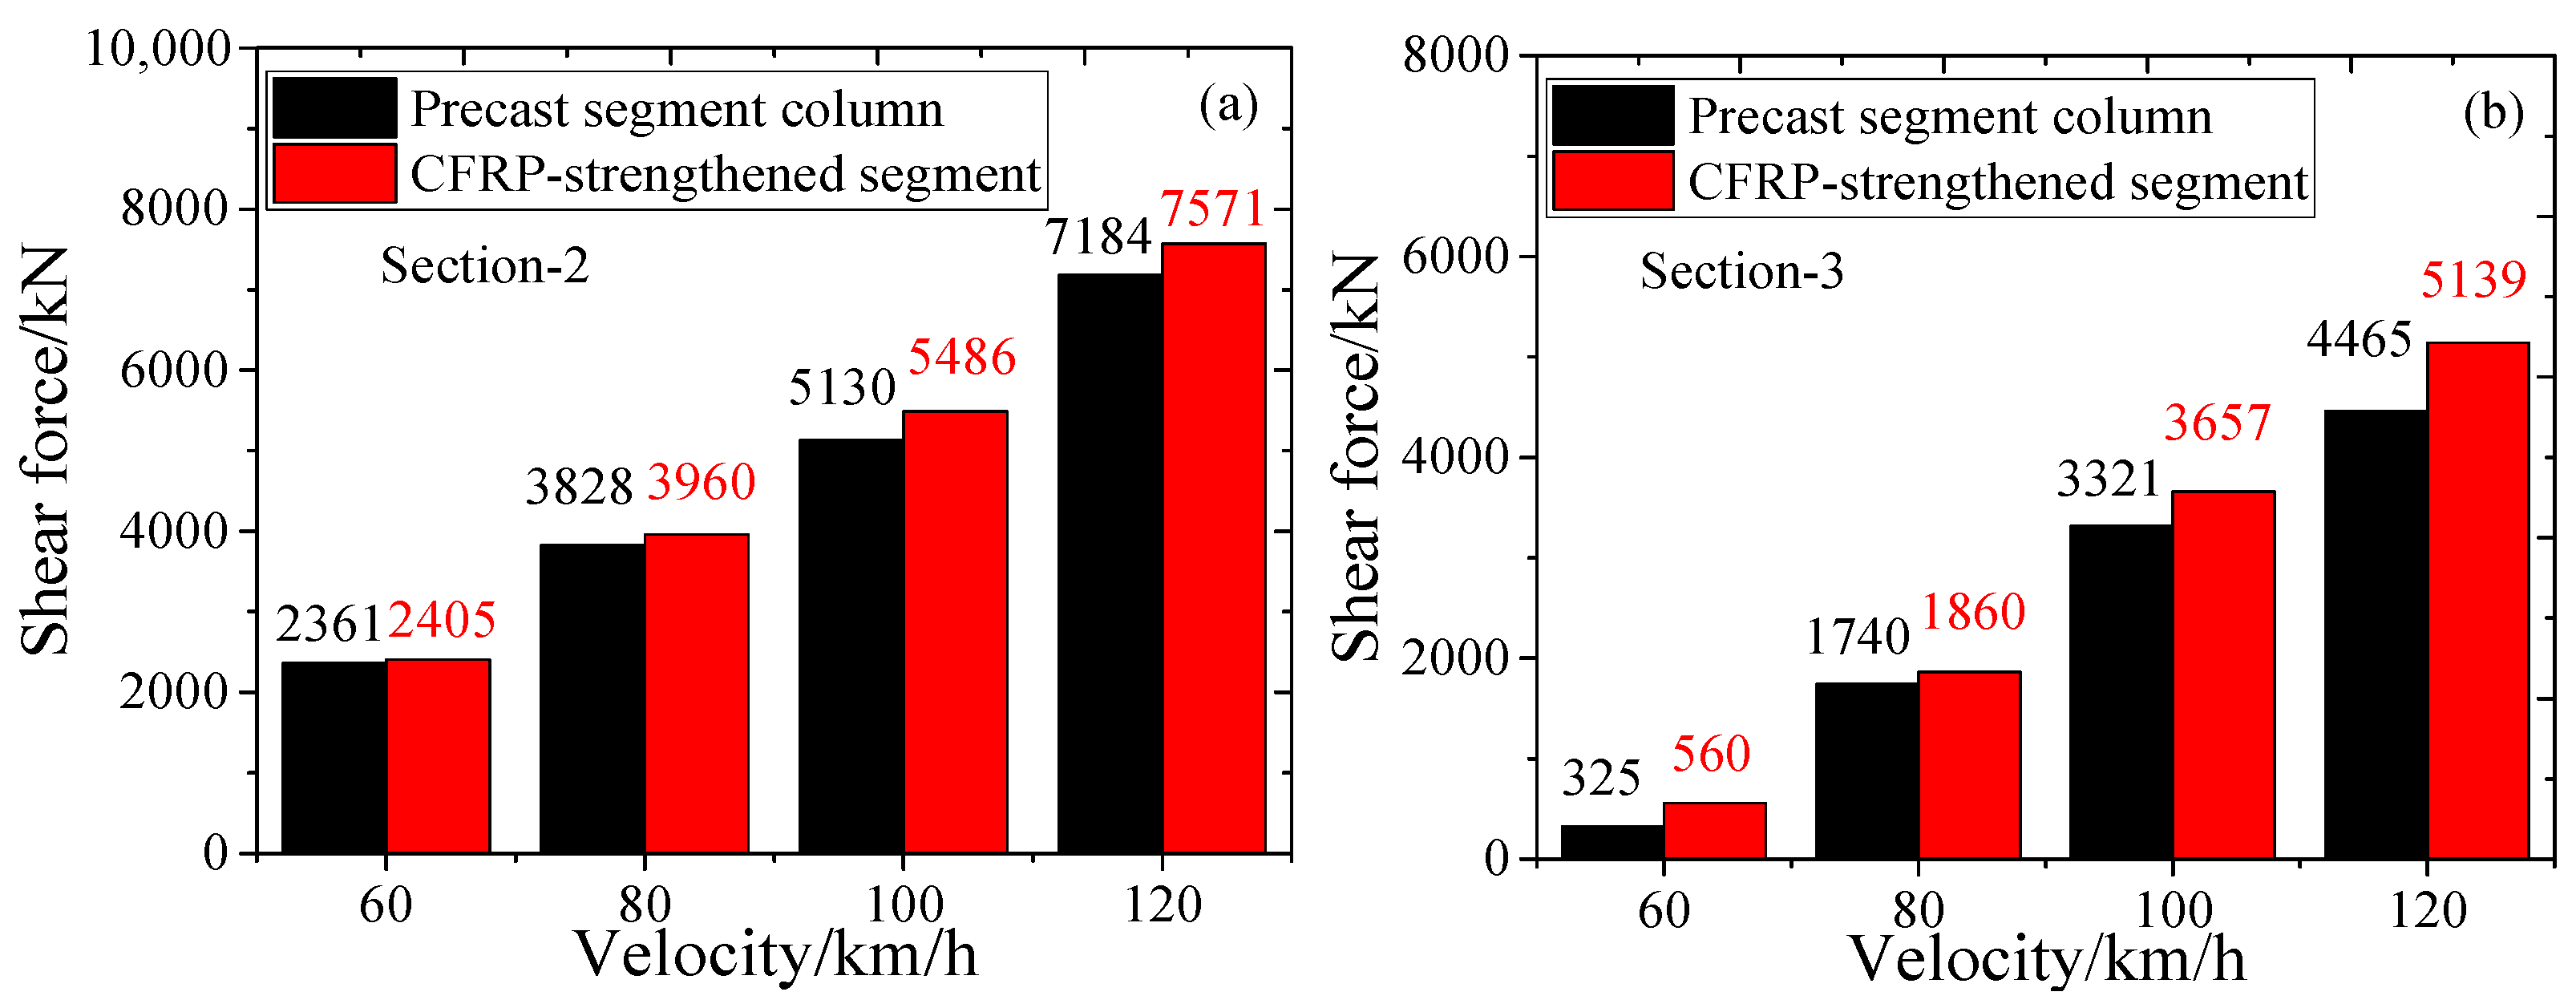
- The use of a PSC with CFRP can result in a notable enhancement of the capacity to resist shear forces and bending moments. At a speed of 100 km/h, the PSC reinforced with CFRP demonstrated an increase in shear force and bending moment values in the impact area, with respective increases of 7.1% and 7.6%.
- (2)
- The predominant failure mode of the PSC with CFRP is the crushing of the bottom segment, whereas the PSC without CFRP exhibits a tendency towards shear failure. Furthermore, the maximum impact force of the PSC with CFRP is greater than that of the PSC without CFRP.
- (3)
- Enhancing the concrete strength of PSC has the effect of improving the bearing performance. In comparison with a maximum shear force and moment of 30 MPa, the PSC with 70 MPa demonstrates increases of 12.1% and 44.1%, respectively.
- (4)
- An increase in the thickness of CFRP has been observed to enhance the dynamic load-bearing capacity of PSC. Compared with the CFRP thickness of 2 mm, the maximum shear force and moment in the impact zone of PSC with a CFRP thickness of 6 mm, respectively, increased by 3.1% and 7.5%.
- (5)
- An increase in the thickness of the CFRP and the strength of the concrete can appropriately enhance the impact resistance of PSC. Furthermore, the degree of damage to the concrete will also be reduced.
Author Contributions
Funding
Data Availability Statement
Acknowledgments
Conflicts of Interest
References
- Hung, H.H.; Sung, Y.C.; Lin, K.C.; Jiang, C.R.; Chang, C.K. Experimental study and numerical simulation of precast segmental bridge columns with semi-rigid connections. Eng. Struct. 2017, 136, 12–25. [Google Scholar]
- Kim, D.H.; Moon, D.Y.; Kim, M.K.; Zi, G.; Roh, H. Experimental test and seismic performance of partital precast concrete segmental bridge column with cast-in-place base. Eng. Struct. 2015, 100, 178–188. [Google Scholar]
- Wang, J.C.; Ou, Y.C.; Chang, K.C.; Lee, G.C. Large-scale tests of tall concrete bridge columns with precast segmental construction. Earthq. Eng. Struct. Dynam. 2008, 37, 1449–1465. [Google Scholar] [CrossRef]
- Chung, C.H.; Lee, J.W.; Gil, J.H. Structural performance evaluation of a precast prefabricated bridge column under vehicle impact loading. Struct. Infrastruct. Eng. 2014, 10, 777–791. [Google Scholar] [CrossRef]
- Zhang, X.; Hao, H.; Li, C. Experimental investigation of the response of precast segmental columns subjected to impact loading. Int. J. Impact Eng. 2016, 95, 105–124. [Google Scholar]
- Zhang, X.; Hao, H.; Li, C. The effect of concrete shear key on the performance of segmental columns subjected to impact loading. Adv. Struct. Eng. 2016, 20, 352–373. [Google Scholar] [CrossRef]
- EI-Tawil, S.; Severino, E.; Fonseca, P. Vehicle collision with bridge piers. J. Bridge Eng. 2005, 10, 345–353. [Google Scholar]
- Tsang, H.H.; Lam, N.T.K. Collapse of reinforced concrete column by vehicle impact. Comput.-Aided Civ. Inf. 2008, 23, 427–436. [Google Scholar] [CrossRef]
- Zhang, X.; Hao, H.; Li, C.; Do, T.V. Experimental study on the behavior of precast segmental column with domed shear key and unbonded Post-Tensioning tendon under impact loading. Eng. Struct. 2018, 173, 589–605. [Google Scholar] [CrossRef]
- Do, T.V.; Pham, T.M.; Hao, H. Numerical investigation of the behavior of precast concerte segmental columns subjected to vehicle collision. Eng. Struct. 2018, 156, 375–393. [Google Scholar]
- Sharma, H.; Hurlebaus, S.; Gardoni, P. Performance-based response evaluation of reinforced concrete columns subjected to vehicle impact. Int. J. Impact Eng. 2012, 43, 52–62. [Google Scholar] [CrossRef]
- Thilakarathna, H.M.I.; Thambiratnam, D.P.; Dhanasekar, M.; Perera, N. Numerical simulation of axially loaded concrete columns under transverse impact and velnerability assessment. Int. J. Impact Eng. 2010, 37, 1100–1112. [Google Scholar]
- Abdelkarim, O.I.; ElGawady, M.A. Performance of bridge piers under vehicle collision. Eng. Struct. 2017, 140, 337–352. [Google Scholar]
- Wu, M.; Jin, L.; Du, X.L. Dynamic responses and reliability analysis of bridge double-column under vehicle collision. Eng. Struct. 2020, 221, 111035. [Google Scholar] [CrossRef]
- Do, T.V.; Pham, T.M.; Hao, H. Dynamic responses and failure modes of bridge columns under vehicle collision. Eng. Struct. 2018, 156, 243–259. [Google Scholar]
- Fan, W.; Xu, X.; Zhang, Z.Y.; Shao, X.D. Performance and sensitivity analysis of UHPCFRC-strengthened bridge columns subjected to vehicle collision. Eng. Struct. 2018, 173, 251–268. [Google Scholar]
- AASHTO. LRFD Bridge Design Specifications; American Association of State Highway and Transportation Officials: Washington, DC, USA, 2007. [Google Scholar]
- JTG D60-2015; General Code for Design of Highway Bridges and Culverts. The People’s Communication Publishing Company: Beijing, China, 2015.
- Chopra, A.K. Dynamic of Structures: Theory and Applications to Earthquake Engineering, 2nd ed.; Prentice-Hall: Englewood Cliffs, NJ, USA, 2001. [Google Scholar]
- Ferrer, B.; Ivorra, S.; Segovia, E.; Irles, R. Tridimensiona modelization of the impact of a vehile against a metallic parking column at a low speed. Eng. Struct. 2010, 32, 1986–1992. [Google Scholar] [CrossRef]
- Do, T.V.; Pham, T.M.; Hao, H. Effects of confinement and shear keys on the impact response of precast concrete segmental columns. J. Constr. Steel Res. 2019, 158, 331–349. [Google Scholar]
- Ozbakkaloglu, T.; Idris, Y. Seismic behavior of FRP-high-strength concrete-steel double-skin tubular columns. J. Struct. Eng. 2014, 140. [Google Scholar] [CrossRef]
- Youssf, O.; ElGawady, M.A.; Mills, J.E.; Ma, X. An experimental investigation of crumb rubber concrete confined by fibre reinforced polymer tubes. Constr. Build. Mater. 2014, 53, 522–532. [Google Scholar]
- ElGawady, M.A.; Dawood, H.M. Analysis of segmental piers consisted of concrete filled FRP tubes. Eng. Struct. 2012, 38, 142–152. [Google Scholar]
- Zhang, X.; Hao, H. Improved impact resistant capacity of segmental column with fibre reinforced polymer wrap. Int. J. Impact Eng. 2019, 125, 117–133. [Google Scholar] [CrossRef]
- Abdelkarim, O.I.; ElGawady, M.A. Performance of hollow-core FRP-concrete-steel bridge columns subjected to vehicle collision. Eng. Struct. 2016, 123, 517–531. [Google Scholar] [CrossRef]
- Wu, M.; Liu, J.; Du, X. Dynamic response analysis of bridge precast segment piers under vehicle collision. Eng. Fail. Anal. 2021, 124, 105363. [Google Scholar] [CrossRef]
- Wu, M.; Zeng, Y.; Jin, L.; Du, X. Numerical study of precast segment columns with shear keys under vehicle collision. Struct. Infrastruct. Eng. 2023, 1–14. [Google Scholar] [CrossRef]
- LS-DYNA. LS-DYNA Keyword User’s Manual; Livermore Software Technology Cprporation: Canonsburg, PA, USA, 2013; Volume R7.0, pp. 1–2658. [Google Scholar]
- Kadhim, M.M.A.; Wu, Z.J.; Cunningham, L.S. Experimental study of CFRP strengthened steel columns subject to lateral impact loads. Compos. Struct. 2018, 185, 94–104. [Google Scholar] [CrossRef]
- Youssf, O.; ElGawady, M.A.; Mills, J.E. Displacement and plastic hinge length of FRP-confined circular reinforced concrete columns. Eng. Struct. 2015, 101, 465–476. [Google Scholar]
- Youssf, O.; ElGawady, M.A.; Mills, J.E.; Ma, X. Finite element modelling and dilation of FRP- confined concrete column. Eng. Struct. 2014, 79, 70–85. [Google Scholar]
- Elsanadedy, H.M.; AI-Salloum, Y.A.; Alsayed, S.H.; Iqbal, R.A. Experimental and numerical investigation of size of effects in FRP-wrapped concrete columns. Constr. Build. Mater. 2012, 29, 56–72. [Google Scholar] [CrossRef]
- Mohammed, T.A. Reinforced Concrete Structural Members under Impact Loading; The University of Toledo: Toledo, OH, USA, 2012. [Google Scholar]
- Pham, T.M.; Hao, H. Behavior of Fiber-Reinforced Polymer-Strengthend reinforced concrete beams under static and impact loads. Int. Protect Struct. 2017, 8, 3–24. [Google Scholar]
- Saini, D.; Shafei, B. Investigation of concrete-filled steel tube beams strengthened with CFRP against impact loads. Compos. Struct. 2019, 208, 744–757. [Google Scholar] [CrossRef]
- ACI Building code Requirements for Structural Concrete (ACI 318-14): An ACI Standard: Commentary on Building Code Requirements for Structural Concrete (ACI 318R-14), an ACI Report; American Concrete Institute: Farmington Hills, MI, USA, 2015.
- Zaouk, A.; Bedewi, N.; Kan, C.; Schinke, H. Evaluation of a multi-purpose pickup truck model using full scale crash data with application to highway barrier impacts. In Proceedings of the 29th International Symposium on Automotive Technology and Automation, Florence, Italy, 3–6 June 1996; pp. 39–46. [Google Scholar]
- Mohan, P.; Marzougui, D.; Kan, C.D. Validation of a single unit truck model for roadside hardware impact. J. Veh. Syst. Model. Test. 2006, 2, 1–15. [Google Scholar]
- Pham, T.M.; Hao, H. Effect of the plastic hinge and boundary conditions on impact behavior of reinforced concrete beams. Int. J. Impact Eng. 2017, 102, 74–85. [Google Scholar]
- Kishi, N.; Mikami, H.; Matsuoka, K.G.; Ando, T. Impact behavior of shear failure type RC beams without shear rebar. Int. J. Impact Eng. 2002, 27, 955–968. [Google Scholar]


| Case | Velocity of Vehicle (km/h) | Concrete Strength (MPa) | Thickness of CFRP (mm) | With or without CFRP |
|---|---|---|---|---|
| C1 | 60 | 30 | - | without |
| C2 | 80 | 30 | - | without |
| C3 | 100 | 30 | - | without |
| C4 | 120 | 30 | - | without |
| C5 | 60 | 30 | 2 | with |
| C6 | 80 | 30 | 2 | with |
| C7 | 100 | 30 | 2 | with |
| C8 | 120 | 30 | 2 | with |
| C9 | 100 | 50 | 2 | with |
| C10 | 100 | 70 | 2 | with |
| C11 | 100 | 30 | 4 | with |
| C12 | 100 | 30 | 6 | with |
Disclaimer/Publisher’s Note: The statements, opinions and data contained in all publications are solely those of the individual author(s) and contributor(s) and not of MDPI and/or the editor(s). MDPI and/or the editor(s) disclaim responsibility for any injury to people or property resulting from any ideas, methods, instructions or products referred to in the content. |
© 2024 by the authors. Licensee MDPI, Basel, Switzerland. This article is an open access article distributed under the terms and conditions of the Creative Commons Attribution (CC BY) license (https://creativecommons.org/licenses/by/4.0/).
Share and Cite
Han, R.; Zhou, H.; Wu, M. Dynamic Performance Analysis of Precast Segment Column Reinforced with CFRP Subject to Vehicle Collision. Buildings 2024, 14, 2658. https://doi.org/10.3390/buildings14092658
Han R, Zhou H, Wu M. Dynamic Performance Analysis of Precast Segment Column Reinforced with CFRP Subject to Vehicle Collision. Buildings. 2024; 14(9):2658. https://doi.org/10.3390/buildings14092658
Chicago/Turabian StyleHan, Runbo, Hai Zhou, and Min Wu. 2024. "Dynamic Performance Analysis of Precast Segment Column Reinforced with CFRP Subject to Vehicle Collision" Buildings 14, no. 9: 2658. https://doi.org/10.3390/buildings14092658