Experimental Investigation on the Seismic Performance of Novel Prefabricated Composite RC Shear Walls with Concrete-Filled Steel Tube Frame

Abstract
:1. Introduction
2. Experimental Designs
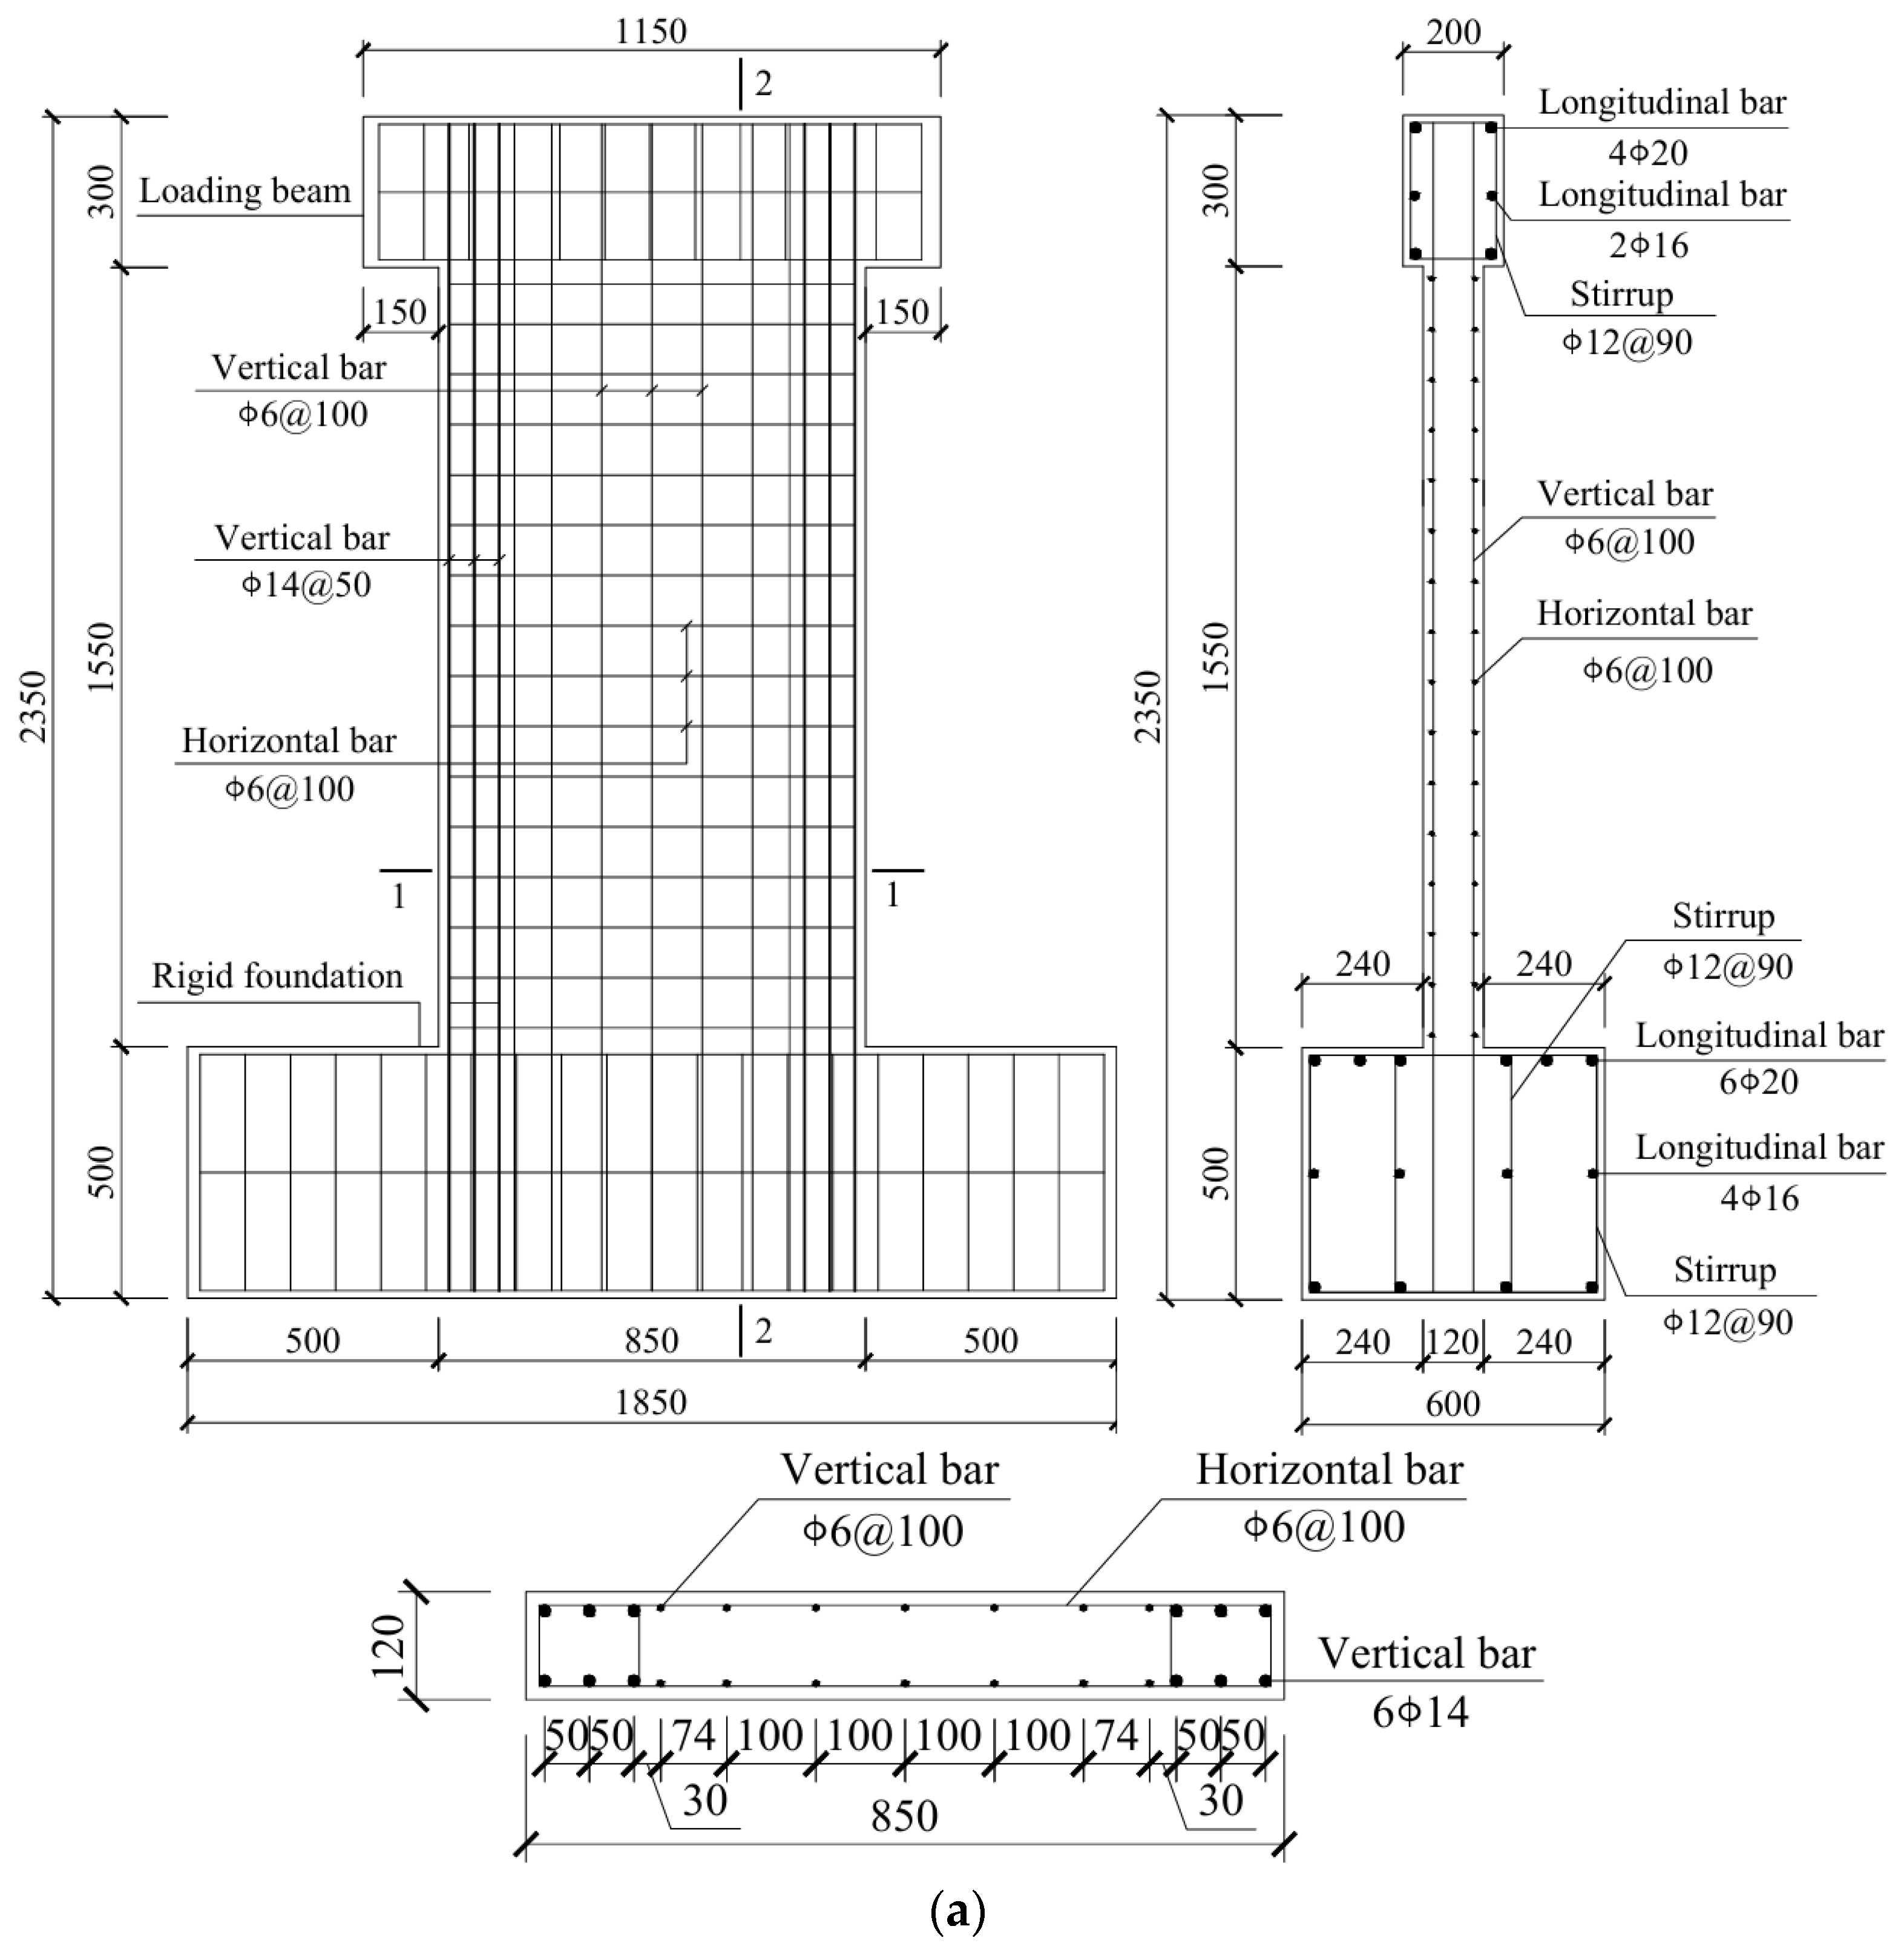
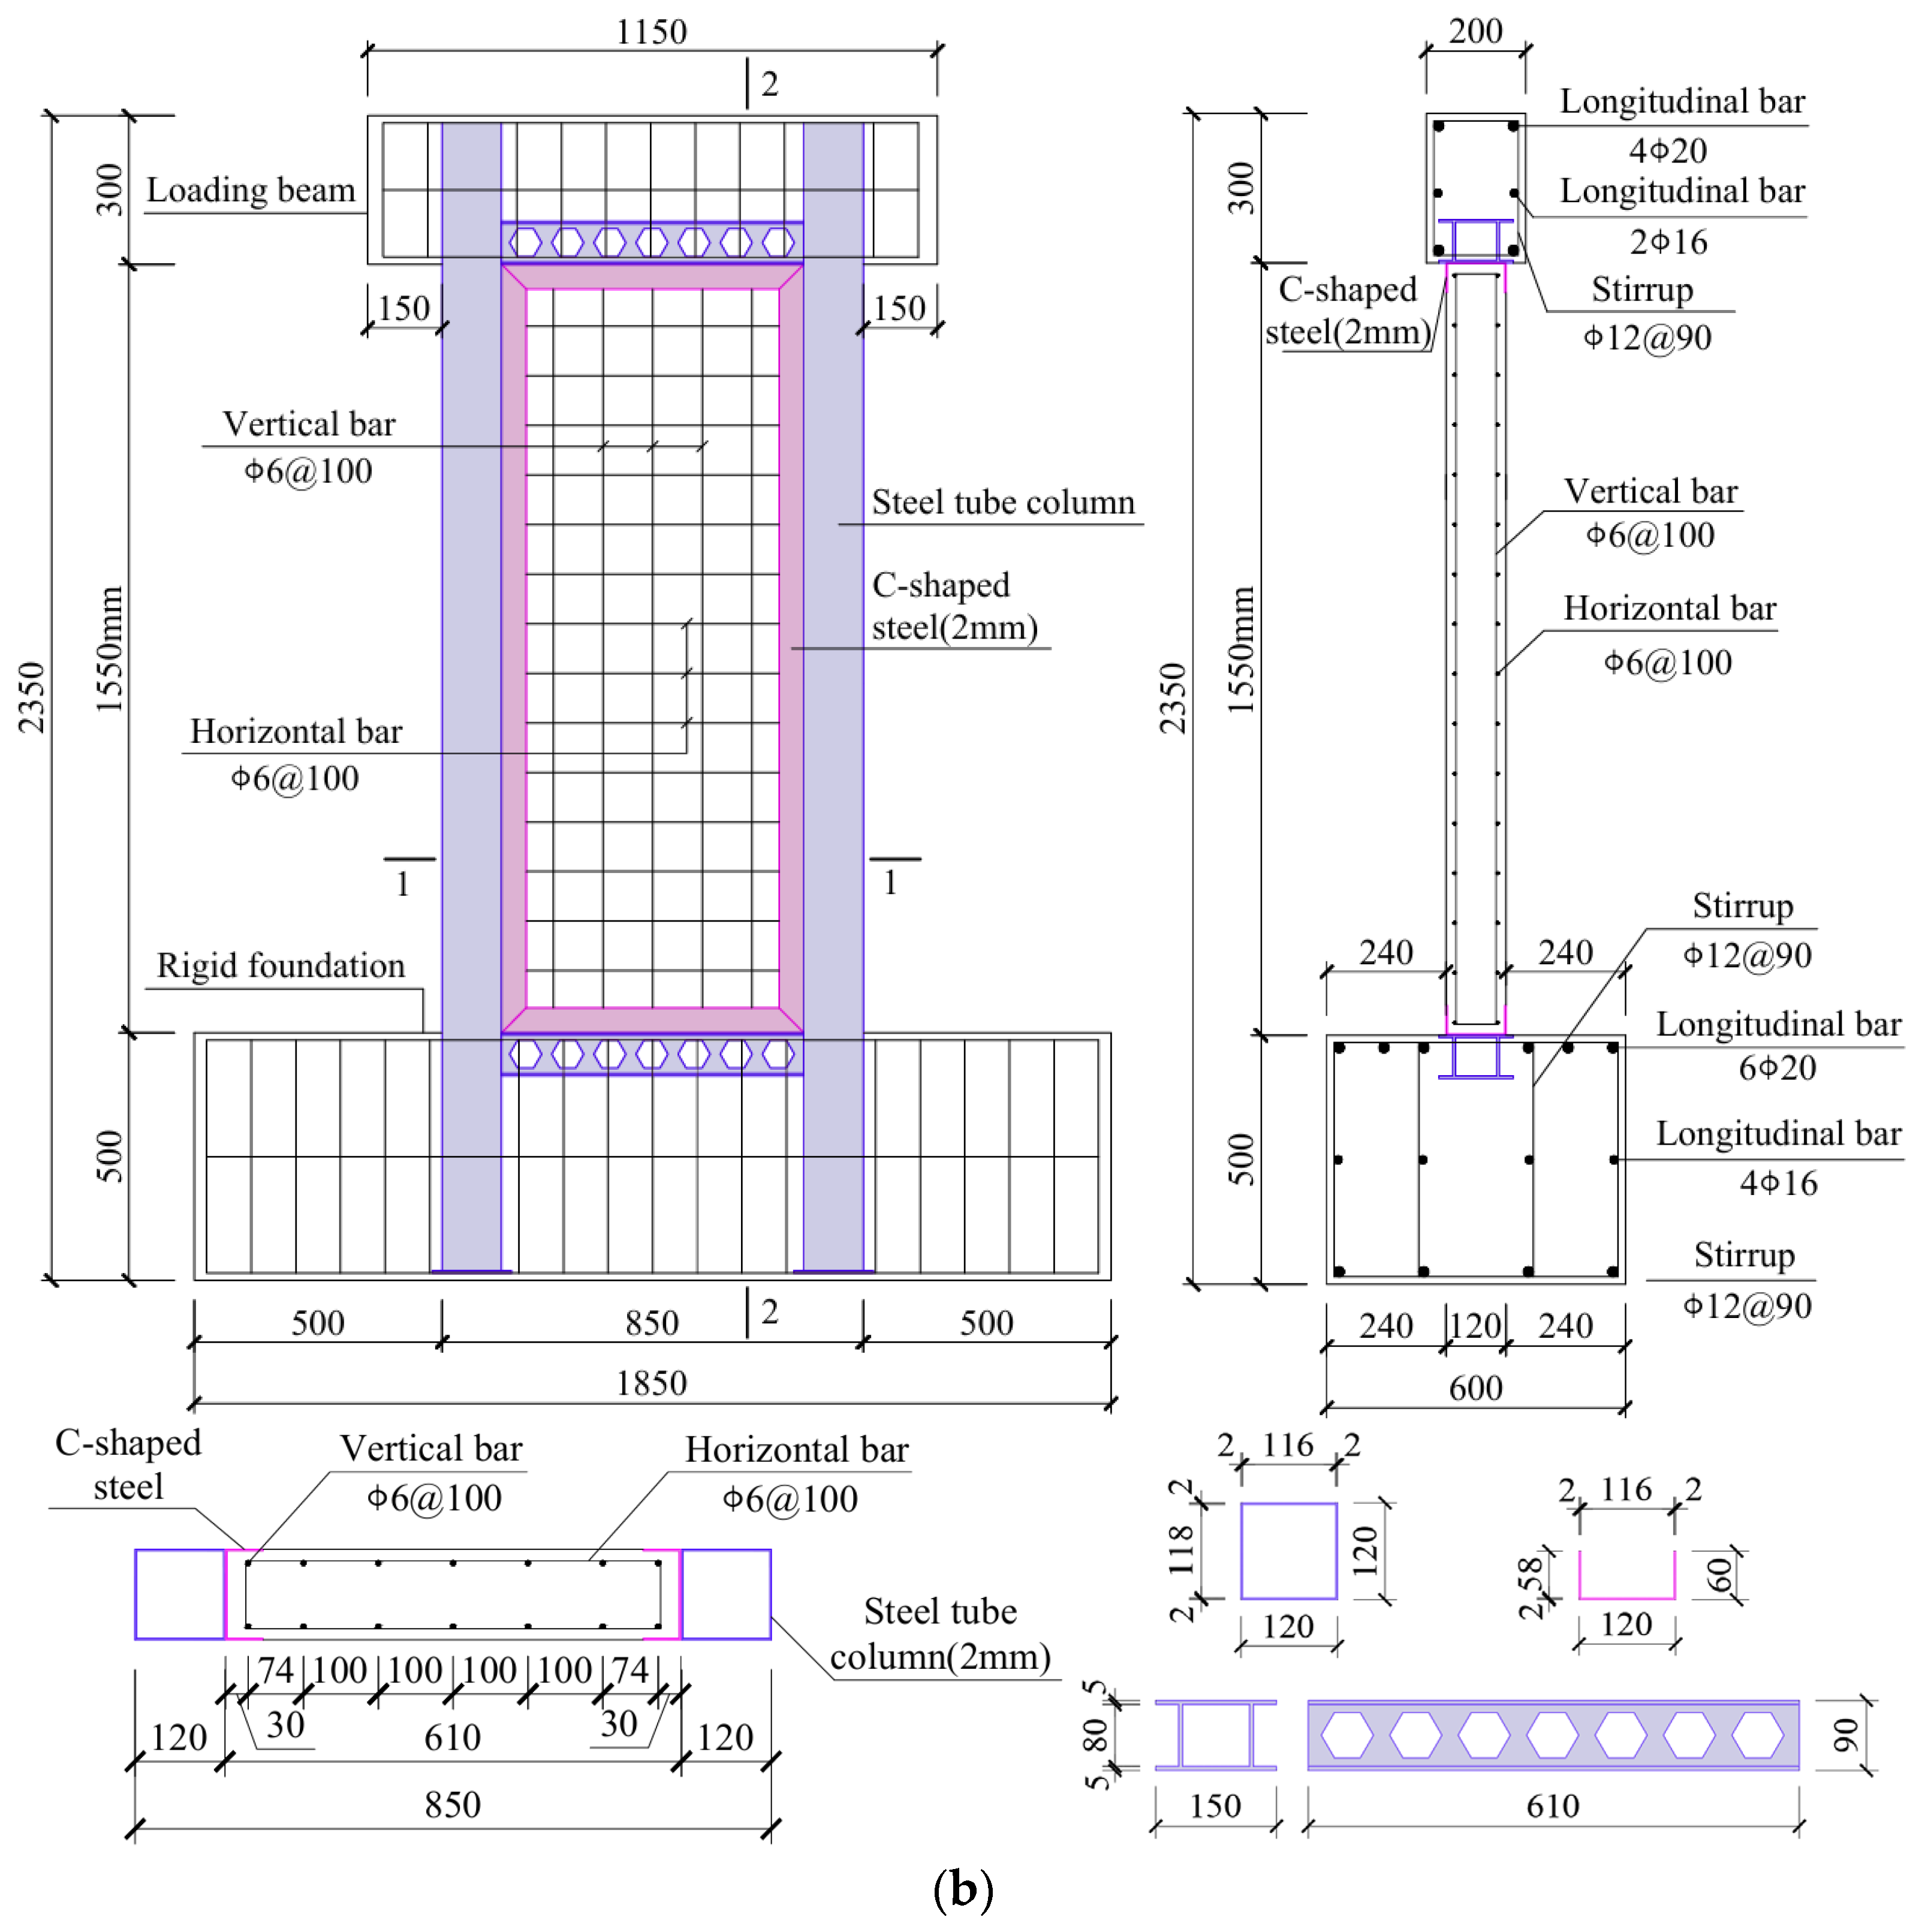
2.1. Specimen Design
2.2. Materials Properties
- (1)
- Concrete
- (2)
- Steels
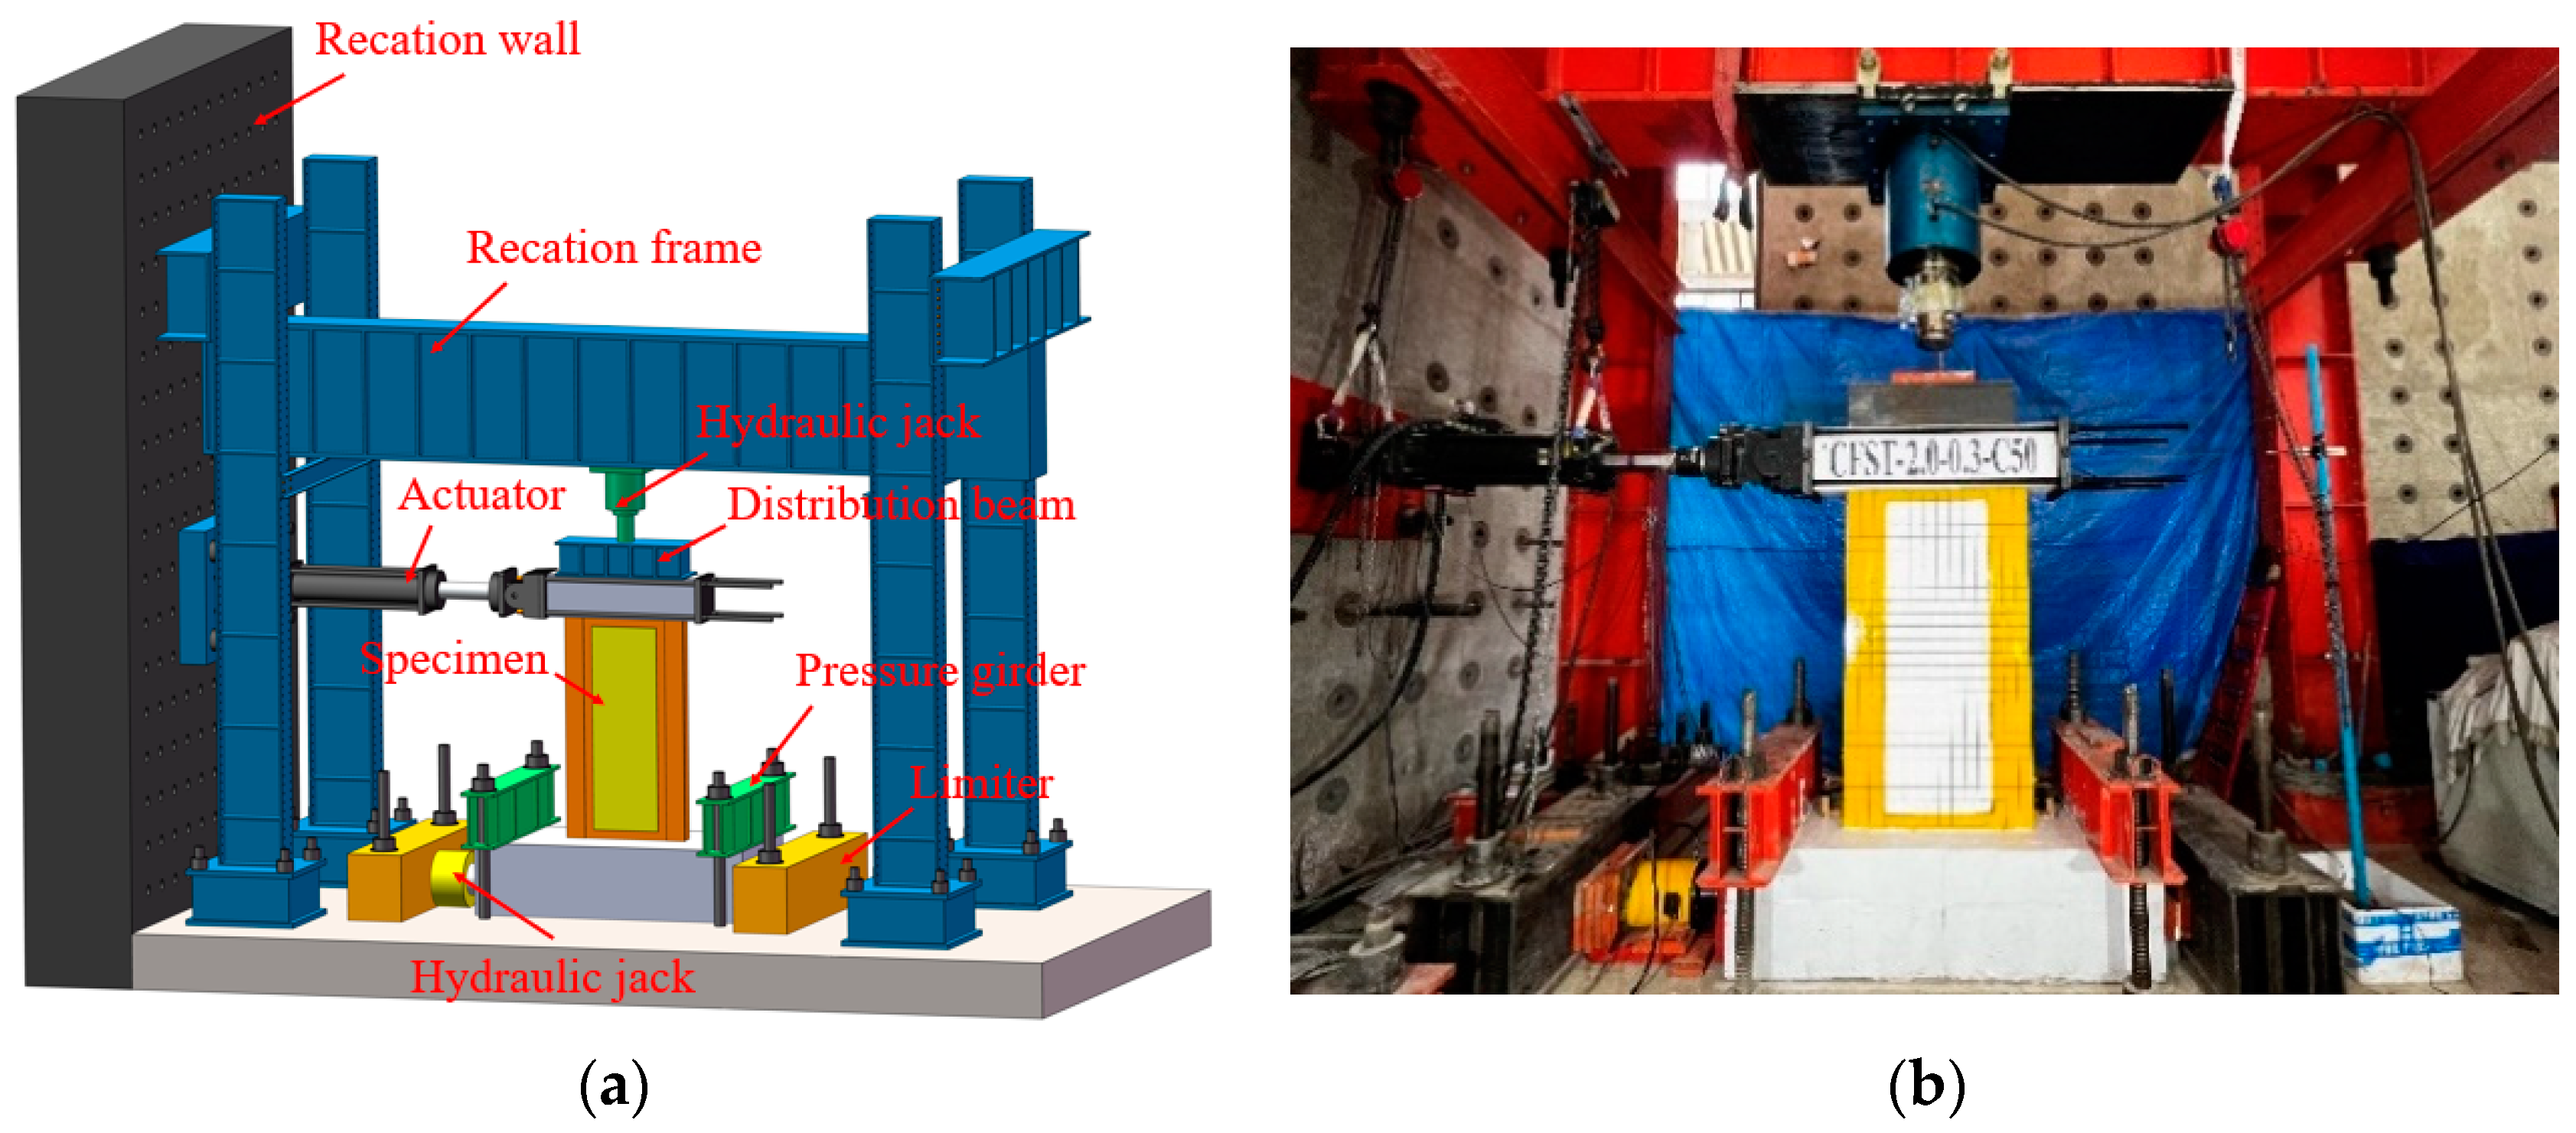
2.3. Loading Device
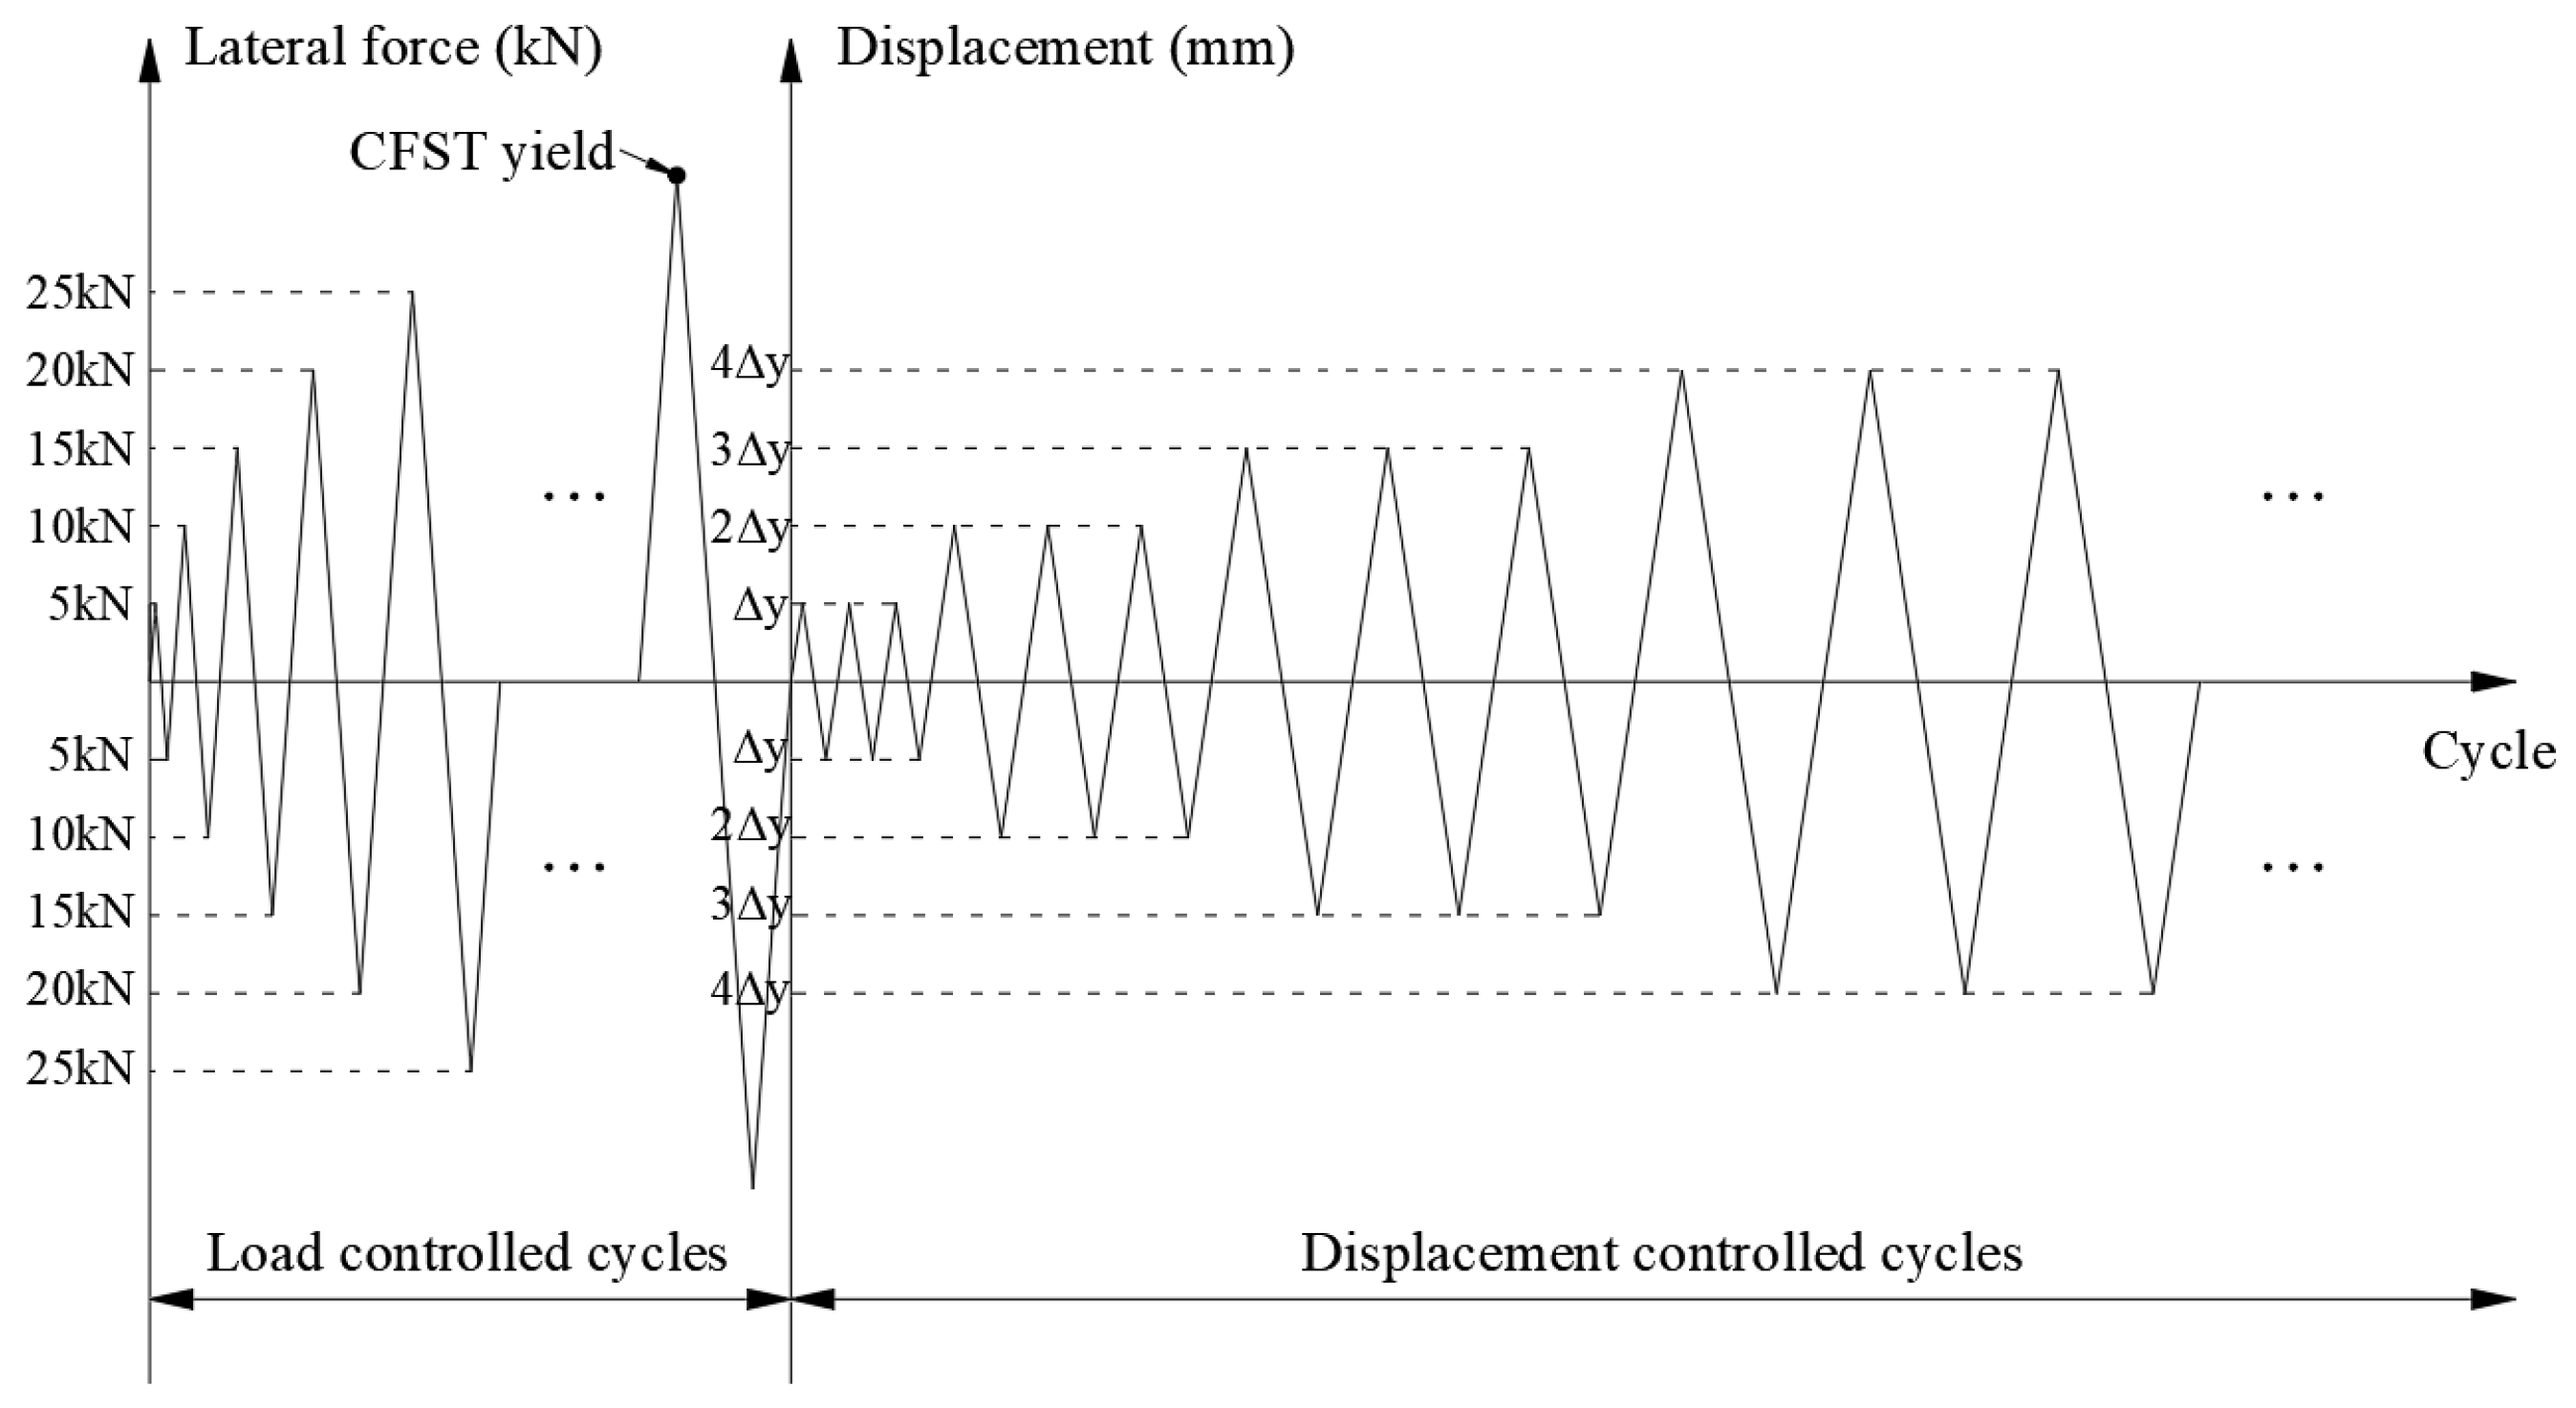
2.4. Loading Protocol
- (1)
- Vertical load
- (2)
- Horizontal load
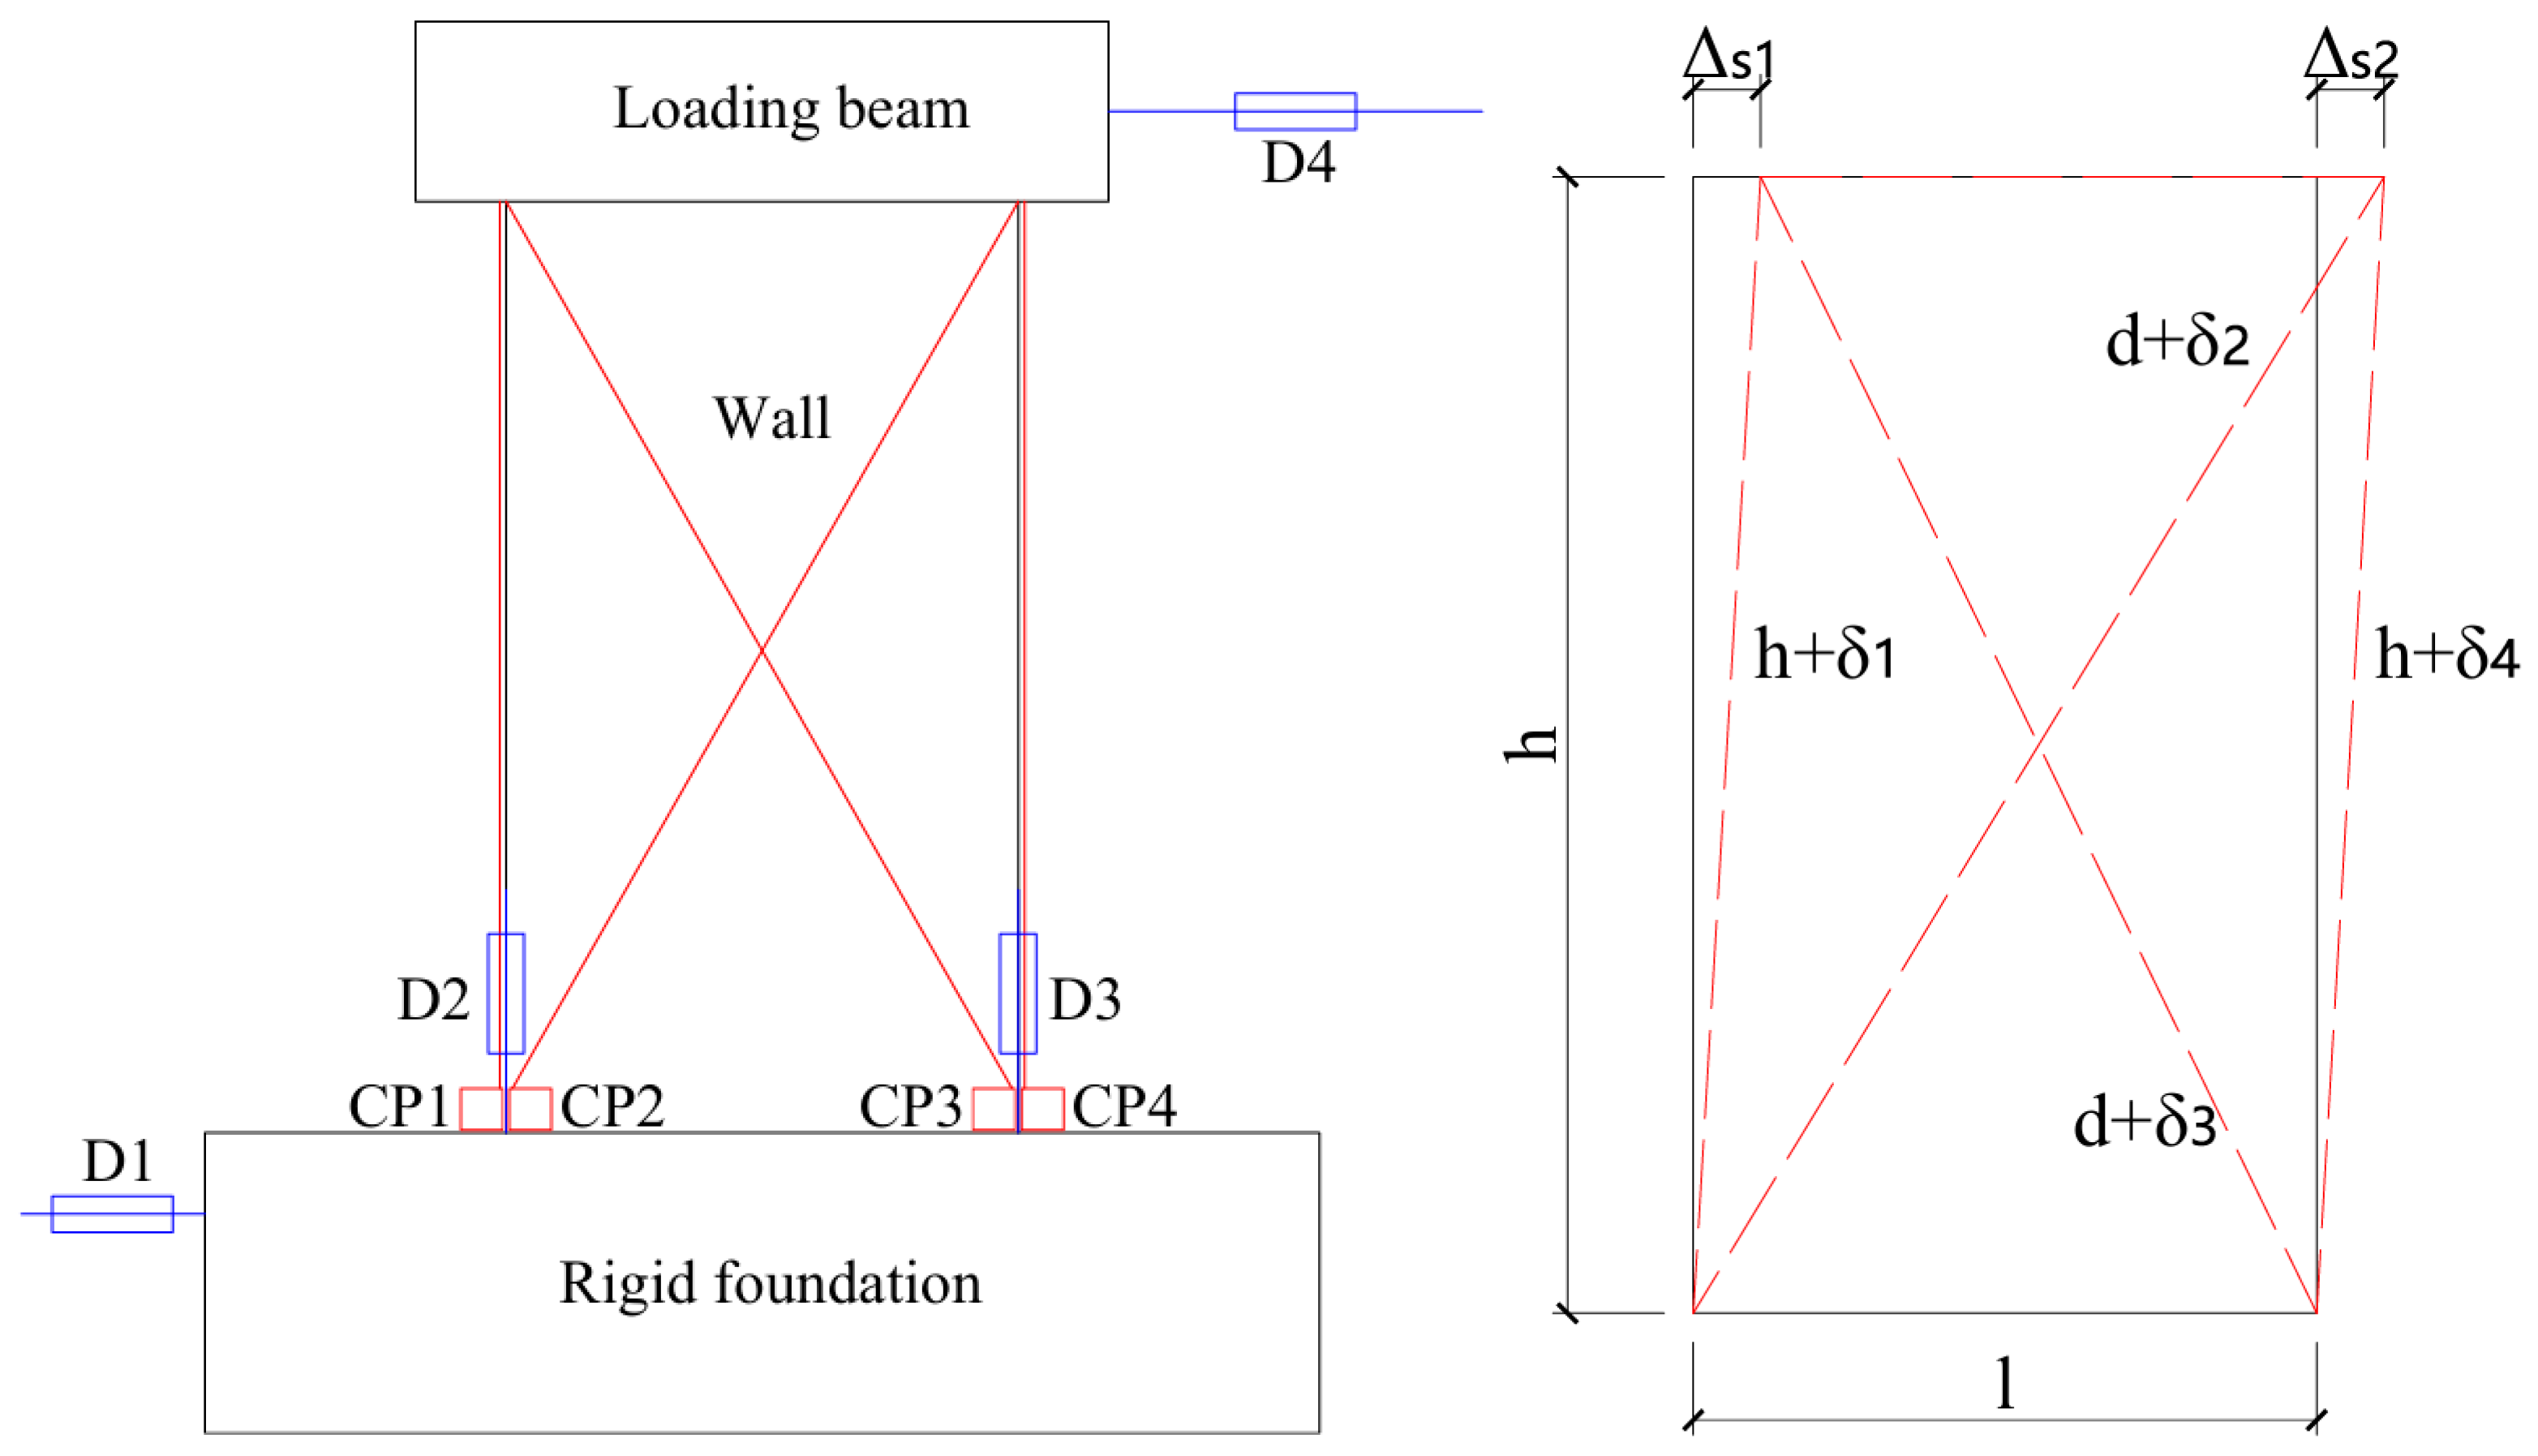
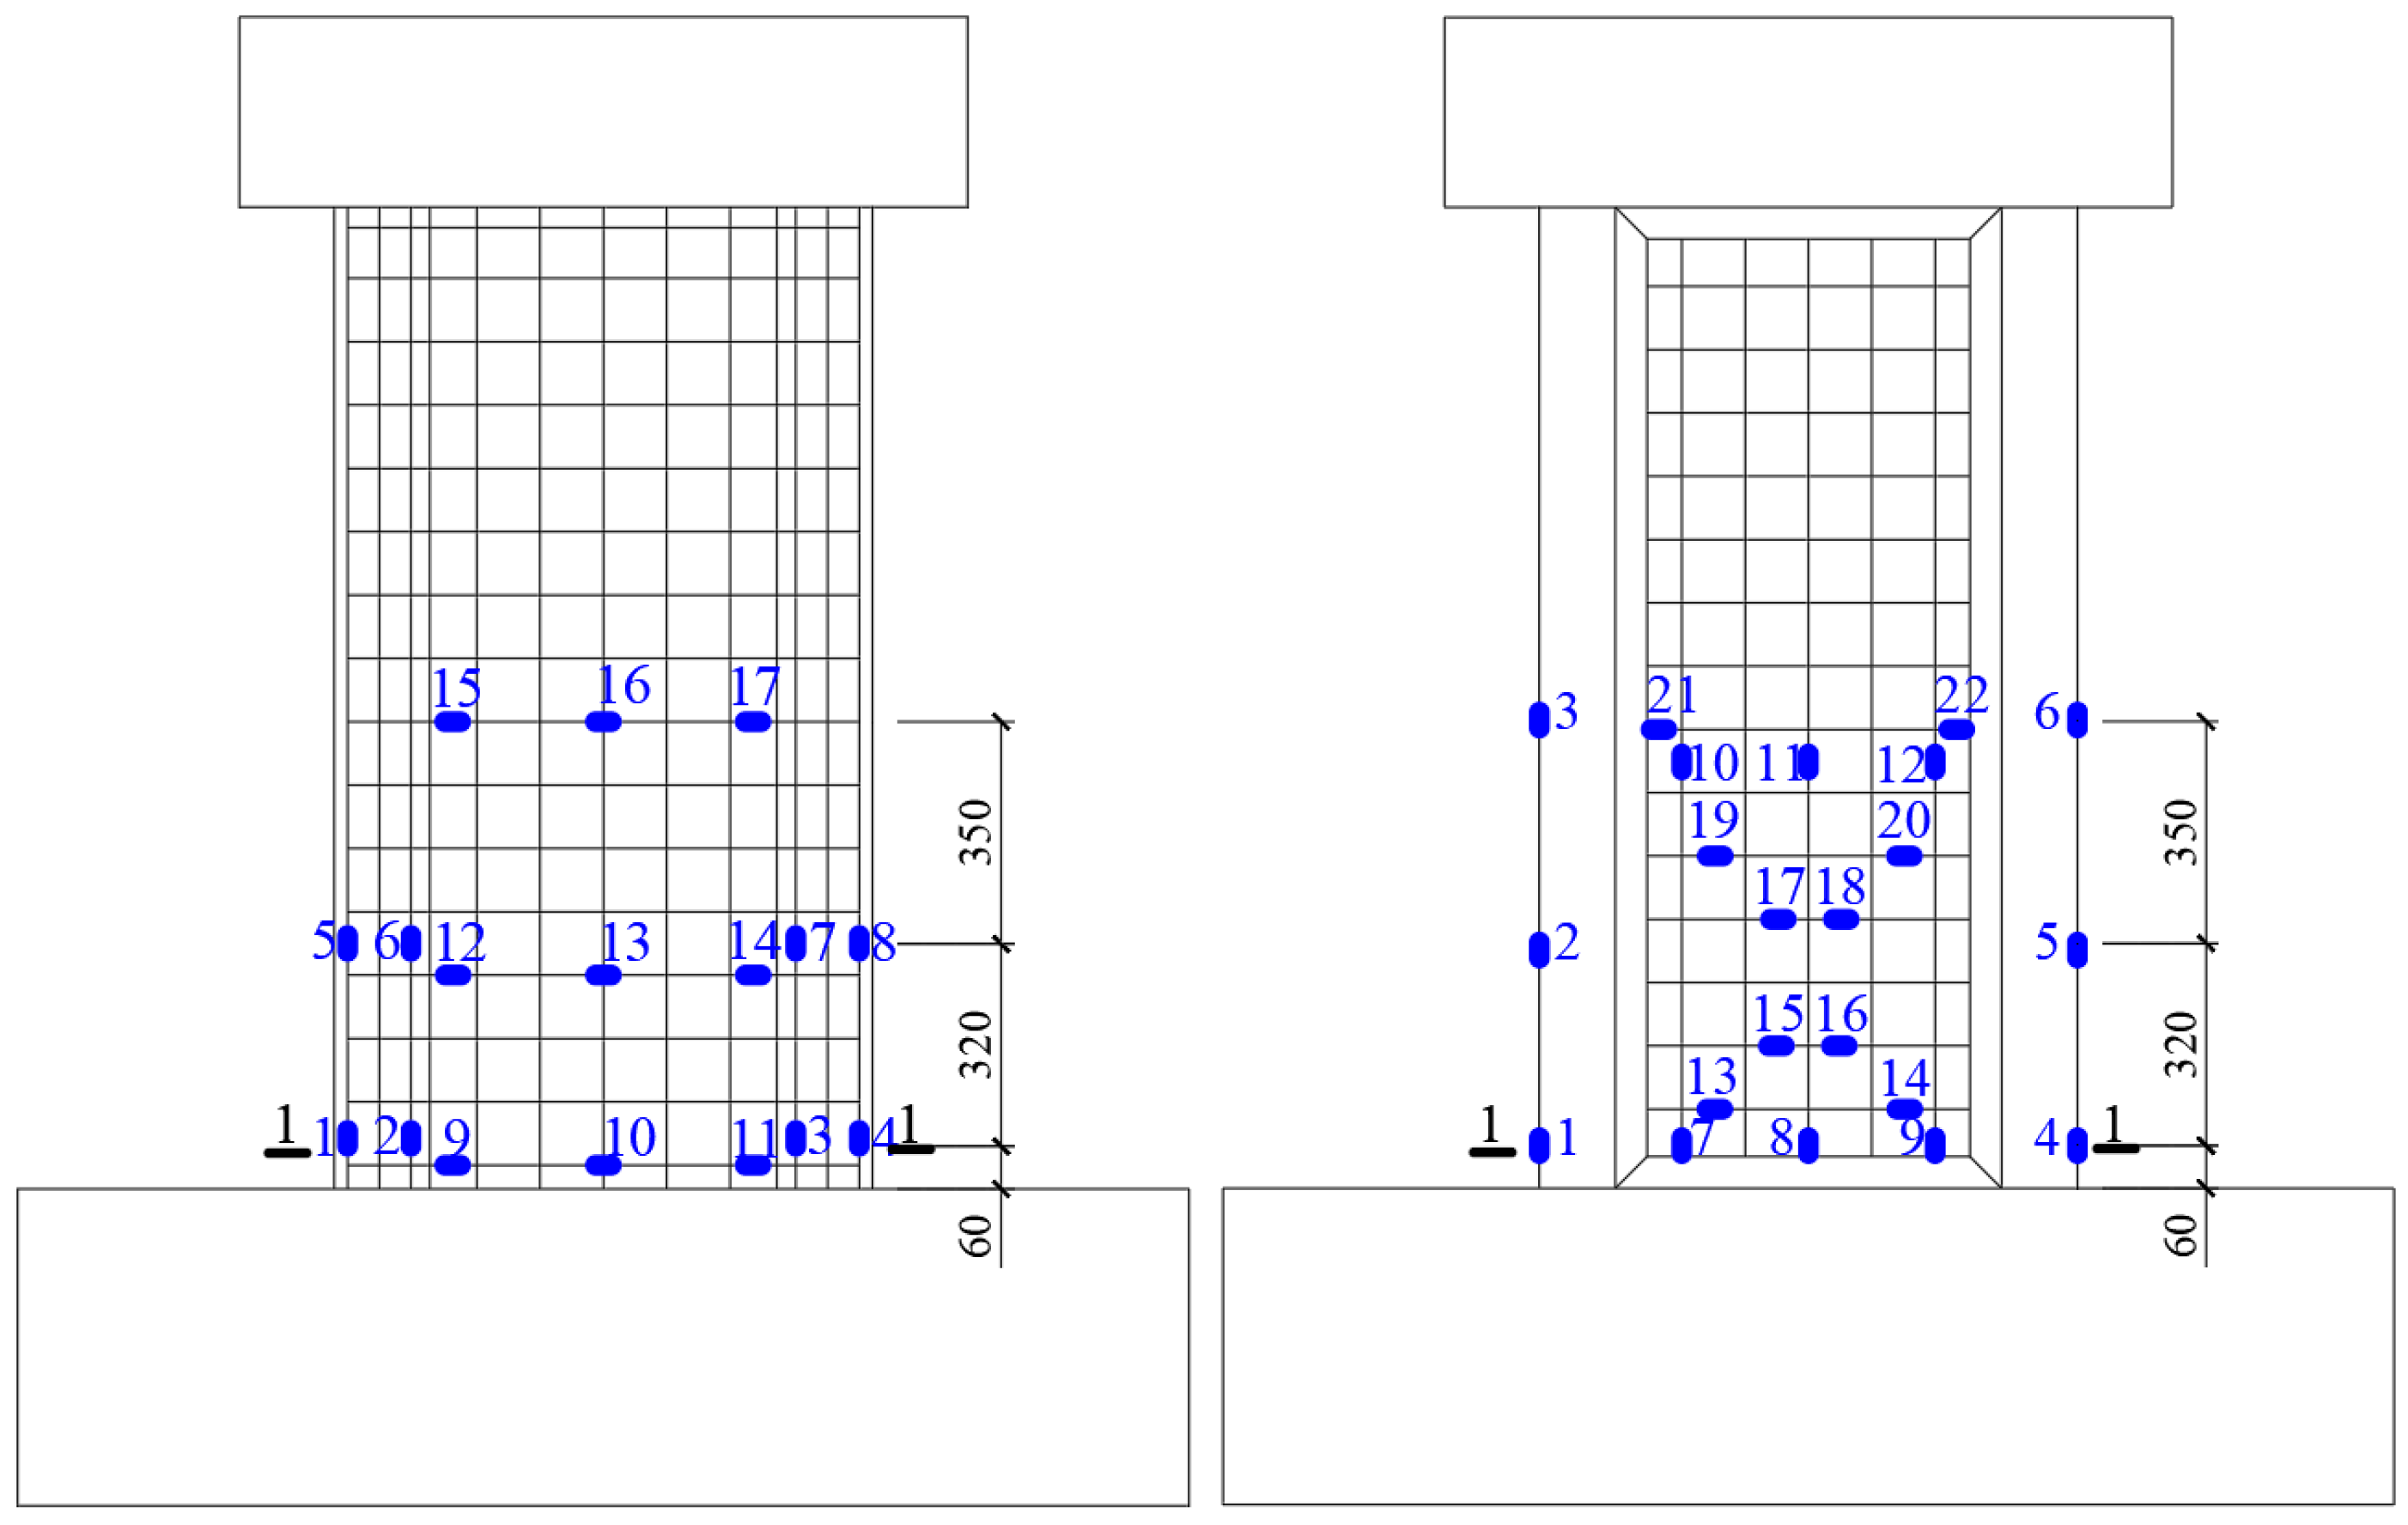
2.5. Measuring Device
3. Experimental Results
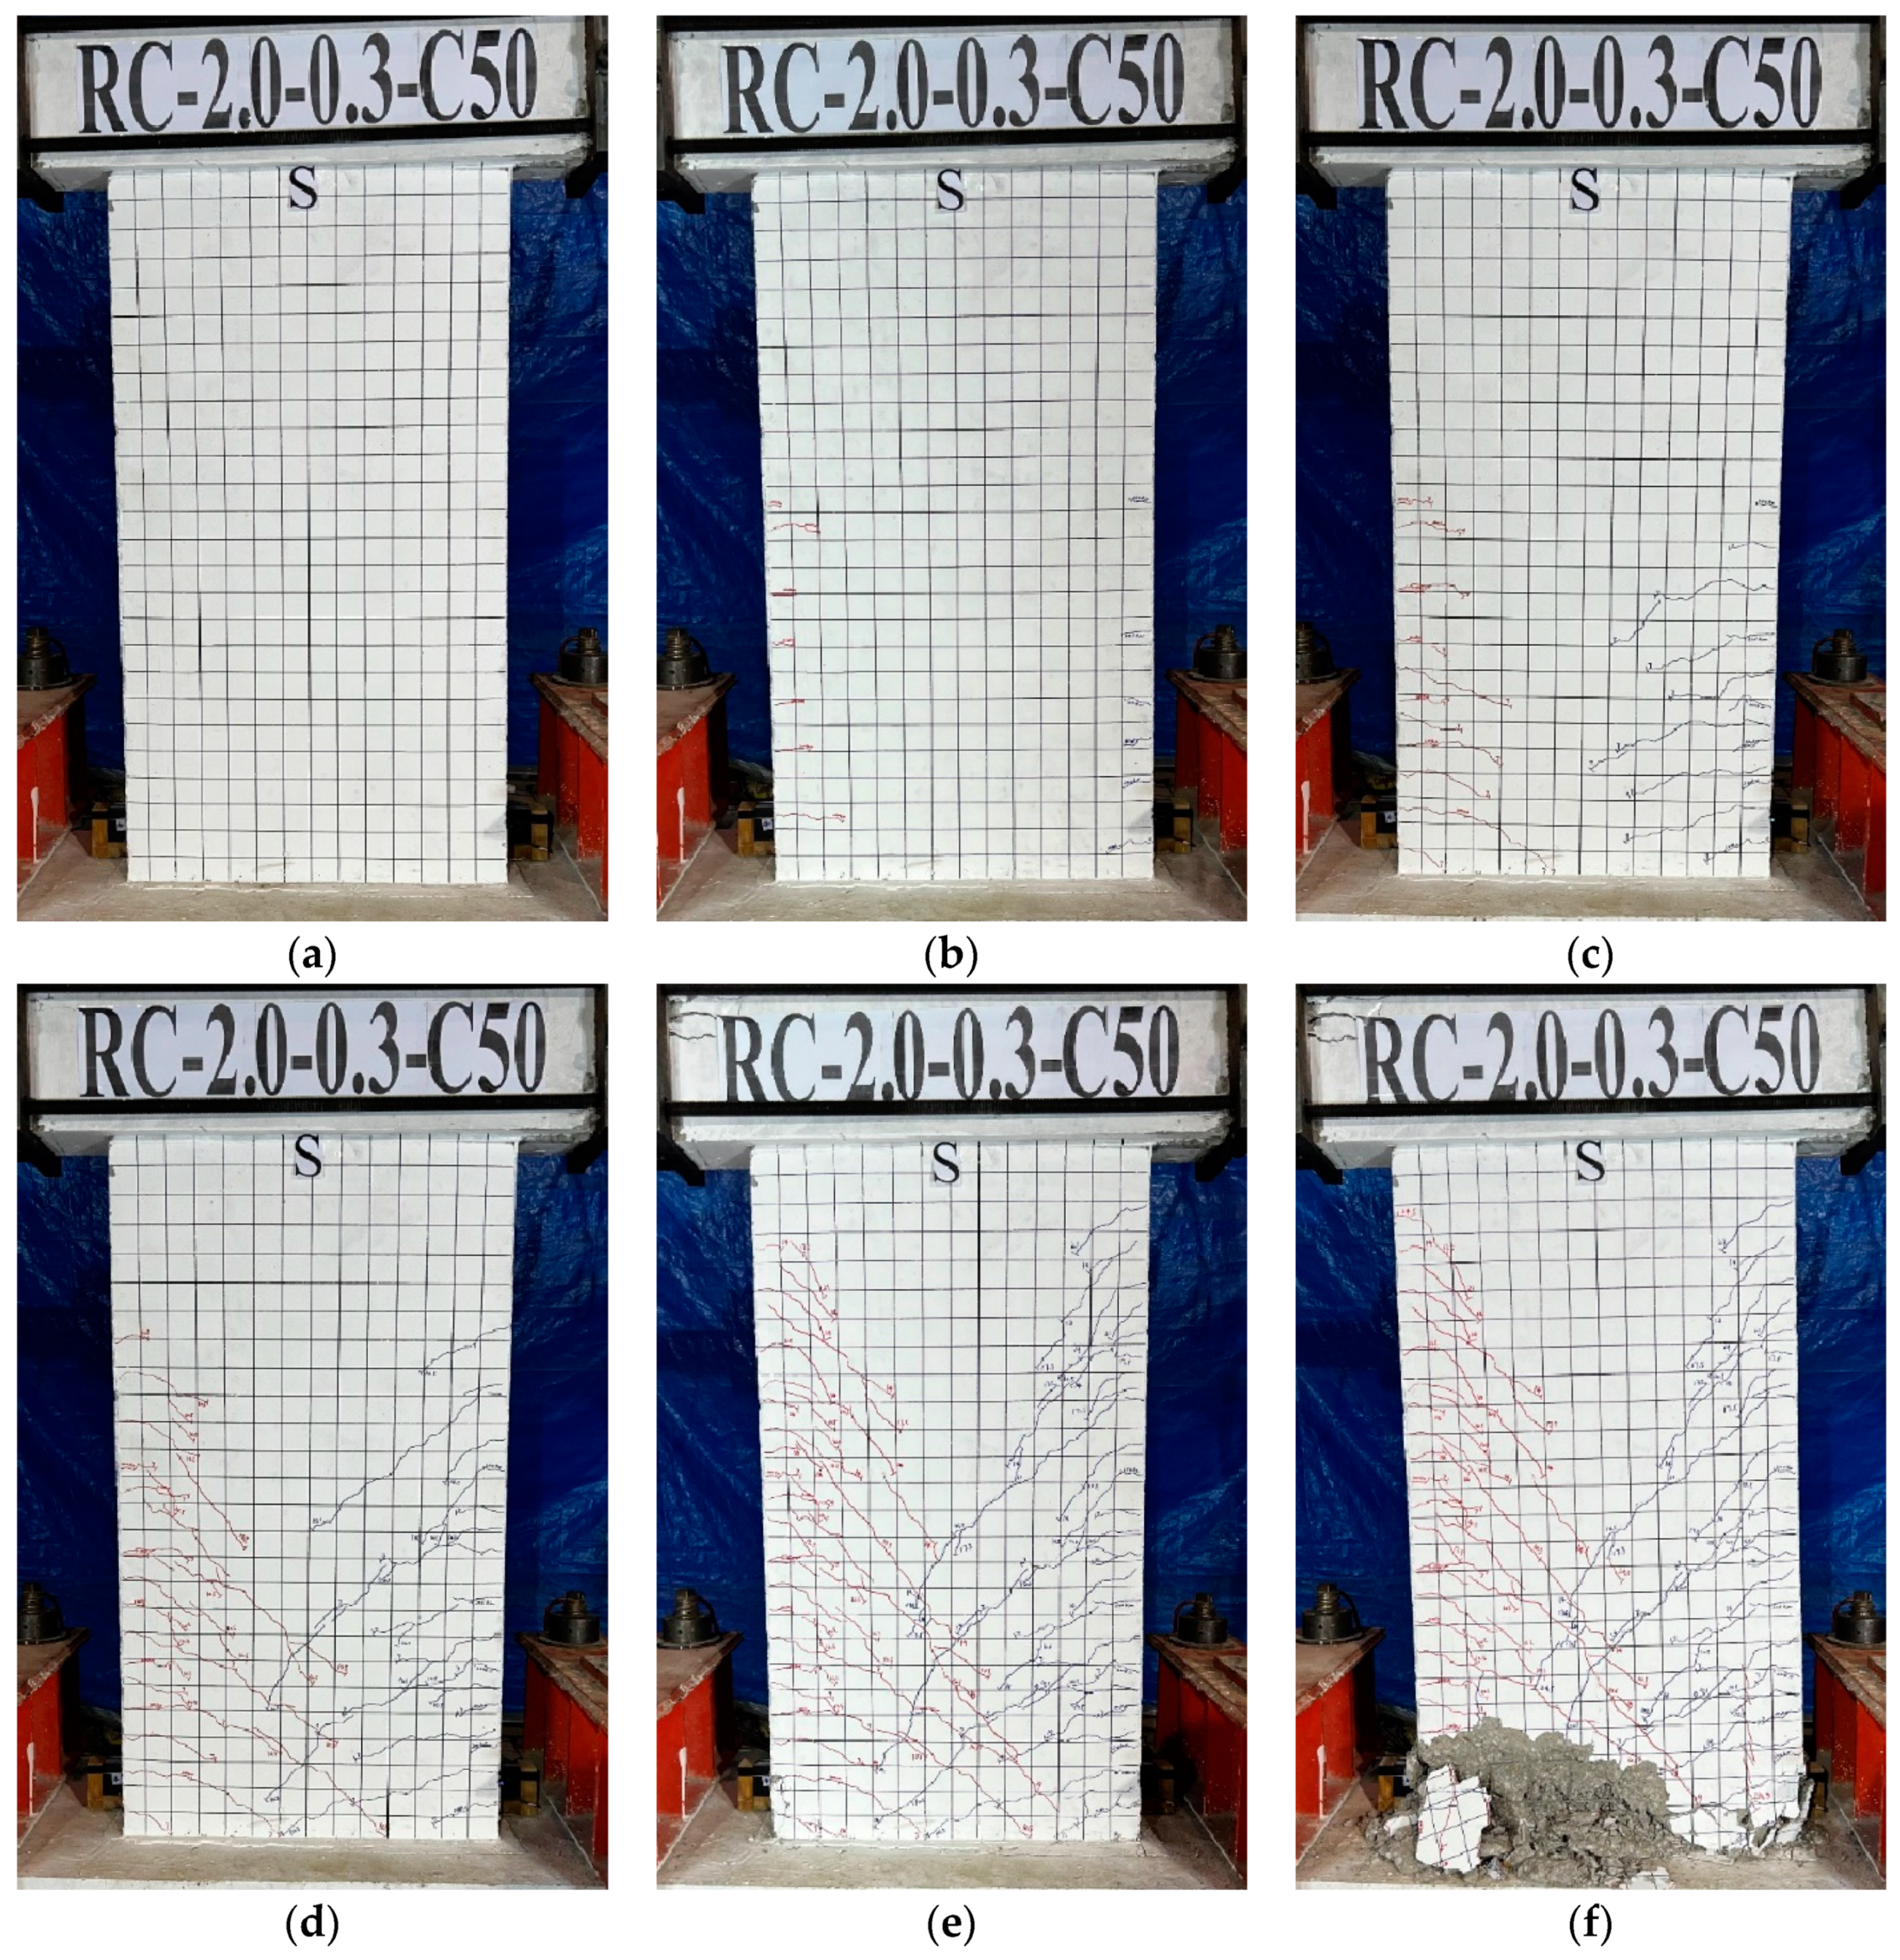
3.1. Failure Process
3.2. Hysteretic Curves
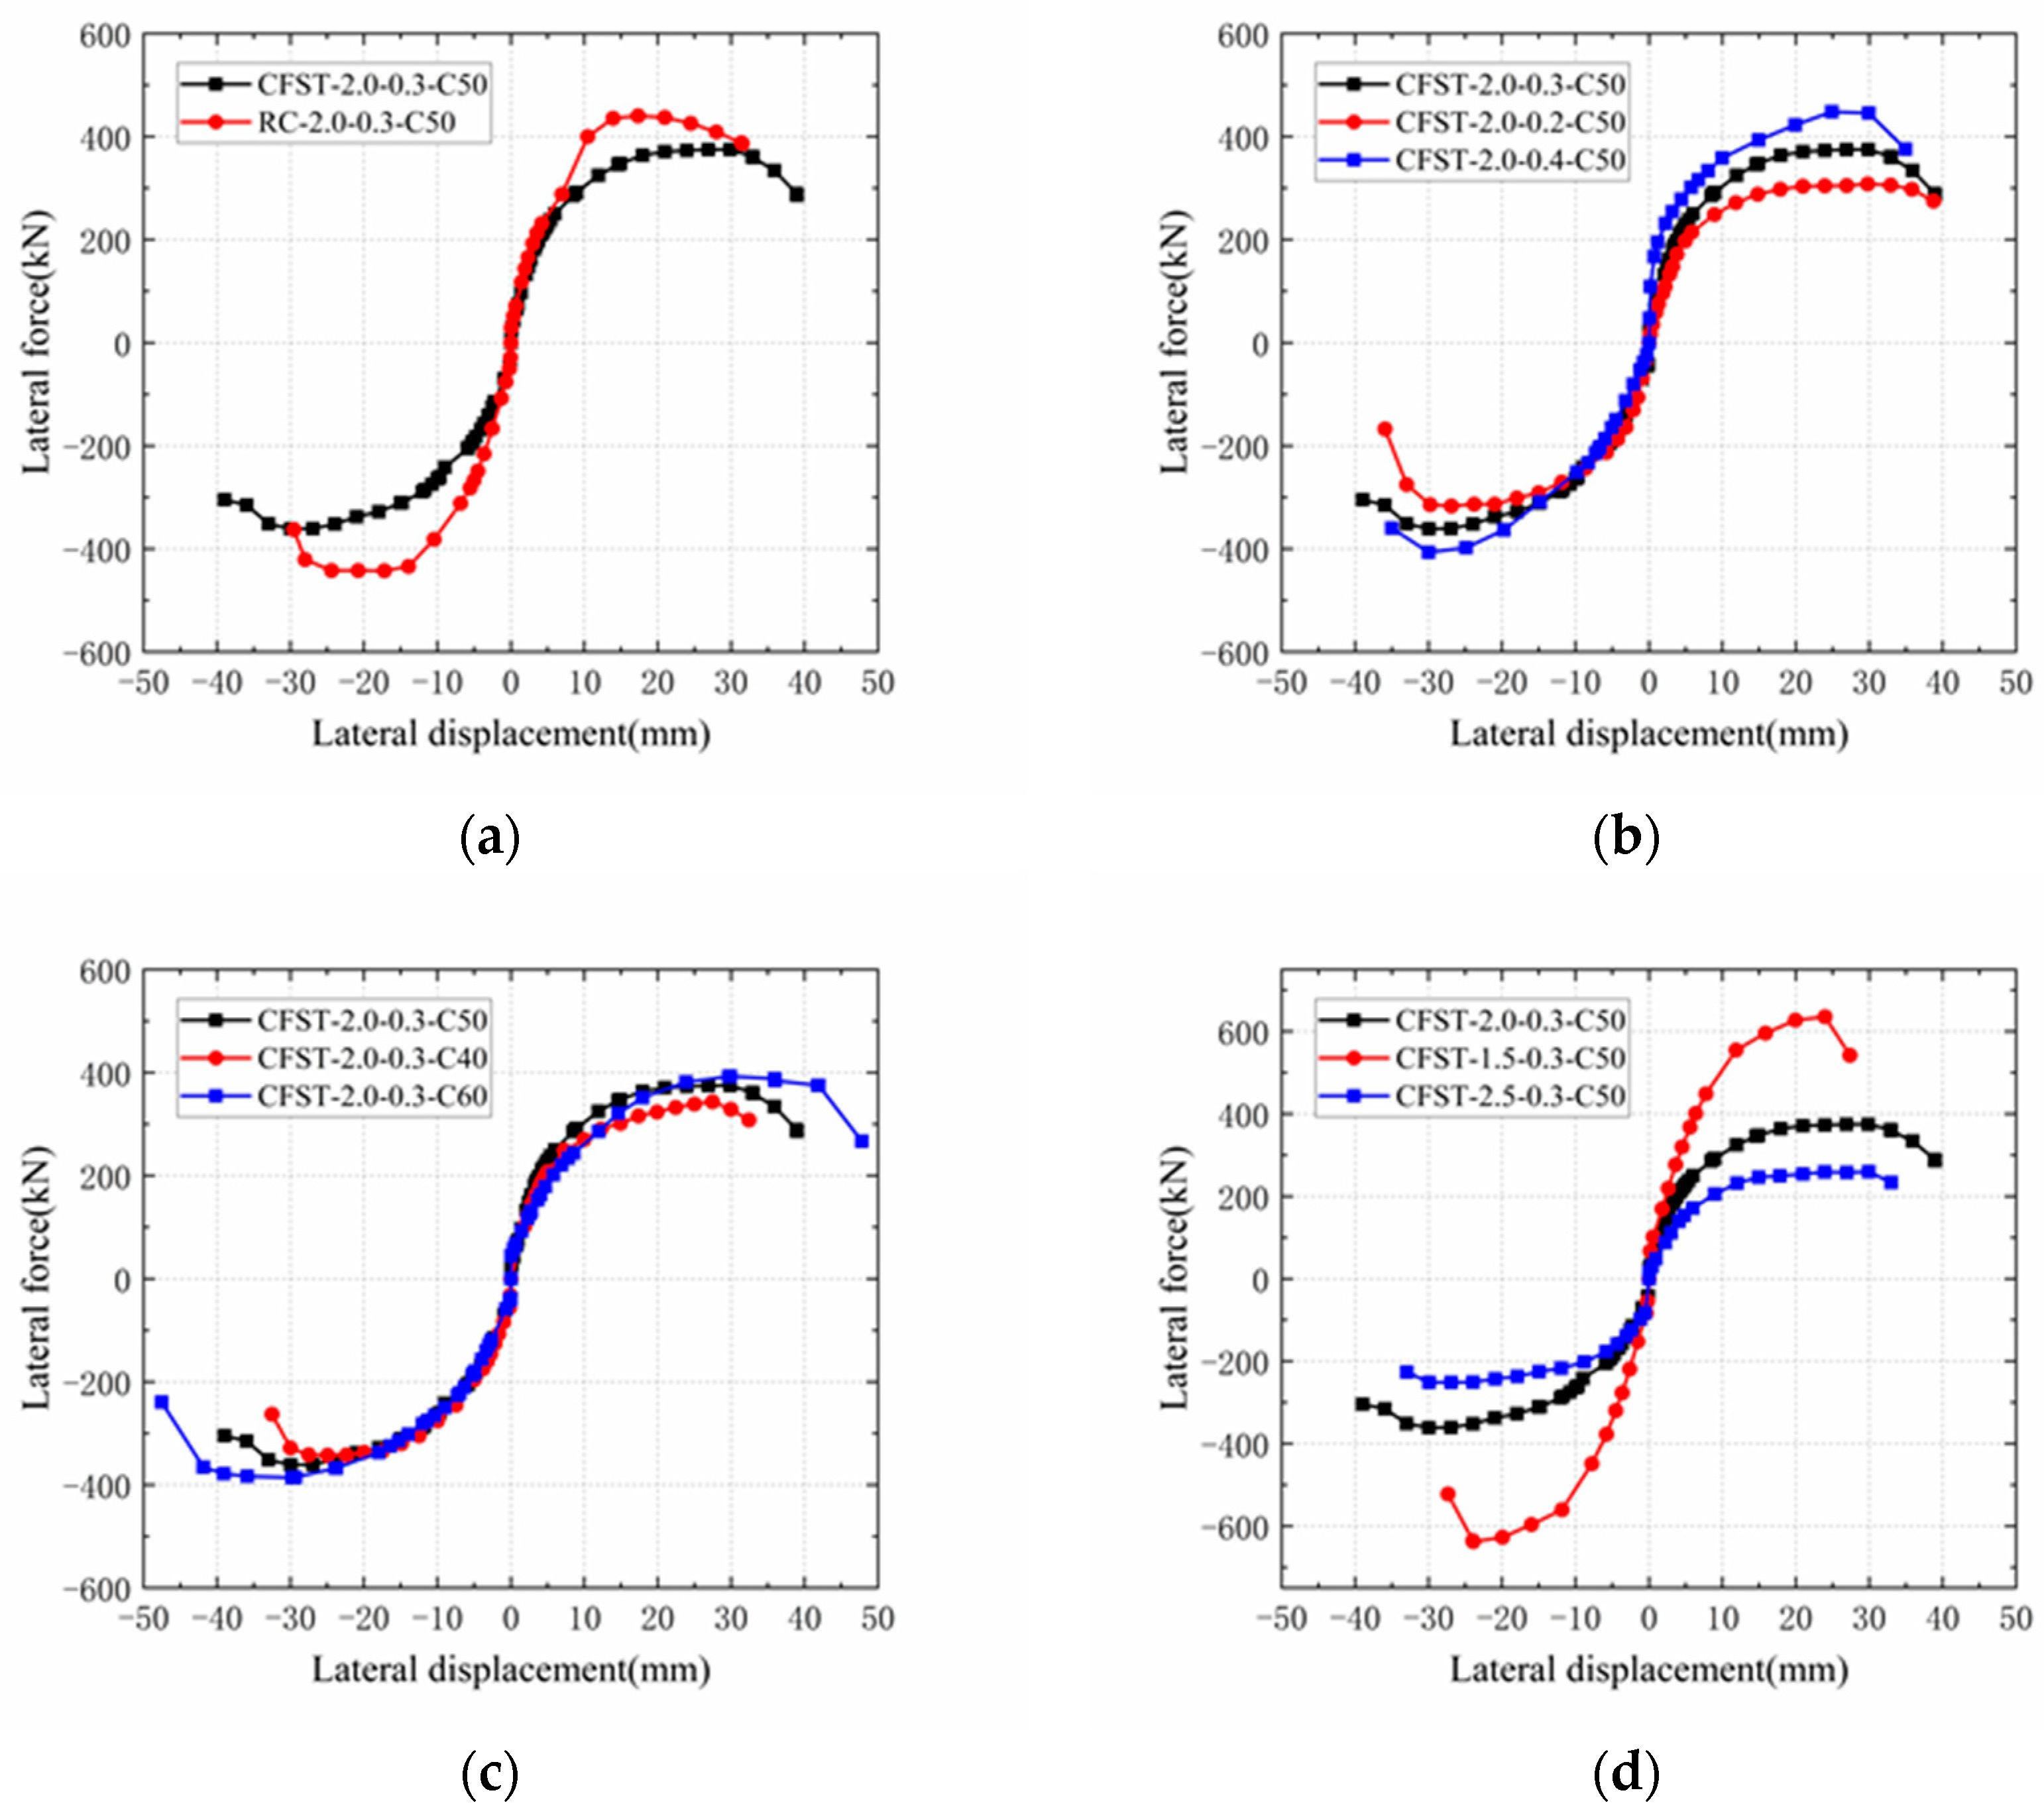
3.3. Skeleton Curves
- (1)
- The peak load for RC-2.0-0.3-C50 exceeded that of CFST-2.0-0.3-C50; however, the load-bearing capability of RC-2.0-0.3-C50 decreased rapidly after reaching its peak. CFST-2.0-0.3-C50 demonstrated a 55.4% increase in peak displacement, a 15.6% increase in ultimate displacement, and a 14.1% enhancement in displacement ductility coefficient upon comparison with RC-2.0-0.3-C50. This indicates that CRCSW-CFSTs provide superior ductility over traditional RCSWs due to the confining effect of the concrete-filled steel tube boundary columns on the web [42].
- (2)
- Among the three CRCSW-CFST specimens with different axial compression ratios, CFST-2.0-0.3-C50 and CFST-2.0-0.4-C50 demonstrated an increase of 21.8% and 45% in peak load, respectively, compared to CFST-2.0-0.2-C50. Despite the increase in peak load, CFST-2.0-0.3-C50 and CFST-2.0-0.4-C50 showed a decrease in peak displacement of 9.73% and 16.44% and a reduction in ductility coefficient of 10.1% and 16.7%, respectively. The observed results suggest that the load-bearing capacity of the CRCSW-CFST specimens increased while the deformation capacity decreased with an increasing axial compression ratio. This observation can be attributed to the higher axial pressure, which increased the shear compression zone height in the web. This enhancement in shear capacity reduced concrete cracking. However, in the specimens with higher axial pressures, the increased horizontal displacement accelerated concrete failure, leading to a rapid decrease in load-bearing capacity.
- (3)
- Among the three CRCSW-CFST specimens with varying concrete strengths, CFST-2.0-0.3-C50 and CFST-2.0-0.3-C60 demonstrated peak loads that were 9.33% and 14.58% higher, respectively, than that of CFST-2.0-0.3-C40. Furthermore, their peak displacements increased by 9.79 and 31.1%, respectively. The results indicate that increasing concrete strength enhances the load-bearing capacity of CRCSW-CFSTs.
- (4)
- Among the three CRCSW-CFST specimens with varying shear span ratios, CFST-2.0-0.3-C50 and CFST-2.5-0.3-C50 demonstrated 41.22 and 59.25% lower peak loads compared to CFST-1.5-0.3-C50. However, their peak displacements increased by 12.6% and 25.1%, respectively. The results showed that lower shear span ratios enhanced the load-bearing capacity but resulted in a more rapid decrease in capacity after reaching the peak load. The relationship between ductility and shear span ratio in CRCSW-CFSTs was not significant under the influence of diverse failure modes.
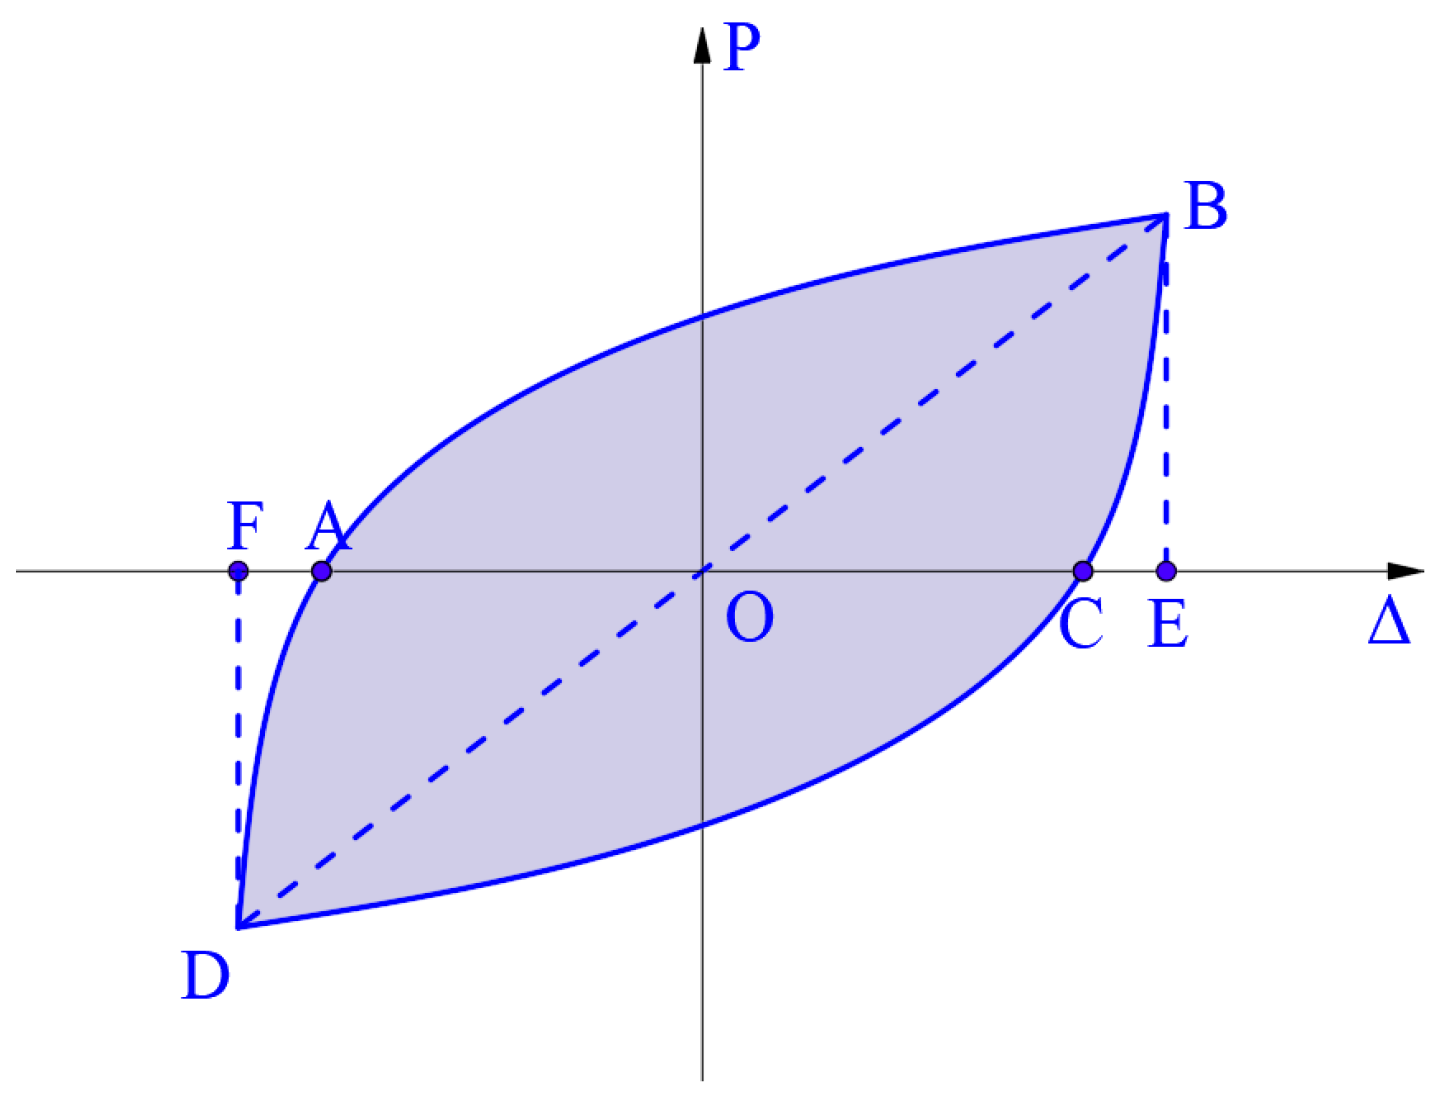
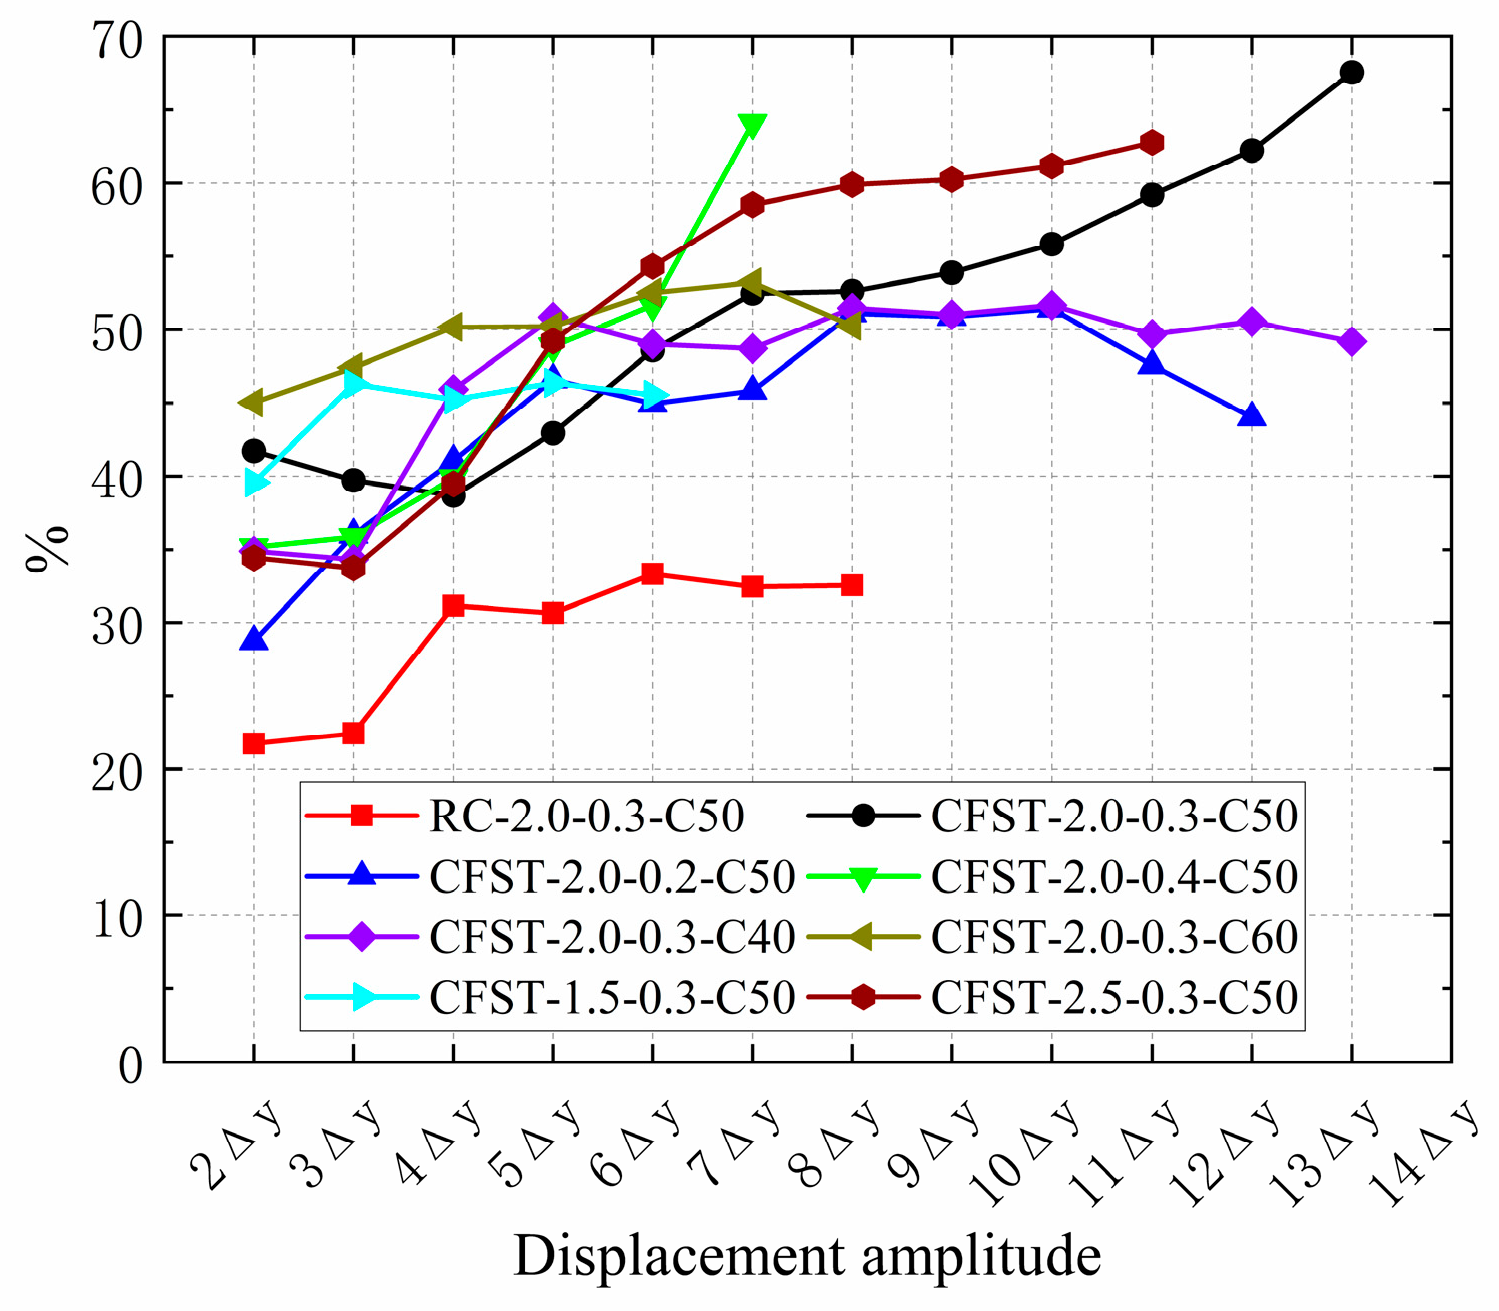
3.4. Energy Dissipation
- (1)
- The value of RC-2.0-0.3-C50 was very low at small displacements (less than 15 mm), while that of CFST-2.0-0.3-C50 was relatively high. The value for RC-2.0-0.3-C50 increased rapidly after displacement exceeded 18 mm, whereas the value for CFST-2.0-0.3-C50 remained relatively stable. At 30 mm displacement, the value of CFST-2.0-0.3-C50 rose significantly, primarily because the values for RCSWs are mainly derived from plastic damage in the concrete and relative slips between the reinforcement and the concrete. At small displacement values, concrete plastic damage and reinforcement slip were minimal. However, as displacement increased, both concrete damage and reinforcement slip rapidly developed. For CRCSW-CFSTs, the slight relative slippage between the prefabricated concrete wall panel and the encasing C-shaped steel resulted in higher values at small displacements. Furthermore, the constraint provided by the concrete-filled steel tubes on the prefabricated web panels delayed plastic damage in the web, causing increase to begin only in the later stages of loading.
- (2)
- The value increased with the axial compression ratio among the three CRCSW-CFSTs, particularly at small displacements. This increase was primarily due to larger vertical loads, which made relative slippage between the reinforced concrete wall panel of the prefabricated web and the encasing C-shaped steel less likely to occur. At larger displacements, higher vertical loads resulted in more plastic damage to the concrete and greater relative slips between the reinforcement and the concrete.
- (3)
- The trends in the viscous damping coefficient for the three CRCSW-CFSTs with varying concrete strengths were similar. Both CFST-2.0-0.3-C40 and CFST-2.0-0.3-C50 showed comparable failure characteristics, leading to similar curves. In contrast, the failure of the CFST-2.0-0.3-C60 specimen was primarily due to the buckling and tearing of the bottom concrete-filled steel tube columns, which constrained the plastic energy dissipation capacity of the prefabricated web panels and resulted in the lowest value.
- (4)
- Among the three CRCSW-CFST specimens with different shear span ratios, those with higher shear span ratios exhibited higher values. This took place primarily because the relative slippage between the reinforced concrete wall panel of the prefabricated web and the encasing C-shaped steel in the specimens with higher shear span ratios consumed more energy. At larger displacements, the values showed varying trends due to the differing failure modes of the specimens.
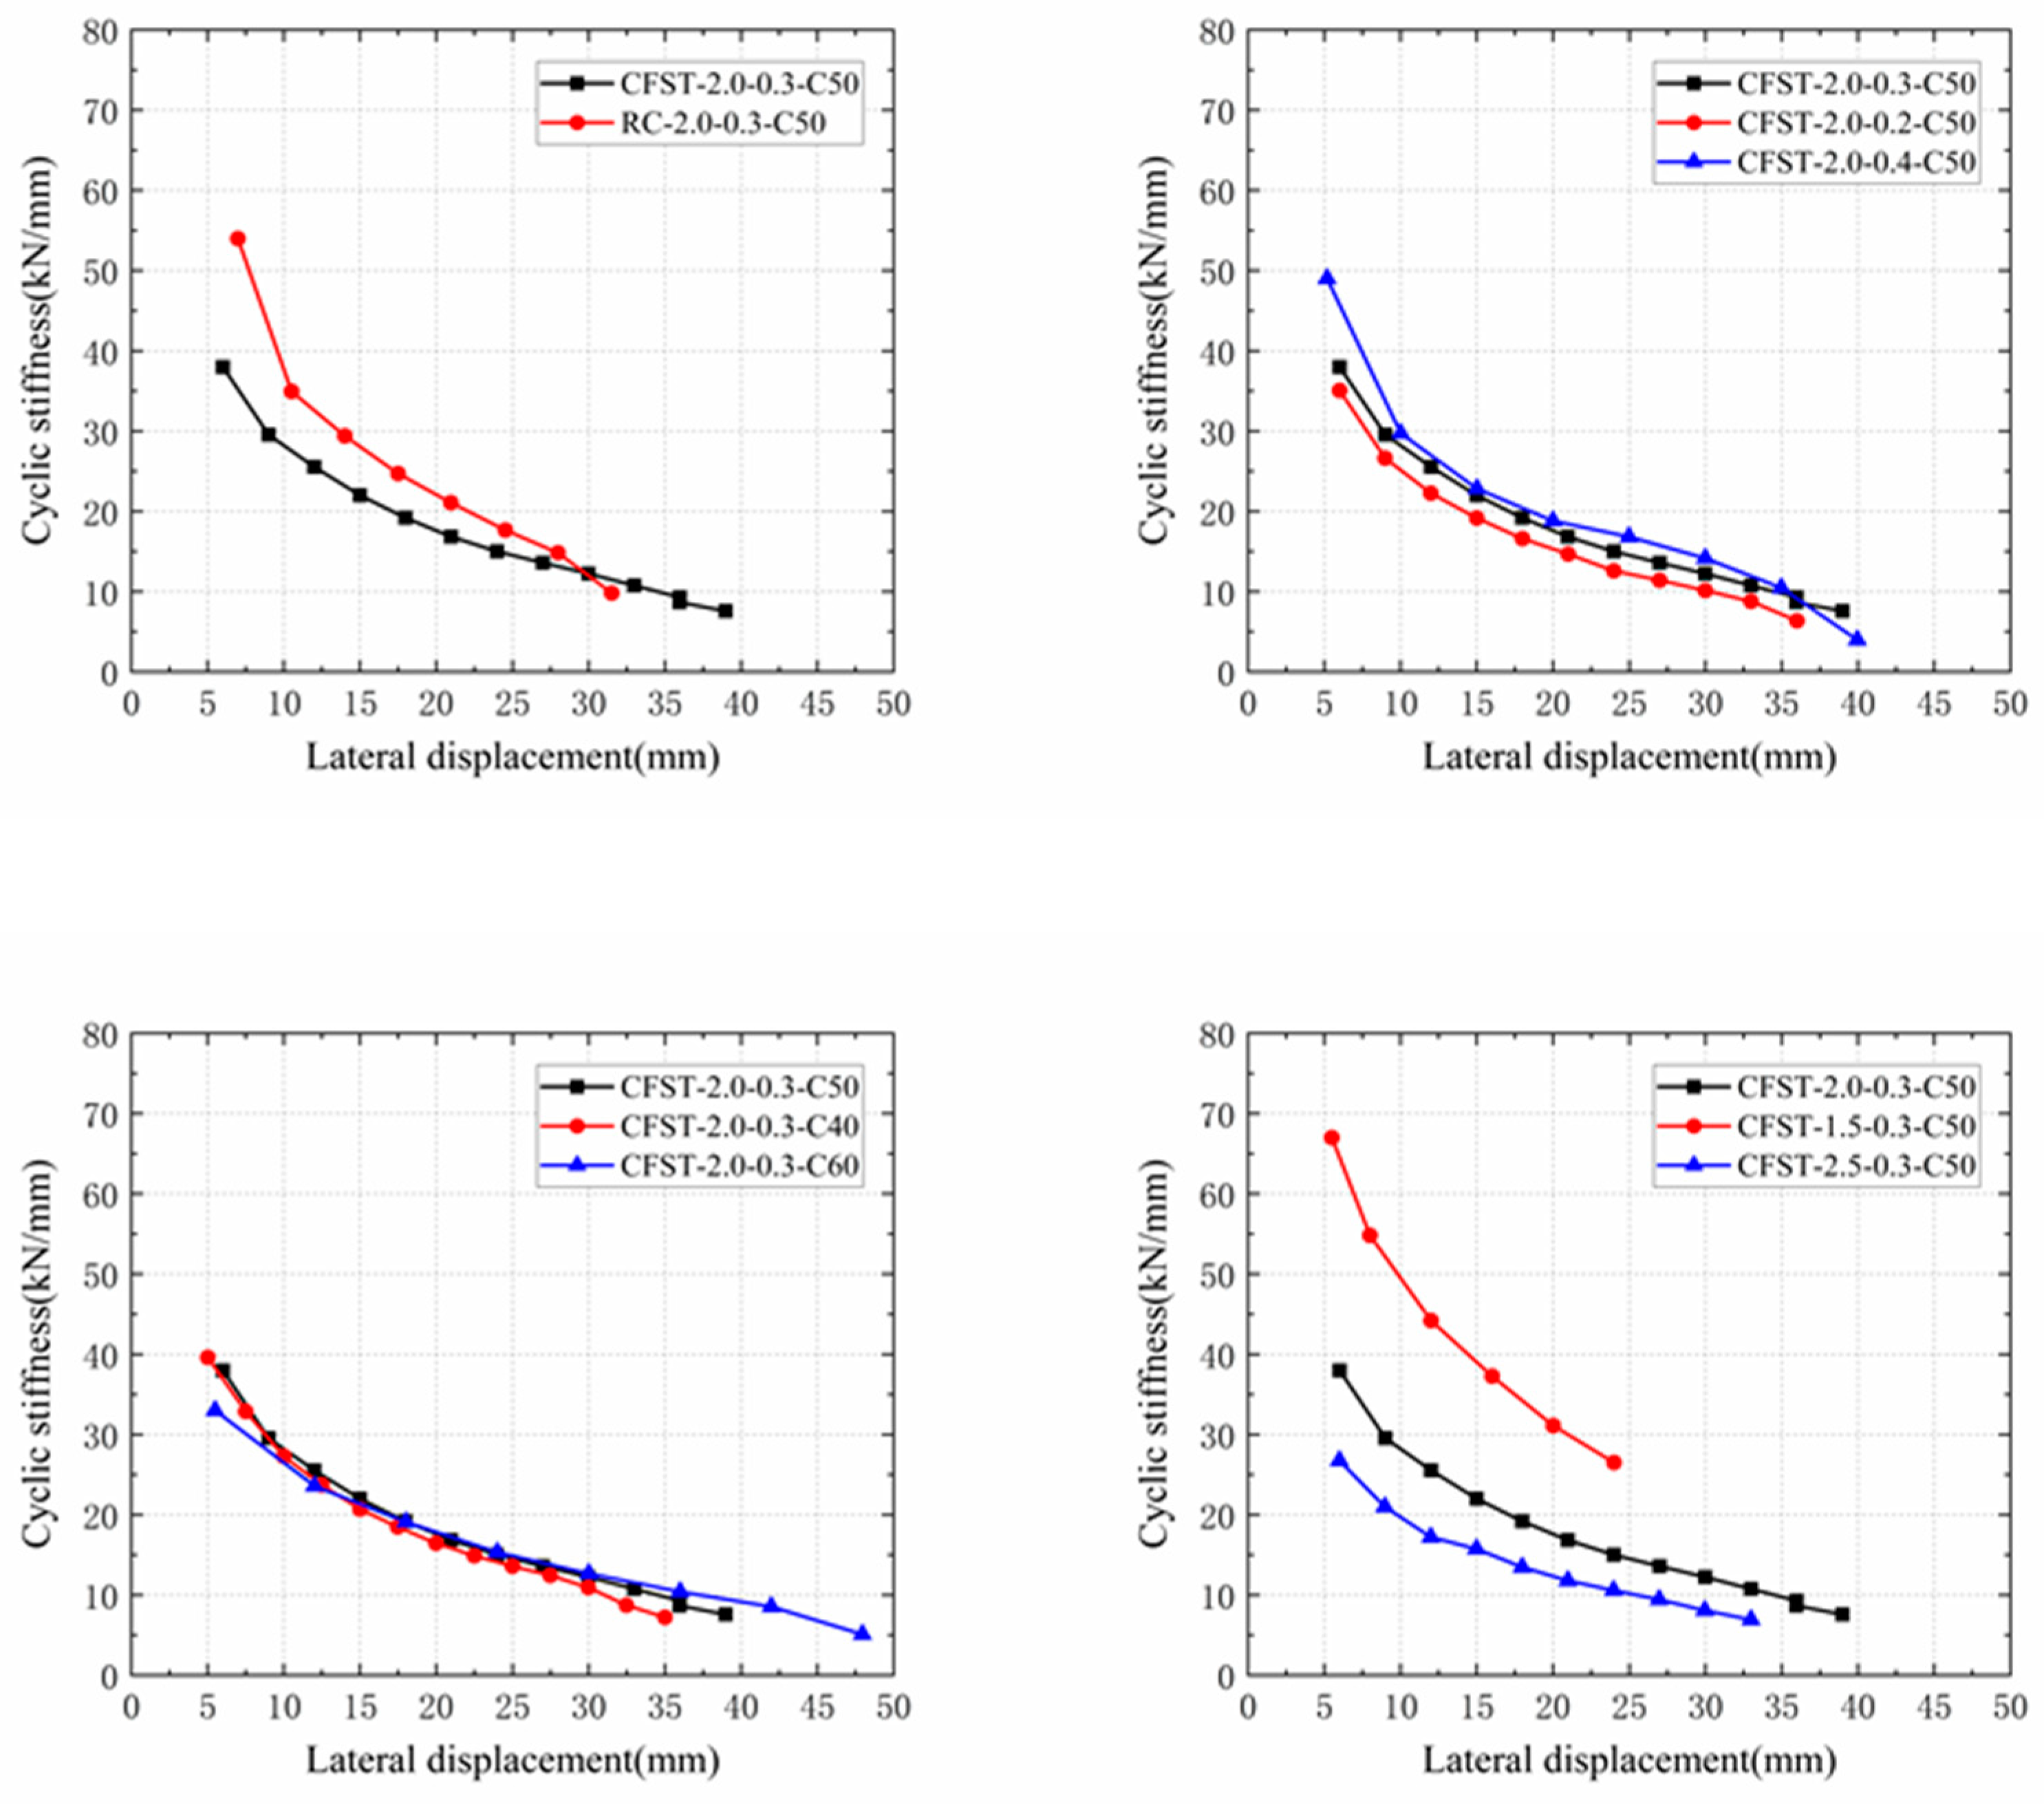
3.5. Stiffness Degradation
- (1)
- The sinusoidal stiffness of the RC-2.0-0.3-C50 specimen was found to be higher than that of the CFST-2.0-0.3-C50 specimen during the early-to-mid stages of displacement loading. However, the stiffness of the RC-2.0-0.3-C50 specimen decreased more rapidly as displacement increased.
- (2)
- The stiffness degradation curves of CRCSW-CFSTs were largely consistent across different axial compression ratios and concrete strengths, indicating that these factors had minimal impact on the stiffness degradation of CRCSW-CFSTs.
- (3)
- The CFST-1.5-0.3-C50 specimen exhibited the highest positive stiffness during displacement loading but also experienced the most rapid decrease in rigidity as displacement increased. However, the CFST-2.5-0.3-C50 specimen displayed the opposite behavior, indicating that an increase in the shear span ratio improved the positive stiffness of CRCSW-CFSTs while slowing the rate of stiffness reduction with increasing load displacement.
3.6. Strain
3.7. Deformation
4. Conclusions
- (1)
- The failure modes of CRCSW-CFSTs differ from those observed in RCSWs. The prefabricated web was subjected to diagonal compressive loads under cyclic loading, while the CFST frame columns experienced bending and shear forces. The final failure mode was influenced by factors such as the axial compression ratio, concrete strength, and shear span ratio, leading to three main scenarios: 1. Tearing in the low-plasticity region of the CFST frame columns, with minimal or no cracking in the prefabricated web. 2. Tearing in the low-plasticity region of the CFST frame columns, accompanied by severe cracking and crushing in the prefabricated web. 3. Minor bulging at the base of the CFST frame columns, along with cracking and significant crushing in the prefabricated web.
- (2)
- The weld seam remained intact throughout the test, demonstrating the reliability of the welded connection.
- (3)
- As the axial compression ratio increased, crack development in the prefabricated web increased, while damage to the CFST frame columns decreased. Increasing the axial compression ratio from 0.2 to 0.3 and 0.4 raised the peak load of CRCSW-CFSTs by 21.8% and 45%, respectively, but reduced the peak displacement by 9.73% and 16.44%. Additionally, as the axial compression ratio increased, the stiffness before peak load improved, while both the ultimate displacement and ductility coefficient declined. Moreover, strength degradation accelerated after exceeding peak load.
- (4)
- An increase in concrete strength from C30 to C40 and C50 raised the peak loads of CRCSW-CFSTs by 9.33% and 14.58%, respectively, and enhanced the ultimate displacements by 9.79% and 31.1%. Meanwhile, the yield capacity and stiffness remained relatively unchanged.
- (5)
- Increasing the shear span ratio from 1.5 to 2.0 and 2.5 reduced the yield load of CRCSW-CFSTs by 41.22% and 59.25%, respectively, while the peak displacement increased by 12.6% and 25.1%, respectively. Additionally, the stiffness of CRCSW-CFSTs decreased with a higher shear-to-span ratio, though the rate of stiffness reduction slowed as displacement increased.
- (6)
- In the initial loading stages, the energy dissipation capacity of the shear wall primarily resulted from minor relative slippage between the prefabricated reinforced concrete panel and the encasing C-shaped steel.
Author Contributions
Funding
Data Availability Statement
Conflicts of Interest
References
- Huang, Z.; Zhang, S.; Guo, L. Cyclic behavior of low shear-span ratio dovetailed profiled steel–concrete composite shear walls. J. Build. Eng. 2022, 59, 105094. [Google Scholar] [CrossRef]
- Rahnavard, R.; Hassanipour, A.; Mounesi, A. Numerical study on important parameters of composite steel-concrete shear walls. J. Constr. Steel Res. 2016, 121, 441–456. [Google Scholar] [CrossRef]
- Dan, D.; Fabian, A.; Stoian, V.J.E.S. Nonlinear behavior of composite shear walls with vertical steel encased profiles. Eng. Struct. 2011, 33, 2794–2804. [Google Scholar] [CrossRef]
- Nie, X.; Wang, J.J.; Tao, M.X.; Fan, J.S.; Bu, F.M. Experimental study of flexural critical reinforced concrete filled composite plate shear walls. Eng. Struct. 2019, 197, 109439. [Google Scholar] [CrossRef]
- Dan, D.; Fabian, A.; Stoian, V. Theoretical and experimental study on composite steel–concrete shear walls with vertical steel encased profiles. J. Constr. Steel Res. 2011, 67, 800–813. [Google Scholar] [CrossRef]
- Xu, K.Y.; Xu, D.; Wang, X.T.; Wang, T.; Yan, J.; Yan, J.B. Seismic behaviors of steel truss-embedded steel-concrete composite shear walls. J. Build. Eng. 2022, 49, 104112. [Google Scholar] [CrossRef]
- Lou, G.B.; Chen, P.X.; Zheng, J.H. Seismic performance of high-strength steel plate-concrete composite shear walls. J. Build. Eng. 2024, 82, 108258. [Google Scholar] [CrossRef]
- Wang, J.; Zhou, T.; Wu, H.; Guan, Y.; Zhang, L. Cyclic performance of steel frame fabricated with cold-formed steel composite wall structure. Eng. Struct. 2022, 270, 114892. [Google Scholar] [CrossRef]
- Ke, X.J.; Liu, L.Z.; Chen, S.J.; Li, N. Study on bearing capacity of T-shaped steel plate reinforced concrete composite shear wall. In Structures; Elsevier: Amsterdam, The Netherlands, 2024; Volume 67. [Google Scholar]
- Chen, S.; Peng, X.; Lin, C.; Zhang, Y.; Hu, H.; He, Z. Experimental and analytical studies of prefabricated composite steel shear walls under low reversed cyclic loads. Materials 2022, 15, 5737. [Google Scholar] [CrossRef]
- Huang, S.T.; Huang, Y.S.; He, A.; Tang, X.L.; Chen, Q.J.; Liu, X.; Cai, J. Experimental study on seismic behaviour of an innovative composite shear wall. J. Constr. Steel Res. 2018, 148, 165–179. [Google Scholar] [CrossRef]
- Pan, Z.; Si, D.; Jiang, S.; Huang, Z.; Meng, S. Numerical and experimental investigation on composite shear walls with different steel layouts. J. Constr. Steel Res. 2024, 219, 108760. [Google Scholar] [CrossRef]
- Yan, J.B.; Yan, Y.Y.; Wang, T. Cyclic tests on novel steel-concrete-steel sandwich shear walls with boundary CFST columns. J. Constr. Steel Res. 2020, 164, 105760. [Google Scholar] [CrossRef]
- Du, Y.; Shi, C.; Zhao, Z.; Zhang, Y.; Li, T. Compressive behavior of an innovative double-steel-plate composite shear wall with iron tailings and recycled aggregate concrete. J. Build. Eng. 2024, 91, 109523. [Google Scholar] [CrossRef]
- Shang, W.; Zhang, L.; Liu, S.; Liu, J. Numerical analysis of CFST-RC composite shear wall under axial compression and cyclic loads. Eur. J. Environ. Civ. Eng. 2023, 27, 3566–3585. [Google Scholar] [CrossRef]
- Xing, Y.; Wang, W.; Ou, Y.; Jiang, X.; Al-azzani, H. Seismic behavior of steel truss and concrete composite shear wall with double X-shaped braces. J. Build. Eng. 2022, 62, 105399. [Google Scholar] [CrossRef]
- Katrangi, M.; Khanmohammadi, M. Experimental Study of Seismic Performance of an Innovative Low-Damage Self-Centering Composite Steel Plate Shear Wall. J. Struct. Eng. 2024, 150, 04023212. [Google Scholar] [CrossRef]
- Wang, W.; Yang, Q.; Deng, X.; Ou, Y.; Jiang, X. Experimental and numerical study on seismic behavior of special shaped steel truss and concrete composite shear wall. Eng. Struct. 2024, 300, 117237. [Google Scholar] [CrossRef]
- Zhou, Y.; Lu, X.; Dong, Y. Seismic behaviour of composite shear walls with multi-embedded steel sections. Part I: Experiment. Struct. Des. Tall Spec. Build. 2010, 19, 618–636. [Google Scholar] [CrossRef]
- Liao, F.Y.; Han, L.H.; Tao, Z. Performance of reinforced concrete shear walls with steel reinforced concrete boundary columns. Eng. Struct. 2012, 44, 186–209. [Google Scholar] [CrossRef]
- Zhou, J.; Fang, X.; Jiang, Y. Cyclic behavior of concrete-encased high-strength concrete-filled steel tube composite walls: An experiment. Struct. Concr. 2021, 22, 691–708. [Google Scholar] [CrossRef]
- Kisa, M.H.; Yuksel, S.B.; Caglar, N. Experimental study on hysteric behavior of composite shear walls with steel sheets. J. Build. Eng. 2021, 33, 101570. [Google Scholar] [CrossRef]
- Olabi, M.N.; Caglar, N.; Kisa, M.H.; Yuksel, S.B. Numerical study on the response of composite shear walls with steel sheets under cyclic loading. J. Build. Eng. 2021, 34, 102069. [Google Scholar] [CrossRef]
- Lu, X.; Zhang, Y.; Zhang, H.; Zhang, H.; Xiao, R. Experimental study on seismic performance of steel fiber reinforced high strength concrete composite shear walls with different steel fiber volume fractions. Eng. Struct. 2018, 171, 247–259. [Google Scholar] [CrossRef]
- Zhang, J.; Li, X.; Cao, W.; Yu, C. Seismic behavior of composite shear walls incorporating high-strength materials and CFST boundary elements. Eng. Struct. 2020, 220, 110994. [Google Scholar] [CrossRef]
- Yin, F.; Cao, W.L.; Wang, R.W.; Weng, H.F.; Liu, Y.B. Seismic behavior of prefabricated concrete filled steel tube-bordered monolayer reinforced shear wall. J. Constr. Steel Res. 2022, 194, 107328. [Google Scholar] [CrossRef]
- Chen, Z.; Mohammed, A.; Du, Y.; Mashrah WA, H.; Zhao, B.; Huang, J. Experimental and numerical study on seismic performance of square and l-shaped Concrete-filled steel tubes column Frame-Buckling steel plate shear walls. Eng. Struct. 2023, 274, 115155. [Google Scholar] [CrossRef]
- Hou, J.; Guo, L.; Zhong, H.; Gao, S.; Chen, J. Hysteretic behavior of partially buckling-restrained steel plate shear walls with coupled restraining steel tubes. Eng. Struct. 2023, 276, 115388. [Google Scholar] [CrossRef]
- Bian, J.; Cao, W.; Dong, H.; Chen, J. Seismic research of prefabricated CFST frame with various H-steel frame shear walls. J. Build. Eng. 2022, 57, 104971. [Google Scholar] [CrossRef]
- Shi, Y.; Luo, Z.; Xu, Y.; Zou, Y.; Xu, L.; Ma, Q. Experimental study on the seismic behavior of high-performance cold-formed steel plate shear walls. Eng. Struct. 2022, 251, 113552. [Google Scholar] [CrossRef]
- GB 50010-2010; Code for Design of Concrete Structures. China Ministry of Construction: Beijing, China, 2015. (In Chinese)
- JGJ 138-2016; Code for Design of Composite Structures. China Ministry of Construction: Beijing, China, 2016. (In Chinese)
- JGJ 55-2011; Specification for Mix Proportion Design of Ordinary Concrete. China Ministry of Construction: Beijing, China, 2011. (In Chinese)
- GB/T 50080-2016; Standard for Test Method of Performance on Ordinary Fresh Concrete. China Ministry of Construction: Beijing, China, 2016. (In Chinese)
- Shafighfard, T.; Kazemi, F.; Asgarkhani, N.; Yoo, D.Y. Machine-learning methods for estimating compressive strength of high-performance alkali-activated concrete. Eng. Appl. Artif. Intell. 2024, 136, 109053. [Google Scholar] [CrossRef]
- GB Z 38434-2019; Metallic Materials-Guide to Test Pieces Preparation for Mechanical Testing. China Ministry of Construction: Beijing, China, 2019. (In Chinese)
- GB/T228.1-2021; Metallic Materials-Tensile Testing-Part 1: Method of Test at Room Temperature. China Ministry of Construction: Beijing, China, 2021. (In Chinese)
- JGJ T 101-2015; Specification for Seismic Test of Buildings. China Ministry of Construction: Beijing, China, 2015. (In Chinese)
- Wang, W.; Wang, Y.; Lu, Z. Experimental study on seismic behavior of steel plate reinforced concrete composite shear wall. Eng. Struct. 2018, 160, 281–292. [Google Scholar] [CrossRef]
- Zhang, W.; Wang, K.; Chen, Y.; Ding, Y. Experimental study on the seismic behaviour of composite shear walls with stiffened steel plates and infilled concrete. Thin-Walled Struct. 2019, 144, 106279. [Google Scholar] [CrossRef]
- Wang, J.J.; Nie, X.; Bu, F.M.; Tao, M.X.; Fan, J.S. Experimental study and design method of shear-dominated composite plate shear walls. Eng. Struct. 2020, 215, 110656. [Google Scholar] [CrossRef]
- Mo, J.; Uy, B.; Li, D.; Thai, H.T.; Tran, H. A review of the behaviour and design of steel–concrete composite shear walls. In Structures; Elsevier: Amsterdam, The Netherlands, 2021; Volume 31. [Google Scholar]
- Wang, W.; Song, J.; Hou, M.; Liu, G.; Wang, W. Experimental study and numerical simulation of replaceable corrugated steel plate-concrete composite shear walls. Soil Dyn. Earthq. Eng. 2019, 127, 105827. [Google Scholar] [CrossRef]
- Zheng, L.; Zheng, Y. Seismic behaviour of concrete-filled steel tubular column and precast shear wall connections. In Structures; Elsevier: Berlin/Heidelberg, Germany, 2020; Volume 27. [Google Scholar]


| Specimens | Shear Span Ratio | Axial Compression Ratio | Type of Concrete |
|---|---|---|---|
| RC-2.0-0.3-C50 | 2.0 | 0.3 | C50 |
| CFST-2.0-0.3-C50 | 2.0 | 0.3 | C50 |
| CFST-2.0-0.2-C50 | 2.0 | 0.2 | C50 |
| CFST-2.0-0.4-C50 | 2.0 | 0.4 | C50 |
| CFST-2.0-0.3-C40 | 2.0 | 0.3 | C40 |
| CFST-2.0-0.3-C60 | 2.0 | 0.3 | C60 |
| CFST-1.5-0.3-C50 | 1.5 | 0.3 | C50 |
| CFST-2.5-0.3-C50 | 2.5 | 0.3 | C50 |
| Types of Concrete | Ultimate Pressure (kN) | Compressive Strength (MPa) | Axial Compressive Strength (MPa) |
|---|---|---|---|
| C40 | 981 | 43.6 | 29.16 |
| C50 | 1329 | 59.10 | 38.24 |
| C60 | 1533 | 68.12 | 43.72 |
| Types | Yield Strength (MPa) | Ultimate Strength (MPa) | Elastic Modulus (×105 MPa) | Yield Strain (×10−6) |
|---|---|---|---|---|
| Bar Ø 6 | 532 | 695 | 1.99 | 2673 |
| Bar Ø 14 | 395 | 576 | 2.03 | 1945 |
| 2 mm | 272 | 384 | 2.06 | 1175 |
| 5 mm | 330 | 375 | 2.03 | 1856 |
| Specimen | Py (kN) | Δy (mm) | Pm (kN) | Δm (mm) | Pu (kN) | Δu (mm) | E (kN·m) | μ |
|---|---|---|---|---|---|---|---|---|
| RC-2.0-0.3-C50 | 397 | 10.8 | 440 | 17.3 | 374 | 32.2 | 120.1 | 2.97 |
| CFST-2.0-0.3-C50 | 313 | 10.9 | 375 | 26.9 | 319 | 37.0 | 177.0 | 3.39 |
| CFST-2.0-0.2-C50 | 256 | 9.8 | 308 | 29.8 | 262 | 37.0 | 114.4 | 3.77 |
| CFST-2.0-0.4-C50 | 366 | 11.0 | 448 | 24.9 | 381 | 34.5 | 132.3 | 3.14 |
| CFST-2.0-0.3-C40 | 280 | 11.0 | 343 | 27.5 | 292 | 33.7 | 128.6 | 3.06 |
| CFST-2.0-0.3-C60 | 341 | 16.9 | 393 | 29.9 | 334 | 44.2 | 125.5 | 2.64 |
| CFST-1.5-0.3-C50 | 544 | 11.1 | 638 | 23.9 | 542 | 27.4 | 60.1 | 2.47 |
| CFST-2.5-0.3-C50 | 220 | 10.6 | 260 | 29.9 | 221 | 33.2 | 108.5 | 3.15 |
Disclaimer/Publisher’s Note: The statements, opinions and data contained in all publications are solely those of the individual author(s) and contributor(s) and not of MDPI and/or the editor(s). MDPI and/or the editor(s) disclaim responsibility for any injury to people or property resulting from any ideas, methods, instructions or products referred to in the content. |
© 2024 by the authors. Licensee MDPI, Basel, Switzerland. This article is an open access article distributed under the terms and conditions of the Creative Commons Attribution (CC BY) license (https://creativecommons.org/licenses/by/4.0/).
Share and Cite
Dou, L.; Huang, Z.; Liu, Y.; Wang, Y.; Zhao, L. Experimental Investigation on the Seismic Performance of Novel Prefabricated Composite RC Shear Walls with Concrete-Filled Steel Tube Frame. Buildings 2024, 14, 2673. https://doi.org/10.3390/buildings14092673
Dou L, Huang Z, Liu Y, Wang Y, Zhao L. Experimental Investigation on the Seismic Performance of Novel Prefabricated Composite RC Shear Walls with Concrete-Filled Steel Tube Frame. Buildings. 2024; 14(9):2673. https://doi.org/10.3390/buildings14092673
Chicago/Turabian StyleDou, Lijun, Ziheng Huang, Yuxi Liu, Yuhao Wang, and Lei Zhao. 2024. "Experimental Investigation on the Seismic Performance of Novel Prefabricated Composite RC Shear Walls with Concrete-Filled Steel Tube Frame" Buildings 14, no. 9: 2673. https://doi.org/10.3390/buildings14092673