Article

Prediction of Ultra-High-Performance Concrete (UHPC) Properties Using Gene Expression Programming (GEP)

1
School of Civil Engineering, Changsha University of Science & Technology, Changsha 410000, Hunan, China
2
Department of Civil Engineering, College of Engineering, University of Hafr Al Batin, Hafr Al Batin 39524, Saudi Arabia
3
Department of Civil Engineering, Jubail Industrial College, Royal Commission of Jubail, Jubail Industrial City 31961, Saudi Arabia
4
Department of Electrical Engineering, College of Engineering, University of Hafr Al Batin, Hafr Al Batin 39524, Saudi Arabia
5
School of Civil Engineering, Southeast University, Nanjing 210096, China
*
Authors to whom correspondence should be addressed.
Buildings 2024, 14(9), 2675; https://doi.org/10.3390/buildings14092675
Submission received: 19 July 2024 / Revised: 20 August 2024 / Accepted: 23 August 2024 / Published: 28 August 2024
(This article belongs to the Section Building Materials, and Repair & Renovation)

Abstract

:
In today’s digital age, innovative artificial intelligence (AI) methodologies, notably machine learning (ML) approaches, are increasingly favored for their superior accuracy in anticipating the characteristics of cementitious composites compared to typical regression models. The main focus of current research work is to improve knowledge regarding application of one of the new ML techniques, i.e., gene expression programming (GEP), to anticipate the ultra-high-performance concrete (UHPC) properties, such as flowability, flexural strength (FS), compressive strength (CS), and porosity. In addition, the process of training a model that predicts the intended outcome values when the associated inputs are provided generates the graphical user interface (GUI). Moreover, the reported ML models that have been created for the aforementioned UHPC characteristics are simple and have limited input parameters. Therefore, the purpose of this study is to predict the UHPC characteristics while taking into account a wide range of input factors (i.e., 21) and use a GUI to assess how these parameters affect the UHPC properties. This input parameters includes the diameter of steel and polystyrene fibers (µm and mm), the length of the fibers (mm), the maximum size of the aggregate particles (mm), the type of cement, its strength class, and its compressive strength (MPa) type, the contents of steel and polystyrene fibers (%), and the amount of water (kg/m3). In addition, it includes fly ash, silica fume, slag, nano-silica, quartz powder, limestone powder, sand, coarse aggregates, and super-plasticizers, with all measurements in kg/m3. The outcomes of the current research reveal that the GEP technique is successful in accurately predicting UHPC characteristics. The obtained R2, i.e., determination coefficients, from the GEP model are 0.94, 0.95, 0.93, and 0.94 for UHPC flowability, CS, FS, and porosity, respectively. Thus, this research utilizes GEP and GUI to accurately forecast the characteristics of UHPC and to comprehend the influence of its input factors, simplifying the procedure and offering valuable instruments for the practical application of the model’s capabilities within the domain of civil engineering.

1. Introduction

Ultra-high-performance concrete (UHPC) is a new type of concrete that is developed based on four principles: i. improving the microstructure; ii. reducing porosity; iii. enhancing toughness; and iv. increasing homogeneity [1,2,3]. It is commonly recognized that UHPC has much greater strength (>150 MPa), excellent toughness, and durability [4,5]. Hence, UHPC could be employed as a structural precast element in bridges and other components from industry to build structures that are lightweight, robust, flexible, and visually appealing [6,7]. To achieve higher UHPC properties, minimal w/c ratios, greater contents of cement, silica fume, fine quartz powders, etc., well-graded aggregates, and high-range water-reducing admixtures are used to obtain the lowest possible porosity with good consolidation and flow, as well as higher particle packing densities [8,9,10]. Recently, various research has been carried out to determine the mechanical properties of UHPC, utilizing various additives and mix designs [11,12,13,14,15]. Nano-silica was shown to improve the early-age strength of UHPC by accelerating the hydration process and refining the pore structure [16]. Liu et al. [17] demonstrated that incorporating fine quartz powder into UHPC formulations significantly increased the compressive strength and reduced the shrinkage potential. Kang et al. [18] investigated the effects of water-reducing admixtures on the rheology and mechanical properties of UHPC, finding that optimal dosages enhanced both workability and compressive strength. Researchers have focused on the use of environmentally acceptable supplemental cementitious materials (SCMs), such as ground granulated blast slag furnaces (GGBS) and fly ash (FA). Because of its brittle nature, plain UHPC may have limited applications [7,19,20,21,22]. As a result, various fibers such as steel and artificial fibers have been added frequently to composite materials to improve their ductility and impact resistance [23,24]. Numerous researchers investigated reinforcing UHPC with steel, synthetic, or natural fibers to improve properties like hardness, ductility, fatigue resistance, and the ability to stop fractures from spreading. UHPC is reinforced with steel fibers to improve its toughness and resistance to post-cracking phenomena. Nevertheless, studies have also shown that fibers have little effect on increasing UHPC’s compressive strength; instead, the degree of cement hydration and the density of the matrix particle packing play a more important role in the development of UHPC’s strength. These study results bring attention to the lack of knowledge in predicting the behavior of UHPCs with various mixing ingredients. Thus, modelling is required to establish a relationship between the input parameters and outcomes [25].
The recent advances in artificial intelligence (AI) have made machine learning (ML) techniques an intriguing modelling tool that can be used to a wide range of scientific areas, including materials engineering. Accordingly, the employment of ML approaches is currently trending for predicting concrete characteristics. Multiple applications such as regression, classification, correlation, and clustering may be executed with the help of these applications [26,27,28,29,30]. Thus, it is become easier now to predict the properties of concrete due to said progression in ML approaches [31,32,33]. The GB ML technique was employed by Marani et al. [34] for predicting UHPC strength. This research was performed in less time, i.e., prediction of 28-days strength. The study resulted in precise prediction of UHPC compressive strength having an R2 value of 0.96. In order to ascertain the impact of lithium-slag on the characteristics of cementitious mortar, Lu et al. [35] used the support vector machine (SVM) modelling approach. This led to an 11% improvement in SVM’s prediction performance when compared to other ML models. In the similar manner, Solhmirzaei et al. [36] also documented the successful prediction of SVM modelling for UHPC beam shear capacity. GEP is a version of GP that is credited to Ferreira [37] for its initial presentation. GEP is based on the population generation hypothesis, which integrates linear chromosomes of a predetermined length with parse trees during modelling. GEP is an improvement on GP, which encrypts a small-scale program using simple, rigid-length chromosomes. One advantage of GEP is its capacity to produce mathematical formulas that precisely predict intricate and nonlinear problems [38,39].
Thus, using AI-based machine learning (ML) techniques can assist in resolving a variety of complicated problems in various civil engineering domains [40,41]. By taking into account a dataset of input variables, machine learning techniques can be utilized to forecast the final outcome [40]. Similarly, a GEP ML approach is used in this work to predict UHPC characteristics. Chaabene et al. [42] used machine learning algorithms to forecast the mechanical properties of concrete. Likewise, the characteristics of different concrete types, such as self-healing concrete [43], phase change materials-integrated concrete [44], high-performance concrete (HPC) [45,46,47,48,49], recycled aggregate concrete (RAC) [50,51,52,53], etc. have also been assessed using the ML techniques reported in the literature. Han et al. [46] employed ML approaches to predict HPC flowability. The input variables included coarse aggregates, cement, sand, water, age, fly ash, and GGBFS, as well as five variable combinations. The developed models anticipated the highly precise flowability of HPC. In this manner, the use of machine learning methods to assess concrete characteristics serves as a foundation for future studies to save time and money.
Zhu et al. [54] utilized interpretable models to predict the creep behavior of UHPC, training them on experimental datasets with features selected for their relevance to creep behavior. The models were validated using cross-validation techniques, with performance assessed through metrics such as R2 and MSE, ensuring accuracy and reliability. Similarly, Pishro et al. [55] introduced a hybrid machine learning approach that combined classical modeling techniques with machine learning algorithms to enhance the prediction accuracy of bond stress–slip models in UHPC structures, evaluating the model’s robustness using RMSE, R2, and additional statistical methods. Ullah et al. [56] highlighted the use of machine learning techniques like artificial neural networks (ANN), support vector machines (SVM), and decision trees for modelling UHPC’s mechanical properties, with accuracy validated by cross-validation and quantified through R2, MSE, and RMSE. Pishro et al. [57] also introduced a Parallel Micro Element System integrated with Physics-Informed Neural Networks (PINN) to predict bond stress–slip behavior under monotonic loading. Additionally, Li et al. [58] employed random forest (RF), support vector machine (SVM), and k-nearest neighbor (KNN) to predict UHPC compressive strength. The models were trained on experimental data and validated using cross-validation methods. The performance was assessed using MSE, RMSE, and R2. Thus, these statistical metrics like MSE, RMSE, and R2 are important to evaluate the performance of models.
UHPC has transformed the construction industry with its superior mechanical properties and durability, but accurately predicting and optimizing these properties remains a significant challenge due to the complexity of its formulations. Therefore, a new, simplified equation set has been generated using Gene Expression Programming (GEP), a machine learning approach, to predict and assess the efficacy of forecasting various UHPC properties. Historically, there has been a lack of graphical user interfaces (GUIs) tailored explicitly for predicting UHPC properties. This novel GUI enhances accessibility and usability, making the prediction process more intuitive and efficient for researchers and practitioners. Traditional methods for predicting UHPC properties have relied heavily on complex, often opaque models that are difficult to interpret. The benefits of GEP for predicting UHPC properties include increased accuracy through complex algorithmic analysis, improved efficiency by automating model generation, adaptability to diverse datasets and formulations, interpretability of generated models, and robust generalization capabilities across different scenarios. Meanwhile, the significance of the new GUI lies in its accessibility, user-friendliness, incorporation of data visualization features, and customization options, all of which collectively contribute to simplifying the prediction process and broadening the utility of predictive models for UHPC properties in construction projects. This study focuses on the prediction of essential UHPC properties, including flowability, compressive strength, flexural strength, and porosity. The input dataset used for model training and validation encompasses a wide range of variables relevant to UHPC formulations, such as the diameter of steel and polystyrene fibers (µm and mm), the length of the fibers (mm), the maximum size of aggregate particles (mm), the type of cement, its strength class, and the compressive strength (MPa) type, the contents of steel and polystyrene fibers (%), and water (kg/m3). In addition, it includes fly ash, silica fume, slag, nano-silica, quartz powder, limestone powder, sand, coarse aggregates, and super-plasticizers. In summary, the combination of GEP-based predictive models and the newly developed GUI represents a significant advancement in the field of UHPC research and application. By leveraging advanced machine learning techniques and user-friendly interfaces, this innovative approach offers enhanced accuracy, efficiency, and accessibility for predicting and optimizing UHPC properties in the construction industry. Thus, this new approach addresses existing gaps in the literature and provides a powerful tool for predicting and optimizing UHPC properties.

2. Gene Expression Programming (GEP)

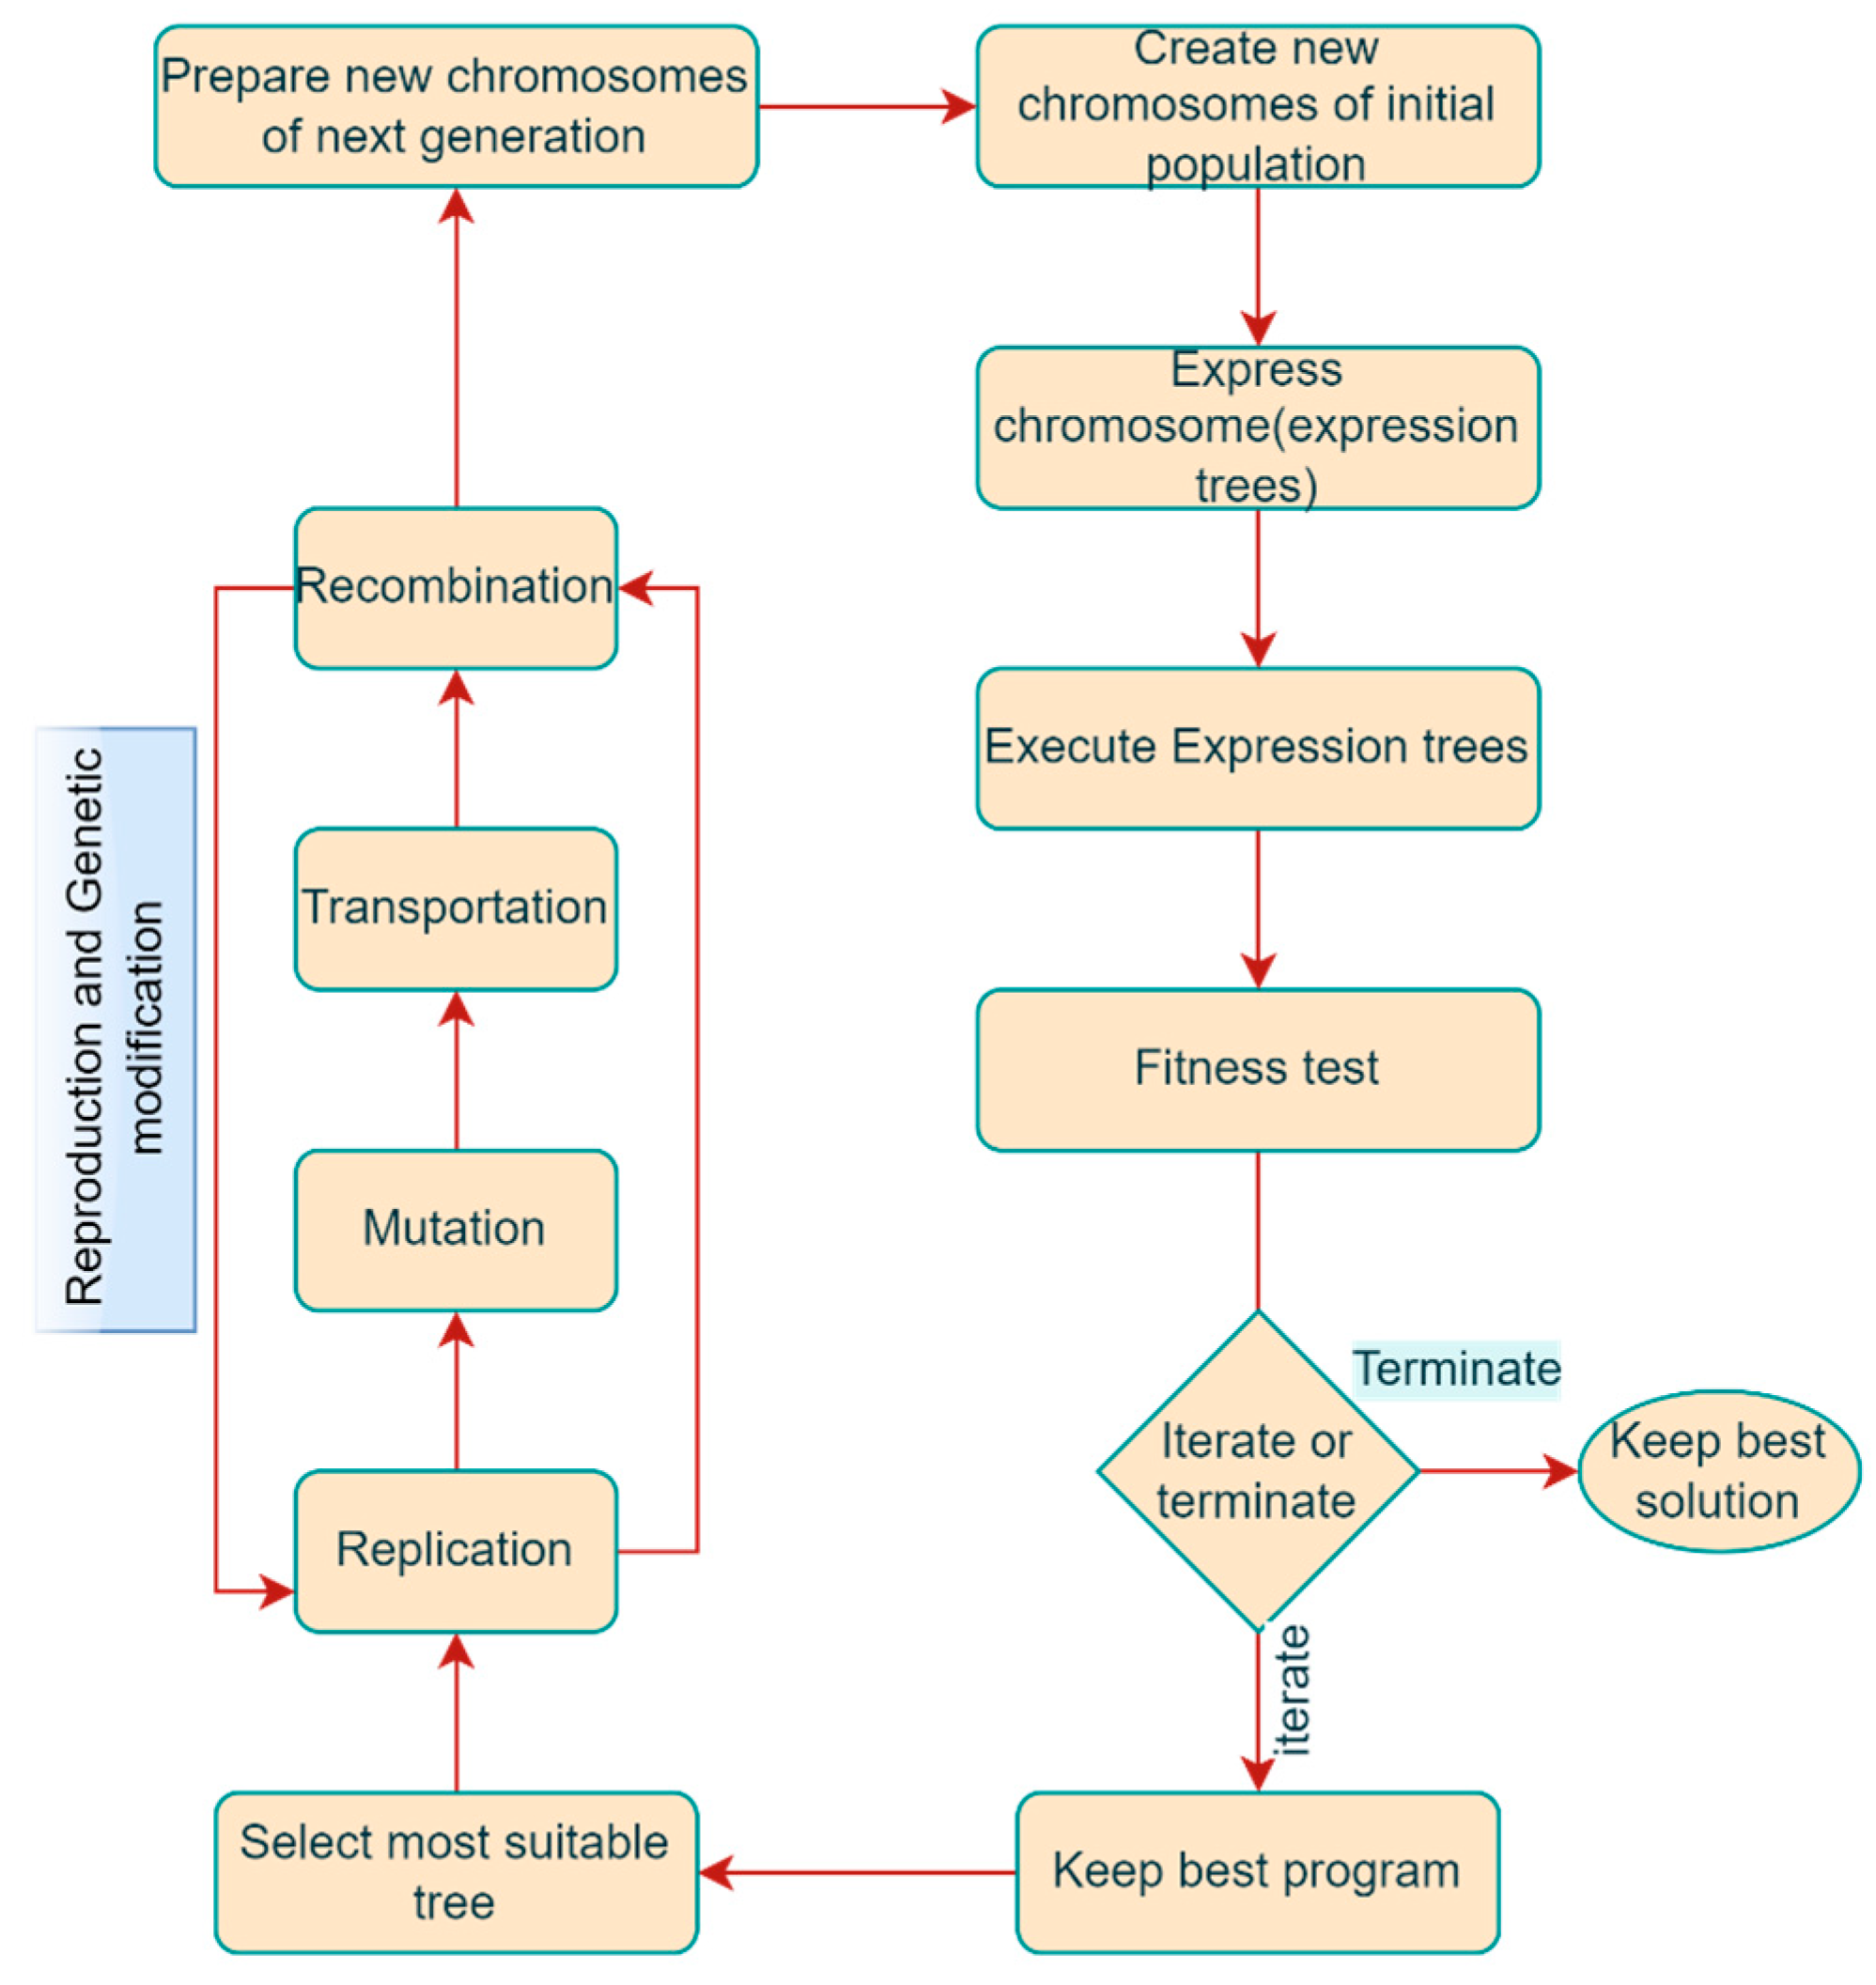
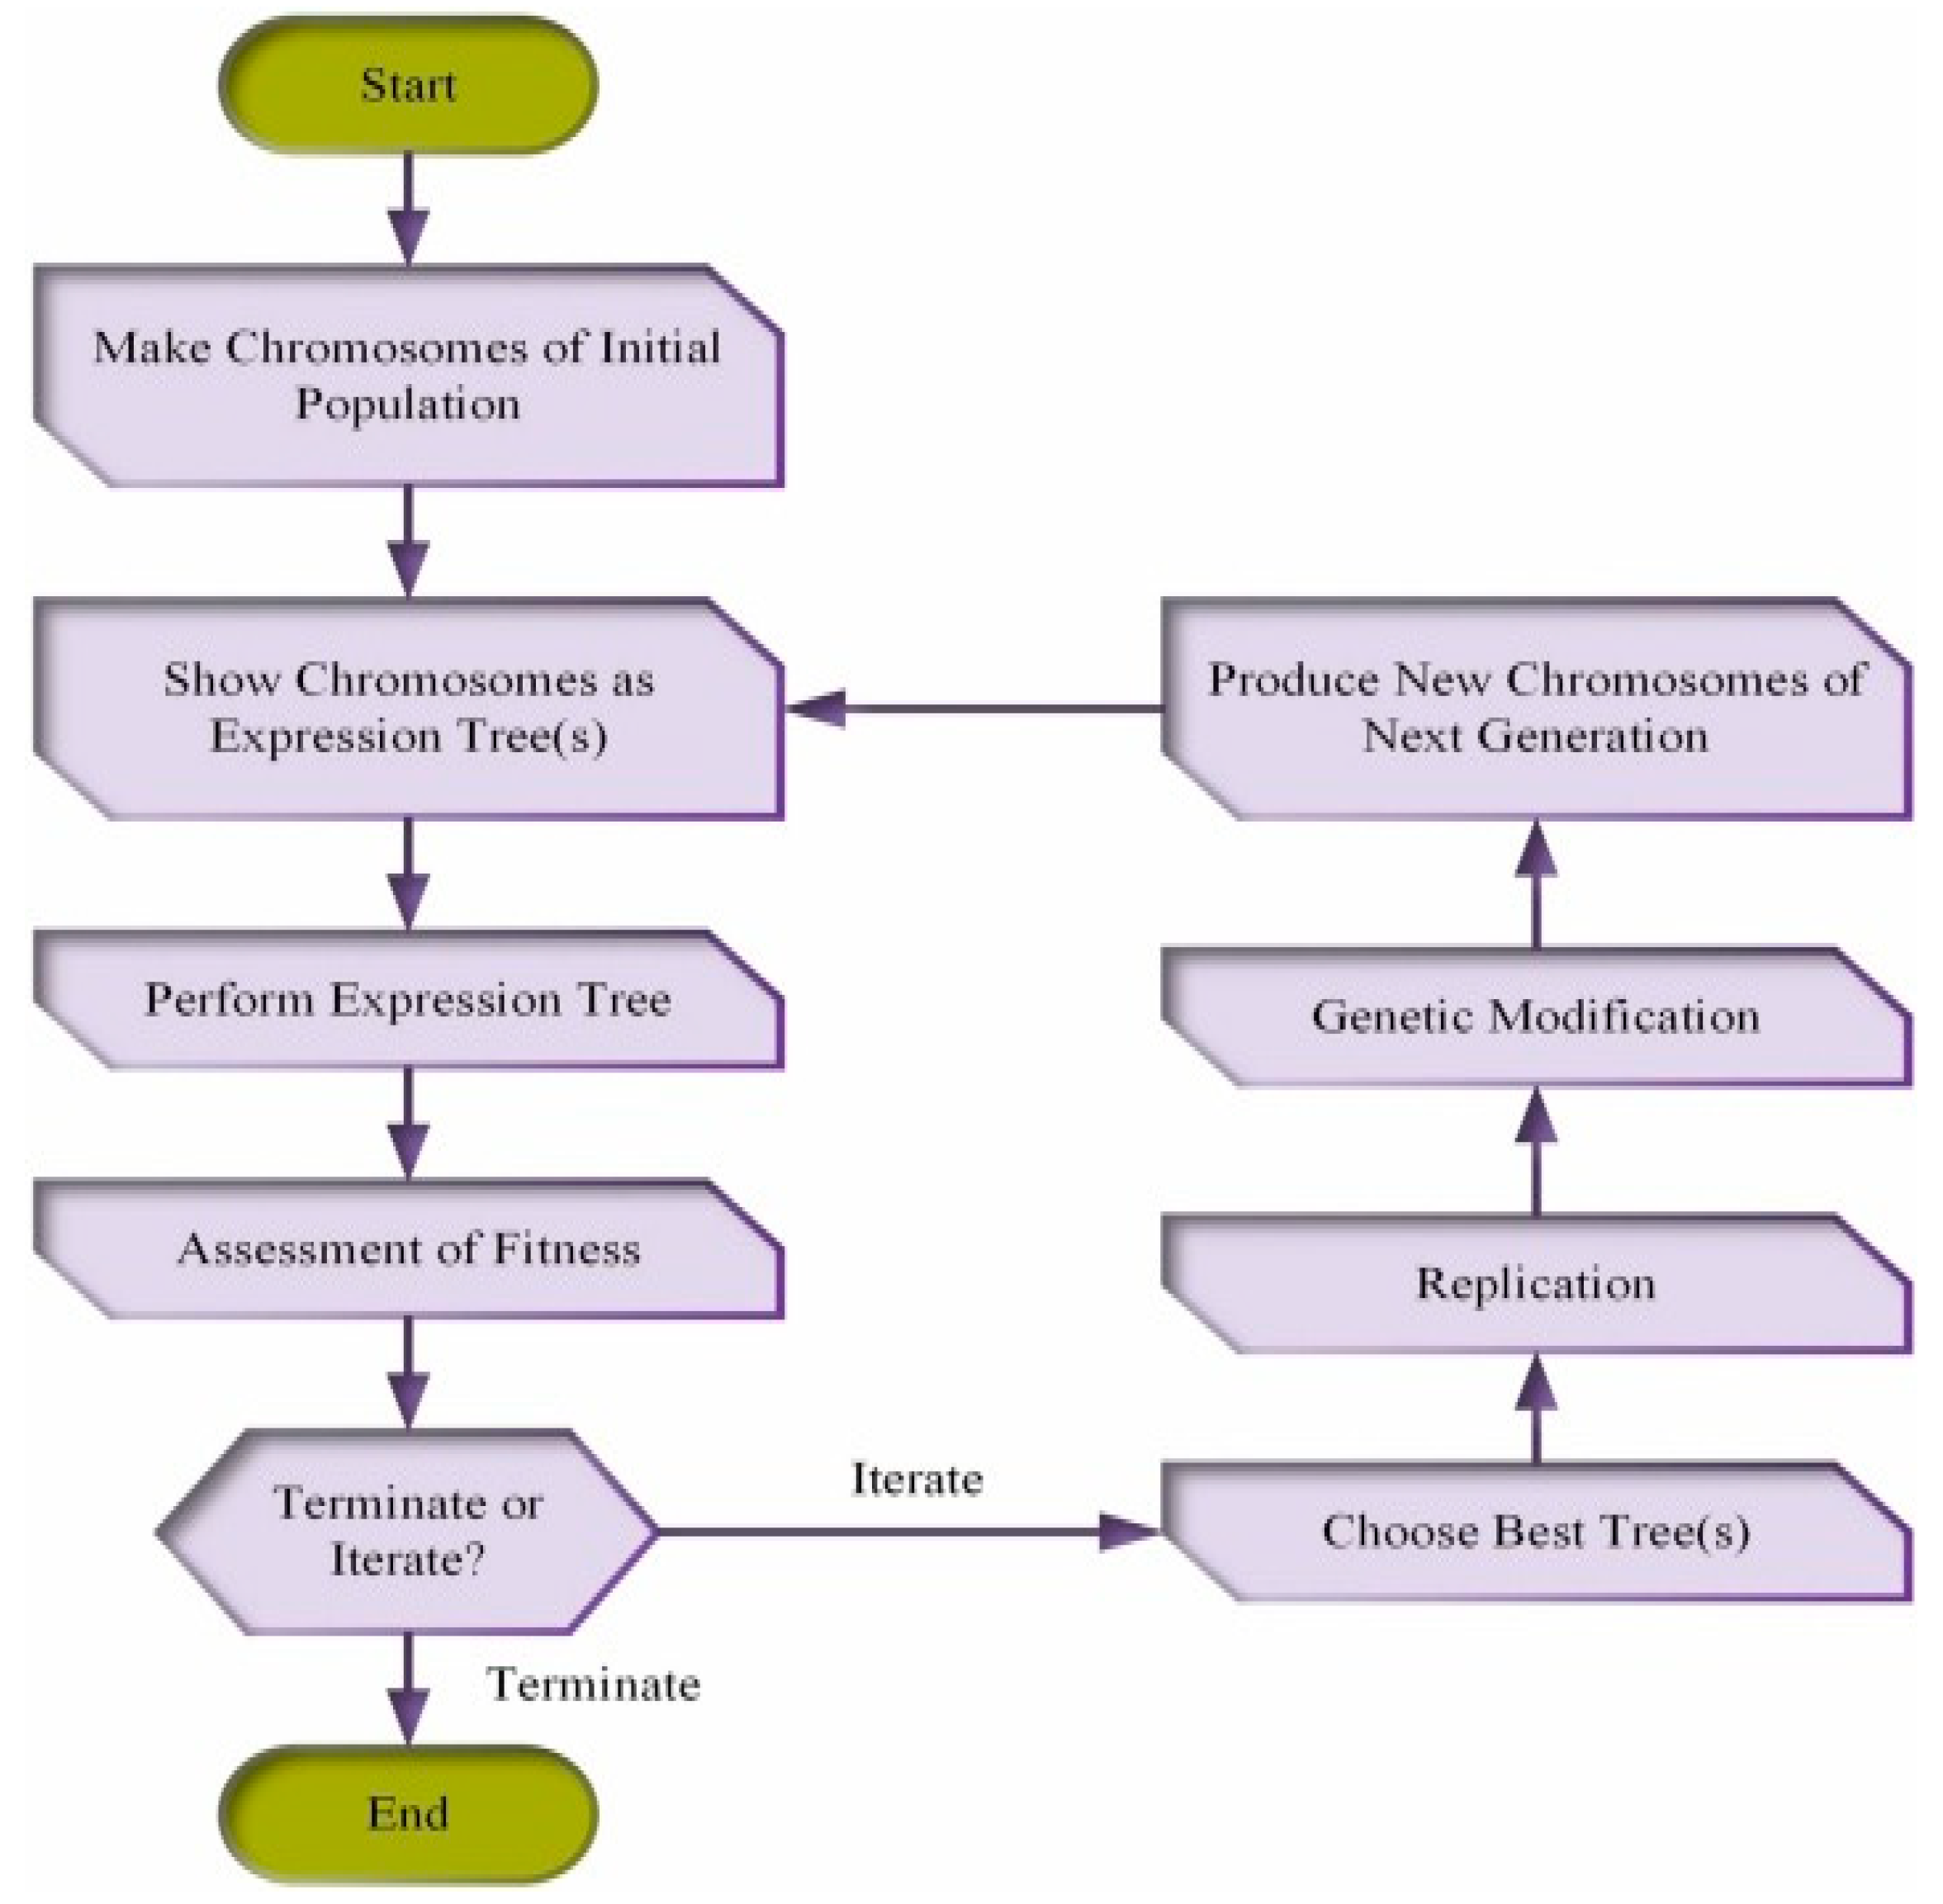
2.1. Overview of GEP ML Technique

The genetic algorithm (GA) was developed by Holland [59] and was based on evolution of Darwin’s theory. A series of GAs demonstrates how the genetic process evolves, whereas fixed-length chromosomes show how it resolves. Koza and Koza [60] also proposed gene programming (GP) as an alteration to genetic algorithm (GA). GP is a versatile method for resolving issues that autonomously develops a model through the process of genetic evolution, without being restricted to any specific field [61]. GP is a flexible method because nonlinear structures like parse trees swap fixed-length binary strings. A developed machine intelligence program is based on certainly occurring genetic characteristics (i.e., mutation, reproduction, and cross-over) [62]. It handles reproduction-related issues following the Darwinian theory [37]. The goal of GP is to remove the programs that produce the lowest fitness during the reproduction phase. Trees at the execution stage are shown as the trees with the lowest fitness are terminated, and the remaining trees are used to replenish the population using the chosen mechanism. Nonetheless, the model’s early convergence is safeguarded by the process of evolution [62,63]. The GP approach specifies five key parameters: the set of crucial measurements and input parameters, basic domain functions, fitness evaluation, primary functional operators (population size, cross-over, etc.), and the outcomes are ascertained using the techniques employed for termination criteria [62]. Although GP generates a model automatically, a cross-over genetic processor generates the vast majority of the parse trees [60]. Creating nonlinear GP forms necessitates serving as a phenotype as well as a genotype, which results in complex expressions for desirable attributes [37].
GEP is a version of GP that is attributed to Ferreira [37] for its initial presentation. GEP is based on the population generation hypothesis, which integrates linear chromosomes of a predetermined length with parse trees during modelling. GEP is an advancement of GP, which encrypts a small-scale program using simple, rigid-length chromosomes. One advantage of GEP is its capacity to produce mathematical formulas that precisely predict intricate and nonlinear problems [38,39]. All other specified parameters, including the finish set, end conditions, and fitness function, are assigned to the same values as in GP. Chromosomes with certain numbers are generated randomly throughout the GEP algorithm’s execution after being identified as such using the “Karva” language. GEP uses a line of a specific length. However, GP takes into account parse trees of different size when processing data in programming. These distinctive strings are initially preprogrammed as fixed-length genomes, and then they are characterized as nonlinear expression/parse trees with branched forms that represent chromosomes in various sizes and shapes [62,64]. Furthermore, there is a separate encoding of certain genotypes and some phenotypes [37]. The fact that the genome is simply passed on linearly to the next generation—there is no structural mutation or duplication—is one advantage of GEP.
A normal chromosome is made up of its head and tail. Therefore, another amazing characteristic is the formation of things from a particular chromosome with many genes [62]. These genes include conditional functions, final sets, fixed-length variables, arithmetic operations, mathematical functions, and Boolean logic functions. A genetic code operator establishes a causal relationship between a cell and its associated function. These chromosomes include all of the information needed to produce empirical formulas, which are retrieved and deduced using a novel language called Karva. Beginning with Karva, the leading revolution moves through the expression tree (ET) with the string. According to Equation (1), when nodes are moved from the lowest layer to the bottom, ET records them [38]. The variation in the number of ETs can affect the scope of the GEP gene and the K-expression’s length.
E T G E P = log ( i 3 j )
GEP is a complex ML method because its output is not based on any preexisting relationships. Figure 1 depicts the many phases required for the creation and evolution of equations involving mathematics in GEP. Each individual has chromosomes that are fixed in length from birth. After that, these chromosomes are classified as ETs and each person’s health is evaluated. The most physically fit person is chosen to procreate. The optimum solution is attained because of the iterative procedure of these best-fit individuals. Three genetic functions, mutation, cross-over, and breeding, are finally carried out to obtain the ultimate mathematical expression.

2.2. Employed Methodology for GEP ML Technique

The data used to predict the properties of UHPC were sourced from the literature [66]. Preprocessing was done including normalizing features and selecting relevant variables to improve model performance. Gene Expression Programming (GEP) was used to train the model on the processed data, with validation ensuring accurate predictions of UHPC. Models developed through genetic programming (GP) are solely dependent on genetic evaluation. Regression and neural approaches are the foundation of the GP technique. Even though GP is significantly better than conventional methods, it can nevertheless produce straightforward statements without assuming the base form. Regression requires the definition of a few functions, followed by their analysis. It is not required to pre-define functions when using this machine learning technique, which looks for an expression that matches the experimental results and adds or subtracts different parameter combinations. GEP is thought to be an improvement over earlier methods [67]. The result of GEP is selected using appropriate mathematical equations that are very applicable and accurately. Its unique and multigenic property enables the construction of even the most intricate systems. Parse trees (GP) and basic linear chromosomes of fixed length (GA) are both used in GEP. Similar to those in the GP are the parameters that need to be specified. The majority of the data used to create GEP models are collected, and adding more data points might increase the model’s accuracy and dependability. GEP has recently been used to solve complicated engineering problems by supplying the most straightforward equations that fit the obtained database. Genes are connected by linking functions (+, −, ×, ÷) in the GEP model. Adding more genes increases the complexities of the GEP model while improving its precision. Two datasets are used in the creation of the GEP model: training data and validation data. Usually, training data are used to build the GEP model, while validation data are used to check and confirm the GEP Model. Typically, the accuracy of the GEP model is statistically validated using an appropriate fitness function. Before developing the GEP model, each gene represents an expression with a variety of functions and constants that can be selected. The GEP model can be illustrated using a variety of coding languages, such as C++, VBA (Excel), MATLAB, Java, Visual Basic, Expression Tree, and Karva [68]. Various researchers stated that there was a strong agreement between the model’s predictions and the experimental results. Figure 2 shows the diagrammatic illustration of GEP.

3. Dataset Description

3.1. UHPC Flowability

The data used to predict the flowability (FA) of UHPC were obtained from the literature [66] and contained different combinations of 21 input parameters. This dataset encompasses a range of components, including cement content (kg/m3), type and strength of cement, fly ash (kg/m3), slag (kg/m3), silica fume (kg/m3), nano-silica (kg/m3), limestone powder (kg/m3), sand (kg/m3), coarse aggregates (kg/m3), maximum aggregate size (mm), quartz powder (kg/m3), water (kg/m3), super-plasticizers (kg/m3), polystyrene fibers (%), steel fiber (%), and the length (mm) and diameter (µm and mm) of polystyrene and steel fibers. These input variables were utilized to determine various output parameters, including flowability (cm) as shown in Figure 3.
These findings illustrate that flowability in UHPC is influenced by a delicate balance of multiple ingredients, each contributing to the final workability in unique ways. The dataset seems well suited for creating predictive models of UHPC flowability, capturing the intricate interactions between UHPC components. Accurate prediction and optimization of flowability are critical for ensuring that UHPC can be effectively used in specialized applications, such as intricate formworks or structures where mechanical compaction may be challenging. Overall, the relationships between mix components and flowability presented in these plots provide valuable insights for advancing UHPC technology, ensuring that the concrete not only meets the high-performance criteria for strength and durability but is also practical to work with from a placement and finishing standpoint.

3.2. UHPC Compressive Strength

The dataset for predicting the UHPC compressive strength was taken from the literature [66]. It includes 626 mix combinations and 21 input variables (Figure 4). The measured input variables are fly ash content (kg/m3), cement content (kg/m3), silica fume content (kg/m3), nano-silica content (kg/m3), slag content (kg/m3), quartz powder content (kg/m3), sand content (kg/m3), limestone powder content (kg/m3), coarse aggregates content (kg/m3), diameter (mm), length (mm) and content (%) of steel fiber, super-plasticizers content (kg/m3), diameter (µm), length (mm), and content (%) of polystyrene fibers, cement type, water content (kg/m3), cement strength class, cement compressive strength (MPa), curing time (days), and maximum aggregate size (mm). These input components are used to determine output characteristics, i.e., compressive strength (MPa).
These observations suggest that the dataset captures the nuanced impact of these variables on the compressive strength of UHPC, making it suitable for predictive modeling. Such a model would be invaluable in the design phase of UHPC, enabling the fine-tuning of mix proportions to optimize for strength, durability, and cost. The plot’s insights into the relationships between mix components and compressive strength are crucial for enhancing the performance of UHPC in practical scenarios. With its high compressive strength, UHPC becomes an ideal material for a range of applications, from high-rise buildings to bridges and marine structures, where both load-bearing capacity and longevity are critical. Understanding these relationships helps ensure that UHPC not only performs under stress but also meets longevity expectations, which is vital for sustainable construction practices.

3.3. UHPC Flexural Strength

The UHPC dataset used for executing the algorithms for estimating its FS was obtained from the accessible literature [66]. A total of 21 input factors (Figure 5), i.e., fly ash content (kg/m3), cement content (kg/m3), silica fume content (kg/m3), nano-silica content (kg/m3), slag content (kg/m3), quartz powder content (kg/m3), sand content (kg/m3), limestone powder content (kg/m3), coarse aggregates content (kg/m3), diameter (mm), length (mm) and content (%) of steel fiber, super-plasticizers content (kg/m3), diameter (µm), length (mm), and content (%) of polystyrene fibers, cement type, water content (kg/m3), cement strength class, cement compressive strength (MPa), curing time (days), and maximum aggregate size (mm), are taken as output parameters for UHPC flexural strength.
These trends illustrate that the variables captured are relevant and can be used to build predictive models for the flexural strength of UHPC. Such models would be invaluable in optimizing the mix design for specific applications, ensuring that UHPC structures can withstand the stressors of their environment while maintaining longevity. In conclusion, the positive trends in these plots underscore the potential for using this dataset to predict the flexural strength of UHPC, which is critical for designing structures that are both safe and durable. Understanding these relationships allows engineers and designers to push the boundaries of what’s possible with UHPC, leveraging its exceptional properties to create innovative solutions for modern construction challenges.

3.4. UHPC Porosity

Data from the literature [66] were utilized to predict the porosity of UHPC. The dataset contains distinct combinations of the 21 input parameters (as shown in Figure 6). This dataset covers a variety of parameters, comprising cement (kg/m3), silica fume (kg/m3), fly ash (kg/m3), nano-silica (kg/m3), slag (kg/m3), limestone powder (kg/m3), quartz powder (kg/m3), coarse aggregates (kg/m3), maximum aggregate size (mm), super-plasticizers (kg/m3), sand (kg/m3), polystyrene fibers (%), steel fiber (%), water (kg/m3), compressive strength (MPa), strength class, and type of cement. It also includes dimensions like diameter (µm and mm) and length (mm) of steel and polystyrene fibers. Porosity (%) is the output characteristic determined using these input values.
The database demonstrates that the relationship of every factor with the porosity of that UHPC mix is multidimensional and complex. It signifies the applicability of this database to develop precise models for predicting UHPC porosity depending upon the combination of mix parameters and respective interactions. For achieving higher compressive strength of UHPC along with better long-term performance and durability, lesser porosity is a must. Hence, it is important to understand these interactions between input parameters and output characteristics to optimize the mix design for attaining the maximum performance of UHPC for respective applications. Instead of these complex relationships, the database comprises the important information for its optimization and prediction, thus contributing as a valuable source for research and application in UHPC. It recommends that, with the adoption of appropriate modelling technique, this data can be utilized for minimizing porosity to attain the UHPC high-performance characteristics.

4. Results and Analysis

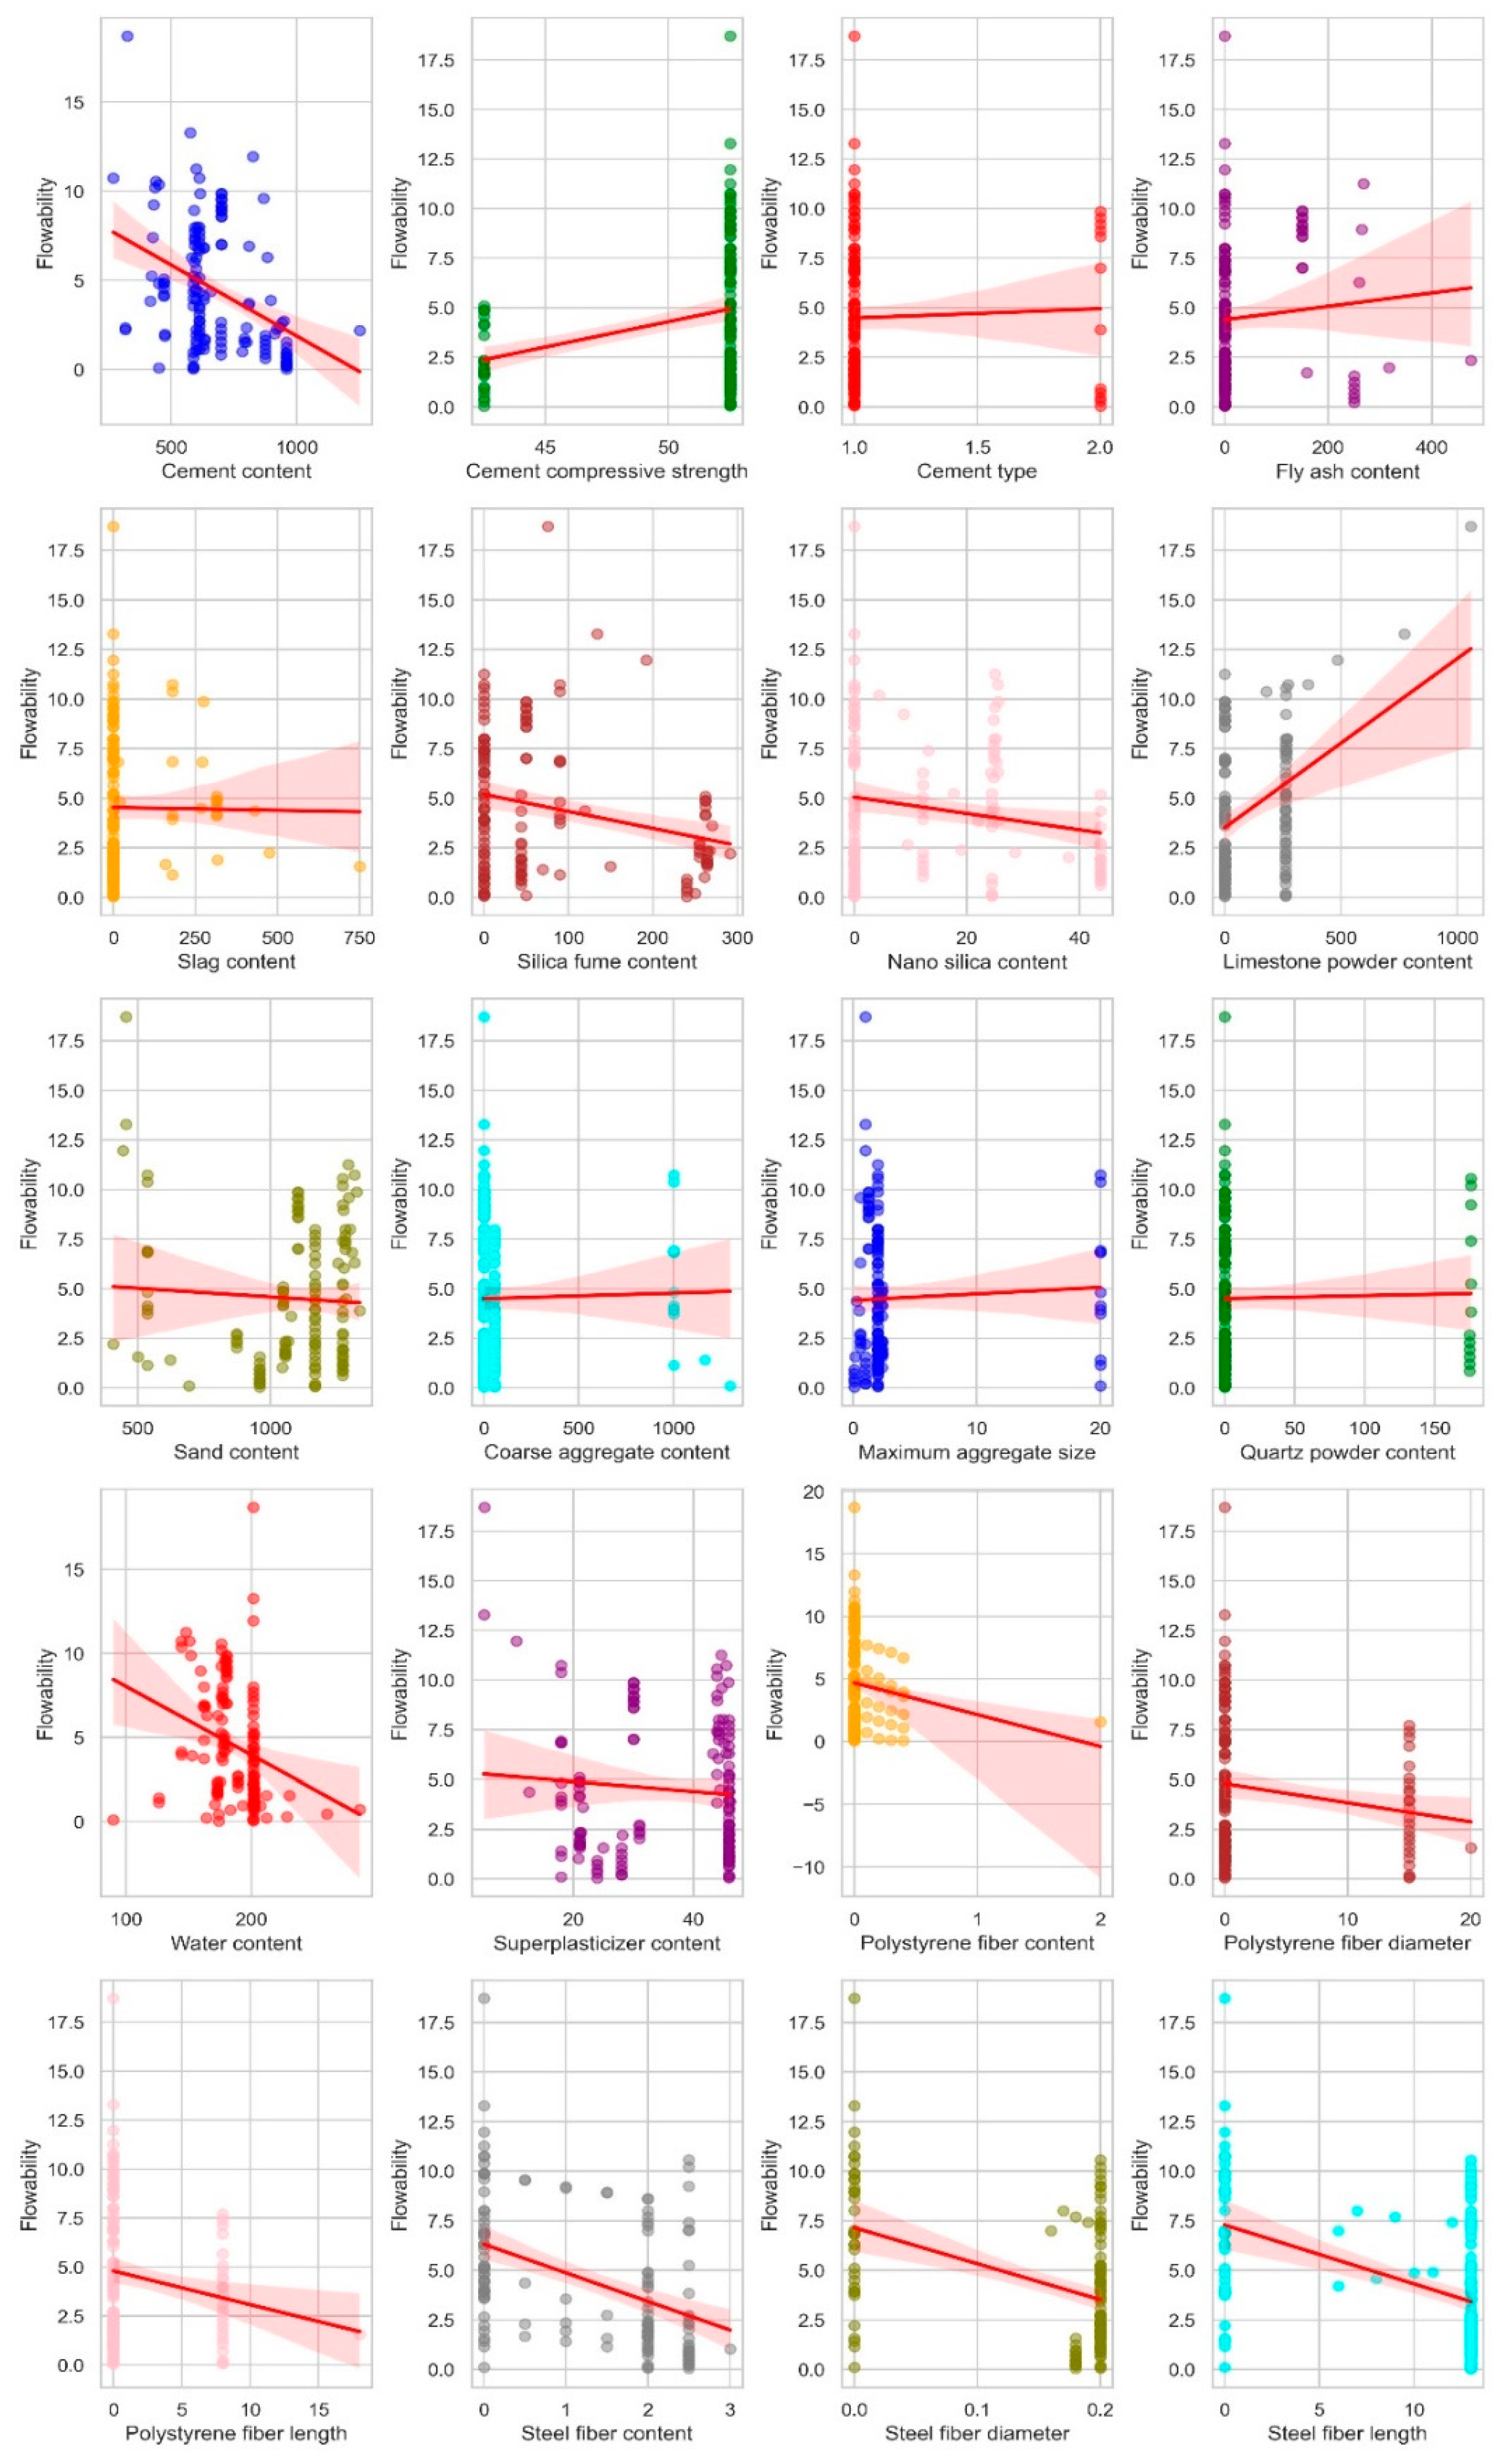
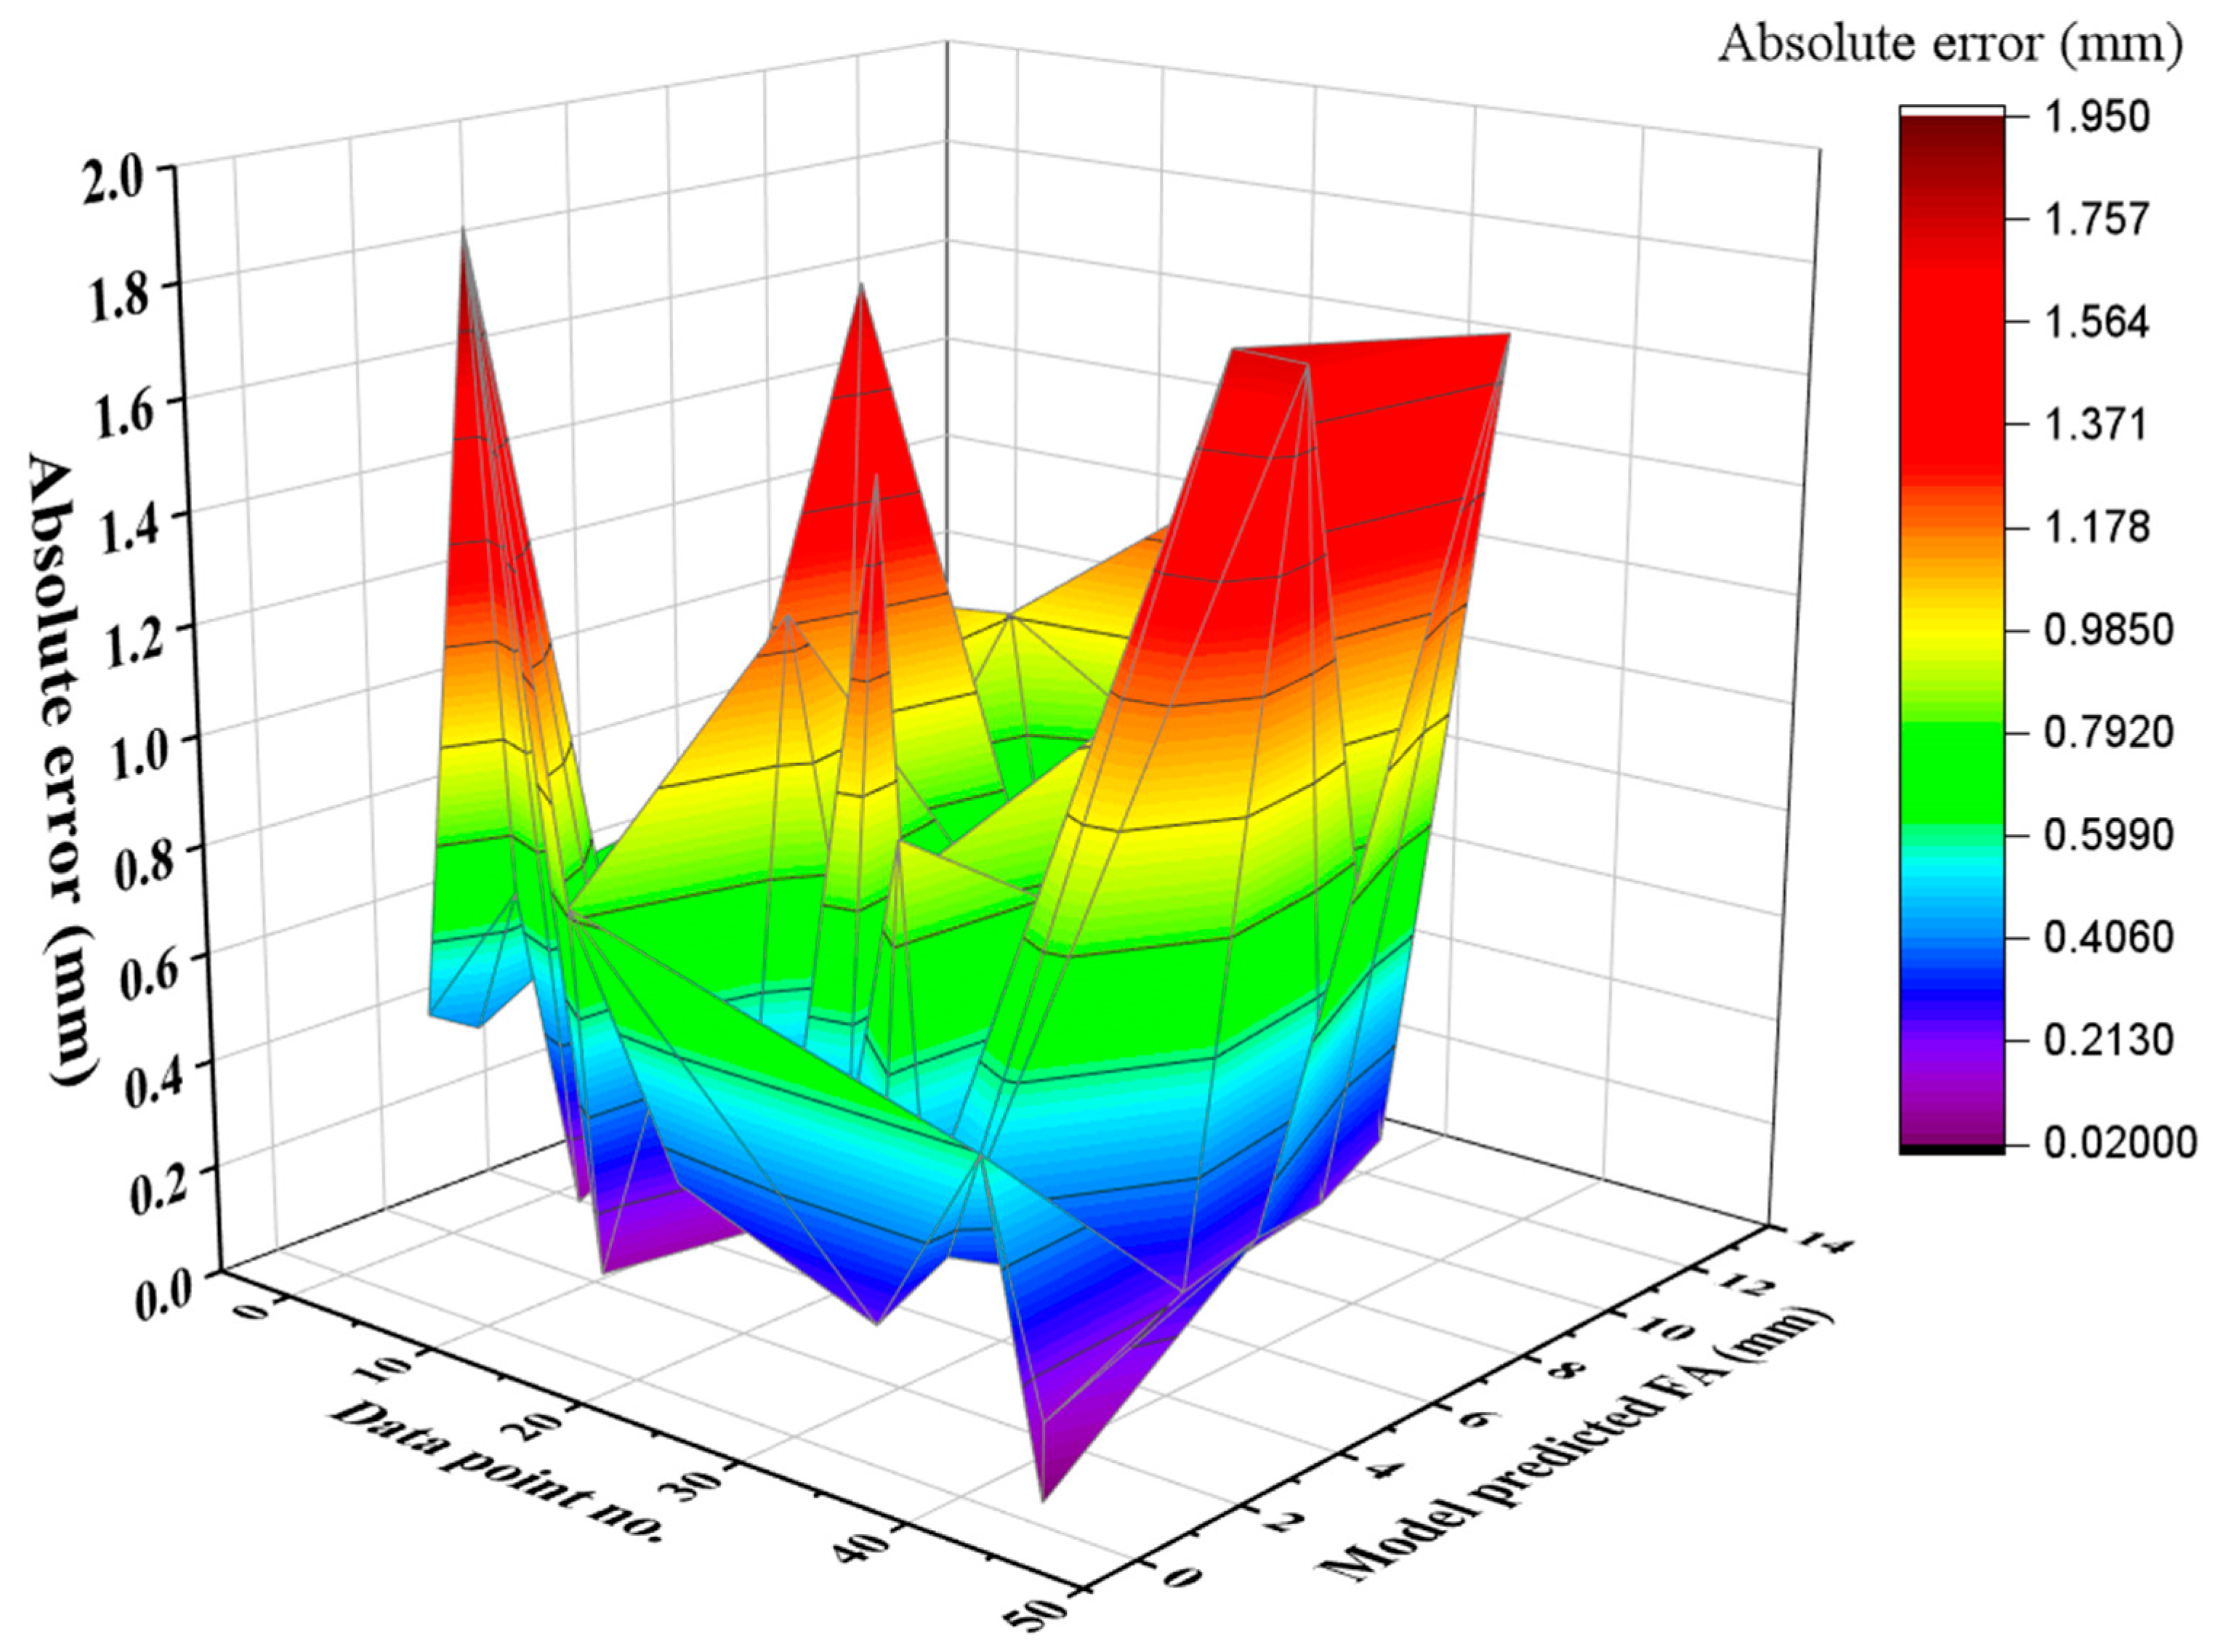
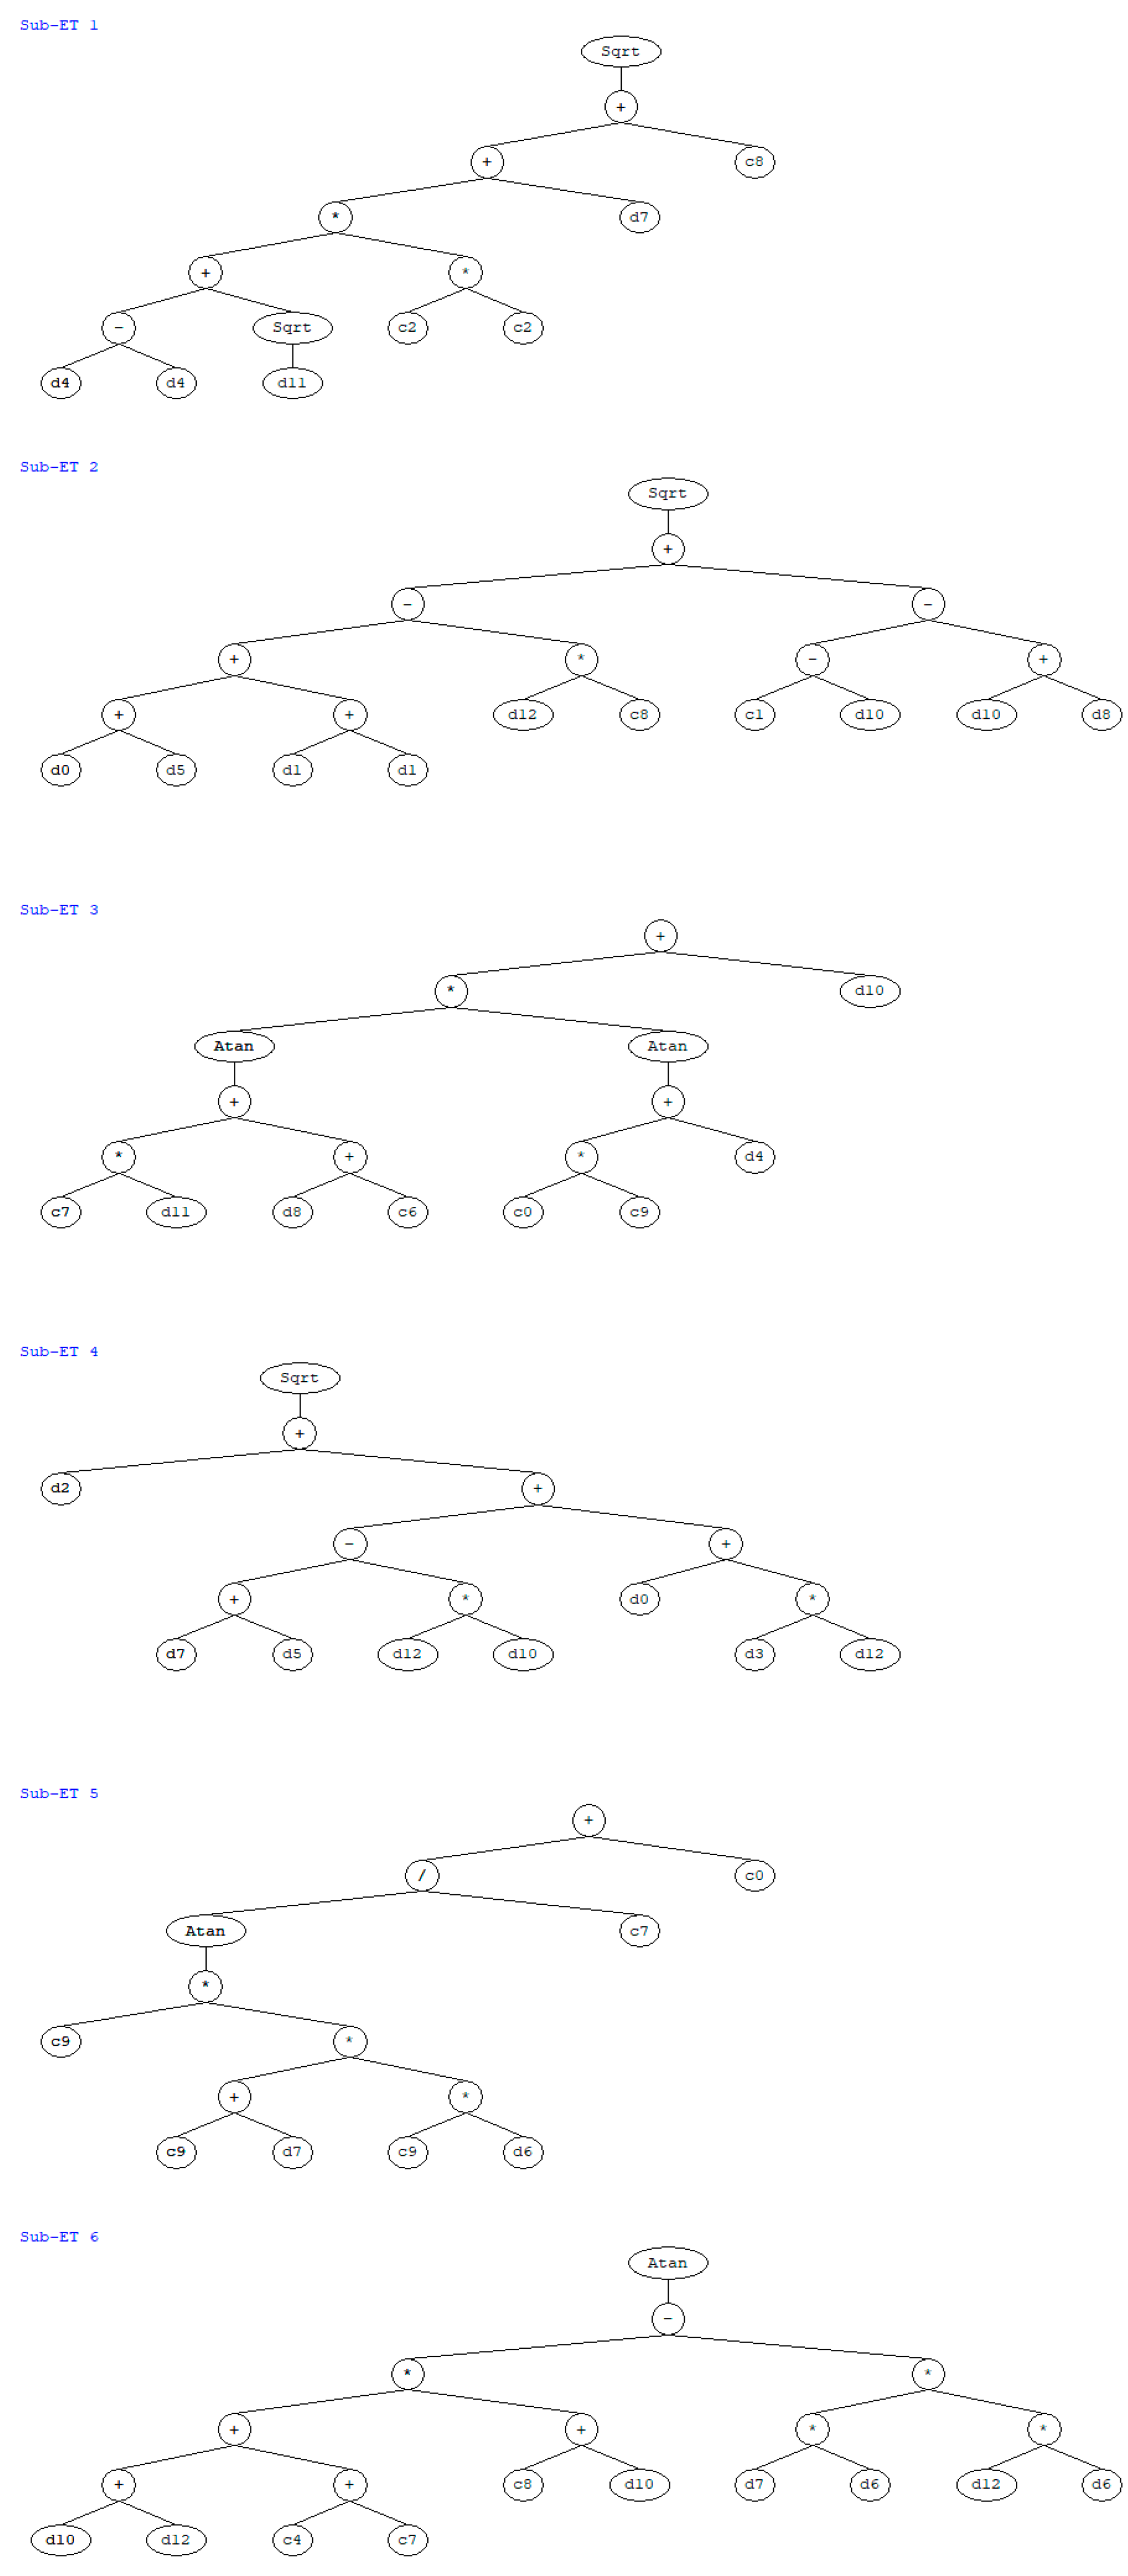
4.1. GEP Modelling for UHPC Flowability (FA)

The development of models utilizing the GEP technique is in ET form, as shown in Figure 7, to collect mathematical correlations for FA calculations based on head size and chromosomal number. The FA’s sub-ETs mostly use the arithmetic operators +, –, x, ÷, and cubic root. The sub-ETs obtained using the GEP model are encrypted to yield the ultimate result, a mathematical formula. Equation (2), which uses these input parameters to forecast FA in the future, shows the mathematical conclusions for both output values. The developed model outperforms an ideal model under UHPC settings and has a large enough number of data points. The flowability regression lines of the training and validation sets’ experimental values are contrasted with the model’s predicted results in Figure 8. The regression lines’ slope indicates that the R2 value between the experimental and projected data is 0.94. The inclination of regression lines is about the same for training datasets that are near the perfect match (equals to 1). Figure 9 depicts a plot of the absolute error of the suggested GEP equation versus the experimental findings, providing an overview of the GEP model’s maximum error percentage. GEP equation’s results and the experimental results are almost identical, as seen by the reported minimum and maximum absolute error values of 0.021 and 1.94, respectively. The fact that maximum error frequencies are far less frequent must be noted.
F A = M + N + O + P + Q + R
where;
M = F a s h W a S P 2 S F + N S + S F L 15.00
N = L S W a N S + S P 85.71
O = S F L S F c L n   F a s h C A + 4.16 W a C e m
P = S P S F c S P + 1.70 S g + L n   S a W a W a + C A
Q = 8.89 S F L L n   N S + S P × S P + Q u 4.74  
R = S F L C A 5.33 + S F L S P
where F A = flowability (in cm) by estimated model; F a s h = content of fly ash; C e m = cement content; S F = content of silica fume; S g = content of slag; N S = nano-silica content; S a = sand content; Q u = content of quartz; L S = limestone content; S P = superplasticizer content; W a = water content; S F L = steel fiber length; S F c = steel fiber content.

Development of Jupyter-Driven Graphical User Interface (GUI) for UHPC Flowability

Flowability is a fundamental attribute of shotcrete, especially when dealing with sophisticated mixes like UHPC. It is essential to ensure that the shotcrete adheres properly to the substrate and achieves the desired compaction and homogeneity. The developed GUI (Figure S1) allows for the meticulous input of various parameters that influence the flowability of UHPC shotcrete, which include ‘Cement content’, ‘Cement compressive strength’, ‘Cement type’, ‘Cement strength class’, ‘Fly ash content’, ‘Silica fume content’, ‘Slag content’, ‘Limestone powder content’, ‘Nano-silica content’, ‘Sand content’, ‘Maximum aggregate size’, ‘Coarse aggregate content’, ‘Quartz powder content’, ‘Superplasticizer content’, ‘Water content’, ‘Polystyrene fiber content’, ‘Polystyrene fiber length’, ‘Polystyrene fiber diameter’, ‘Steel fiber content’, ‘Steel fiber length’, and ‘Steel fiber diameter’. Each input parameter has a specific role in affecting the flowability of the mix:
  • Cement content and cement compressive strength determine the binder’s capacity and the matrix’s strength, which are directly related to the viscosity and stability of the mix.
  • Cement type and cement strength class can alter the rheology of the mixture, which impacts how easily the shotcrete flows.
  • Additives like fly ash, slag, and silica fume can improve workability and reduce water demand, enhancing flowability without sacrificing cohesion.
  • Nano-silica and limestone powder contribute to the filler effect and particle packing, optimizing the flow.
  • Coarse aggregate content and sand content, along with Maximum aggregate size, are crucial for maintaining a balance between flowability and the prevention of segregation during application.
  • Quartz powder acts as a micro-filler, improving the interface between aggregates and cement paste.
  • The water content and superplasticizer content are key factors in achieving the desired consistency and workability for shotcrete application.
  • Fiber additions, such as polystyrene fiber content, polystyrene fiber diameter, polystyrene fiber length, steel fiber content, steel fiber diameter, and steel fiber length, influence the fresh and hardened properties of UHPC, affecting its viscosity, and thus the flowability.
Understanding the intricate relationship between these parameters and flowability is vital for the success of shotcrete applications. The GUI provides a predictive and practical approach for the professionals to get an anticipated rating for flowability by inputting accurate mix proportions. Such anticipation aids in predicting the shotcrete performance, making sure that the mix is neither causing slumping or sagging due to fluidity nor hindering the spraying process due to rigidity. Therefore, it can be said that this GUI comes as a significant essential mean for progressing towards shotcrete as an application of UHPC and enhancing the reliability and efficiency of UHPC for construction industry.
The discussion is made here on the importance of GUI for developing ML models to predict flowability. The input factors for making the UHPC mix comprises of various parameters affecting its mix composition and characteristics. Each factor plays its role distinctively in the production of, affecting its flowability. For example, the type and content of cement, with slag and fly ash as additives, considerably affect UHPC setting characteristics, whereas, the percentages of aggregates, sand, and water play important part in assessing flowability and workability. Further additives such as fibers and superplasticizers can increase viscosity. The given values against said factors offer accurate specifications in case of every parameter involved in the UHPC mix, confirming the prediction accuracy. Out of said factors, the input values comprise compressive strength and content of cement, contents of nano-silica, slag, water, sand, and superplasticizer, each contributive to the properties of UHPC mix. The determination of the percentage error between the GUI predicted and experimental values for UHPC flowability with the help of above-mentioned formula is approximately 3.637%. Hence, this percentage difference displays the prediction reliability and preciseness, showing as almost exact anticipation as experimental values. Accordingly, this precise anticipation, supported by GUI, is highly beneficial in application of UHPC as shotcrete in terms of UHPC mix design optimization for attaining required flowability values. This would aid in shotcrete placement with efficacy in the construction industry.

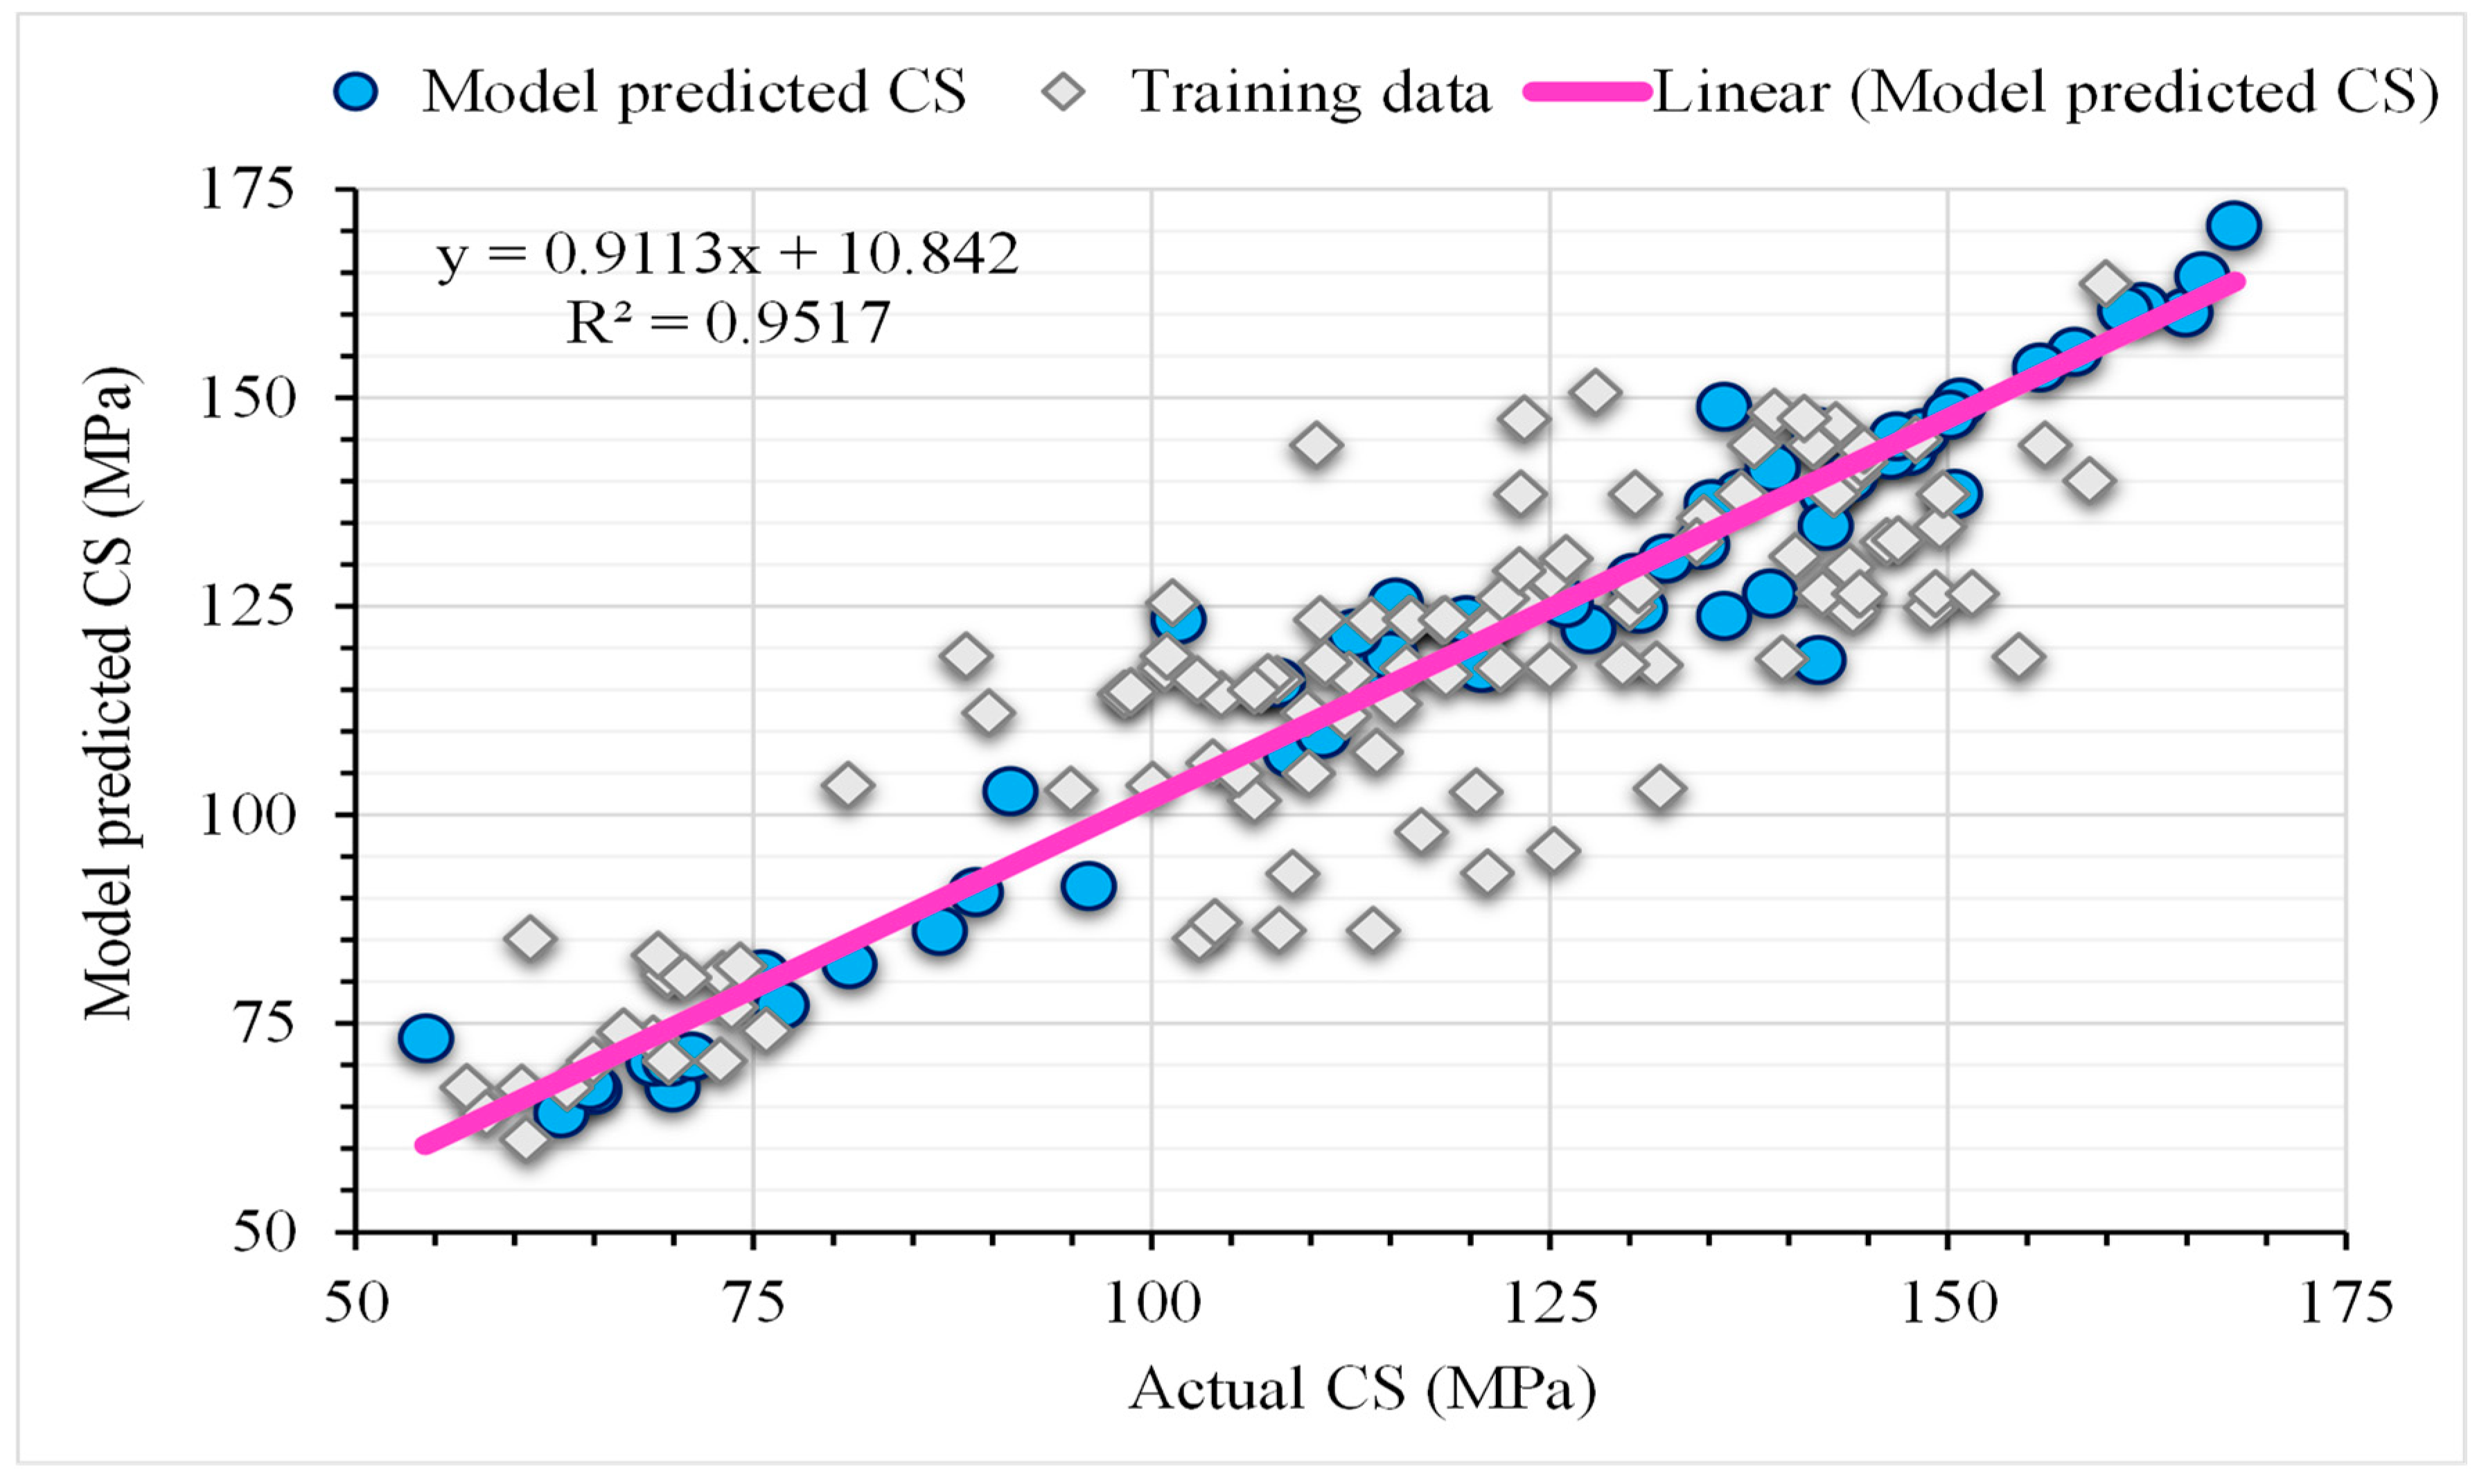
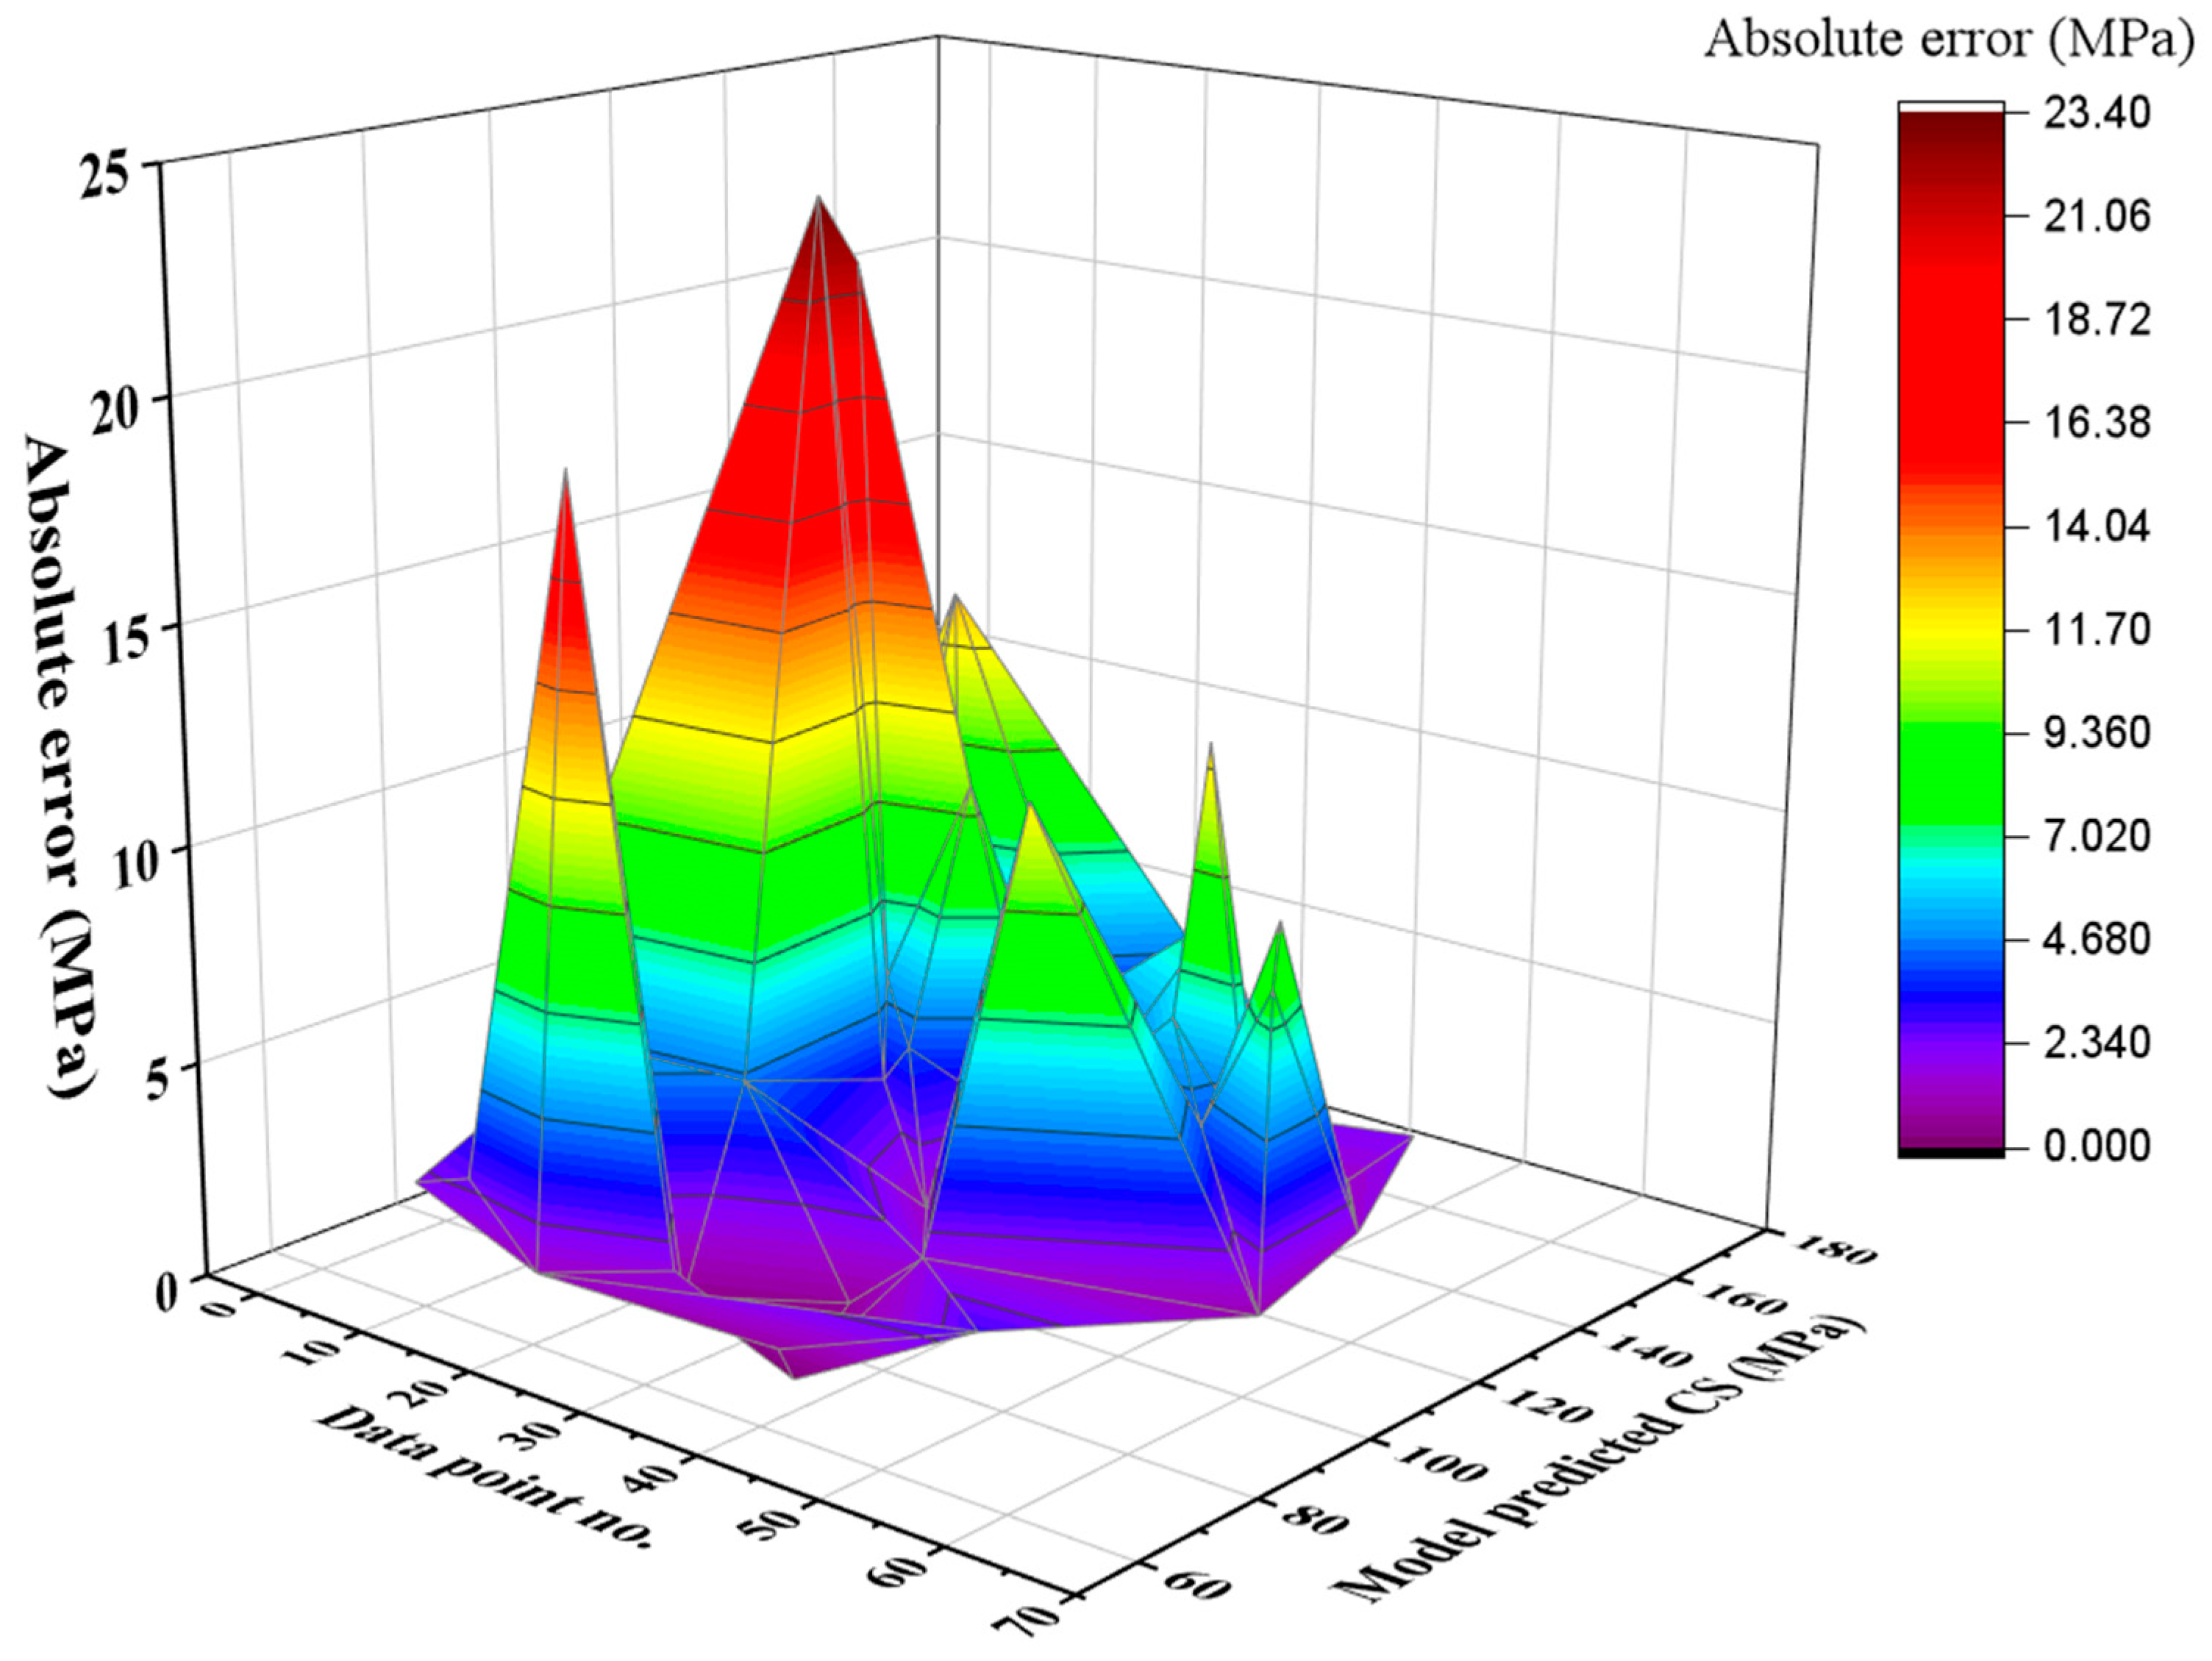
4.2. GEP Modelling for UHPC Compressive Strength (CS)

The primary step for the development of AI based ML models is the adoption of adequate input factors. Therefore, the highly effective input factors, in terms of maximum effect on compressive strength of UHPC, were adopted in this study. GeneXproTools version 5.0 program is adopted by the GEP for the establishment of models [70,71,72]. GeneXproTools is an information generator that creates code by finding variables, analyzing them, and randomly assigning missing values. Overall, the developed models are more productive and effective [73]. It may develop models and create program in a number of languages, such as Visual Basic, MATLAB, and C++ [74]. The settings of GEP utilized in current investigation were chosen following multiple tests runs and consideration of guidance from previously published studies [75,76,77]. Using a trial-and-error approach, the initial best combination was selected in order to determine how specific GEP parameters affected the accuracy of the anticipated results. Thus, the ultimate optimal sequence of the GEP hyper-parameters was found and employed in the modelling to forecast the outcome and transform those forecasts into simple mathematical expressions (refer to Table 1). The complexity of the model is influenced by the quantity of genes and chromosomes as well as the size of the head. As the number grows, so too will the amount of time needed to run the program. Nonetheless, due to the relationship between error and regression, a larger overall model is produced by having more chromosomes and genes.
The GEP technique generated models in ET form, as shown in Figure 10, based on the number of chromosomes and the size of the head to infer mathematical relationships for computing the CS. The CS’s sub-ETs are mostly defined by the arithmetic operators +, −, x, ÷, and cubic root. The sub-ETs obtained using the GEP model are encrypted to produce the final result, which is a mathematical formula. Equation (3), which uses these input parameters to anticipate CS in the future, shows the mathematical conclusions for both output values. The developed model outperforms the ideal model in ideal circumstances for RHA-based concrete and has an adequate number of data points. The compressive strength regression lines of the training and validation sets’ experimental values are contrasted with the model’s predicted results in Figure 11. The regression lines’ slope indicates that the expected and experimental R2 values are 0.95. The regression lines’ leanings are about the same as the training datasets, which are near the perfect match (equals to 1). A plot of the absolute error of the proposed GEP equation against the experimental values is shown in Figure 12, which gives a general idea of the maximum error percentage of the GEP model. The absolute error values were found to be 0.07 at the minimum and 23.34 at the highest, respectively. This indicates that the GEP equation’s results and the experimental results are almost identical. The fact that maximum error frequencies are far less frequent must be noted.
C S = A + B + C + D + E + F
where
A = 257 × S F c + C A + 0.232
B = C e m + L S + 2 F a s h 9.67 S F L + 10.56 2 S P + Q u )
C = L n   6.50 S F c + Q u + 11.67 × L n   ( 17.93 + N S + S P + 0.08   W a )
D = S g + C A + L S S P × S F L + C e m + ( S F × S F L )
E = L n   1437.19 C A × 37.91 S a 5.95
F = L n   S P + S F L + 14.65 × 5.92 + S P + ( C A × S a × ( S F L × S a )
where C S = model-estimated compressive strength in Mpa; C e m = cement content; F a s h = fly ash content; S g = slag content; S F = silica fume content; N S = nano-silica content; L S = limestone content; S a = sand content; Q u = quartz content; W a = water content; S P = superplasticizer content; S F c = steel fiber content; S F L = steel fiber length.

Establishment of Jupyter-Based Graphical User Interface (GUI) for UHPC Compressive Strength

The compressive strength of UHPC is a vital factor in column applications, where both high load-bearing capacity and durability are required. The developed GUI (Figure S2) offers a sophisticated means of inputting a range of parameters to predict the compressive strength of UHPC, crucial for columnar structures that demand superior performance under compressive loads. The input parameters for the GUI—‘Cement content’, ‘Cement compressive strength’, ‘Cement type’, ‘Cement strength class’, ‘Slag content’, ‘Fly ash content’, ‘Nano-silica content’, ‘Silica fume content’, ‘Sand content’, ‘Limestone powder content’, ‘Coarse aggregate content’, ‘Quartz powder content’, ‘Maximum aggregate size’, ‘Water content’, ‘Superplasticizer content’, ‘Polystyrene fiber content’, ‘Polystyrene fiber diameter’, ‘Polystyrene fiber length’, ‘Steel fiber content’, ‘Steel fiber diameter’, ‘Steel fiber length’, and ‘Curing time’—all intertwine to influence the final compressive strength of the UHPC. Here is how these parameters interplay to affect the compressive strength of UHPC for column applications:
  • Cement content, cement compressive strength, cement type, and cement strength class establish the backbone of the UHPC matrix, providing the primary binding material that governs strength development.
  • Fly ash, slag, and silica fume, as pozzolanic materials, contribute to the microstructural refinement of UHPC, leading to higher density, and thus enhanced compressive strength.
  • Nano-silica promotes the pozzolanic reaction and fills voids at the nanoscale, contributing to increased strength.
  • Limestone powder acts as a fine aggregate and can enhance the particle packing, thus improving the compressive strength.
  • Sand content and coarse aggregate content, along with the maximum aggregate size, are optimized to facilitate dense packing and minimize voids, directly influencing strength.
  • Quartz powder further refines the microstructure and can contribute to strength development due to its hard nature.
  • Water content must be carefully balanced to provide workability without weakening the concrete matrix.
  • The higher compressive strength of UHPC along with adequate workability may be achieved using superplasticizer instead of increasing water content, hence the content of superplasticizer is crucial.
  • The dispersed reinforcement in UHPC is provided by incorporating steel and polystyrene fibers of different diameters and lengths. This dispersed reinforcement is aimed to increase the tensile strength of composite, ultimately adding in UHPC toughness. This enhanced toughness of UHPC is desirable for UHPC columns that are exposed to fluctuating loads.
  • The achievement of maximum UHPC strength is also relatable to the curing time. The proper pozzolanic and hydration reactions are attained in case the incorporated cementitious materials receive proper curing.
The precision in UHPC compressive strength prediction is essential to foresee the long-term performance against design loads throughout the design life, if the material is intended to be used for column applications. Hence, this GUI tool provides assistance to the construction designers in developing model for optimizing the UHPC mixes without going for excessive experimental trial mixes for assuring the required strength for UHPC column applications. Moreover, this optimization through GUI models is also an effective step towards attainment of sustainable development by maximizing the performance and minimizing the consumption of resources, time, and cost, ultimately contributing towards revolutionary construction in future having more resilience and efficiency.
There are different parameters incorporated in manufacturing of UHPC that are vital for the evaluation of its compressive strength. Every factor has a unique contribution towards UHPC characteristics, and hence effect on its strength overall. These are the type of cement and its content, as well as curing time. Moreover, the incorporation of other binders, i.e., nano-silica, and silica fume, along with superplasticizer may affect the UHPC strength considerably. In addition, the percentage contents of remaining parameters, i.e., steel fibers, aggregates, and sand also contribute to the structural performance of UHPC. The input values for these factors provide accurate calculations for every parameter considered for the mix, depicting the preciseness in the process of prediction. Among these parameters, the input values of cement content, cement compressive strength, silica fume content, nano-silica content, sand content, water content, superplasticizer content, and others each contribute to UHPC’s compressive strength. The percentage error between the predicted and experimental compressive strength values is approximately 1.44%. This indicates a relatively small deviation between the predicted and actual values, suggesting a high level of accuracy in the predictive model. Such accurate predictions facilitated by the GUI can aid engineers and researchers in optimizing UHPC mix designs to achieve desired compressive strength levels for various construction applications, especially for columns.

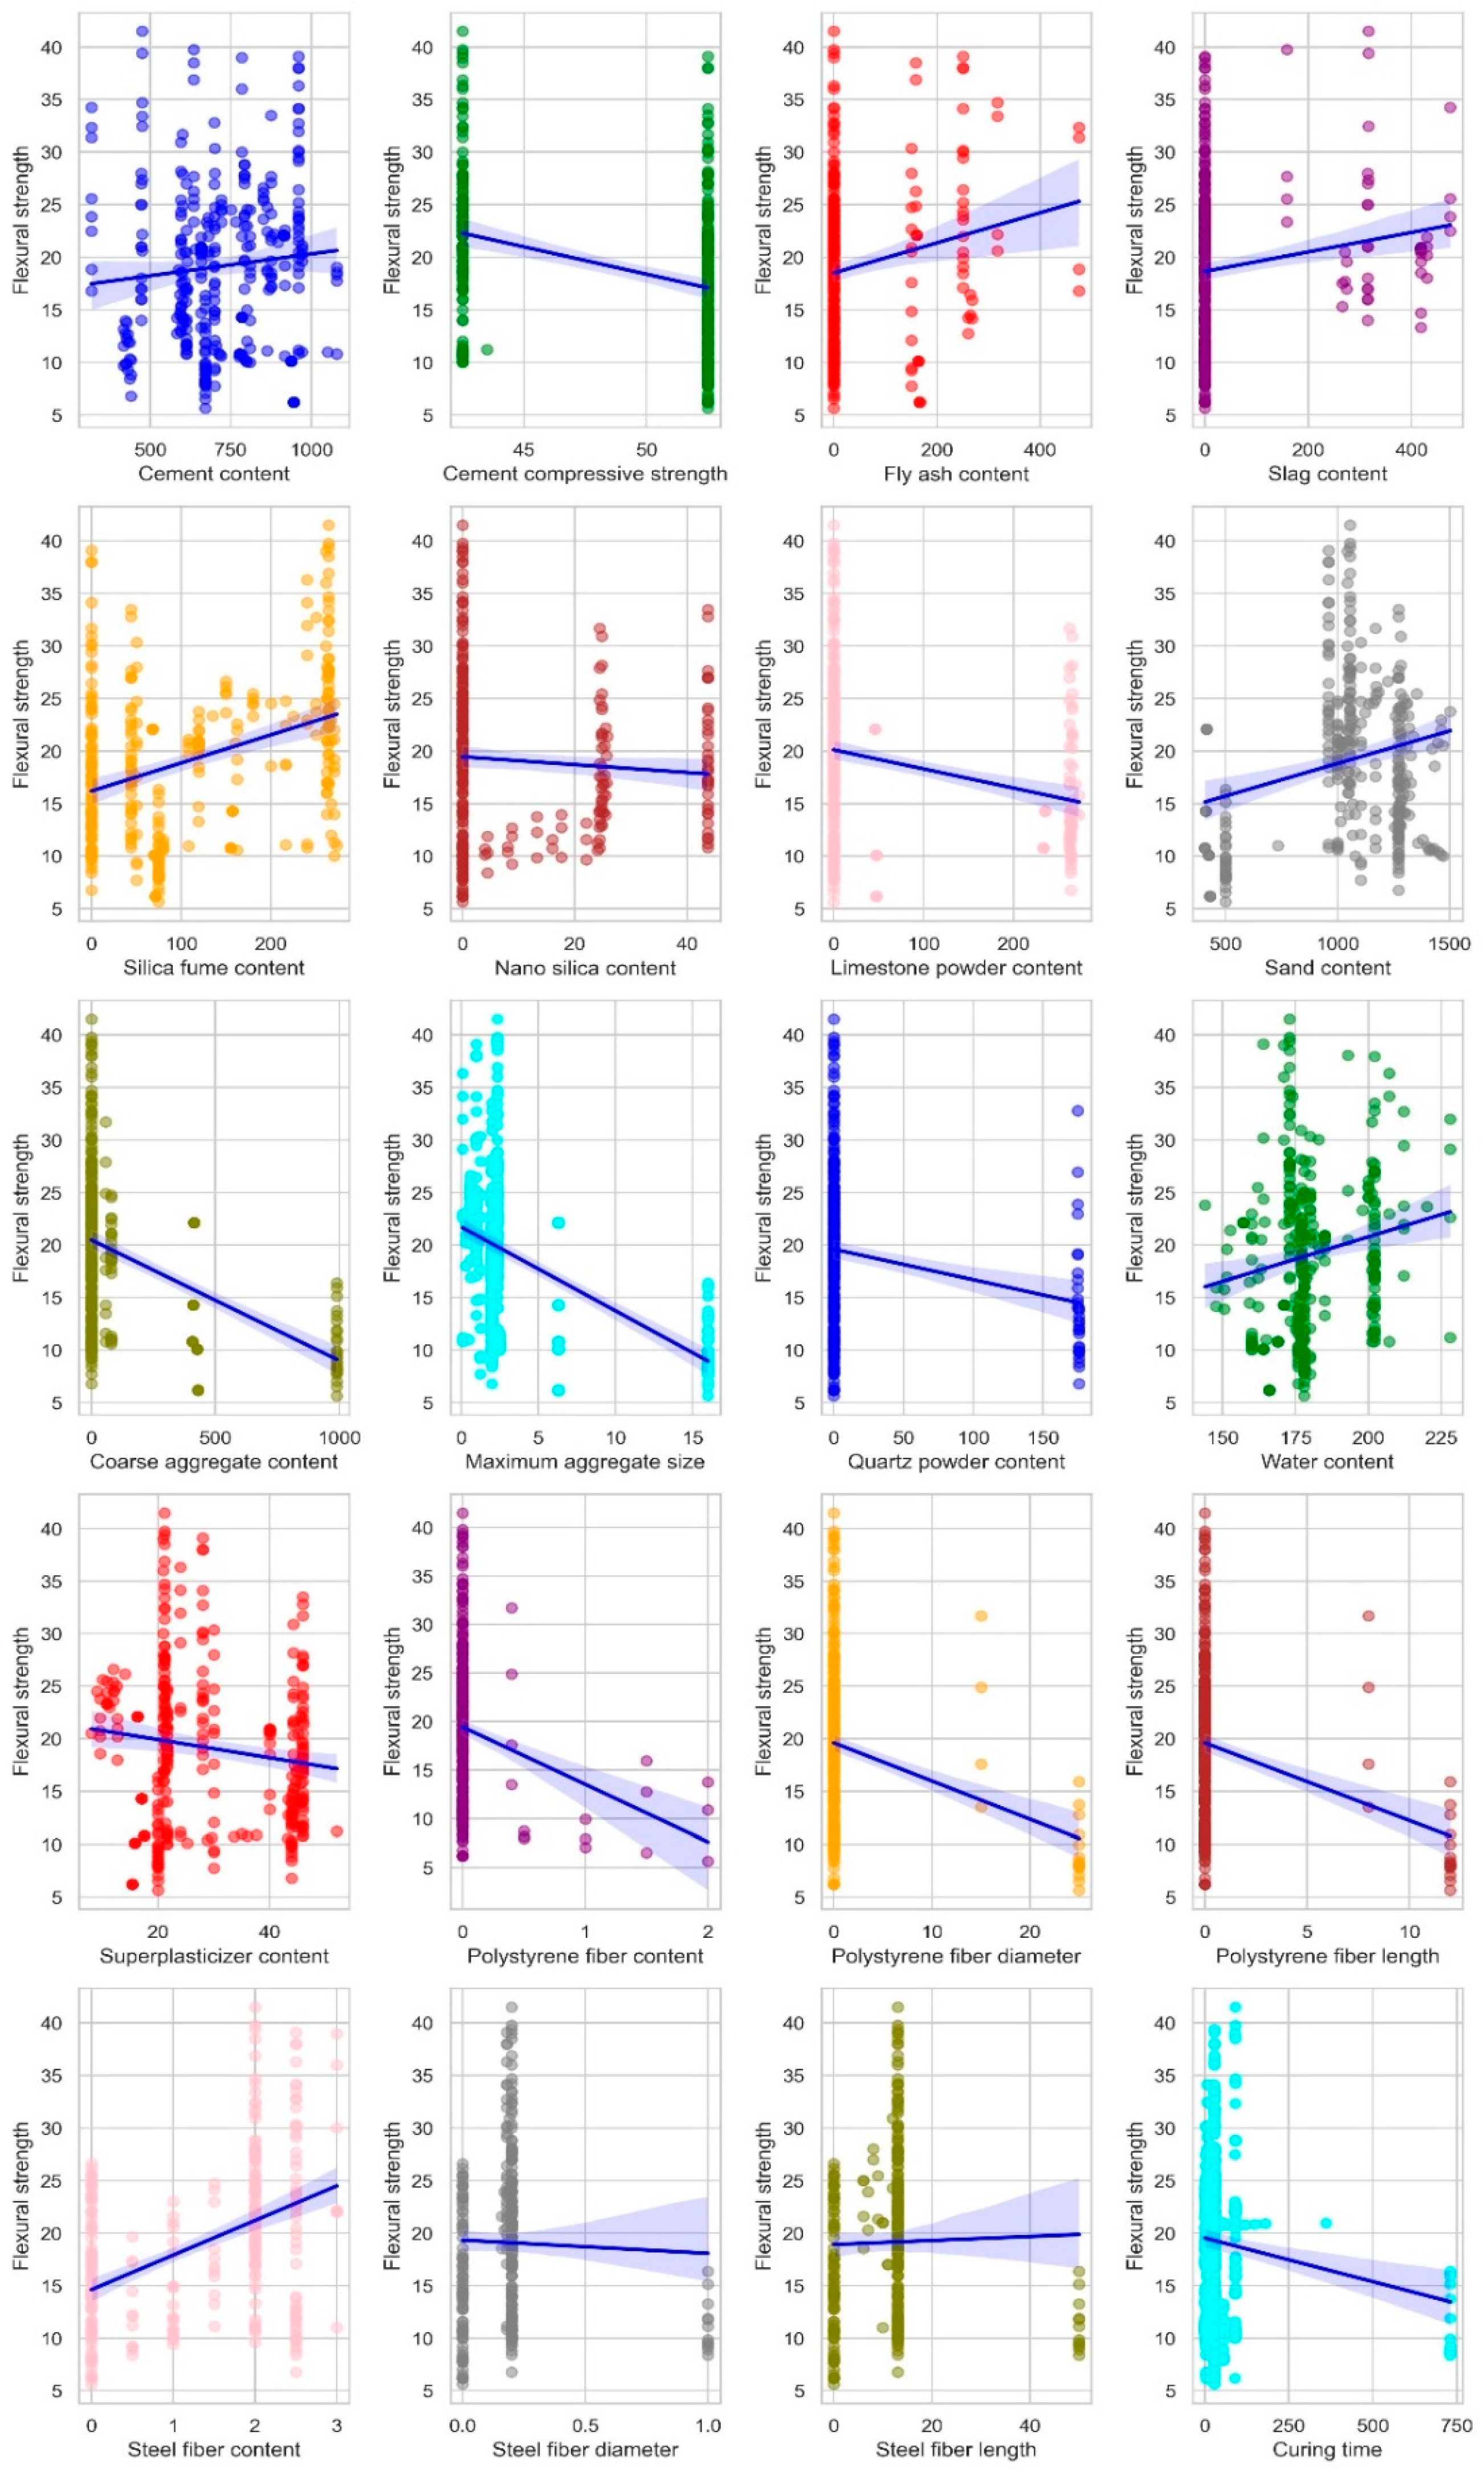
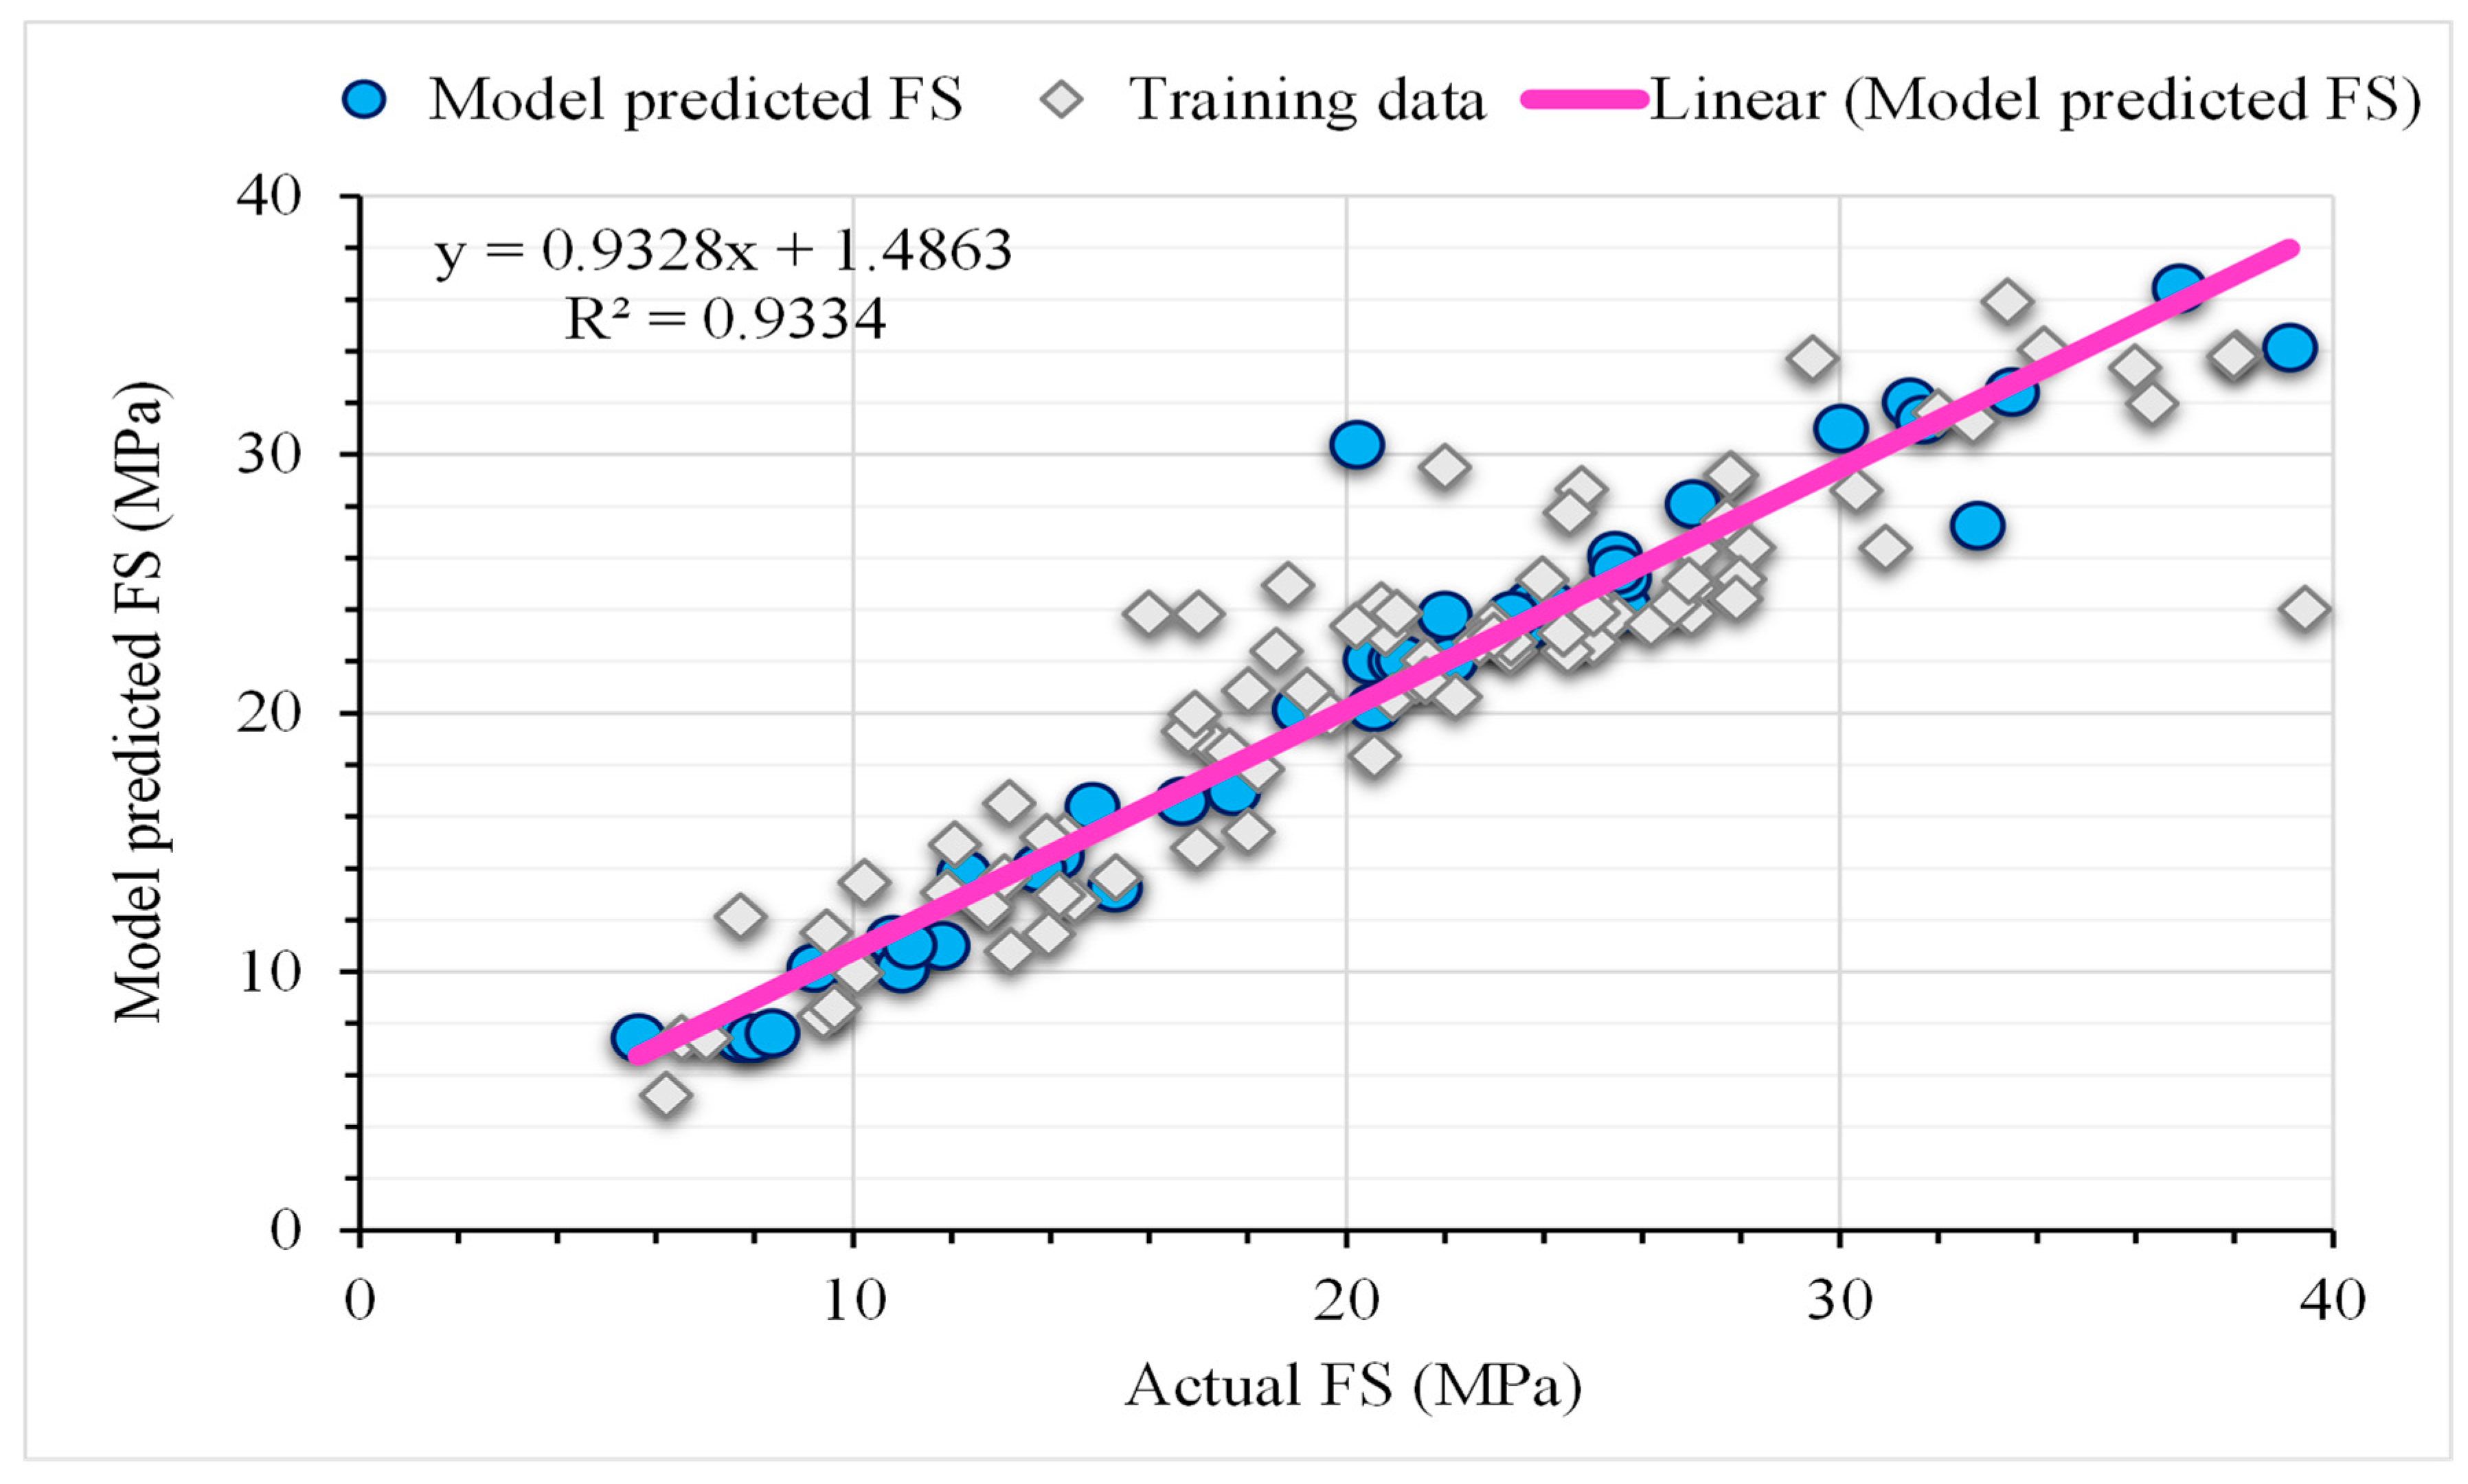
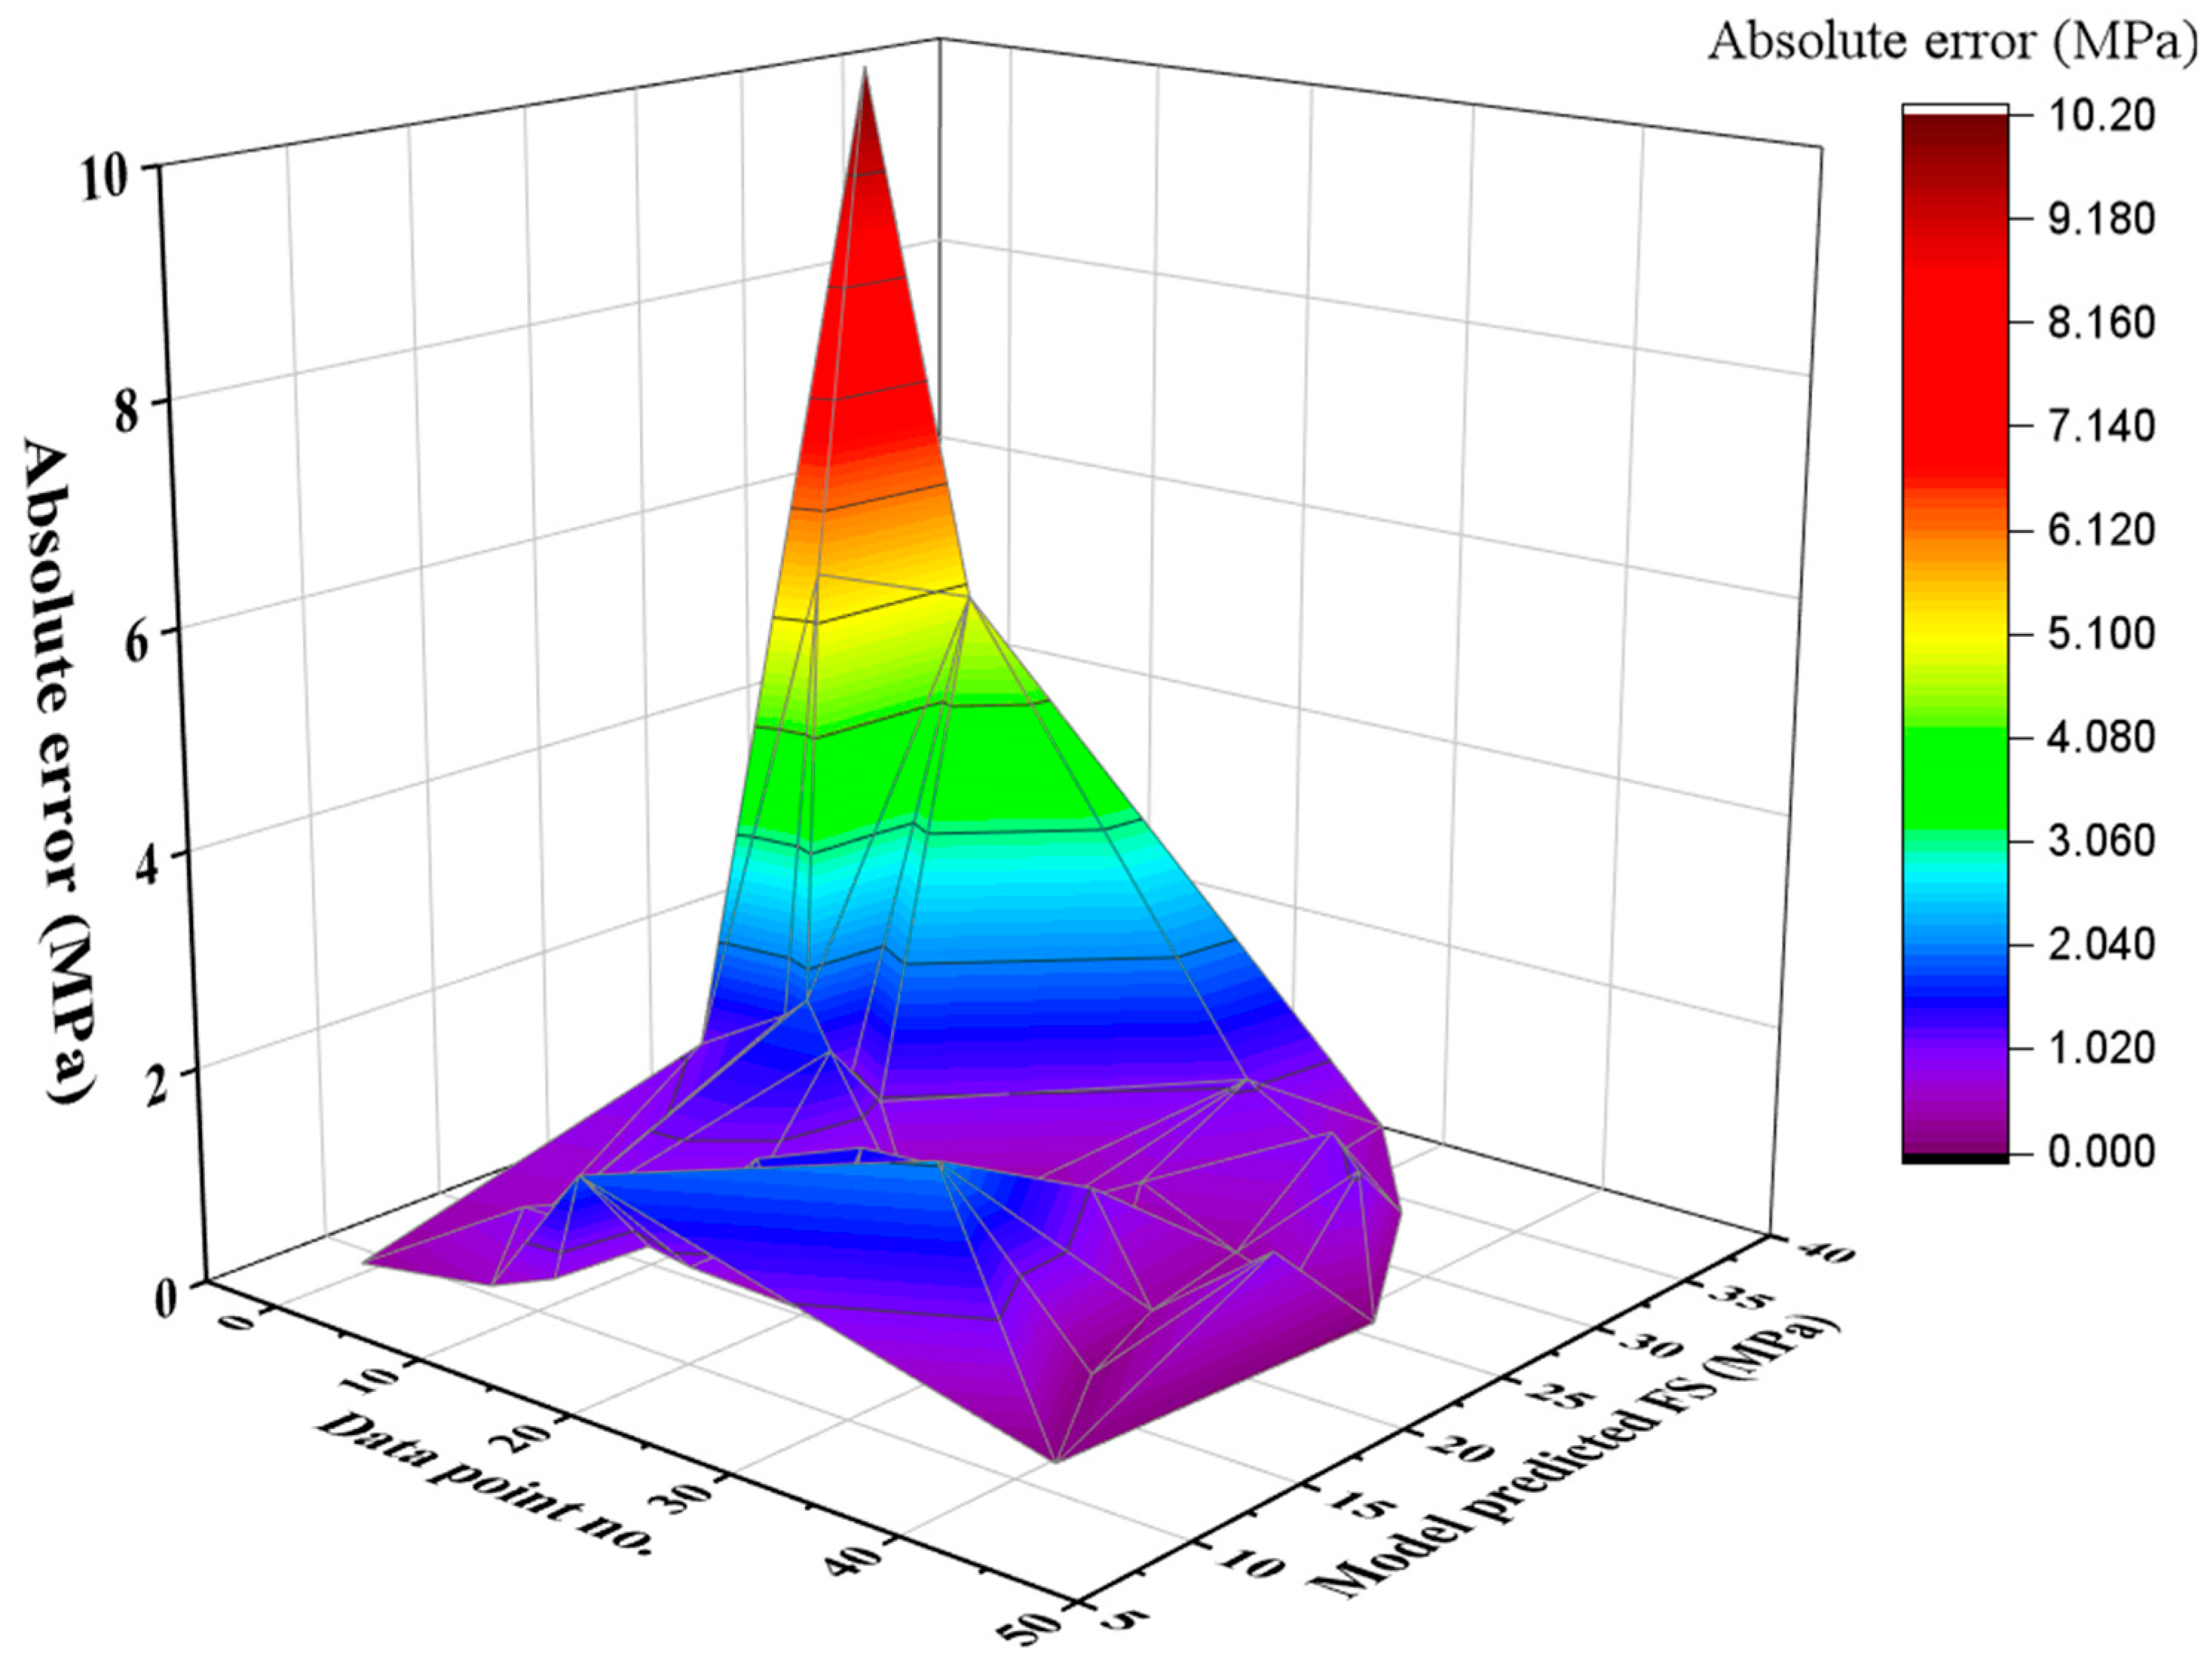
4.3. GEP Modelling for UHPC Flexural Strength (FS)

The GEP technique generated models in ET form, as shown in Figure 13, based on the number of chromosomes and the size of the head to infer mathematical relationships for FS calculation. The majority of the sub-ETs for the FS are defined by the five arithmetic operators +, −, x, ÷, and cubic root. The sub-ETs obtained using the GEP model are encrypted to produce the final result, which is a mathematical formula. Equation (4), which uses these input parameters to forecast FS in the future, shows the mathematical consequences for both output values. The developed model outperforms the ideal model under UHPC settings and has a large enough number of data points.
F S = G + H + I + J + K + L
where
G = C A S P 8.46 S F c 6.21 + ( S F c + 9.40 )
H = 2 S F c × S F L × F a s h + W a S F L S C e m
I = 11.44 4.51 2 S F L S g 11.19
J = S F c 3 Q u L n   ( 0.15 S a )
K = S F c 109.20 S P 10.14 F a s h N S + C e m W a
L = C e m S F S F L W a 2.47 F a s h + W a Q u 13.42  
where F S = model estimated compressive strength in Mpa; C e m = cement content; F a s h = fly ash content; S g = slag content; S F = silica fume content; N S = nano-silica content; L S = limestone content; S a = sand content; Q u = quartz content; W a = water content; S P = superplasticizer content; S F c = steel fiber content; S F L = steel fiber length.
The compressive strength regression lines of the training and validation sets’ experimental values are contrasted with the model’s predicted results in Figure 14. It is clear that the regression lines’ slope indicates that the R2 between the experimental and anticipated values is 0.93. The inclination of the regression lines is about the same for the training datasets, which are near the perfect match (equals to 1). A plot of the absolute error of the proposed GEP equation against the experimental values is shown in Figure 15, which gives a general idea of the maximum error percentage of the GEP model. The absolute error values at the minimum and maximum were found to be 0.029 and 10.17, respectively, indicating a close match between the experimental results and the GEP equation’s output. The fact that maximum error frequencies are far less frequent must be noted.

Creation of Jupyter-Based Graphical User Interface (GUI) for UHPC Flexural Strength

Flexural strength is a critical property of UHPC when applied to beam construction, as it governs the material’s ability to resist bending and cracking. In beam applications, where UHPC is valued for its excellent mechanical performance and durability, the flexural strength determines the load the beam can support before failure. The designed GUI allows (Figure S3) for precise manipulation of input parameters to predict the flexural strength of UHPC beams, crucial for structural elements that are subjected to bending stresses. The parameters that can be entered into the GUI are comprehensive, including ‘Cement content’, ‘Cement compressive strength’, ‘Cement type’, ‘Cement strength class’, ‘Slag content’, ‘Fly ash content’, ‘Nano-silica content’, ‘Silica fume content’, ‘Sand content’, ‘Limestone powder content’, ‘Maximum aggregate size’, ‘Coarse aggregate content’, ‘Quartz powder content’, ‘Water content’, ‘Superplasticizer content’, ‘Polystyrene fiber content’, ‘Polystyrene fiber diameter’, ‘Polystyrene fiber length’, ‘Steel fiber content’, ‘Steel fiber diameter’, ‘Steel fiber length’, and notably ‘Curing time’. Each of these inputs has a direct or indirect impact on the flexural strength:
  • Cement-related parameters contribute to the initial matrix strength, which is fundamental to the beam’s ability to resist bending.
  • Fly ash, slag, and silica fume enhance the microstructure and contribute to the high-density matrix of UHPC, which supports greater flexural strength.
  • Nano-silica assists in optimizing the microstructure for superior mechanical properties, including flexural strength.
  • Limestone powder serves as a micro-filler, promoting dense packing and contributing to the flexural rigidity of the beam.
  • Sand content and coarse aggregate content, as well as maximum aggregate size, are critical for achieving a balance between workability and a compact matrix for improved flexural response.
  • Also, the flexural properties of UHPC can also be benefitted by the incorporation of quartz powder, enhancing the stiffness of composite.
  • The adequate consistency of UHPC mix is obtained by adjusting water content, but without disturbing the integrity of matrix.
  • Similarly, instead of enhancing the water content, superplasticizers may be incorporated to achieve more workability, but without adding additional water. This may also contribute towards maximizing the flexural strength.
  • The incorporation of dispersed fibers, i.e., steel and polystyrene, considerably contributes towards attainment of enhanced flexural strength due to the crack-arresting bridging effect provided by the dispersed fibers, ultimately enhancing the toughness of UHPC. These specifications are highly beneficial for the beam applications where both the static and dynamic loadings are to be resisted.
  • It is also reported that the adequate completion of hydration process due to proper curing time considerably contributes towards development of the mechanical properties of cementitious composites. Hence, the UHPC flexural strength can also be enhanced by proper curing, which is highly beneficial for the beam applications.
Therefore, it can be said that the application of UHPC for structural beams in the design demands significant flexural strength. Thus, for this purpose, the GUI may serve as an important aid for structural design engineers. The optimization of UHPC mix design to achieve maximum flexural strength can be done using GUI design instead of extensive experimental trials consuming bulk resources. It would also help in conservation of time and cost. This would be an effective contribution of the construction industry towards sustainable development without compromising structural performance of the respective structure, demonstrating the considerable progress in UHPC applications.
Here again, the significance of GUI is reported for the prediction of UHPC flexural strength with the intention to be employed as structural beam. As mentioned earlier, the UHPC mix design incorporates multiple diverse parameters that affects its flexural strength. The contribution of every parameter is important in terms of acquired UHPC properties under the application of bending loads. These parameters include curing time and the contents of superplasticizer, cement, nano-silica, silica fume, aggregates, sand and fibers that considerably affect the UHPC flexural strength for beam applications. The percentage error between the predicted and experimental flexural strength values is approximately 1.79%. This indicates a relatively small deviation between the predicted and actual values, suggesting a high level of accuracy in the predictive model. Such accurate predictions facilitated by the GUI can aid engineers and researchers in optimizing UHPC mix designs to achieve the desired flexural strength levels for various beam applications, ensuring structural integrity and performance in construction projects.

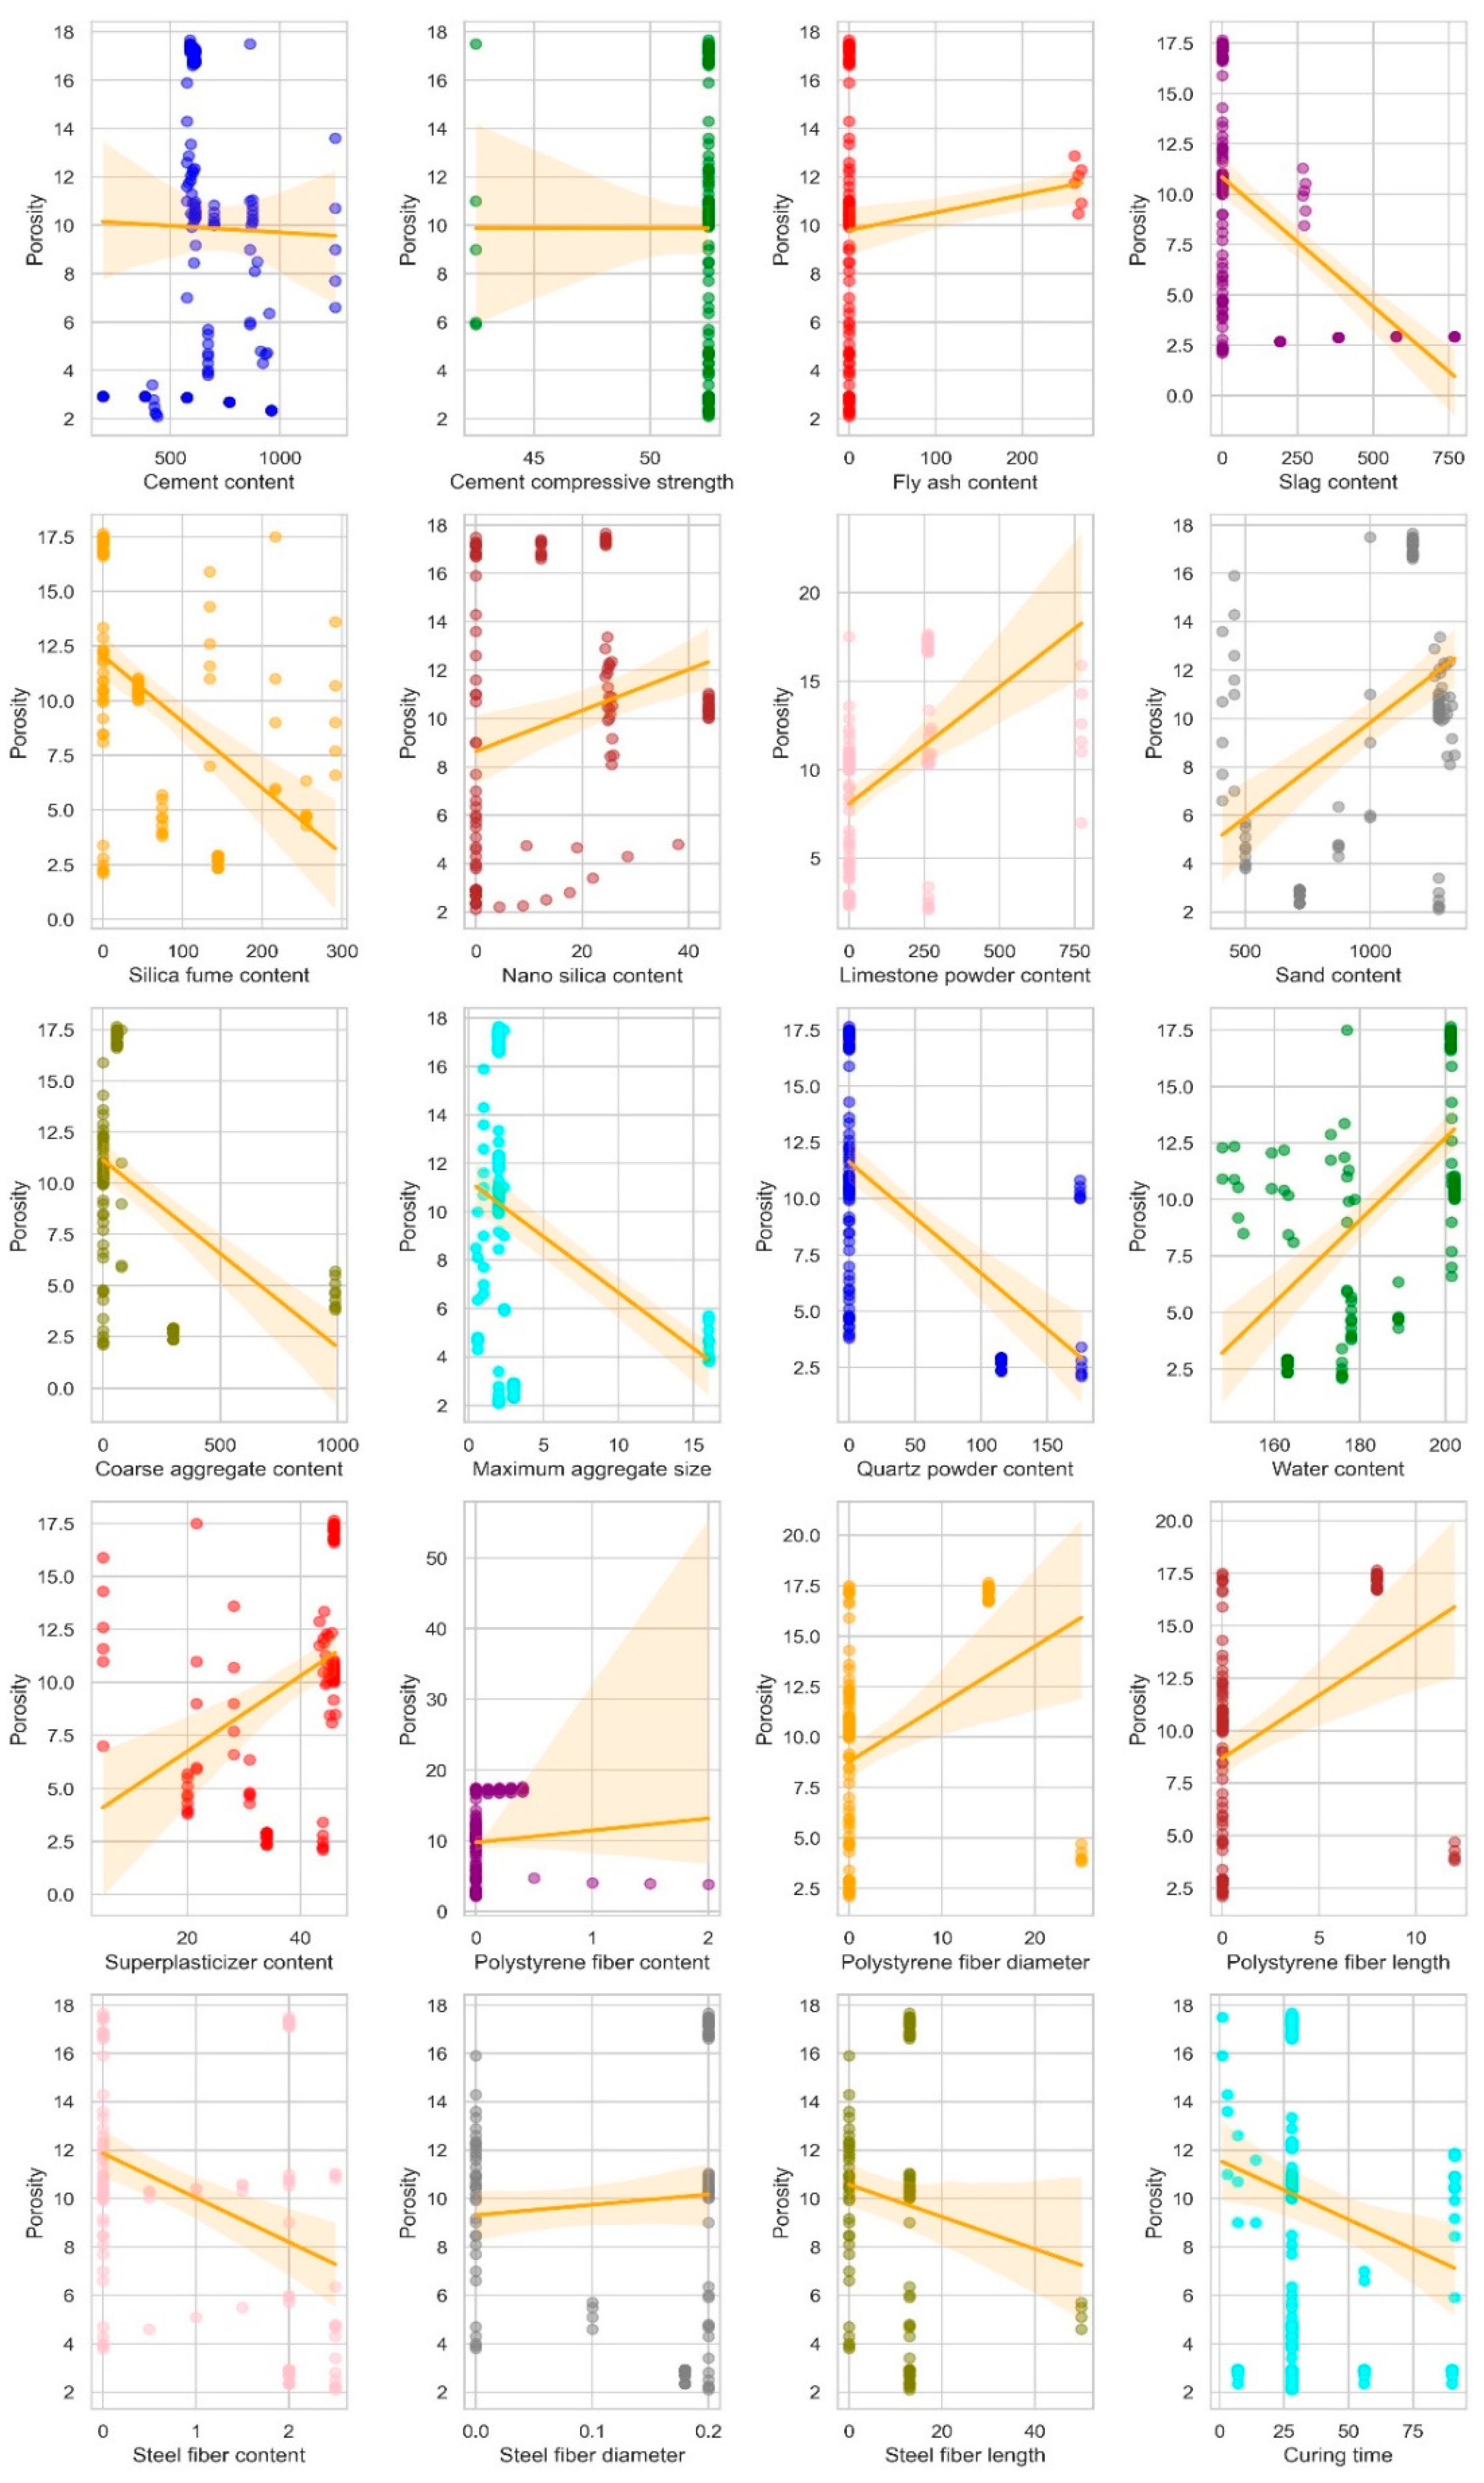
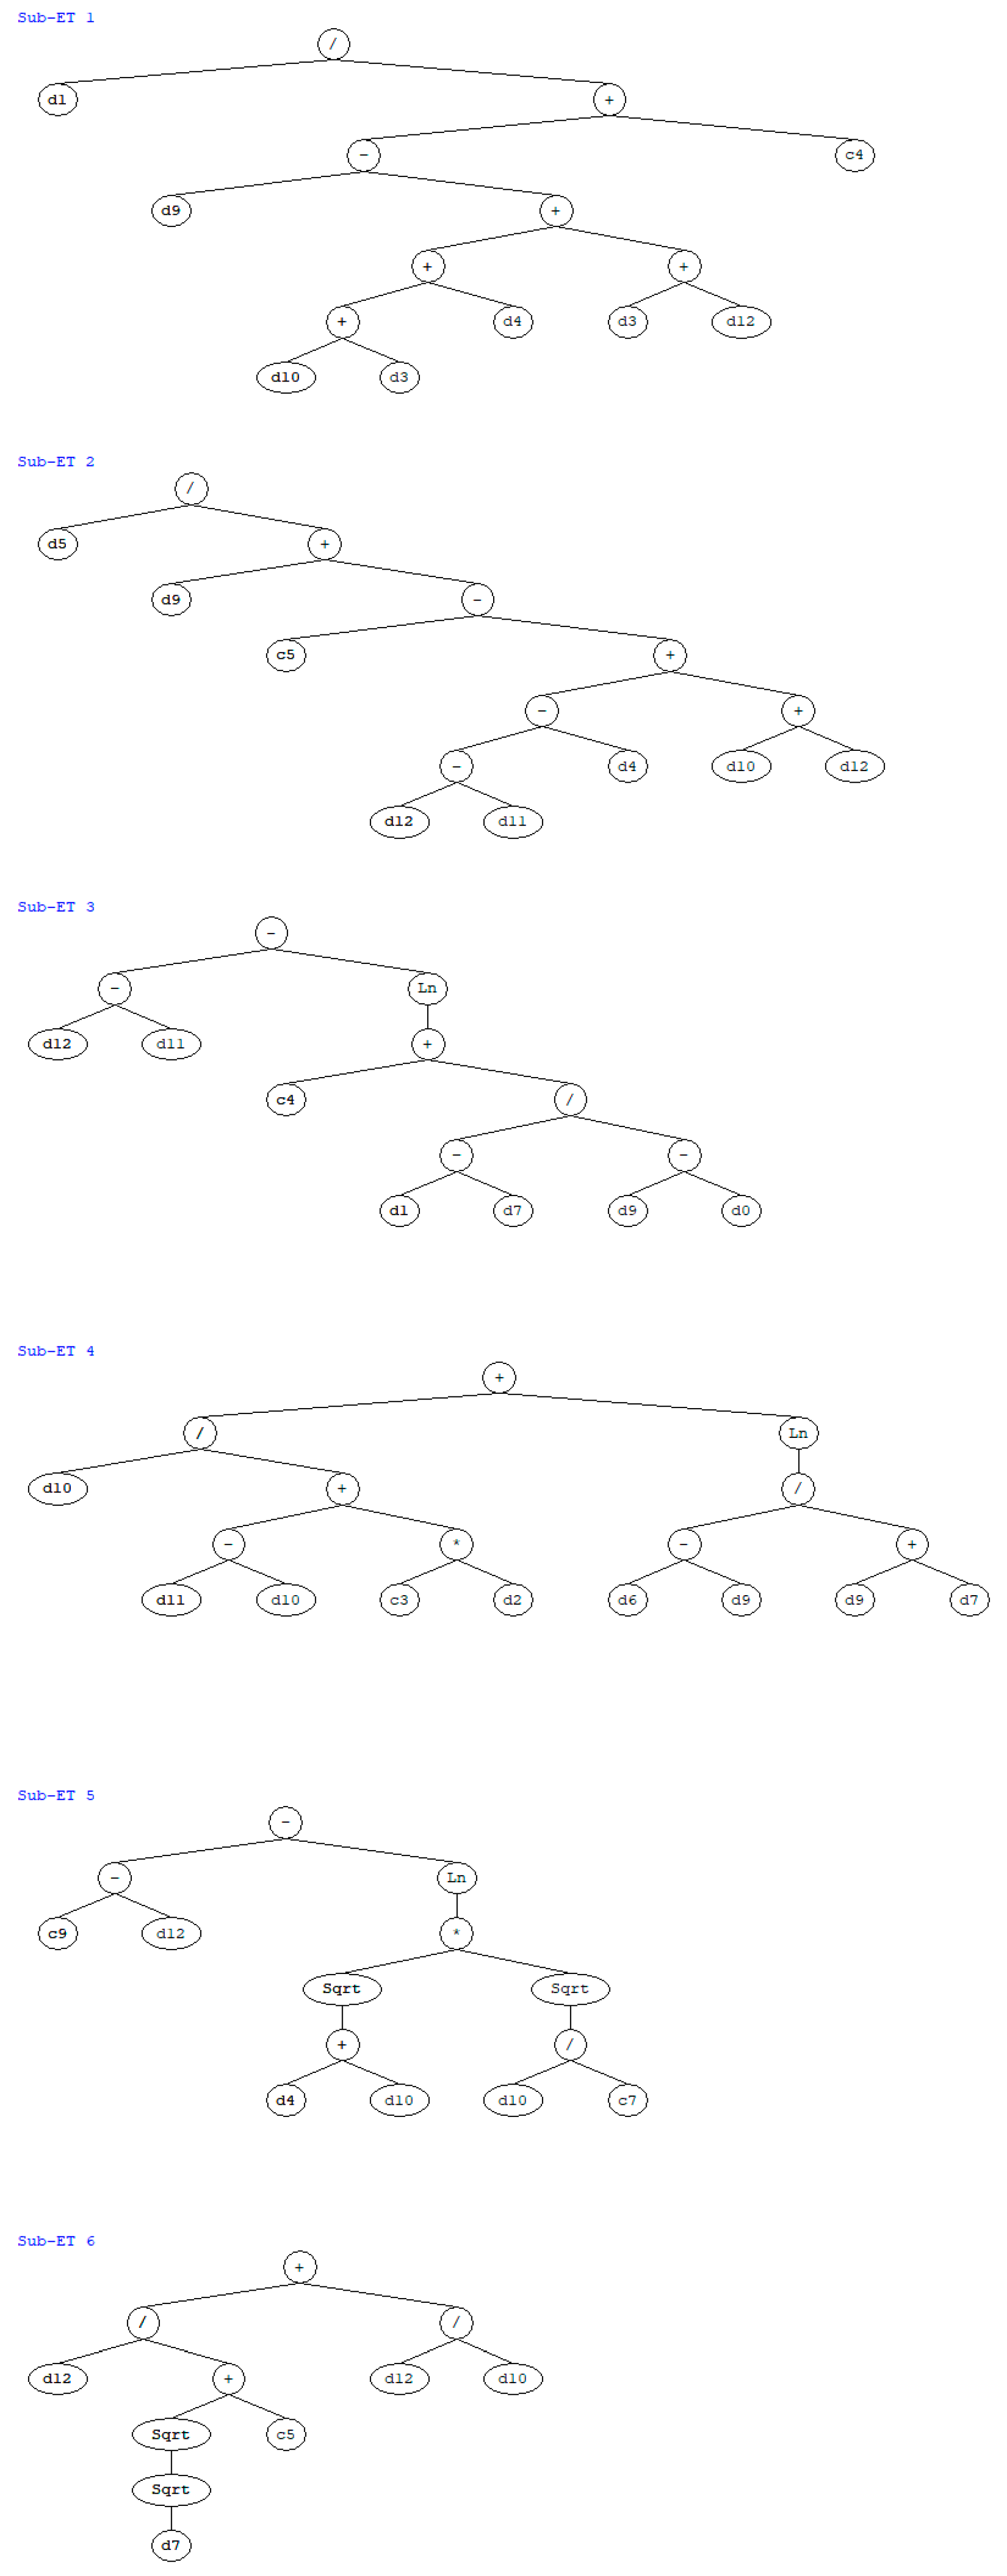
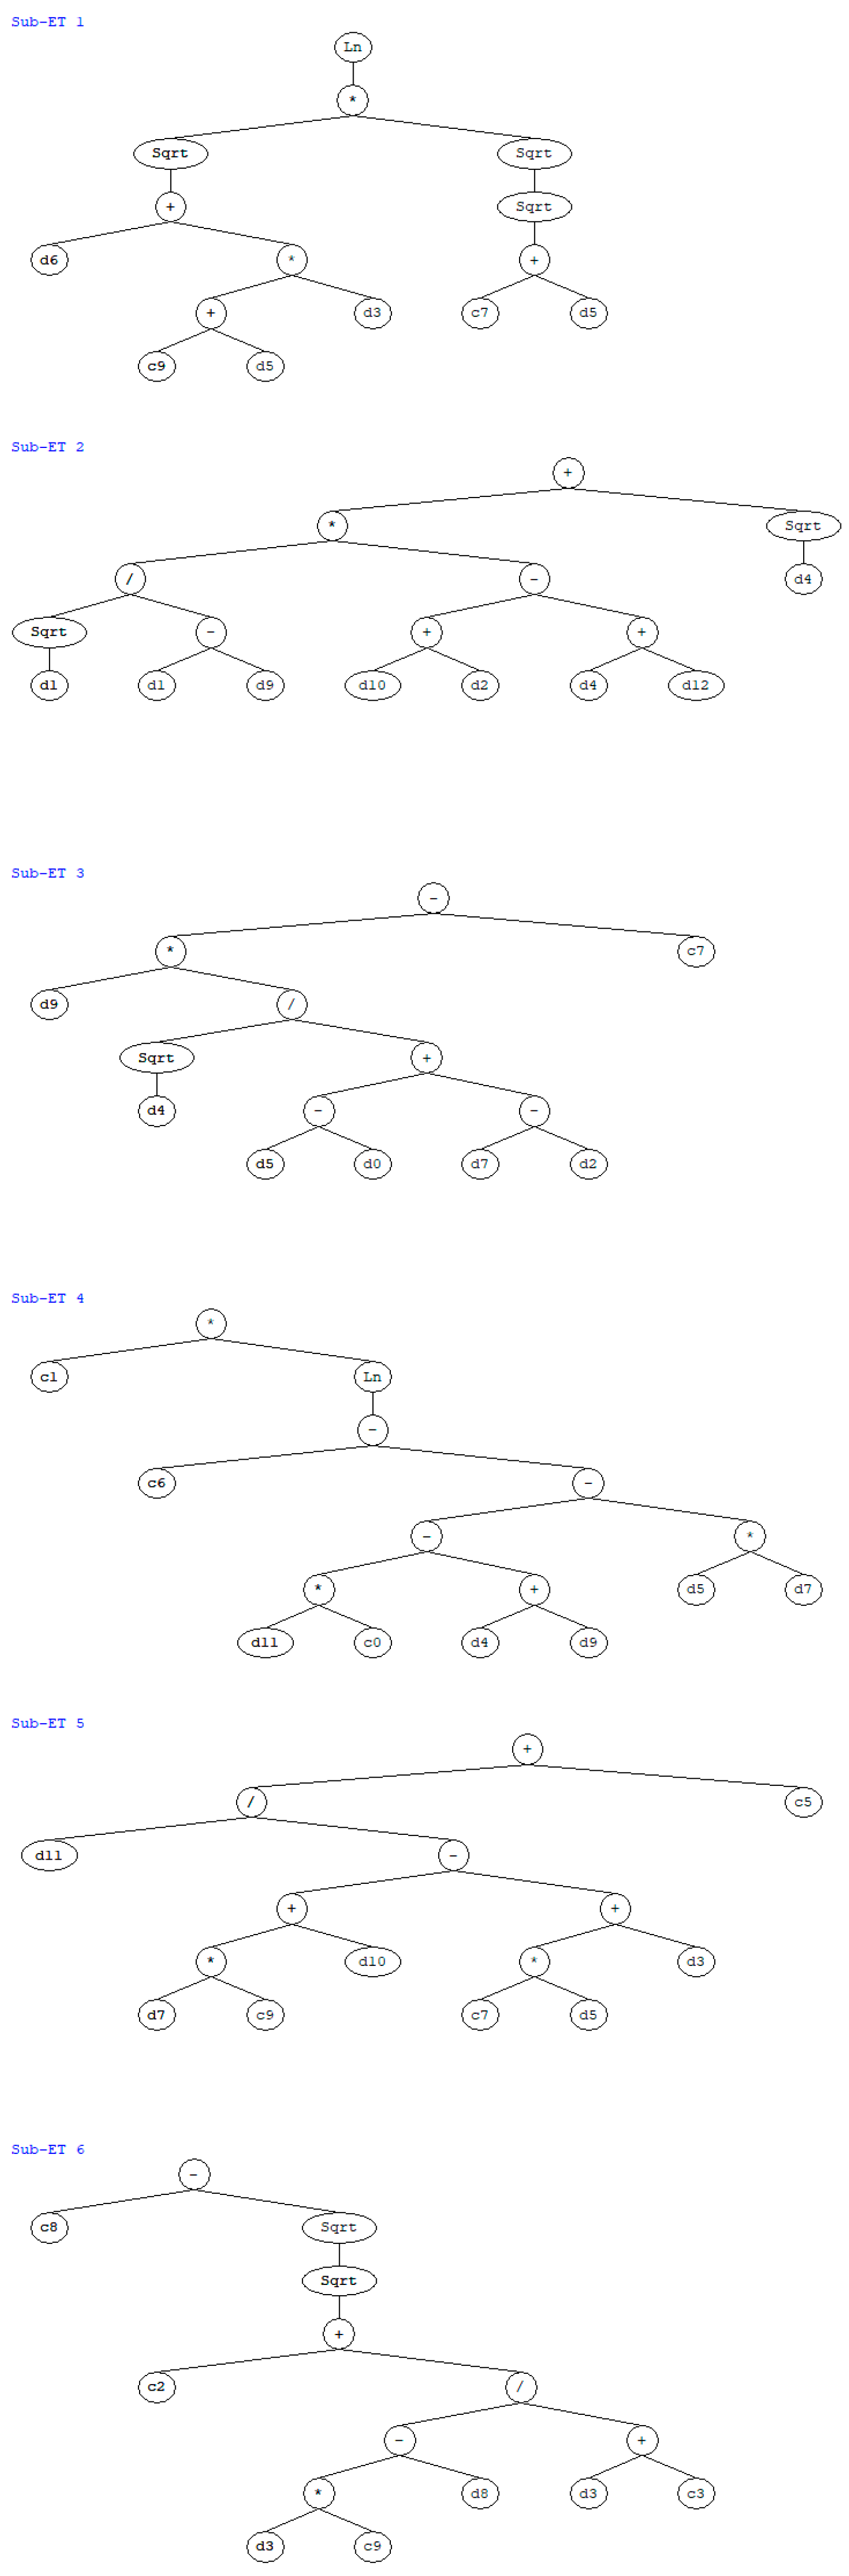
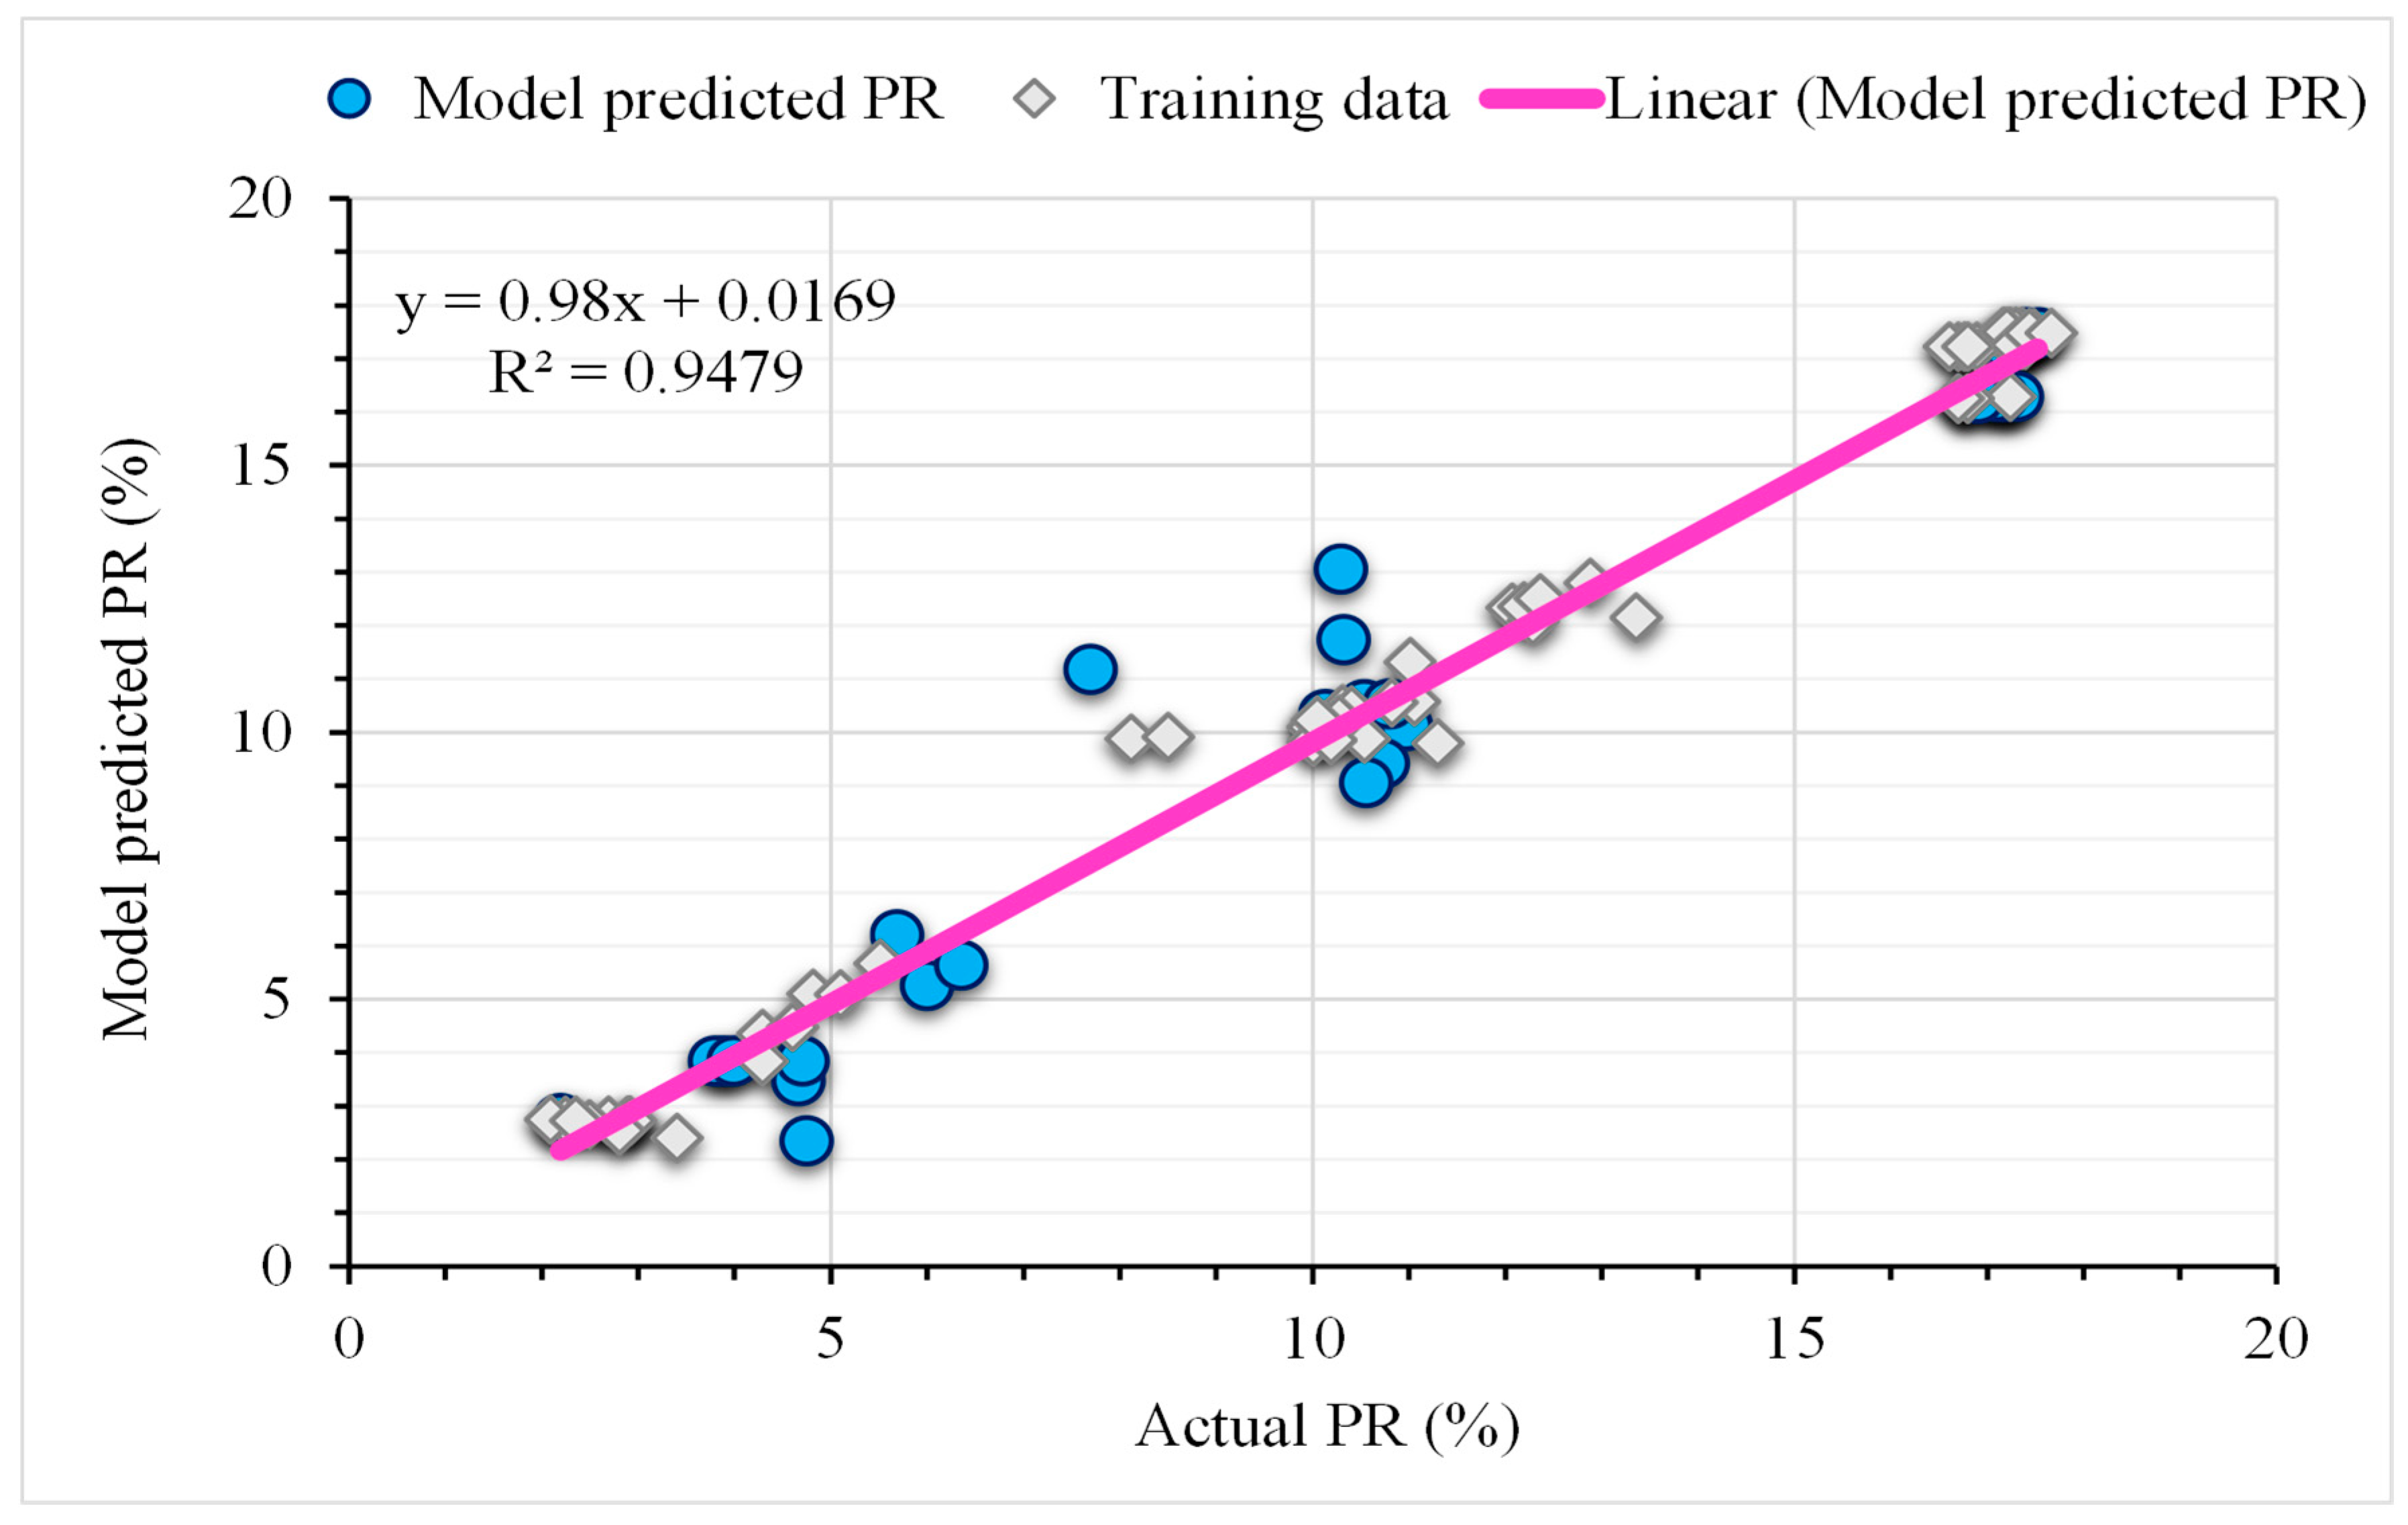
4.4. GEP Modelling for UHPC Porosity (PR)

The GEP technique developed models in ET form, as shown in Figure 16, to infer mathematical correlations for computing the FA based on the size of the head and the number of chromosomes. The majority of the sub-ETs for the FA are formulated using the five arithmetic operators +, −, x, ÷, and cubic root. The sub-ETs obtained using the GEP model are encrypted to produce the final result, which is a mathematical formula. With these input parameters, FA can be predicted in the future. Equation (5) shows the mathematical results for both output values. The developed model outperforms an ideal model under UHPC settings and has a large enough number of data points.
P R = S + T + U + V + W + X
S = L n   S a + S F × L S 3.42 × 2.67 5 + L S
T = F a s h F a s h + W a × S P + S g N S + S F L + N S
U = W a × N S L S C e m + C A S g + 4.35
V = 1.55 × L n 40.01 48.15   S F c N S + W a ( L S × C A )
W = S F c 0.0567   C A + S P + S F 0.0088   L S 1.82
X = 5.57 0.097 Q u + 5.89   S F S F 0.11
where P R = model estimated porosity in %; C e m = cement content; F a s h = fly ash content; S g = slag content; S F = silica fume content; N S = nano-silica content; L S = limestone content; S a = sand content; Q u = quartz content; W a = water content; S P = superplasticizer content; S F c = steel fiber content; S F L = steel fiber length.
The compressive strength regression lines of the training and validation sets’ experimental values are contrasted with the model’s predicted results in Figure 17. It is clear that the regression lines’ slope indicates that the R2 value between the experimental and projected values is 0.94. The inclination of the regression lines is about the same for training datasets, which are near the perfect match (equals to 1). A plot of the absolute error of the proposed GEP equation against the experimental values is shown in Figure 18, which gives a general idea of the maximum error percentage of the GEP model. The GEP equation’s results and the experimental results are almost identical, as seen by the reported minimum and maximum absolute error values of 0.023 and 3.47, respectively. The fact that maximum error frequencies are far less frequent must be noted.

Rendering of Jupyter-Based Graphical User Interface (GUI) for UHPC Porosity

Porosity is a pivotal parameter in assessing the durability of UHPC, particularly when applied to structures where longevity and resistance to environmental factors are paramount. The lower the porosity of UHPC, the higher its ability to withstand corrosive elements, freeze–thaw cycles, and ingress of harmful substances, which are critical considerations in durability applications. The GUI, as depicted in Figure S4, incorporates inputs such as diameter of steel fibers, the type of cement used, the content of silica fume, the class and compressive strength of cement, as well as the amounts of sand, fly ash, water, nano-silica, limestone powder, quartz powder, and slag, the size of the maximum aggregate and the contents of superplasticizer, coarse aggregate, polystyrene fiber, the length and diameter of polystyrene fibers, the length of steel fibers, and the curing time to estimate the porosity of UHPC. Here is the relationship between these inputs and the porosity of UHPC in the context of durability:
  • Cement content and the associated parameters dictate the density and strength of the cement matrix, influencing the overall porosity.
  • Pozzolanic materials such as fly ash, slag, and silica fume contribute to the pozzolanic reaction, which refines the pore structure and reduces porosity.
  • Nano-silica reacts with calcium hydroxide to form additional calcium silicate hydrate (C-S-H), reducing the void spaces within the concrete.
  • Limestone powder can enhance the packing density of the mix, further reducing porosity.
  • Sand, coarse aggregate content, and maximum aggregate size are optimized for a tight gradation that minimizes voids, and thus porosity.
  • Quartz powder, known for its hardness, also contributes to a more compact concrete structure when used as a fine filler.
  • The water content in the mix is crucial since excessive water can lead to increased porosity upon evaporation.
  • Superplasticizer aids in reducing water content without losing workability, thus maintaining a low porosity.
  • The uniform distribution of steel and polystyrene fibers in the UHPC mix assist in crack arresting to resist the propagation of cracks in the respective matrix. This behavior can lead towards reduced porosity.
  • Moreover, the proper completion of hydration process is attained through proper curing, which results in better microstructure and porosity.
As far as the durability related applications of UHPC are concerned, a mix with definite microstructure is a must. These applications include bridges, marine structures, and rigid pavements, etc. The employed GUI aids in offering an effective understanding regarding the prediction of UHPC porosity in relevance with variations in the parameters considered for respective UHPC mix design. The effective prediction though GUI for attaining lesser porosity is beneficial for the designers in designing effective UHPC mix with maximum durability, ultimately leading towards durable structures with least maintenance requirements. This confirms the GUI as an effective tool for progressing towards sustainable development by establishing resilient infrastructures which are resistant to harsh environments.
Here, the significance of GUI based models in effective prediction of UHPC porosity is discussed for durability. The durability of cementitious concrete structures in harsh environmental areas is mainly dependent on porosity. The input factors have their own unique influence on the UHPC porosity which are crucial in resisting the effect of deleterious matters, i.e., sulphates, chloride ions, and water. For example, the adoption of SCMs such as nano-silica and silica fume, without coarse aggregates, reduces pore connectivity in UHPC, and thus its porosity. Moreover, adequate w/c ratio, superplasticizers, and curing time alleviate porosity by enhancing hydration and densification of cementitious materials. The input factors are the compressive strength of cement, contents of cement, sand, silica fume, superplasticizer, and water. The percentage error between the predicted and experimental porosity values is approximately 7.09%. This indicates a moderate deviation between the predicted and actual values, suggesting that further refinement of the predictive model may be necessary to enhance accuracy. Nonetheless, such predictions facilitated by the GUI provide valuable insights for engineers and researchers in optimizing UHPC mix designs to achieve desired porosity levels for improved durability in various structural applications.

5. Discussion

Table 2 shows that different models perform better for different materials and different properties in the current and previous studies. ANN performs well for recycled glass and eggshell cement composite with R2 of 0.87, while SVM is better for geopolymer concrete with R2 of 0.78. The GEP model appears to be very successful in predicting FA, CS, FS, and PR of UHPC, with higher R2 values of 0.94, 0.95, 0.93, and 0.94, respectively. The R2 values in the table suggest that GEP can be highly effective in predicting the properties of UHPC. GEP appears to be a particularly strong performer, but other models also show promise for specific materials and properties. The table demonstrates the potential of GEP to accurately predict material properties, which could lead to more efficient and cost-effective material development and design.
Predictive models enable engineers to optimize material usage in UHPC applications, reducing waste and costs by accurately predicting material properties without the need for laboratory tests. These models help in the early design stages by evaluating different UHPC material combinations, predicting performance under various conditions, and tailoring UHPC for specific applications such as higher compressive strength for bridges or improved fire resistance for buildings. They also facilitate the development of sustainable UHPC materials, ensure consistent quality in precast UHPC elements, and predict long-term performance for enhanced structural integrity and safety.
The GEP model for predicting UHPC properties has several limitations, including its dependence on the size training data, which can affect its accuracy when applied to new formulations. The model’s sensitivity to changes in input parameters like cement type and aggregate size may result in increased prediction errors if these inputs deviate significantly from the training dataset. To address these limitations, future research should focus on expanding the training dataset to encompass a broader range of UHPC formulations and conducting detailed sensitivity analyses to better understand the model’s performance across different inputs. Comprehensive validation across varied real-world scenarios could significantly improve the model’s robustness for UHPC, making it a more reliable and versatile tool for the construction industry. For future work, we recommend exploring Partial Dependence Plots (PDPs) for UHPC to further visualize the relationships between individual UHPC components and their corresponding properties. These plots can help identify and explain the influence of specific features on the predictive model, enabling a more detailed analysis of feature importance [83,84]. The GEP is also recommended to estimate the performance of structural concrete members and buildings as explored in previous studies [85,86].

6. Conclusions

The primary focus of this study is to assess the efficacy of Gene Expression Programming (GEP), one of the machine learning techniques, in forecasting the flowability, compressive and flexural strengths, and porosity of UHPC. This input parameters includes the diameter of steel and polystyrene fibers (µm and mm), the length of the fibers (mm), the maximum size of aggregate particles (mm), the type of cement, its strength class, and the compressive strength (MPa) type, the contents of steel and polystyrene fibers (%), and water (kg/m3). In addition, it includes fly ash, silica fume, slag, nano-silica, quartz powder, limestone powder, sand, coarse aggregates, and superplasticizers, with all measurements in kg/m3. The investigation performed has led to the following conclusions:
  • The GEP method offers a simplified, equation-based representation of UHPC characteristics such as flowability, compressive strength, flexural strength, and porosity. It demonstrates a high level of accuracy, closely aligning with both modeled and experimental results, effectively accounting for both linear and nonlinear data.
  • The GEP model provides the necessary equations for accurate prediction of UHPC characteristics using manual computations, making the evaluation process more straightforward and reliable.
  • By incorporating a range of input factors, the GEP machine learning model achieved high accuracy in predicting UHPC properties, with R2-values of 0.94, 0.95, 0.93, and 0.94 for flowability, compressive strength, flexural strength, and porosity, respectively.
  • The value of R2 for GEP in predicting flowability, compressive strength, flexural strength, and porosity of UHPC is higher than that of other models (ANN and SVM etc.) in previous studies.
  • A GUI was developed to visualize and predict UHPC properties, including flowability, compressive and flexural strengths, and porosity. The GUI enhances the user experience for researchers by providing an intuitive, efficient, and visually appealing platform, thereby improving overall productivity.
This study establishes more effective material optimization, leading to cost savings and improved performance in construction projects. The implications of this work are substantial, promoting more sustainable and cost-effective construction practices, enabling tailored UHPC formulations for specific applications, and improving long-term material performance in diverse conditions.

Supplementary Materials

The following supporting information can be downloaded at: https://www.mdpi.com/article/10.3390/buildings14092675/s1, Figure S1. Graphical user interface (GUI) for predicting flowability. Figure S2. GUI for compressive strength prediction. Figure S3. GUI for flexural strength prediction. Figure S4. GUI for predicting the porosity.

Author Contributions

Conceptualization, Y.Q. and M.S.; Methodology, Y.Q., J.Y. and A.H.A.; Software, Y.Q. and W.Y.; Validation, J.Y., W.Y., A.H.A. and A.M.A.; Formal Analysis, Y.Q. and M.S.; Investigation, J.Y.; Resources, J.Y. and A.H.A.; Data Curation, W.Y. and A.A.; Writing—Original Draft, Y.Q.; Writing—Review and Editing, J.Y., W.Y., A.H.A., A.A., A.M.A. and M.S.; Visualization, A.A. and A.M.A.; Supervision, J.Y. and M.S.; Project Administration, A.H.A., A.A., A.M.A. and M.S.; Funding Acquisition, A.H.A., A.A. and A.M.A. All authors have read and agreed to the published version of the manuscript.

Funding

This research was supported by National Natural Science Foundation of China (52209155), Hunan Natural Science Foundation (2023JJ30045) and Hunan Provincial Department of Water Resources Science and Technology Project (22cslg034).

Data Availability Statement

The raw data of this article will be made available by reasonable request from corresponding authors.

Conflicts of Interest

The authors declare no conflicts of interest.

References

  1. Shi, C.; Wu, Z.; Xiao, J.; Wang, D.; Huang, Z.; Fang, Z. A review on ultra high performance concrete: Part I. Raw materials and mixture design. Constr. Build. Mater. 2015, 101, 741–751. [Google Scholar] [CrossRef]
  2. Wu, Z.; Shi, C.; He, W.; Wang, D. Uniaxial compression behavior of ultra-high performance concrete with hybrid steel fiber. J. Mater. Civ. Eng. 2016, 28, 06016017. [Google Scholar] [CrossRef]
  3. Khan, M.; Kai, M.; Ahmad, M.R.; Lao, J.; Dai, J.-G. Fire Performance of Fiber-reinforced Ultra-High-Performance Concrete: A state-of-the-art review. J. Asian Concr. Fed. 2023, 9, 65–102. [Google Scholar] [CrossRef]
  4. Park, S.H.; Kim, D.J.; Ryu, G.S.; Koh, K.T. Tensile behavior of ultra high performance hybrid fiber reinforced concrete. Cem. Concr. Compos. 2012, 34, 172–184. [Google Scholar] [CrossRef]
  5. Habel, K.; Viviani, M.; Denarié, E.; Brühwiler, E. Development of the mechanical properties of an ultra-high performance fiber reinforced concrete (UHPFRC). Cem. Concr. Res. 2006, 36, 1362–1370. [Google Scholar] [CrossRef]
  6. Schmidt, M.; Fehling, E. Ultra-high-performance concrete: Research, development and application in Europe. ACI Spec. Publ. 2005, 228, 51–78. [Google Scholar]
  7. Wang, D.; Shi, C.; Wu, Z.; Xiao, J.; Huang, Z.; Fang, Z. A review on ultra high performance concrete: Part II. Hydration, microstructure and properties. Constr. Build. Mater. 2015, 96, 368–377. [Google Scholar] [CrossRef]
  8. Ali, B.; Farooq, M.A.; El Ouni, M.H.; Azab, M.; Elhag, A.B. The combined effect of coir and superplasticizer on the fresh, mechanical, and long-term durability properties of recycled aggregate concrete. J. Build. Eng. 2022, 59, 105009. [Google Scholar] [CrossRef]
  9. Zhang, C.; Ali, A. The advancement of seismic isolation and energy dissipation mechanisms based on friction. Soil Dyn. Earthq. Eng. 2021, 146, 106746. [Google Scholar] [CrossRef]
  10. Essam, A.; Mostafa, S.A.; Khan, M.; Tahwia, A.M. Modified particle packing approach for optimizing waste marble powder as a cement substitute in high-performance concrete. Constr. Build. Mater. 2023, 409, 133845. [Google Scholar] [CrossRef]
  11. Zhou, M.; Lu, W.; Song, J.; Lee, G.C. Application of ultra-high performance concrete in bridge engineering. Constr. Build. Mater. 2018, 186, 1256–1267. [Google Scholar] [CrossRef]
  12. Yoo, D.-Y.; Banthia, N. Mechanical properties of ultra-high-performance fiber-reinforced concrete: A review. Cem. Concr. Compos. 2016, 73, 267–280. [Google Scholar] [CrossRef]
  13. Yu, R.; Spiesz, P.; Brouwers, H. Mix design and properties assessment of ultra-high performance fibre reinforced concrete (UHPFRC). Cem. Concr. Res. 2014, 56, 29–39. [Google Scholar] [CrossRef]
  14. Khan, M.; Lao, J.; Ahmad, M.R.; Kai, M.-F.; Dai, J.-G. The role of calcium aluminate cement in developing an efficient ultra-high performance concrete resistant to explosive spalling under high temperatures. Constr. Build. Mater. 2023, 384, 131469. [Google Scholar] [CrossRef]
  15. Lao, J.-C.; Xu, L.-Y.; Huang, B.-T.; Zhu, J.-X.; Khan, M.; Dai, J.-G. Utilization of sodium carbonate activator in strain-hardening ultra-high-performance geopolymer concrete (SH-UHPGC). Front. Mater. 2023, 10, 1142237. [Google Scholar] [CrossRef]
  16. Chen, Y.X.; Li, S.; Mezari, B.; Hensen, E.J.; Yu, R.; Schollbach, K. Effect of highly dispersed colloidal olivine nano-silica on early age properties of ultra-high performance concrete. Cem. Concr. Compos. 2022, 131, 104564. [Google Scholar] [CrossRef]
  17. Liu, J.; Shi, C.; Wu, Z. Hardening, microstructure, and shrinkage development of UHPC: A review. J. Asian Concr. Fed. 2019, 5, 1–19. [Google Scholar] [CrossRef]
  18. Kang, S.-T.; Kim, J.H.; Lee, B.Y. Effects of water reducing admixture on rheological properties, fiber distribution, and mechanical behavior of UHPFRC. Appl. Sci. 2018, 9, 29. [Google Scholar] [CrossRef]
  19. Le Hoang, A.; Fehling, E. Influence of steel fiber content and aspect ratio on the uniaxial tensile and compressive behavior of ultra high performance concrete. Constr. Build. Mater. 2017, 153, 790–806. [Google Scholar] [CrossRef]
  20. Larsen, I.L.; Thorstensen, R.T. The influence of steel fibres on compressive and tensile strength of ultra high performance concrete: A review. Constr. Build. Mater. 2020, 256, 119459. [Google Scholar] [CrossRef]
  21. Jiang, X.; Zhang, Y.; Xiao, R.; Polaczyk, P.; Zhang, M.; Hu, W. A comparative study on geopolymers synthesized by different classes of fly ash after exposure to elevated temperatures. J. Clean. Prod. 2020, 270, 122500. [Google Scholar] [CrossRef]
  22. Raza, S.S.; Amir, M.T.; Azab, M.; Ali, B.; Abdallah, M.; El Ouni, M.H.; Elhag, A.B. Effect of micro-silica on the physical, tensile, and load-deflection characteristics of micro fiber-reinforced high-performance concrete (HPC). Case Stud. Constr. Mater. 2022, 17, e01380. [Google Scholar] [CrossRef]
  23. Zhang, W.; Huang, Y. Three-dimensional numerical investigation of mixed-mode debonding of FRP-concrete interface using a cohesive zone model. Constr. Build. Mater. 2022, 350, 128818. [Google Scholar] [CrossRef]
  24. Khan, M.; Lao, J.; Ahmad, M.R.; Dai, J.-G. Influence of high temperatures on the mechanical and microstructural properties of hybrid steel-basalt fibers based ultra-high-performance concrete (UHPC). Constr. Build. Mater. 2024, 411, 134387. [Google Scholar] [CrossRef]
  25. Huang, Y.; Zhang, W.; Liu, X. Assessment of Diagonal Macrocrack-Induced Debonding Mechanisms in FRP-Strengthened RC Beams. J. Compos. Constr. 2022, 26, 04022056. [Google Scholar] [CrossRef]
  26. Kumar, B.N.; Kumar, P.P. Prediction on Flexural strength of High Strength Hybrid Fiber Self Compacting Concrete by using Artificial Intelligence. J. Artif. Intell. 2022, 4, 1–16. [Google Scholar] [CrossRef]
  27. Nehdi, M.; El Chabib, H.; El Naggar, M.H. Predicting performance of self-compacting concrete mixtures using artificial neural networks. Mater. J. 2001, 98, 394–401. [Google Scholar]
  28. Nguyen, T.T.; Duy, H.P.; Thanh, T.P.; Vu, H.H. Compressive Strength Evaluation of Fiber-Reinforced High-Strength Self-Compacting Concrete with Artificial Intelligence. Adv. Civ. Eng. 2020, 2020, 3012139. [Google Scholar] [CrossRef]
  29. Asri, Y.E.; Aicha, M.B.; Zaher, M.; Alaoui, A.H. Prediction of compressive strength of self-compacting concrete using four machine learning technics. Mater. Today Proc. 2022, 57, 859–866. [Google Scholar] [CrossRef]
  30. de-Prado-Gil, J.; Palencia, C.; Silva-Monteiro, N.; Martínez-García, R. To predict the compressive strength of self compacting concrete with recycled aggregates utilizing ensemble machine learning models. Case Stud. Constr. Mater. 2022, 16, e01046. [Google Scholar] [CrossRef]
  31. Balf, F.R.; Kordkheili, H.M.; Kordkheili, A.M. A New method for predicting the ingredients of self-compacting concrete (SCC) including fly ash (FA) using data envelopment analysis (DEA). Arab. J. Sci. Eng. 2021, 46, 4439–4460. [Google Scholar] [CrossRef]
  32. Kovačević, M.; Lozančić, S.; Nyarko, E.K.; Hadzima-Nyarko, M. Modeling of compressive strength of self-compacting rubberized concrete using machine learning. Materials 2021, 14, 4346. [Google Scholar] [CrossRef] [PubMed]
  33. Zhang, Z.; Liang, G.; Niu, Q.; Wang, F.; Chen, J.; Zhao, B.; Ke, L. A Wiener degradation process with drift-based approach of determining target reliability index of concrete structures. Qual. Reliab. Eng. Int. 2022, 38, 3710–3725. [Google Scholar] [CrossRef]
  34. Marani, A.; Jamali, A.; Nehdi, M.L. Predicting ultra-high-performance concrete compressive strength using tabular generative adversarial networks. Materials 2020, 13, 4757. [Google Scholar] [CrossRef]
  35. Lu, J.; Yu, Z.; Zhu, Y.; Huang, S.; Luo, Q.; Zhang, S. Effect of lithium-slag in the performance of slag cement mortar based on least-squares support vector machine prediction. Materials 2019, 12, 1652. [Google Scholar] [CrossRef] [PubMed]
  36. Solhmirzaei, R.; Salehi, H.; Kodur, V.; Naser, M. Machine learning framework for predicting failure mode and shear capacity of ultra high performance concrete beams. Eng. Struct. 2020, 224, 111221. [Google Scholar] [CrossRef]
  37. Ferreira, C. Gene Expression Programming, Mathematical Modeling by an Artificial Intelligence, 2nd ed.; Springer: Berlin/Heidelberg, Germany, 2006; pp. XX, 480. [Google Scholar]
  38. Gandomi, A.; Yun, G.; Alavi, A. An evolutionary approach for modeling of shear strength of RC deep beams. Mater. Struct. 2013, 46, 2109–2119. [Google Scholar] [CrossRef]
  39. Gandomi, A.H.; Babanajad, S.K.; Alavi, A.H.; Farnam, Y. Novel Approach to Strength Modeling of Concrete under Triaxial Compression. J. Mater. Civ. Eng. 2012, 24, 1132–1143. [Google Scholar] [CrossRef]
  40. Khan, M.; Lao, J.; Dai, J.-G. Comparative study of advanced computational techniques for estimating the compressive strength of UHPC. J. Asian Concr. Fed. 2022, 8, 51–68. [Google Scholar] [CrossRef]
  41. Wang, Q.; Hussain, A.; Farooqi, M.U.; Deifalla, A.F. Artificial intelligence-based estimation of ultra-high-strength concrete’s flexural property. Case Stud. Constr. Mater. 2022, 17, e01243. [Google Scholar] [CrossRef]
  42. Chaabene, W.B.; Flah, M.; Nehdi, M.L. Machine learning prediction of mechanical properties of concrete: Critical review. Constr. Build. Mater. 2020, 260, 119889. [Google Scholar] [CrossRef]
  43. Suleiman, A.R.; Nehdi, M.L. Modeling self-healing of concrete using hybrid genetic algorithm–artificial neural network. Materials 2017, 10, 135. [Google Scholar] [CrossRef] [PubMed]
  44. Marani, A.; Nehdi, M.L. Machine learning prediction of compressive strength for phase change materials integrated cementitious composites. Constr. Build. Mater. 2020, 265, 120286. [Google Scholar] [CrossRef]
  45. Castelli, M.; Vanneschi, L.; Silva, S. Prediction of high performance concrete strength using genetic programming with geometric semantic genetic operators. Expert Syst. Appl. 2013, 40, 6856–6862. [Google Scholar] [CrossRef]
  46. Han, Q.; Gui, C.; Xu, J.; Lacidogna, G. A generalized method to predict the compressive strength of high-performance concrete by improved random forest algorithm. Constr. Build. Mater. 2019, 226, 734–742. [Google Scholar] [CrossRef]
  47. Al-Shamiri, A.K.; Yuan, T.-F.; Kim, J.H. Non-tuned machine learning approach for predicting the compressive strength of high-performance concrete. Materials 2020, 13, 1023. [Google Scholar] [CrossRef]
  48. Dingqiang, F.; Rui, Y.; Zhonghe, S.; Chunfeng, W.; Jinnan, W.; Qiqi, S. A novel approach for developing a green Ultra-High Performance Concrete (UHPC) with advanced particles packing meso-structure. Constr. Build. Mater. 2020, 265, 120339. [Google Scholar] [CrossRef]
  49. Fan, D.Q.; Yu, R.; Shui, Z.H.; Wu, C.F.; Song, Q.L.; Liu, Z.J. A new design approach of steel fibre reinforced ultra-high performance concrete composites: Experiments and modeling. Cem. Concr. Compos. 2020, 110, 103597. [Google Scholar] [CrossRef]
  50. Deng, F.; He, Y.; Zhou, S.; Yu, Y.; Cheng, H.; Wu, X. Compressive strength prediction of recycled concrete based on deep learning. Constr. Build. Mater. 2018, 175, 562–569. [Google Scholar] [CrossRef]
  51. Zhang, J.; Huang, Y.; Aslani, F.; Ma, G.; Nener, B. A hybrid intelligent system for designing optimal proportions of recycled aggregate concrete. J. Clean. Prod. 2020, 273, 122922. [Google Scholar] [CrossRef]
  52. Han, T.; Siddique, A.; Khayat, K.; Huang, J.; Kumar, A. An ensemble machine learning approach for prediction and optimization of modulus of elasticity of recycled aggregate concrete. Constr. Build. Mater. 2020, 244, 118271. [Google Scholar] [CrossRef]
  53. Behnood, A.; Golafshani, E.M. Machine learning study of the mechanical properties of concretes containing waste foundry sand. Constr. Build. Mater. 2020, 243, 118152. [Google Scholar] [CrossRef]
  54. Zhu, P.; Cao, W.; Zhang, L.; Zhou, Y.; Wu, Y.; Ma, Z.J. Interpretable Machine Learning Models for Prediction of UHPC Creep Behavior. Buildings 2024, 14, 2080. [Google Scholar] [CrossRef]
  55. Pishro, A.A.; Zhang, S.; Hu, Q.; Zhang, Z.; Pishro, M.A.; Zhang, L. Advancing ultimate bond stress–slip model of UHPC structures through a novel hybrid machine learning approach. Structures 2024, 62, 106162. [Google Scholar] [CrossRef]
  56. Ullah, R.; Qiang, Y.; Ahmad, J.; Vatin, N.I.; El-Shorbagy, M.A. Ultra-high-performance concrete (UHPC): A state-of-the-art review. Materials 2022, 15, 4131. [Google Scholar] [CrossRef]
  57. Pishro, A.A.; Zhang, Z.; Pishro, M.A.; Xiong, F.; Zhang, L.; Yang, Q.; Matlan, S.J. UHPC-PINN-parallel micro element system for the local bond stress–slip model subjected to monotonic loading. Structures 2022, 46, 570–597. [Google Scholar] [CrossRef]
  58. Li, Y.; Yang, X.; Ren, C.; Wang, L.; Ning, X. Predicting the Compressive Strength of Ultra-High-Performance Concrete Based on Machine Learning Optimized by Meta-Heuristic Algorithm. Buildings 2024, 14, 1209. [Google Scholar] [CrossRef]
  59. Holland, J.H. An Introductory Analysis with Applications to Biology, Control, and Artificial Intelligence. In Computing and Processing; MIT Press: Cambridge, MA, USA, 1992; p. 211. [Google Scholar]
  60. Koza, J.R.; Koza, J.R. Genetic Programming: On the Programming of Computers by Means of Natural Selection; MIT Press: Cambridge, MA, USA, 1992. [Google Scholar]
  61. Gholampour, A.; Ozbakkaloglu, T.; Hassanli, R. Behavior of rubberized concrete under active confinement. Constr. Build. Mater. 2017, 138, 372–382. [Google Scholar] [CrossRef]
  62. Sarıdemir, M. Genetic programming approach for prediction of compressive strength of concretes containing rice husk ash. Constr. Build. Mater. 2010, 24, 1911–1919. [Google Scholar] [CrossRef]
  63. Nazari, A.; Torgal, F.P. Modeling the compressive strength of geopolymeric binders by gene expression programming-GEP. Expert Syst. Appl. 2013, 40, 5427–5438. [Google Scholar] [CrossRef]
  64. Nazar, S.; Yang, J.; Javed, M.F.; Khan, K.; Li, L.; Liu, Q.-F. An evolutionary machine learning-based model to estimate the rheological parameters of fresh concrete. Structures 2023, 48, 1670–1683. [Google Scholar] [CrossRef]
  65. Amin, M.N.; Ahmad, W.; Khan, K.; Deifalla, A.F. Optimizing compressive strength prediction models for rice husk ash concrete with evolutionary machine intelligence techniques. Case Stud. Constr. Mater. 2023, 18, e02102. [Google Scholar] [CrossRef]
  66. Soroush, M.; Yi, B. The key material properties of ultra-high-performance concrete (UHPC). Mendeley Data 2021, 1. [Google Scholar] [CrossRef]
  67. Abdollahzadeh, G.; Jahani, E.; Kashir, Z. Genetic programming based formulation to predict compressive strength of high strength concrete. Civ. Eng. Infrastruct. J. 2017, 50, 207–219. [Google Scholar]
  68. Murad, Y. Compressive strength prediction for concrete modified with nanomaterials. Case Stud. Constr. Mater. 2021, 15, e00660. [Google Scholar] [CrossRef]
  69. Alabduljabbar, H.; Khan, M.; Awan, H.H.; Eldin, S.M.; Alyousef, R.; Mohamed, A.M. Predicting ultra-high-performance concrete compressive strength using gene expression programming method. Case Stud. Constr. Mater. 2023, 18, e02074. [Google Scholar] [CrossRef]
  70. Alavi, A.H.; Gandomi, A.H.; Nejad, H.C.; Mollahasani, A.; Rashed, A. Design equations for prediction of pressuremeter soil deformation moduli utilizing expression programming systems. Neural Comput. Appl. 2013, 23, 1771–1786. [Google Scholar] [CrossRef]
  71. Asif, U.; Javed, M.F.; Abuhussain, M.; Ali, M.; Khan, W.A.; Mohamed, A. Predicting the mechanical properties of plastic concrete: An optimization method by using genetic programming and ensemble learners. Case Stud. Constr. Mater. 2024, 20, e03135. [Google Scholar] [CrossRef]
  72. Ferreira, C. Gene expression programming: A new adaptive algorithm for solving problems. arXiv 2001, arXiv:cs/0102027. [Google Scholar]
  73. Ferreira, C. Genetic representation and genetic neutrality in gene expression programming. Adv. Complex Syst. 2002, 5, 389–408. [Google Scholar] [CrossRef]
  74. Hanandeh, S.; Ardah, A.; Abu-Farsakh, M. Using artificial neural network and genetics algorithm to estimate the resilient modulus for stabilized subgrade and propose new empirical formula. Transp. Geotech. 2020, 24, 100358. [Google Scholar] [CrossRef]
  75. Iqbal, M.F.; Liu, Q.F.; Azim, I.; Zhu, X.; Yang, J.; Javed, M.F.; Rauf, M. Prediction of mechanical properties of green concrete incorporating waste foundry sand based on gene expression programming. J. Hazard. Mater. 2020, 384, 121322. [Google Scholar] [CrossRef] [PubMed]
  76. Shahin, M.A. Genetic programming for modelling of geotechnical engineering systems. In Handbook of Genetic Programming Applications; Springer: Berlin/Heidelberg, Germany, 2015; pp. 37–57. [Google Scholar]
  77. Soleimani, S.; Rajaei, S.; Jiao, P.; Sabz, A.; Soheilinia, S. New prediction models for unconfined compressive strength of geopolymer stabilized soil using multi-gen genetic programming. Measurement 2018, 113, 99–107. [Google Scholar] [CrossRef]
  78. Zhu, F.; Wu, X.; Lu, Y.; Huang, J. Strength Reduction Due to Acid Attack in Cement Mortar Containing Waste Eggshell and Glass: A Machine Learning-Based Modeling Study. Buildings 2024, 14, 225. [Google Scholar] [CrossRef]
  79. Amin, M.N.; Khan, K.; Ahmad, W.; Javed, M.F.; Qureshi, H.J.; Saleem, M.U. Compressive strength estimation of geopolymer composites through novel computational approaches. Polymers 2022, 14, 2128. [Google Scholar] [CrossRef]
  80. Arifeen, S.U.; Amin, M.N.; Ahmad, W.; Althoey, F.; Ali, M.; Alotaibi, B.S.; Abuhussain, M.A. A comparative study of prediction models for alkali-activated materials to promote quick and economical adaptability in the building sector. Constr. Build. Mater. 2023, 407, 133485. [Google Scholar] [CrossRef]
  81. Faraz, M.I.; Arifeen, S.U.; Amin, M.N.; Nafees, A.; Althoey, F.; Niaz, A. A comprehensive GEP and MEP analysis of a cement-based concrete containing metakaolin. Structures 2023, 53, 937–948. [Google Scholar] [CrossRef]
  82. Ahmad, A.; Ahmad, W.; Aslam, F.; Joyklad, P. Compressive strength prediction of fly ash-based geopolymer concrete via advanced machine learning techniques. Case Stud. Constr. Mater. 2022, 16, e00840. [Google Scholar] [CrossRef]
  83. Shafighfard, T.; Kazemi, F.; Asgarkhani, N.; Yoo, D.-Y. Machine-learning methods for estimating compressive strength of high-performance alkali-activated concrete. Eng. Appl. Artif. Intell. 2024, 136, 109053. [Google Scholar] [CrossRef]
  84. Shafighfard, T.; Kazemi, F.; Bagherzadeh, F.; Mieloszyk, M.; Yoo, D.Y. Chained machine learning model for predicting load capacity and ductility of steel fiber–reinforced concrete beams. Comput.-Aided Civ. Infrastruct. Eng. 2024. [Google Scholar] [CrossRef]
  85. Kazemi, F.; Asgarkhani, N.; Jankowski, R. Machine learning-based seismic response and performance assessment of reinforced concrete buildings. Arch. Civ. Mech. Eng. 2023, 23, 94. [Google Scholar] [CrossRef]
  86. Kazemi, F.; Asgarkhani, N.; Shafighfard, T.; Jankowski, R.; Yoo, D.-Y. Machine-Learning Methods for Estimating Performance of Structural Concrete Members Reinforced with Fiber-Reinforced Polymers. Arch. Comput. Methods Eng. 2024, 1–33. [Google Scholar]
Figure 1. GEP technique flow diagram [65].
Buildings 14 02675 g001
Figure 2. Gene expression programming algorithm diagrammatic illustration [69].
Buildings 14 02675 g002
Figure 3. Exploratory data analysis for flowability of UHPC.
Buildings 14 02675 g003
Figure 4. Exploratory data analysis for compressive strength of UHPC.
Buildings 14 02675 g004
Figure 5. Exploratory data analysis for flexural strength of UHPC.
Buildings 14 02675 g005
Figure 6. Exploratory data analysis for porosity of UHPC.
Buildings 14 02675 g006
Figure 7. Expression tree (ET) of GEP for flowability.
Buildings 14 02675 g007
Figure 8. Correlation between actual and predicted flowability.
Buildings 14 02675 g008
Figure 9. Error distribution plot for the GEP flowability model.
Buildings 14 02675 g009
Figure 10. Expression tree (ET) for CS model.
Buildings 14 02675 g010
Figure 11. Correlation between actual and predicted compressive strength.
Buildings 14 02675 g011
Figure 12. Error distribution plot for the GEP compressive strength model.
Buildings 14 02675 g012
Figure 13. Expression tree (ET) of GEP for flexural strength.
Buildings 14 02675 g013
Figure 14. Correlation between actual and predicted flexural strength.
Buildings 14 02675 g014
Figure 15. Error distribution plot for the GEP flexural strength model.
Buildings 14 02675 g015
Figure 16. Expression tree (ET) of GEP for porosity model.
Buildings 14 02675 g016
Figure 17. Correlation between actual and predicted porosity.
Buildings 14 02675 g017
Figure 18. Error distribution plot for the GEP flexural strength model.
Buildings 14 02675 g018
Table 1. Parameters fixed for GEP model.
ParametersSettingsParametersSettings
GeneralCSInversion rate0.00546
Genes 4Stumbling Mutation0.00141
Constant per gene 10Two-point recombination rate0.00277
Chromosomes150Leaf Mutation0.00546
Function set+, −, x, ÷, cubic rootOne-point recombination rate0.00277
Head size 8IS transposition rate0.00546
Data TypeFloating numberGene recombination rate0.00277
Linking functionAdditionRIS transposition rate0.00546
Lower bound−10Gene transposition rate0.00277
Upper bound 10Random Chromosomes0.0026
Table 2. Comparison with other machine learning models.
PropertyMaterialModelsR2References
CS reductionRecycled glass and eggshell cement compositeANN0.87[78]
CSGeopolymer concreteSVM0.78[79]
CSRise husk ash-based concreteGEP0.83[65]
CSAlkali-activated materialsKNN0.79[80]
CSMetakaolin-based concreteGEP0.91[81]
CSFly ash-based geopolymerDT0.90[82]
CSRise husk ash-based concreteMEP0.89[65]
CSGeopolymer concreteMLPNN0.81[79]
FAUHPCGEP0.94This study
CSUHPCGEP0.95This study
FSUHPCGEP0.93This study
PRUHPCGEP0.94This study
Disclaimer/Publisher’s Note: The statements, opinions and data contained in all publications are solely those of the individual author(s) and contributor(s) and not of MDPI and/or the editor(s). MDPI and/or the editor(s) disclaim responsibility for any injury to people or property resulting from any ideas, methods, instructions or products referred to in the content.

