Article

Numerical Stability Analysis of Sloped Geosynthetic Encased Stone Column Composite Foundation under Embankment Based on Equivalent Method

1
College of Civil Engineering, Hunan University, Changsha 410082, China
2
China Construction Fifth Engineering Bureau the Third Construction (Shenzhen) Co., Ltd., Shenzhen 518131, China
3
College of Civil Engineering and Architecture, Hunan University of Arts and Science, Changde 415000, China
4
Key Laboratory of Building Safety and Energy Efficiency of the Ministry of Education, Hunan University, Changsha 410082, China
5
National International Joint Research Center for Building Safety and Environment, Hunan University, Changsha 410082, China
*
Author to whom correspondence should be addressed.
Buildings 2024, 14(9), 2681; https://doi.org/10.3390/buildings14092681
Submission received: 1 August 2024 / Revised: 25 August 2024 / Accepted: 27 August 2024 / Published: 28 August 2024
(This article belongs to the Section Building Energy, Physics, Environment, and Systems)

Abstract

:
As an effective technology for the rapid treatment of soft-soil foundations, geosynthetic encased stone column (GESC) composite foundations are commonly used in various embankment engineerings, including those situated on sloped soft foundations. Nevertheless, there is still a scarcity of stability studies for sloped GESC composite foundations. Several 3D numerical models for sloped GESC composite foundations were established using an equivalent method. The influences of the area replacement ratio and the tensile strength of geosynthetic encasement on the stability were investigated. The results showed that the stability increased nonlinearly with the area replacement ratio, and there existed an optimal area replacement ratio (e.g., 24.56% in this study) to balance the safety and economic requirements. The stability increased linearly with the tensile strength of geosynthetic encasement at low tensile strength levels (lower than 105 kN/m in this study), and the impact was relatively limited compared with that of the area replacement ratio. In addition, the stability generally decreased nonlinearly as the foundation slope decreased, and high-angle (foundation slope close to 30°) sloped GESC composite foundations are recommended to be treated with multiple reinforcement techniques. The relationship between the minimum area replacement ratio and the foundation slope was further quantified by an exponential function, allowing for the determination of the area replacement ratio of various sloped GESC composite foundations and providing theoretical guidance for engineering practice.

1. Introduction

Geosynthetic encased stone columns (GESCs) represent green and innovative foundation-improvement techniques that involve wrapping ordinary stone columns (OSCs) with geosynthetic encasements (e.g., round woven geotextiles or geogrids). This technique has been proven to enhance the bearing capacity and reduce the post-construction settlement of the soft foundation. Presently, it has been widely used in various embankment engineering [1,2,3,4,5,6,7,8,9,10]. Simultaneously, embankments in highway engineering are often constructed on complex terrains, including mountains and hills, which necessitates the earthwork on the sloped soft foundations. These foundations are characterized by the following features: (1) includes an outward slope at the foundation surface or the base of the soft-soil layer and (2) consists of soft soils with low strength and high compressibility. When subjected to embankment or fill loading, the sloped soft foundation tends to exhibit lateral deformation concentrated towards the downslope direction. The increasing shear strains near the toe make the foundation more susceptible to instability than the horizontal soft foundations. In practice, reinforcement measures for sloped soft foundations commonly include leveling or removing the soft-soil layer, enhancing the soil strength, and restricting the lateral foundation deformation. Among these, installing GESCs in soft soils stands out as an effective measure to improve the shear strength of the foundation [11,12], which is called sloped GESC composite foundations.
Currently, the research on the stability of sloped soft foundations has mainly focused on unreinforced sloped soft foundations, with limited insight into the sloped GESC composite foundations. For example, Yang et al. [13] studied the ultimate bearing capacity of the sloped foundations through the energy dissipation method and model tests. Qiu et al. [14] conducted numerical studies and investigated the impact of deformation characteristics of sloped soft foundations on asphalt pavements. Jiang et al. [15] executed a 3D finite-difference numerical analysis and examined the spatial distribution of the potential slide surface in sloped soft foundations under embankment. Baah-Frempong and Shukla [16] performed a 2D finite-element numerical study to analyze the influences of soil properties, slope geometry, and foundation locations on the stability of the embankment supported by a sloped sandy soil foundation. Zhang et al. [17] figured out the effects of the embankment heights, embankment slopes, and foundation slopes on the stability of an embankment on the sloped foundation through numerical simulations.
To summarize, previous research on the stability of sloped GESC composite foundations under embankments is relatively scarce. In fact, the sloped GESC composite foundation cannot be simply regarded as a straightforward combination of the sloped soft foundation and the GESC composite foundation. In addition, the complexity of the issue is further increased by the unique deformation behavior of GESCs [18,19,20,21,22,23,24]. Consequently, it is necessary to enhance the comprehension of the stability of sloped GESC composite foundations, especially their responses to various physical parameters that are commonly used in the designing of practical embankment engineering (e.g., column diameter, column spacing, area replacement ratio of composite foundation, tensile strength of geosynthetic encasement, etc.).
To this end, a set of 3D numerical models for sloped GESC composite foundations under embankments are established through an equivalent method (GESCs are modeled based on the homogeneity assumption). Influences of the area replacement ratio and the tensile strength of geosynthetic encasements (i.e., geogrid strength) on the stability of sloped GESC composite foundations are investigated, and a method for determining the minimum area replacement ratio under different foundation slopes is further proposed.

2. FDM Molding and Validation

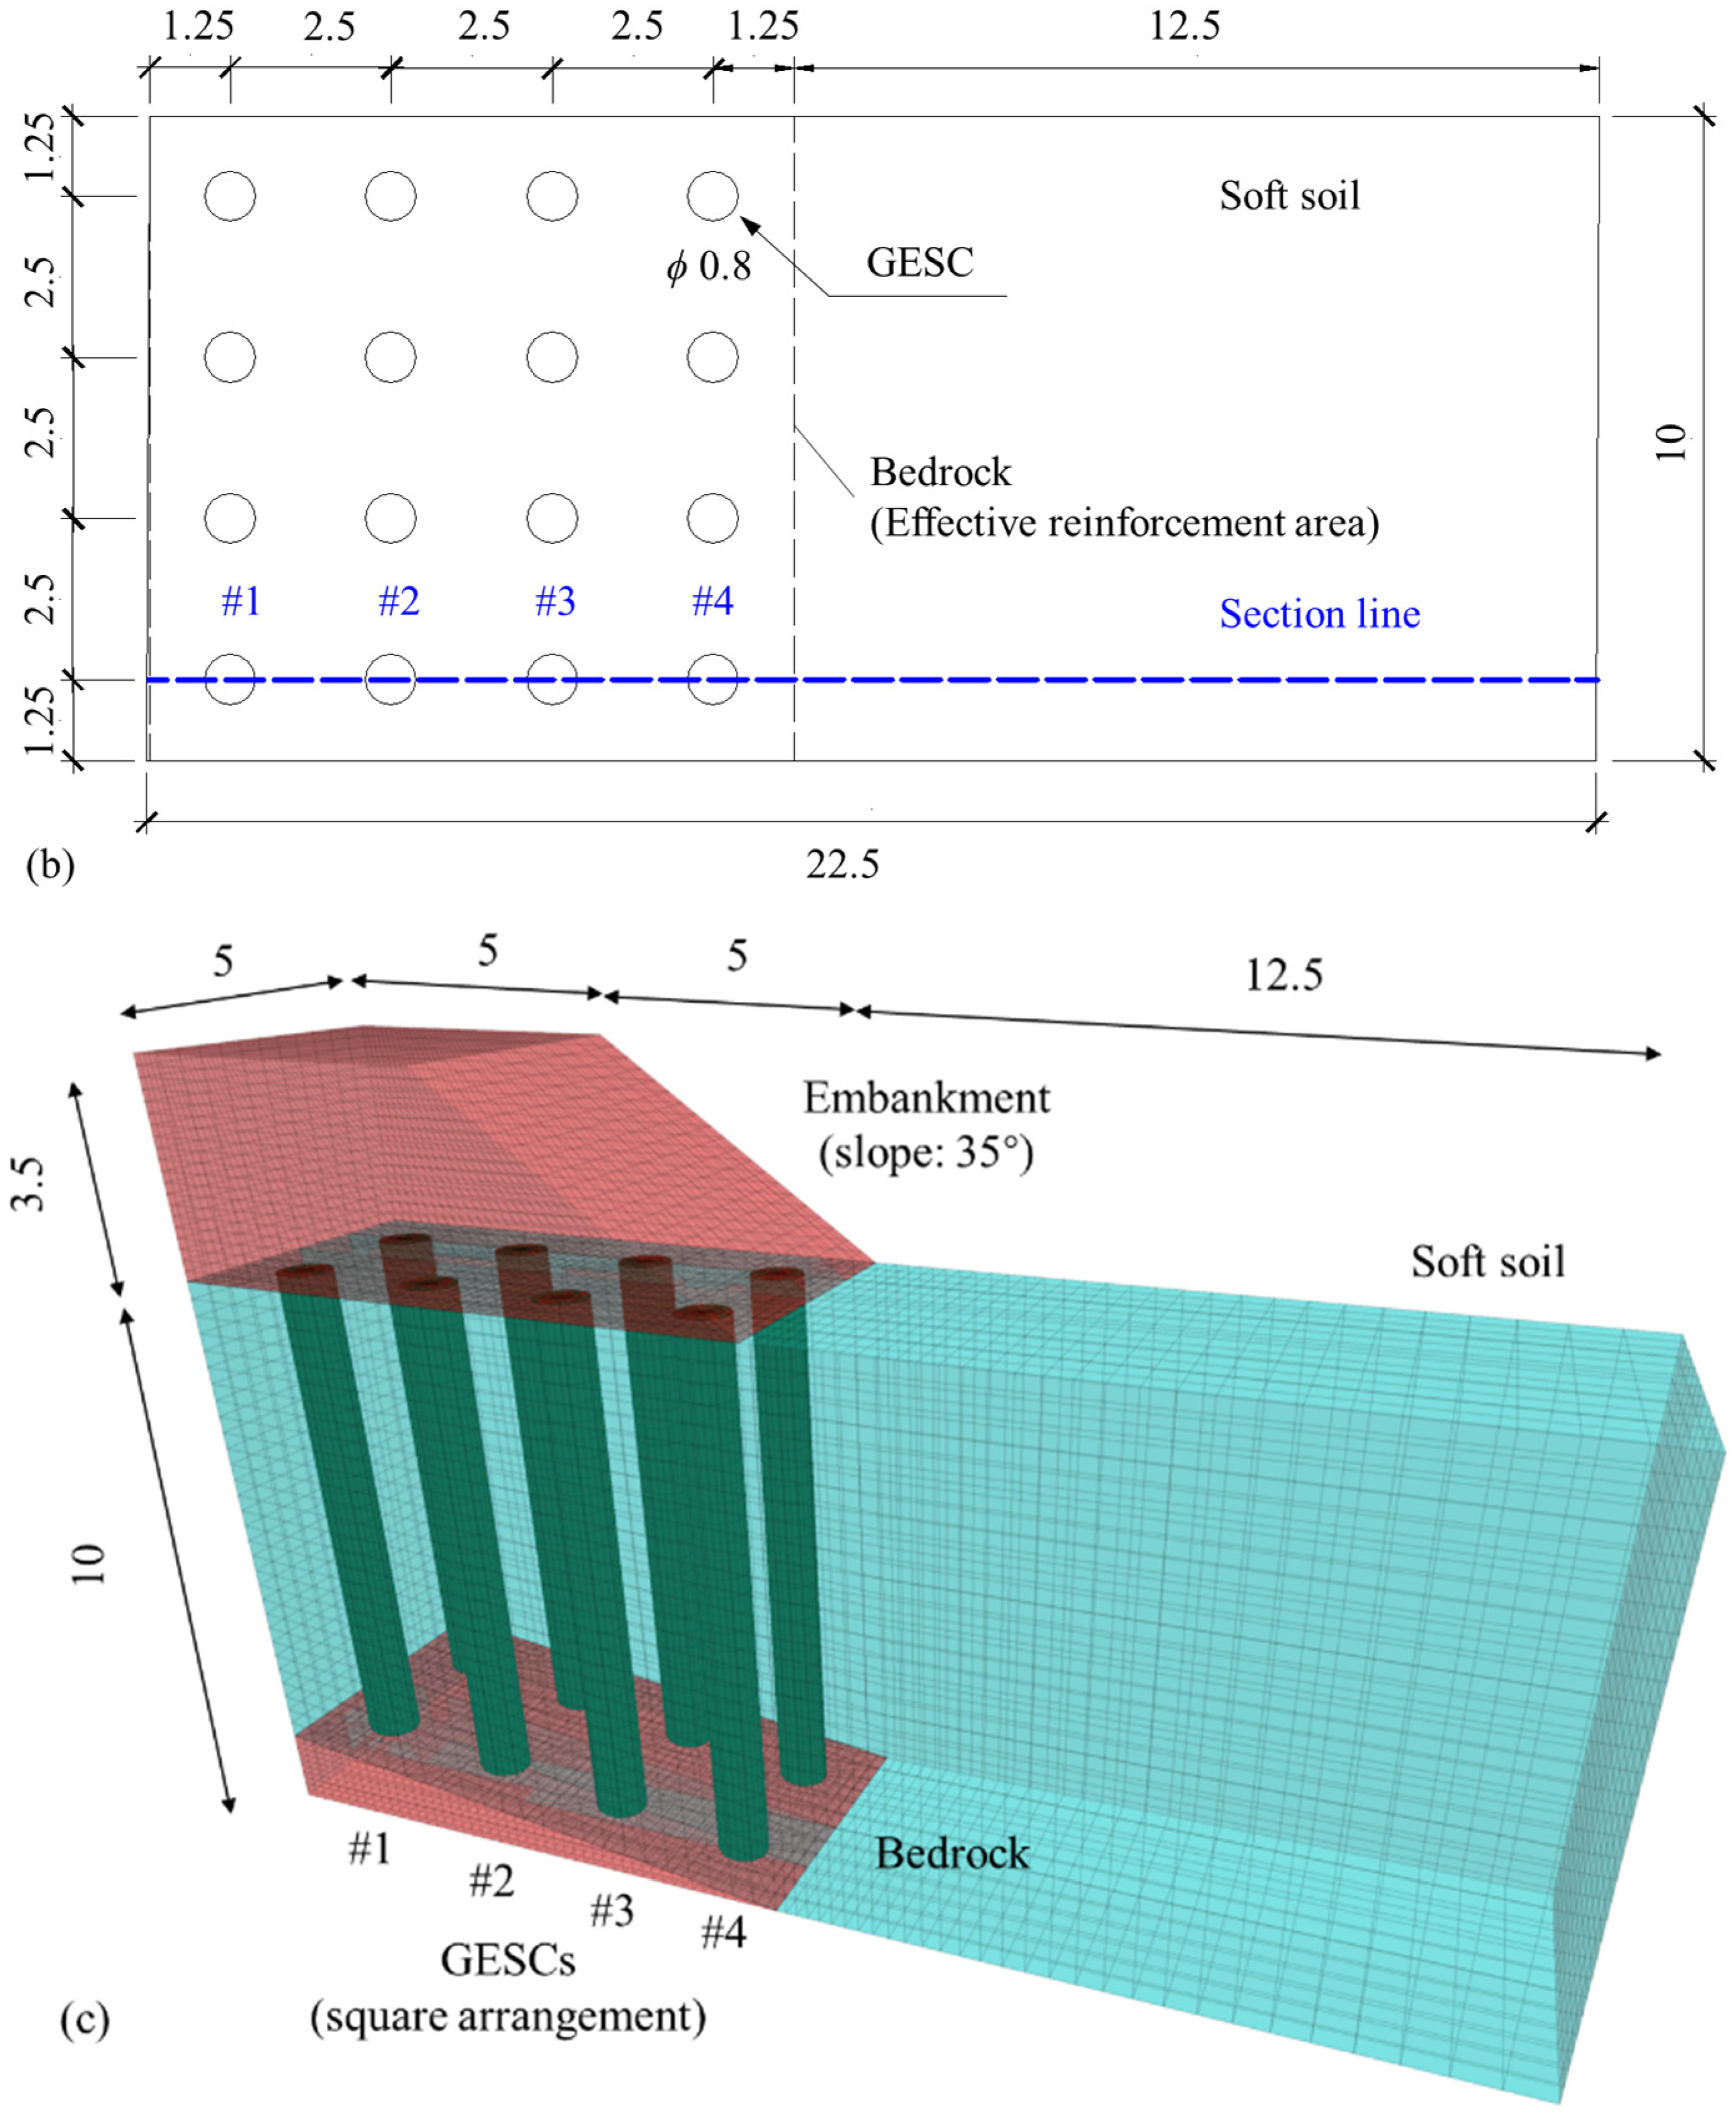
2.1. Details of the FDM Model

The sloped GESC composite foundation was numerically modeled using the software FLAC3D (version 6.00) through the finite-difference method (FDM), based on the laboratory embankment tests performed by Chen et al. [11]. FLAC3D is well-suited for modeling complex ground conditions, such as sloped GESC composite foundations. It excels in performing nonlinear analysis, which is crucial for accurately simulating material behavior while offering high computational efficiency in stability analysis. The FDM is widely used across industries to solve critical engineering problems. In geotechnical engineering, tools like FLAC3D model the interactions between soil, rock, and structures, helping engineers assess the stability and design of foundations, embankments, and slopes. Beyond geotechnics, FDM is also essential in civil, mechanical, and aerospace engineering, providing insights that enhance design safety and system reliability.
A GESC composite foundation was composed of GESCs and their surrounding soft soils, measuring 22.5 × 5 × 10 m in length, width, and height, respectively, with an effective reinforcement area of 10 × 5 × 10 m. Above the foundation lay a granular soil embankment, 3.5 m high and 10 m wide, featuring a 35° side slope. Beneath the foundation was a bedrock with a variable slope, i.e., the foundation slope (α). When α = 0°, the model degraded into a horizontal GESC composite foundation, which is consistent with the GESC composite foundation model in tests. In addition, GESCs with a 0.8 m diameter were installed in a square pattern in the composite foundation, with 2.5 m column spacing (i.e., center-to-center spacing). The columns extended from the foundation surface down to the top of the bedrock, and the column lengths varied according to the foundation slope and the location of the columns. To improve numerical computational efficiency, half of the GESC composite foundation (i.e., 5 m in thickness) was adopted for simulation, leveraging the structural symmetry of the model. The details are represented in Figure 1a,b. Note that the initial parameters presented in Figure 1, including the dimensions and boundaries of the model, are all fixed and consistent with the existing laboratory test [11], with only the foundation slope (α) serving as a variable in the test.
In addition, impermeable boundaries were applied to the FDM model, with a groundwater table set at the foundation surface. The lateral boundaries in the model were constrained horizontally, while the bottom boundary was constrained horizontally and vertically. The embankment was constructed by a single-stage load method (i.e., continuous linear construction, with a loading period of 30 days from the height of 0 to 3.5 m), and the hexahedral elements were used to build the finite-difference meshes, which included a total of 17,910 zones and 21,408 gridpoints. The meshes were determined through a series of sensitivity analyses and were locally refined near the embankment to improve computational precision. Additionally, as shown in Figure 1c, the four GESCs intersected by the section line were numbered sequentially from #1 to #4, starting from the center of the embankment and moving toward the toe.

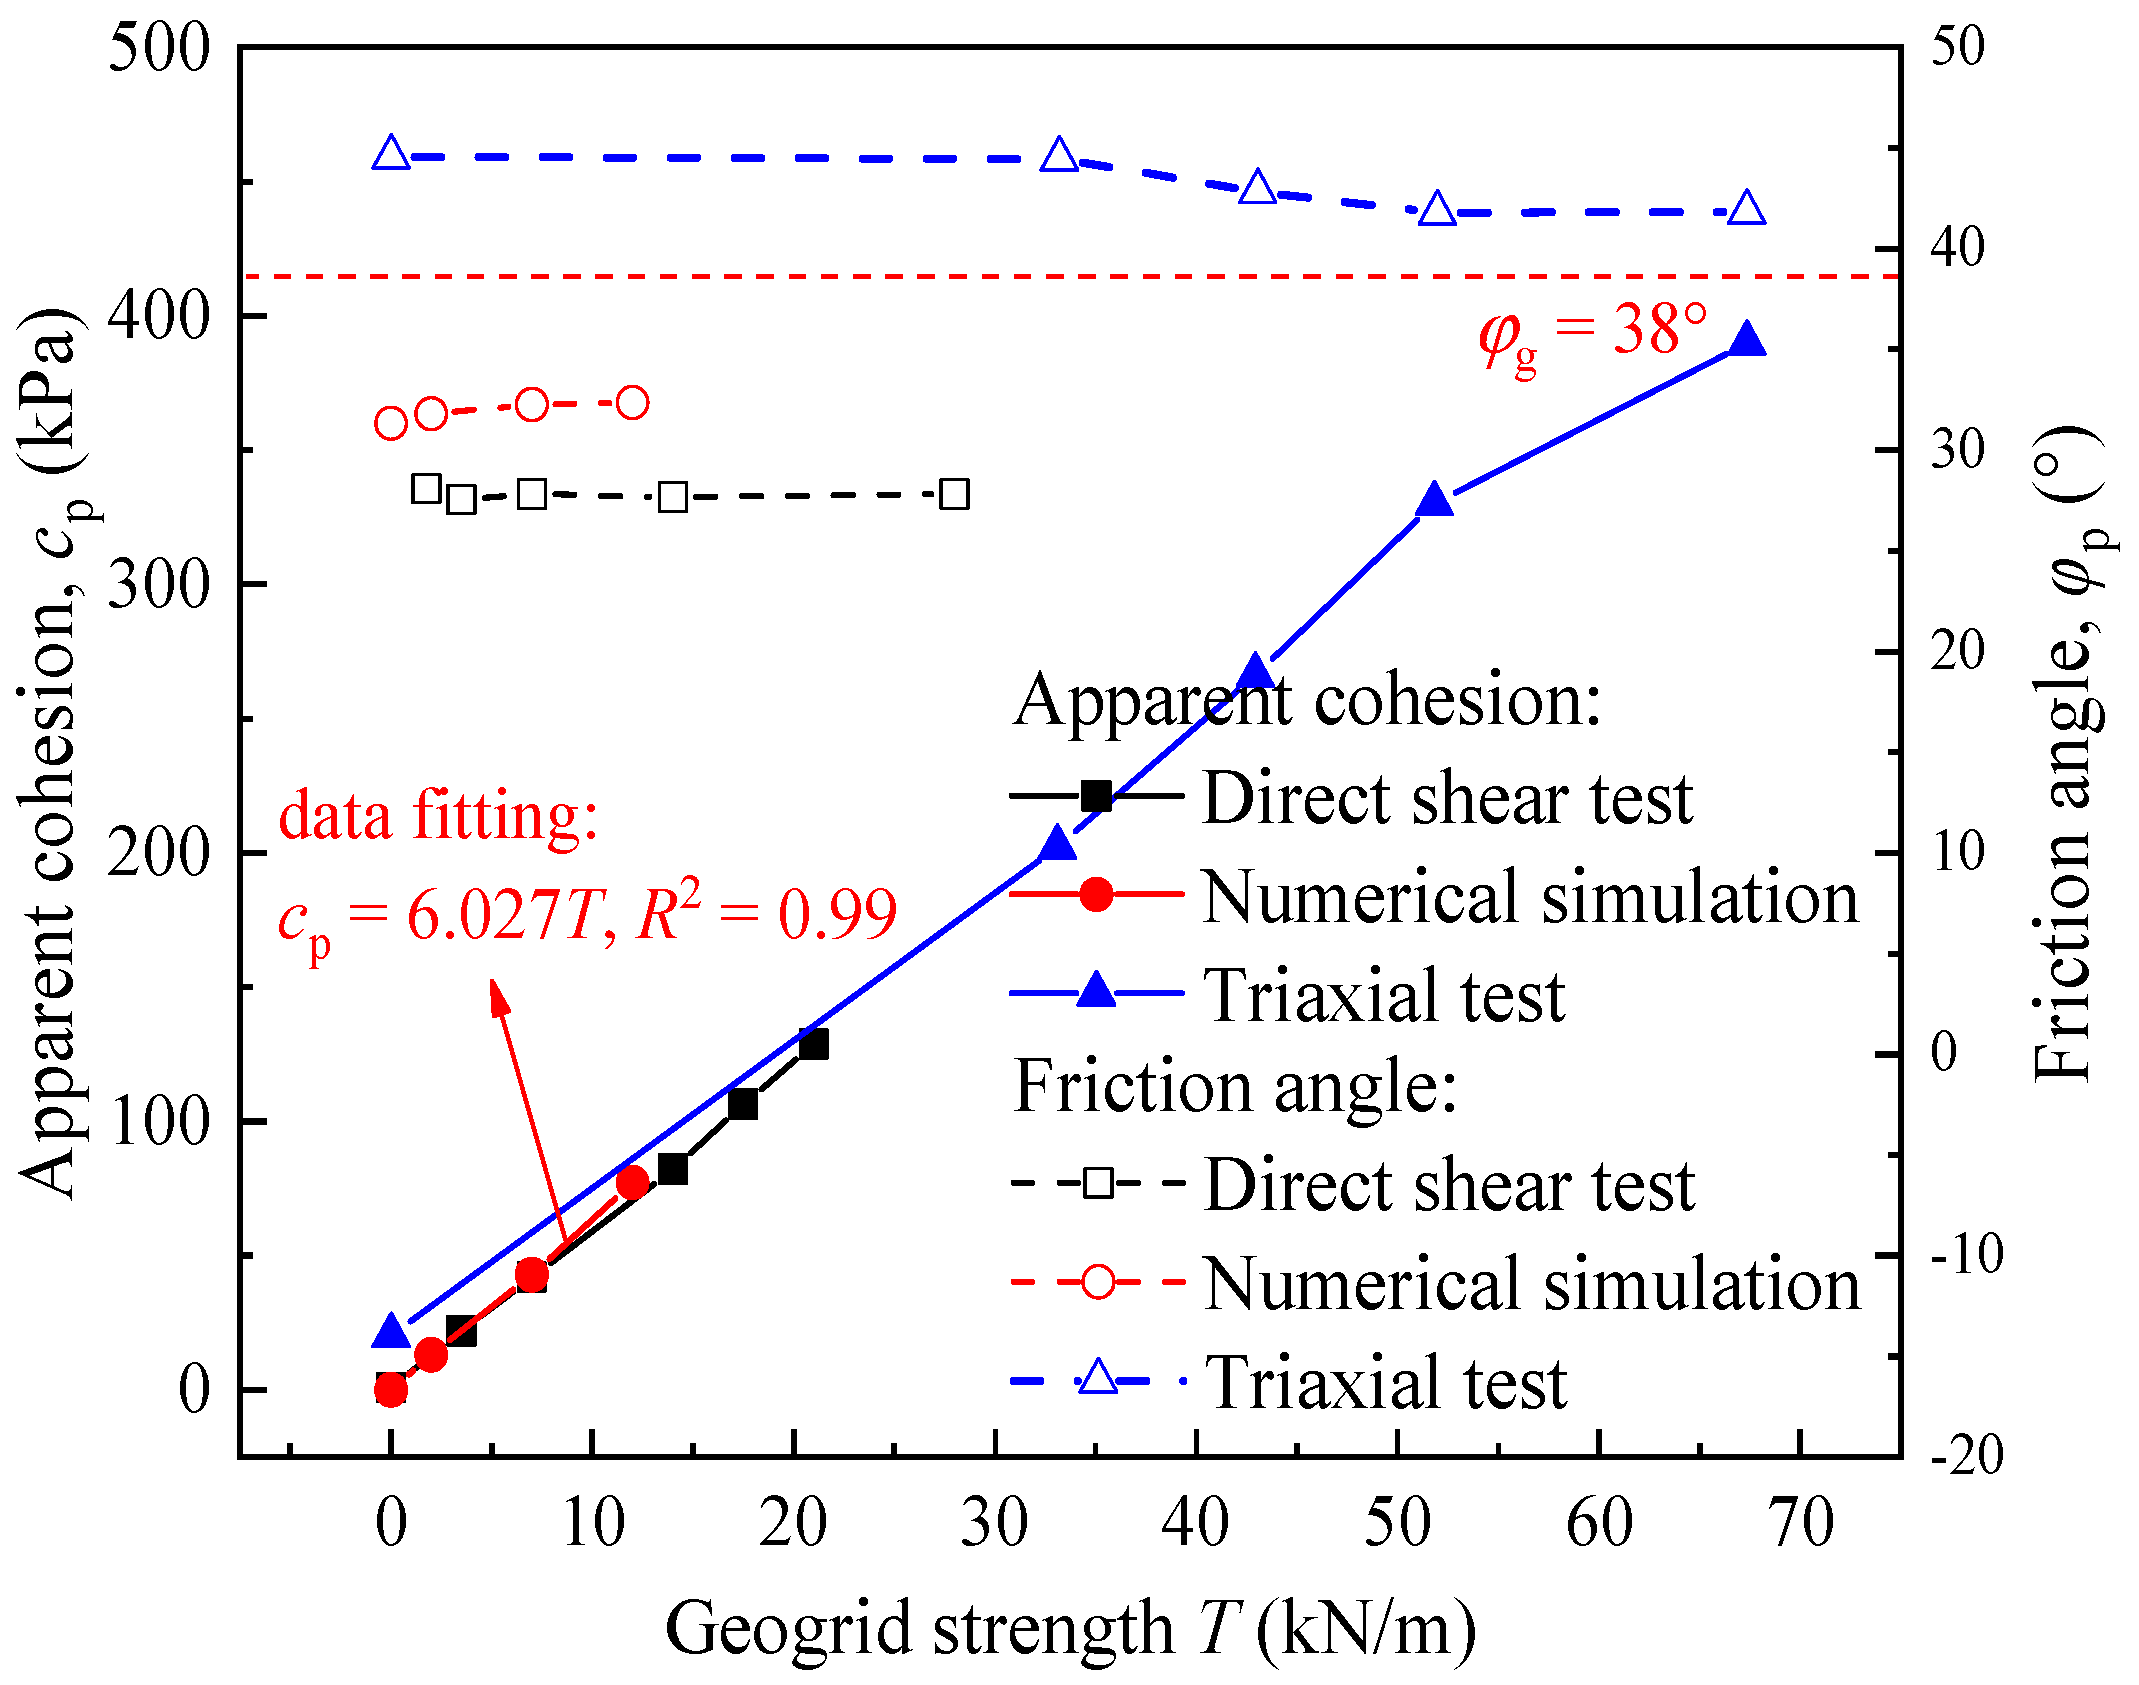
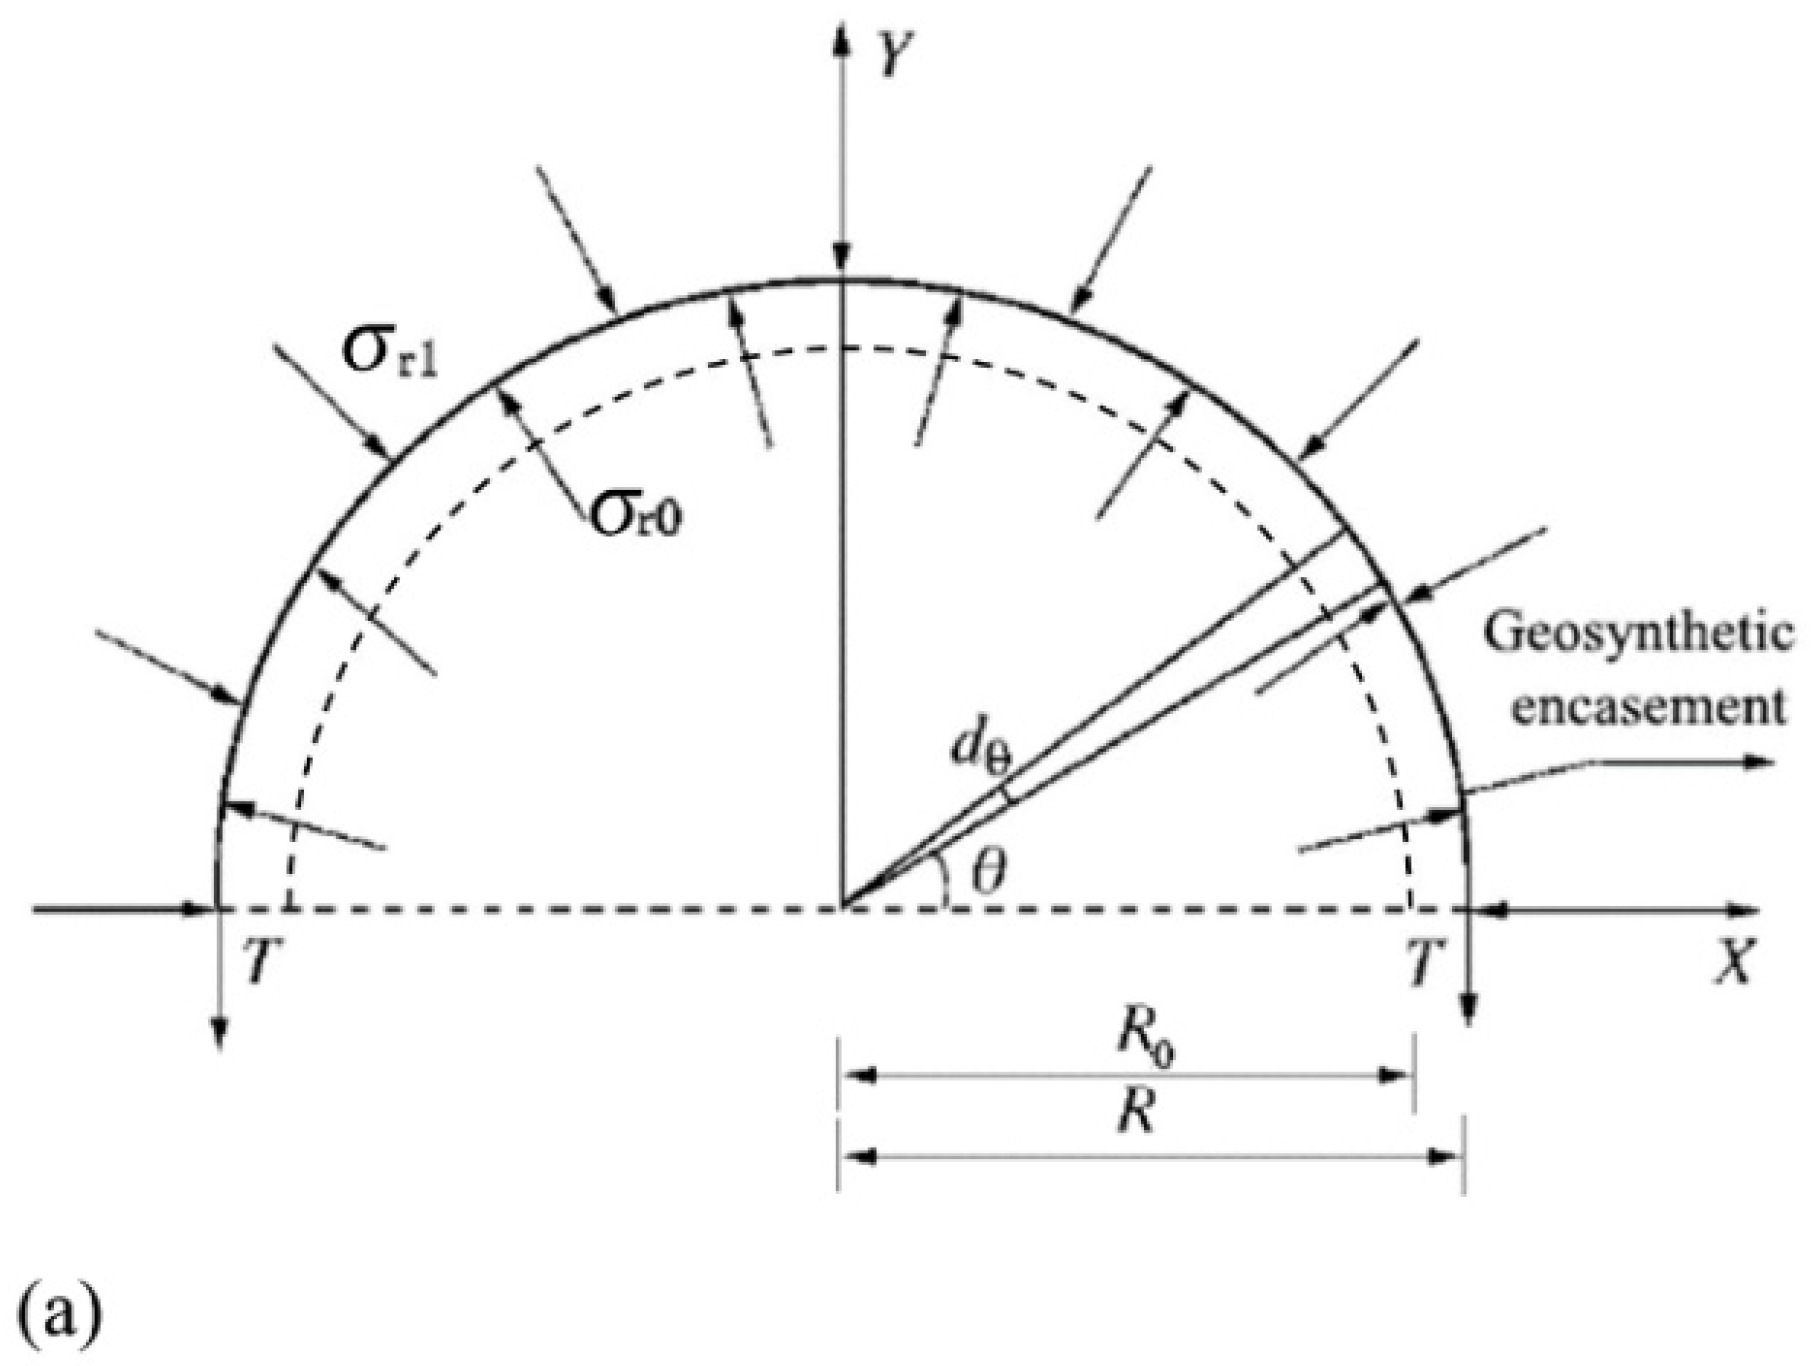
2.2. Material Properties and Equivalent Method

The GESC composite foundation model consisted of four materials, namely embankment fills, soft soils, bedrocks, and GESCs. The embankment fills, soft soils, and bedrocks were modeled through the Mohr–Coulomb model, and their material properties were determined from existing laboratory model tests (where the parameters of bedrock referred to Jiang et al. [25], while the other parameters of embankment fill and soft soil came from Chen et al. [11]), as listed in Table 1.
In addition, an equivalent method was developed to represent GESCs in a way that simplifies the modeling procedure and enhances numerical efficiency while maintaining accuracy. This approach involves treating the GESC as a uniform material with equivalent physical properties, accounting for the relationships between their physical properties and the tensile strength of the geosynthetic encasement. Further details are outlined below.
As the results of the laboratory shear tests [12] revealed, apparent cohesions of GESCs increase linearly with the tensile strength of the geosynthetic encasements, whereas their friction angles are little influenced and remain constant. The results of the laboratory triaxial tests [26] also come to similar conclusions, as shown in Figure 2. Therefore, the apparent cohesions of GESCs can be calculated by the tensile strength of geosynthetic encasements (in the vertical direction), and their friction angles remain constant, matching those of stone columns, as shown in Equations (1) and (2).
c p = a T
φ p = φ g
where cp is the apparent cohesion of GESC; φp is the friction angle of GESC; a is the linear fitting coefficient and a = 6.027 is from the literature [12]; T is the tensile strength of geosynthetic encasements, and T = 70 kN/m in this study; and φg is the friction angle of stone column, and φg = 38°.
Commonly, the Young’s Modulus (Ep) of GESC could be calculated using Equation (3).
E p = σ z ε z
where σz and εz are the axial stress and the axial strain of the column, respectively.
For GESCs subjected to compressive deformation, the axial stress of the column can be calculated as follows.
(1) Take the geosynthetic encasement for analysis. As shown in Figure 3a, the relationship between the initial radius (R0) of the geosynthetic encasement and the radius after bulging deformation (R) could be described as Equation (4).
R = R 0 ( 1 + ε r )
where εr is the radial strain of the geosynthetic encasement at tensile failure, and the corresponding tensile force is close to the available geogrid strength, which can be regarded as equal to the geogrid strength (T) under ideal conditions. For simplicity, the creep effect is not considered in this study. There exists a force equilibrium in the geosynthetic encasement at the Y-axis direction:
2 R ( σ r 0 σ r 1 ) 2 T = 0
σ r 0 = σ r 1 + T R
where σr0 is the stress acting on the outside of the geosynthetic encasement from the deformation of the stone column, and σr1 is the soil stress acting inwards the geosynthetic encasement;
(2) Take the GESC for analysis. As shown in Figure 3b, the connection between the maximum and the minimum principal stresses could be characterized through axial stress (σz) and soil stress (σr1), based on the strength criterion of Mohr–Coulomb, as follows:
σ z = σ r 0 tan 2 ( 45 ° + φ g 2 )
Then, introduce Equations (4) and (5) into Equation (6), and the calculation equation of the axial stress of GESC is obtained:
σ z = ( σ r 1 + T ( 1 + ε r ) R 0 ) tan 2 ( 45 ° + φ g 2 )
In the above equation, the soil stress of the GESC composite foundation is calculated by the passive soil pressure theory [27,28], as follows:
σ r 1 = ( γ s z + q s ) tan 2 ( 45 + φ s 2 ) + 2 c s tan ( 45 + φ s 2 )
where γs is the effective unit weight of soft soils; qs is the embankment stress shared by GESCs; cs is the cohesion of soft soils and φs is the internal friction angle; and z is the burial depth of columns. In this study, the GESC is divided into several segments along its depth, with the average Young’s modulus calculated for each segment. When the number of segments is sufficiently large, the value of Young’s modulus could be considered to vary continuously along the burial depth.
In combination with Equations (3) and (7), the value of Young’s Modulus is calculated as Equation (9):
E = ( σ r 1 + T ( 1 + ε r ) R 0 ) tan 2 ( 45 + φ g 2 ) ε z
Take geogrid strength (T) as an independent variable. The axial strain (εz) and the radical strain (εr) are still unknown variables in Equation (9). For simplicity, the two variables can be estimated from the existing studies of GESCs. Specifically, the results of the triaxial tests conducted by Frikha et al. [29] reveal that the deviator stresses of GESCs tend to be stable at the axial strain of 6~10%. The experimental and numerical triaxial tests performed by Malarvizhi and Ilamparuthi [30] also show that a 10% axial strain is the best value to determine the shear strength parameters of GESCs. The laboratory compression test results and the corresponding numerical investigations by Gu et al. [31,32] suggest that the Young’s modulus of GESCs is almost constant in the process of compression, and the radical strains exhibit minimal variation at the same axial strain of 8.8%. Chen et al. [11] adopt a radical strain of 4.8% at the axial strain of 10% for the numerical analysis of GESCs. Based on the referenced findings, the radical strain can be determined within the scope of 4% to 5%, with an axial strain of approximately 10%. Aligning with the recommendation of Chen et al. [11], 4.8% circumferential strain and 10% axial strain are adopted in this study (i.e., ε1 = 0.1, εr = 0.048). Therefore, by adopting these values, the equivalent value of Young’s modulus is directly determined under embankment conditions.
To validate the equivalent Young’s modulus of GESC, the theoretical results (solved by Mathcad 15.0) were compared with the test results by existing triaxial tests [26]. As Figure 4 shows, with a correction coefficient of κ = 1.91, the theoretical values align well with the actual values. Therefore, the equation for calculating the theoretical Young’s modulus is further corrected as follows:
E = κ ( σ r 1 + T ( 1 + ε r ) R 0 ) tan 2 ( 45 + φ g 2 ) ε z
Finally, the Poisson’s ratio of GESCs is little influenced by geosynthetic encasement [33], so it is determined to be the same as that of stone columns:
v p = v g
where vp and vg are the Poisson’s ratios of a GESC and a stone column, respectively.
Additionally, interfaces were created between two different materials, such as GESC–soft soil, GESC–embankment fill, GESC–bedrock, and so on. The interface parameters were adopted referring to the existing interface shear test conducted by Zhang et al. [34], as shown in Figure 5a. The upper and lower shear box was filled with soft soils and stones, respectively. The geogrid sample was placed between the stones and soft soils, with its four corners fixed in the lower box using steel bars. The shear properties of the GESC–soft soil interface were investigated and further replicated through numerical simulation. The results (Figure 5b) showed that the friction angle of the interface increased with the stiffness of the GESC, while the cohesion of the interface was little influenced. Specifically, the stiffness parameters (including normal and shear stiffness) of interfaces can be calculated by Equation (12), and the cohesion and friction angle of the interfaces were determined to be 0.8 times the values of the involved materials, as they were relatively insignificant to the test results.
k n = k s = 10 ( K + 4 3 G ) / H
where kn and ks were the normal stiffness and shear stiffness of interface, respectively, and K and G were, respectively, the bulk modulus and shear modulus of the soil, which can be calculated from Young’s modulus and Poisson’s ratio of soil. H was the minimum size of FDM grids around the interface, and H = 0.333 m in this study.
Generally, GESCs can be modeled using the equivalent method in finite-difference methods (FDM) or similar numerical analyses. The specific steps are as follows:
  • establish the basic geometric model;
  • determine the material parameters for all components except the GESCs;
  • adopt the Mohr–Coulomb model for GESCs and calculate the equivalent parameters through Equations (1), (2), (10), and (11);
  • create the interfaces between different materials and determine the interface parameters.

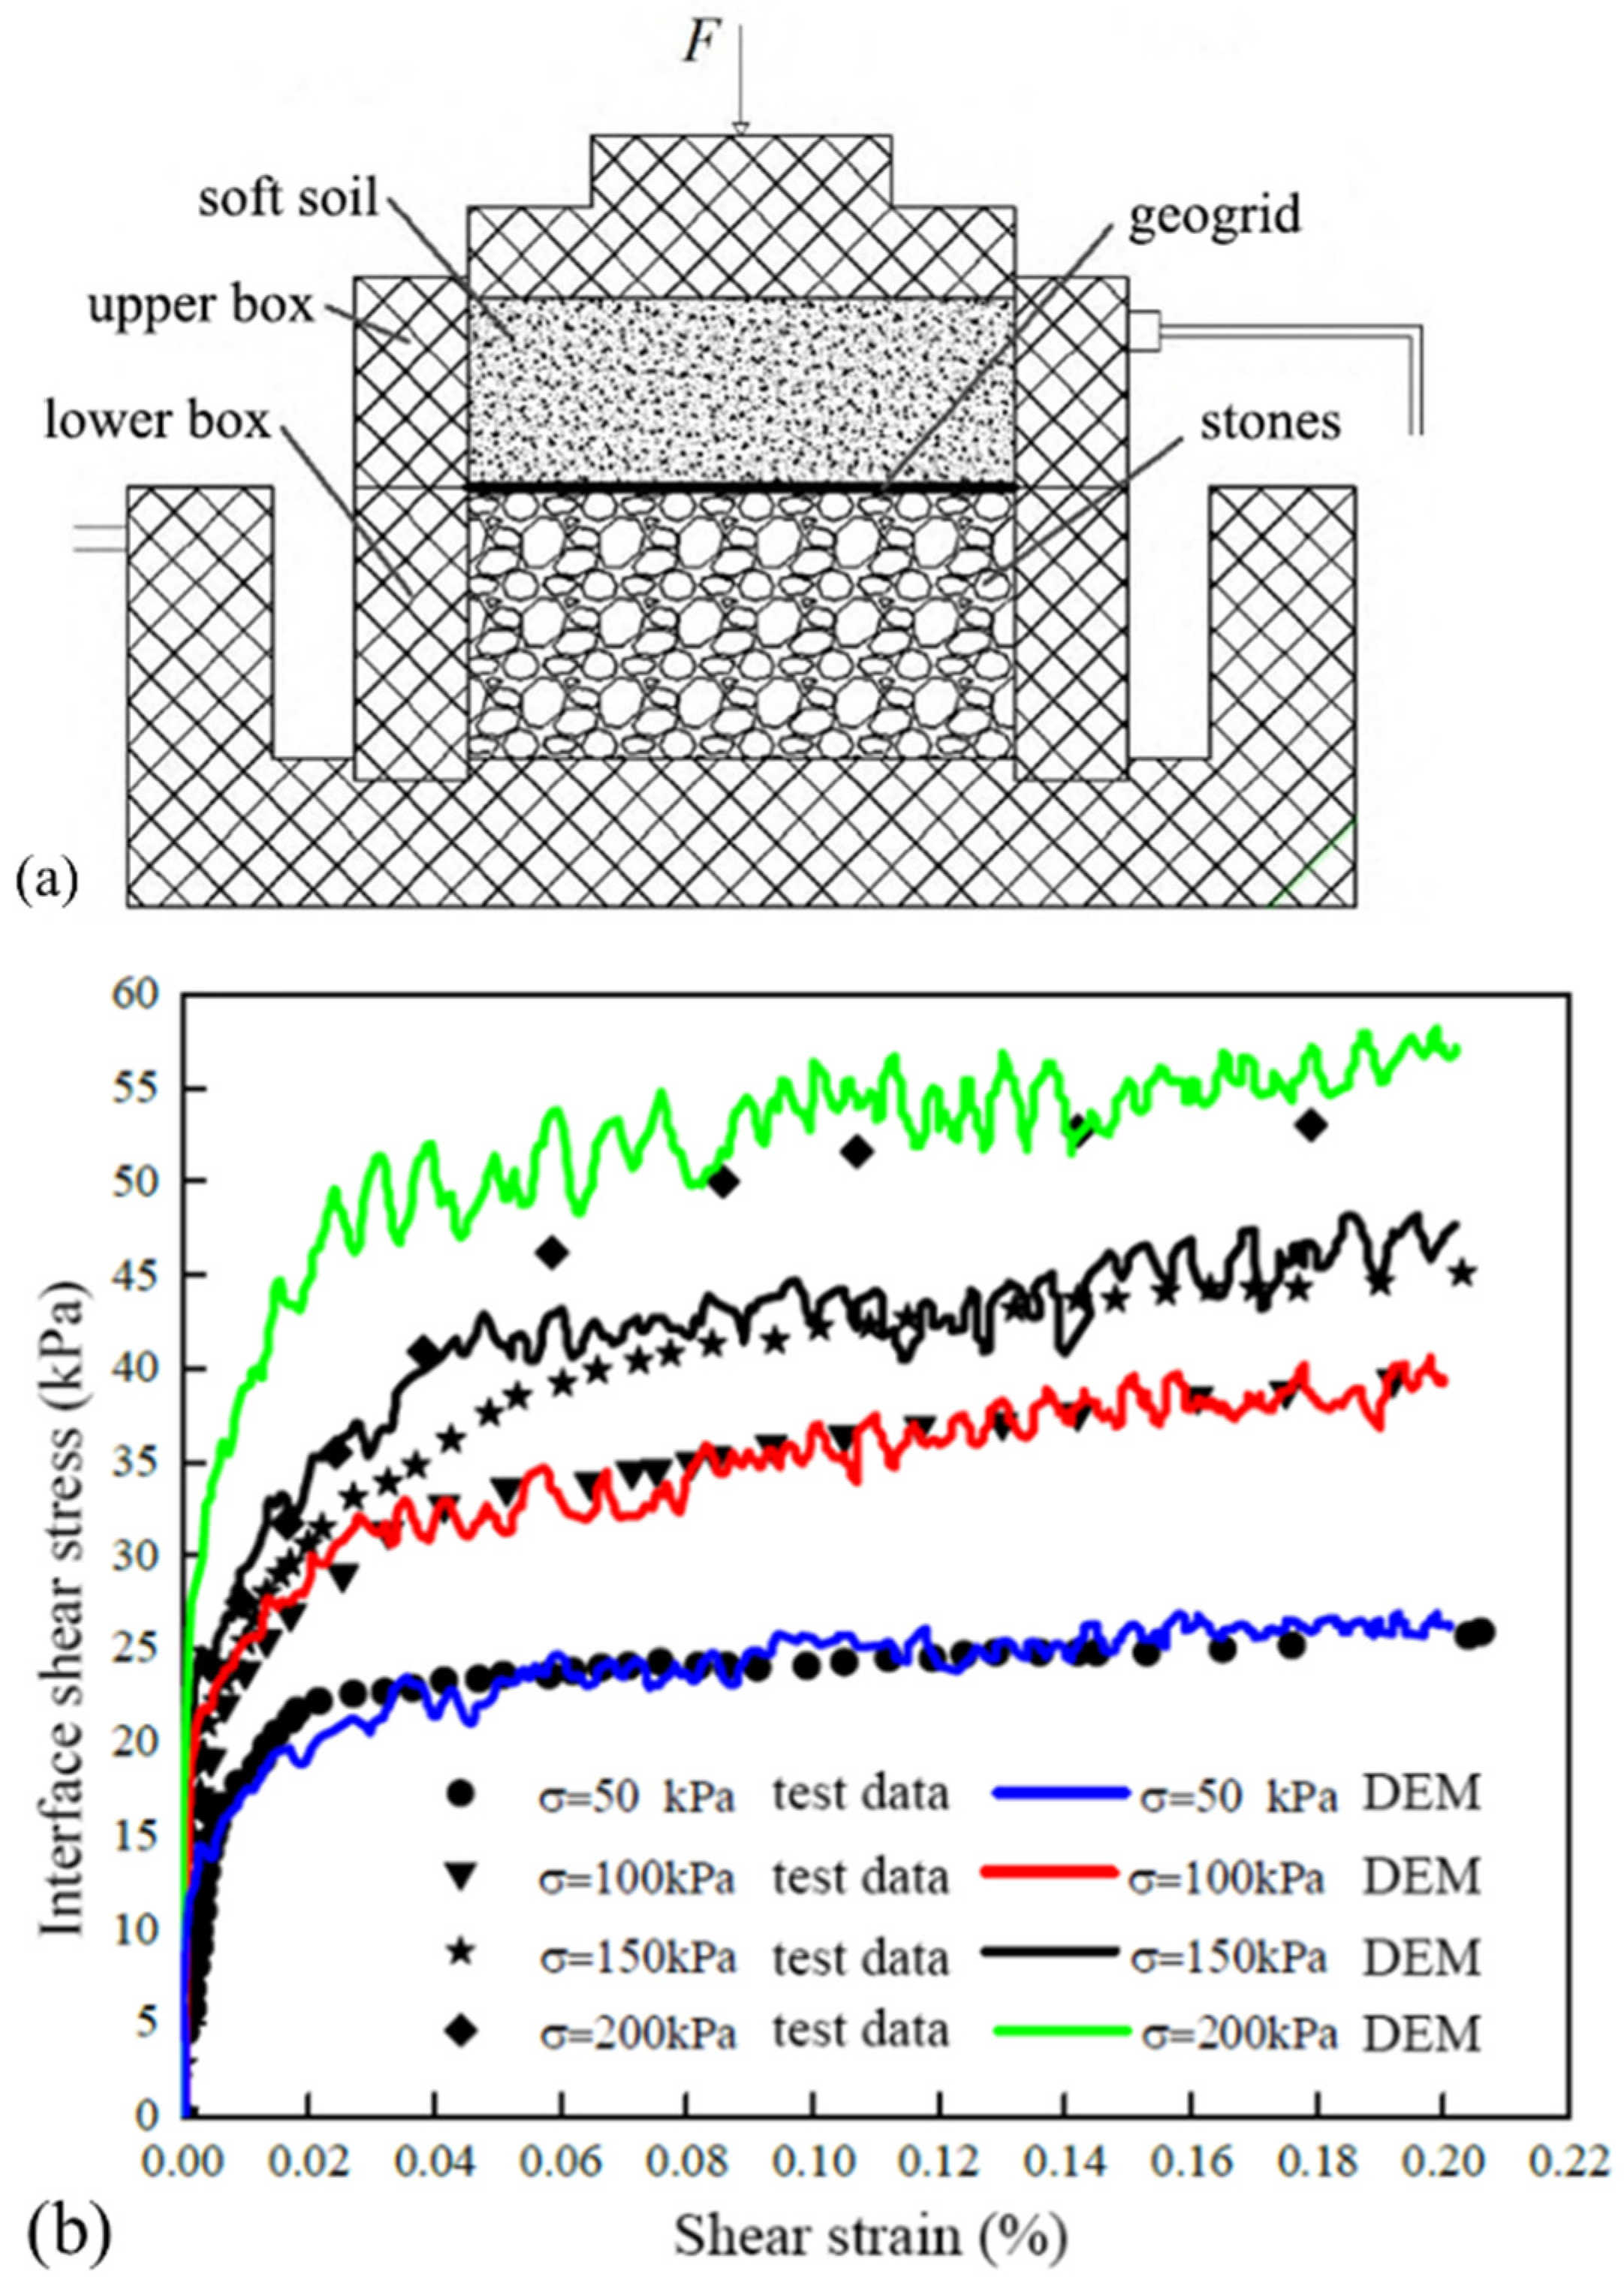
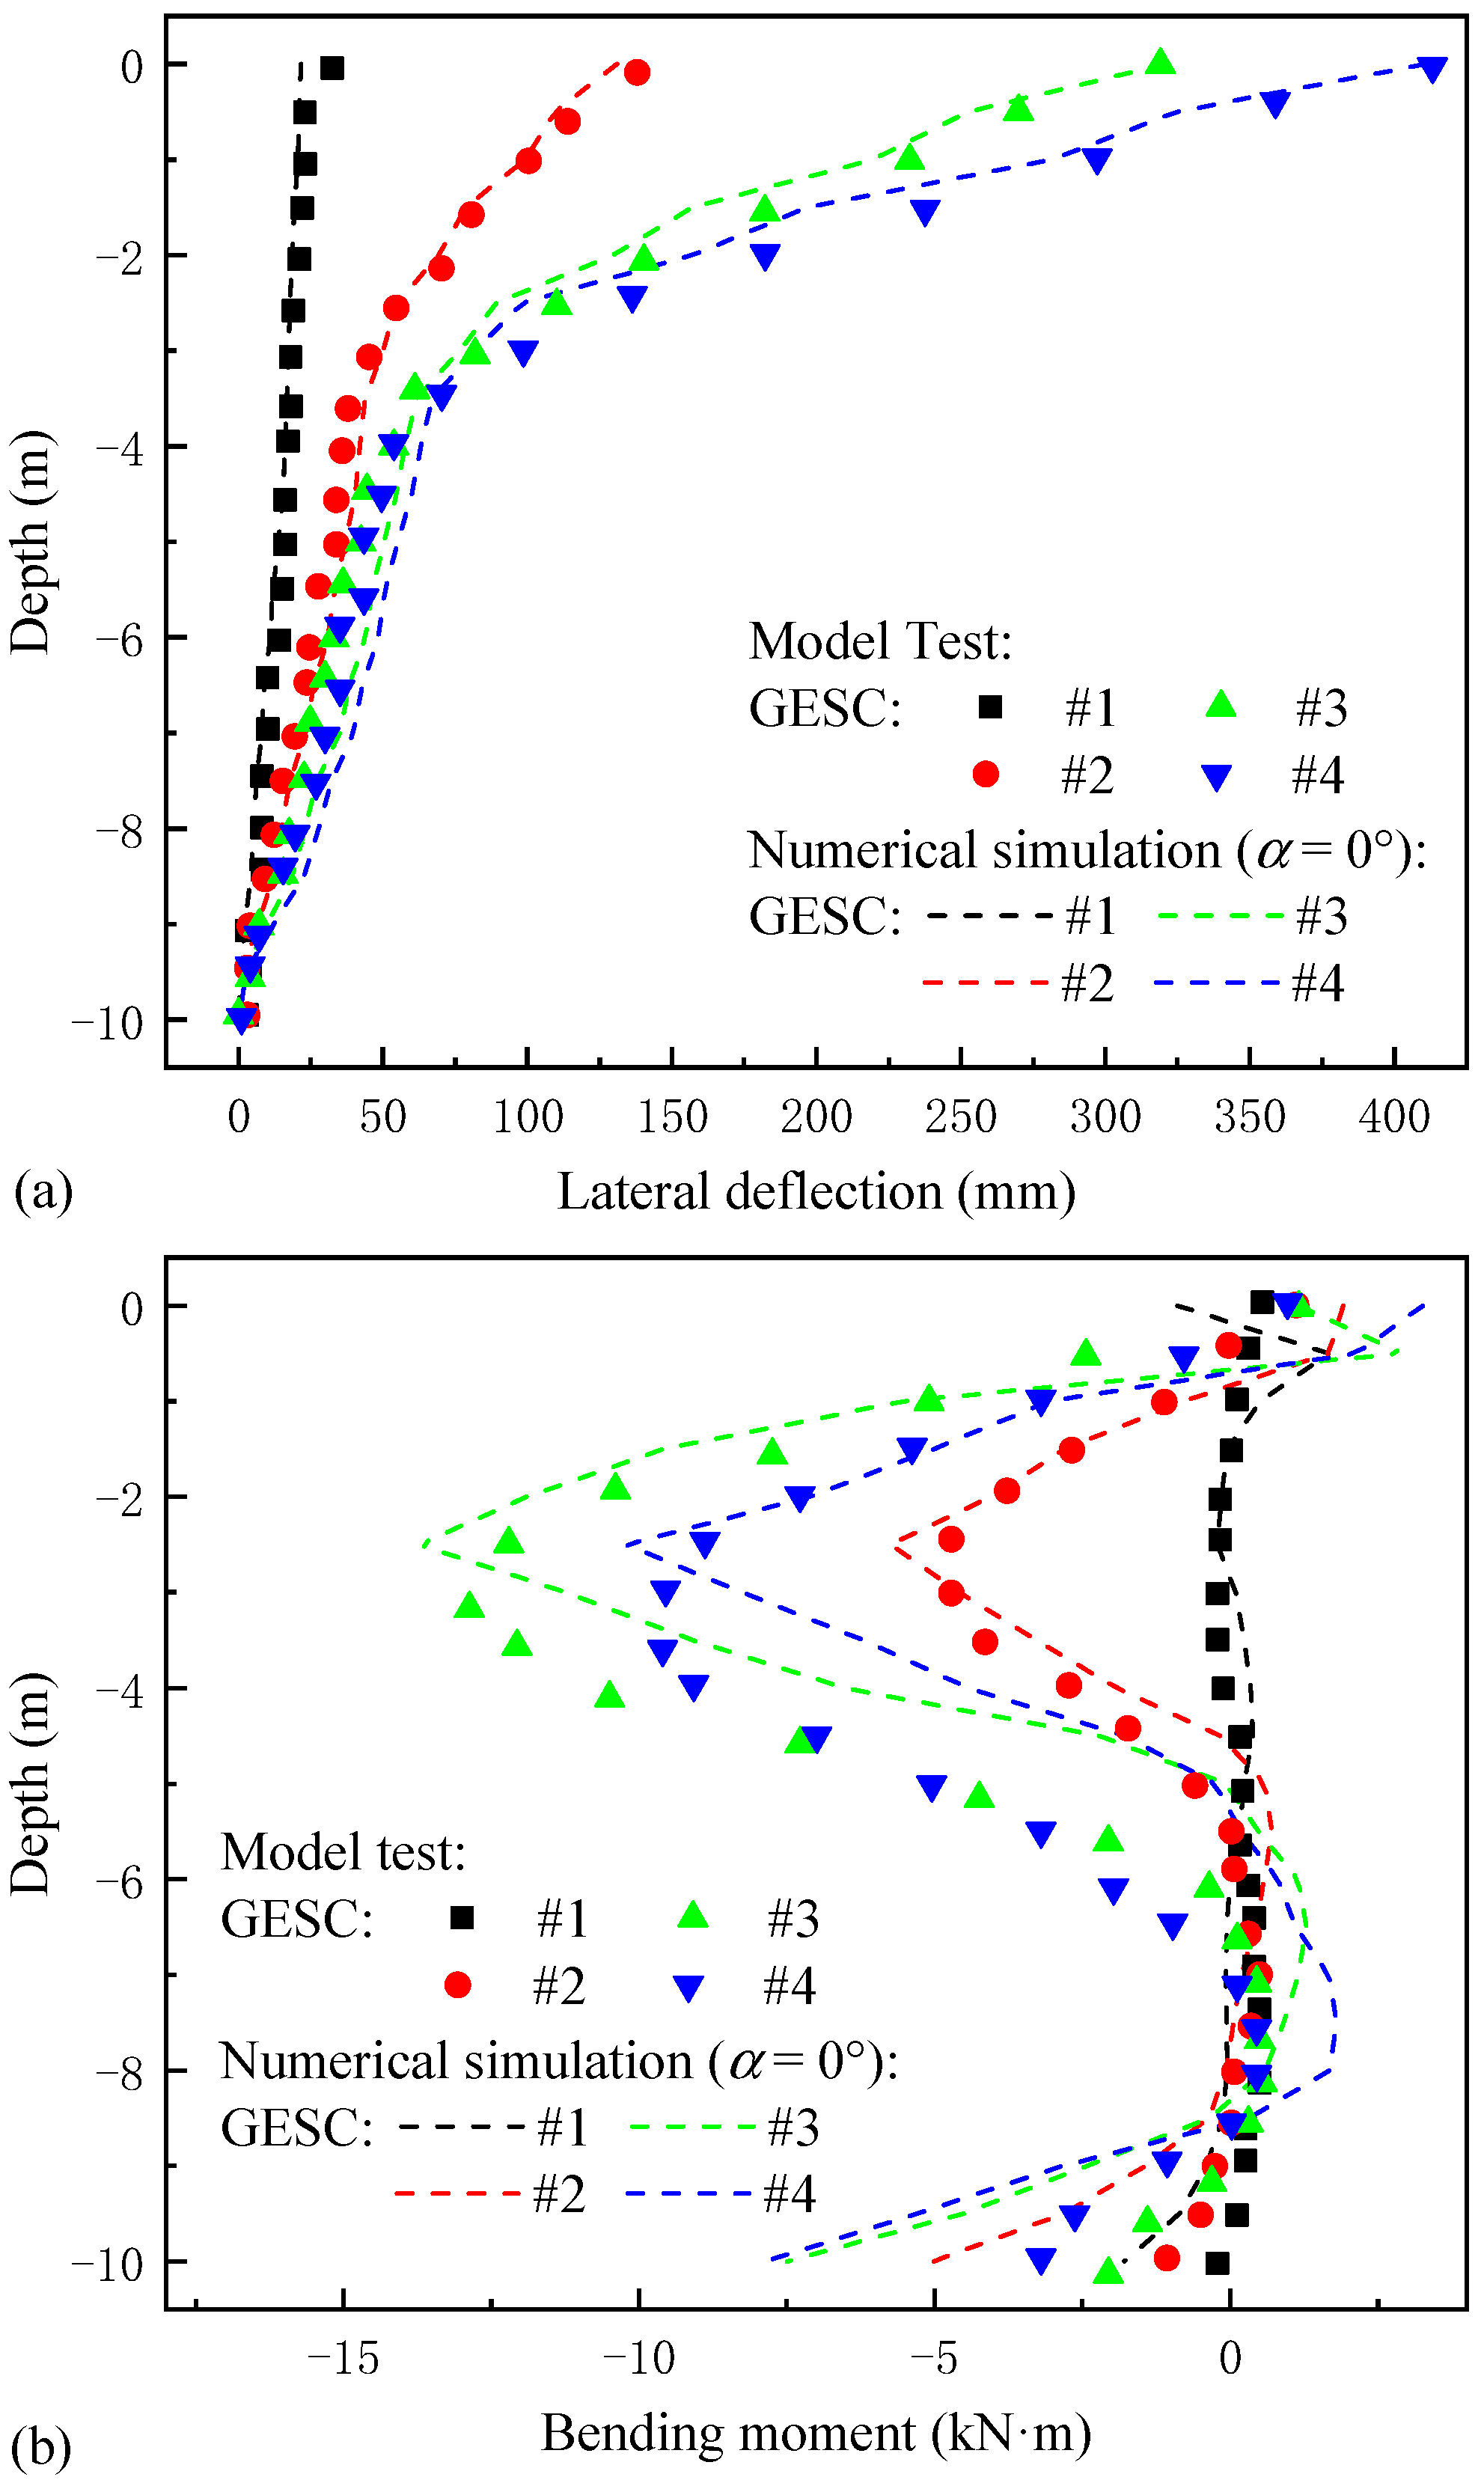
2.3. Model Verification

To verify the sloped GESC composite foundation model, the numerical results (i.e., the lateral displacements and bending moments experienced by GESCs) were compared with the laboratory test results [11], as shown in Figure 6. High consistency can be observed in the lateral displacements of GESCs between the test results and the numerical simulations. Simultaneously, the bending moment distributions along the depth of GESCs are nearly identical, with only minor differences in magnitude. The observed discrepancies occur near the bottom of the model and can be attributed to boundary-condition errors. Specifically, in the FEM model, the bottom boundary is fixed horizontally, which cannot be fully realized in the laboratory test due to the limited friction between GESCs and the bottom boundary. This discrepancy leads to overestimated bending moments near the bottom and underestimated moments further from the bottom. However, these errors remain within an acceptable range. Despite this, there is still a good consistency between the test results and numerical simulations, confirming the rationality of the equivalent modeling method for GESCs and the accuracy of the FDM model, which is suitable as a baseline case for the subsequent stability analysis.

3. Test Scheme

This study utilized the built-in method of strength reduction [35] in FLAC3D to determine the factor of safety (i.e., FS) and investigate the stability of sloped GESC composite foundations. It was a typical method commonly used in numerical analysis for the slope stability of various foundations and embankments and was proven to provide high accuracy. The strength reduction method involved a sequence of varied FS values to incrementally diminish the material strength until reaching a limit equilibrium state of the model. The FS value was calculated as follows [36]:
c = c FS
tan ( φ ) = tan ( φ ) FS
where c and φ were the initial cohesion and friction angle of materials, respectively, and c’ and φ’ were the reduced cohesion and friction angle of materials, respectively. It was noted that large values of FS represented a stable foundation. When the foundation experienced initial instability (i.e., FS < 1.0), the shear strength of the materials would be enhanced.
Based on this, seven different foundation slopes were selected and corresponding FS values were calculated in different cases. The foundation slopes ranged from smallest to largest, as follows: α = 0° (i.e., horizontal GESC composite foundation), 5°, 10°, 15°, 20°, 25°, and 30°.
The area replacement ratio is an important parameter that influences slope stability. According to the definition of the area replacement ratio (Equation (15)), with constant column spacing, various area replacement ratios can be obtained by adjusting the column diameter. Generally, the area replacement ratio of composite foundations ranged from about 10 to 25%. To deepen the understanding of the relationship between area replacement ratio and stability of sloped GESC composite foundations, nine column diameters were utilized in this study, including d = 0, 0.6, 0.7, 0.8, 0.9, 1.0, 1.2, 1.4, 1.6 m, corresponding to area replacement ratios of m = 0 (i.e., unreinforced sloped soft foundation), 4.51%, 6.14%, 8.02%, 10.15%, 12.53%, 18.04%, 24.56%, and 32.08%, respectively. The additional area replacement ratios were limited in practical significance but helpful to qualitative insights into the influence of the area replacement ratio on slope stability.
m = d 2 d e 2
d e = 1.13 s
where d was the column diameter; de was the equivalent diameter for the effective reinforcement area of a single column, which can be calculated by Equation (16), when the columns were installed in a square pattern; and s was the column spacing.
On the other hand, the tensile strength of geosynthetic encasement is of significant influence on the mechanical behavior of GESCs, which was a prominent characteristic differing from the OSC composite foundations. To investigate their further impact on the slope stability, seven tensile strengths of geosynthetic encasement were involved in this study, referring to the adopted values in the literature [12], including T = 0 (i.e., sloped OSC composite foundation), 35, 70, 105, 140, 175, and 210 kN/m. All the cases are summarized in Table 2, while the other parameters were kept consistent with the baseline case.

4. Test Results

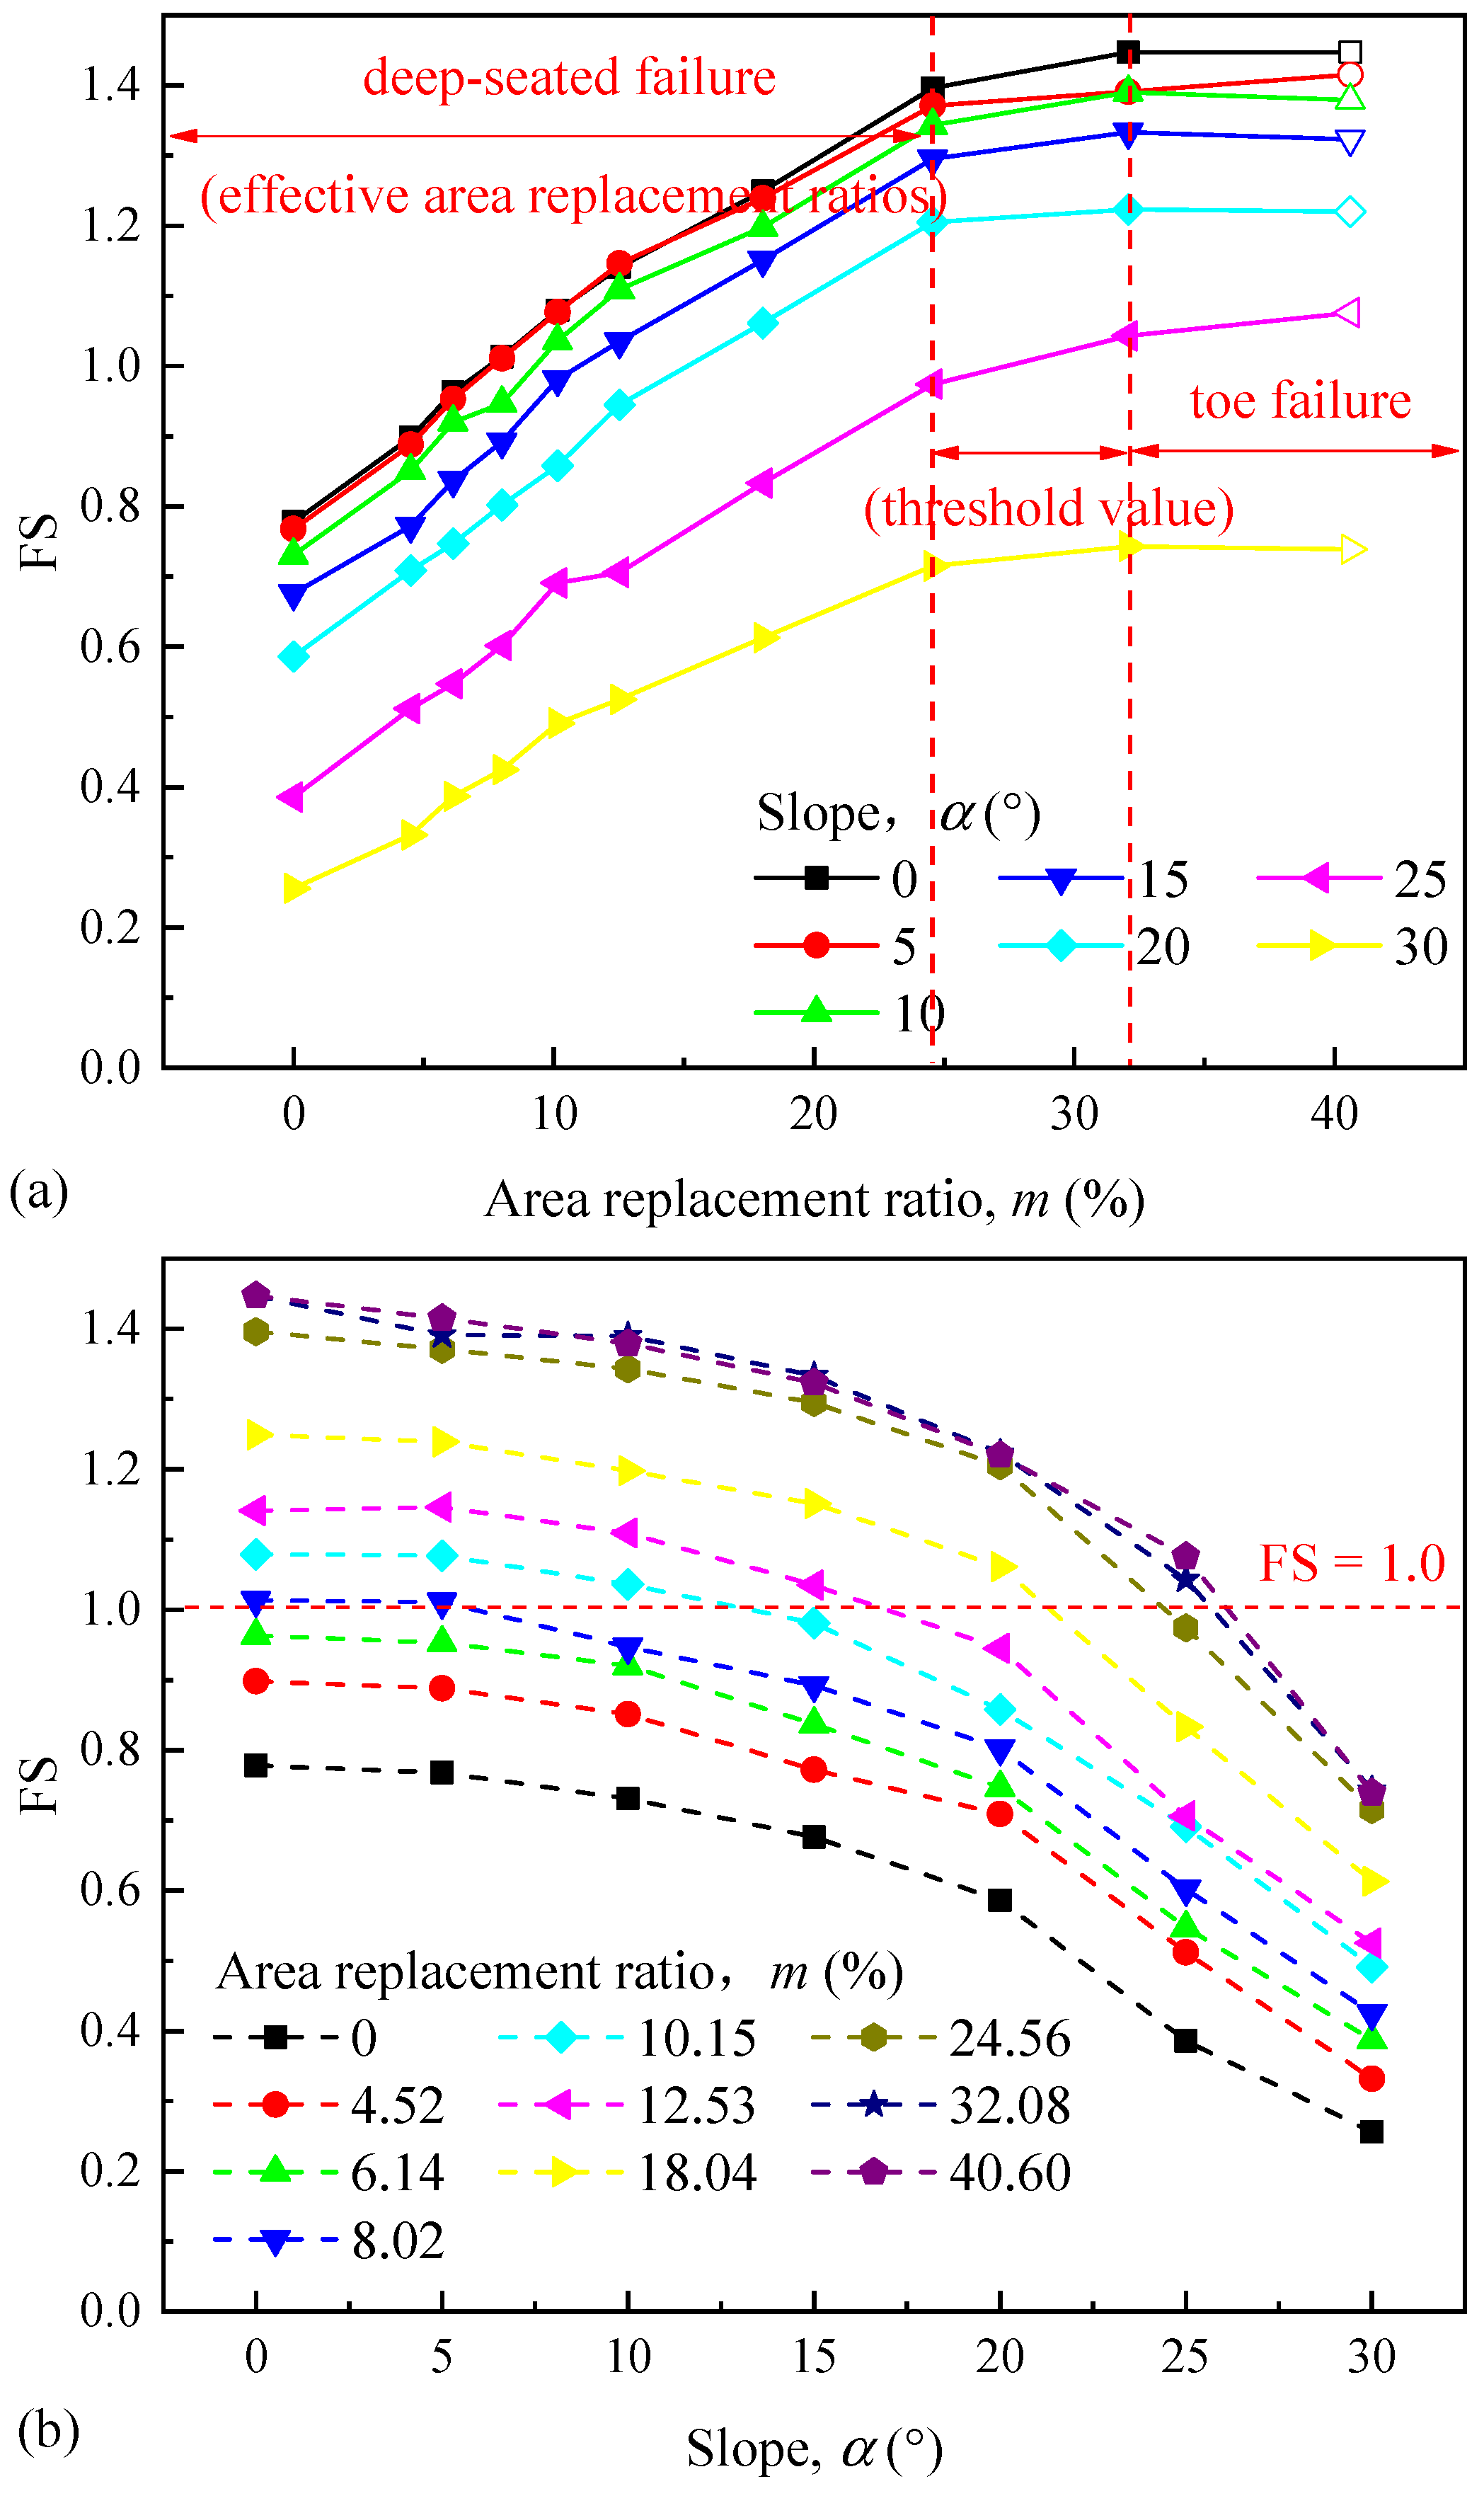
4.1. Effect of Area Replacement Ratio under Different Slopes

The effect of area replacement ratio (m) on the stability of sloped GESC composite foundations was investigated under different foundation slopes (α), as shown in Figure 7a. In general, the FS value increases nonlinearly with the area replacement ratio regardless of foundation slopes. Specifically, when the area replacement ratio is relatively low, there exhibits an approximately linear positive relationship between the FS and the area replacement ratio. However, when the area replacement ratio continually increases and exceeds a certain threshold (m > 24.56% in this study), the increase in the FS significantly reduces. To further figure out the impact of a high area replacement ratio on the slope stability, an additional case with a high area replacement ratio of m = 40.60% was added into the analysis (included in Figure 7a). It could be found that slope stability gradually approaches the maximum value and tends to be constant.
To explain this phenomenon, the distribution of maximum shear-strain increments was captured from the numerical analysis in the critical instability state of various sloped GESC composite foundations. The distribution represents the development of the continuous plastic zones, indicating the locations of potential slide surfaces. For instance, consider the two cases with area replacement ratios of m = 24.56% and m = 32.08% under the same foundation slope (α = 10°), as illustrated in Figure 8a,b. It is found that the failure mode of the sloped GESC composite foundation shifts from the deep-seated failure (Figure 8a) to the toe failure (Figure 8b). It means the primary factor controlling the overall stability of the model changes from the shear strength of the composite foundation into that of the embankment at a certain point (i.e., area replacement ratio between m = 24.56% and 32.08%). Consequently, further increasing the area replacement ratio beyond the point could effectively enhance the composite foundations, but it does not significantly benefit the overall stability of the sloped GESC composite foundation and its overlying embankment.
Analyzing the combination of Figure 7 and Figure 8, it is evident that there exists an effective range for the area replacement ratios (i.e., m = 0~24.56% in this study). Within the range, increasing the area replacement ratio could significantly improve the slope stability of the sloped GESC composite foundation. However, once the area replacement ratio exceeds the threshold of the range, the increase of slope stability gradually diminishes and tends to stabilize. From an economic perspective, the threshold value of the effective area replacement ratio represents the optimal area replacement ratio, providing high slope stability with low material costs. To further improve the slope stability, it will be more effective to improve the shear strength of embankment fills rather than continually increasing the area replacement ratio.
On the other hand, the slope stability under different foundation slopes (α) was compared in Figure 7b. It is found that the area replacement ratio contributes to an improvement in slope stability at similar rates across all foundation slopes (α = 0~30°), and the effective range of the area replacement ratio also remains nearly the same. However, as the foundation slope increases, the slope stability demonstrates a nonlinear decrease in general, and the magnitude of the decrease grows with the foundation slope (i.e., the steeper the slope, the larger the decrease in slope stability). This phenomenon could be attributed to the variation of the failure mechanism in various sloped GESC composite foundations. Take three cases for instance, including different foundation slopes varying from low to high of α = 5°, 15° and 25° (under the same area replacement ratio of m = 8.02%), as illustrated in Figure 9a–c. It could be found that the failure mechanism changed significantly with the foundation slope. Specifically, the potential sliding surface (i.e., the continuous plastic zone) first occurred at the shallow stratum of the foundation with a low foundation slope (e.g., α = 5°). As the foundation slope increased (e.g., α = 15°), the influence gradually appeared and extended to the area near the bedrock and became more and more evident at the deep stratum of the foundation with a high foundation slope (e.g., α = 25°), which is consistent with the variation of the slope stability. Moreover, the failure mechanism that occurred in the embankment also changed significantly with the foundation slope. The potential sliding surface passing through the embankment developed from the toe towards the center as the foundation slope increased. Especially at high foundation slopes (e.g., α = 25°), the entrance of the siding surface is located close to the center, showing large differences with foundations with low slopes. It can be inferred that the foundation slope had a significant influence on the failure mechanism of sloped GESC composite foundations. When other conditions remained constant, GESC composite foundations with high foundation slopes were more prone to deep failure, thus leading to a decrease in slope stability. Consequently, the stability of high-sloped GESC composite foundations can hardly be ensured by merely increasing the area replacement ratio (e.g., FS < 1.0 when α = 30° for all cases in Figure 7b). More safety storage is necessary for high-angle sloped GESC composite foundations, and it is recommended to use multiple reinforcement techniques to improve their slope stability, such as the combination of GESCs and anti-slide piles.

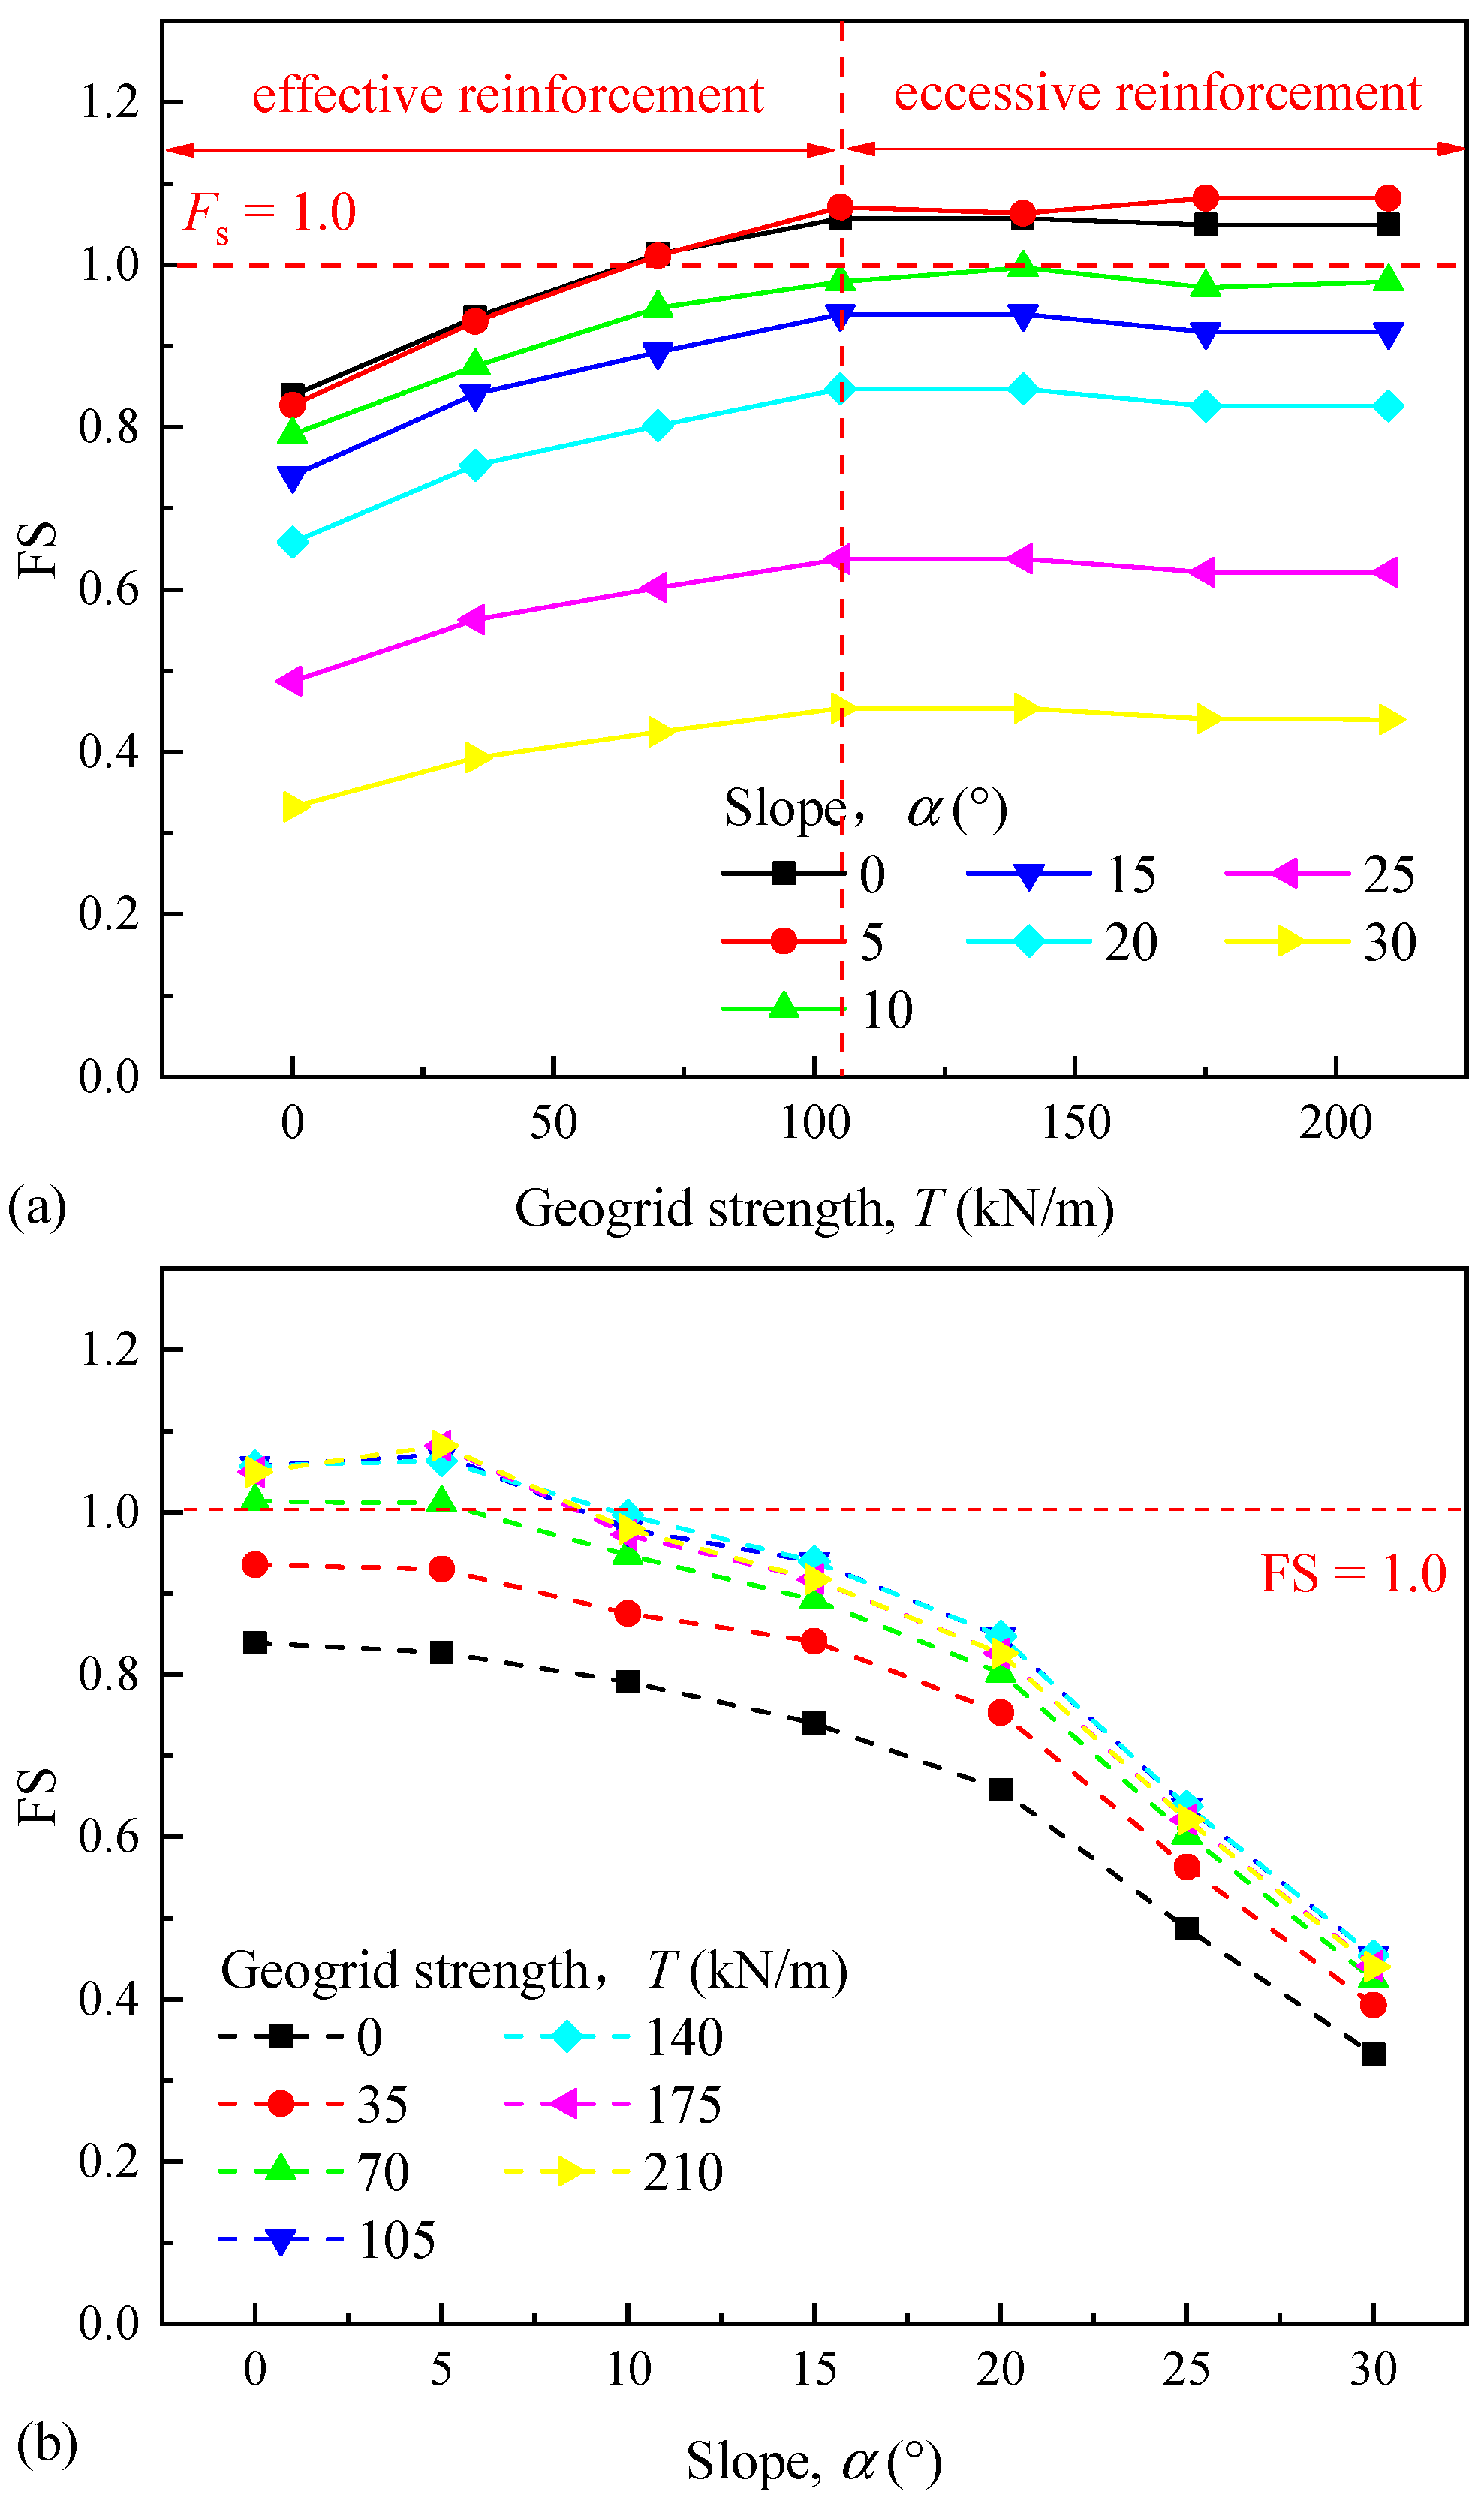
4.2. Effect of Geogrid Strength under Different Slopes

Similarly, the impact of the tensile strength of geosynthetic encasement, i.e., geogrid strength (T), on the slope stability while varying the foundation slopes (α) was illustrated in Figure 10a. As shown, when the geogrid strength is relatively low, the FS exhibits a near-linear increase as the geogrid strength rises, indicating an effective reinforcement of the sloped GESC composite foundation. However, once the geogrid strength surpasses a specific limit (T > 105 kN/m in this study), the FS immediately ceases to increase and remains constant at the maximum value. Further increases in geogrid strength have little influence on the slope stability. Consequently, there is a maximum geogrid strength for the sloped GESC composite foundations to achieve maximum stability. Beyond this point, higher tensile strengths result in excessive reinforcement with minimal benefits in stability.
Additionally, the foundation slope exhibited a nonlinear correlation with the FS, as revealed in Figure 10b, which is similar to that observed in Figure 7b. The relationship holds true regardless of the impact of area replacement ratio or geogrid strength. It is worth noting that increasing the geogrid strength (T) yields relatively limited improvements in the stability of sloped GESC composite foundations compared to increasing the area replacement ratio (m). The conclusion is supported by comparisons of Figure 7a and Figure 9a. Within both the effective reinforcement range (i.e., m = 0~24.56% and T = 0~105 kN/m), increasing the area replacement ratio results in a more substantial improvement in slope stability (FS value increases about 0.6 in general) than increasing the geogrid strength (FS value increases about 0.2 in general).
Moreover, except for the foundations with very low slopes (e.g., α = 0° and 5°), continually increasing the geogrid strength cannot bring a satisfactory result in slope stability (e.g., α = 10~30°). The FS values remain below 1.0 regardless of the increase in geogrid strength. This finding can be attributed to the influence mechanism of the geosynthetic encasement on the shear strength of GESCs and the composite foundations. Specifically, increasing the geogrid strength significantly improves the apparent cohesion of the GESC and the composite foundation but has little impact on their friction angle [12]. However, the friction angle dominates the stability of the embankments supported by granular material columns rather than the cohesion [37]. As a result, the positive contribution of the tensile strength does not surpass the negative effect of the foundation slope, thus failing to improve slope stability to a safe state (FS ≥ 1.0).
In summary, for the horizontal or low-angle sloped GESC composite foundations (α ≤ 5°), their stability can be improved through the increases of geogrid strength, and there is a maximum tensile strength that maximizes slope stability. However, for modest and high-angle sloped GESC composite foundations (α > 5°), increasing the geogrid strength yields limited improvements in the slope stability. By contrast, increasing the area replacement ratio is more effective for stabilizing those sloped GESC composite foundations.

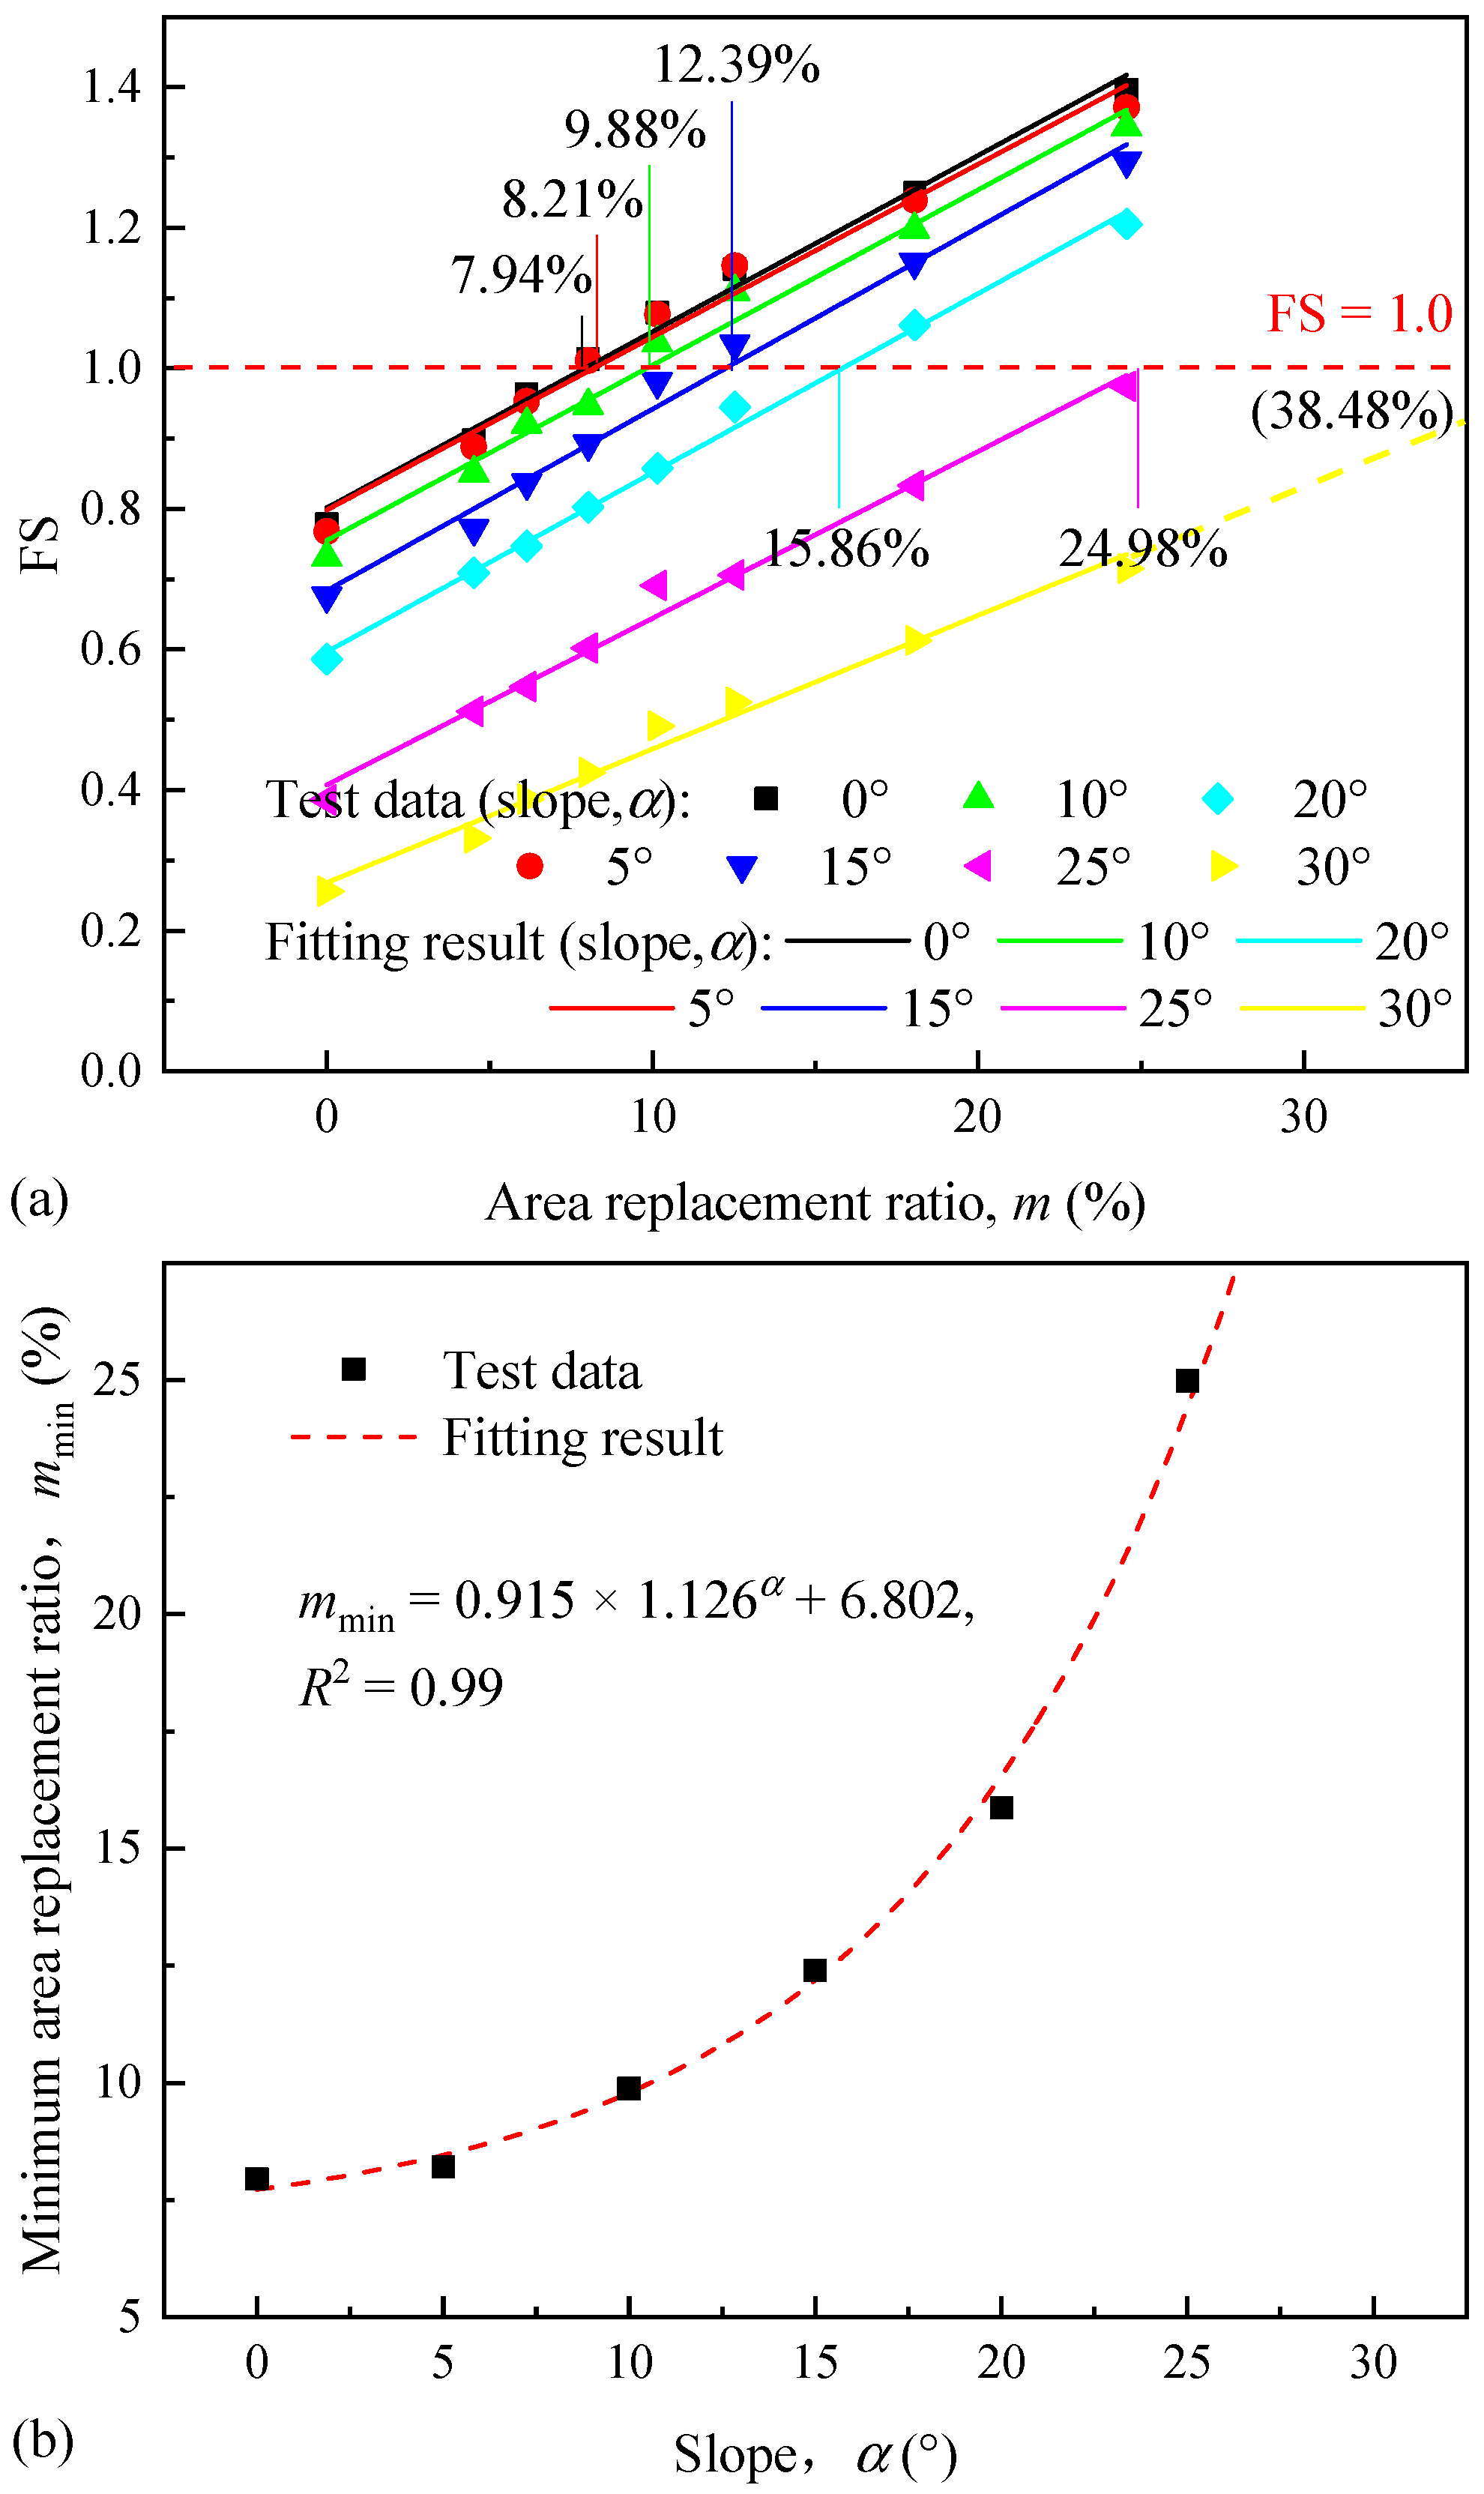
5. Determination of Minimum Area Replacement Ratio

Based on the test results in Section 4.1, the connection between slope stability and area replacement ratio could be further investigated by data fitting, as shown in Figure 11a. The FS values corresponding to the effective area replacement ratios (m = 0~24.56%) were used for the fitting.
According to the conception of the factor of safety (see Equations (13) and (14)), the ultimate equilibrium state is achieved when FS = 1.0 for different sloped GESC composite foundations. Therefore, the area replacement ratio corresponding to FS = 1.0 represents the minimum area replacement ratio (mmin) for sloped GESC composite foundations to meet the basic stability requirements. These values, obtained from the fitted linear relationship between the FS and the area replacement ratio in Figure 11a, are detailed as mmin = 7.94%, 8.21%, 9.88%, 12.39%, 15.86%, 24.98, and 38.48%, corresponding to the foundation slopes of α = 0°, 5°, 10°, 15°, 20°, 25°, and 30°.
The connection between minimum area replacement ratio (mmin) and foundation slope (α) was separately illustrated in Figure 11b. It is observed that the minimum area replacement ratio increases nonlinearly with the increasing foundation slope. Specifically, the larger the foundation slope, the larger the increase in the minimum area replacement ratio. Given the exponential characteristics observed in the relationship, an exponential function is adopted for further data fitting, as described by Equation (17). The correlation coefficient (R2 = 0.99) indicates a good agreement of the fitting result with the test data, suggesting that the connection between the minimum area replacement ratio and the foundation slope can be quantized by the exponential function.
m min = 0.915 × 1.126 α + 6.802
For sloped GESC composite foundations with various foundation slopes (α = 0~30°), the minimum area replacement ratio that ensures slope safety can be easily predicted by Equation (17). Table 3 has listed some typical predicted values of the area replacement ratio at various foundation slopes, providing convenience for the practical design of sloped GESC composite foundations. Once the area replacement ratio is determined, the other parameters of foundation design (e.g., column diameter, column spacing, column arrangement, etc.) can be reasonably determined and adjusted in combination with the actual embankment conditions. It is helpful for the practical design of sloped GESC composite foundations with both economic and safety requirements to meet.

6. Conclusions

In this study, an equivalent method is proposed to establish the sloped GESC composite foundation based on laboratory embankment model tests. The effect of the area replacement ratio (m) and the tensile strength of geosynthetic encasement (T) on the stability of sloped GESC composite foundations are investigated. The findings are summarized as follows:
(1)
The equivalent method, which treats the GESC as a homogeneous material, is rational and effective, offering simplicity and computational efficiency without compromising precision. The method could be recommended for practical applications where simplicity and computational efficiency are prioritized, ensuring accurate results without the need for overly complex calculations;
(2)
The FS increases nonlinearly with the area replacement ratio (m). Within an effective range (e.g., m = 0~24.56% in this study), the FS increases approximately linearly with the area replacement ratio. Beyond this range, the increase tends to diminish and stabilize. There exists an optimal area replacement ratio (m = 24.56%) to ensure slope stability while minimizing material costs. Increasing the shear strength of embankment fills will be more effective for the further improvement of slope stability than continuously increasing the area replacement ratio. Additionally, multiple reinforcement techniques, such as combining GESCs with anti-slide piles, are necessary for high-angle sloped GESC composite foundations;
(3)
The FS also increases linearly with the tensile strength of geosynthetic encasement (T) at lower strength levels (e.g., T = 0~105 kN/m in this study), but beyond a threshold, the FS immediately stops increasing and remains constant, indicating an excessive reinforcement. Increasing the tensile strength of geosynthetic encasement benefits the low-angle (α ≤ 5°) sloped GESC composite foundations more than the modest or high-angle (α > 5°) ones, where increasing the area replacement rate is more effective;
(4)
The connection between the minimum area replacement ratio (mmin) and the foundation slope (α) can be expressed by an exponential function, allowing for the determination of the area replacement ratio for various sloped GESC composite foundations, and providing practical use for achieving safety requirements and economic efficiency;
(5)
Further research could focus on refining the parameter study by involving additional influencing factors, such as column diameter, column spacing, and soil strength. Additionally, research could consider the effects of an additional strip load on soil foundations reinforced layer-by-layer with geomaterials. Investigating the stability of sloped GESC composite foundations using various analysis methods, including finite-element, discrete-element, and theoretical methods, will also be valuable.

Author Contributions

Conceptualization, B.-C.P. and L.Z.; methodology, B.-C.P. and Z.-Y.X.; writing—original draft preparation, B.-C.P.; writing—review and editing, Z.-Y.X., P.-L.C. and Y.-Y.L. All authors have read and agreed to the published version of the manuscript.

Funding

This research was funded by the Foundation of China (grant 52378340, 52078205), the Natural Science Foundation of Hunan Province (grant 2020JJ3013), and the Postgraduate Scientific Research Innovation Project of Hunan Province, China (grant CX20200407, QL20210108). The support is gratefully acknowledged.

Data Availability Statement

Data are contained within the article.

Conflicts of Interest

Authors Bo-Cheng Peng and Ze-Yu Xu were employed by the company China Construction Fifth Engineering Bureau the Third Construction (Shenzhen) Co., Ltd. The remaining authors declare that the research was conducted in the absence of any commercial or financial relationships that could be construed as a potential conflict of interest.

References

  1. De Mello, L.G.; Mondolfo, M.; Montez, F.; Tsukahara, C.N.; Bilfinger, W. First use of geosynthetic encased sand columns in South America. In Proceedings of the 1st Pan-American Geosynthetics Conference, Cancun, Mexico, 2–5 March 2008. [Google Scholar]
  2. Gniel, J.; Bouazza, A. Construction of geogrid encased stone columns: A new proposal based on laboratory testing. Geotext. Geomembr. 2010, 28, 108–118. [Google Scholar] [CrossRef]
  3. Almeida, M.S.S.; Hosseinpour, I.; Riccio, M.; Alexiew, D. Behavior of geotextile-encased granular columns supporting test embankment on soft deposit. J. Geotech. Geoenviron. Eng. 2015, 141, 04014116. [Google Scholar] [CrossRef]
  4. Alexiew, D.; Moormann, C.; Jud, H. Foundation of a coal/coke stockyard on soft soil with geotextile encased columns and horizontal reinforcement. In The 17th International Conference on Soil Mechanics and Geotechnical Engineering; IOS Press: Tepper Drive Clifton, VA, USA, 2009; Volume 1–4, pp. 2236–2239. [Google Scholar]
  5. Alexiew, D.; Raithel, M. Geotextile-Encased Columns: Case Studies over Twenty Years. Embankments with Special Reference to Consolidation and Other Physical Methods; Butterworth-Heinemann: Oxford, UK, 2015; pp. 451–477. [Google Scholar]
  6. Michalowski, R.L.; Wojtasik, A.; Duda, A.; Florkiewicz, A.; Park, D. Failure and remedy of column-supported embankment: Case study. J. Geotech. Geoenviron. Eng. 2018, 144, 05017008. [Google Scholar] [CrossRef]
  7. Shukla, A.; Pandey, B.K.; Ingale, R.; Vivek, A.K.; Meshram, K. Effect of construction time on the behavior of embankment constructed on ESC-improved clayey soil. Indian Geotech. J. 2023, 54, 1538–1548. [Google Scholar] [CrossRef]
  8. Ouyang, F.; Wu, Z.; Wang, Y.; Wang, Z.; Cao, J.; Wang, K.; Zhang, J. Field tests on partially geotextile encased stone column-supported embankment over silty clay. Geotext. Geomembr. 2024, 52, 95–109. [Google Scholar] [CrossRef]
  9. Akosah, S.; Chen, J.; Bao, N. Reinforcement of problematic soils using geotextile encased stone/sand columns. Arab. J. Geosci. 2022, 15, 1371. [Google Scholar] [CrossRef]
  10. Gu, Z.-A.; Niu, F.-J.; Chen, J.-F.; Yoo, C. Centrifuge investigation on behavior of geosynthetic-encased stone column supported embankment under freeze-thaw cycles. Geotext. Geomembr. 2024, 52, 2–11. [Google Scholar] [CrossRef]
  11. Chen, J.-F.; Li, L.-Y.; Xue, J.-F.; Feng, S.-Z. Failure mechanism of geosynthetic-encased stone columns in soft soils under embankment. Geotext. Geomembr. 2015, 43, 424–431. [Google Scholar] [CrossRef]
  12. Zhang, L.; Peng, B.; Xu, Z.; Zhou, S. Shear performance of geosynthetic-encased stone column based on 3D-DEM simulation. Comput. Geotech. 2022, 151, 104952. [Google Scholar] [CrossRef]
  13. Yang, X.-L.; Wang, Z.-B.; Zou, J.-F.; Li, L. Bearing capacity of foundation on slope determined by energy dissipation method and model experiments. J. Cent. South Univ. Technol. 2007, 14, 125–128. [Google Scholar] [CrossRef]
  14. Qiu, Y.; Wei, Y.; Luo, Q. Highway embankments over sloped ground and influence on pavement responses. In Proceedings of the First International Conference on Transportation Engineering, Chengdu, China, 22–24 July 2007; pp. 1615–1620. [Google Scholar]
  15. Jiang, X.; Qiu, Y.J.; Wei, Y.X.; Ling, J. Application of SSRM in stability analysis of subgrade embankments over sloped weak ground with FLAC3D. In Landslides and Engineered Slopes. From the Past to the Future; CRC Press: Boca Raton, FL, USA, 2008; pp. 763–768. [Google Scholar]
  16. Baah-Frempong, E.; Shukla, S.K. Stability analysis and design charts for a sandy soil slope supporting an embedded strip footing. Int. J. Geo-Eng. 2018, 9, 13. [Google Scholar] [CrossRef]
  17. Zhang, O.; Yang, G.; Zhao, Y.; Lu, H.; Hou, L. Parametric Influences of Stability and Settlement Pattern of Embankment on Slope Foundation. IOP Conf. Ser. Earth Environ. Sci. 2020, 560, 012047. [Google Scholar] [CrossRef]
  18. Castro, J.; Sagaseta, C. Deformation and consolidation around encased stone columns. Geotext. Geomembr. 2011, 29, 268–276. [Google Scholar] [CrossRef]
  19. Rajesh, S.; Jain, P. Influence of permeability of soft clay on the efficiency of stone columns and geosynthetic-encased stone columns—A numerical study. Int. J. Geotech. Eng. 2015, 9, 483–493. [Google Scholar] [CrossRef]
  20. Chen, J.-F.; Li, L.-Y.; Zhang, Z.; Zhang, X.; Xu, C.; Rajesh, S.; Feng, S.-Z. Centrifuge modeling of geosynthetic-encased stone column-supported embankment over soft clay. Geotext. Geomembr. 2021, 49, 210–221. [Google Scholar] [CrossRef]
  21. Xu, Z.; Zhang, L.; Peng, B.; Zhou, S. DEM-FDM numerical investigation on load transfer mechanism of GESC-supported embankment. Comput. Geotech. 2021, 138, 104321. [Google Scholar] [CrossRef]
  22. Fan, K.; Liu, S.H.; Cheng, Y.P.; Wang, Y. Sliding stability analysis of a retaining wall constructed by soilbags. Geotech. Lett. 2019, 9, 211–217. [Google Scholar] [CrossRef]
  23. Liu, F.; Wang, J.; Zhou, B.; Wu, M.; He, J.; Bin, J. Shaking table study on rubber-sand mixture cored composite block as low-cost isolation bearing for rural houses. J. Build. Eng. 2023, 76, 107413. [Google Scholar] [CrossRef]
  24. Wang, J.; Wu, M.; Liu, F.; Bin, J.; He, J. Rubber-sand infilled soilbags as seismic isolation cushions: Experimental validation. Geosynth. Int. 2024, 23, 1–4. [Google Scholar] [CrossRef]
  25. Jiang, X.; Liang, D.W.; Liu, J.N. Working mechanism of embankment over sloped weak ground reinforced by combination of gravel piles and slide-resistant piles. J. China Railw. Soc. 2015, 37, 81–87. [Google Scholar]
  26. Chen, J.F.; Wang, X.T.; Zeng, Y. Large triaxial compression tests on geosynthetic-encased granular columns. Chin. J. Geotech. Eng. 2017, 39, 2212–2218. [Google Scholar] [CrossRef]
  27. Fan, K.; Yang, G.; Zou, W.; Han, Z.; Shen, Y. Lateral earth pressure of granular backfills on retaining walls with expanded polystyrene geofoam inclusions under limited surcharge loading. J. Rock Mech. Geotech. Eng. 2024, 16, 1388–1397. [Google Scholar] [CrossRef]
  28. Fan, K.; Zou, W.; Zhang, P.; Wang, X.; Shen, Y.; Fan, K.; Zou, W.; Zhang, P.; Wang, X.; Shen, Y. Laboratory investigation and theoretical analysis of lateral pressure exerted by expansive soils on retaining walls with expanded polystyrene geofoam block upon water infiltration. Geotext. Geomembr. 2024, 52, 332–341. [Google Scholar] [CrossRef]
  29. Frikha, W.; Tounekti, F.; Kaffel, W.; Bouassida, M. Experimental study for the mechanical characterization of Tunis soft soil reinforced by a group of sand columns. Soils Found. 2015, 55, 181–191. [Google Scholar] [CrossRef]
  30. Malarvizhi, S.N.; Ilamparuthi, K.O. Numerical analysis of encapsulated stone columns. In Proceedings of the 12th International Conference of International Association for Computer Methods and Advances in Geomechanics, Goa, India, 1–6 October 2008; pp. 3719–3726. [Google Scholar]
  31. Gu, M.; Han, J.; Zhao, M. Three-dimensional discrete-element method analysis of stresses and deformations of a single geogrid-encased stone column. Int. J. Géoméch. 2017, 17, 04017070. [Google Scholar] [CrossRef]
  32. Gu, M.; Han, J.; Zhao, M. Three-dimensional DEM analysis of single geogrid-encased stone columns under unconfined compression: A parametric study. Acta Geotech. 2017, 12, 559–572. [Google Scholar] [CrossRef]
  33. Zhou, Z.G.; Zhang, Q.S.; Zheng, J.L. Analysis of mechanism of improved ground with stone columns reinforced by geogrids. China Civ. Eng. J. 1998, 31, 21–26. [Google Scholar] [CrossRef]
  34. Zhang, L.; Xu, Z.; Yao, P.; Zhao, M.; Chen, L. Experimental study and discrete element simulation on interface friction of geo-encased stone columns. Chin. J. Geotech. Eng. 2022, 44, 72–81. [Google Scholar] [CrossRef]
  35. Dawson, E.M.; Roth, W.H.; Drescher, A. Slope stability analysis by strength reduction. Geotechnique 1999, 49, 835–840. [Google Scholar] [CrossRef]
  36. Itasca. Fast Lagrangian Analysis of Continua (FLAC3D 6.00); Itasca Consulting Group Inc.: Minneapolis, MN, USA, 2017. [Google Scholar]
  37. Zheng, G.; Yu, X.; Zhou, H.; Wang, S.; Zhao, J.; He, X.; Yang, X. Stability analysis of stone column-supported and geosynthetic-reinforced embankments on soft ground. Geotext. Geomembr. 2020, 48, 349–356. [Google Scholar] [CrossRef]
Figure 1. Illustrations of the FDM model (unit: m): (a) cross-section diagram; (b) layout diagram; (c) 3D representation.
Buildings 14 02681 g001aBuildings 14 02681 g001b
Figure 2. Relationships between the shear strength of GESCs with geogrid strength.
Buildings 14 02681 g002
Figure 3. Analysis diagram of (a) geosynthetic encasement; (b) GESC under compression.
Buildings 14 02681 g003aBuildings 14 02681 g003b
Figure 4. Comparison between actual Young’s modulus and theoretical Young’s modulus of GESCs.
Buildings 14 02681 g004
Figure 5. (a) Sketch of interface shear tests for GESC; (b) comparation of test results and numerical simulation.
Buildings 14 02681 g005
Figure 6. Comparation between numerical and test results: (a) lateral deflections; (b) bending moments.
Buildings 14 02681 g006
Figure 7. Relationship between FS and (a) area replacement ratio; (b) foundation slope.
Buildings 14 02681 g007
Figure 8. Variation of instability features for sloped GESC composite foundations: (a) m = 24.56%; (b) m = 32.08%.
Buildings 14 02681 g008
Figure 9. Variation of failure mechanism in various sloped GESC composite foundations: (a) α = 5°; (b) α = 15°; (c) α = 25°.
Buildings 14 02681 g009aBuildings 14 02681 g009b
Figure 10. Relationship between FS and (a) geogrid strength; (b) foundation slope.
Buildings 14 02681 g010
Figure 11. (a) Determination of minimum area replacement ratio; (b) relationship between minimum area replacement ratio and foundation slope.
Buildings 14 02681 g011
Table 1. Properties of materials applied in the numerical model.
VariableEmbankment SoilSurrounding Soft SoilBedrock
Bulk density (kN/m3)201722
Young’s Modulus (MPa)203300
Cohesion (kPa)0.51200
Friction angle (°)301550
Dilation angle (°)1000
Poisson’s ratio0.30.30.25
Table 2. Test scheme for stability analysis of sloped GESC composite foundations.
Slope,
α (°)
Area Replacement Ratio,
m (%)
Geogrid Strength,
T (kN/m)
00, 4.51, 6.14, 8.02, 10.15, 12.53, 18.04, 24.56, 32.0870
8.020, 35, 70, 105, 140, 175, 210
50, 4.51, 6.14, 8.02, 10.15, 12.53, 18.04, 24.56, 32.0870
8.020, 35, 70, 105, 140, 175, 210
100, 4.51, 6.14, 8.02, 10.15, 12.53, 18.04, 24.56, 32.0870
8.020, 35, 70, 105, 140, 175, 210
150, 4.51, 6.14, 8.02, 10.15, 12.53, 18.04, 24.56, 32.0870
8.020, 35, 70, 105, 140, 175, 210
200, 4.51, 6.14, 8.02, 10.15, 12.53, 18.04, 24.56, 32.0870
8.020, 35, 70, 105, 140, 175, 210
250, 4.51, 6.14, 8.02, 10.15, 12.53, 18.04, 24.56, 32.0870
8.020, 35, 70, 105, 140, 175, 210
300, 4.51, 6.14, 8.02, 10.15, 12.53, 18.04, 24.56, 32.0870
8.020, 35, 70, 105, 140, 175, 210
Table 3. Typical predicted values of area replacement ratio at various foundation slopes.
Foundation Slope,
α (°)
Area Replacement Ratio,
m (%)
Foundation Slope,
α (°)
Area Replacement Ratio,
m (%)
2.58.0317.514.10
58.462016.62
7.59.0322.520.02
109.802524.58
12.510.8427.530.72
1512.233038.98
Disclaimer/Publisher’s Note: The statements, opinions and data contained in all publications are solely those of the individual author(s) and contributor(s) and not of MDPI and/or the editor(s). MDPI and/or the editor(s) disclaim responsibility for any injury to people or property resulting from any ideas, methods, instructions or products referred to in the content.

