Article

Durability of Manufactured-Sand-Reinforced Concrete and Its Wet Joint Prepared in Plateau Environment under Corrosion, Freeze–Thaw Cycle and Their Coupling Effect

1
School of Civil Engineering, Tianjin Chengjian University, Tianjin 300384, China
2
Tianjin Key Laboratory of Civil Structure Protection and Reinforcement, Tianjin 300384, China
3
Tianjin Xingchen Engineering Technology Service Co., Ltd., Tianjin 300400, China
4
No. 6 Engineering Co., Ltd. of FHEC of CCCC, Tianjin 300451, China
*
Authors to whom correspondence should be addressed.
Buildings 2024, 14(9), 2697; https://doi.org/10.3390/buildings14092697
Submission received: 5 August 2024 / Revised: 21 August 2024 / Accepted: 22 August 2024 / Published: 29 August 2024
(This article belongs to the Section Building Materials, and Repair & Renovation)

Abstract

:
In order to explore the durability of manufactured-sand-reinforced concrete and its wet joint in a plateau environment, an integrally formed (IF) specimen and a wet joint specimen with punched interface (PI) made up of manufactured sand concrete were prepared in the simulated plateau environment. On the one hand, the accelerated corrosion test on IF and PI specimens was conducted to investigate their durability under corrosion. On the other hand, the freeze–thaw cycle test was carried out on IF and PI specimens to evaluate their frost resistance. Subsequently, the accelerated corrosion test was continuously performed on IF and PI specimens subjected to freeze–thaw cycles. The development of surface cracks, the corrosion morphology of internal steel bars, the actual corrosion rate, the section loss of corroded steel bars and the degradation of mechanical properties of steel bars after corrosion were analyzed. Moreover, the microstructural changes of specimens after different freeze–thaw cycles and corrosion degrees were observed. The results show that during single corrosion, the development of crack width of concrete, the increase in actual corrosion rates of steel bars and the degradation of mechanical properties of steel bars for IF and PI specimens before the theoretical corrosion rate of 6% were relatively slow, and once the theoretical corrosion rate exceeded 6%, these began to accelerate. The development of concrete cracks and the distribution of crack width are affected by wet joints. Compared with IF specimens, the average and maximum longitudinal crack widths of PI specimens increase by 0–22.54% and 12.16–21.95% for different freeze–thaw cycles, respectively. The frost resistance of the PI specimen decreases due to the existence of a wet joint. After freeze–thaw cycles numbering 50, the difference in frost resistance between IF and PI specimens obviously increased. Compared with IF specimens, the nominal yield strength, nominal ultimate strength and elongation of PI specimens after freeze–thaw cycles numbering 25~100 and corrosion with the theoretical corrosion rate of 6% decreased by 5.56–9.11%, 4.74–6.73% and 23.08–28.72%, respectively. The combined effect of freeze–thaw cycle and corrosion has a great influence on the ductility of steel bars.

1. Introduction

As the most widely used construction material all over the world, concrete is inevitably employed in cold and plateau regions, such as the Sichuan–Tibet region in China. In practice, harsh environments or climates in a plateau area, including low air pressure, large temperature difference and dryness, can accelerate the deterioration of durability of concrete structures [1,2]. At present, as regards the durability of concrete in the plateau environment, it has been found that low air pressure has a negative impact on the air content [3] and pore structure [4] of concrete, weakening the durability of concrete [5]. The research results obtained by Ge et al. [6] show that the durability of concrete was reduced by the low air pressure in a plateau environment through increasing the permeability, deicer salt scaling and water absorption. Some scholars have considered that the development of concrete durability is mainly influenced by temperature and humidity by affecting the hydration reaction of cement [7,8,9,10,11]. When the curing temperature is low, the hydration of cement is slow, and the hydration reaction of cement will stop at an ambient temperature under −10 °C [12]. At a negative temperature, as the curing age increases, the permeability of concrete gradually increases [13]. The research results obtained by He et al. [14] show that the durability of concrete is the worst under the natural outdoor curing conditions in the Qinghai Tibet Plateau among different climate environments. As is well known, the freeze–thaw damage of concrete, the corrosion of steel bars caused by chloride salt erosion, and the alkali aggregate reaction are the three major factors affecting the durability of concrete. In a plateau environment, freeze–thaw cycle damage is still the most important factor resulting in the decline in durability of concrete structures [15].
In the Tibet Plateau, the seasonal temperature difference and the temperature difference between day and night are large. Even during the alternation of day and night, the water can freeze and melt alternately [14]. In addition, there is a richness of minerals and many salt lakes in the Tibet Plateau. In a high-salt area, the freeze–thaw cycle is generally accompanied by chloride erosion. The damage caused by freeze–thaw cycles to concrete structures is irreversible [13,16,17,18]. When the temperature drops, the free water in the concrete and the osmotic water in the pores begin to freeze. This causes the water to freeze into ice, resulting in a volume expansion, thereby inducing the formation of fine cracks within the concrete. When the temperature rises, the ice crystals melt and the internal cracks shrink. However, due to the poor tensile strength of concrete, the internal cracks of concrete may not necessarily return to their original state after the temperature increases. After such repeated freeze–thaw cycles, the concrete experiences fatigue, with internal cracks continuing to develop. Moreover, due to the hydrophilicity of concrete, the expansion of cracks leads to the infiltration of increased external water into the interior. As the freeze–thaw cycle continues, the cracks continue to grow, forming a vicious cycle. Consequently, the strength and durability of concrete structures decrease. In the plateau area, there is a large amount of chlorine salt in groundwater, which penetrates into the concrete through cracks, thereby accelerating the deterioration of concrete structures. Under the dual effects of chloride salt erosion and the freeze–thaw cycle, coupled with the influence of low air pressure and a low-humidity environment, concrete cracking or spalling can occur, and this can further exacerbate the corrosion of steel bars, thereby resulting in a rapid shortening of the service life of concrete. In addition, as the weak areas of a precast concrete bridge structure, wet joints derived from the connections of prefabricated components are prone to become damaged first [19,20,21,22]. Therefore, it is of great significance to investigate the durability of concrete and its wet joint in a bridge subjected to the coupling effect of the freeze–thaw cycle and corrosion in a plateau environment.
As regards the durability of joints in precast concrete structures, Udaipurwala et al. [23] found that the reinforcements embedded in the bridge deck were severely corroded owing to the ingress of chloride ions through the interface of joints between the precast elements and the closure pours, and the materials used in closure pours had little effect in terms of improving the durability of joints because the bonding at the interface is not strong enough to prevent chloride penetration. Shen et al. [24] conducted accelerated freeze–thaw tests on specimens with different types of construction joints at different compressive stress levels. The results show that compressive stress not exceeding 0.5 fck could improve the freeze–thaw durability of concrete, and the freeze–thaw resistance of concrete was considerably influenced by different types of joints. Höffgen et al. [25] evaluated concrete durability on localized structural weaknesses created by joints, and three different types of exposure, including chloride penetration, carbonation and freeze–thaw attack, were analyzed. Yoo et al. [26] presented a quantitative evaluation of the chloride diffusion coefficient considering the effects of a cold joint and loading conditions, and Yang et al. [27] investigated changes in the chloride diffusion coefficient in cold joint concrete considering time effects and various loading conditions. The results show that the penetration rate of chloride ions in the joint area increased significantly. Zhang et al. [28] analyzed the beam-to-column joint to illustrate the differences between PC structures and those cast in situ using Monte Carlo simulation. The analysis indicates that corrosion initiation and serviceability limit state were sensitive to chloride diffusivity at the connection area. To sum up, the current research on the durability of concrete joints mainly focuses on chloride ion erosion, freeze–thaw, carbonation and other factors, and there are few reports on the impact of reinforcement corrosion at concrete joints on the durability of concrete.
As the key raw material of concrete, the supply of natural sand has struggled to meet the growing market demand. In addition, the large-scale exploitation of natural sand has also brought about many environmental problems, such as river pollution, hydrological condition changes and river embankment damage. As a substitute of river sand, the application of manufactured sand in concrete has become an irreversible trend because of its economic and environmental advantages [29]. As regards the durability of manufactured sand concrete, it has been observed by Tahir et al. [30] that stone powder has a significant effect on the compactness of manufactured sand concrete. Stone powder can promote cement hydration, and also reduce voids and the permeability channels of water. With the increase in stone powder content, the compactness of concrete is enhanced, and the impermeability is improved. In addition, some researchers have also proposed that stone powder can promote the hydration of C3S and react with other compounds to form crystals, optimizing the pore structure of concrete [31]. Sangoju et al. [32] pointed out that the durability of manufactured sand concrete in a chloride environment was better than that of river sand concrete, which could be regarded as a substitute for natural sand. Chen et al. [33] carried out experimental investigations on C30, C40 and C50 manufactured sand concrete in coupled environments of salt erosion and freeze–thaw cycles. The results show that the sodium chloride erosion solution coupled with freeze–thaw cycles led to the deterioration of manufactured sand concrete most severely out of all the coupling effects. Vijaya et al. [34] conducted acid corrosion tests, sulfate corrosion tests and rapid chloride ion penetration tests on ordinary concrete and manufactured sand concrete, and the results show that the durability of manufactured sand concrete of all grades was higher than that of river sand concrete. Zhang et al. [35] pointed out that because the stone powder in manufactured sand had a positive effect on the pore filling of concrete, it showed better durability in an atmospheric acidification environment. Zheng et al. [36] prepared granite and limestone manufactured sand concrete and studied the influence of fine aggregate on the durability of high-strength manufactured sand concrete. The results show that the appropriate amount of fine aggregate could improve the chloride ion corrosion resistance of concrete, and the durability of high-strength manufactured sand concrete was the best when the fine aggregate content was 10%. The research by Li et al. [37] indicates that adding granite dust instead of fly ash into manufactured sand concrete could improve its frost resistance when the content of granite dust was less than 20%. It can be seen from the above studies that the manufactured sand concrete shows superior durability compared to the river sand concrete in a harsh environment, such as one with salt erosion, freeze–thaw cycles, acidification, and their coupling effects. However, there are few studies on the durability of manufactured sand concrete in a plateau environment, especially for the wet joint of manufactured sand concrete prepared in a plateau environment.
Through previous studies by the authors, it has been determined that the chloride corrosion resistance of a concrete wet joint with a punched interface is excellent, and is close to that of integrally formed concrete. To further investigate the durability of a wet joint with a punched interface, a freeze–thaw–corrosion test on the wet joint specimens of manufactured-sand-reinforced concrete with a punched interface prepared in a simulated plateau environment was carried out in this study, with the integrally formed manufactured-sand-reinforced concrete as the comparison specimen. In one case, only an accelerated corrosion test on specimens in the chloride salt solution was conducted. The corrosion rates of steel bars of 2~10% were considered in this test. The durability of different specimens was studied by analyzing the indexes, including the surface cracking of concrete, the corrosion morphology of internal steel bars, and the degradation of mechanical properties of steel bars. On the other hand, the freeze–thaw cycle test and accelerated corrosion test were performed on specimens by sequence. Freeze–thaw cycles numbering 20~100 times and the specific corrosion rate of the steel bar determined by previous corrosion tests were adopted in these experiments. Firstly, the mass loss rate and relative dynamic elastic modulus were measured to evaluate the freeze–thaw durability of different specimens. Finally, the durability of manufactured-sand-reinforced concrete and its wet joint with a punched interface prepared in a plateau environment under the coupling effects of freeze–thaw and corrosion was comprehensively evaluated by re-analyzing the indexes previously mentioned, with the aim of providing reasonable recommendations for engineering practice.

2. Experimental Design

2.1. Experimental Materials

The P·O 42.5 ordinary Portland cement (OPC) and grade Ⅰ fly ash were used as cementitious materials in the test. The manufactured sand (medium sand) was adopted as the fine aggregate. The continuous graded crushed stone was selected as the coarse aggregate, and the mass ratio of particles with sizes of 5~10 mm and 10~20 mm was 3:7. The JM-HPC3 high-efficiency retarding water reducer with a water reduction rate of 18% was used as the admixture. HRB400 steel bar with a length of 400 mm was selected in this experiment. The physical properties of different experimental materials, including manufactured sand, crushed stone, cement, steel bar and concrete, were tested according to the Sand for construction (GB/T 14684-2022), Pebble and crushed stone for construction (GB/T 14685-2022), Test methods for water requirement of normal consistency, setting time and soundness of the Portland cement (GBT 1346-2021), Test method of cement mortar strength (ISO method) (GB/T 17671-2021), Steel for the reinforcement of concrete-Part 2: Hot rolled ribbed bars (GB 1499.2-2024) and Standard for test methods of concrete physical and mechanical properties (GB/T 50081-2019) in China, respectively. The mix ratio was set according to the Specification for mix proportion design of ordinary concrete (JGJ55-2019) in China. The experimental materials, physical properties of cement and parameters of the steel bar are listed in Table 1, Table 2 and Table 3. The fly ash, manufactured sand and coarse aggregate are shown in Figure 1. The mix ratio of concrete with a design strength of C50 is shown in Table 4. The compressive strength of the concrete cube is also listed in Table 4.

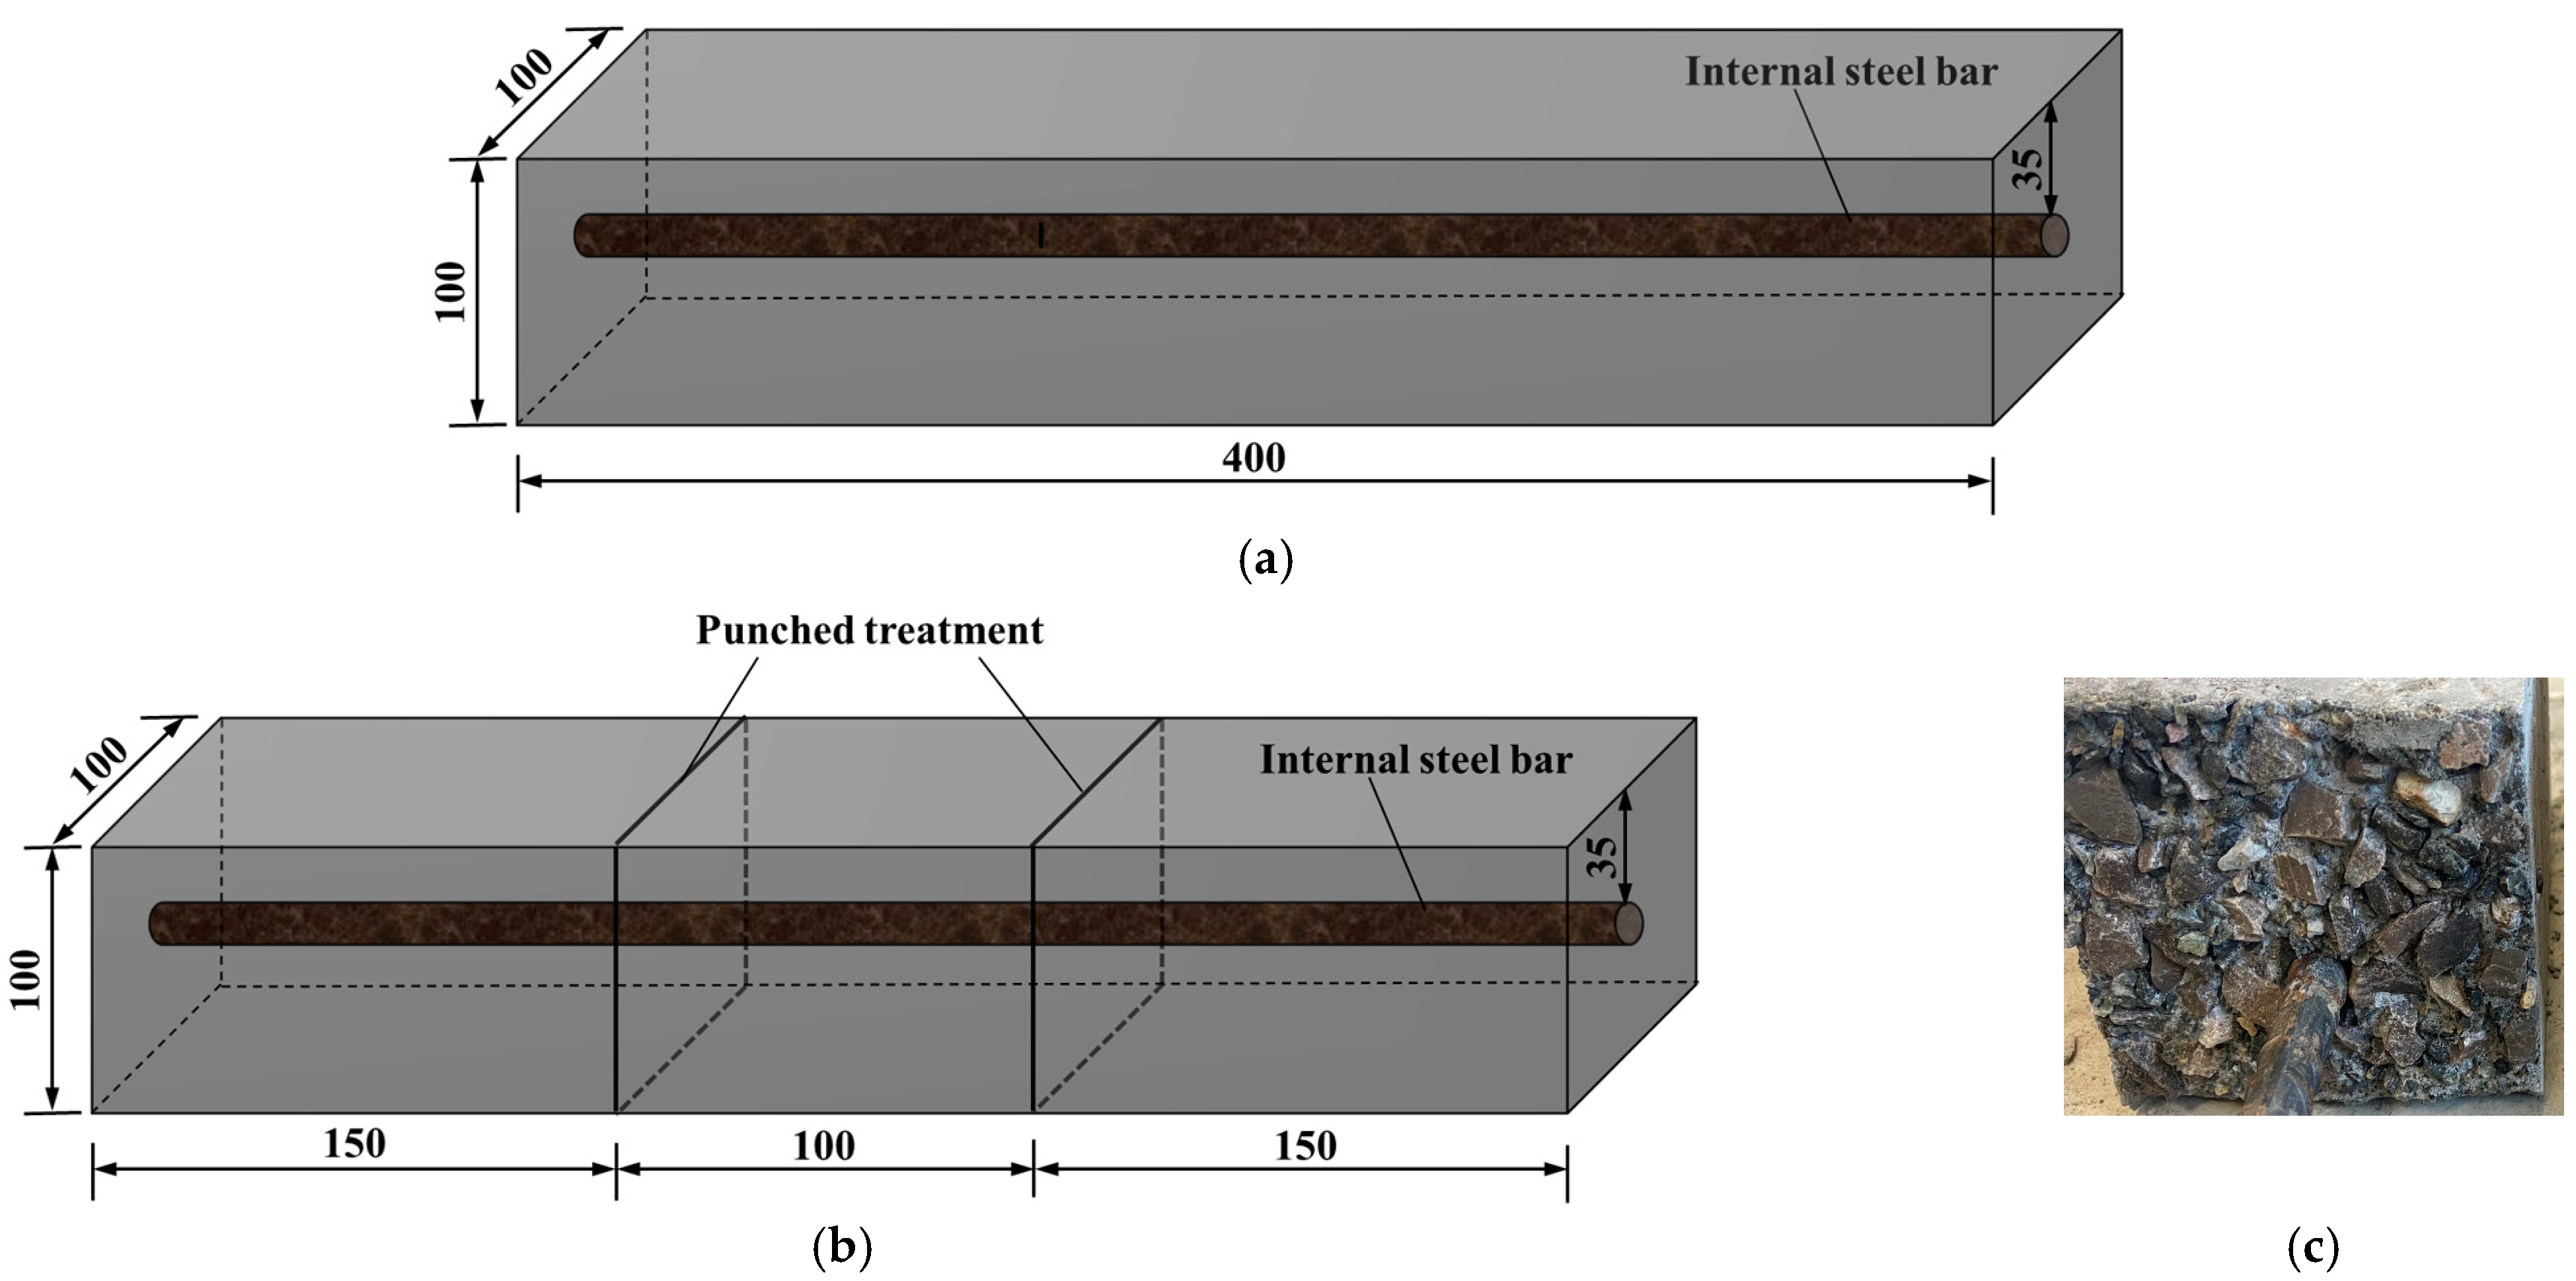
2.2. Preparation of Specimens and Test Method

Two types of manufactured-sand-reinforced concrete specimens, including an integrally formed (IF) specimen and a wet joint specimen with punched interface (PI), were prepared in a simulated plateau environment. The IF and PI specimens were prisms of 100 × 100 × 400 mm. The IF specimen was cast as a whole and the PI specimen was cast in two parts. A Φ12 HRB400 steel bar was set in the specimen, which had a protective layer with a thickness of 35 mm. The initial mass of the steel bar was weighed with an electronic scale whose accuracy was 0.01 g. And a wire was connected at one end of the steel bar to facilitate electric corrosion before casting the concrete, which was sealed with epoxy resin glue. For the PI specimen, its preparation process included two steps. Firstly, a stop block of 100 × 100 × 100 mm was set in the longitudinal middle part of test mold of 100 × 100 × 400 mm. Then both ends of specimen were cast to dimensions of 100 × 100 × 150 mm. After 24 h, the concrete had hardened, the stop block was removed, and the joint interfaces were roughened with a high-pressure water gun. Finally, the concrete of 100 × 100 × 100 mm was cast in the middle of the PI specimen. The sizes of specimens and the joint interface of PI specimen after punched treatment are shown in Figure 2.
According to the research by Zhang et al. [38], the properties of concrete are mainly impacted by low air pressure in the casting and molding stages and the initial stage of curing. Therefore, a low-pressure simulation chamber was designed to simulate the low-pressure condition, where specimens were prepared and initially cured. Further, a multi-functional environment simulation box was designed to simulate the large temperature variation and dry environment, wherein specimens were primarily cured. The plateau environment was simulated using these two devices. In the low-pressure simulation chamber, the concrete mixer, vibration table and air pressure console were included. In the multi-functional environment simulation box, the refrigerating machine, heater, humidifier and temperature and humidity console were contained. According to the environment in the Sichuan–Tibet region in China, the air pressure inside the simulation chamber was set as 60.1 kPa, and the temperature in the simulation box was set as −10~20 °C (±3 °C), which varied between day and night within 1 d. In a cycle, the temperature was maintained at 20 °C for 10 h and −10 °C for 10 h, and there was a heating process (from −10 °C to 20 °C) of 2 h and a cooling process (from 20 °C to −10 °C) of 2 h. The humidity in the simulation box was maintained at 25–30% [14]. The temperature and humidity in the low-pressure simulation chamber were essentially consistent with those outside, and the air pressure in the multi-functional environment simulation box was normal atmospheric pressure, which was consistent with the condition outside of the box. The IF specimen was cast and cured in the low-pressure simulation chamber for 7 days, and then it was placed in the environment simulation box for 21 days. For the PI specimen, the pre-cast concrete was first cast and cured in the low-pressure simulation chamber for 7 days, and then the joint interfaces were treated by punching and the wet joint was cast and cured in the low-pressure simulation chamber for another 7 days. Finally, the specimen was placed in the environment simulation box for another 14 days. For IF and PI specimens, the entire preparation process lasted for 28 days. After curing, the specimens were taken out for later use. The preparation and test processes and methods of development of the IF and PI specimens are shown in Figure 3.
For single corrosion test, the specimens were placed in 5% NaCl solution, and were subjected to accelerated corrosion by energization. During the corrosion test, aside from the pouring surface reserved as the erosion area, the other surfaces of specimens were sealed with neutral silicone structural adhesive to simulate chloride ion erosion through the upper surface of the actual engineering structure. In the corrosion device, the steel bars in the specimens, the carbon rod and the salt solution formed a loop, and energization was implemented using the stabilized voltage supply [39,40], whose current was set to 0.02 A. During the single corrosion test, the theoretical corrosion rates of steel bars in specimens were set as 2%, 4%, 6%, 8% and 10%. According to Faraday’s law, the energization times under five theoretical corrosion rates were calculated [41].
For the coupling test of the freeze–thaw cycle and corrosion, IF and PI specimens were subjected to the freeze–thaw cycle test and corrosion test successively. The freeze–thaw cycle test was conducted using the rapid freeze–thaw testing machine according to the test method for the rapid freezing and thawing in the Standard for test methods of long-term performance and durability of ordinary concrete (GB/T 50082-2009) in China. Firstly, the initial masses of PI and IF specimens prepared for the freeze–thaw cycle test were weighed with an electronic scale whose accuracy was 0.01 g. Then, the specimens were put into the black rubber sleeves, which were filled with water. The water surface was 20 mm above the tops of specimens and the specimens were soaked in water for 4 days. After that, the specimens were taken out and the surface moisture of specimens was wiped off with a dry cloth. The initial transverse fundamental frequency of specimens was measured using a concrete dynamic elastic modulus tester, as shown in Figure 4. After the measurements, the specimens were put into the rubber sleeves again and water was added into the sleeves to more than 5 mm above the tops of specimens. Finally, the sleeves were placed in the test frame grid of the freeze–thaw testing machine and antifreeze was poured into the freeze–thaw test box. PI and IF specimens were subjected to freeze–thaw cycles numbering 25, 50, 75 and 100, respectively. Each freeze–thaw cycle was set as 4 h, and the thawing time was set as 1 h, which was not less than 1/4 of the total freeze–thaw time. The temperatures of freezing and thawing in the centers of specimens were controlled at −18 ± 2 °C and 5 ± 2 °C, respectively. The interval number of freeze–thaw cycles was set to 25; that is, the specimen was taken out every 25 freeze–thaw cycles, and the surface moisture of specimens was wiped with a cloth. Finally, the mass and transverse fundamental frequency of specimens after freeze–thaw cycles were measured. After the freeze–thaw cycle test, the specimens were subsequently placed in 5% NaCl solution, and the accelerated corrosion test was conducted until a theoretical corrosion rate of 6% (which was determined according to the test results obtained from single corrosion) was achieved for the steel bars in specimens. The specific test process was the same as that outlined in single corrosion test. Three parallel specimens were prepared for each testing condition.

2.3. Test Indices

After the freeze–thaw cycle test, the mass loss rate and relative dynamic elastic modulus were calculated according to Equations (1) and (2), respectively.
Δ W n = M 0 M n M 0 × 100 %
where Δ W n is the mass loss rate (%) of concrete after the freeze–thaw cycles of n, M 0 is the initial mass (kg) of specimens before the freeze–thaw cycle, and M n is the mass (kg) of specimens after the freeze–thaw cycles of n.
P = f n 2 f 0 2 × 100 %
where P is the relative dynamic elastic modulus of concrete after freeze–thaw cycles of n, f n 2 is the square of the transverse fundamental frequency (Hz2) of specimens after freeze–thaw cycles of n, and f 0 2 is the square of the initial transverse fundamental frequency (Hz2) of specimens before the freeze–thaw cycle.
After the corrosion test, the crack width of the specimens was measured using the SK-510 crack detector, the actual average corrosion rate of the steel bar was calculated based on the weight loss of the steel bar, and the diameter of the steel bar after rust removal was obtained using a vernier caliper with an accuracy of 0.01 mm. Here, the mass and diameter of the steel bar after corrosion were measured after the rust on the surface of the steel bar had been cleaned with a rust-remover and anhydrous ethanol, and the steel bar was dried. The crack width of the concrete and the diameter of the steel bar after corrosion were measured at every 20 mm along the longitudinal direction of the specimen. By counting 21 test values, the maximum and average crack widths of specimens were obtained. The diameter of the steel bar was measured twice at positions perpendicular to each other, and the mean of two measurements was adopted as the diameter d of the steel bar for each measuring point. The cross-section loss rate μ (%) of the steel bar was calculated according to Equation (3). Then, the static tensile properties of the corroded steel bar were tested using a universal testing machine according to the Test methods of steel for reinforcement of concrete (GB/T 28900-2022) and the Steel for the reinforcement and prestressing of concrete-Test methods-Part 1: Reinforcing bars, rods and wire, MOD (ISO 15630-1: 2019), and the tensile rate was 10 MPa/s until breaking. Finally, the micro-morphologies of concrete in IF specimens and at the joint interfaces of PI specimens were observed by SEM. The testing instruments, including the dynamic elastic modulus tester and crack detector, are shown in Figure 4 and Figure 5.
μ = A 0 A A 0 × 100 % = 1 ( d d 0 ) 2
where A0 and A represent the cross-sectional areas of the steel bar before and after corrosion, respectively (mm2), and d0 and d represent the diameters of the steel bar before and after corrosion, respectively (mm).
For the single corrosion test, the specimens were named as follows: Type (IF or PI)—strength grade (C50)—preparation environment (LP)—theoretical corrosion rate (2%~10%). For the freeze–thaw cycle test, the specimens were named as follows: Type (IF or PI)—strength grade (C50)—preparation environment (LP)—freeze–thaw cycles (25~100). For the coupling test of freeze–thaw cycle and corrosion, the specimens after freeze–thaw cycle testing continued to suffer corrosion, and were named as follows: Type (IF or PI)—strength grade (C50)—preparation environment (LP)—freeze–thaw cycles (25~100)—theoretical corrosion rate (6%). For example, PI-50-LP-25-6 is a PI specimen whose concrete strength grade was C50, was prepared in the LP environment, and was subjected to freeze–thaw cycles numbering 25 and corrosion to the theoretical corrosion rate of 6% for the steel bar in the specimen.

3. Results and Discussion

3.1. Corrosion Effect

3.1.1. Crack Development on the Specimen Surface

Figure 6 shows the development of cracks of IF and PI specimens when the theoretical corrosion rates of steel bars were 2%, 4% and 10%. Cracks began to appear on the surfaces of the post-cast concrete in the PI specimen when the theoretical corrosion rate reached 2%, which was earlier than that of the IF specimen. There were only longitudinal cracks along steel bars for IF specimens [42,43], while there were longitudinal cracks along steel bars and transverse cracks along joint interfaces for PI specimens. The transverse crack width was less than that of the longitudinal crack width for the same specimen. Generally, the maximum width cracks were mainly located around the transverse joint interfaces for PI specimens.
Figure 7 shows the variation curves of maximum and average crack widths with the theoretical corrosion rates for IF and PI specimens. It can be seen that as the theoretical corrosion rates increased from 2% to 6%, the maximum and average crack widths of specimens increase gradually. Subsequently, the increases in maximum and average crack widths became evident. In general, the average longitudinal crack width of the PI specimens was close to that of the IF specimens after the theoretical corrosion rate of 4%. The maximum longitudinal crack widths of PI specimens were always greater than those of IF specimens when the theoretical corrosion rate varied from 2% to 10%. Compared with the longitudinal crack, the transverse crack widths of PI specimens increased slowly, and the maximum and average transverse crack widths were small, resulting from the rust expansion effect of the longitudinal steel bar acting on concrete. Compared with IF-50-LP specimens, the average and maximum longitudinal crack widths of PI-50-LP specimens increased by −11.54~13.33% (average: 6.20%) and 22.22~54.17% (average: 33.57%), respectively.

3.1.2. Corrosion of Steel Bars

Figure 8 shows the corrosion morphologies of steel bars in IF and PI specimens at the theoretical corrosion rate of 10%. The steel bar in the IF-50-LP-10 specimen was relatively intact, and the area of corrosion pits was small. However, the longitudinal rib of the steel bar in the PI-50-LP-10 specimen was severely corroded, and corrosion pits with large areas appeared on the surfaces of the steel bar. These were obvious near the joint interfaces.
Figure 9 shows the actual corrosion rates of steel bars in IF and PI specimens under different theoretical corrosion rates. The theoretical corrosion rate here can reflect the corrosion time. All the actual corrosion rates of steel bars in the IF and PI specimens exceeded the corresponding theoretical corrosion rates, and the actual corrosion rates of steel bars in PI specimens were always larger than those of IF specimens over the same corrosion time. When the theoretical corrosion rate was 6%, the difference in the actual corrosion rate between IF and PI specimens was at the minimum, which is consistent with the rule presented by the average longitudinal crack width. Compared with IF-50-LP specimens, the actual corrosion rates of steel bars in PI-50-LP specimens increased by 2.67~30.05% (average: 18.90%). This is because the joint interface can provide a path for the penetration of chloride ions.
Figure 10 shows the section loss rates of steel bars in IF and PI specimens at every 20 mm along the longitudinal direction. It can be seen that the section loss rates of steel bars in PI specimens at the post-cast wet joint were clearly greater, especially at the joint interfaces, than that at any other areas of the specimens, and were also greater than those at the same location in IF specimens. This rule is suitable for any corrosion rates of steel bars in this experiment. The reason behind this is that in the early stage of corrosion, the chloride ions are transmitted into the post-cast wet joint not only through the exposed surface of the specimen, but also through the joint interfaces, and the chloride ions can be transmitted horizontally along the longitudinal direction through joint interfaces. In the later stage of corrosion, the chloride ions are mainly transmitted through cracks, and the crack width of the post-cast wet joint is also larger than that of any other area of specimen, as shown in Figure 6.

3.1.3. Mechanical Properties of Corroded Steel Bars

Figure 11 shows the degradation of mechanical properties of steel bars in IF and PI specimens with the corrosion rate. The degradation degrees of the nominal strength (including nominal yield strength and nominal ultimate strength, which are calculated by dividing the yield load and ultimate load of corroded steel bar by its initial cross-sectional area) of steel bars were similar for IF and PI specimens before the theoretical corrosion rate of 6%. When the theoretical corrosion rate exceeded 6%, the degradation rate of the strength of steel bars in PI specimens was greater than that of steel bars in IF specimens, which is mainly due to the more serious section loss of the steel bar at the joint interfaces. In general, the degradation rate of the yield strength of steel bars was similar to that of the corresponding ultimate strength for IF and PI specimens. Compared with the IF-50-LP specimens, the yield and ultimate strengths of steel bars in PI-50-LP specimens decreased by 0.11~8.75% (average: 3.29%) and 0.91~8.30% (average: 3.57%), respectively.
The degradation of elongation of the steel bars was relatively slow before the theoretical corrosion rate of 6%, and it then became fast once the theoretical corrosion rate exceeded 6%. However, unlike the degradation of strength, the degradation degree of elongation of steel bars in PI specimens was significantly greater than that of steel bars in IF specimens during the whole period of corrosion, which results from the obvious stress concentration in the steel bar at the joint interfaces during the tensile process of steel bars. In general, with the increase in the theoretical corrosion rate, the difference in the elongation of steel bars after corrosion gradually decreased. This is primarily because, at the theoretical corrosion rate of 2%, no crack appeared on the surface of the IF-50-LP specimen, and transverse cracks appeared on the surface of the PI-50-LP specimen (as shown in Figure 6); the differences in terms of the corrosion of steel bars between IF-50-LP and PI-50-LP specimens mainly manifested at the joint interfaces (as shown in Figure 10). As the corrosion degree increased, the longitudinal distribution of the section loss rate of the steel bars tended to remain uniform. In addition, the degradation of elongation of steel bar is related to the total longitudinal corrosion and not just the maximum section loss of the steel bar. Compared with the IF-50-LP specimens, the percentage reduction of elongation in steel bars in the PI-50-LP specimens was 18.67~37.14% (average: 28.13%).
Based on the above research, it has been found that the development of crack width in concrete, the increase in actual corrosion rates of steel bars and the degradation of mechanical properties of steel bars for IF and PI specimens before the theoretical corrosion rate of 6% were relatively slow, whereas once the theoretical corrosion rate exceeded 6%, these began to accelerate [44]. The average crack width of concrete, the actual corrosion rate of the steel bar and the yield and ultimate strengths of the steel bar in IF and PI specimens at the theoretical corrosion rate of 6% were similar. Therefore, the theoretical corrosion rate of a steel bar of 6% can be considered as the boundary point for the development of various durability indicators of specimens prepared in a plateau environment under chloride corrosion. As a result, to reduce the number of specimens, a theoretical corrosion rate of a steel bar of 6% was fixed in the subsequent coupling tests of corrosion and freeze–thaw cycles performed on IF and PI specimens.

3.2. Freeze–Thaw Cycle

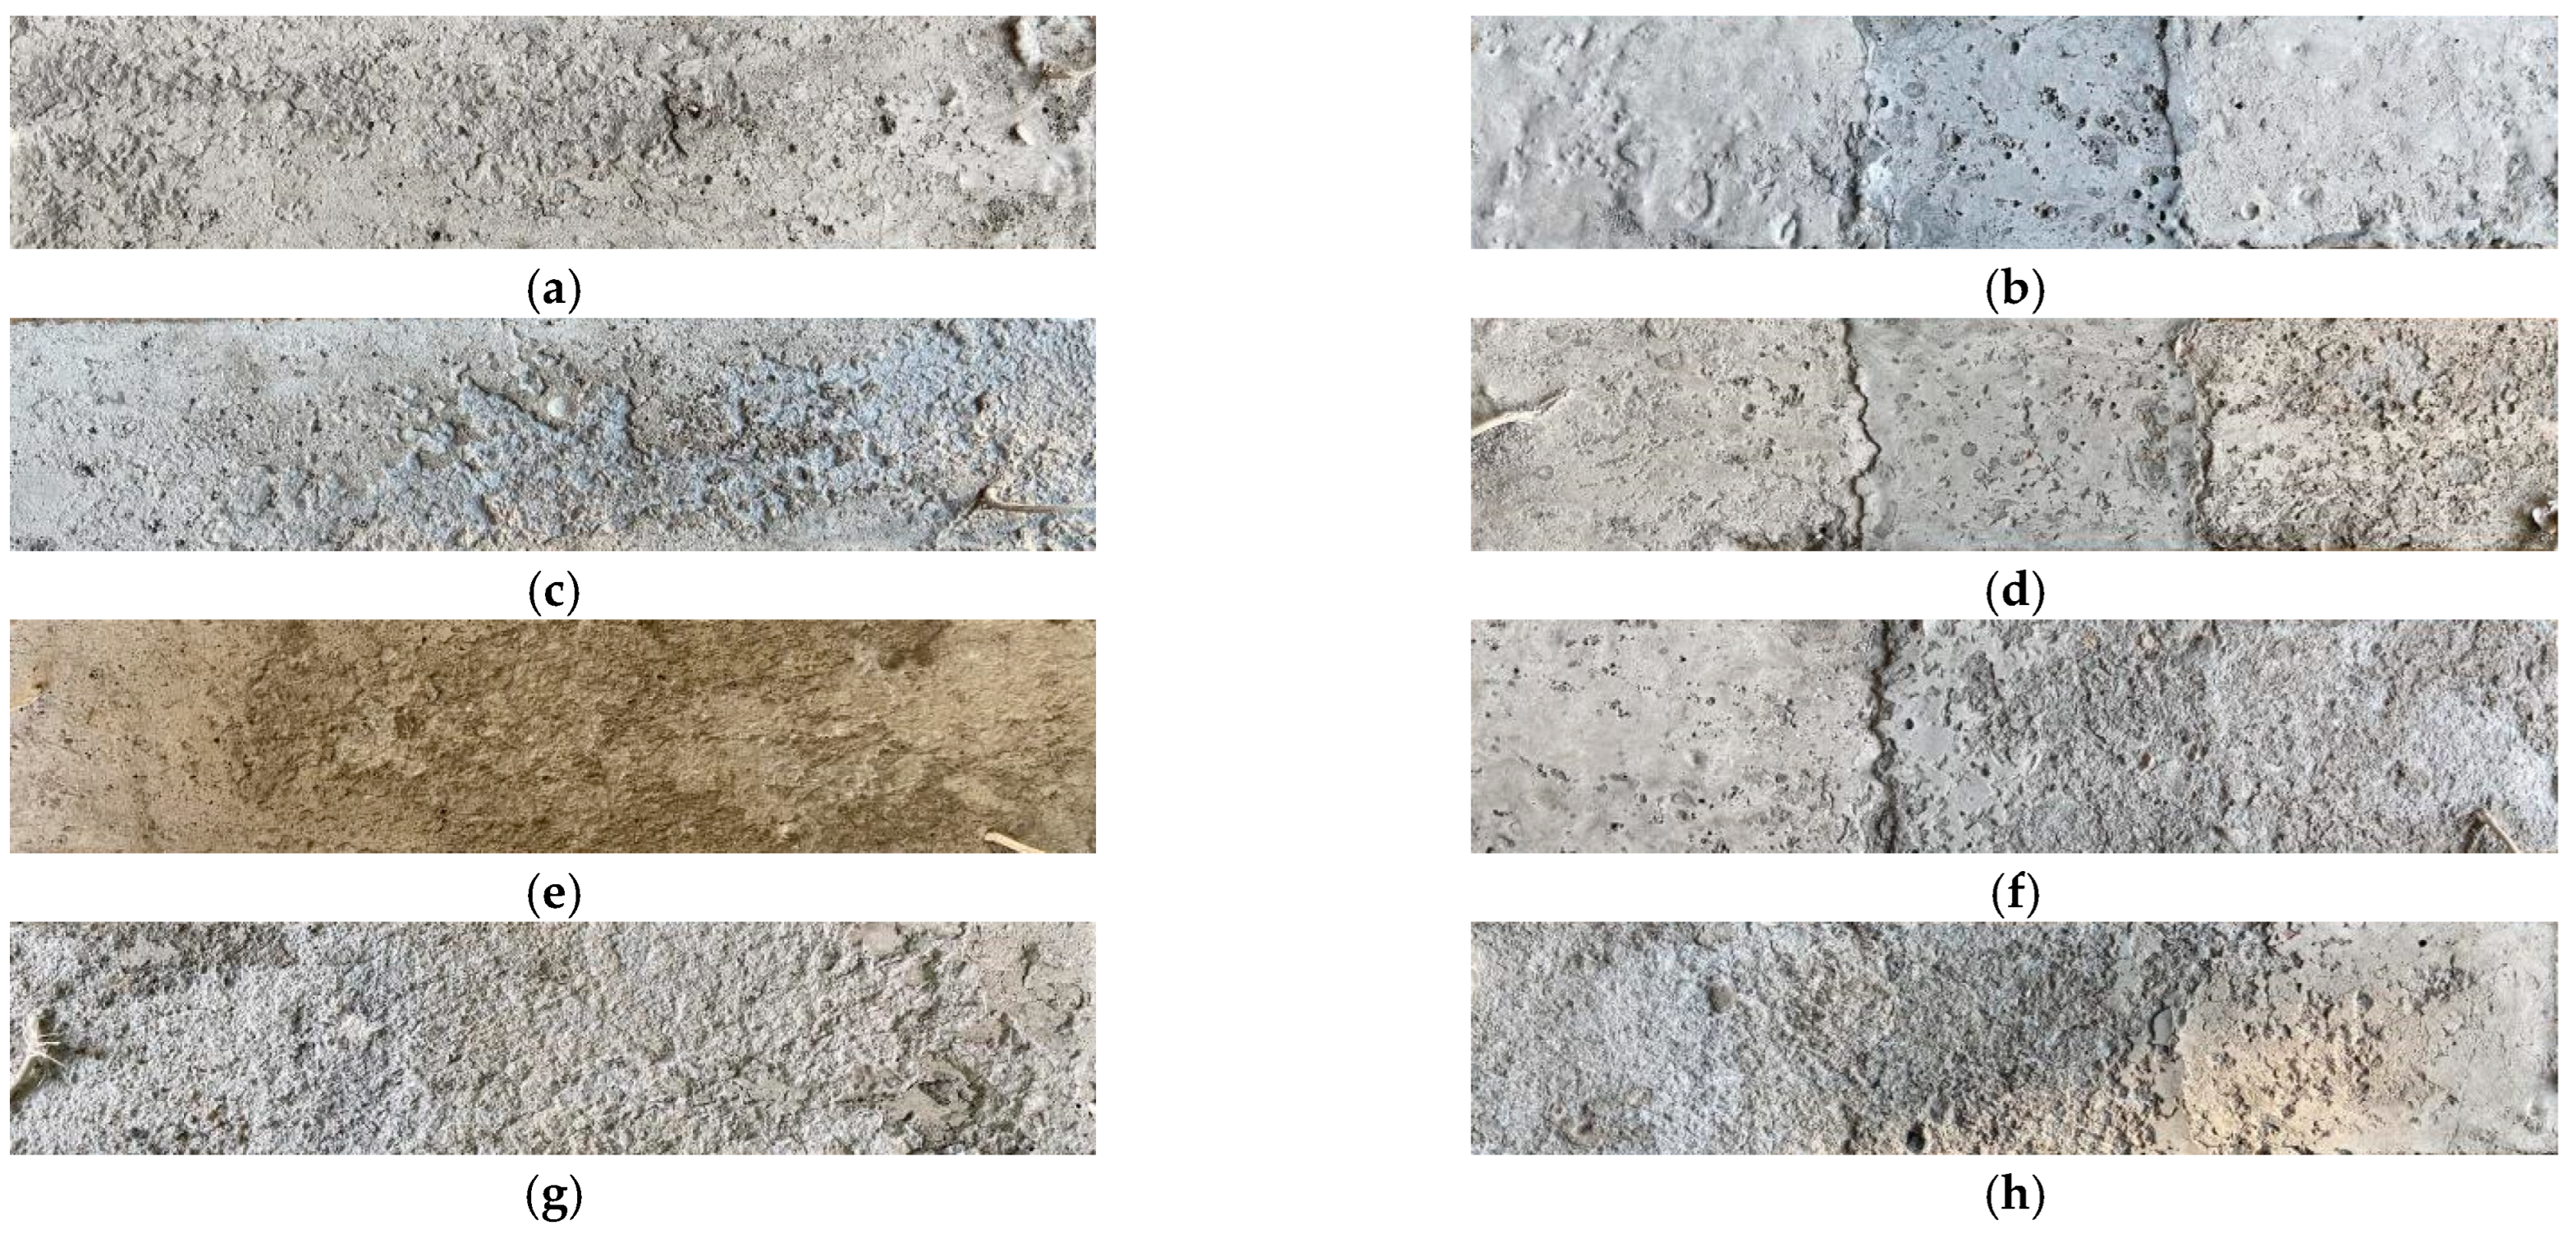
3.2.1. Surface Morphology

The surface spalling of IF and PI specimens after freeze–thaw cycles numbering 25, 50, 75 and 100 is shown in Figure 12. For IF specimens, the spalling area on the concrete’s surface was small and not obvious after 25 freeze–thaw cycles. When the freeze–thaw cycles reached 50, the concrete began to spall in large flakes, and the spalling area was further expanded. After 75 freeze–thaw cycles, the spalling area of concrete reached 2/3 of the IF specimen’s surface, and fine cracks had already appeared on the concrete’s surface by this point. When the freeze–thaw cycles reached 100 times, the concrete on the entire surface of the IF specimen peeled off, resulting in a pitted surface, and the surface cracks were further expanded. For PI specimens, the spalling area was small and there was no evident pitting on the surface before 75 freeze–thaw cycles. However, after 75 freeze–thaw cycles, the spalling area of concrete was further enlarged and became continuous. Fine cracks appeared at the interfaces of the wet joint. This was mainly because the interfaces of the wet joint provide a channel for external water, and the frost heaving force resulting from the freeze–thaw cycles acts on this weak area. Moreover, the freeze–thaw damage in post-cast concrete at the wet joint in the PI-50-LP-100 specimen was more severe than that in pre-cast concrete. This is attributed to the difference in age between the post-cast and pre-cast concrete segments, resulting in different degrees of frost resistance.

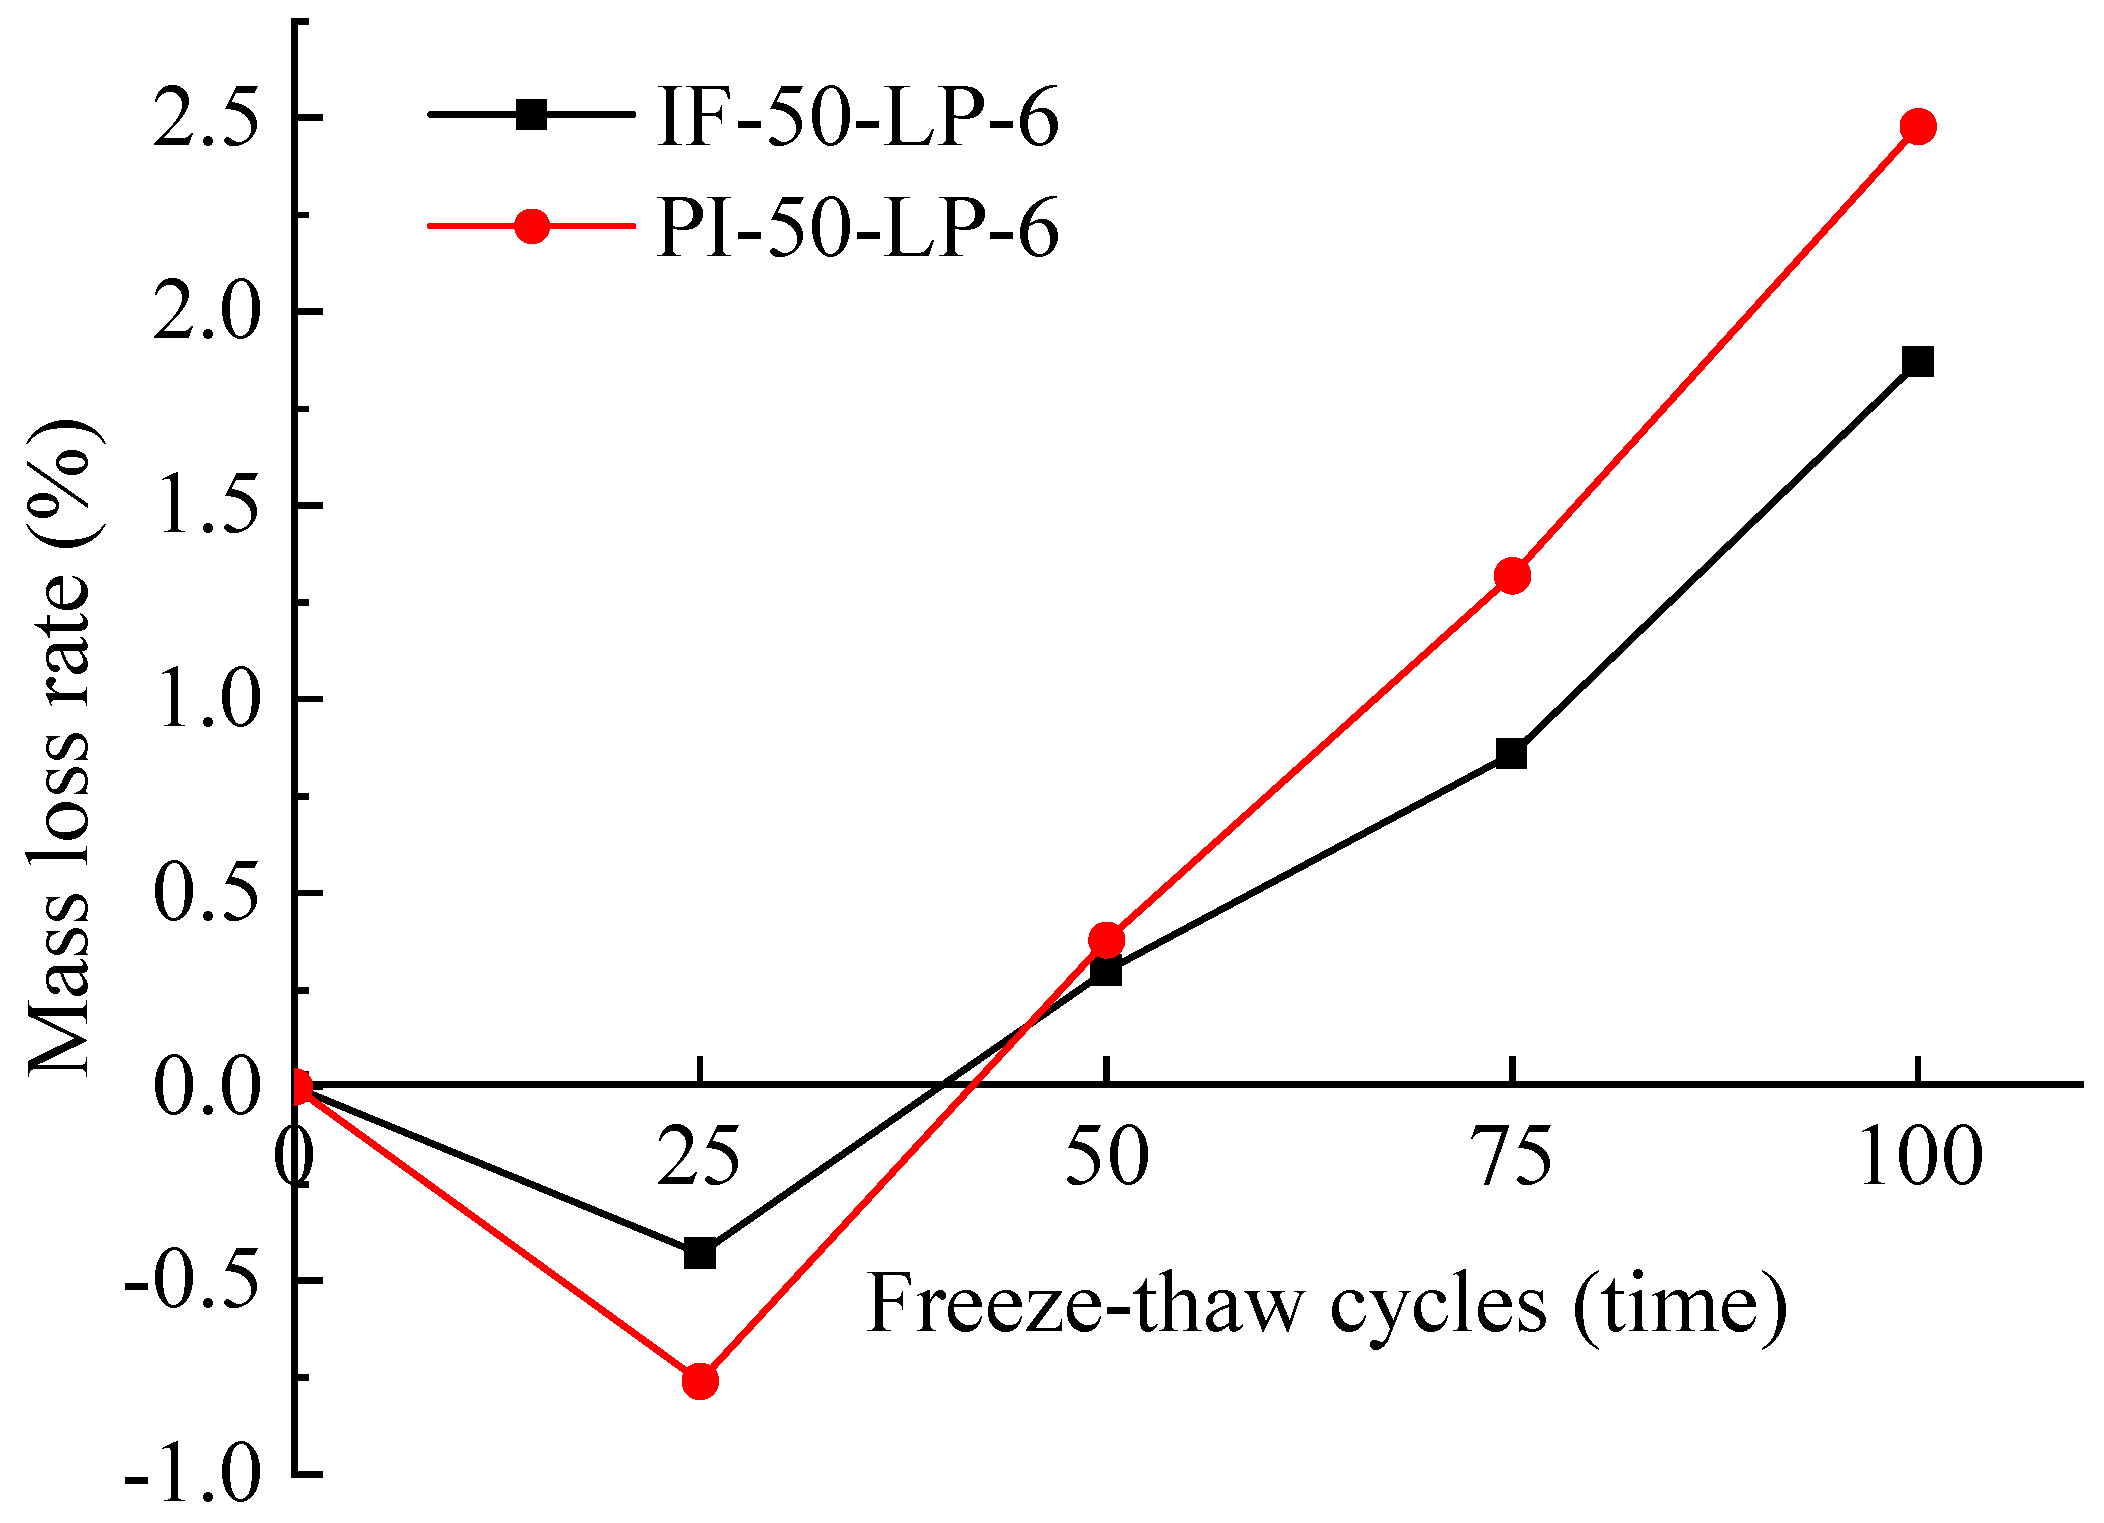
3.2.2. Mass Loss Rate

The variation curves of mass loss rate with freeze–thaw cycling for PI and IF specimens are shown in Figure 13. With an increase in the number of freeze–thaw cycles, the surface spalling of specimens became gradually more serious, and the mass loss of specimens increased first and then decreased. The surface spalling of specimens was not obvious after 25 freeze–thaw cycles, but their internal structures were damaged and became more porous due to the freeze–thaw process. Further, microcracks appeared, and the porosity increased inside the concrete. As a result, the water absorption rate of concrete also increased, and the external free water was adsorbed. In addition, because of the influence of the plateau preparation environment, the internal hydration of the specimen was not sufficient. When free water entered the interior of specimens, the hydration reaction continued, thereby increasing the compactness of the concrete. Therefore, when the specimens were subjected to 25 freeze–thaw cycles, their mass increased and the mass loss rates were negative. After 50 freeze–thaw cycles, the mass loss rates of specimens became positive and showed an increasing trend. The mass loss rate of the PI specimen was higher than that of the IF specimen at the same number of freeze–thaw cycles. This is because the joint interfaces, as the weakest area of the specimen, provide a permeable channel for external water. Therefore, the freeze–thaw damage on the PI specimen caused by the frost heaving force became more severe, and its mass loss rate also increased. When the number of freeze–thaw cycles reached 100, the mass loss rate of the PI specimen was 2.48%, which is 32.6% higher than that of the IF specimen. This indicates that the PI specimen underwent a deterioration in its frost resistance due to the existence of joint interfaces.

3.2.3. Relative Dynamic Elastic Modulus

The relative dynamic elastic modulus is an important index used to evaluate the freeze–thaw durability of concrete, and it reflects the internal compactness and damage variation of concrete. The variation curves of the relative dynamic elastic modulus developing with freeze–thaw cycles for PI and IF specimens are shown in Figure 14. The relative dynamic elastic moduli of specimens decreased with the increase in freeze–thaw cycles, and the decrease rate of the relative dynamic elastic modulus also increased with the number of freeze–thaw cycles. This is attributed to the fact that the internal damage of concrete is minor, and its compactness is good, during the initial stages of freeze–thaw cycles, resulting in superior frost resistance. As a result, the relative dynamic elastic modulus decreases at a slower rate. When the number of freeze–thaw cycles exceeded 25, the effect of freeze–thaw damage on concrete gradually became more obvious, the internal structure of concrete became looser, and the compactness decreased significantly [45]. This in turn increased the water absorption rate, and further aggravated the frost heaving effect. Hence, the decrease in relative dynamic elastic modulus was accelerated under these vicious cycles. Compared to the IF specimens, the relative dynamic elastic modulus of PI specimens decreased rapidly, indicating that the frost resistance of the PI specimen was inferior to that of the IF specimen. When the number of freeze–thaw cycles reached 100, the relative dynamic elastic modulus of the IF specimen became 74.6%. The relative dynamic elastic modulus of the PI specimen was 68.3%, which is 8.45% lower than that of the IF specimen. This can also be attributed to the existence of joint interfaces in the PI specimen, which provided extra penetration paths for external water. The damage to the joint interfaces caused by the freeze–thaw cycles also gradually accumulated.

3.3. Coupling Effect of Corrosion and Freeze–Thaw Cycle

The IF and PI specimens, which had undergone the freeze–thaw cycle test, were placed in a 5% NaCl solution for the accelerated corrosion test. The corrosion test lasted until the theoretical corrosion rate of the steel bars reached 6%. The cracking patterns of concrete induced by the rust expansion of internal steel bars, the corrosion morphologies of steel bars, the mechanical property degradation of the corroded steel bars and the concrete microstructure in the IF and PI specimens were investigated. A comprehensive evaluation of the durability of the wet joint with a punched interface under the coupling effects of freeze–thawing and corrosion was conducted, aiming to provide reasonable recommendations for engineering practices.

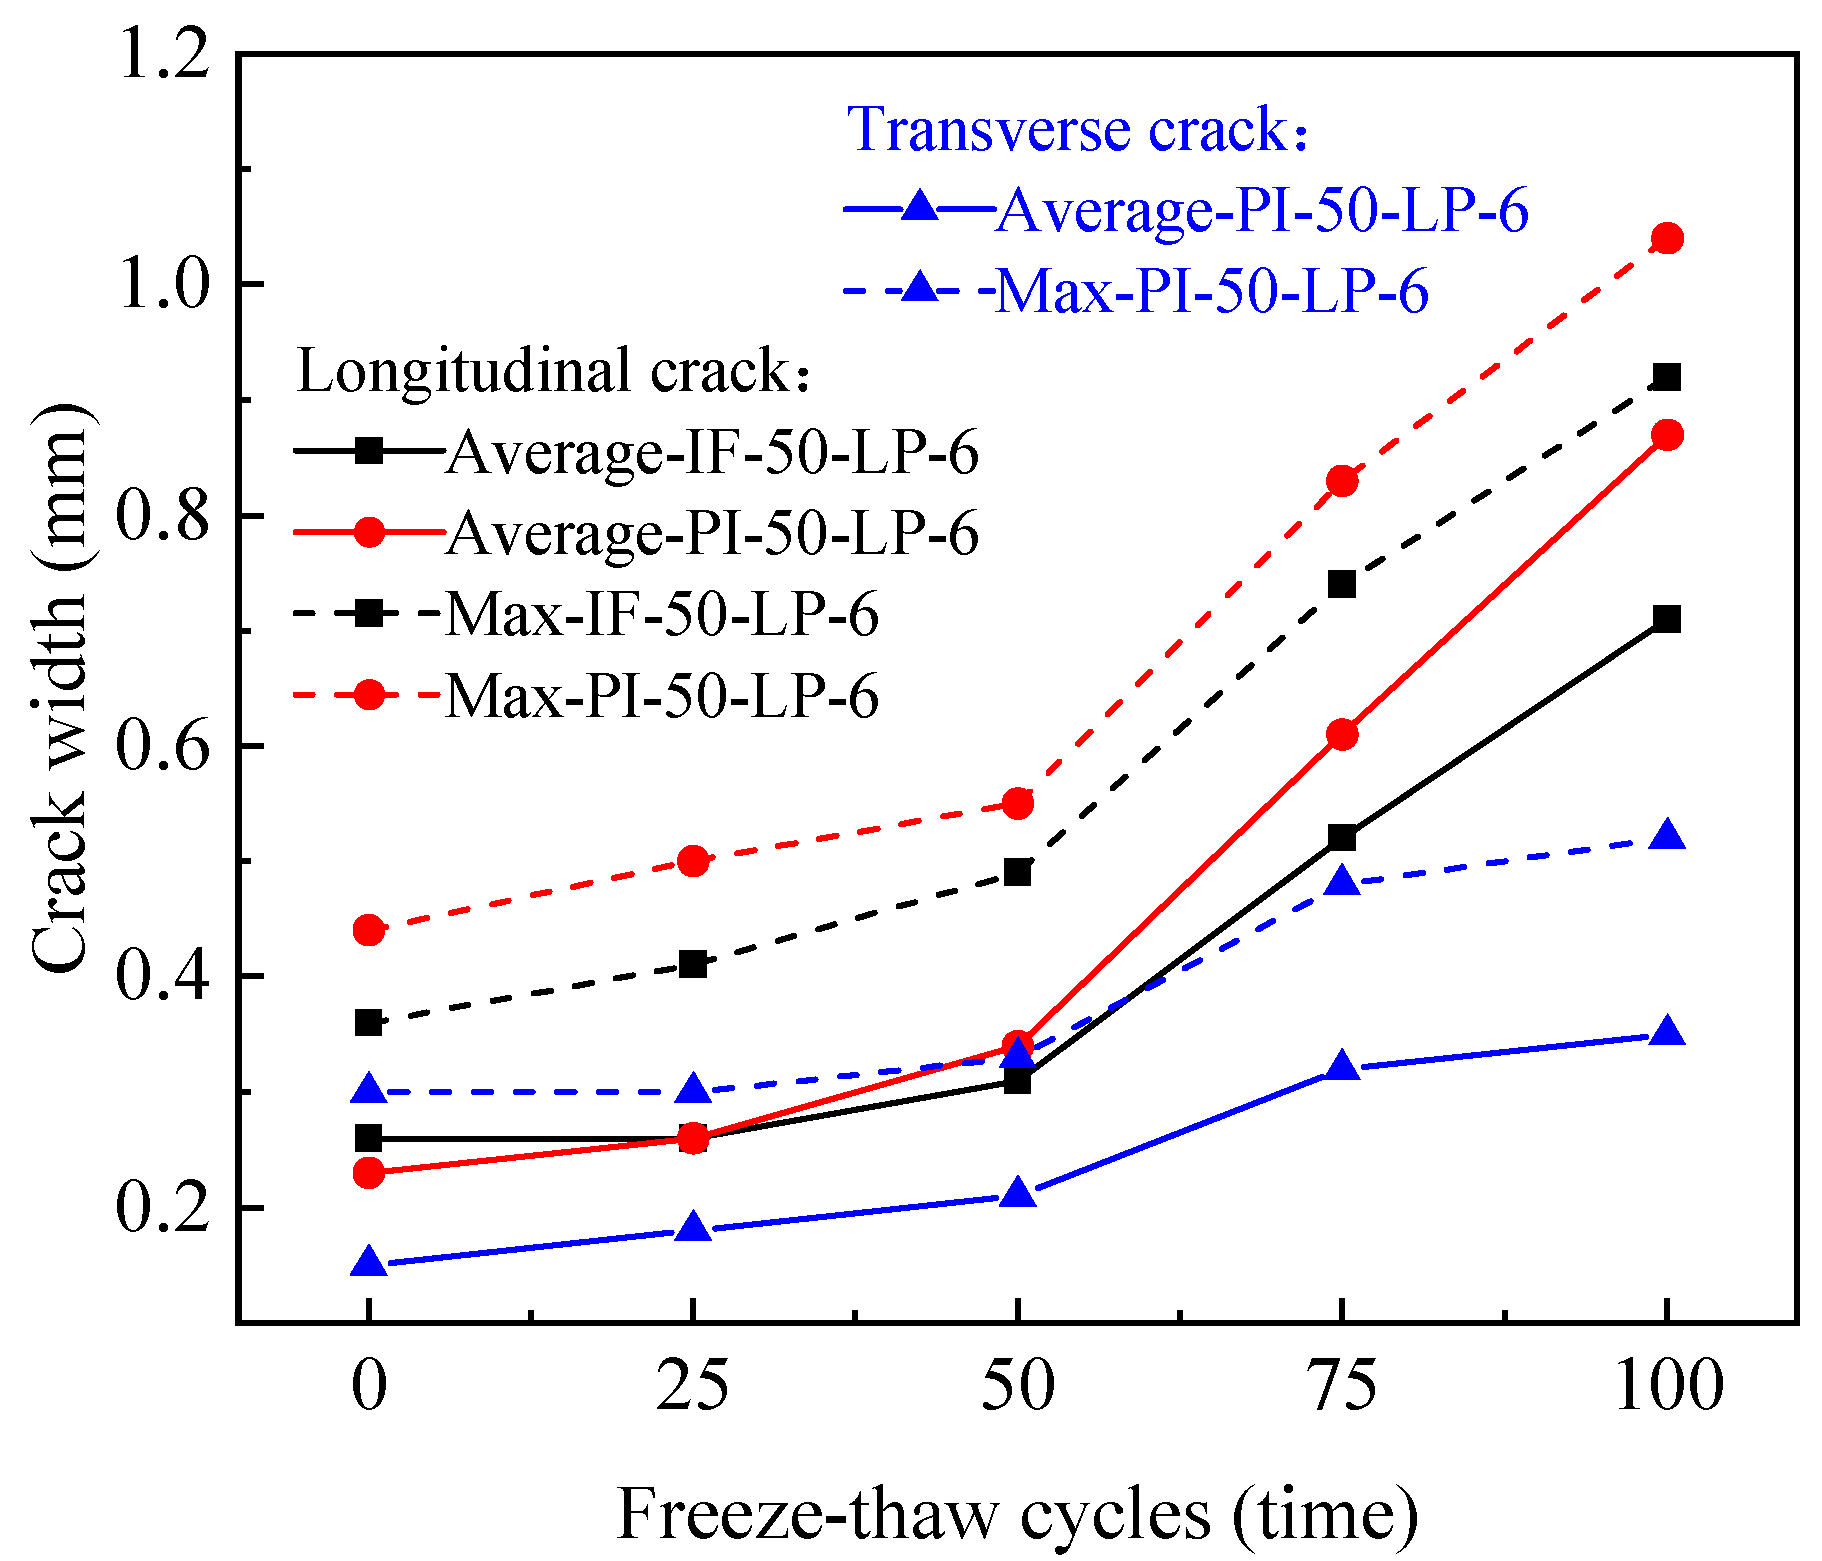
3.3.1. Crack Development on the Specimen Surface

The development of cracks in the IF and PI specimens after different numbers of freeze–thaw cycles and the subsequent corrosion in chlorine salt solution are shown in Figure 15. During the corrosion process, the corrosion products gradually overflowed from the surfaces of specimens, and the widths of cracks on the surfaces of specimens gradually expanded with the increase in corrosion time. When the theoretical corrosion rate of steel bars reached 6%, only longitudinal through-length cracks that developed along the steel bars emerged on the surfaces of the IF specimens. However, in addition to the longitudinal cracks, there were also two transverse through-width cracks along the joint interfaces on the surfaces of the PI specimens. In general, as the freeze–thaw cycles increased, the cracking became increasingly obvious for the IF and PI specimens. The corrosion products mainly overflowed from the joint interfaces for PI specimens and the crack width here was larger, which findings are different from those of the IF specimens. Because the steel bar was arranged longitudinally in the concrete, the transverse crack width was generally narrower than that of the longitudinal crack in PI specimens.
The relationships between the maximum and average crack widths and the freeze–thaw cycles in IF and PI specimens are shown in Figure 16. With the increase in freeze–thaw cycles, the average and maximum longitudinal crack widths of two types of specimens exhibited an increasing trend. The growth in crack widths in the IF and PI specimens is was before 50 freeze–thaw cycles, but significantly accelerated when the freeze–thaw cycles exceeded 50. Compared with specimens that had not undergone freeze–thaw cycles, with an increase in freeze–thaw cycles from 25 to 100, the average and maximum crack widths of IF specimens increased by 0–173.08% and 13.89–155.56%, respectively. Similarly, the average and maximum crack widths of PI specimens increased by 13.04–278.26% and 13.64–136.36%, respectively. This is mainly because the specimens were prepared in a plateau environment, resulting in insufficient hydration inside concrete. In the early stages of freeze–thaw cycles, the filling effect on the internal structure of concrete—resulting from the further hydration reaction, which primarily occurs during the heating stage—can offset most of the freeze–thaw damage of concrete. Thus, the crack widths of specimens increased slowly in the early stage. However, in the later stages of freeze–thaw cycling, the filling effect was insufficient to resist the influence of cumulative freeze–thaw damage, resulting in an accelerated increase in the crack widths. After the same number of freeze–thaw cycles, the characteristic values (maximum and average) of longitudinal crack widths of PI specimens were larger than those of IF specimens. Compared with IF specimens, the average and maximum longitudinal crack widths of PI specimens increased by 0–22.54% (average: 12.38%) and 12.16–21.95% (average: 14.85%) for different freeze–thaw cycles, respectively. It can be inferred that the erosion of the chlorine ion for PI specimens was exacerbated due to the presence of joint interfaces. Furthermore, the joint interfaces were also damaged by the freeze–thaw cycles, thereby expanding the erosion channels of chloride ions at the joint interfaces. Consequently, the corrosion of internal steel bars was intensified and the crack widths increased.
The characteristic values of transverse crack widths of PI specimens increased slowly with the increase in the number of freeze–thaw cycles in the early stage, but the growth of crack widths began to accelerate after 50 freeze–thaw cycles; the development rate of transverse crack widths then decreased after 75 freeze–thaw cycles. This is because the impact of freeze–thaw damage on PI specimens begins to be significant after the number of freeze–thaw cycles reached 50. However, due to the circular distribution of rust expansion force along the length of the steel bars, compared with the development of longitudinal cracks, the growth of transverse crack widths slowed down as they developed, to a certain extent.

3.3.2. Corrosion of Steel Bars

After the freeze–thaw cycles and accelerated corrosion, the specimens were broken, and then the steel bars were acid-washed to ascertain their surface morphologies, as shown in Figure 17. When the number of freeze–thaw cycles reached 50, the distribution of corrosion pits on the steel bar in the IF specimen was relatively dispersed, and the corrosion of the longitudinal and transverse ribs of the steel bar was not uniform, but the morphology remained relatively complete. When the number of freeze–thaw cycles reached 100, the pitting corrosion of the steel bar in the IF specimen was serious, and some longitudinal and transverse ribs were severely corroded and became blurred. Different from the IF specimens, the corrosion of steel bars in the PI specimens was mainly concentrated in the corresponding post-cast segment and joint interfaces. At these locations, the area of corrosion pits was large, and the damage in the longitudinal and transverse ribs was serious. Moreover, the corrosion damage in these parts was aggravated by the freeze–thaw cycles.
The relationship between the actual corrosion rates of steel bars and the freeze–thaw cycles for IF and PI specimens is shown in Figure 18. It can be seen that the actual corrosion rate of the steel bar increased as the freeze–thaw cycles increased. The actual corrosion rates of IF specimens at 0, 25, 50, 75 and 100 freeze–thaw cycles were 18.67%, 22.50%, 28.67%, 36.00% and 45.50% greater than the theoretical corrosion rate of 6%, respectively. The actual corrosion rates of PI specimens at 0, 25, 50, 75 and 100 freeze–thaw cycles were 21.83%, 27.00%, 31.33%, 40.83%, and 51.00% greater than the theoretical corrosion rate of 6%, respectively. This can be attributed to the fact that the increase in freeze–thaw cycles aggravates the freeze–thaw damage done to the internal structure of the concrete, which makes the intrusion of external ions into concrete easier. Compared with IF specimens, the actual corrosion rates of the steel bars in the PI specimens increase by 2.07–3.78% (average: 3.27%) under freeze–thaw cycling, and the percentage of increase in the actual corrosion rate increased after 50 freeze–thaw cycles. It can be seen that the durability of the PI specimen was affected by the joint interfaces, and this effect became more obvious in the later stages of freeze–thaw cycles.

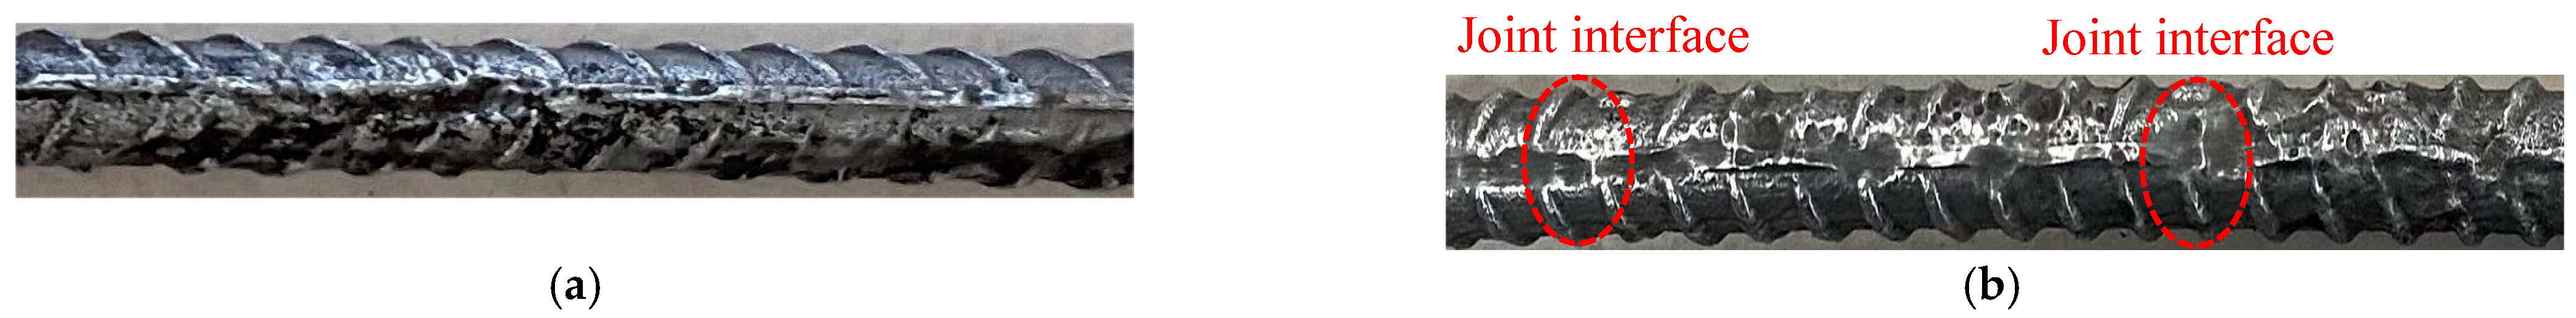
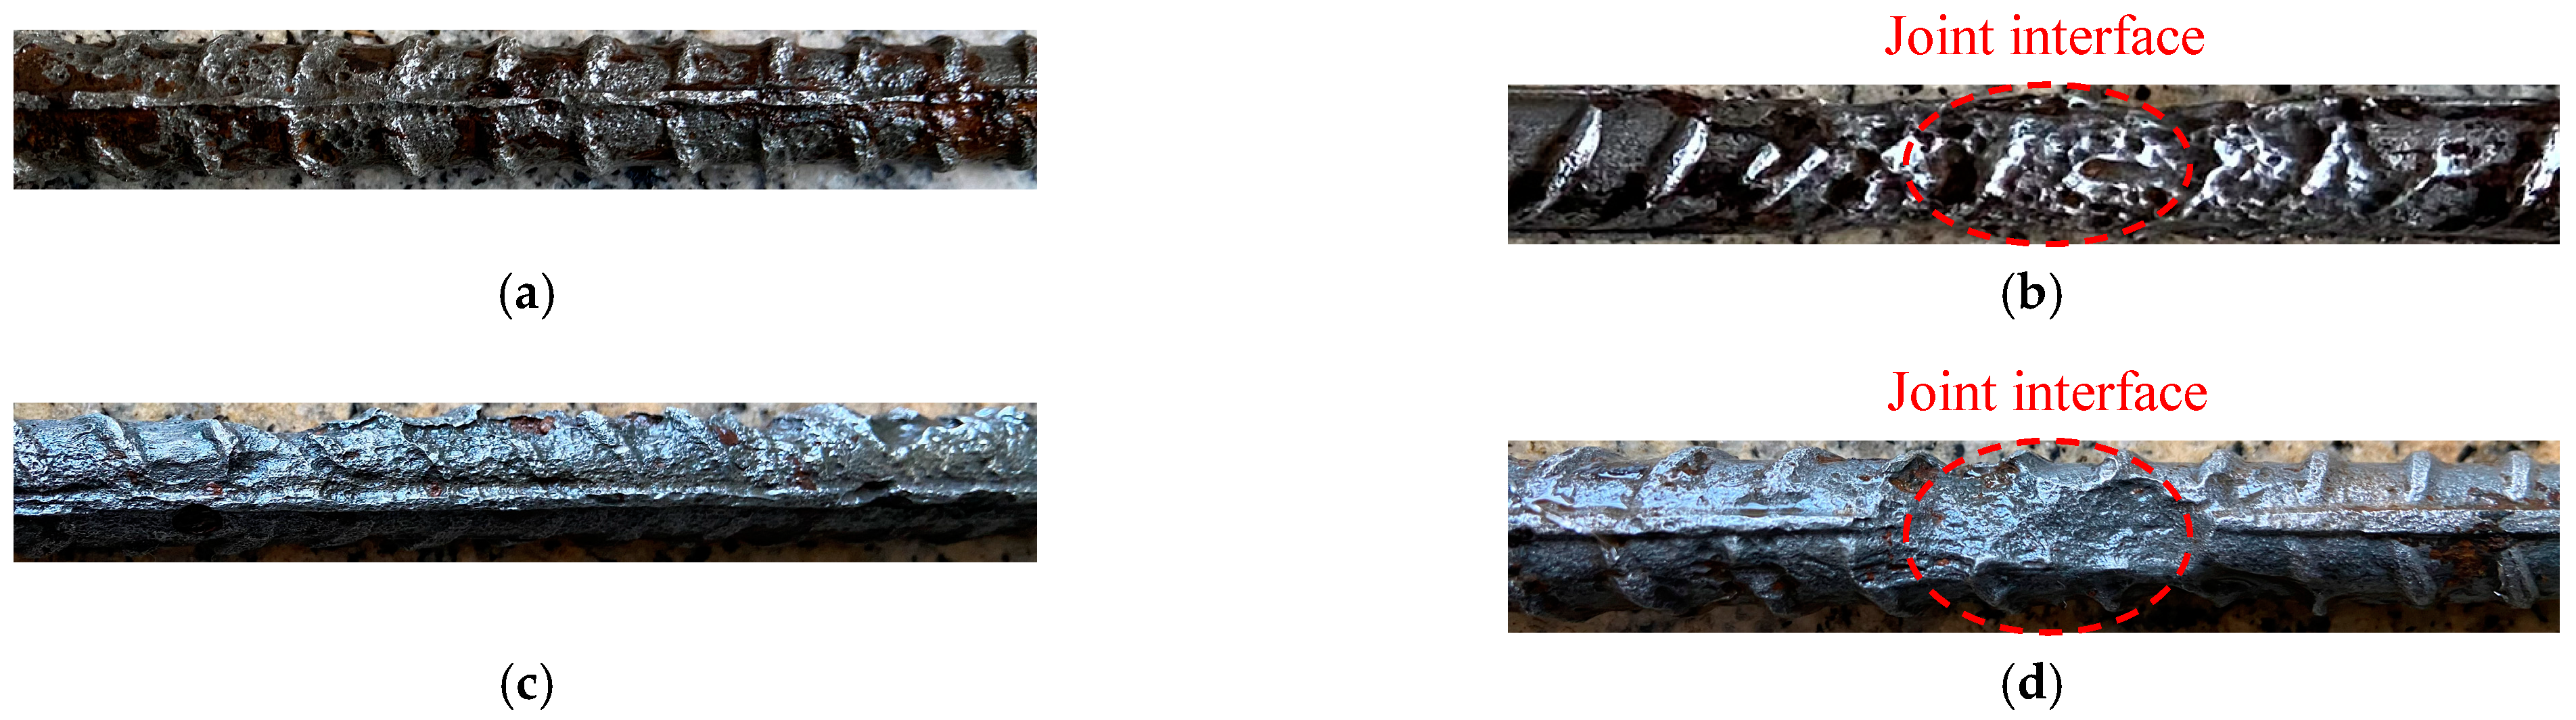
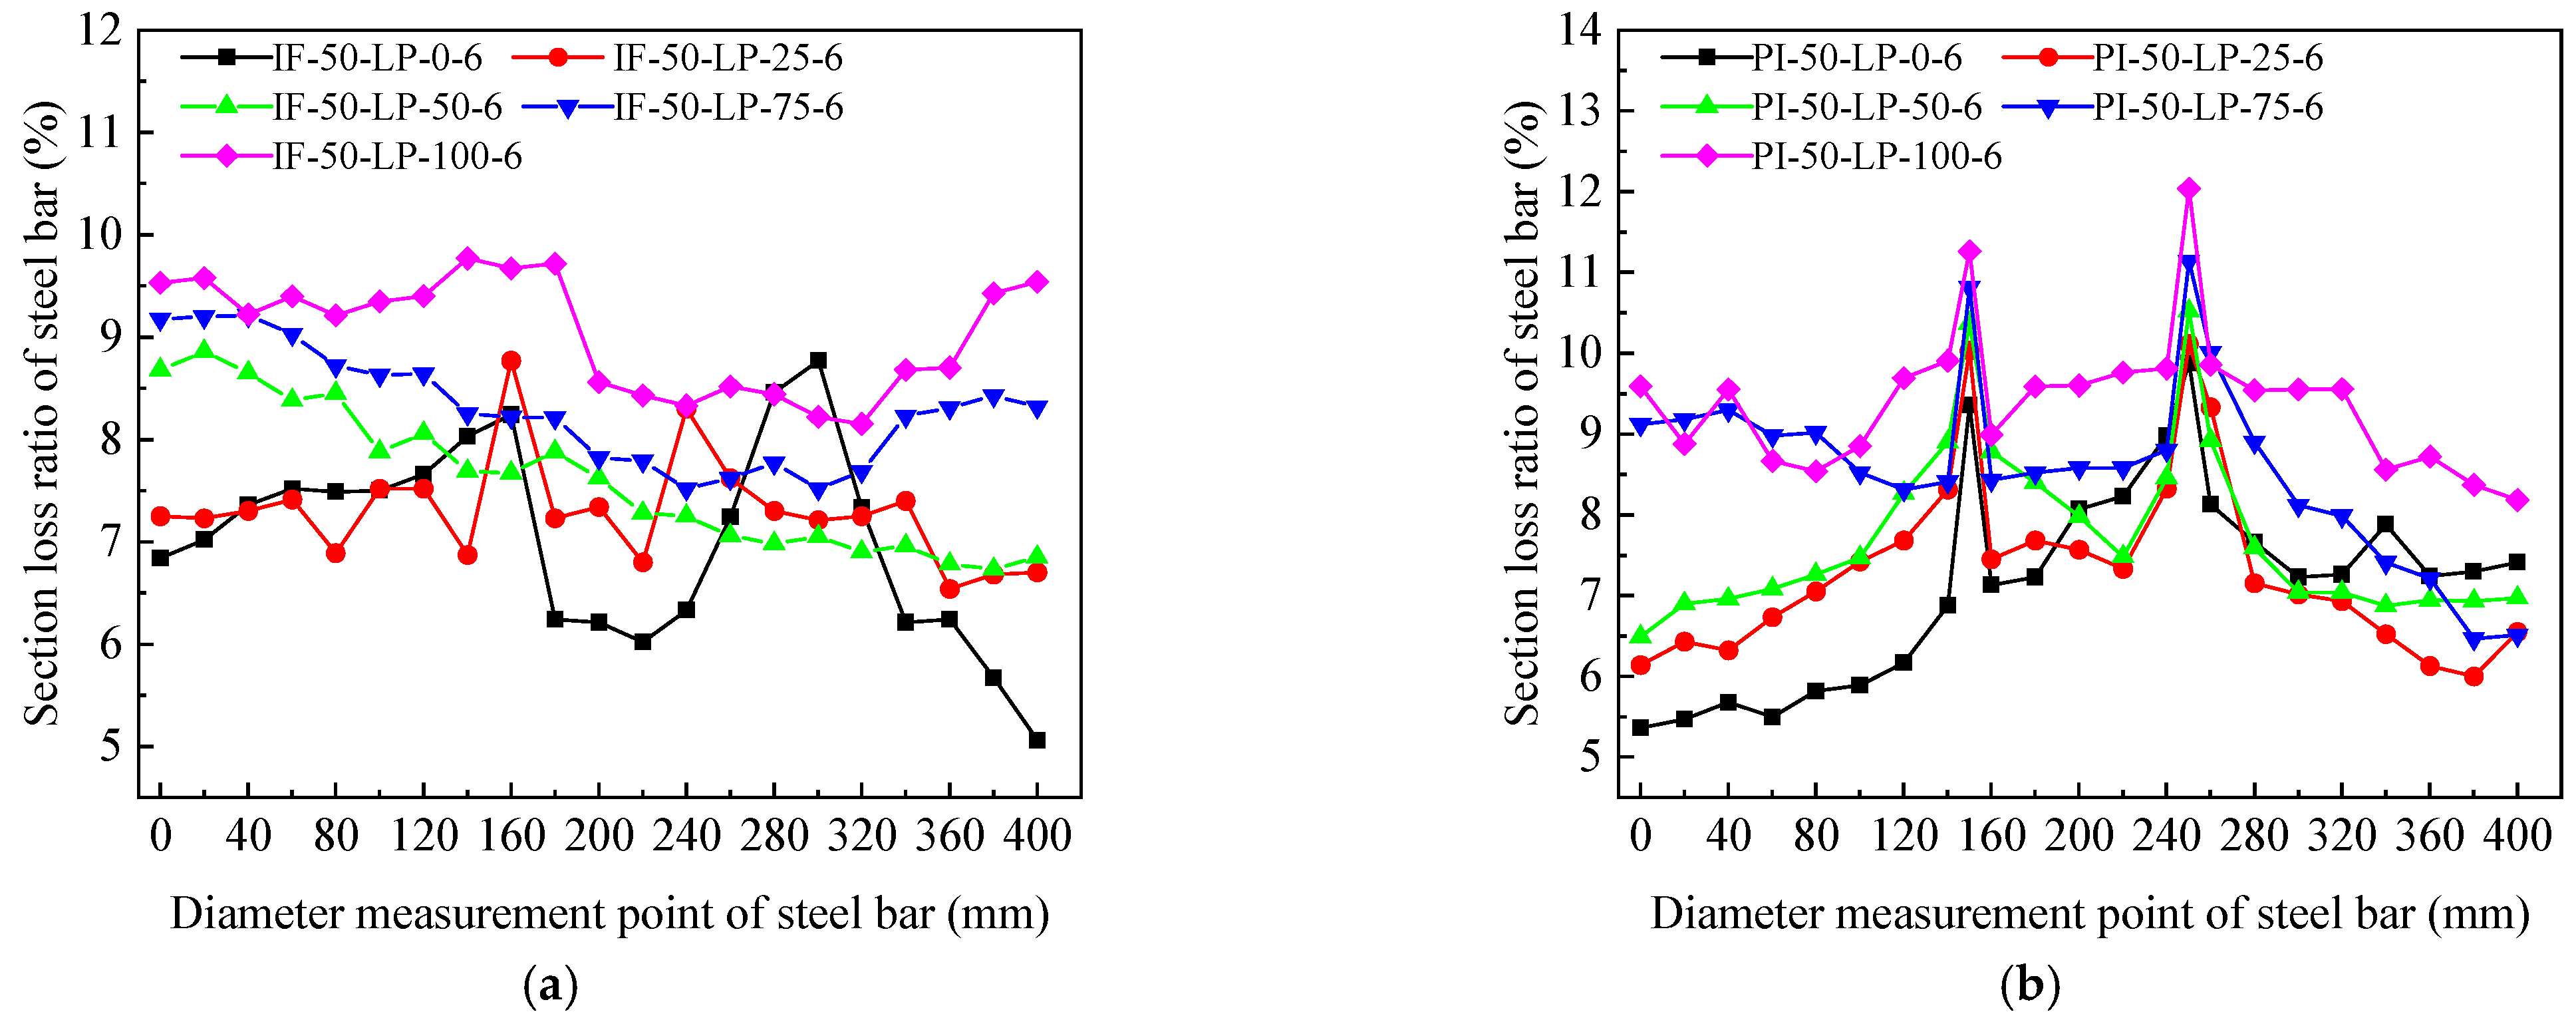
3.3.3. Section Loss of Steel Bar

The section losses of steel bars in IF and PI specimens after freeze–thaw cycling and corrosion were measured, and the section loss rates of corroded steel bars are shown in Figure 19. The section loss of steel bars in the IF specimens is unevenly distributed when the numbers of freeze–thaw cycles were 0 and 25. After more than 25 freeze–thaw cycles, the non-uniformity of the section loss in steel bars tends to decrease. This is because there is a certain randomness in the damage done to specimens by the freeze–thaw cycles; when the number of freeze–thaw cycles is lower, the damage in the specimens is smaller and the randomness is obvious, while with an increase in freeze–thaw cycles, the specimens become seriously damaged, and the damage done to the specimens gradually tends to uniformity. The maximum section loss of steel bars in the PI specimens was seen at the joint interfaces, and this increased with the number of freeze–thaw cycles. Moreover, as the freeze–thaw cycles increased, the difference in the section loss of steel bars between the joint interfaces and other areas showed a decreasing trend, indicating that the damage done to the concrete is more obvious when the number of freeze–thaw cycles is large, and the effect of the deterioration of the joint on the durability of concrete is weakened. Compared with the IF specimen, the maximum section loss rates of steel bars in the PI specimens after 0–100 freeze–thaw cycles increased by 12.66–23.23% (average: 18.17%). This is due to the fact that the increase in freeze–thaw cycles aggravates the deterioration of the joint interfaces, thereby increasing the connectivity of this area and accelerating the penetration of external chloride ions through joint interfaces.

3.3.4. Mechanical Properties of Corroded Steel Bars

The static tensile tests performed on the steel bars in IF and PI specimens after freeze–thaw cycling and corrosion were carried out to measure their mechanical properties, and the degradation of the mechanical properties of steel bars with freeze–thaw cycling is shown in Figure 20. It can be seen that with the increase in the number of freeze–thaw cycles, the yields and ultimate strengths of steel bars decreased. The yields and ultimate strengths of the steel bars in the PI specimens decreased more rapidly than those of the steel bars in the IF specimens. Compared with the non-freeze–thaw IF specimen, the yields and ultimate strengths of steel bars in the IF specimens after 50 freeze–thaw cycles decreased by 2.40% and 5.57%, respectively, and after 100 freeze–thaw cycles, these decreased by 7.91% and 14.04%, respectively. Compared with the non-freeze–thaw PI specimen, the yields and ultimate strengths of steel bars in PI specimens after 50 freeze–thaw cycles decreased by 11.06% and 10.44%, respectively, and after 100 freeze–thaw cycles, these decreased by 17.00% and 16.81%, respectively. This shows that the freeze–thaw cycles have a greater impact on the mechanical properties of steel bars in PI specimens. Compared with the IF specimens, the yields and ultimate strengths of steel bars in PI specimens after 25–100 freeze–thaw cycles decreased by 5.56–9.11% (average: 7.65%) and 4.74–6.73% (average: 6.18%), respectively.
The rates of degradation of elongation of steel bars in IF and PI specimens after freeze–thaw cycles and corrosion are shown in Figure 20b. As the freeze–thaw cycles increased, the elongation of steel bars also decreased. After more than 50 freeze–thaw cycles, the degradation of elongation of the steel bars in the IF specimens became rapid, because the section loss can affect the ductility of the steel bar and is more obvious when the number of freeze–thaw cycles is high. On the other hand, the degradation of elongation of the steel bars in the PI specimens was relatively gentle after more than 50 freeze–thaw cycles. This is because the elongation of steel bars in PI specimens is mainly determined by the maximum section loss at the joint interfaces, which is much greater than that of the steel bars in the IF specimens, and the maximum section loss gradually increases with the number of freeze–thaw cycles, as shown in Figure 19b. Compared with IF specimens, the elongation of steel bars in the PI specimens after 25–100 freeze–thaw cycles decreased by 23.08–28.72% (average: 25.92%). It can be seen that the existence of a wet joint in the PI specimen had a significant effect on the ductility of the steel bar therein.

3.3.5. Microstructure Analysis of Concrete

After freeze–thaw cycling and corrosion, in order to further investigate the deterioration mechanism of durability, the PI specimens were sampled at the joint interfaces and the IF specimens were sampled at the middle position in order to carry out the microstructural analysis. The micro-morphologies of the concrete in the IF and PI specimens after freeze–thaw cycles and corrosion are shown in Figure 21. The microstructure of the IF specimen not subjected to freeze–thaw cycling was relatively dense, and its surface was relatively flat [5,46], while corrosion led to many fine cracks in the interior of the IF specimen. The PI specimen not subjected to freeze–thaw cycles showed a similar microstructure to the IF specimen, but its crack was wider and its microstructure was looser. After 50 freeze–thaw cycles, the IF and PI specimens produced more flaky calcium hydroxide (CH) crystals and needle-like AFt crystals, the concrete microstructure became loose and porous, and the cracks in the concrete increased significantly. Compared with the IF specimens, the PI specimens were subjected to more obvious detrimental effects of the freeze–thaw cycles. This is because the efficiency of external free water moving through the joint interfaces was accelerated by the freeze–thaw cycles, which made the internal structure looser, such that the wet joint could not resist the rust expansion force of the steel bar. Therefore, more cracks and pores appeared inside the concrete near the joint interfaces. With the increase in the number of freeze–thaw cycles, the microstructures of IF and PI specimens were further deteriorated. After 100 freeze–thaw cycles, the calcium hydroxide (CH) crystals in the concrete decreased significantly, and the internal micro-cracks and void obviously increased. With the increase in the number of freeze–thaw cycles, a large number of chloride ions reacted with the hydrated calcium aluminate (CaO.Al2O3.10H2O) at the joint interfaces to form Friedel salt during the process of corrosion. The newly formed Friedel salt further reacted with the hydrated calcium silicate (C-S-H) crystals to produce water-soluble calcium chloride (CaCl2), resulting in a decrease in the compactness of the internal structure of the concrete. It can be inferred that these changes in the micro-morphologies of specimens after freeze–thaw cycling and corrosion are consistent with the law of their macroscopic durability.
After further analysis, it has been found that the differences in microstructure between the PI and IF specimens could primarily be found in the size and number of pores and cracks, as well as the degree of looseness or compactness. The initial differences mainly resulted from the punched interface treatment process of the PI specimen, which induced the initial damage in the concrete interface. Further, with the increase in the number of freeze–thaw cycles, the initial damage at the interface of the PI specimen was magnified, and the differences in microstructure between PI and IF specimens gradually became apparent. After the corrosion of the steel bars, the damage was further expanded and the differences became more apparent. This is also why the durability of the PI specimens was inferior to that of the IF specimens, and their durability gradually deteriorated.

3.4. Discussion

In general, the durability of a wet joint specimen with a punched interface prepared in a plateau environment is inferior to that of an integrally formed specimen when subjected to corrosion, freeze–thaw cycling and their coupling effects, which is mainly attributable to the extra rate of transmission of chloride ions through joint interfaces in wet joint specimens. However, because the surface of the concrete subjected to a punched treatment was thoroughly cleared and the roughness of the concrete surface was obvious, the development of crack width in the concrete, the increase in the actual corrosion rates of steel bars and the degradation of the mechanical properties of steel bars for PI specimens at a theoretical corrosion below 6% were relatively slow, which results are similar to those for IF specimens. The average crack width of concrete, the actual corrosion rate of the steel bar and the yield and ultimate strengths of the steel bar for in PI specimens at the theoretical corrosion rate of 6% were close to those of the IF specimens. In fact, as the theoretical corrosion rate (especially over 6%) and freeze–thaw cycles (especially over 25) increased, the resulting damage in the joint interfaces increased, further exasperating the difference in durability between the PI and IF specimens. Throughout the whole process, the degradation of elongation of the steel bar was remarkable. Compared with IF specimens, the elongation of PI specimens decreased by more than 25% on average. These research results can be used to help predict the corrosion rates of steel bars when the durability of manufactured-sand-reinforced concrete and its wet joint, as well as the mechanical properties of internal steel bars in a plateau environment, no longer meet the requirements of the specifications. In addition, based on the quantitative differences in the development and distribution of concrete cracks and the degradation of mechanical properties of corroded steel bars between two types of specimens, the durability of wet a joint with a punched interface can be predicted according to that of existing integrally formed concrete. The quantitative results in this study suggest the promising applicability of manufactured sand concrete in engineering practice in plateau environments. Furthermore, based on the findings in this study, it is suggested that the durability of a wet joint and its internal steel bar can be improved by chamfering the joint surfaces, locally coating the steel bars at the joints and standardizing the quality of treatment of joint interfaces. Essentially, through these methods, the bonding of the joint interface is promoted, the transmission path of erosion ions is extended, and the protection for steel bars is enhanced. These areas also represent the focus of future research.

4. Conclusions

In this study, specimens of manufactured-sand-reinforced concrete and its wet joints with punched interface were prepared in a simulated plateau environment, and their durability was investigated by performing accelerated corrosion testing, freeze–thaw cycle testing and a coupled test. The indexes reflecting the durability of the specimens were analyzed. The major conclusions are as follows:
(1)
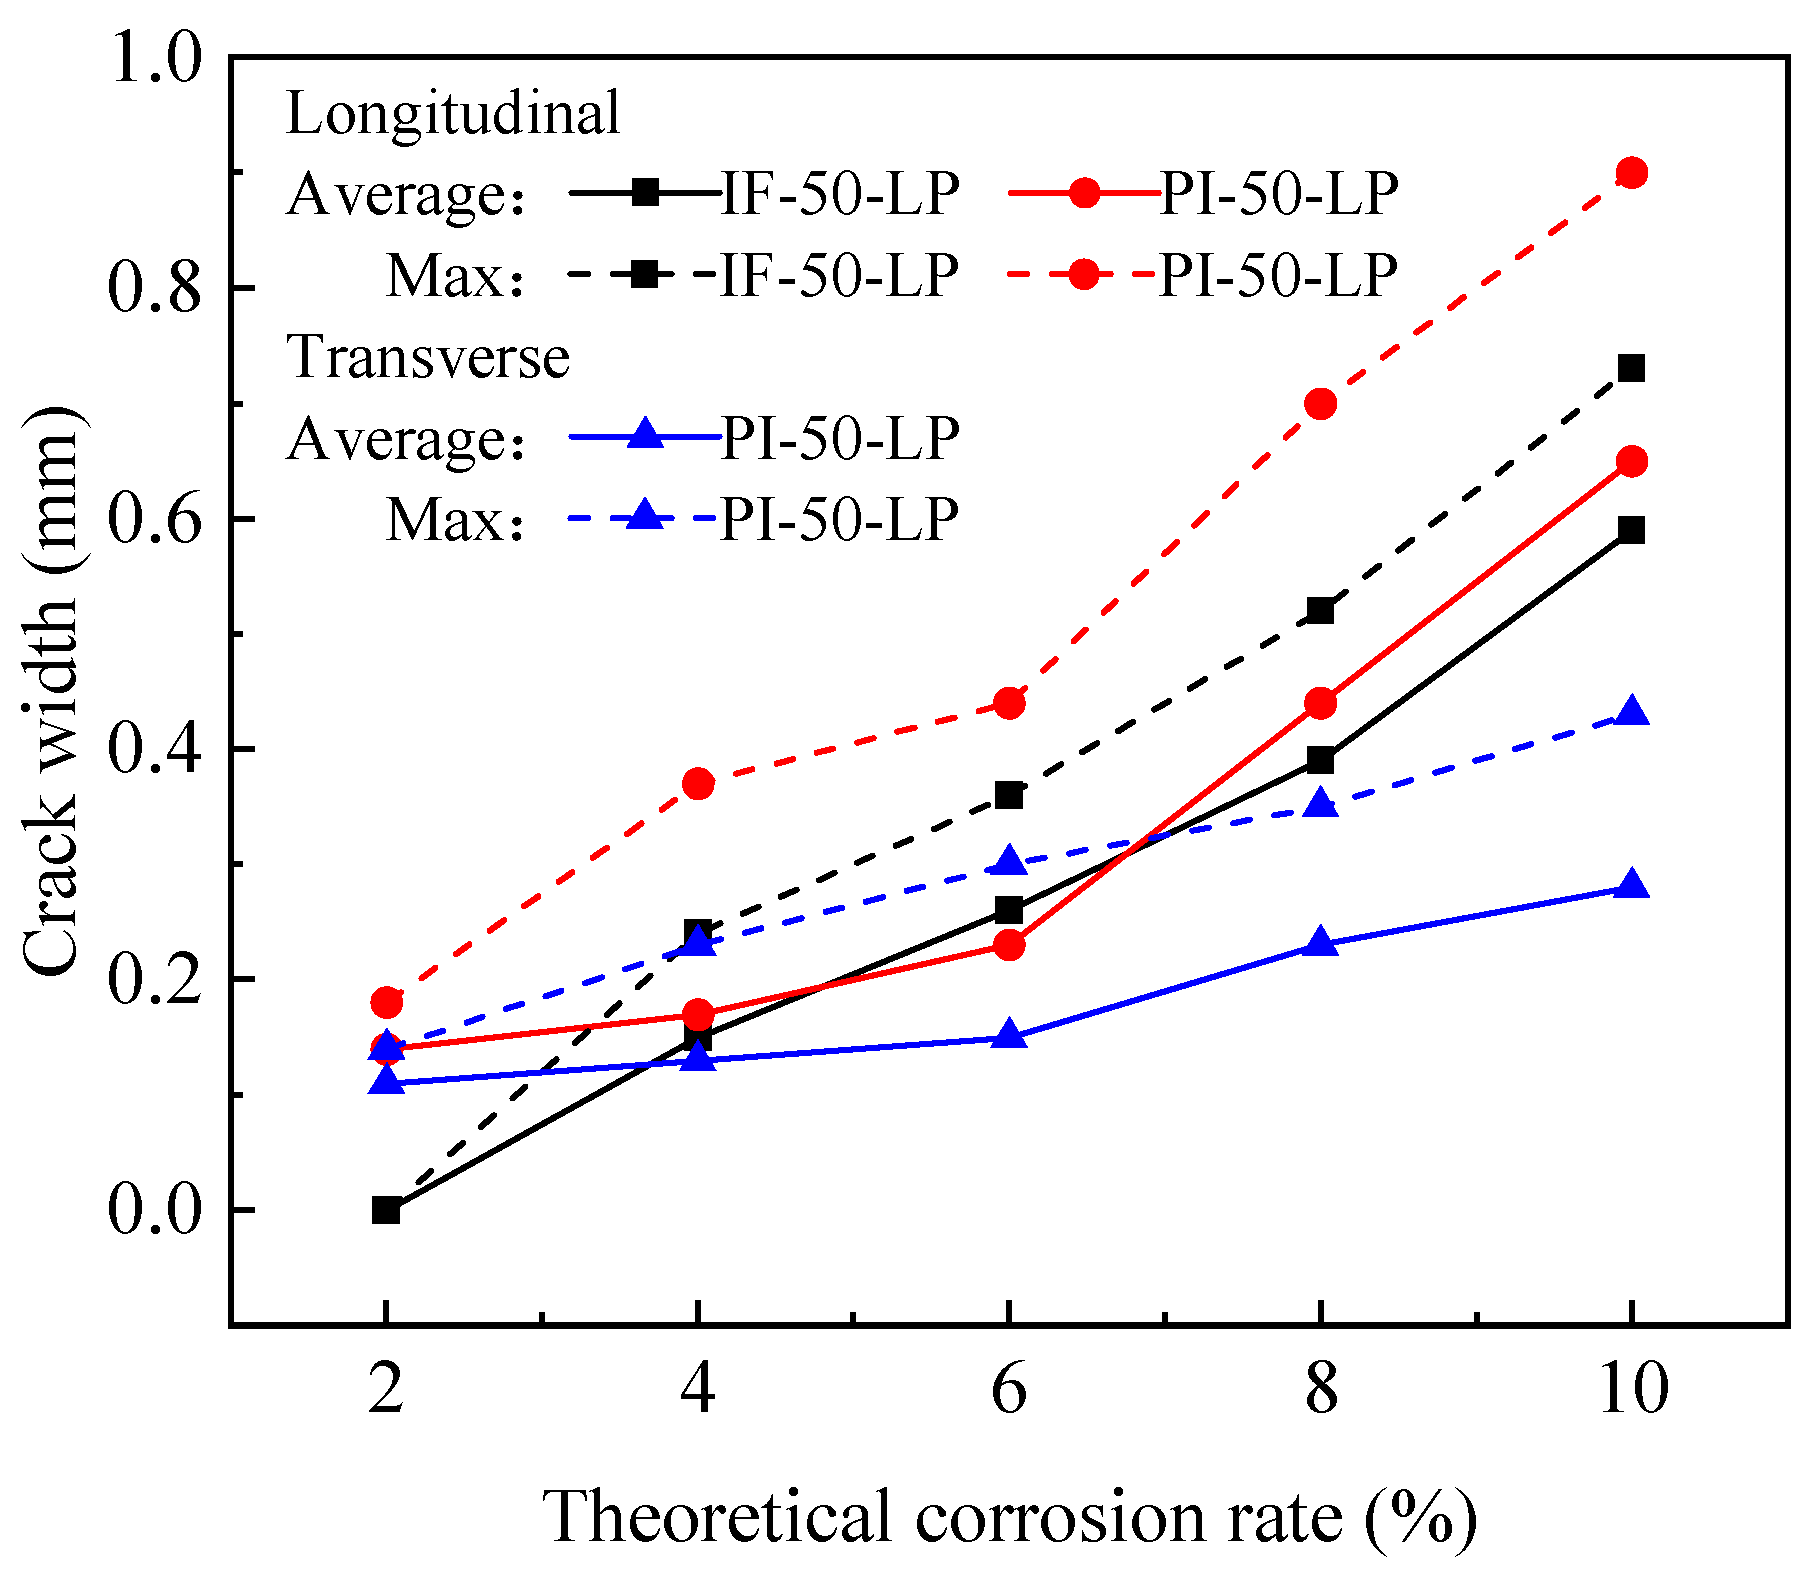
In the single corrosion test, the width of crack development in concrete, the increase in the actual corrosion rates of steel bars and the degradation of mechanical properties of steel bars for IF and PI specimens below the theoretical corrosion rate of 6% were relatively slow, but once the theoretical corrosion rate exceeded 6%, these began to accelerate. The average crack width of concrete, the actual corrosion rate of the steel bars and the yield and ultimate strengths of steel bars in IF and PI specimens at the theoretical corrosion rate of 6% were all similar;
(2)
The IF specimens showed better frost resistance than the PI specimens. At fewer than 50 freeze–thaw cycles, the difference in frost resistance between IF and PI specimens was small. After 50 freeze–thaw cycles, the difference increased notably. When the number of freeze–thaw cycles reached 100, concrete spalling on the surfaces of specimens was more serious, and micro-cracks appeared at the joint interfaces of the PI specimen. The frost resistance of the PI specimen decreased due to the existence of the wet joint.
(3)
Both IF and PI specimens produce longitudinal cracks under the action of freeze–thaw–corrosion. PI specimens produced transverse cracks and the cracks with the maximum width were near to the joint interfaces. Compared with the IF specimen, the average crack width of the PI specimen increased by 0–22.54% (average: 12.38%), and the maximum crack width increased by 12.16–21.95% (average: 14.85%);
(4)
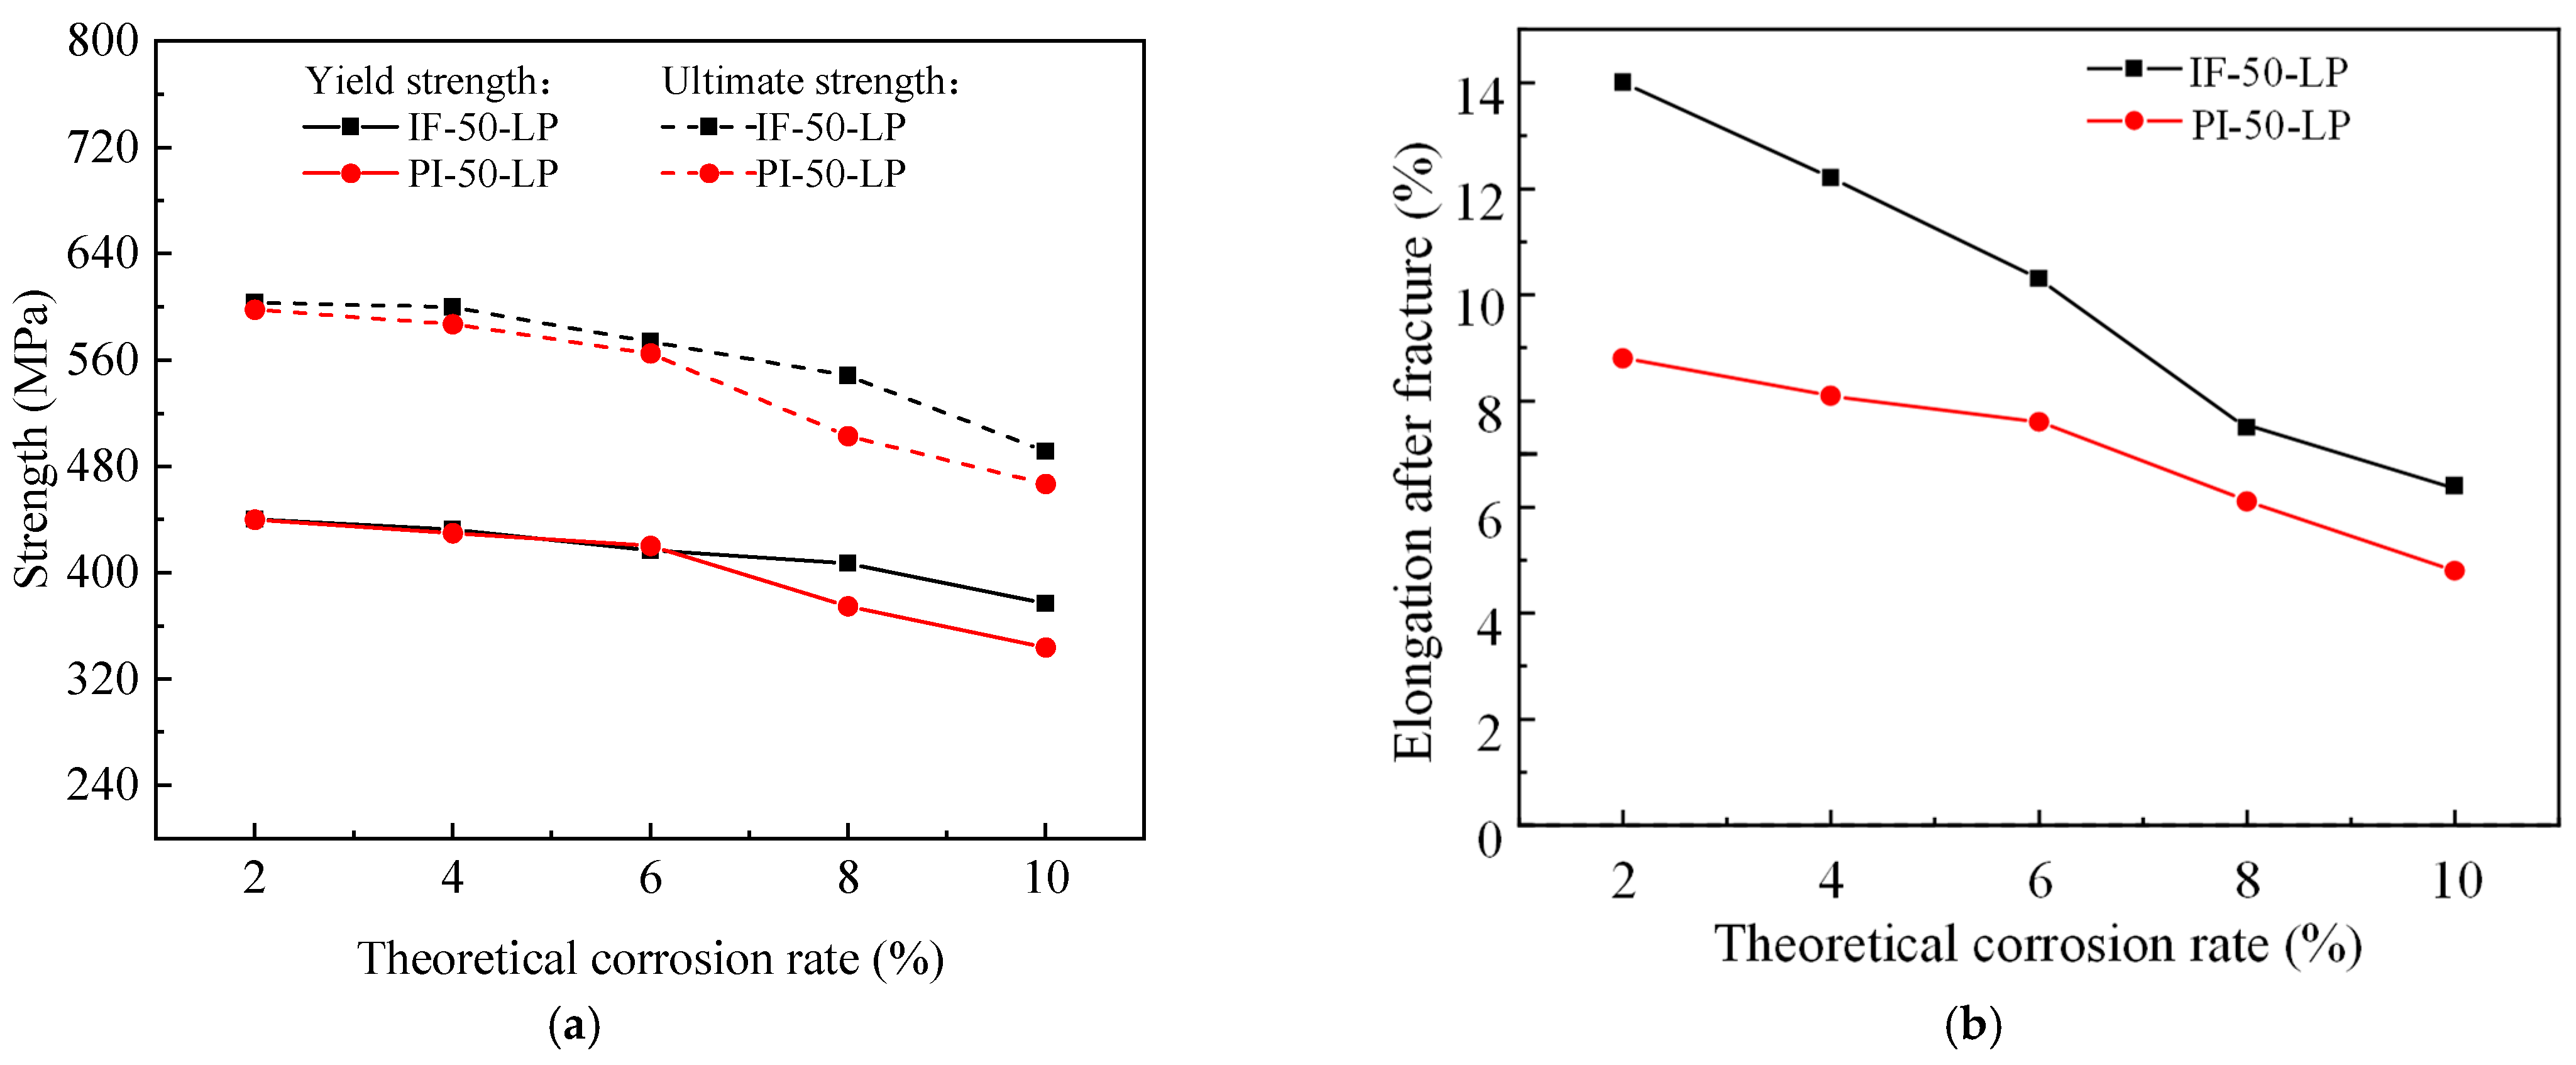
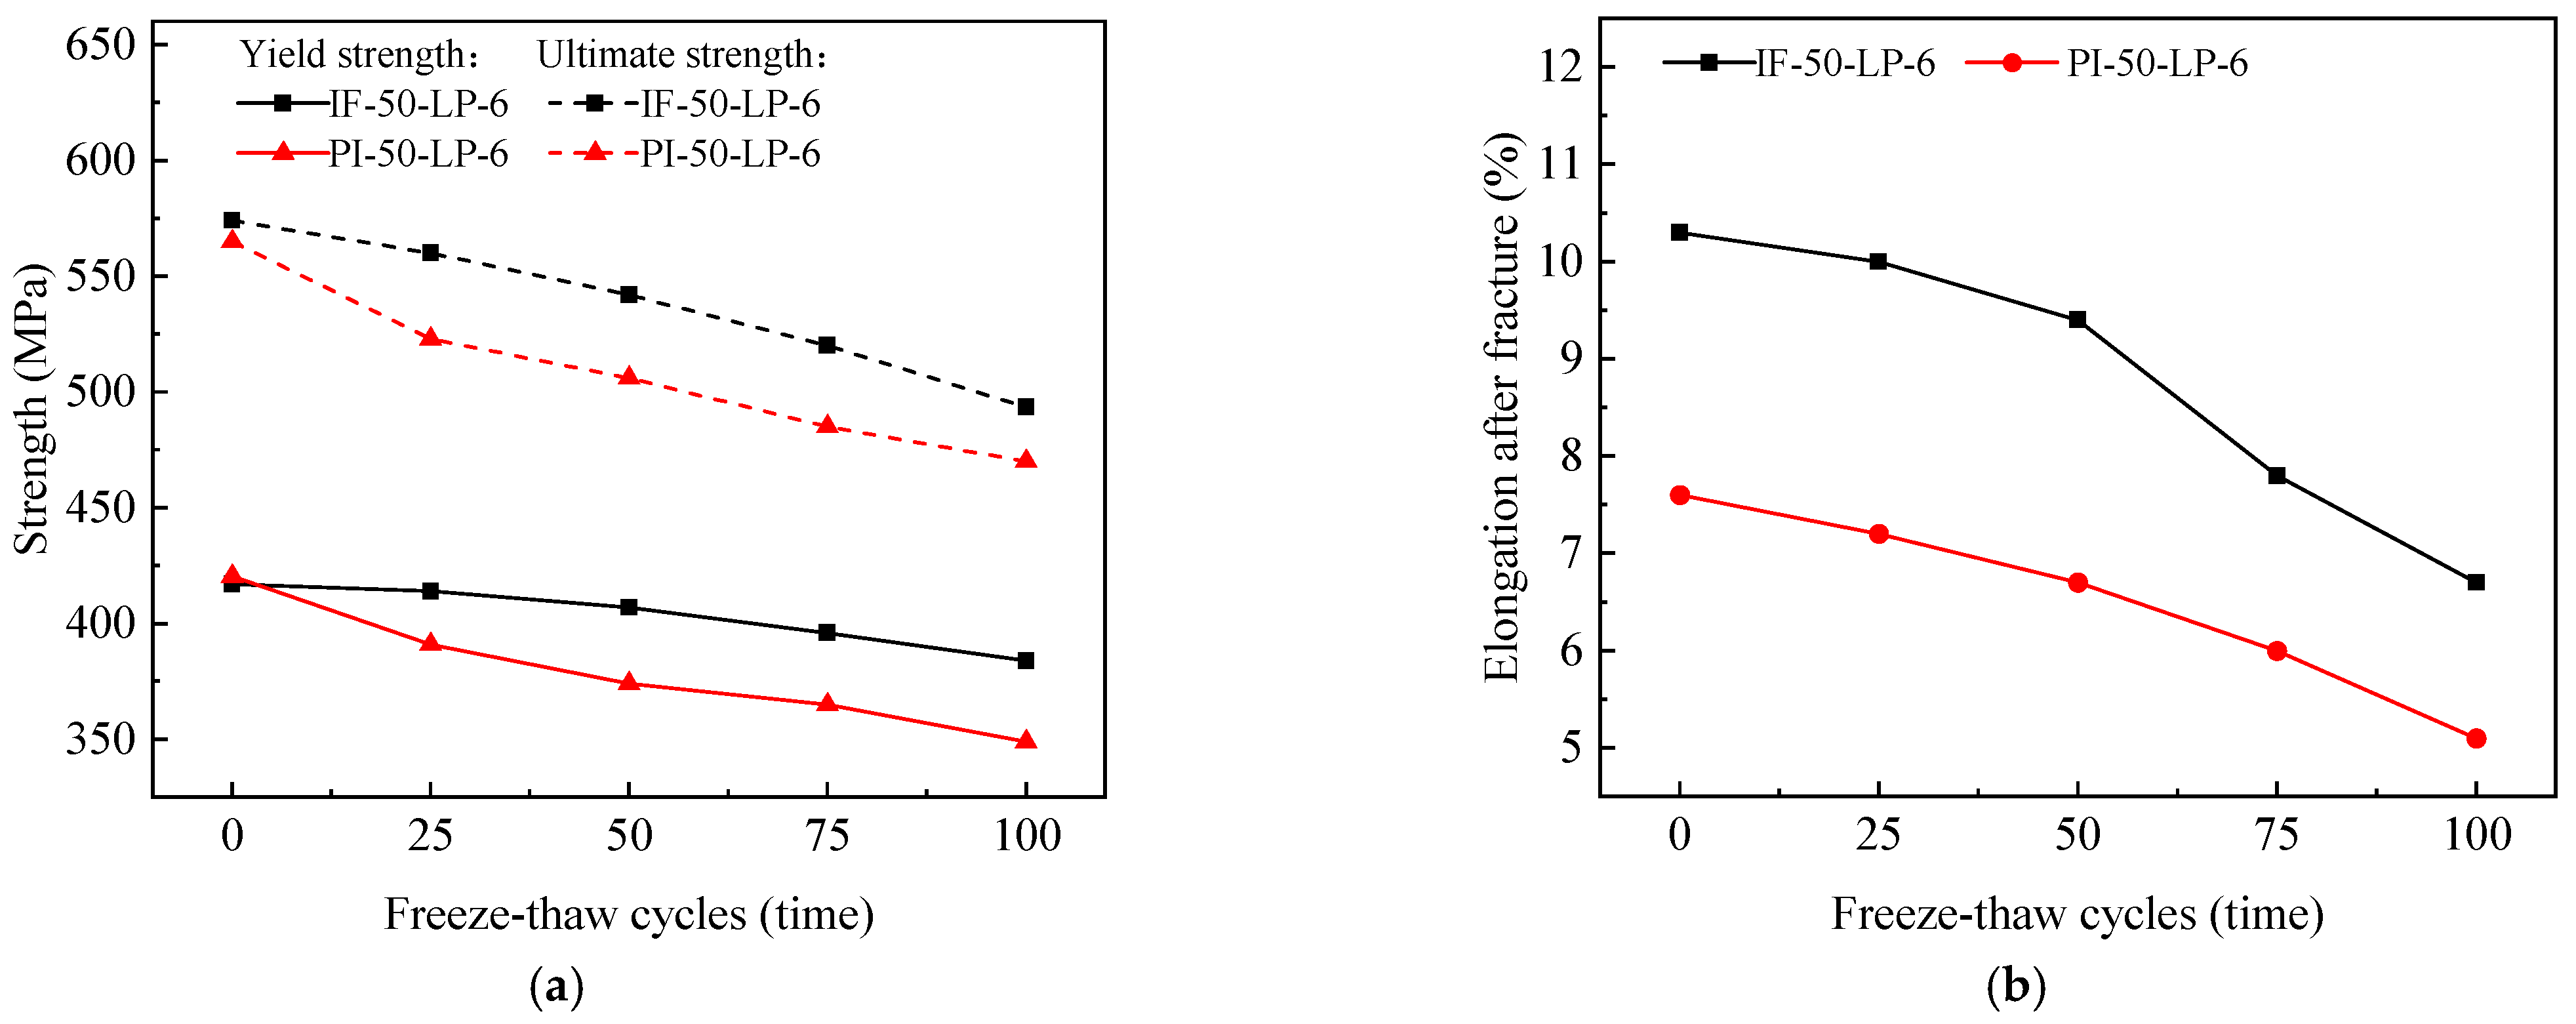
With the increase in the number of freeze–thaw cycles, the deviation between the actual corrosion rate and the theoretical corrosion rate of steel bars increased. The maximum section loss of the IF specimen developed relatively randomly, while that of the PI specimen was mainly concentrated at the joint interfaces, which is consistent with the distribution of surface cracks. Compared with the IF specimens, the average decreases in nominal yield strength, nominal ultimate strength and elongation in the PI specimens after freeze–thaw cycling and corrosion were 7.65%, 6.18% and 25.92%, respectively. The combined effect of freeze–thaw cycling and corrosion had a great influence on the ductility of the steel bars;
(5)
As the number of freeze–thaw cycles increased, the internal structure of the concrete in the specimens subjected to the coupled effects of freeze–thawing and corrosion became loose and porous, and the number of cracks increased significantly. The internal compactness of the PI specimen was looser than that of the IF specimen. The changes in the microstructures of specimens under freeze–thaw–corrosion were consistent with the law of macroscopic durability;
(6)
The quantitative results derived in this study can provide the basis of reasonable suggestions regarding the promising application of manufactured sand concrete in engineering practice in plateau environments. In future research, these methods (promoting the bonding property of joint interface, extending the transmission path of erosion ions, and enhancing the protection of steel bars) can be used to improve the durability of wet joints and their internal steel bars. The specific methods include chamfering the joint surfaces, locally coating the steel bars at the joints, and standardizing the quality of treatment of joint interfaces.

Author Contributions

X.G.: conceptualization, methodology, data curation, formal analysis, writing—review and editing, supervision, funding acquisition. K.C.: data curation, writing—original draft, formal analysis, validation, methodology, investigation. H.W.: conceptualization, resources, supervision. N.F.: validation, methodology, investigation. K.Y.: project administration, methodology, investigation. F.Z.: project administration, methodology, investigation. All authors have read and agreed to the published version of the manuscript.

Funding

The authors gratefully acknowledge the financial support from the National Natural Science Foundation of China [grant number 52208194], the Natural Science Foundation of Tianjin [grant number 22JCQNJC01550], and the Transportation Science and Technology Development Plan Project of Tianjin [grant number 2022-22, 2024-B02].

Data Availability Statement

Data will be made available on request.

Conflicts of Interest

Author Kai Chen was employed by the company Tianjin Xingchen Engineering Technology Service Co., Ltd., authors Kang Yu and Fengming Zhuang were employed by the company No. 6 Engineering Co., Ltd. of FHEC of CCCC. The remaining authors declare that the research was conducted in the absence of any commercial or financial relationships that could be construed as a potential conflict of interest.

References

  1. Wang, H.X.; Long, G.C.; Xie, Y.J.; Zeng, X.H.; Ma, K.L.; Dong, R.Z.; Tang, Z.; Xiao, Q.Y. Effects of intense ultraviolet irradiation on drying shrinkage and microstructural characteristics of cement mortar. Constr. Build. Mater. 2022, 347, 128513. [Google Scholar] [CrossRef]
  2. Wang, N.; Luo, K.; Peng, K.; Li, J.; Lu, Z.Y.; Xia, Y.Q.; Lin, Y.; Zhong, W. Thermal deformation and microstructure characteristics of low heat Portland cement-based concrete in a high plateau environment. J. Build. Eng. 2022, 58, 105025. [Google Scholar] [CrossRef]
  3. Lan, X.L.; Zeng, X.H.; Zhu, H.S.; Umar, H.A.; Long, G.C.; Tang, Z.; Xie, Y.J. Surface tension of cementitious pore solutions at low atmospheric pressure: An experimental exploration. Cem. Concr. Compos. 2024, 145, 105309. [Google Scholar] [CrossRef]
  4. Li, Y.L.; Duo, Z.S.; Li, Y.; Liu, Y.H.; Sun, X.J.; Guo, H.Y.; Ma, H. Mechanical properties and damage characteristics of concrete under different atmospheric pressures. J. Build. Eng. 2024, 82, 108196. [Google Scholar] [CrossRef]
  5. Huo, J.Y.; Wang, Z.J.; Chen, H.X.; He, R. Impacts of low atmospheric pressure on properties of cement concrete in plateau areas: A literature review. Materials 2019, 12, 1384. [Google Scholar] [CrossRef] [PubMed]
  6. Ge, X.; Ge, Y.; Li, Q.F.; Cai, X.P.; Yang, W.C.; Du, Y.B. Effect of low air pressure on the durability of concrete. Constr. Build. Mater. 2018, 187, 830–838. [Google Scholar] [CrossRef]
  7. Wang, Y.L.; Zhu, J.S.; Guo, Y.B.; Wang, C. Early shrinkage experiment of concrete and the development law of its temperature and humidity field in natural environment. J. Build. Eng. 2023, 63, 105528. [Google Scholar] [CrossRef]
  8. Zhu, J.S.; Wang, C.; Yang, Y.B.; Wang, Y.L. Hygro-thermal-mechanical coupling analysis for early shrinkage of cast in situ concrete slabs of composite beams: Theory and experiment. Constr. Build. Mater. 2023, 372, 130774. [Google Scholar] [CrossRef]
  9. Wang, Y.L.; Zhu, J.S.; Sun, Y.D. Multi-scale modeling and simulation of bidirectional coupled moisture and heat transfer in concrete. J. Build. Eng. 2023, 74, 106856. [Google Scholar] [CrossRef]
  10. Tu, Y.M.; Liu, D.Y.; Wang, T.F.; Yuan, L. Evaluation on later-age performance of concrete subjected to early-age freeze-thaw damage. Constr. Build. Mater. 2020, 270, 121491. [Google Scholar] [CrossRef]
  11. Zeyad, A.M.; Johari, M.A.M.; Abadel, A.; Abutaleb, A.; Mijarsh, M.J.A.; Almalki, A. Transport properties of palm oil fuel ash-based high-performance green concrete subjected to steam curing regimes. Case Stud. Constr. Mater. 2022, 16, e01077. [Google Scholar] [CrossRef]
  12. Zhang, Z.Q.; Zhang, B.; Yan, P.Y. Hydration and microstructures of concrete containing raw or densified silica fume at different curing temperatures. Constr. Build. Mater. 2016, 121, 483–490. [Google Scholar] [CrossRef]
  13. Jiang, Z.W.; He, B.; Zhu, X.P.; Ren, Q.; Zhang, Y. State-of-the-art review on properties evolution and deterioration mechanism of concrete at cryogenic temperature. Constr. Build. Mater. 2020, 257, 119456. [Google Scholar] [CrossRef]
  14. He, R.; Wang, T.; Chen, H.X.; Xue, C.; Bai, Y.H. Impact of Qinghai-Tibet Plateau’s Climate on Strength and Permeability of Concrete. China J. Highw. Transp. 2020, 33, 29–41. [Google Scholar]
  15. Ortiz, J.; Aguado, A.; Agulló, L.; García, T. Influence of environmental temperatures on the concrete compressive strength: Simulation of hot and cold weather conditions. Cem. Concr. Res. 2005, 35, 1970–1979. [Google Scholar] [CrossRef]
  16. Demirboğa, R.; Karagöl, F.; Polat, R.; Kaygusuz, M.A. The effects of urea on strength gaining of fresh concrete under the cold weather conditions. Constr. Build. Mater. 2014, 64, 114–120. [Google Scholar] [CrossRef]
  17. Karagol, F.; Demirboga, R.; Khushefati, W.H. Behavior of fresh and hardened concretes with antifreeze admixtures in deep-freeze low temperatures and exterior winter conditions. Constr. Build. Mater. 2015, 76, 388–395. [Google Scholar] [CrossRef]
  18. Guo, J.C.; Zhou, Z.X.; Zhang, Z.Y.; Tang, J.H.; Li, X.; Zou, Y. Effects of alternating positive and negative temperature curing on the mechanical properties of ultra-high performance concrete. Case Stud. Constr. Mater. 2024, 20, e02752. [Google Scholar] [CrossRef]
  19. Li, G.P.; Hu, H.; Ren, C.; Zhou, S.Y.; Li, J.X. Study on durability of joints in concrete bridge structures. China Civ. Eng. J. 2018, 51, 98–103. [Google Scholar]
  20. Li, G.P.; Hu, H.; Ren, C. Resistance of segmental joints to chloride ions. ACI Mater. J. 2016, 113, 471–481. [Google Scholar] [CrossRef]
  21. Li, G.P.; Hu, H.; Ren, C. Resistance of segmental joints to carbonation. ACI Mater. J. 2017, 114, 137–148. [Google Scholar] [CrossRef]
  22. Ding, J.N.; Zhu, J.S.; Kang, J.F. Bonding properties and mechanism of the interface between precast UHPC and post-cast UHPC. Structures 2022, 43, 822–833. [Google Scholar] [CrossRef]
  23. Udaipurwala, A.; Poursaee, A.; Schiff, D.S. Corrosion Activity in Precast Concrete Elements and Cementitious Closure Pours. J. Bridge Eng. 2015, 20, 04015013. [Google Scholar] [CrossRef]
  24. Shen, Y.; Liu, J.; Zhou, S.Y.; Li, G.P. Experimental Investigation on the Freeze-Thaw Durability of Concrete under Compressive Load and with Joints. Constr. Build. Mater. 2019, 229, 116893. [Google Scholar] [CrossRef]
  25. Jan, P.H.; Matthias, M.; Sarah, L.; Viktoria, M.P.; Frank, D. Experimental methods for the analysis of the durability behavior of concrete joints. Struct. Concr. 2022, 24, 423–433. [Google Scholar]
  26. Yoo, S.; Kwon, S. Effects of cold joint and loading conditions on chloride diffusion in concrete containing GGBFS. Constr. Build. Mater. 2016, 115, 247–255. [Google Scholar] [CrossRef]
  27. Yang, H.; Lee, H.; Yang, K.; Ismail, M.A.; Kwon, S.J. Time and cold joint effect on chloride diffusion in concrete containing GGBFS under various loading conditions. Constr. Build. Mater. 2018, 167, 739–748. [Google Scholar] [CrossRef]
  28. Zhang, D.W.; Zeng, Y.; Fang, M.S.; Jin, W.L. Service life prediction of precast concrete structures exposed to chloride environment. Adv. Civ. Eng. 2019, 2019, 3216328. [Google Scholar] [CrossRef]
  29. Goncalves, J.P.; Tavares, L.M.; Filho, R.D.T.; Fairbain, E.M.R.; Cunha, E.R. Comparison of natural and manufactured fine aggregates in cement mortars. Cem. Concr. Res. 2007, 37, 924–932. [Google Scholar] [CrossRef]
  30. Tahir, C.; Khaled, M. Effects of Crushed Stone Dust on Some Properties of Concrete. Cem. Concr. Res. 1996, 26, 1121–1130. [Google Scholar]
  31. Devadass, T. Experimental study on replacement of fine aggregate in concrete with dissimilar curing conditions. Case Stud. Constr. Mater. 2019, 11, e00245. [Google Scholar] [CrossRef]
  32. Sangoju, B.; Ramesh, G.; Bharatkumar, H.B.; Ramanjaneyulu, K. Evaluation of Durability Parameters of Concrete with Manufacture Sand and River Sand. J. Inst. Eng. (India) Ser. A 2017, 98, 267–275. [Google Scholar] [CrossRef]
  33. Chen, Z.; Liu, G.; Peng, G.; Li, S. Mechanical Properties and Microstructure Characteristics of Manufactured-Sand Concrete Under Coupled Effect of Salt Erosion and Freeze-Thaw Cycles. Sci. Adv. Mater. 2019, 11, 555–562. [Google Scholar] [CrossRef]
  34. Vijaya, B.; Selvan, S.S.; Kala, F.; Annadurai, R. Comparative Study on the Strength and Durability Properties of Concrete with Manufactured Sand. Indian J. Sci. Technol. 2015, 8, 1–7. [Google Scholar] [CrossRef]
  35. Zhang, Y.; Gu, L.; Zhang, Q. Durability of manufactured sand concrete in atmospheric acidification environment. Case Stud. Constr. Mater. 2022, 17, e01613. [Google Scholar] [CrossRef]
  36. Zheng, S.; Chen, J.; Wang, W. Effects of Fines Content on Durability of High-Strength Manufactured Sand Concrete. Materials 2023, 16, 522. [Google Scholar] [CrossRef]
  37. Li, H.; Huang, F.; Cheng, G.; Xie, Y.; Tan, Y.; Li, L.; Yi, Z. Effect of Granite Dust on Mechanical and some Durability Properties of Manufactured Sand concrete. Constr. Build. Mater. 2016, 109, 41–46. [Google Scholar] [CrossRef]
  38. Zhang, A.; Yang, W.C.; Ge, Y.; Liu, P.H. Effect of nanomaterials on the mechanical properties and microstructure of cement mortar under low air pressure curing. Constr. Build. Mater. 2020, 249, 118787. [Google Scholar] [CrossRef]
  39. Feng, W.P.; Tarakbay, A.; Memonb, S.A.; Tang, W.C.; Cui, H.Z. Methods of accelerating chloride-induced corrosion in steel-reinforced concrete: A comparative review. Constr. Build. Mater. 2021, 289, 123165. [Google Scholar] [CrossRef]
  40. Wang, X.G.; Song, X.W.; Zhang, M.P.; Du, X.B. Experimental comparison of corrosion unevenness and expansive cracking between accelerated corrosion methods used in laboratory research. Constr. Build. Mater. 2017, 153, 36–43. [Google Scholar] [CrossRef]
  41. Lun, P.Y.; Lu, Z.H.; Zhang, X.G.; Zhang, Q.; Zhao, R. Experimental study and suggested mathematical model for chloride-induced reinforcement corrosion rate. Structures 2021, 34, 2014–2029. [Google Scholar] [CrossRef]
  42. Wang, J.; Yuan, Y.Y.; Xu, Q.; Qin, H.T. Prediction of corrosion-induced longitudinal cracking time of concrete cover surface of reinforced concrete structures under load. Materials 2022, 15, 7395. [Google Scholar] [CrossRef] [PubMed]
  43. Zhao, L.Y.; Wang, J.; Gao, P.F.; Yuan, Y.Y. Experimental study on the corrosion characteristics of steel bars in reinforced concrete considering the effects of multiple factors. Case Stud. Constr. Mater. 2024, 20, e02706. [Google Scholar]
  44. Zhang, J.H.; Yi, C.H.; Wang, S.K.; Guan, Z.G. Accelerated corrosion of steel bars in new and old concrete structures. J. Chin. Ceram. Soc. 2022, 50, 2096–2103. [Google Scholar]
  45. Yu, Z.H.; Zhang, H.R.; Bao, J.W.; Zhang, P.; Ding, Y.H.; Chen, X.; Qin, L.; Sun, J.W.; Song, Q. Coupled effects of the freeze-thaw cycles and salt erosion on the performance of recycled aggregate concrete. J. Build. Eng. 2024, 95, 110212. [Google Scholar] [CrossRef]
  46. Bi, L.P.; Long, G.C.; Xiao, R.M.; Zeng, X.H.; Xie, Y.J. Properties and characterization of high-performance steam-cured cement-based materials modified by phase change materials. J. Clean. Prod. 2021, 328, 129669. [Google Scholar] [CrossRef]
Figure 1. Fly ash, manufactured sand and coarse aggregate. (a) Fly ash. (b) Manufactured sand. (c) Particles with sizes of 5–10 mm. (d) Particles with sizes of 10–20 mm.
Buildings 14 02697 g001
Figure 2. Two types of specimens (unit: mm); (a) IF specimen; (b) PI specimen; (c) joint interface of PI specimen.
Buildings 14 02697 g002
Figure 3. Preparation and test process and methods.
Buildings 14 02697 g003
Figure 4. Concrete dynamic elastic modulus tester.
Buildings 14 02697 g004
Figure 5. SK-510 crack detector.
Buildings 14 02697 g005
Figure 6. Surface crack development of IF and PI specimens (Note: For IF specimens, the maximum and average crack widths are indicated in the brackets. For PI specimens, the maximum and average longitudinal crack widths are indicated in the first bracket, and the maximum and average transverse crack widths are indicated in the second bracket.): (a) IF-50-LP-2 (0, 0); (b) PI-50-LP-2 (0.18, 0.14) (0.14, 0.11); (c) IF-50-LP-4 (0.24, 0.15); (d) PI-50-LP-4 (0.37, 0.17) (0.23, 0.13); (e) IF-50-LP-10 (0.73, 0.59); (f) PI-50-LP-10 (0.90, 0.64) (0.43, 0.28).
Buildings 14 02697 g006
Figure 7. Variation curves of maximum and average crack widths with the theoretical corrosion rate for IF and PI specimens.
Buildings 14 02697 g007
Figure 8. Corrosion morphologies of steel bars in IF specimen and near the joint of PI specimen at a theoretical corrosion rate of 10%: (a) IF-50-LP-10; (b) PI-50-LP-10.
Buildings 14 02697 g008
Figure 9. Actual corrosion rates of steel bars in IF and PI specimens.
Buildings 14 02697 g009
Figure 10. Section loss rates of steel bars in IF and PI specimens.
Buildings 14 02697 g010
Figure 11. Degradation of mechanical properties of steel bars in IF and PI specimens with corrosion rate; (a) nominal yield and ultimate strengths; (b) elongation after fracture.
Buildings 14 02697 g011
Figure 12. Surface spalling of IF and PI specimens subjected to freeze–thaw cycles; (a) IF-50-LP-25; (b) PI-50-LP-25; (c) IF-50-LP-50; (d) PI-50-LP-50; (e) IF-50-LP-75; (f) PI-50-LP-75; (g) IF-50-LP-100; (h) PI-50-LP-100.
Buildings 14 02697 g012
Figure 13. Variation curves of mass loss rate with freeze–thaw cycles.
Buildings 14 02697 g013
Figure 14. Variation curves of relative dynamic elastic modulus with freeze–thaw cycles.
Buildings 14 02697 g014
Figure 15. Surface crack development of IF and PI specimens under freeze–thaw–corrosion (Note: For IF specimens, the maximum and average crack widths are indicated in the brackets. For PI specimens, the maximum and average longitudinal crack widths are indicated in the first bracket, and the maximum and average transverse crack widths are indicated in the second bracket.): (a) IF-50-LP-0-6 (0.36, 0.26); (b) IF-50-LP-25-6 (0.41, 0.26); (c) IF-50-LP-50-6 (0.49, 0.31); (d) IF-50-LP-75-6 (0.74, 0.52); (e) IF-50-LP-100-6 (0.92, 0.71); (f) PI-50-LP-0-6 (0.44, 0.23) (0.30, 0.15); (g) PI-50-LP-25-6 (0.50, 0.26) (0.30, 0.18); (h) PI-50-LP-50-6 (0.55, 0.34) (0.33, 0.21); (i) PI-50-LP-75-6 (0.83, 0.61) (0.48, 0.32); (j) PI-50-LP-100-6 (1.04, 0.87) (0.52, 0.35).
Buildings 14 02697 g015
Figure 16. Relationship between maximum and average crack widths and freeze–thaw cycles for IF and PI specimens.
Buildings 14 02697 g016
Figure 17. Corrosion morphologies of steel bars in the IF specimens and near the joint of PI specimens after freeze–thaw cycles and corrosion: (a) IF-50-LP-50-6; (b) PI-50-LP-50-6; (c) IF-50-LP-100-6; (d) PI-50-LP-100-6.
Buildings 14 02697 g017
Figure 18. Variation in the actual corrosion rates of steel bars in specimens undergoing freeze–thaw cycles.
Buildings 14 02697 g018
Figure 19. Section loss rates of steel bars in IF and PI specimens after freeze–thaw cycles and corrosion: (a) IF specimens; (b) PI specimens.
Buildings 14 02697 g019
Figure 20. Degradation of mechanical properties of steel bars in IF and PI specimens with freeze–thaw cycles: (a) Nominal yield and ultimate strengths; (b) elongation after fracture.
Buildings 14 02697 g020
Figure 21. Micro-morphologies of concrete in IF and PI specimens after freeze–thaw cycles and corrosion: (a) IF-50-LP-0-6; (b) PI-50-LP-0-6; (c) IF-50-LP-50-6; (d) PI-50-LP-50-6; (e) IF-50-LP-100-6; (f) PI-50-LP-100-6.
Buildings 14 02697 g021
Table 1. Experimental materials.
Cementitious MaterialsManufactured SandCrushed Stone
Particle Size (mm)Apparent Density (kg/m3)Bulk Density (kg/m3)Fineness ModulusMethylene Blue (MB) ValueParticle Size (mm)Apparent Density (kg/m3)Bulk Density (kg/m3)
P·O 42.5 OPC, grade I fly ash0.35–0.50262015102.81.85–2027351590
Table 2. Physical properties of cement.
Normal Consistency (%)Setting Time (min)Flexural Strength (MPa)Compressive Strength (MPa)
Initial SettingFinal Setting3 d28 d3 d28 d
26.71241936.99.432.161.1
Table 3. Parameters of steel bar.
TypeDiameter (mm)Cross-Section Area (mm2)Average Rib Height (mm)Yield Strength (MPa)Ultimate Strength (MPa)Elongation (%)
HRB400121131.0455611.518.4
Table 4. Mix ratio of concrete.
Strength GradeWater–Binder RatioCement (kg/m3)Fly Ash (kg/m3)Manufactured Sand (kg/m3)Crushed Stone (kg/m3)Water (kg/m3)Water Reducer (kg/m3)Test Value of Compressive Strength (MPa)
NPLP
C500.3033614467310971454.6454.751.3
Note: Test value of compressive strength refers to the compressive strength of a concrete cube (150 mm × 150 mm × 150 mm) prepared under a normal-pressure (abbreviated as NP) natural environment and a low-pressure (abbreviated as LP) plateau environment, respectively.
Disclaimer/Publisher’s Note: The statements, opinions and data contained in all publications are solely those of the individual author(s) and contributor(s) and not of MDPI and/or the editor(s). MDPI and/or the editor(s) disclaim responsibility for any injury to people or property resulting from any ideas, methods, instructions or products referred to in the content.

