
A Parametric Study of Flexible Support Deflection of Photovoltaic Cells Considering Wind-Induced Load Using Time History Technique


Abstract
:1. Introduction
2. Methodology
2.1. Model Building and Meshing
2.1.1. Flexible PV Support Model
2.1.2. Mesh Division
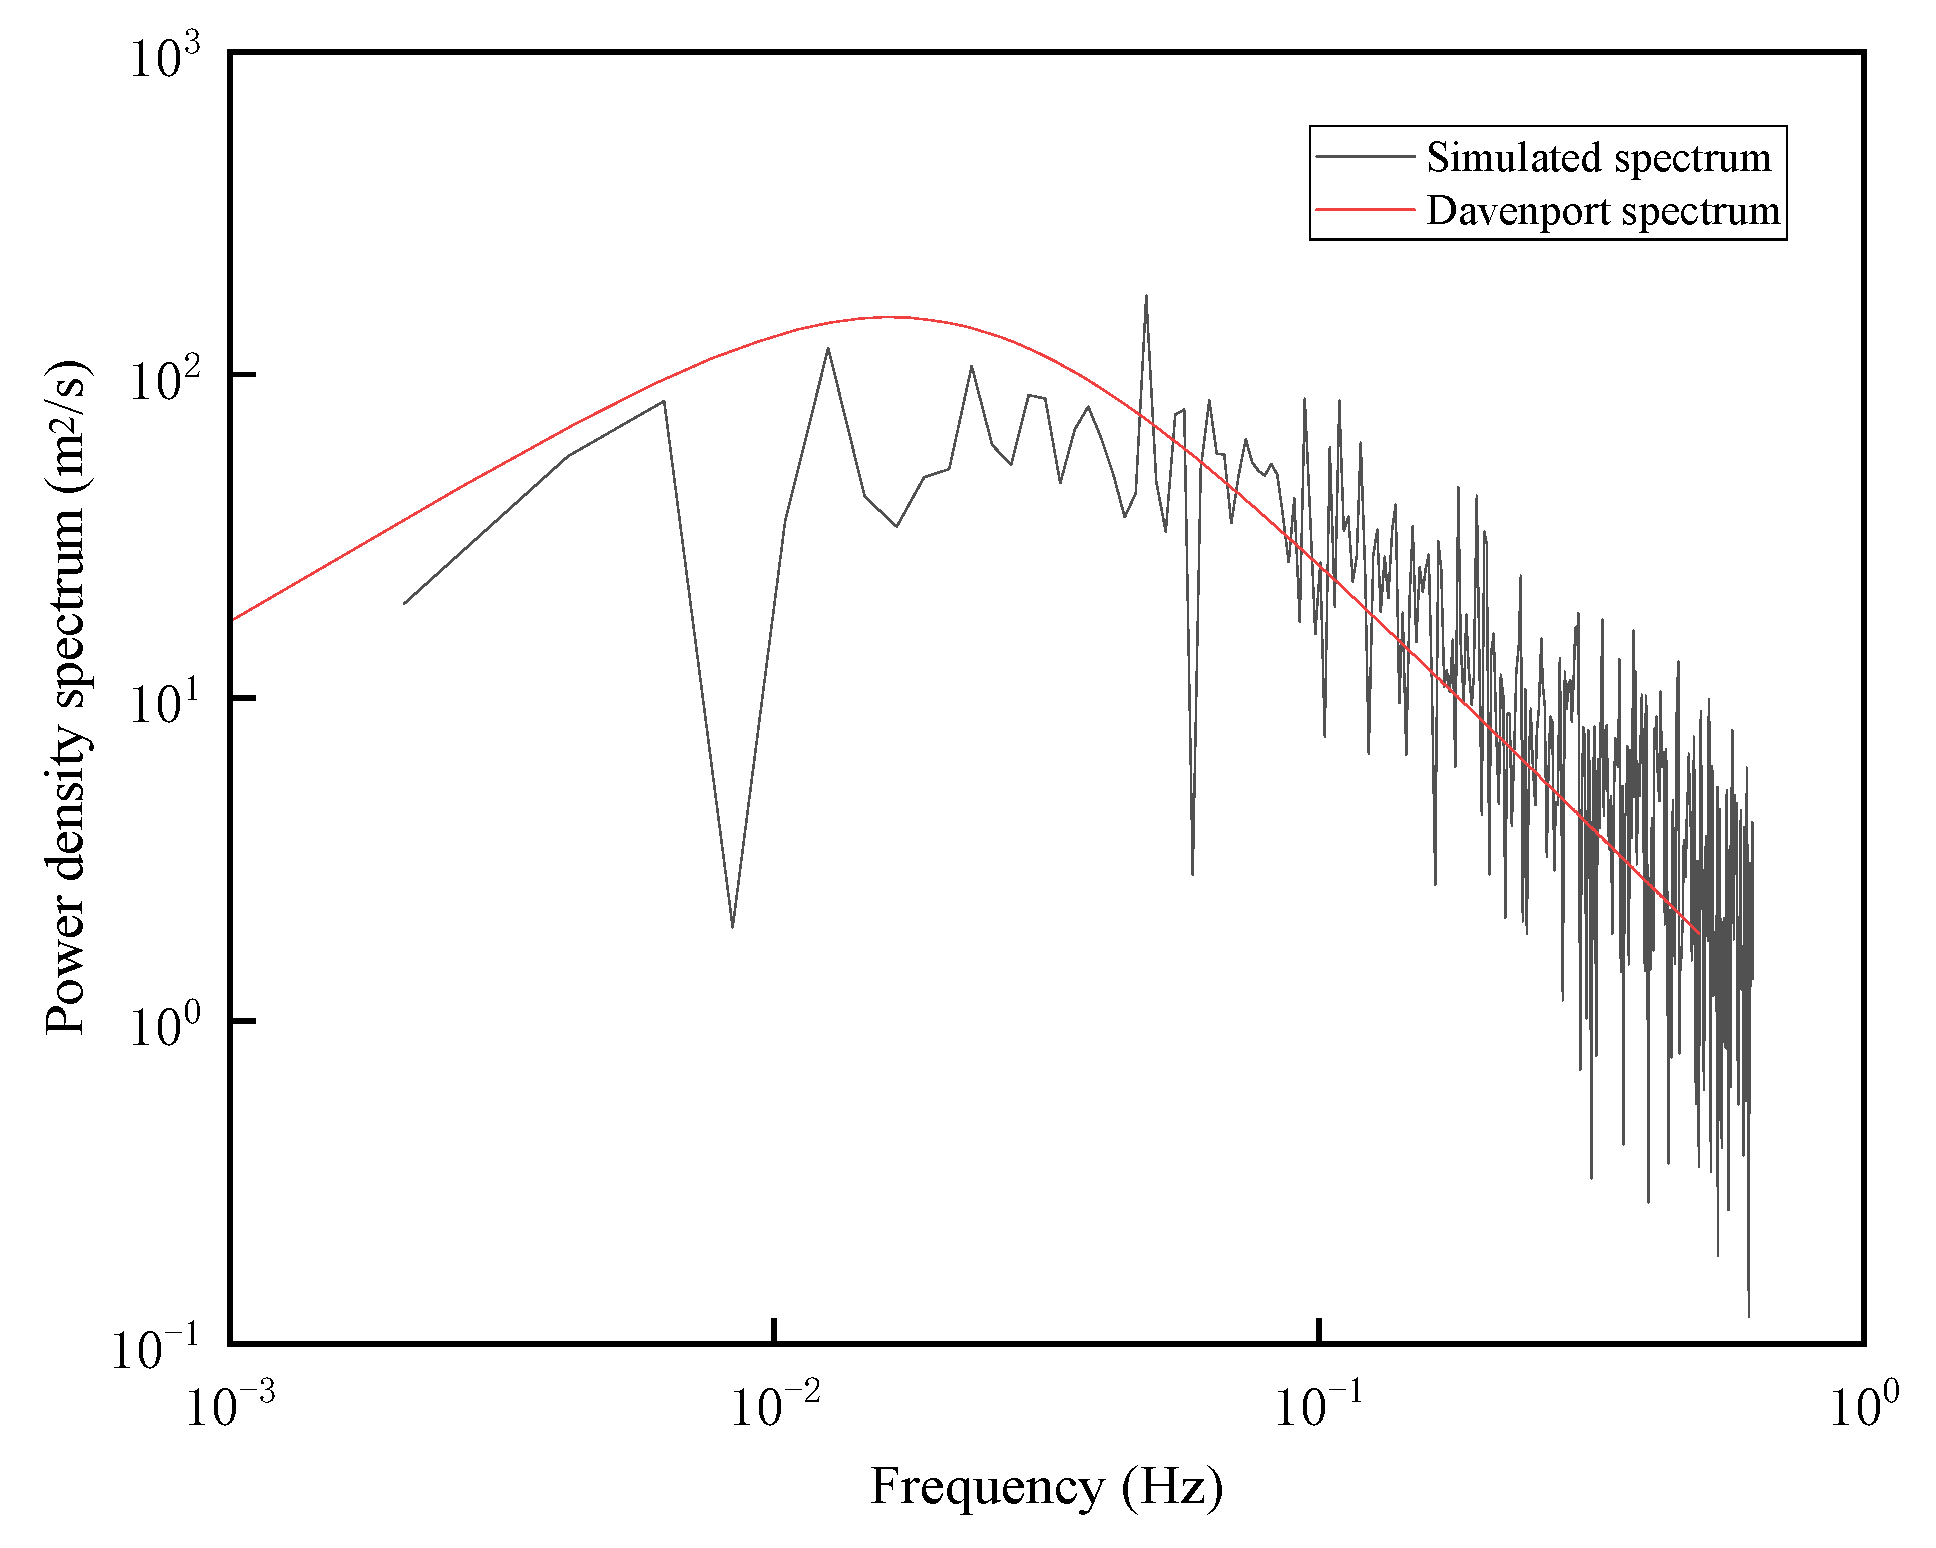
2.2. Structural Wind Pressure Simulation
2.2.1. Wind Speed Calculation
2.2.2. Wind Pressure Calculation
2.3. Simulation
2.3.1. Mean Wind Load
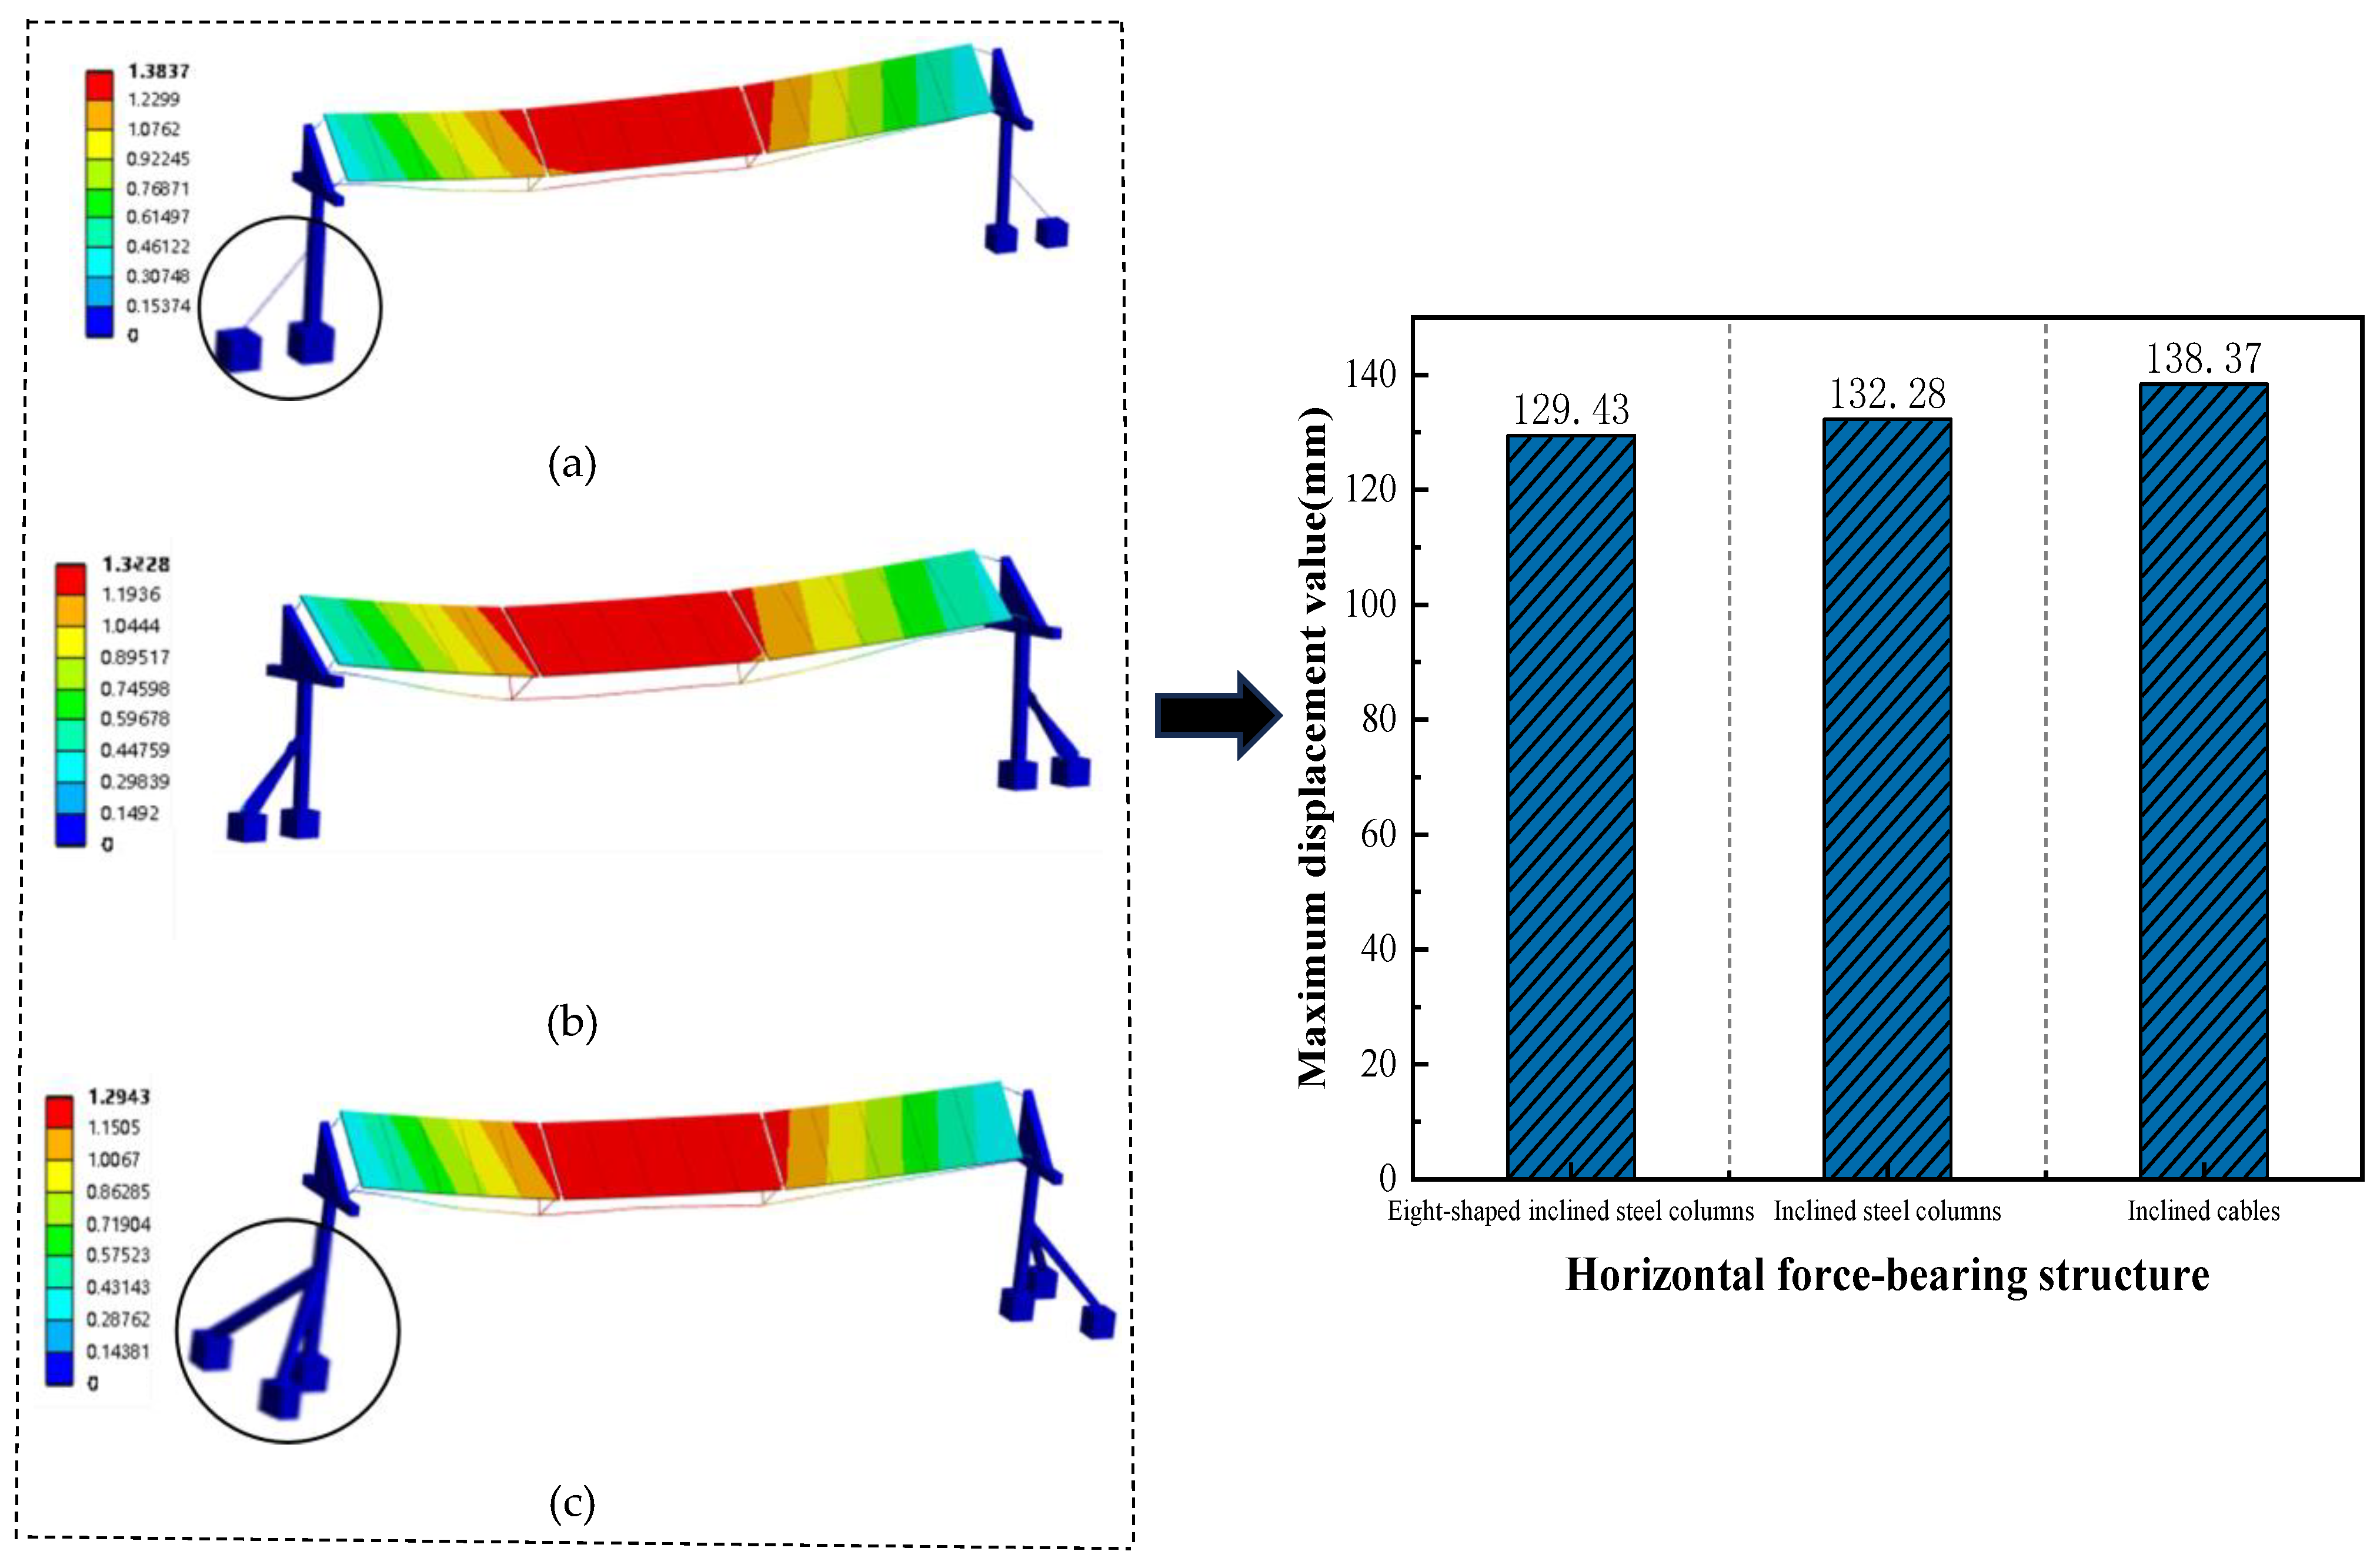
Force-Bearing Safety
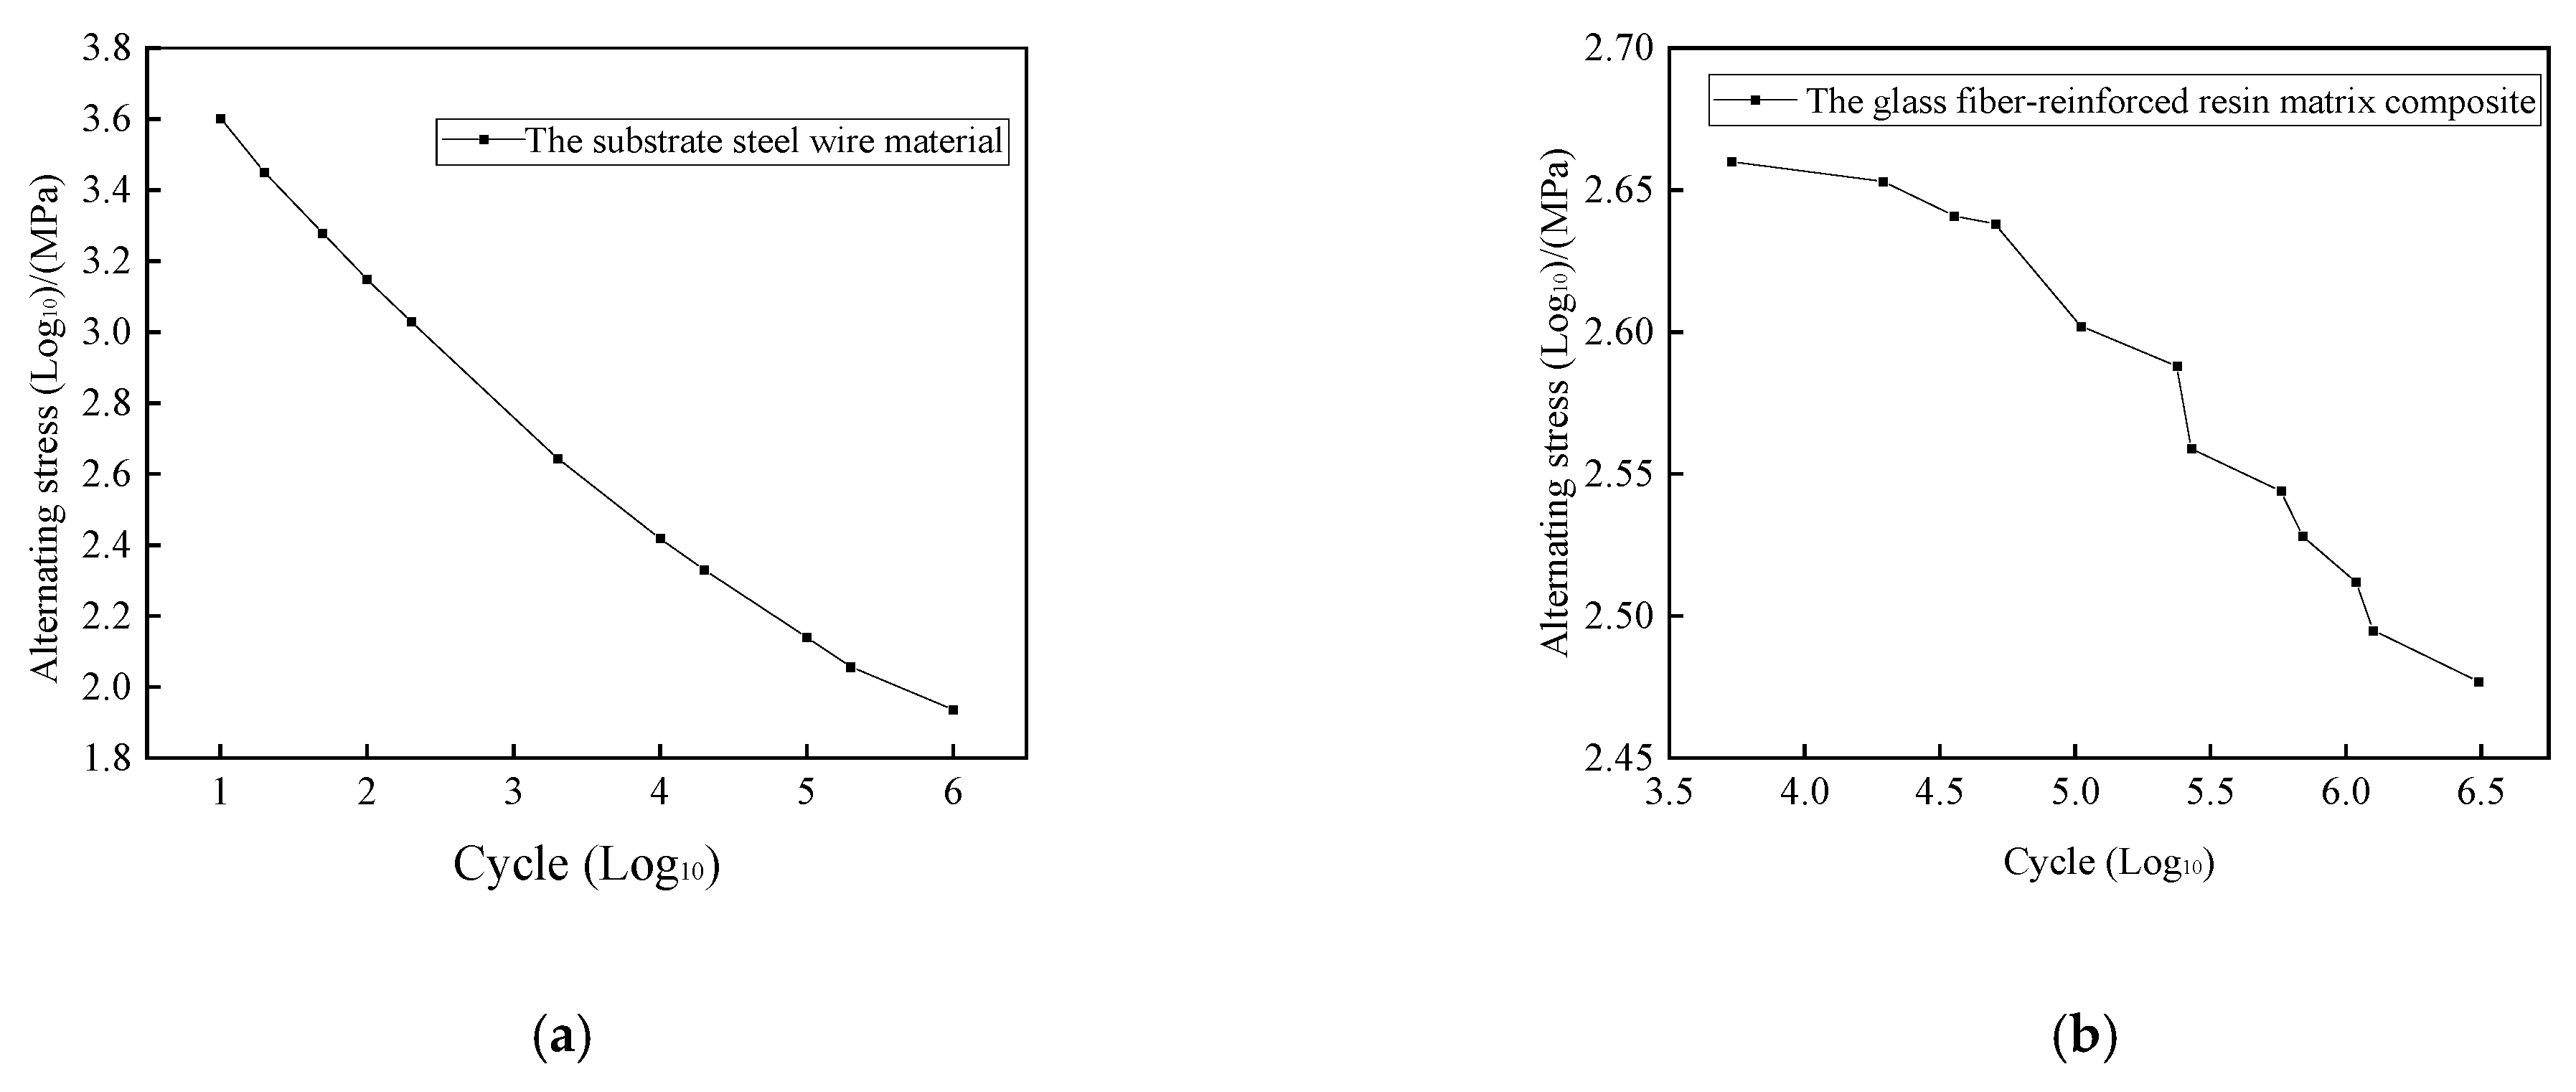
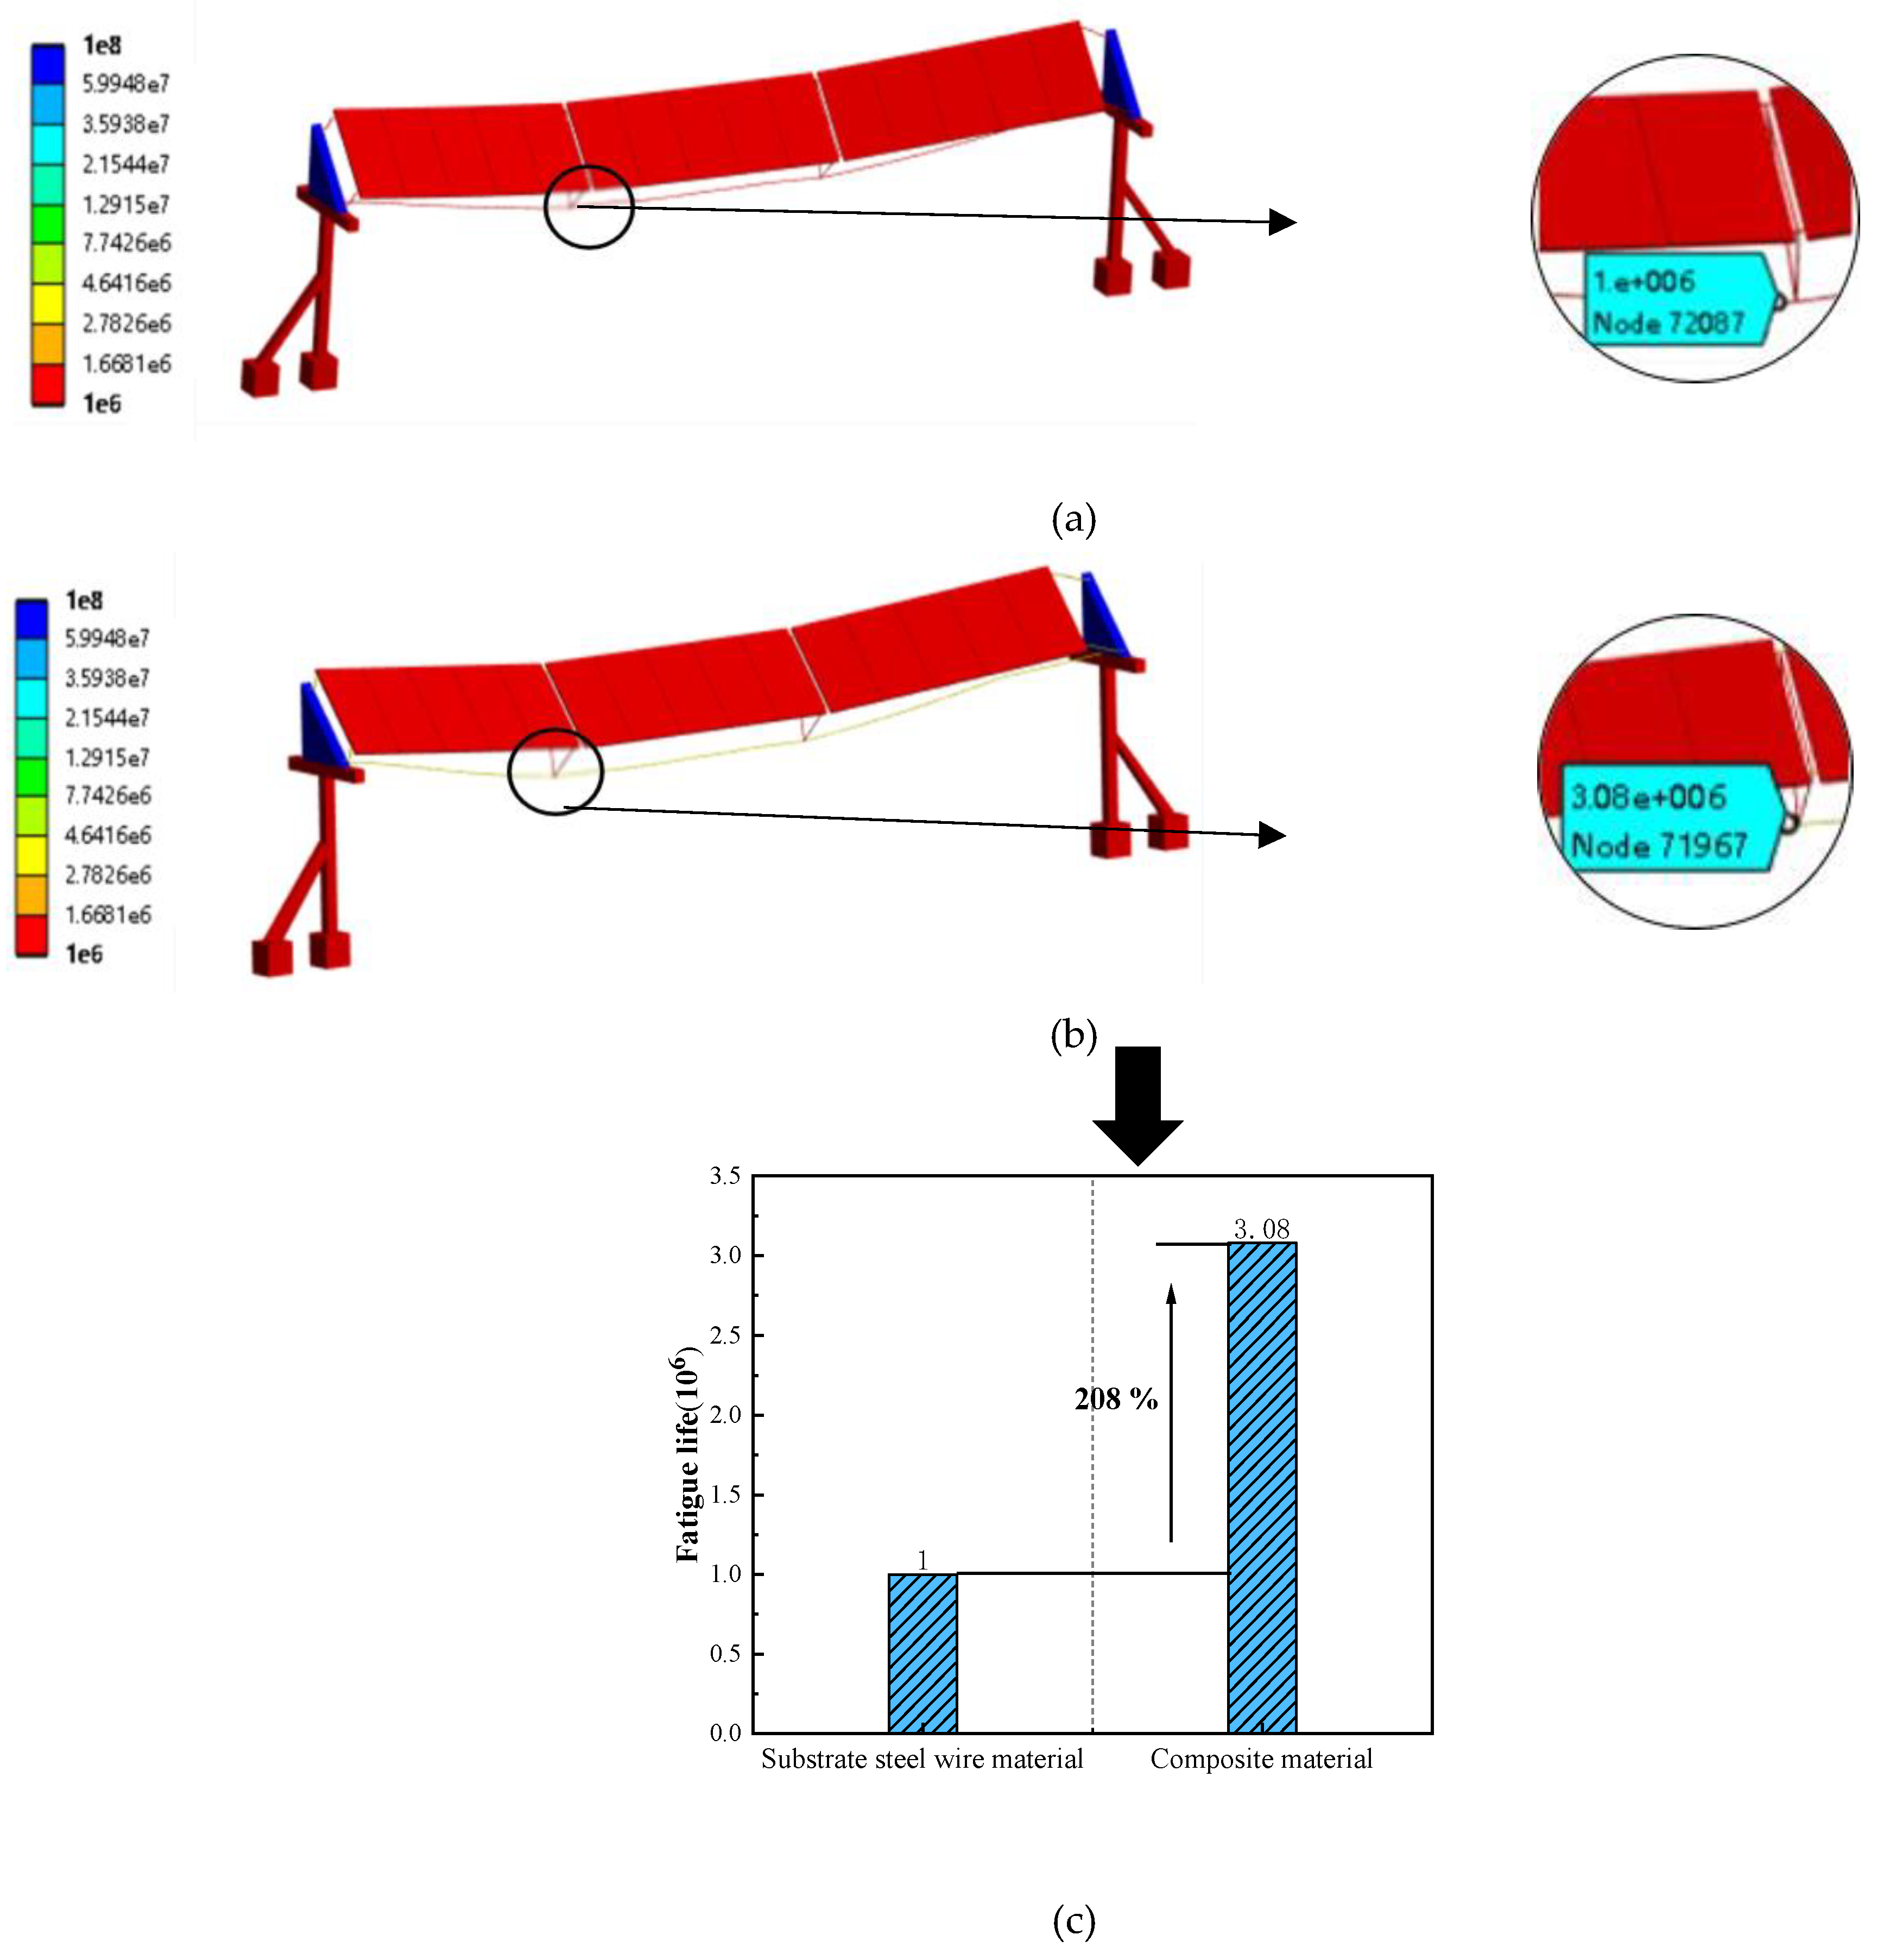
Fatigue Life Evaluation
Wind-Induced Response
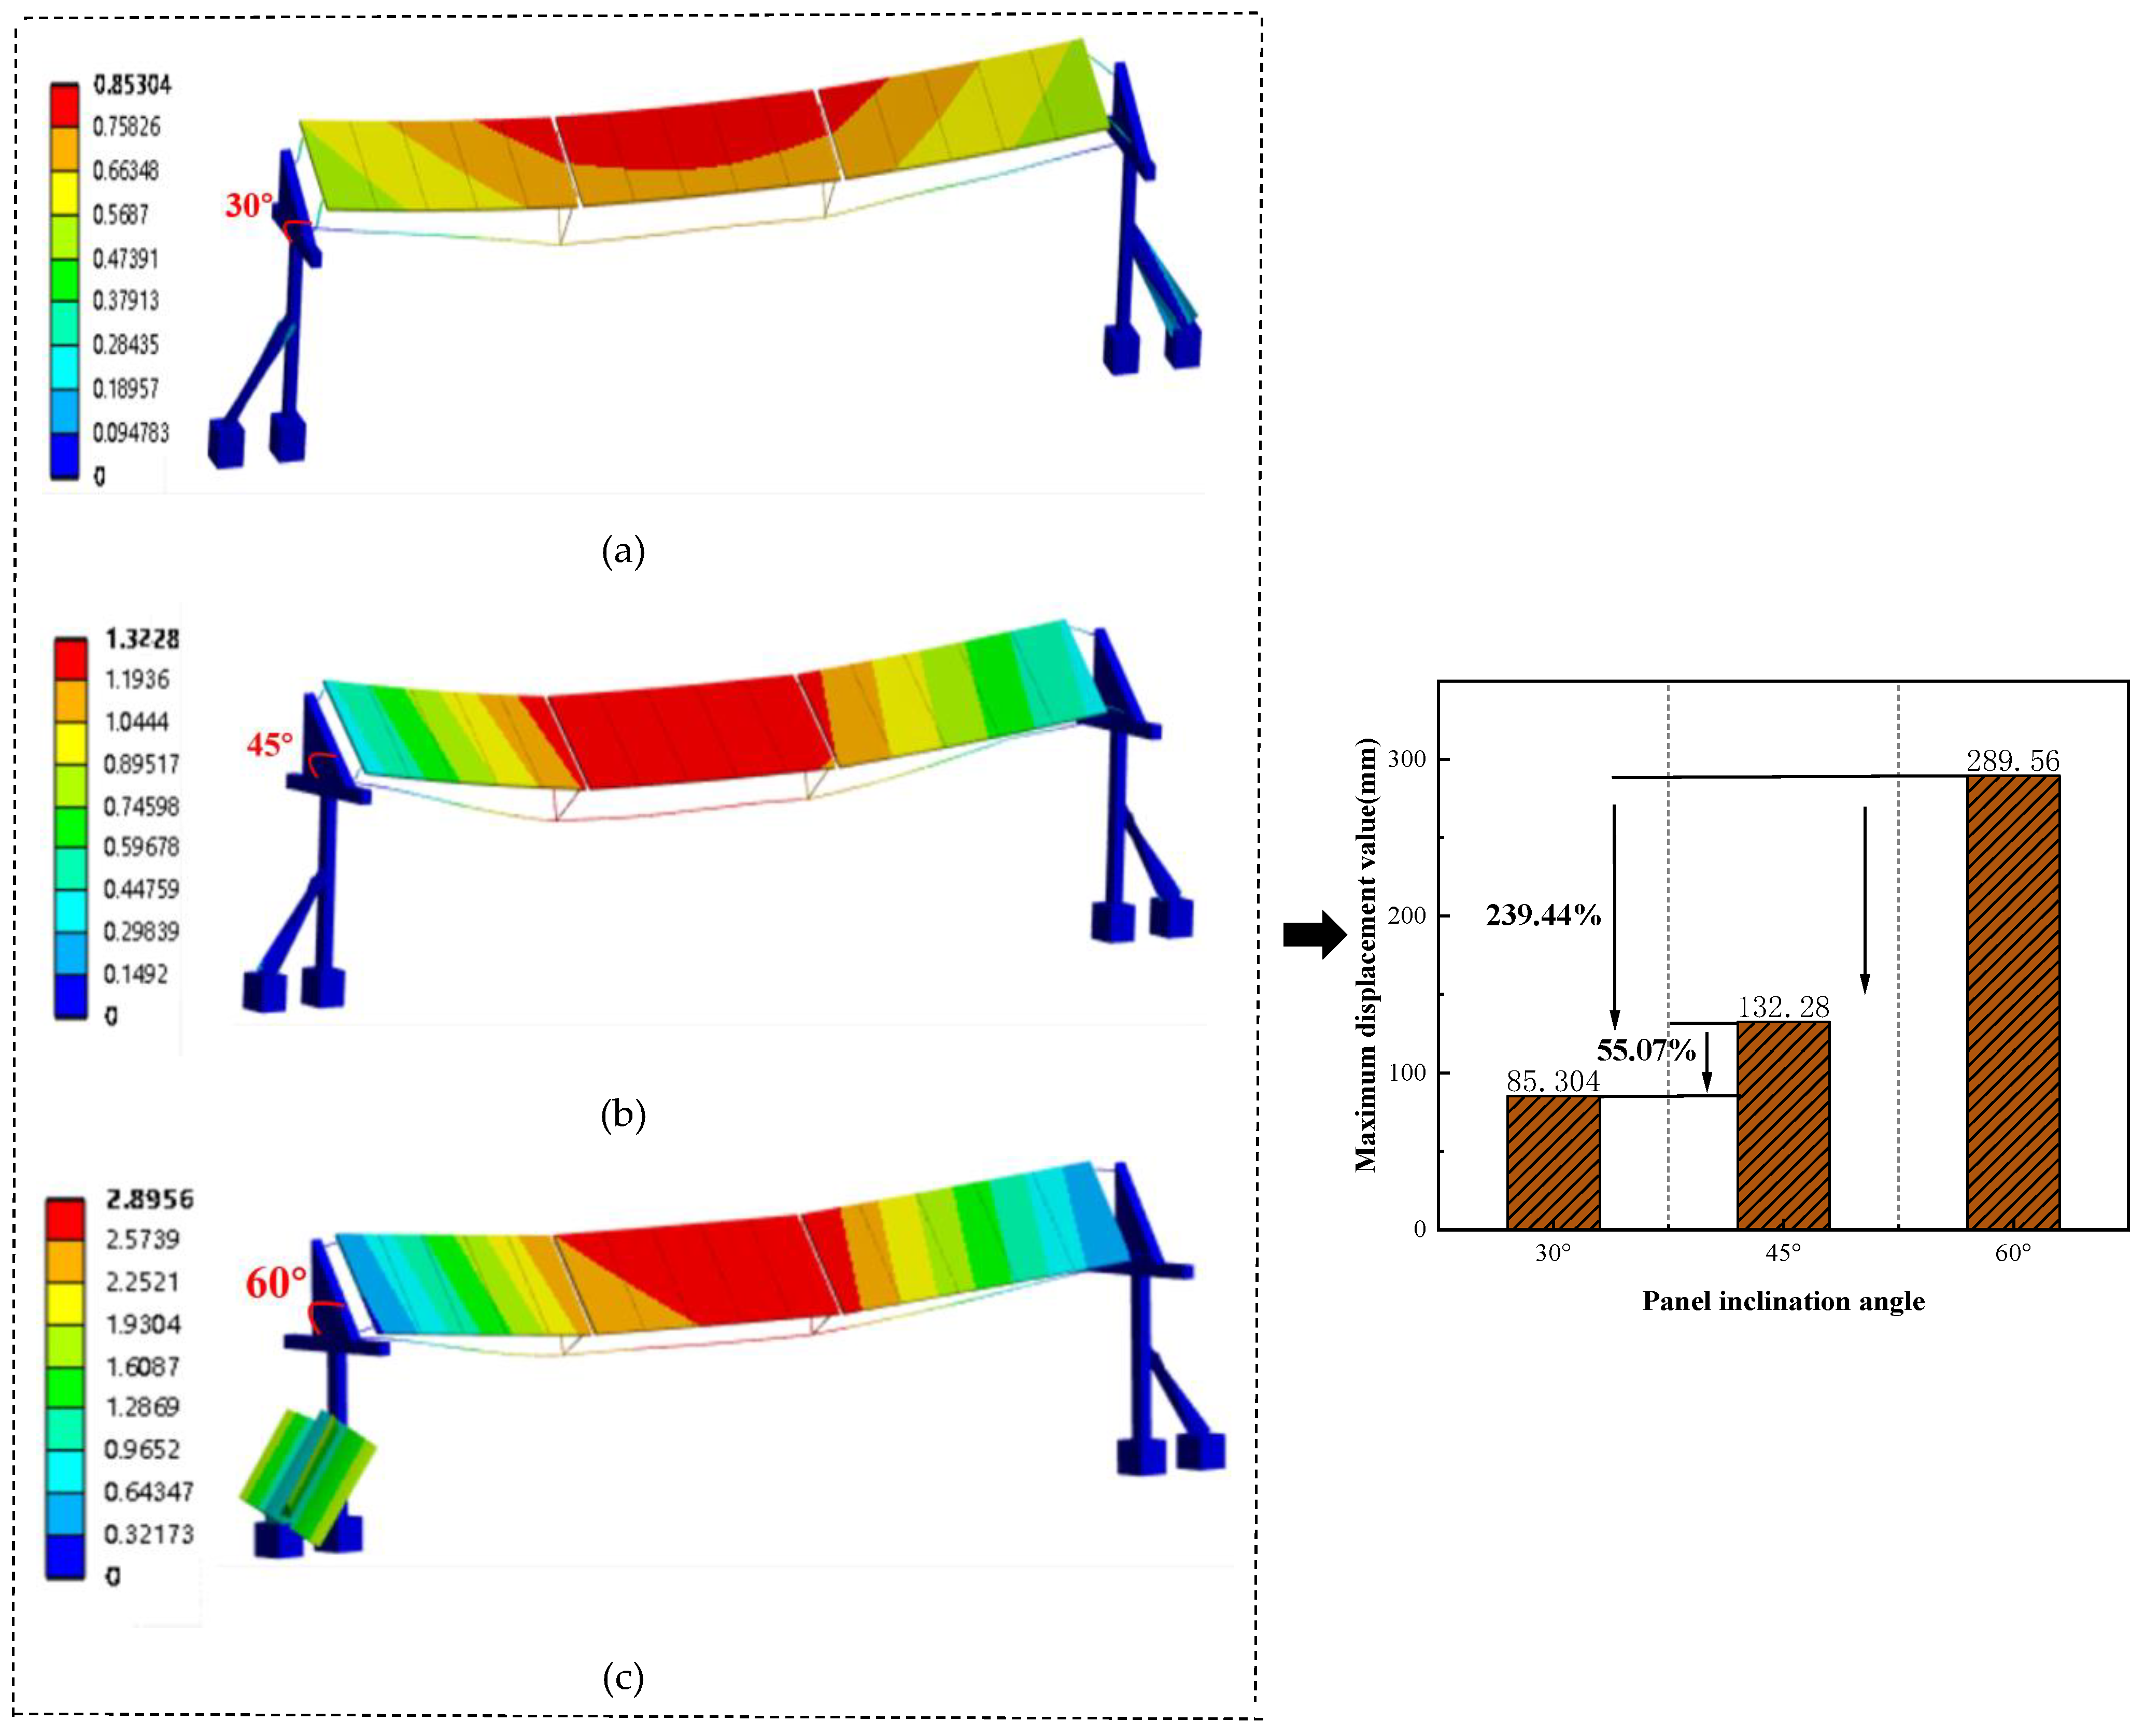
- Panel inclination angle
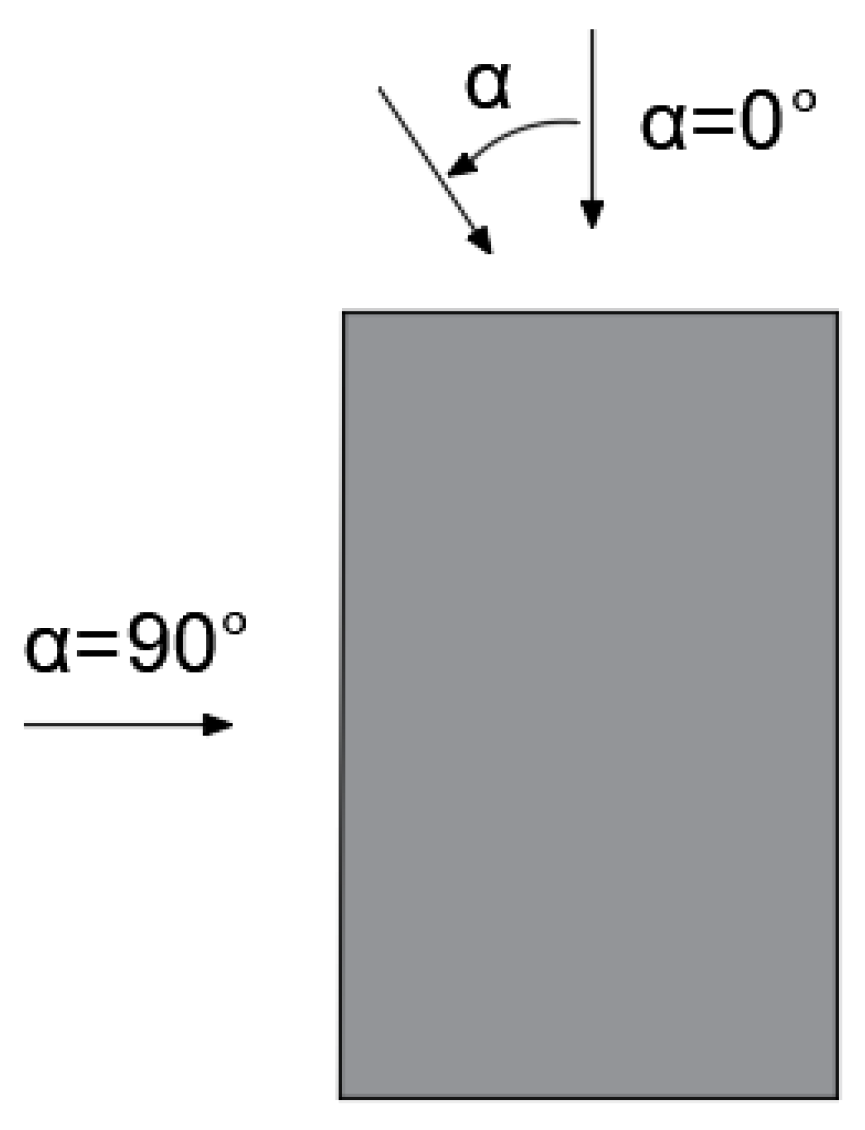
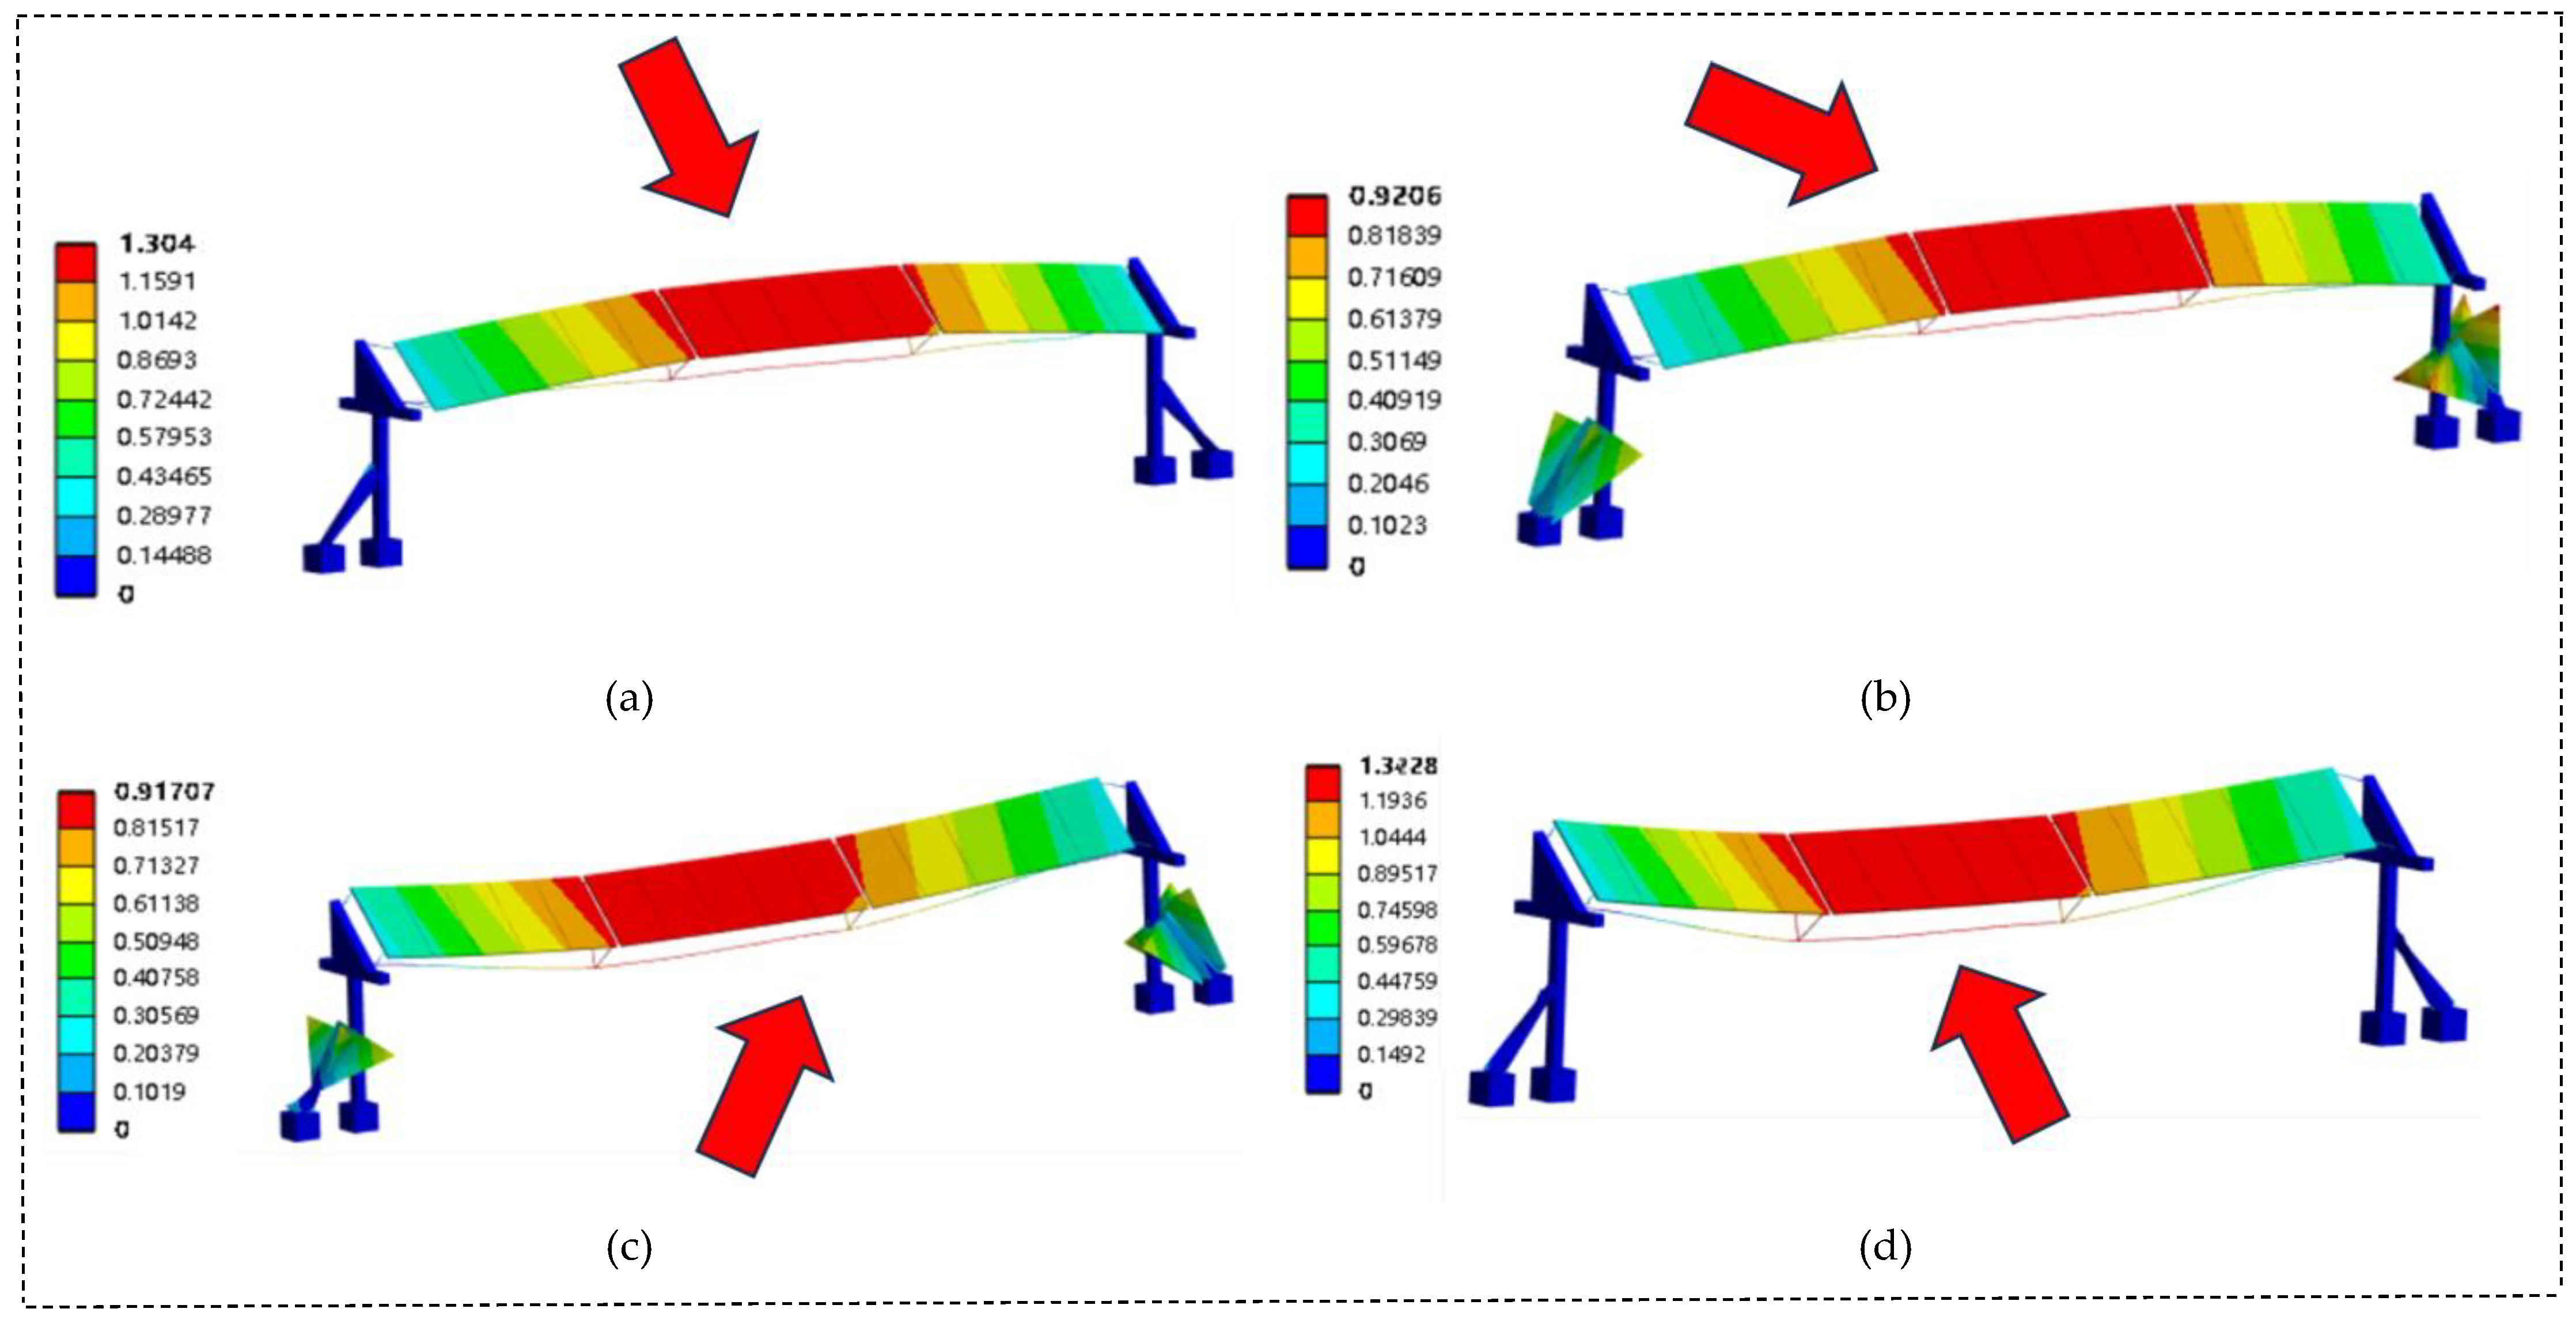
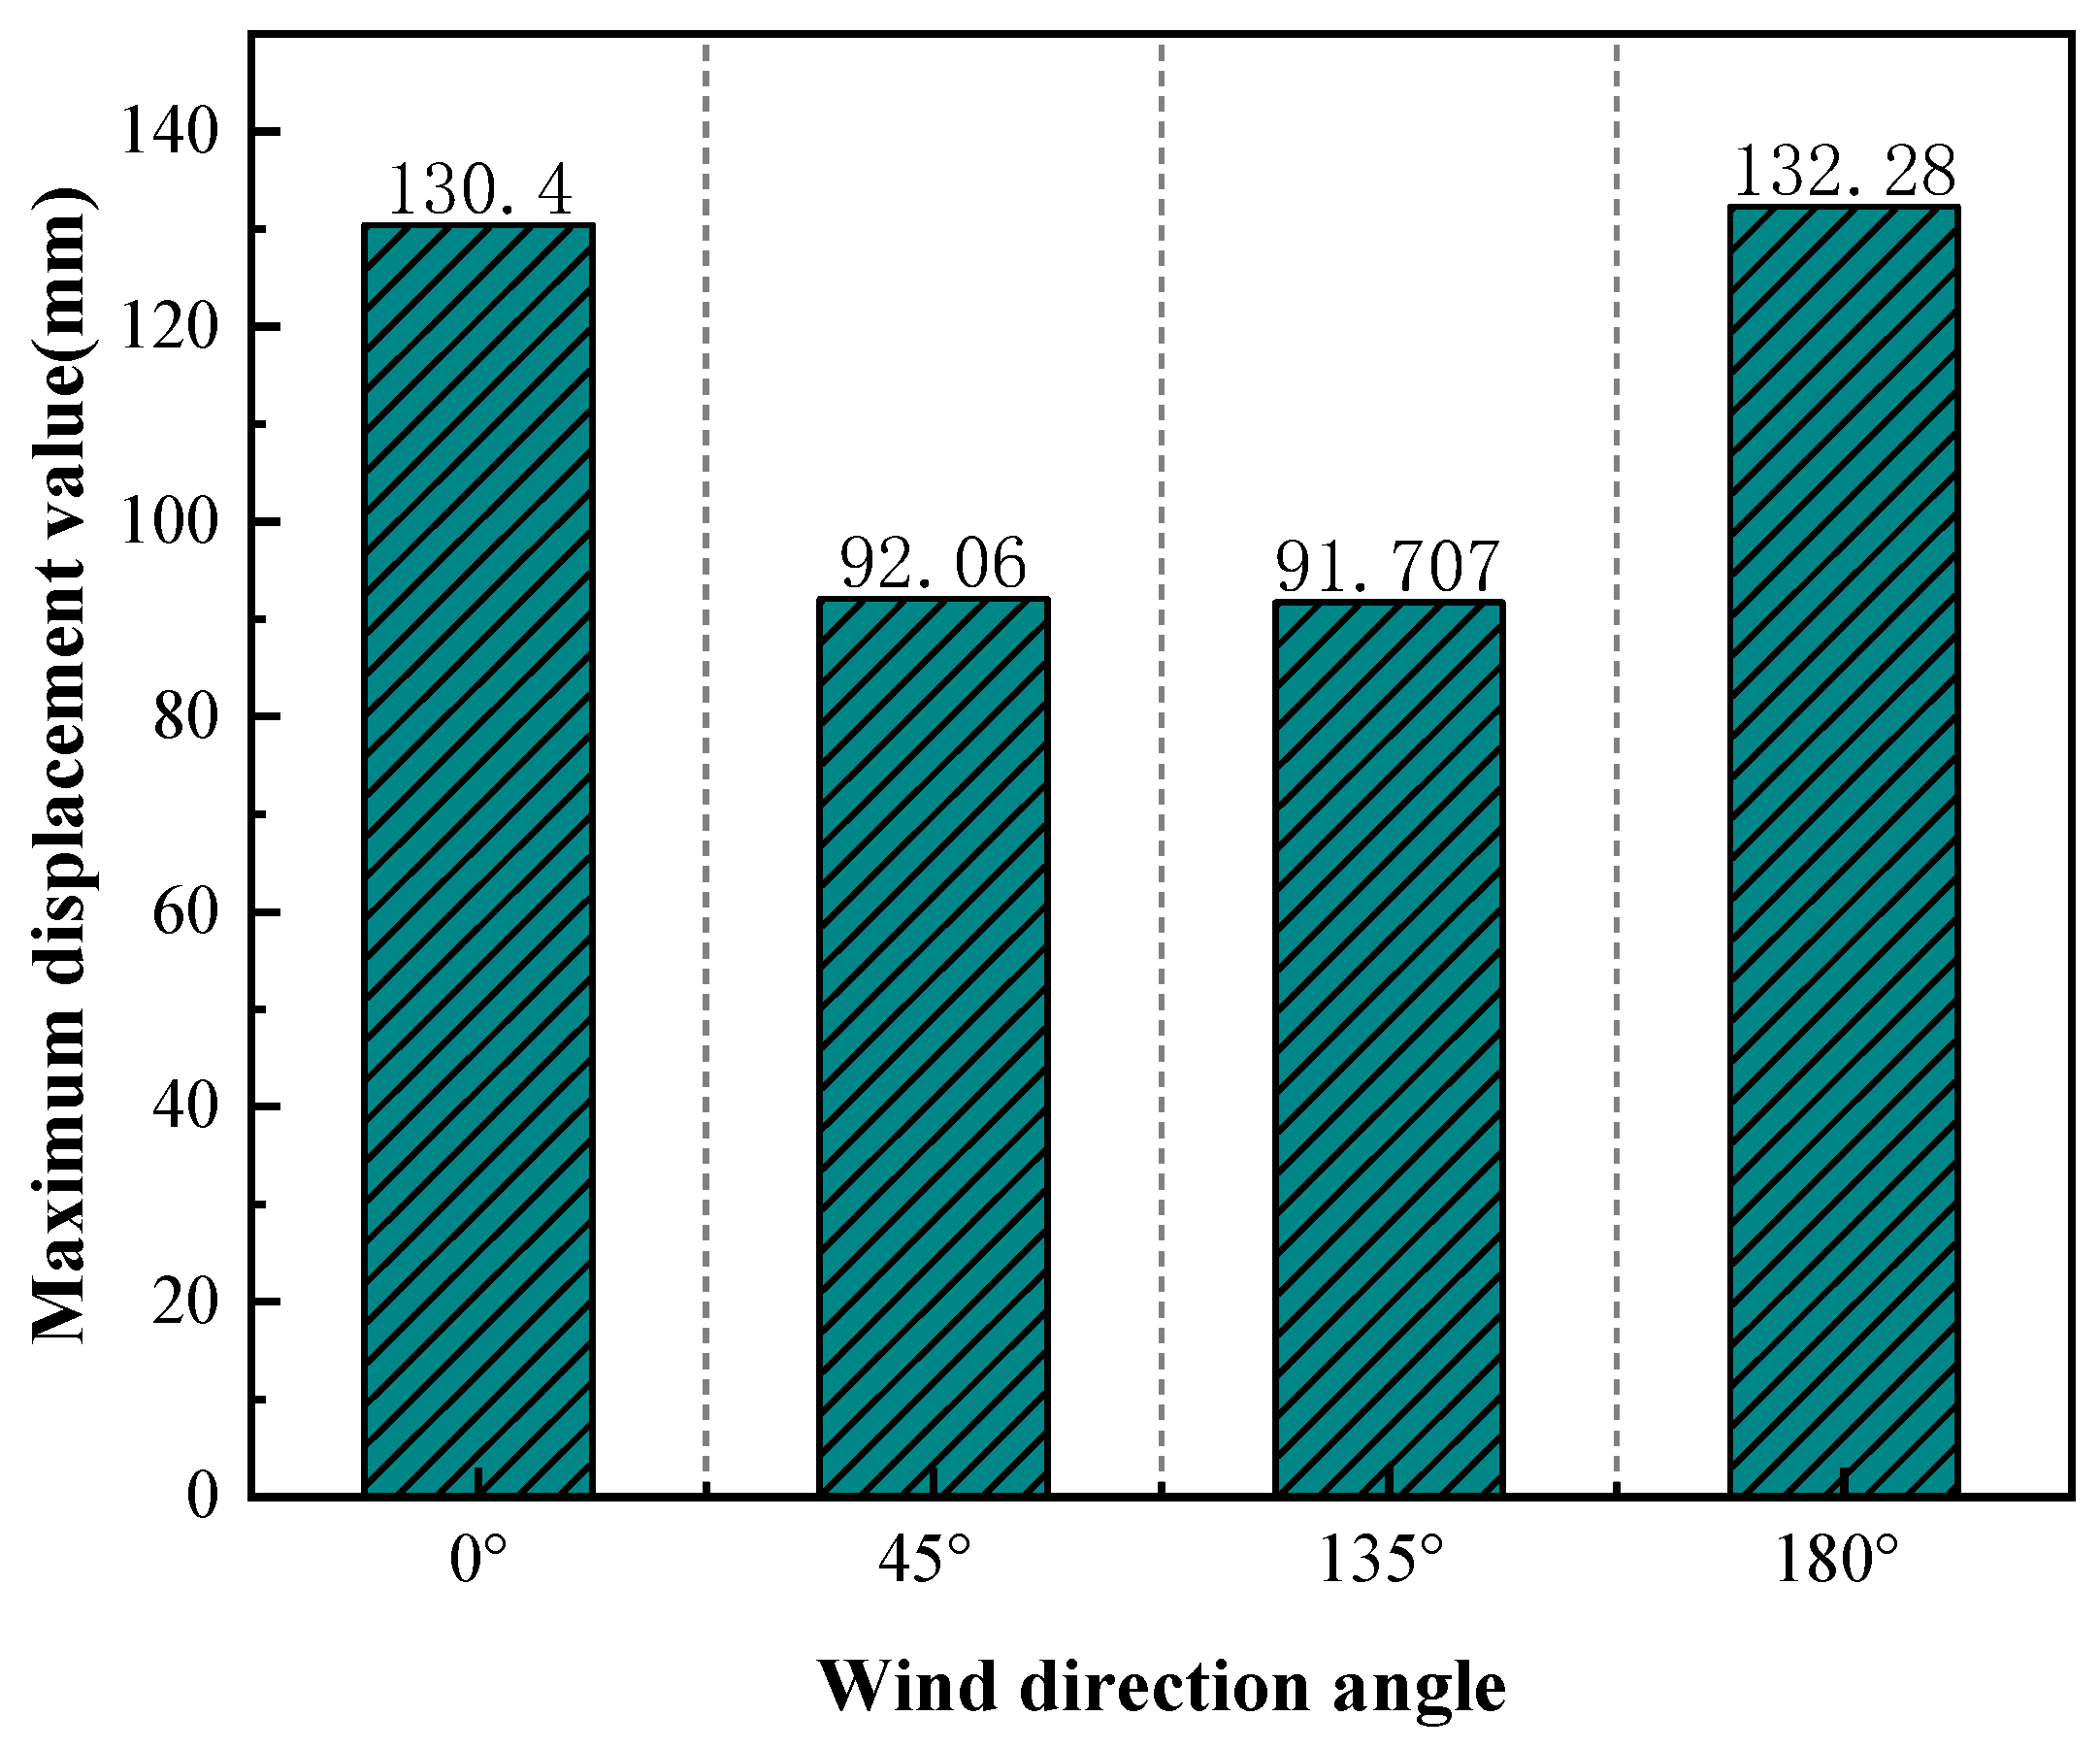
- Wind direction angle
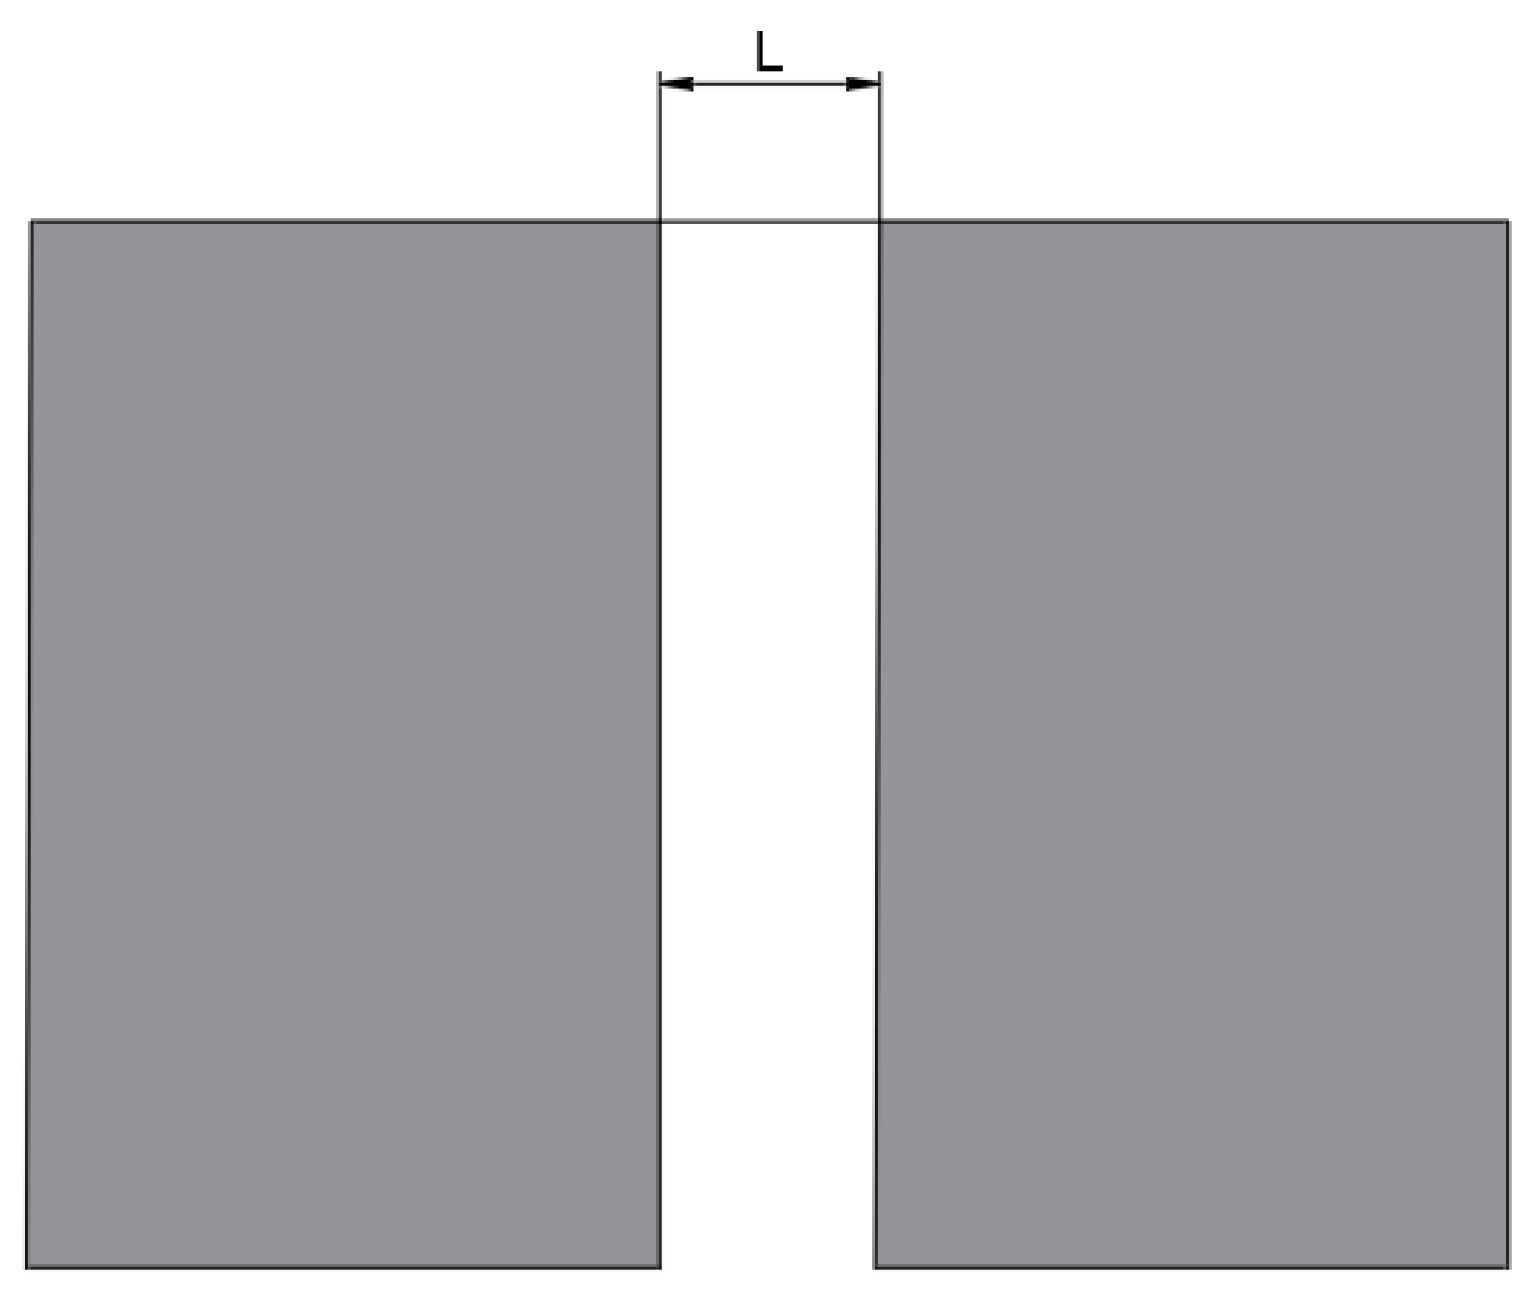
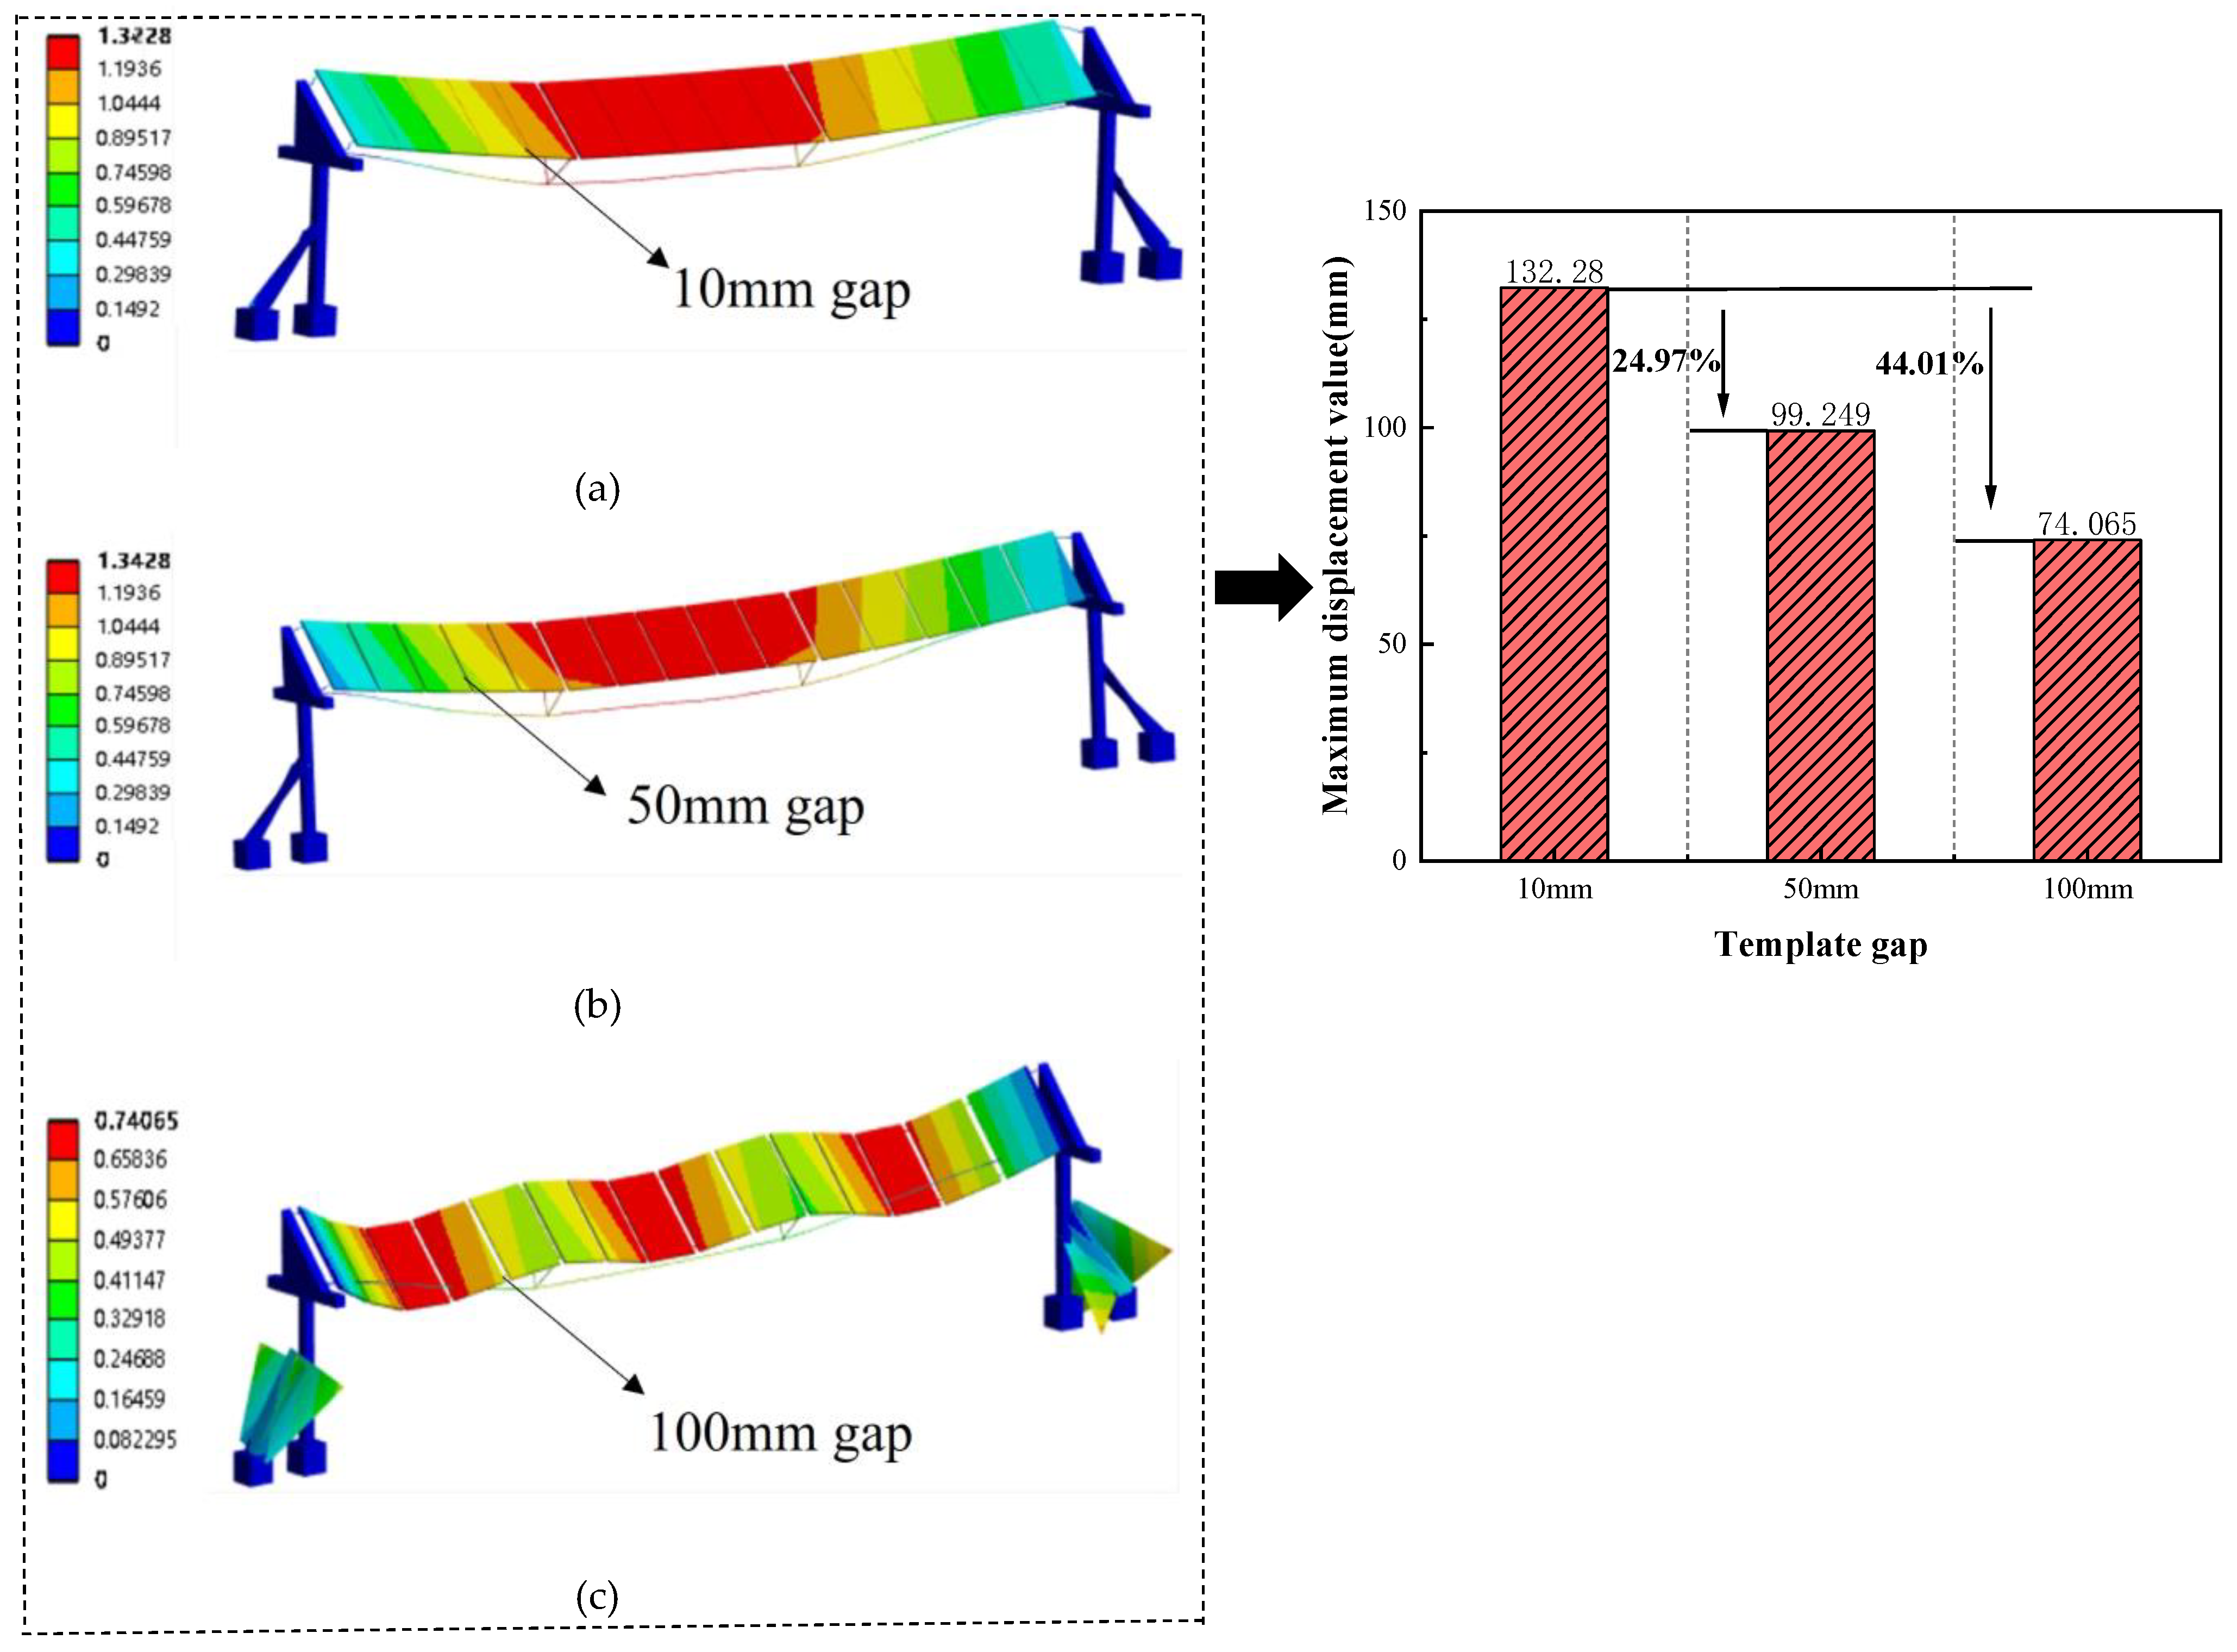
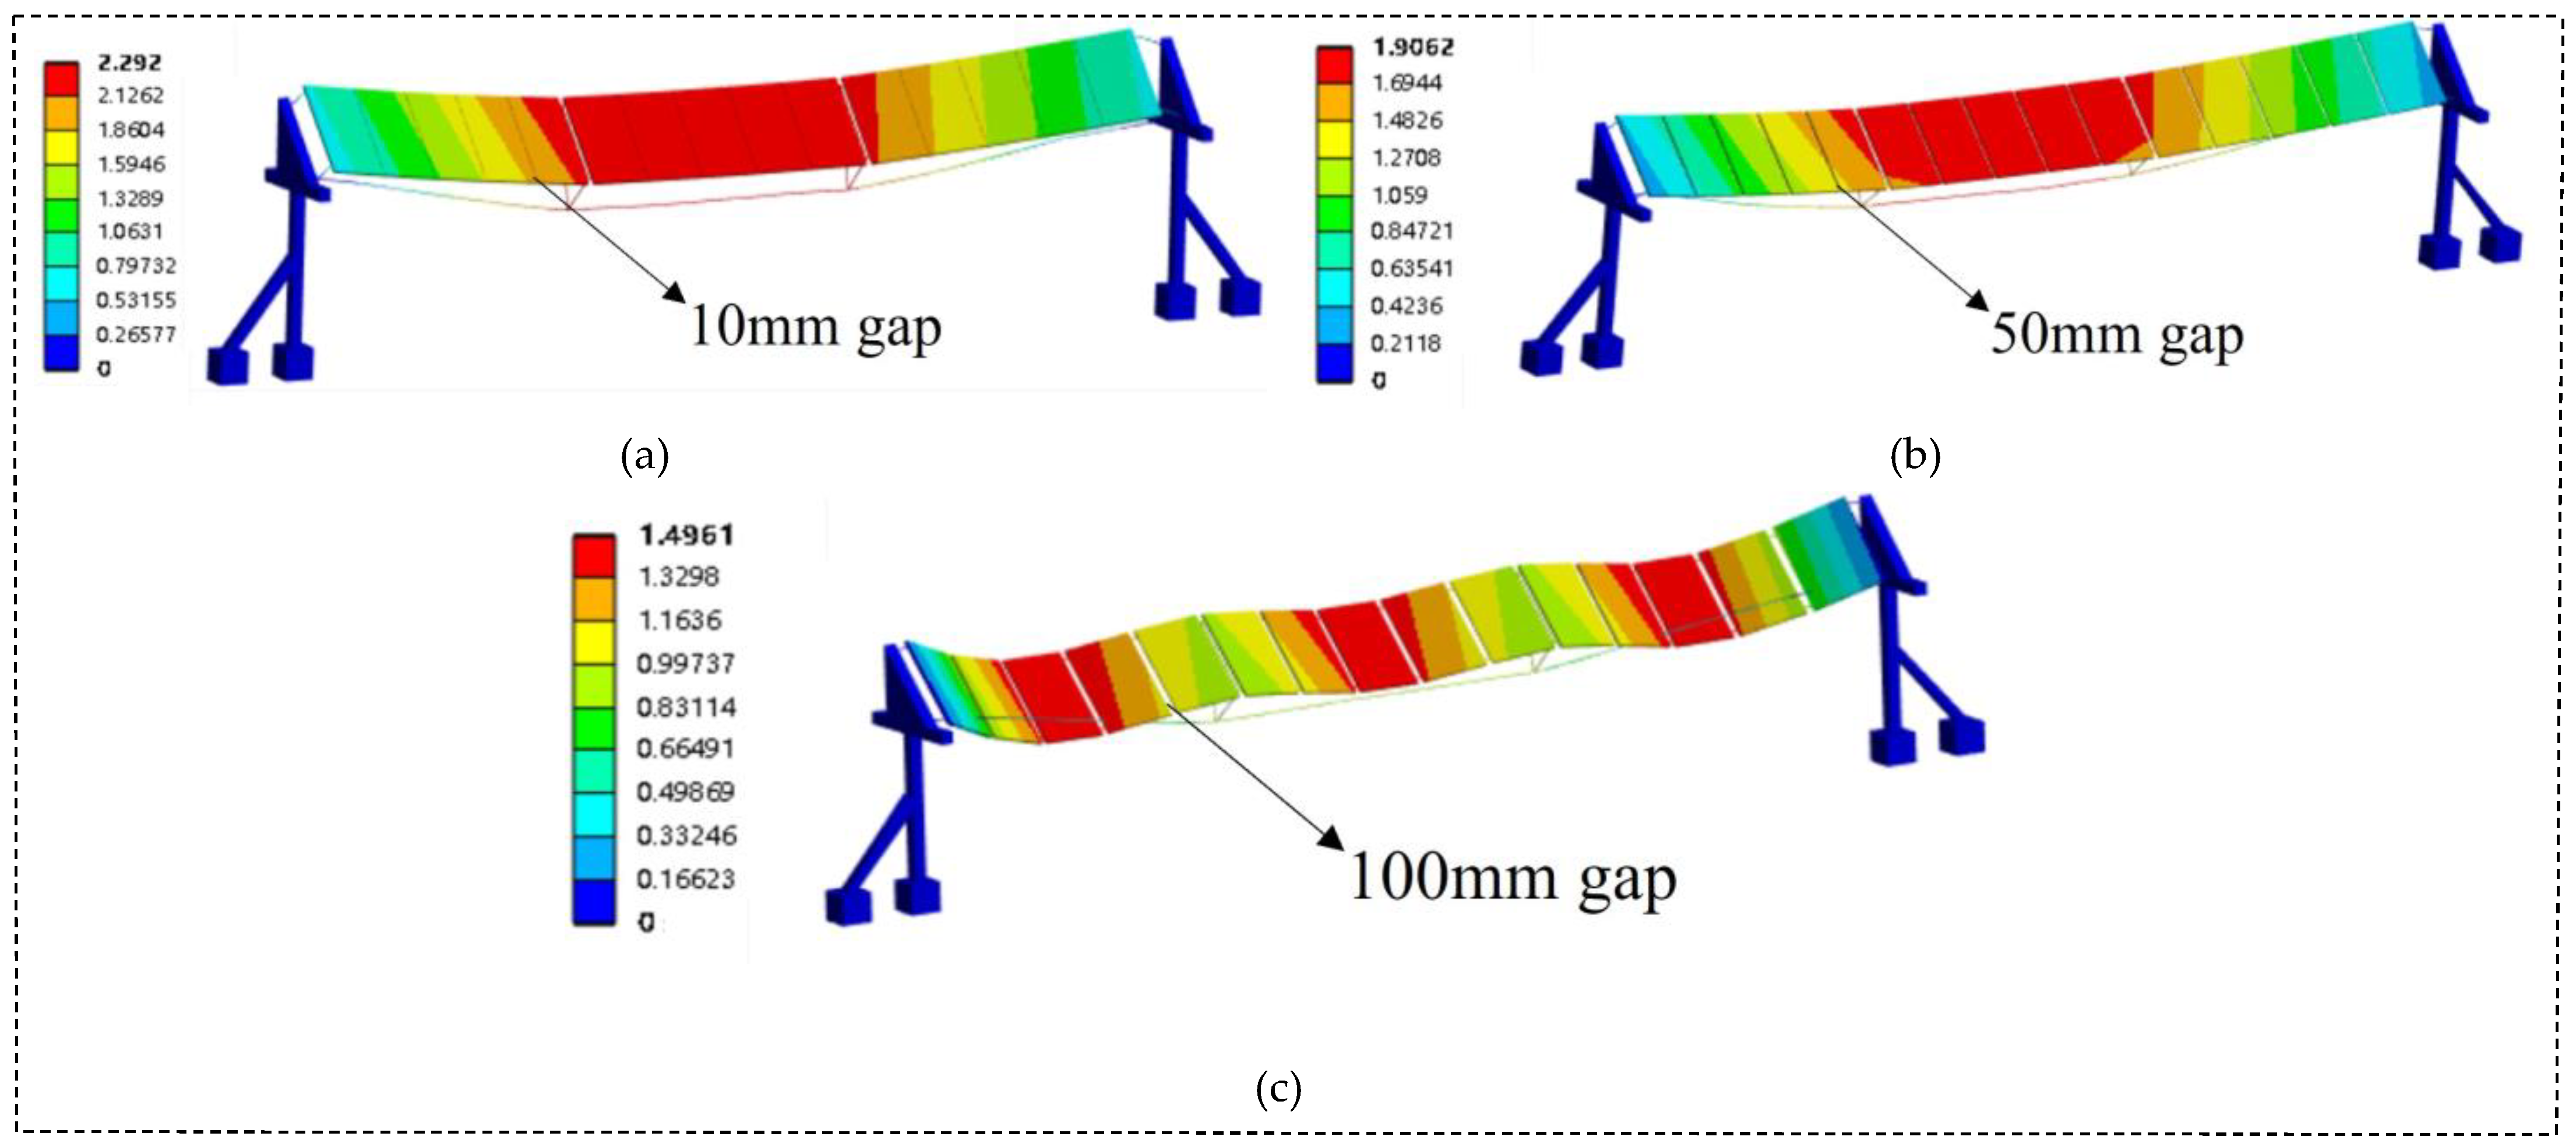
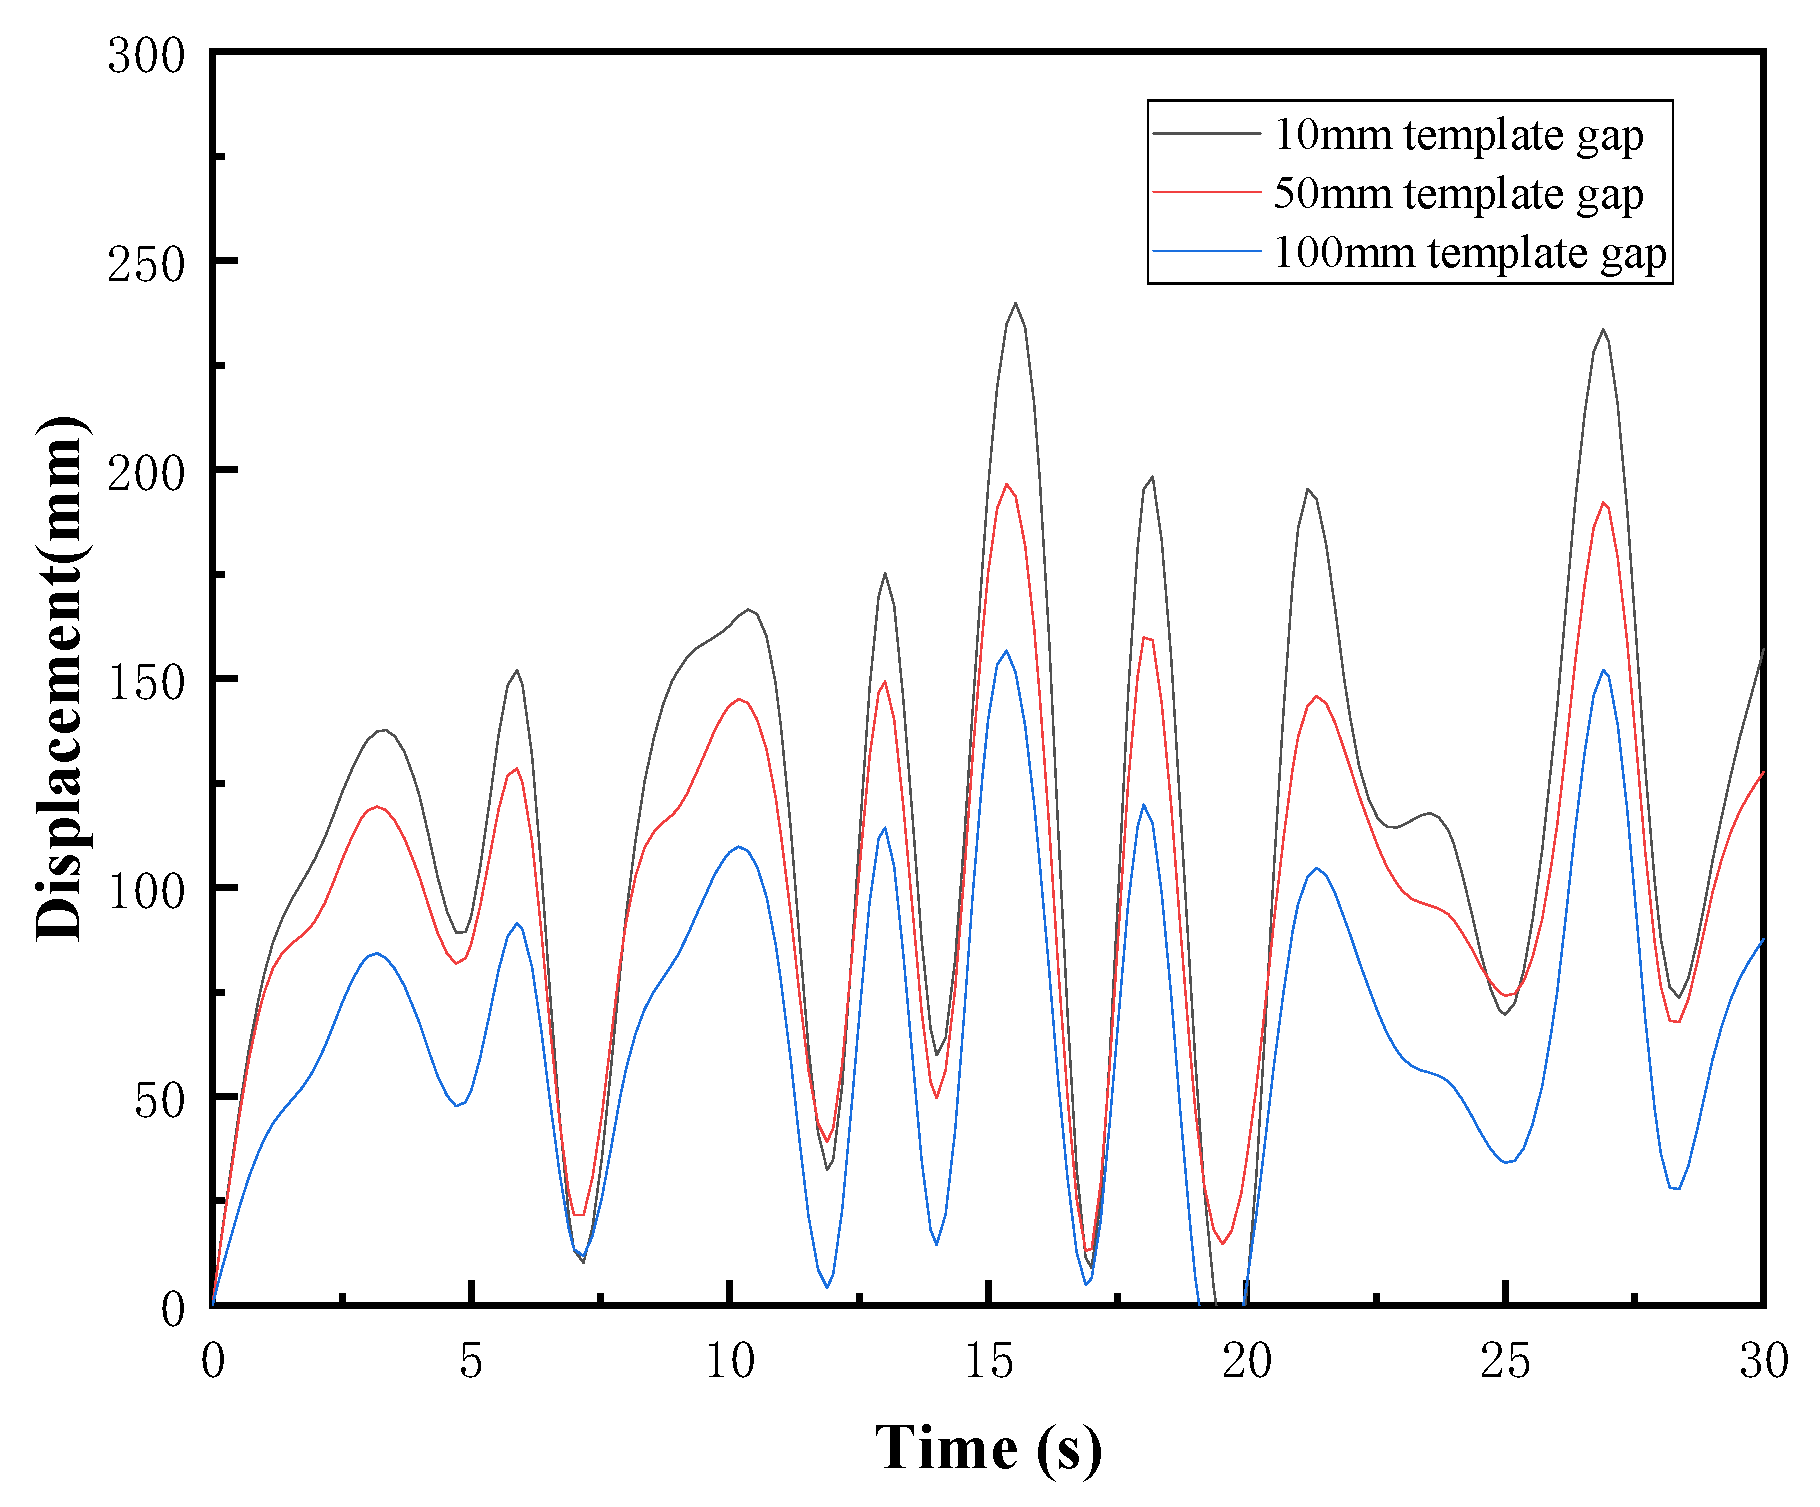
- Template gap
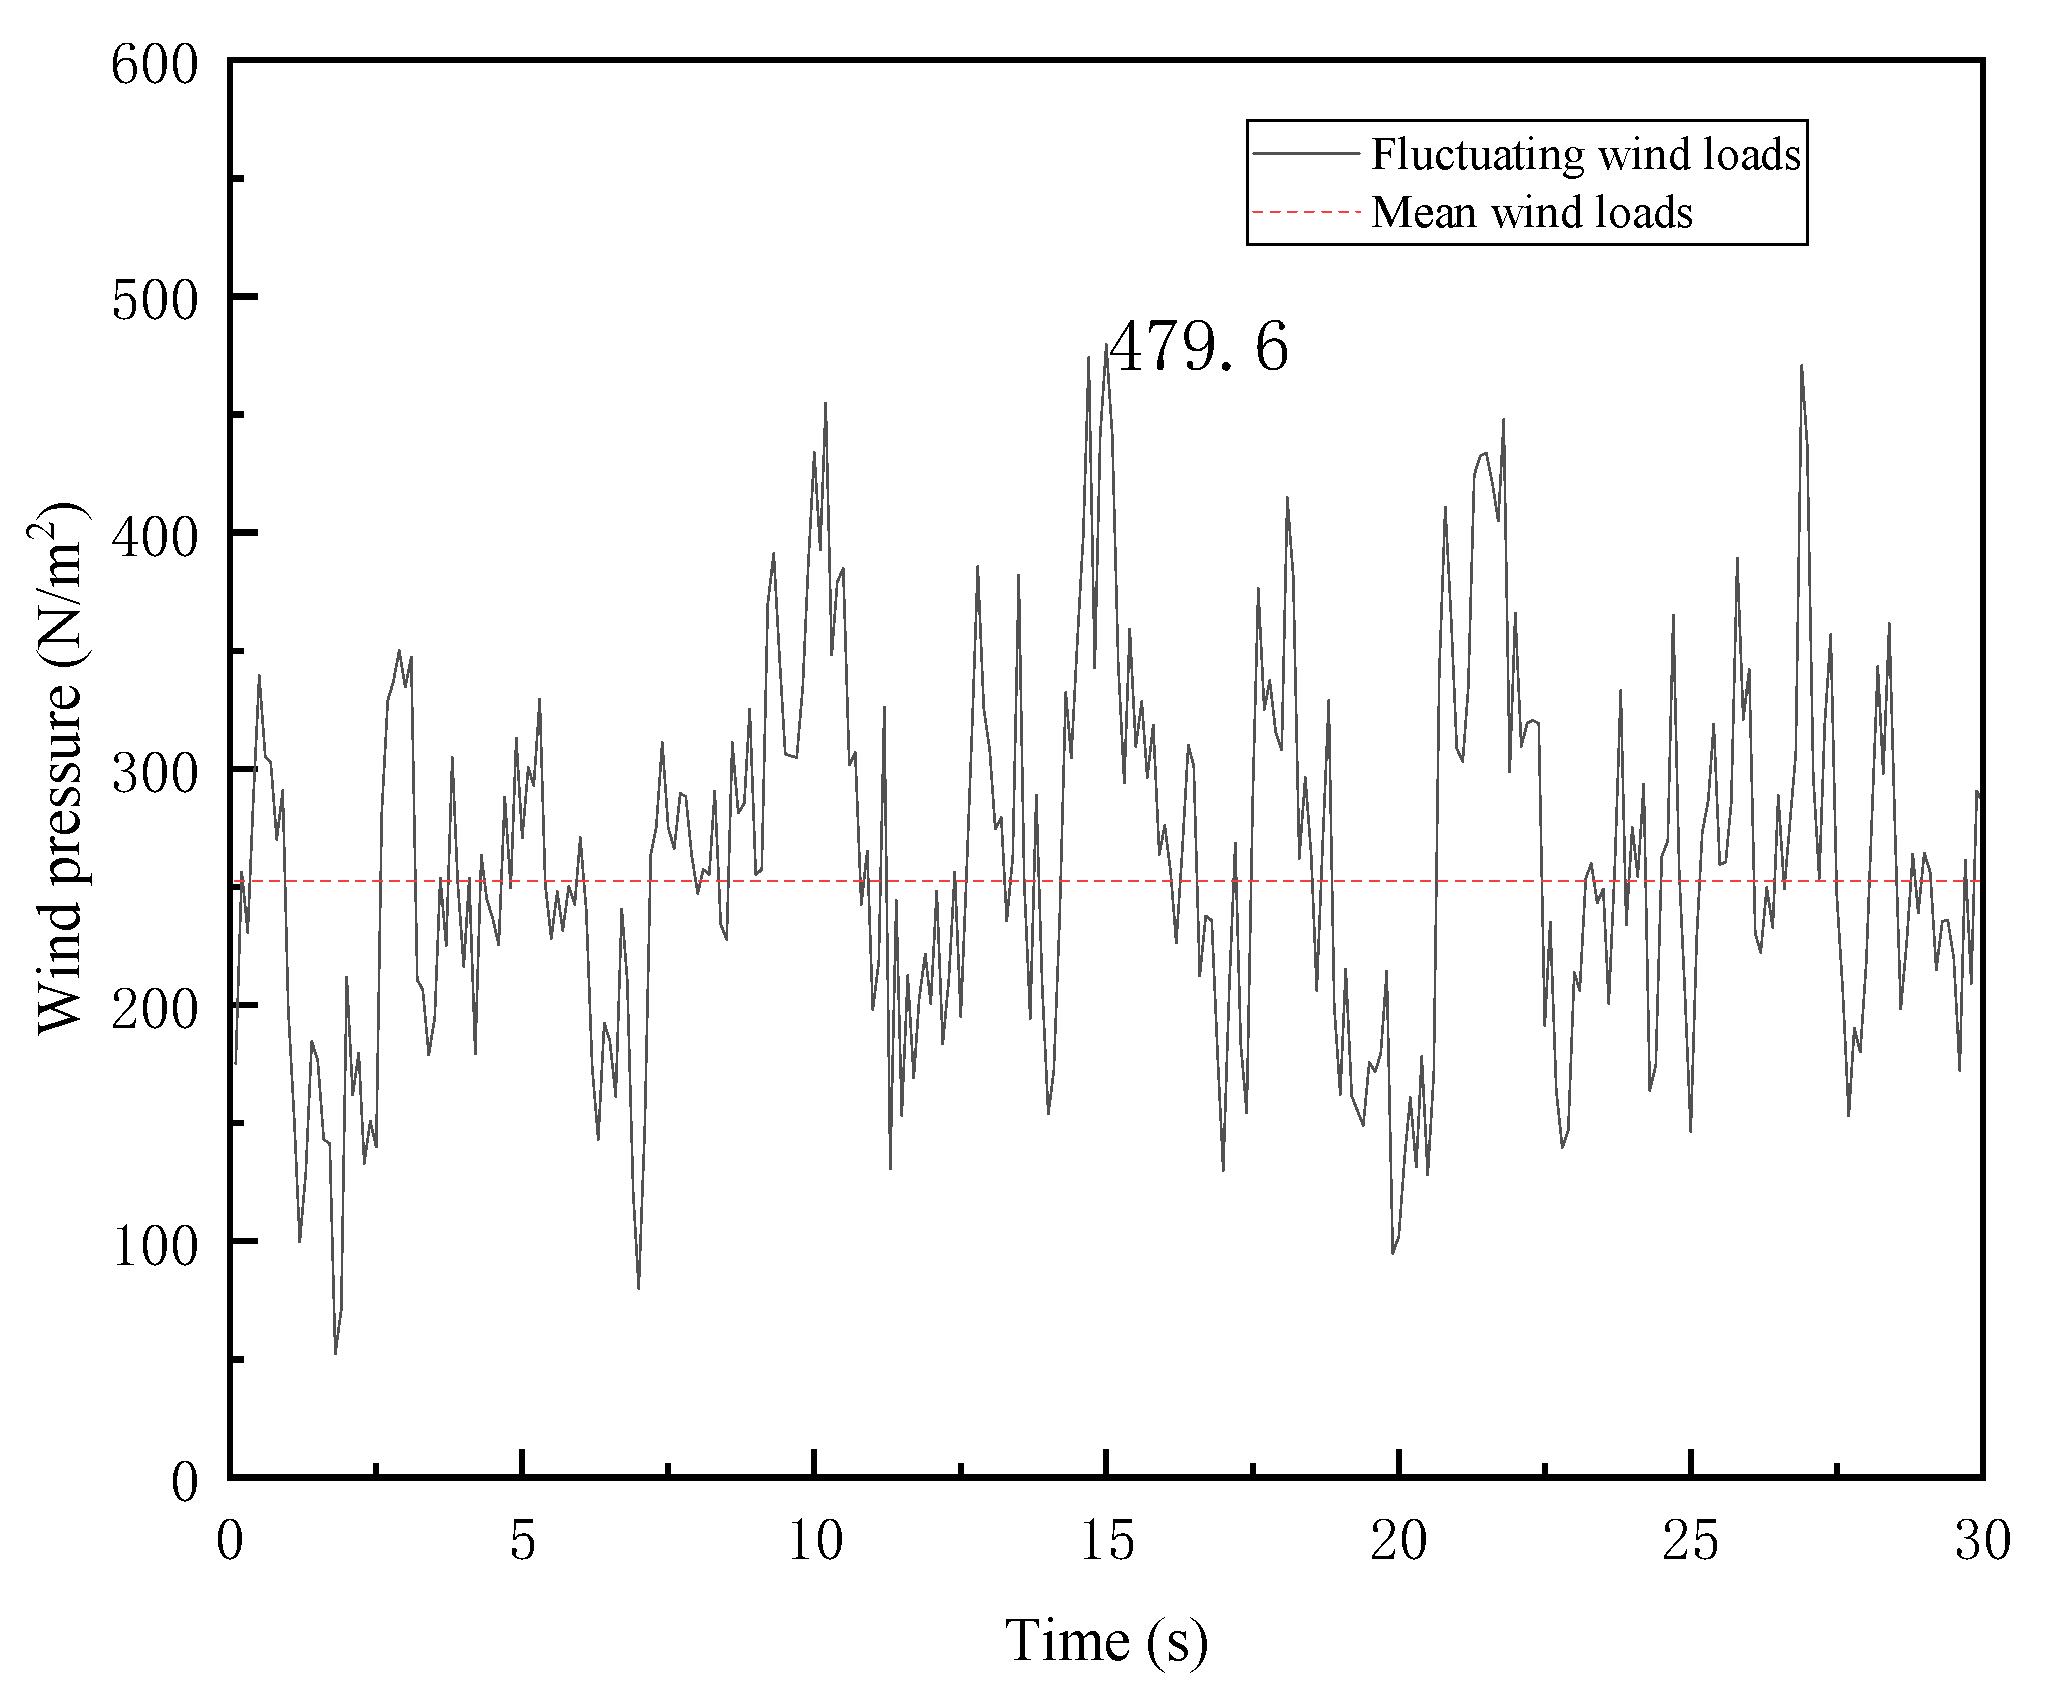
2.3.2. Fluctuating Wind Load
Force-Bearing Safety
Fatigue Life Evaluation
Wind-Induced Response
- Panel inclination angle
- Wind direction angle
- Template gap
3. Conclusions
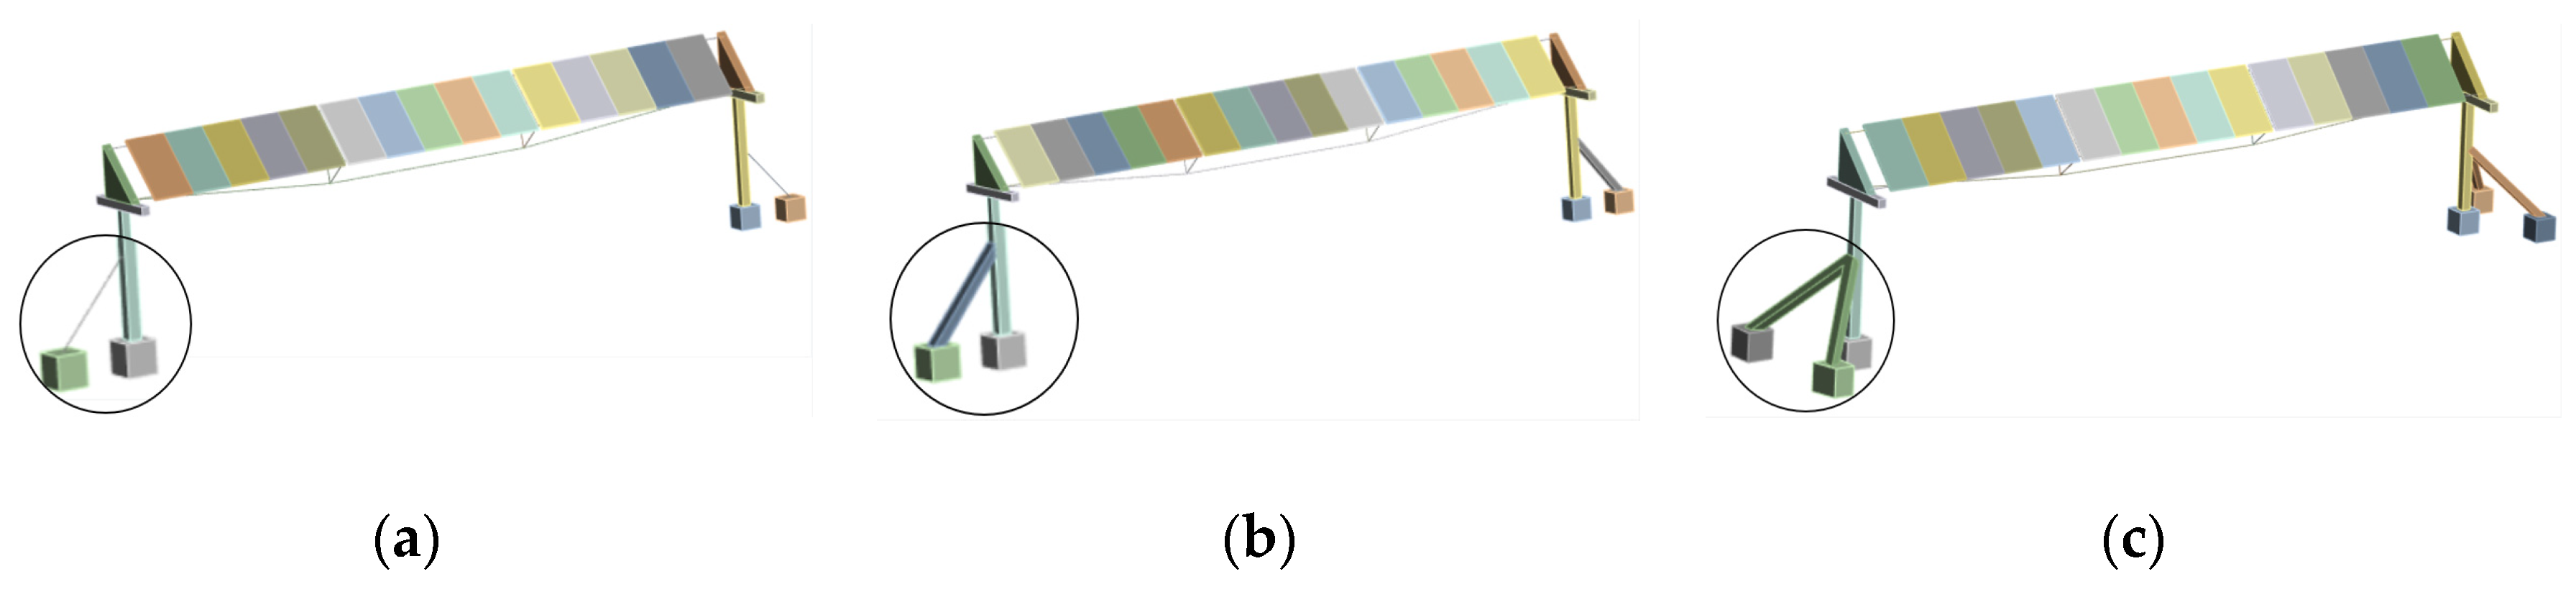
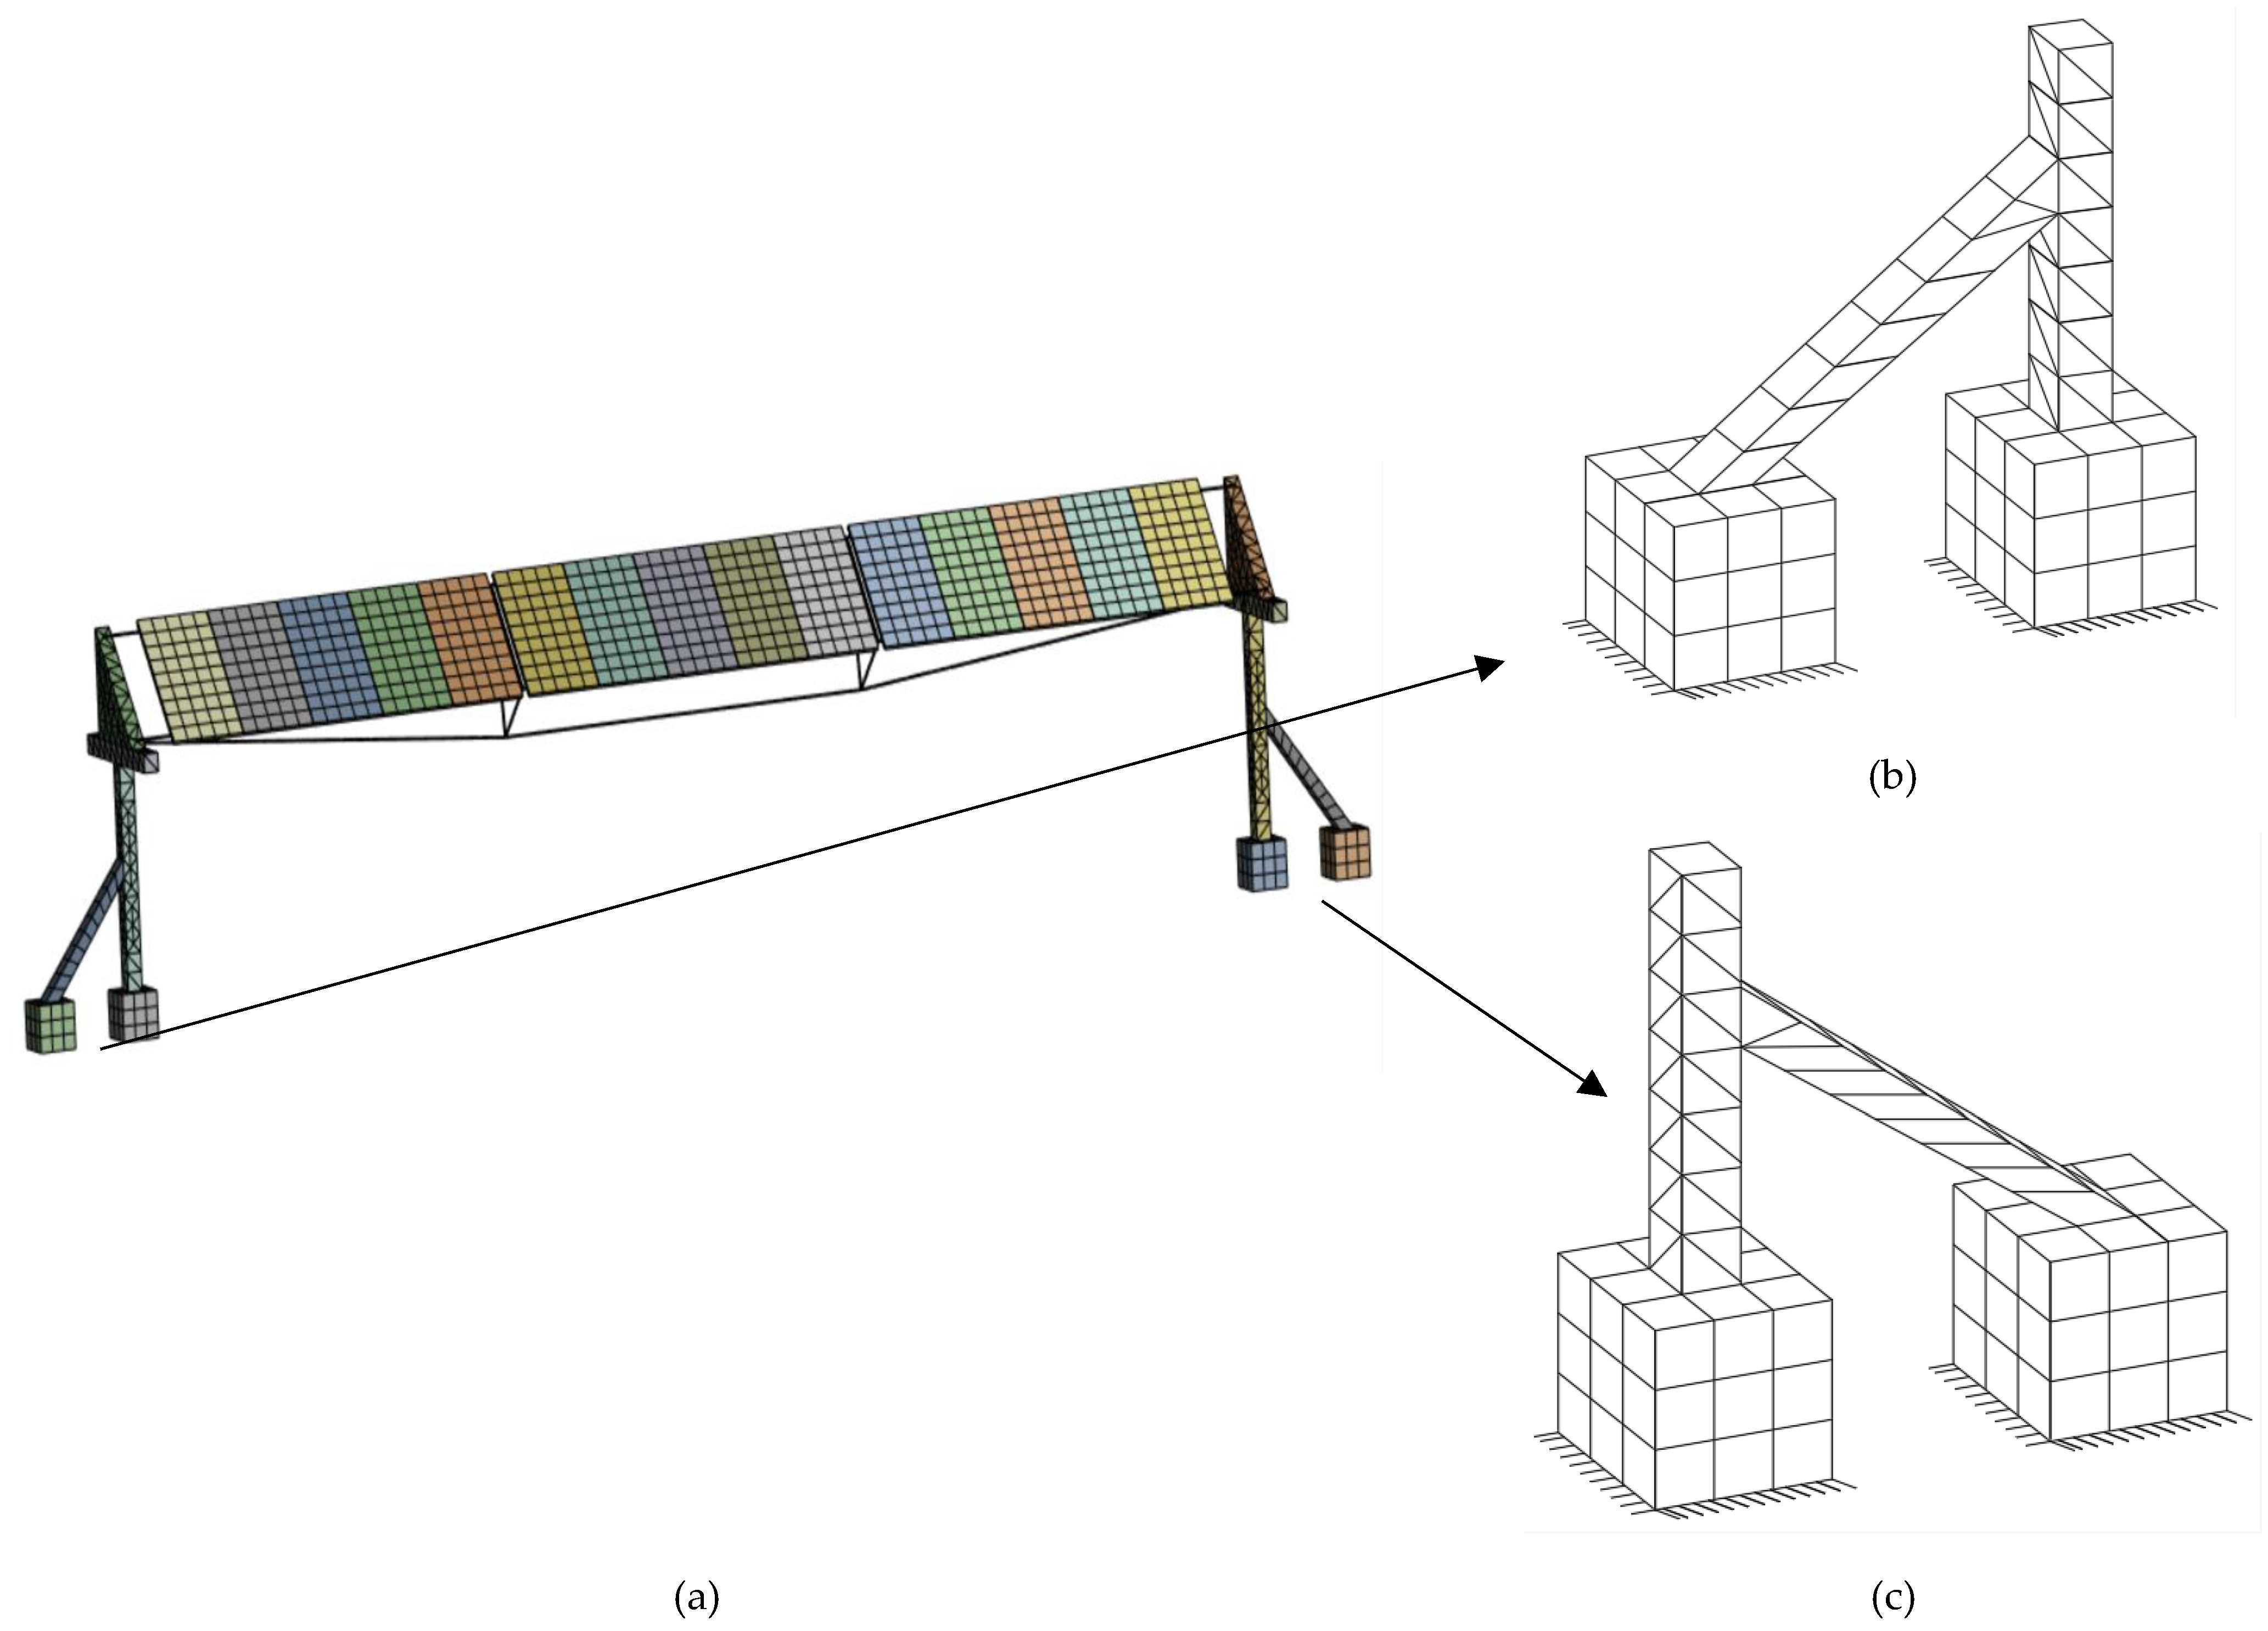
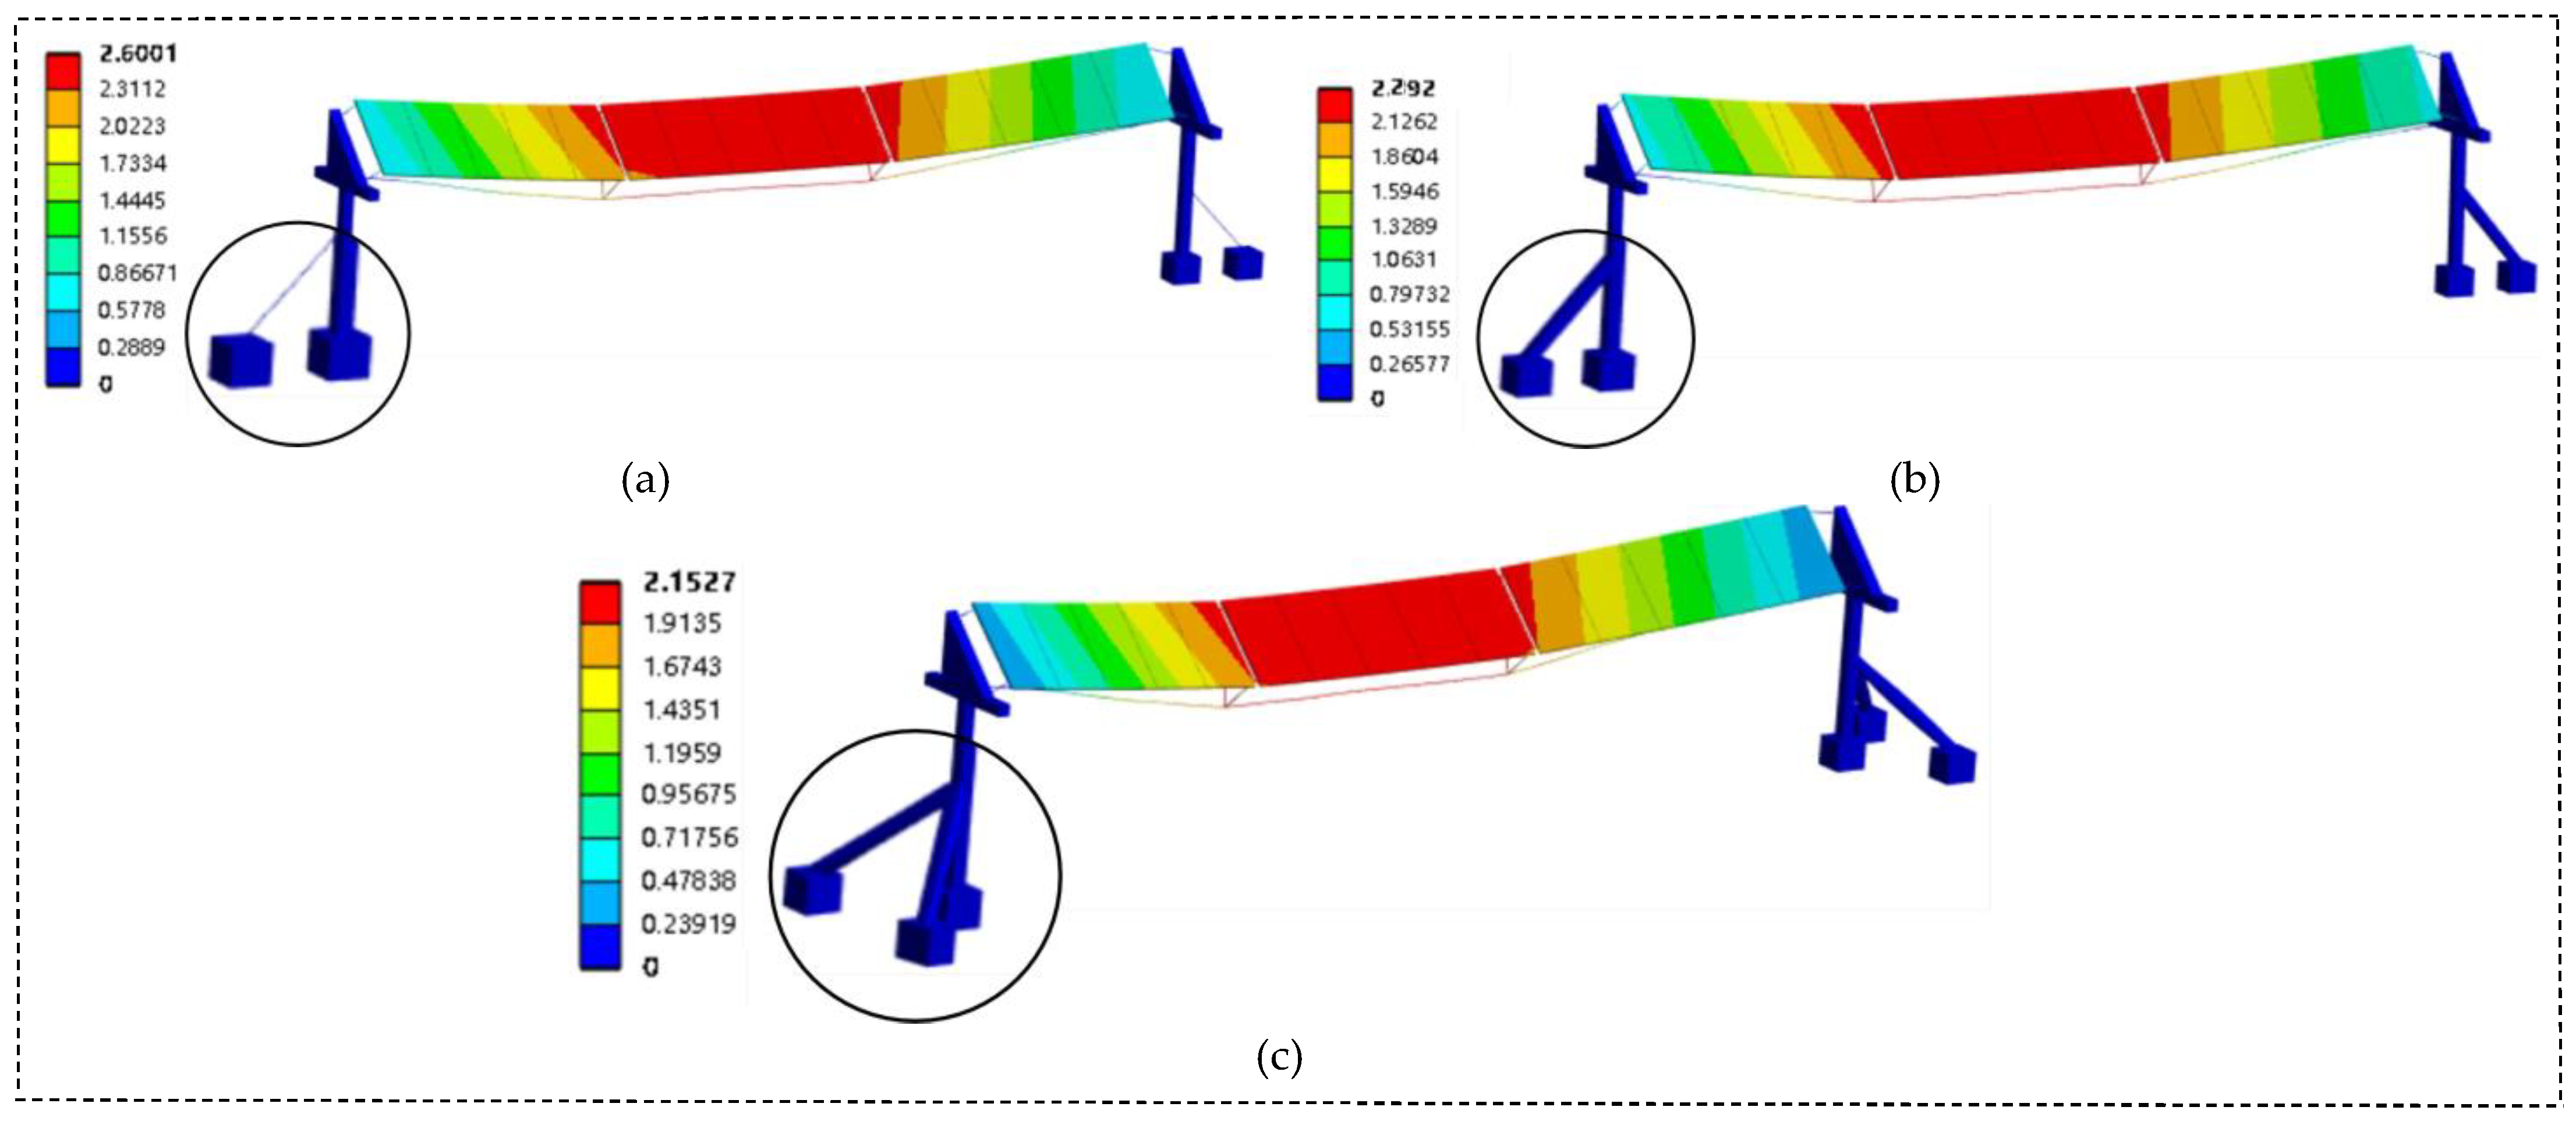
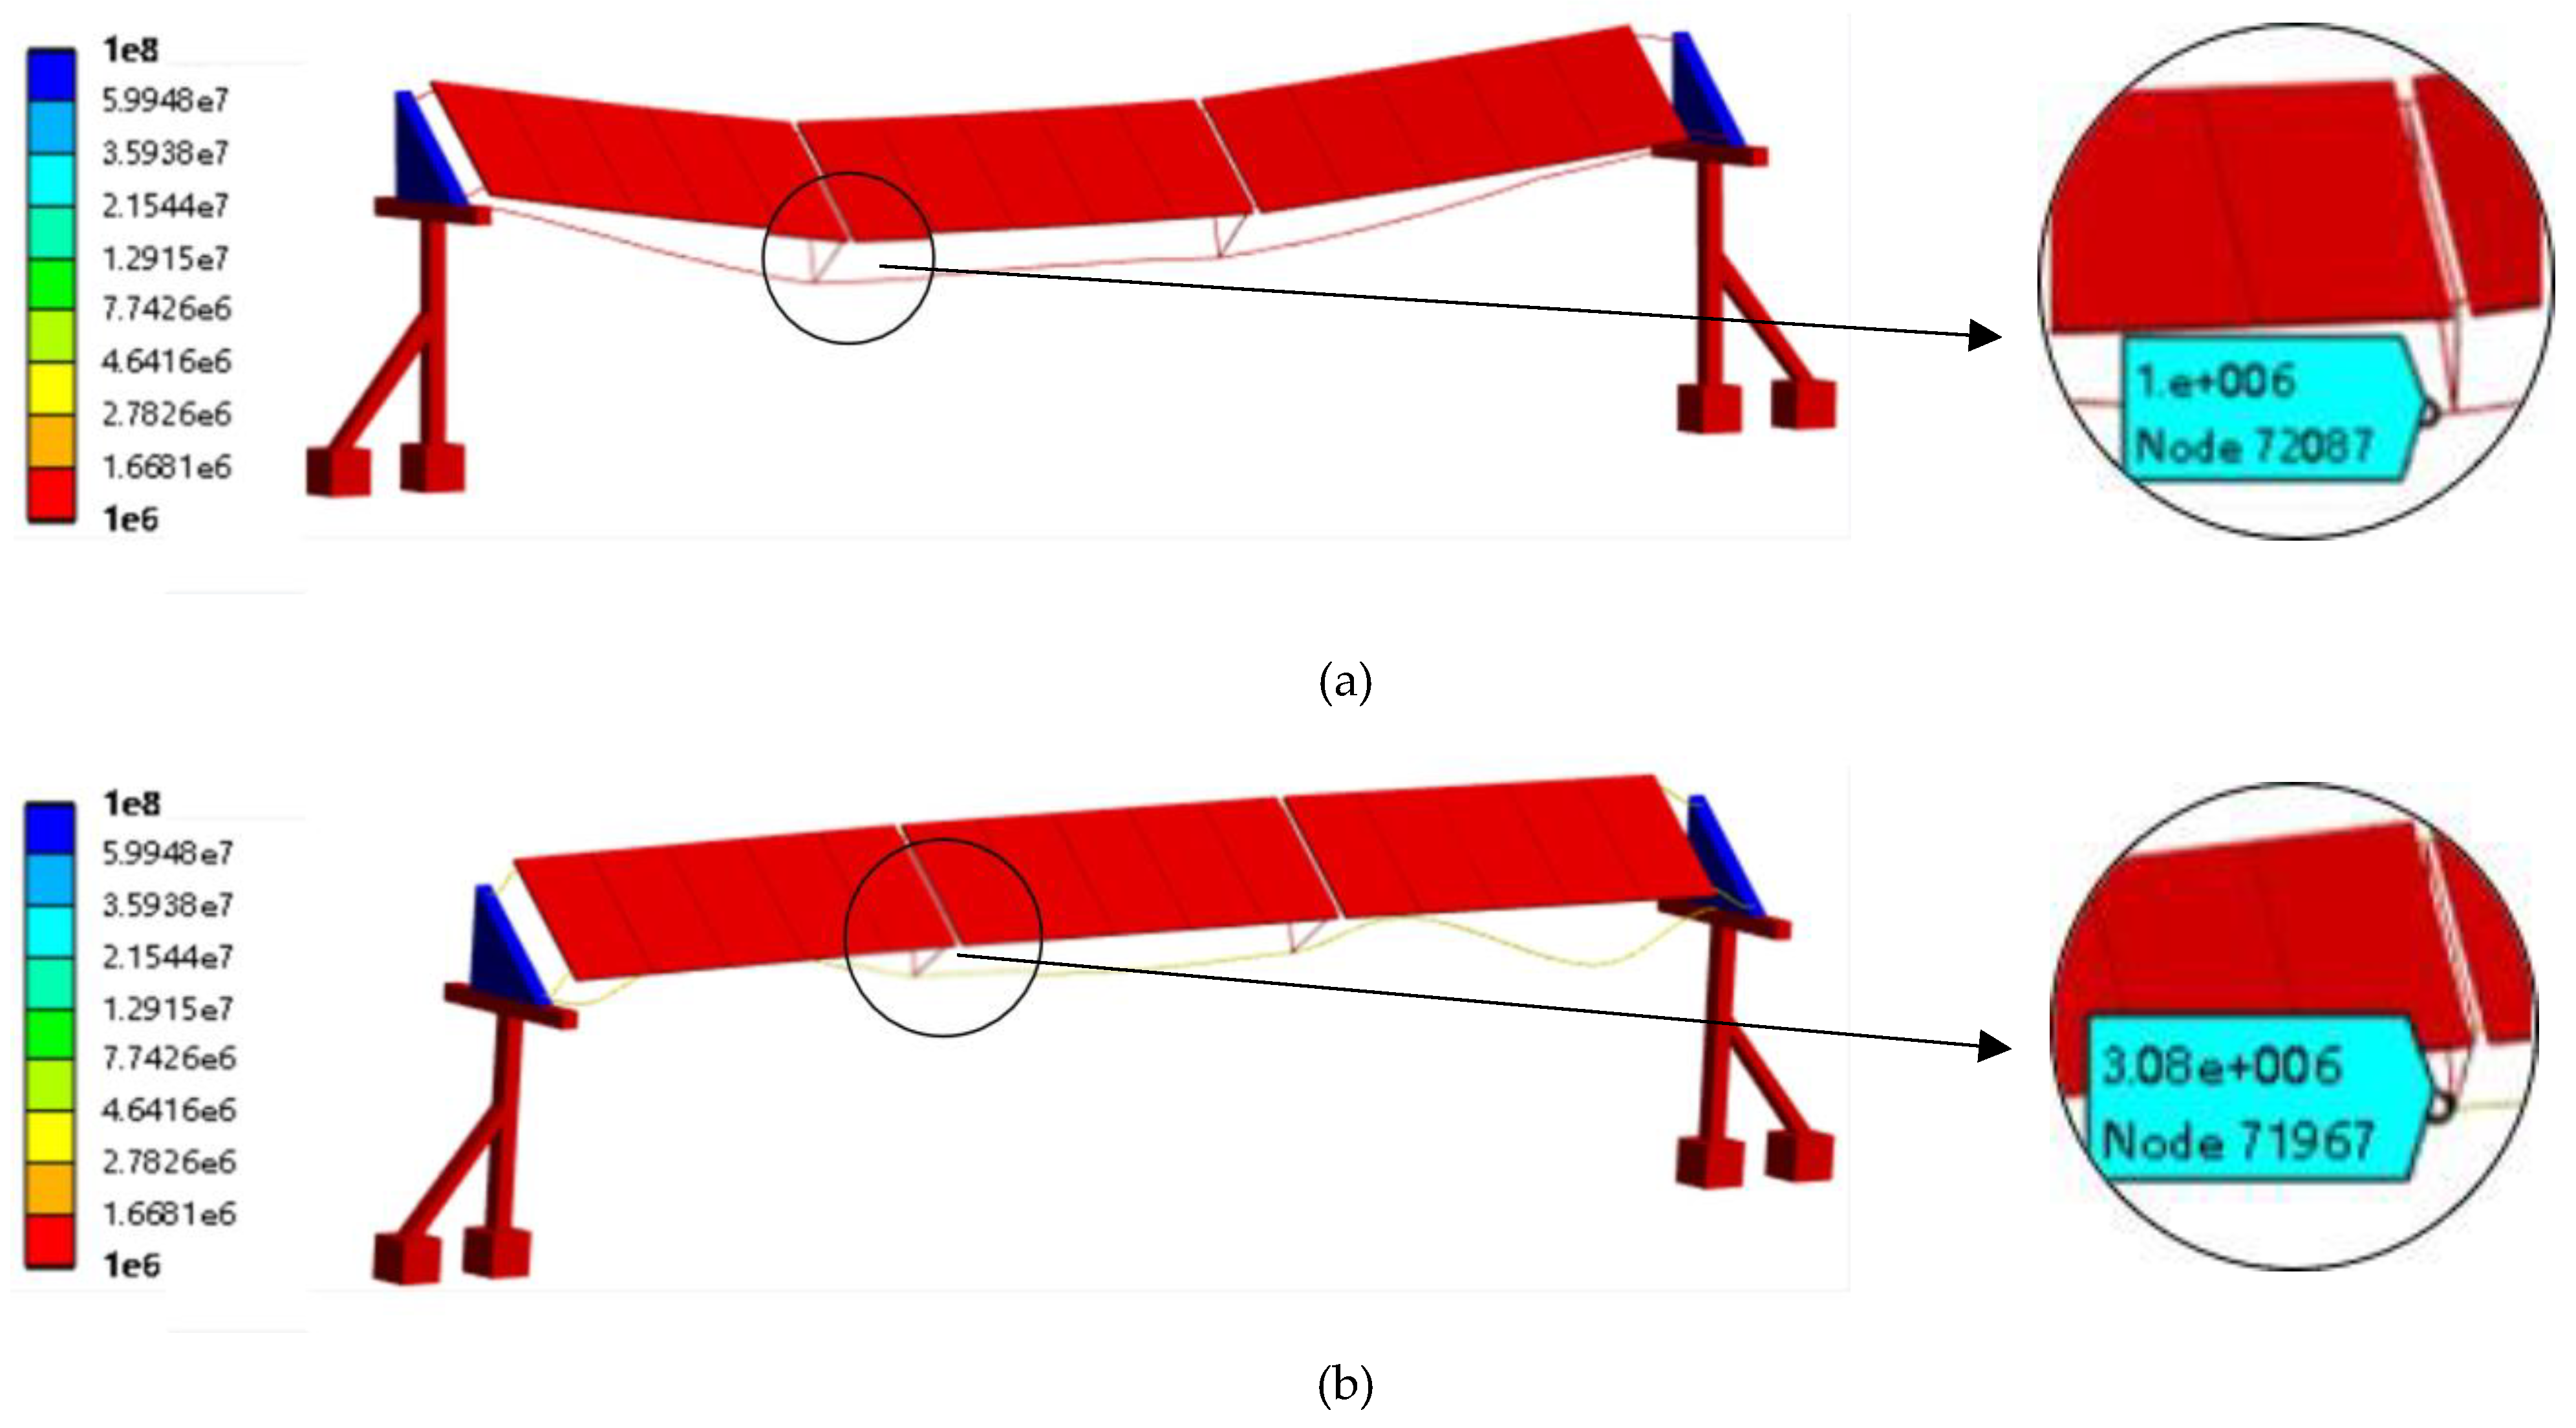
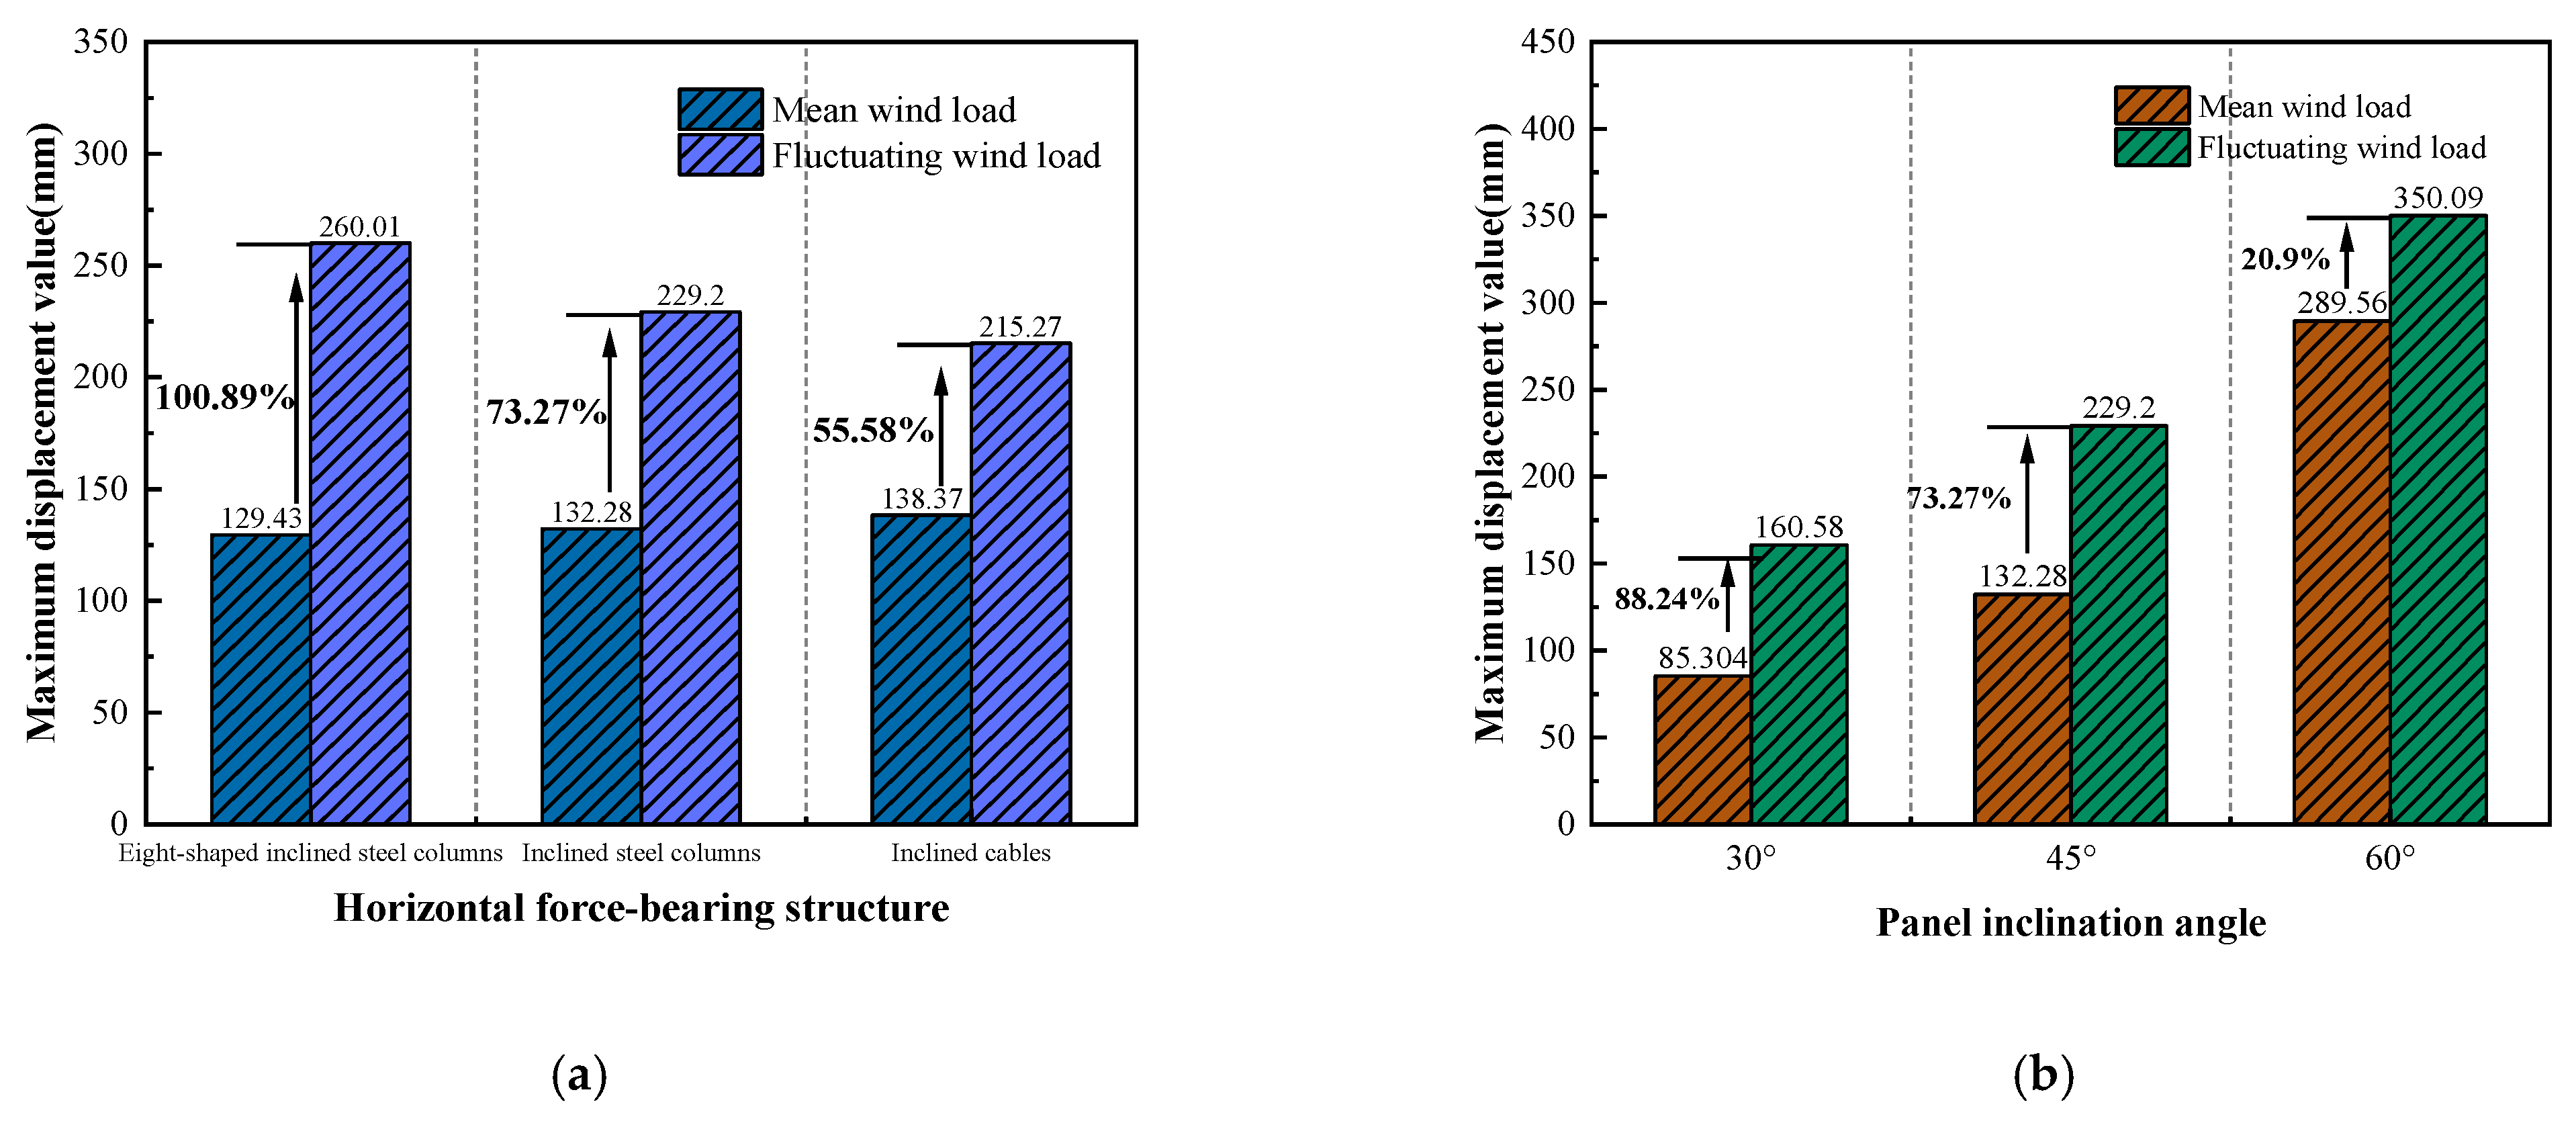
- Among the three kinds of horizontal force-bearing structures, the horizontal force-bearing structure of inclined steel columns had better safety reliability, construction simplicity, and economic feasibility, and it had more advantages in practical application.
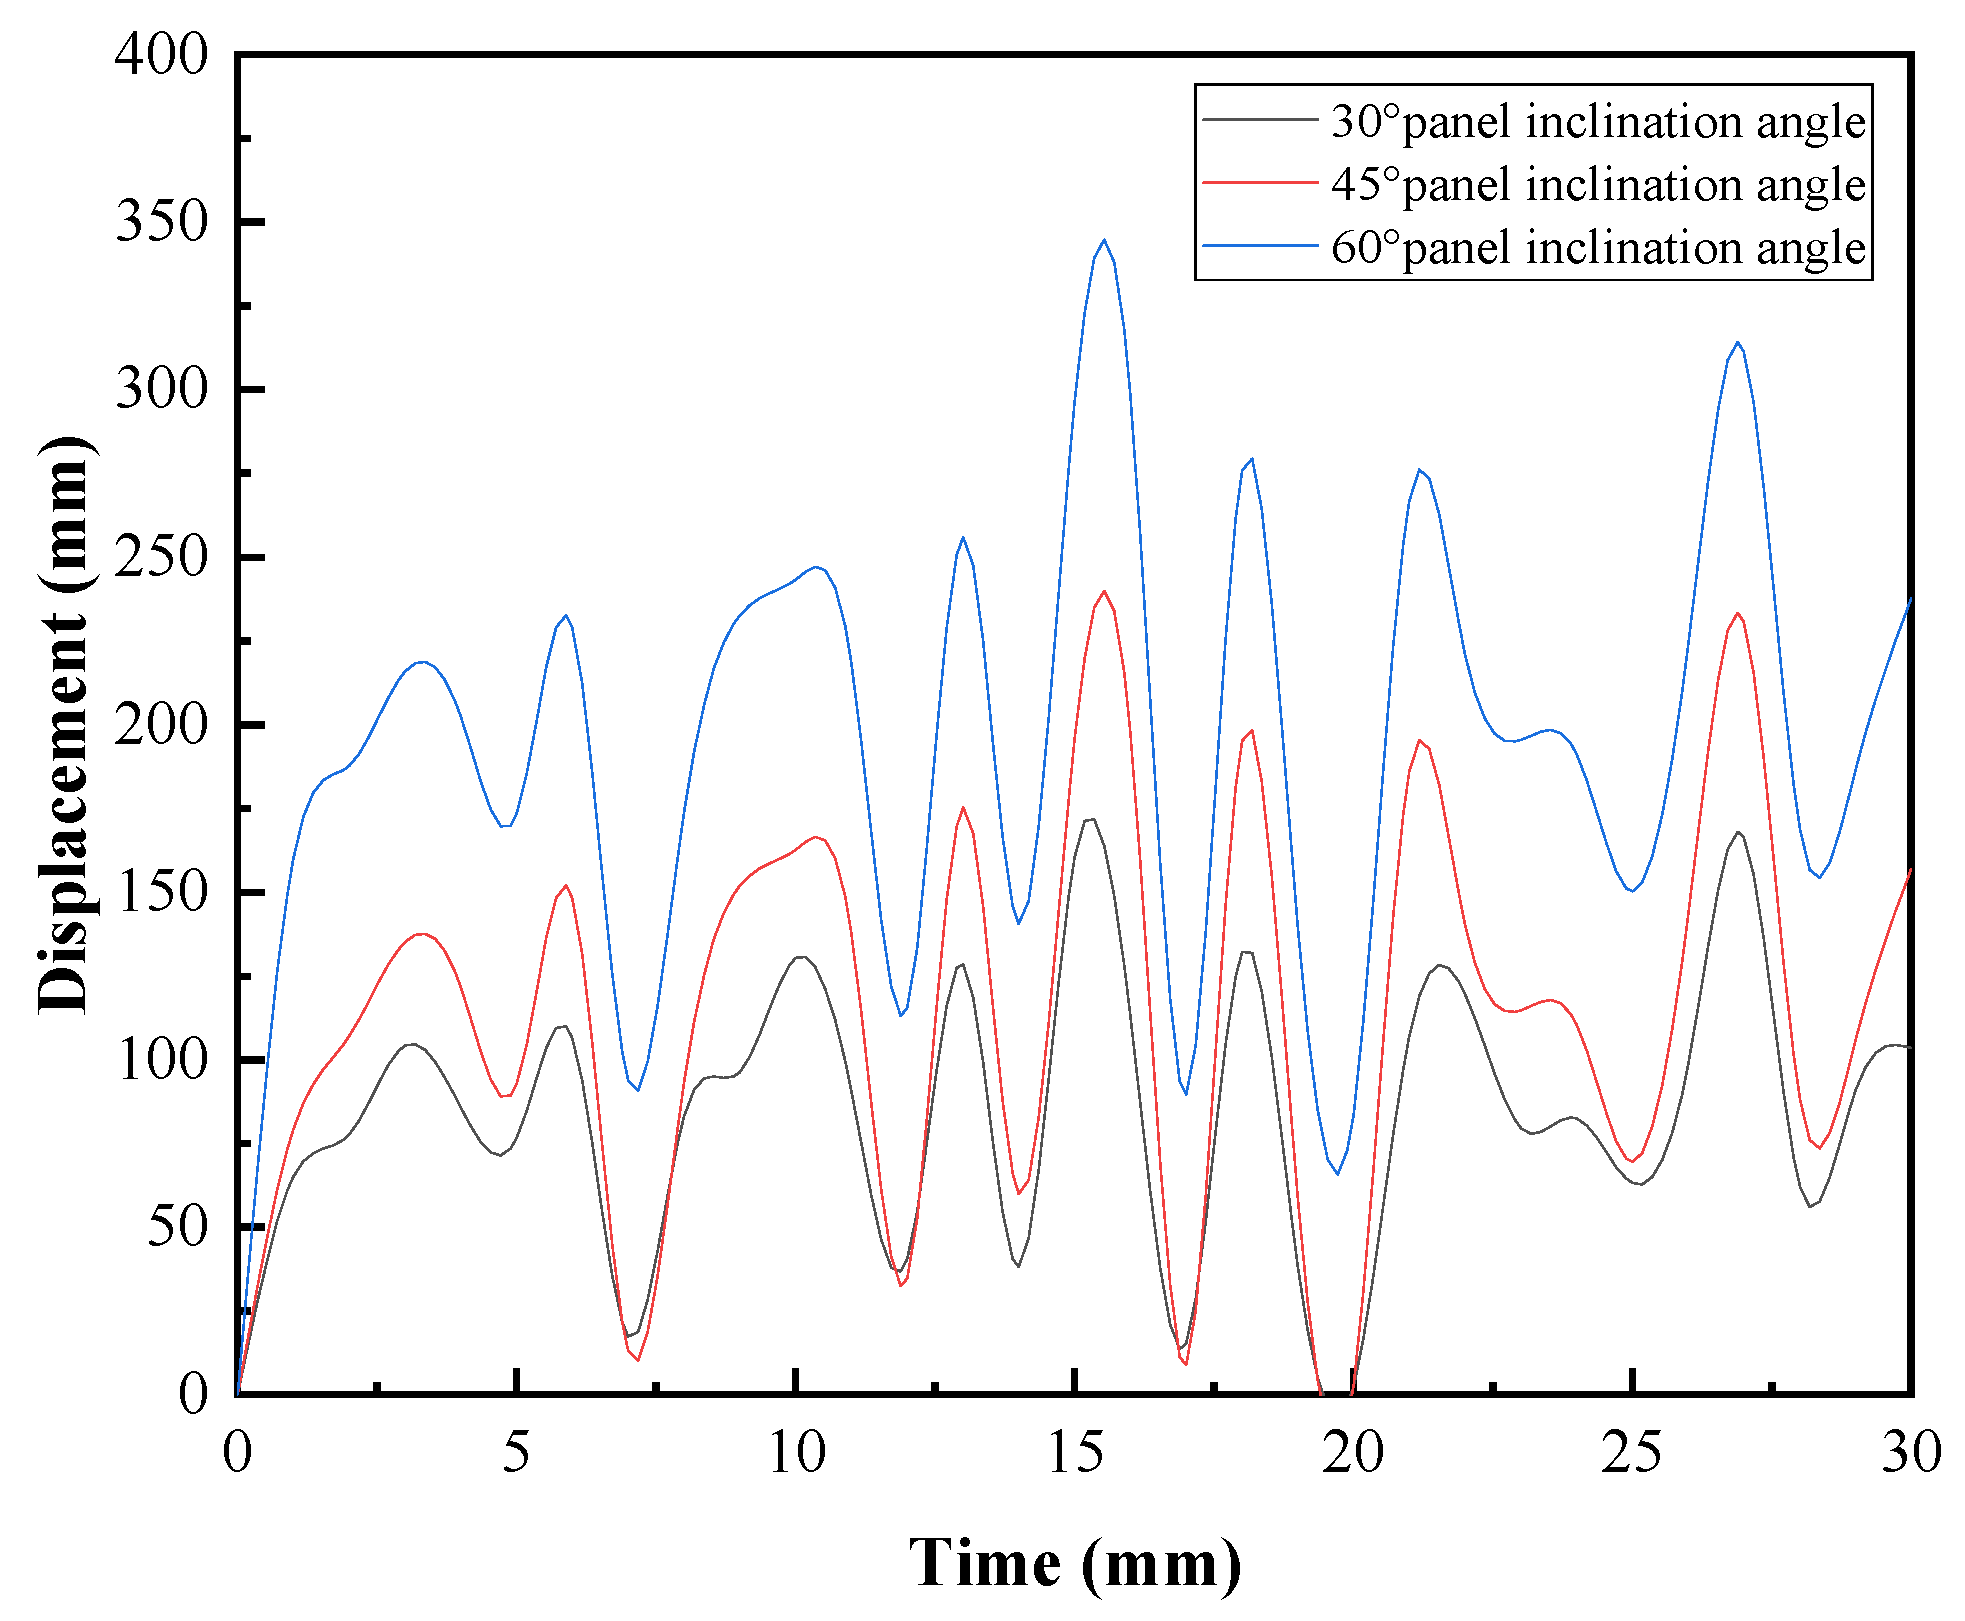
- Increasing the panel inclination angle will lead to growing structural displacements. Considering the correlation between power generation efficiency and panel inclination angle, we suggest that the panel inclination angle should be reduced reasonably in the design to reduce the harm of wind-induced responses and improve the overall power generation efficiency of the PV system.
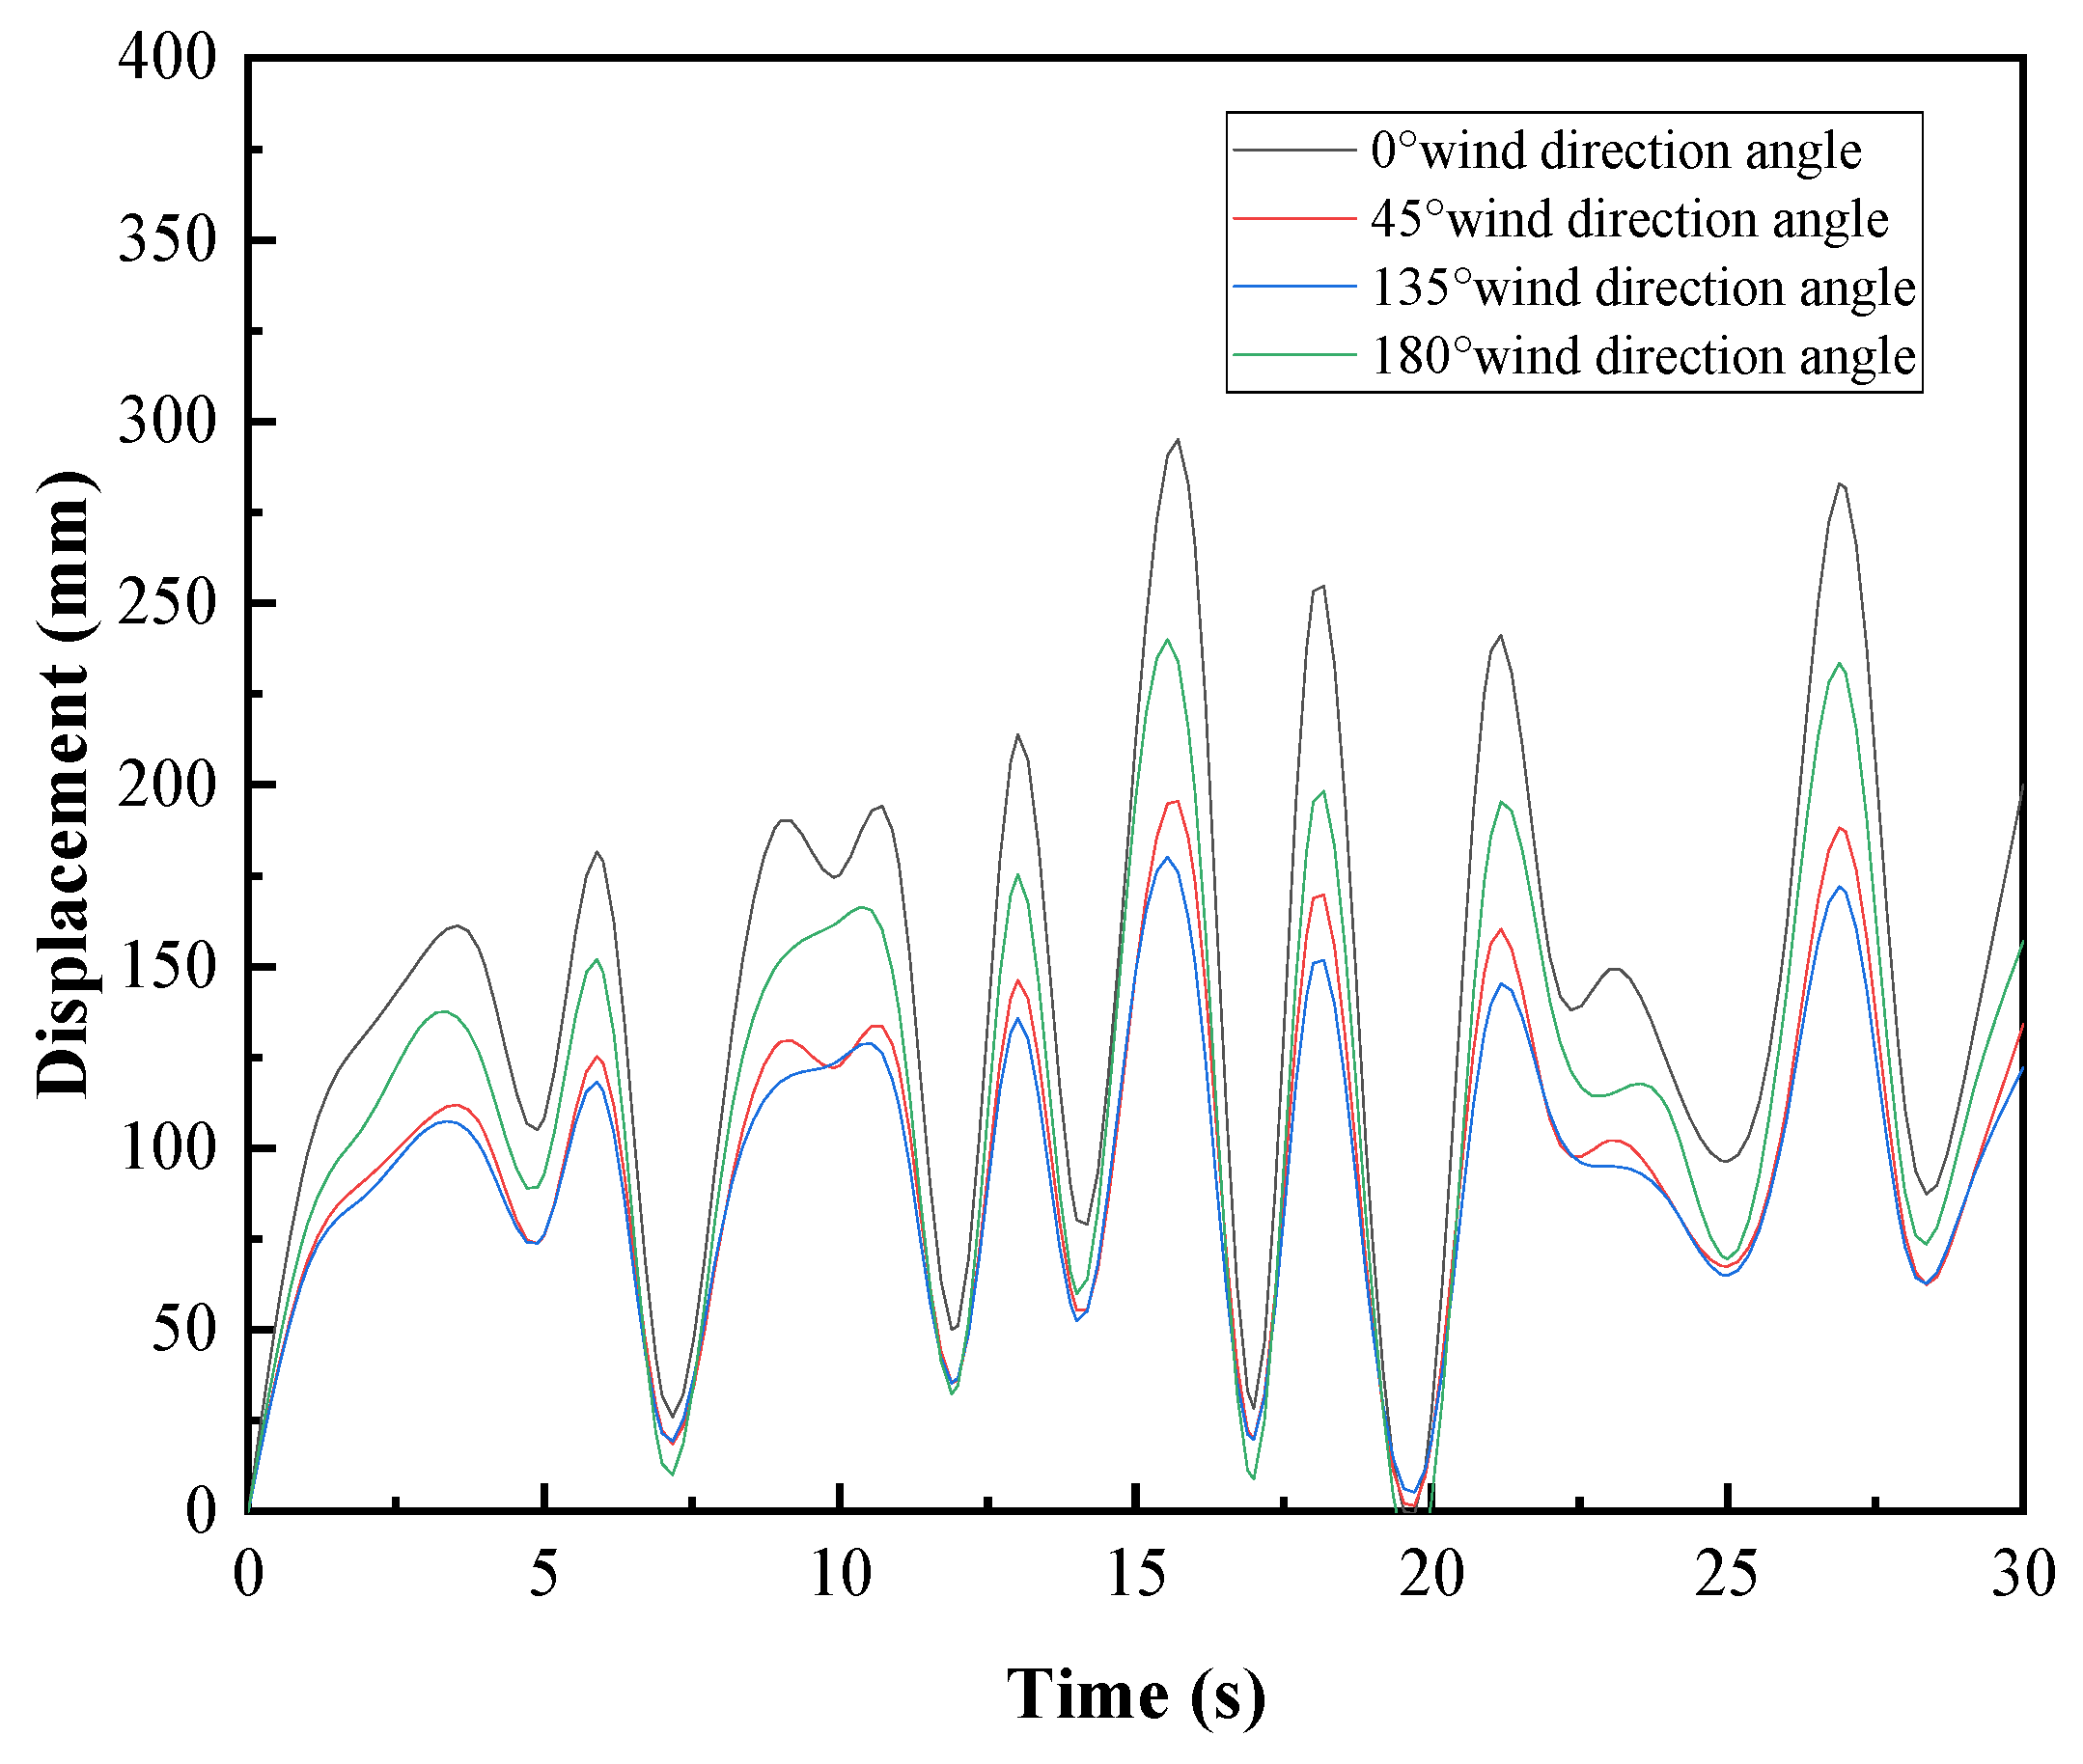
- The structural displacements at 0° and 180° wind direction angles were significantly greater than those at 45° and 135° wind direction angles. It can be seen that the wind direction angle had a significant influence on the wind-induced response of the flexible PV support structure.
- The decrease in the template gap will lead to a reduction in structural displacement. Therefore, a reasonable increase in the template gap is conducive to reducing the influence of the flexible PV support structure on wind-induced response and further promoting the wind resistance design of the flexible PV support structure.
- It is not difficult to see from Figure 30 that although the fluctuating wind load was far less than the mean wind load in numerical terms, the structural displacement under the fluctuating wind load was significantly larger than that under the mean wind load in the analysis of various factors. Thus, the fluctuating wind load was non-negligible in the flexible PV support structure.
Author Contributions
Funding
Data Availability Statement
Acknowledgments
Conflicts of Interest
Abbreviations
| Notation | Description |
| The wind speed (m/s) | |
| The mean wind speed (m/s) | |
| The fluctuating speed (m/s) | |
| The mean wind speed at a specific elevation point (m/s) | |
| The mean wind speed is at a height of 10 m (m/s) | |
| The height at a specific elevation point (m) | |
| The power-law exponent (in this article, 0.16 was used) | |
| The power spectrum of fluctuating wind (m2/s) | |
| The surface roughness coefficient | |
| The frequency of fluctuating wind (Hz) | |
| The fluctuating wind pressure (N/m2) | |
| The air density (kg/m3) |
References
- He, X.; Ding, H.; Jing, H.; Zhang, F.; Wu, X.; Weng, X. Wind-induced vibration and its suppression of photovoltaic modules supported by suspension cables. J. Wind Eng. Ind. Aerodyn. 2020, 206, 104275. [Google Scholar] [CrossRef]
- Stenabaugh, S.; Iida, Y.; Kopp, G.; Karava, P. Wind loads on photovoltaic arrays mounted parallel to sloped roofs on low-rise buildings. J. Wind Eng. Ind. Aerodyn. 2015, 139, 16–26. [Google Scholar] [CrossRef]
- Reina, G.; Stefano, G. Computational evaluation of wind loads on sun-tracking ground-mounted photovoltaic panel arrays. J. Wind Eng. Ind. Aerodyn. 2017, 170, 283–293. [Google Scholar] [CrossRef]
- Du, H.; Xu, H.; Zhang, Y.; Lou, W. Wind pressure characteristics and wind vibration response of long-span flexible photovoltaic support structure. J. Harbin Inst. Technol. 2022, 54, 67–74. [Google Scholar] [CrossRef]
- Wu, J.; Liang, T.; Mi, W.; Tan, Z. Analysis of development and application prospect of floating photovoltaic power station on water. Sol. Energy 2019, 12, 20–23. [Google Scholar]
- Kumar, M.; Niyaz, H.; Gupta, R. Challenges and opportunities towards the development of floating photovoltaic systems. Sol. Energy Mater. Sol. Cells 2021, 233, 111408. [Google Scholar] [CrossRef]
- Mao, Q.; Guo, M.; Lv, J.; Chen, J.; Xie, P.; Li, M. A Risk Assessment Framework of Hybrid Offshore Wind–Solar PV Power Plants under a Probabilistic Linguistic Environment. Sustainability 2022, 14, 4197. [Google Scholar] [CrossRef]
- Baumgartner, F.P.; Büchel, A.; Bartholet, R. Solar wings: A new lightweight PV tracking system. In Proceedings of the 23rd European Photovoltaic Solar Energy Conference, Valencia, Spain, 1–5 September 2008; pp. 2790–2794. [Google Scholar]
- Baumgartner, F.P.; Büchel, A.; Bartholet, R. Experiences with cable-based solar wings tracking system and progress towards two-axis large scale solar systems. In Proceedings of the 24th European Photovoltaic Solar Energy Conference, Hamburg, Germany, 21–25 September 2009; Volume 21. [Google Scholar]
- Baumgartner, F.P.; Büchel, A.; Bartholet, R. Cable-based solar wings tracking system: Two-axis system and progress of one-axis system. In Proceedings of the 25th European Photovoltaic Solar Energy Conference, Valencia, Spain, 6–10 September 2010; Volume 8. [Google Scholar]
- Zhang, D.; Meng, X.; Hu, N.; Feng, P. Experimental study on loading-induced power generation decline of component-level flexible solar cells. Thin-Walled Struct. 2022, 175, 109231. [Google Scholar] [CrossRef]
- Neumüller, A.; Geier, S.; Österreicher, D. Life Cycle Assessment for Photovoltaic Structures—Comparative Study of Rooftop and Free-Field PV Applications. Sustainability 2023, 15, 13692. [Google Scholar] [CrossRef]
- Liu, X.; Cui, G.; Yu, K. Research on solar photovoltaic flexible support system. China Acad. J. Electron. Publ. House 2020, 2, 79–81. [Google Scholar] [CrossRef]
- Ke, R.; Zhu, X.; Dong, Z.; Wu, X. Structure design of composite PV bracket and the application study of engineering. Compos. Sci. Eng. 2018, 87–93. [Google Scholar] [CrossRef]
- Tang, J.; Lin, J.; Huo, J. Structural characteristic analysis and optimal design of flexible photovoltaic support structure. J. Huaqiao Univ. (Nat. Sci.) 2019, 40, 331–337. [Google Scholar] [CrossRef]
- Liu, J.; Li, S.; Luo, J.; Chen, J. Experimental study on critical wind velocity of a 33-meter-span flexible photovoltaic support structure and its mitigation. J. Wind Eng. Ind. Aerodyn. 2023, 236, 105355. [Google Scholar] [CrossRef]
- Zhang, M.; Feng, G.; Zhang, X.; Zhao, G. Study on Wind-Induced Response and Wind Deflection Control of Overhead Sealing Net Structure Spanning Transmission Lines. Buildings 2023, 13, 2947. [Google Scholar] [CrossRef]
- Chen, Z.; Wei, C.; Yin, L.; Su, N.; Zhao, J.; Wu, Y. Interference effects on the wind loads and wind-induced responses of parallel-arranged rectangular-planed air-supported membrane structures. Thin-Walled Struct. 2024, 197, 111572. [Google Scholar] [CrossRef]
- Nan, B.; Chi, Y.; Jiang, Y.; Bai, Y. Wind Load and Wind-Induced Vibration of Photovoltaic Supports: A Review. Sustainability 2024, 16, 2551. [Google Scholar] [CrossRef]
- Aly, A.; Bitsuamlak, G. Aerodynamics of ground-mounted solar panels: Test model scale effects. J. Wind Eng. Ind. Aerodyn. 2013, 123 Pt A, 250–260. [Google Scholar] [CrossRef]
- Jubayer, C.; Hangan, H. Numerical simulation of wind effects on a stand-alone ground mounted photovoltaic (PV) system. J. Wind Eng. Ind. Aerodyn. 2014, 134, 56–64. [Google Scholar] [CrossRef]
- Stathopoulos, T.; Zisis, I.; Xypnitou, E. Local and overall wind pressure and force coefficients for solar panels. J. Wind Eng. Ind. Aerodyn. 2014, 125, 195–206. [Google Scholar] [CrossRef]
- Li, S.; Ma, J.; Liu, J.; Chen, Z. Experimental study on flutter performance of flexible photovoltaic system by segmental model test. Chin. J. Civ. Eng. 2024, 57, 25–34. [Google Scholar] [CrossRef]
- He, X.; Ding, H.; Jing, H.; Wu, X.; Weng, X. Mechanical characteristics of a new type of cable-supported photovoltaic module system. Sol. Energy 2021, 226, 408–420. [Google Scholar] [CrossRef]
- Ma, W.; Chai, X.; Zhao, H.; Ma, C. A study on distribution coefficient of a flexible photovoltaic support cable based on an eccentric moment wind load distribution model. J. Vib. Shock 2021, 40, 305–310. [Google Scholar] [CrossRef]
- Lin, X.; Su, C.; Xian, J. A response spectrum method for base-isolated structures with equivalent base excitations. J. Struct. Eng. 2023, 149, 04022244. [Google Scholar] [CrossRef]
- Qin, H.; Čeh, N.; Li, L. Efficient Response Estimation Approach for As-Built Bridges Based on Multisupport Response Spectrum Method. J. Eng. Mech. 2023, 149, 04023080. [Google Scholar] [CrossRef]
- Jing, Y.; Dan, D.; Zhao, R.; Ma, S. The Steady-State Response Spectrum of Bridge Structures under Statistical Steady Traffic Flow Loads. ASCE-ASME J. Risk Uncertain. Eng. Syst. Part A Civ. Eng. 2024, 10, 04024001. [Google Scholar] [CrossRef]
- Cao, J.; Wang, T.; Zhou, G.; Feng, X.; Zhu, C. Parameter estimation of grouting pressure and surface subsidence on the reliability of shield tunnel excavation under incomplete probability information. Comput. Geotech. 2024, 173, 106530. [Google Scholar] [CrossRef]
- Wang, T.; Cao, J.; Liu, J.; Xu, J.; Zhou, G. Characterizing anisotropic spatial variations of uncertain mechanical parameters for clay layer using incomplete probability data. Probabilistic Eng. Mech. 2024, 76, 103623. [Google Scholar] [CrossRef]
- Li, X.; Wang, C.; Jiang, Y.; Bai, Y. Dynamic response analysis of a whole steel frame solar greenhouse under wind loads. Sci. Rep. 2022, 12, 5200. [Google Scholar] [CrossRef]
- Letchford, C.; Sarkar, P. Mean and fluctuating wind loads on rough and smooth parabolic domes. J. Wind Eng. Ind. Aerodyn. 2000, 88, 101–117. [Google Scholar] [CrossRef]
- Zheng, Y.; Huang, H.; He, Y.; Zhang, M. Research progress on durability of flexible solar support. Sci. Technol. Innov. 2016, 117–119. [Google Scholar] [CrossRef]
- Chen, C.; Fang, H.; Chen, X.; Han, J. Research progress and application of solar photovoltaic support structure. J. Nanjing Tech. Univ. (Nat. Sci. Ed.) 2022, 44, 365–372. [Google Scholar]
- Xie, L.; Liu, W.; Qi, Y.; Fang, Y. UV aging performance of glass fiber reinforced polymer. J. Nanjing Tech. Univ. (Nat. Sci. Ed.) 2014, 36, 93–98. [Google Scholar]
- Chen, H.; Wang, L.; Liu, W.; Huo, R.; Ma, Y.; Fang, Y. Analysis of I-type fracture toughness of sandwich structure with GFRP skins and a foam core under coupling effects of temperature and loading. J. Nanjing Tech. Univ. (Nat. Sci. Ed.) 2017, 39, 93–99. [Google Scholar]
- Su, B.; Chen, J.; Zhang, T.; Yin, D. Heat transfer performance of square tube reinforced GFR sandwich panel. J. Jiangsu Univ. (Nat. Sci. Ed.) 2020, 41, 93–98. [Google Scholar]
- Han, J.; Liu, W.; Fang, H. Application of fiber-reinforced resin matrix composites in the civil infrastructure field. J. Nanjing Tech. Univ. (Nat. Sci. Ed.) 2020, 42, 543–554. [Google Scholar]
- Naeiji, A.; Raji, F.; Zisis, I. Wind loads on residential scale rooftop photovoltaic panels. J. Wind Eng. Ind. Aerodyn. 2017, 168, 228–246. [Google Scholar] [CrossRef]
- Jiang, J.; Zhang, Z.; Lu, Y.; Zhang, T.; Zhang, J.; Li, J.; Miao, F.; Wang, Y.; Wu, K.; Zhang, D. Numerical analysis of wind loads about photovoltaic arrays considering bending moment. Renew. Energy Resour. 2019, 37, 46–52. [Google Scholar] [CrossRef]
- Li, S.; Zhang, X.; Fang, X.; Sun, H.; Chen, Y.; Hu, J. Wind loads on solar car parking gable shed. Acta Energlae Solaris Sin. 2019, 40, 530–537. [Google Scholar]
- Yemenici, O.; Aksoy, M. An experimental and numerical study of wind effects on a ground-mounted solar panel at different panel tilt angles and wind directions. J. Wind Eng. Ind. Aerodyn. 2021, 213, 104630. [Google Scholar] [CrossRef]
- Shademan, M.; Barron, R.; Balachanda, R.; Hangan, H. Numerical simulation of wind loading on ground-mounted solar panels at different flow configurations. Can. J. Civ. Eng. 2014, 41, 728–738. [Google Scholar] [CrossRef]
- Huang, Z.; Yan, H. Numerical simulation of Group Shielding effect of solar photovoltaic panels under wind load. Spec. Struct. 2015, 32, 18–22. [Google Scholar]
- Yin, M.; Zou, Y.; Li, Q.; He, X.; Yan, L.; Han, G. Wind tunnel test study on wind load of single row tracking photovoltaic structure. J. Railw. Sci. Eng. 2020, 17, 2354–2362. [Google Scholar] [CrossRef]
- Zhang, J.; Lou, Y. Study of Wind Load Influencing Factors of Flexibly Supported Photovoltaic Panels. Buildings 2024, 14, 1677. [Google Scholar] [CrossRef]
- Ruan, H.; Liao, W.; Wang, K.; Zhao, Y. Numerical research on surface wind load of PV array. Acta Energlae Solaris Sin. 2015, 36, 871–877. [Google Scholar] [CrossRef]
- Abiola-Ogedengbe, A.; Hangan, H.; Siddiqui, K. Experimental investigation of wind effects on a standalone photovoltaic (PV) module. Renew. Energy 2015, 78, 657–665. [Google Scholar] [CrossRef]
- Yemenici, O. Experimental study of aerodynamic loads on ground-mounted solar panel arrays: The panel spacing and inclination angle effect. Proc. Inst. Mech. Eng. Part C J. Mech. Eng. Sci. 2020, 234, 3380–3396. [Google Scholar] [CrossRef]
- Wood, G.; Denoon, R.; Kwok, K. Wind loads on industrial solar panel arrays and supporting roof structure. Wind Struct. 2001, 4, 481–494. [Google Scholar] [CrossRef]
- Geurts, C.; Blackmore, P. Wind loads on stand-off photovoltaic systems on pitched roofs. J. Wind Eng. Ind. Aerodyn. 2013, 123, 239–249. [Google Scholar] [CrossRef]
- He, J.; Zhu, R.; Wang, J. Numerical simulation of wind load on photovoltaic panels. Sol. Energy 2013, 16, 56–58. [Google Scholar] [CrossRef]
- Liu, H.; Krishna, V.; Leung, J.; Reindl, T.; Zhao, L. Field experience and performance analysis of floating PV technologies in the tropics. Prog. Photovolt. Res. Appl. 2018, 26, 957–967. [Google Scholar] [CrossRef]
- Ma, W.; Ma, C.; Wang, C.; Han, X.; Gao, F. Wind Tunnel Experimental Study on the Wind Load Interference Effect of Solar Panel Arrays. J. Exp. Fluid Mech. 2021, 35, 19–25. [Google Scholar] [CrossRef]
- Ma, W.; Chai, X.; Wang, C. Experimental Study on Wind Load Influencing Factors of Flexible Support Photovoltaic Modules. J. Exp. Fluid Mech. 2021, 42, 10–18. [Google Scholar] [CrossRef]


| Flexible PV Support | Dimension/(mm) | |
|---|---|---|
| Horizontal force-bearing structure | Foundation | 500 mm × 500 mm × 500 mm (length × width × height) |
| Column | 200 mm × 200 mm × 2400 mm (length × width × height) | |
| Beam | 2400 mm × 200 mm × 200 mm (length × width × height) | |
| Thick tripod | 1420 mm × 200 mm × 820 mm (length × width × height) | |
| 1160 mm × 200 mm × 1160 mm (length × width × height) | ||
| 820 mm × 200 mm × 1420 mm (length × width × height) | ||
| Thin tripod | 1430 mm × 1155 mm × 1078 mm × 20 mm (L × M × N × diameter) | |
| 1600 mm × 1400 mm × 908 mm × 20 mm (L × M × N × diameter) | ||
| 1623 mm × 1400 mm × 682 mm × 20 mm (L × M × N × diameter) | ||
| Template gap | 10 mm | |
| 50 mm | ||
| 100 mm | ||
| Cable | 15600 mm × 20 mm (span × diameter) | |
| PV panel | 1640 mm × 1000 mm × 48 mm (length × width × height) | |
| Material | Density (kg/m3) | Young’s Modulus (Pa) | Poisson’s Ratio |
|---|---|---|---|
| Concrete | 2300 | 3 × 10¹⁰ | 0.18 |
| Structural steel | 7850 | 2 × 10¹¹ | 0.3 |
| Aluminium alloy | 2770 | 7.1 × 10¹⁰ | 0.33 |
| PV material | 2600 | 1.1 × 10¹¹ | 0.225 |
Disclaimer/Publisher’s Note: The statements, opinions and data contained in all publications are solely those of the individual author(s) and contributor(s) and not of MDPI and/or the editor(s). MDPI and/or the editor(s) disclaim responsibility for any injury to people or property resulting from any ideas, methods, instructions or products referred to in the content. |
© 2024 by the authors. Licensee MDPI, Basel, Switzerland. This article is an open access article distributed under the terms and conditions of the Creative Commons Attribution (CC BY) license (https://creativecommons.org/licenses/by/4.0/).
Share and Cite
Chi, Y.; Nan, B.; Qiao, Y.; Leng, J. A Parametric Study of Flexible Support Deflection of Photovoltaic Cells Considering Wind-Induced Load Using Time History Technique. Buildings 2024, 14, 2706. https://doi.org/10.3390/buildings14092706
Chi Y, Nan B, Qiao Y, Leng J. A Parametric Study of Flexible Support Deflection of Photovoltaic Cells Considering Wind-Induced Load Using Time History Technique. Buildings. 2024; 14(9):2706. https://doi.org/10.3390/buildings14092706
Chicago/Turabian StyleChi, Yuanpeng, Bo Nan, Youxin Qiao, and Junjie Leng. 2024. "A Parametric Study of Flexible Support Deflection of Photovoltaic Cells Considering Wind-Induced Load Using Time History Technique" Buildings 14, no. 9: 2706. https://doi.org/10.3390/buildings14092706