

Essential Working Features of Asphalt Airport Pavement Revealed by Structural State-of-Stress Theory


Abstract
Highlights
- Proposes the method for deriving the state variables from the tested strain and deformation data;
- Proposes the method for expressing the state of stress of the asphalt airport pavement using state variables;
- Proposes the method for expressing the state of stress of the asphalt airport pavement using state variables;
- What is the implication of the main finding?
Abstract
1. Introduction
2. Structural State-of-Stress Theory and Methods
2.1. Brief of Structural State-of-Stress Theory
2.2. Structural State-of-Stress Analysis Methods
3. Experiment of Asphalt Airport Pavement
3.1. Experimental Asphalt Airport Pavement
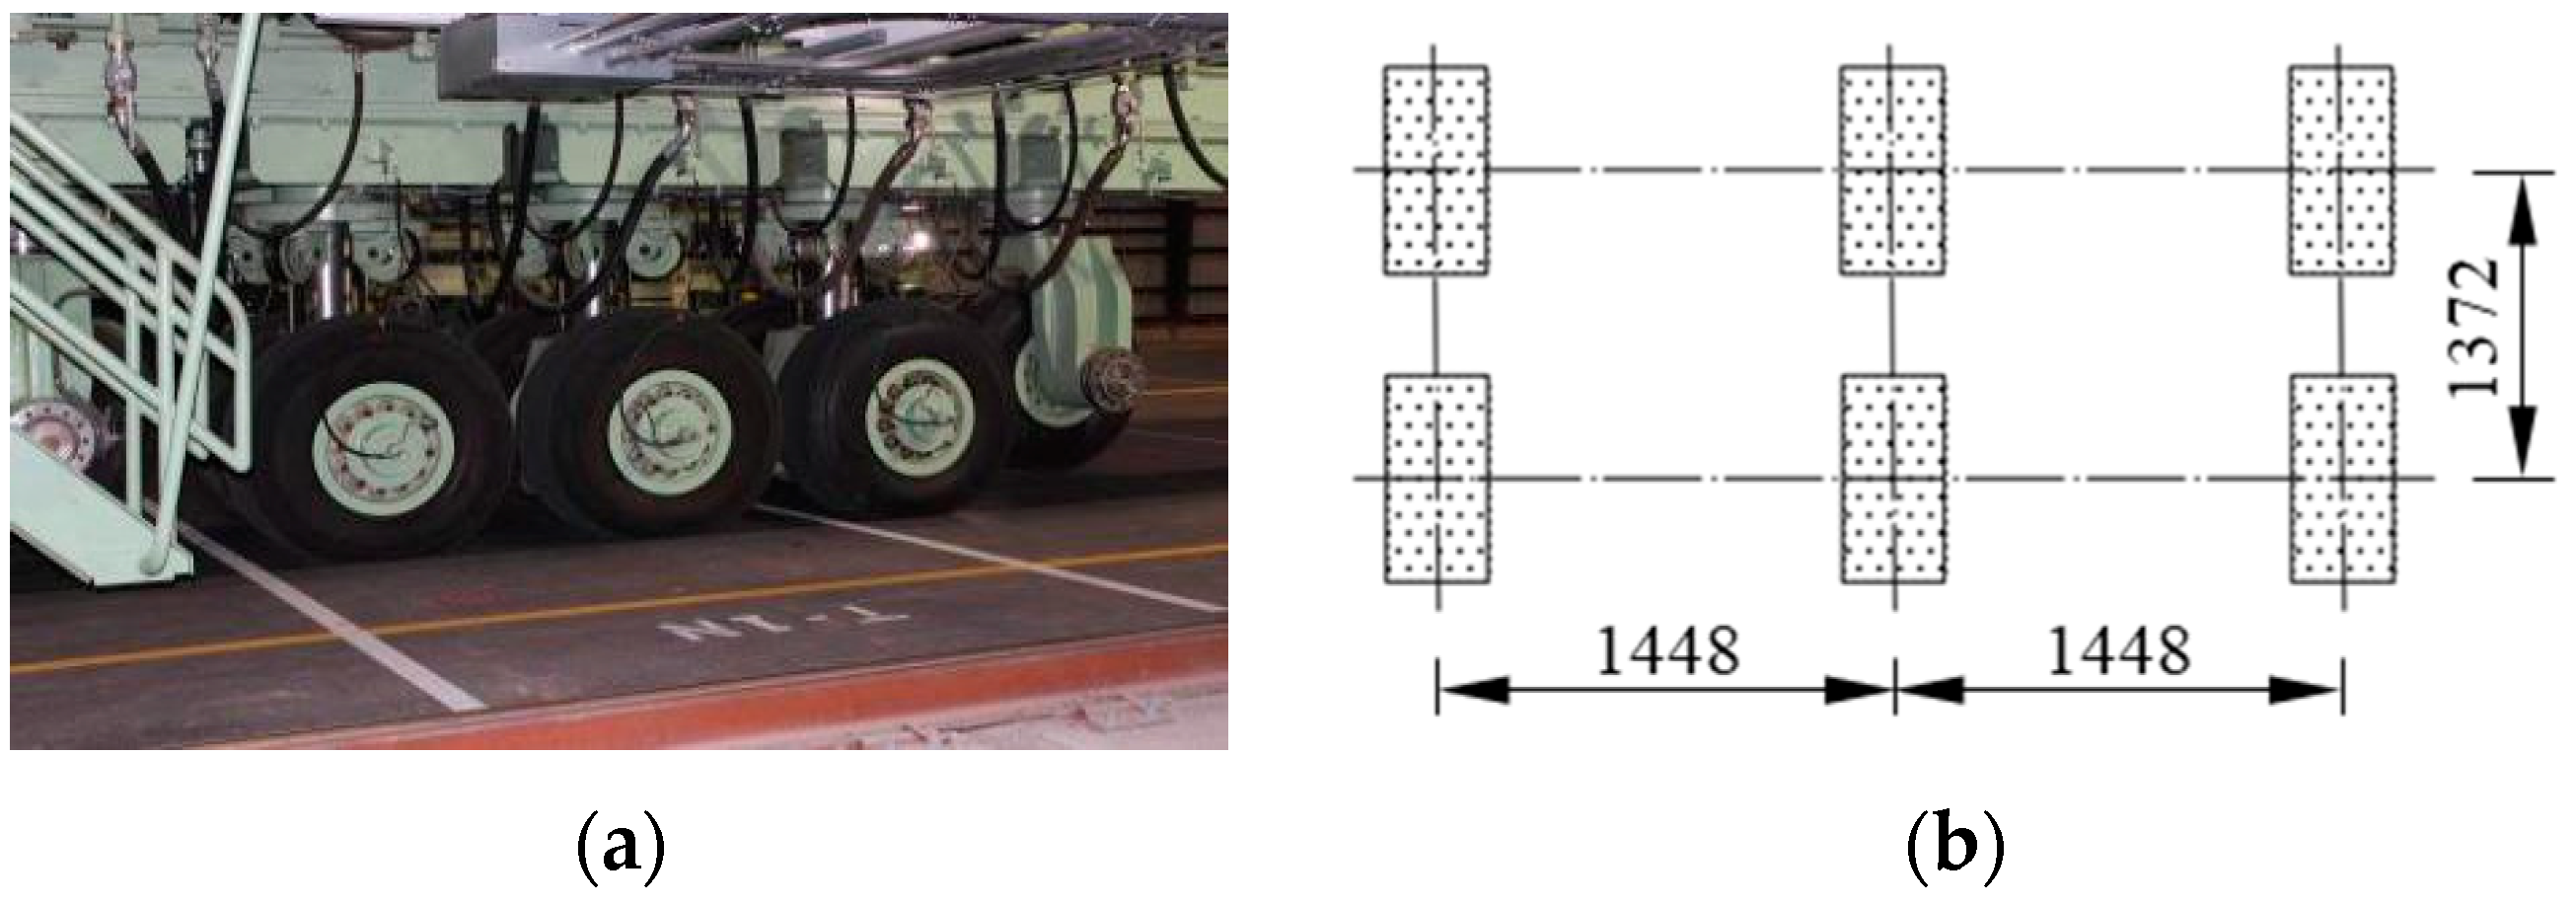
3.2. Loading Scheme
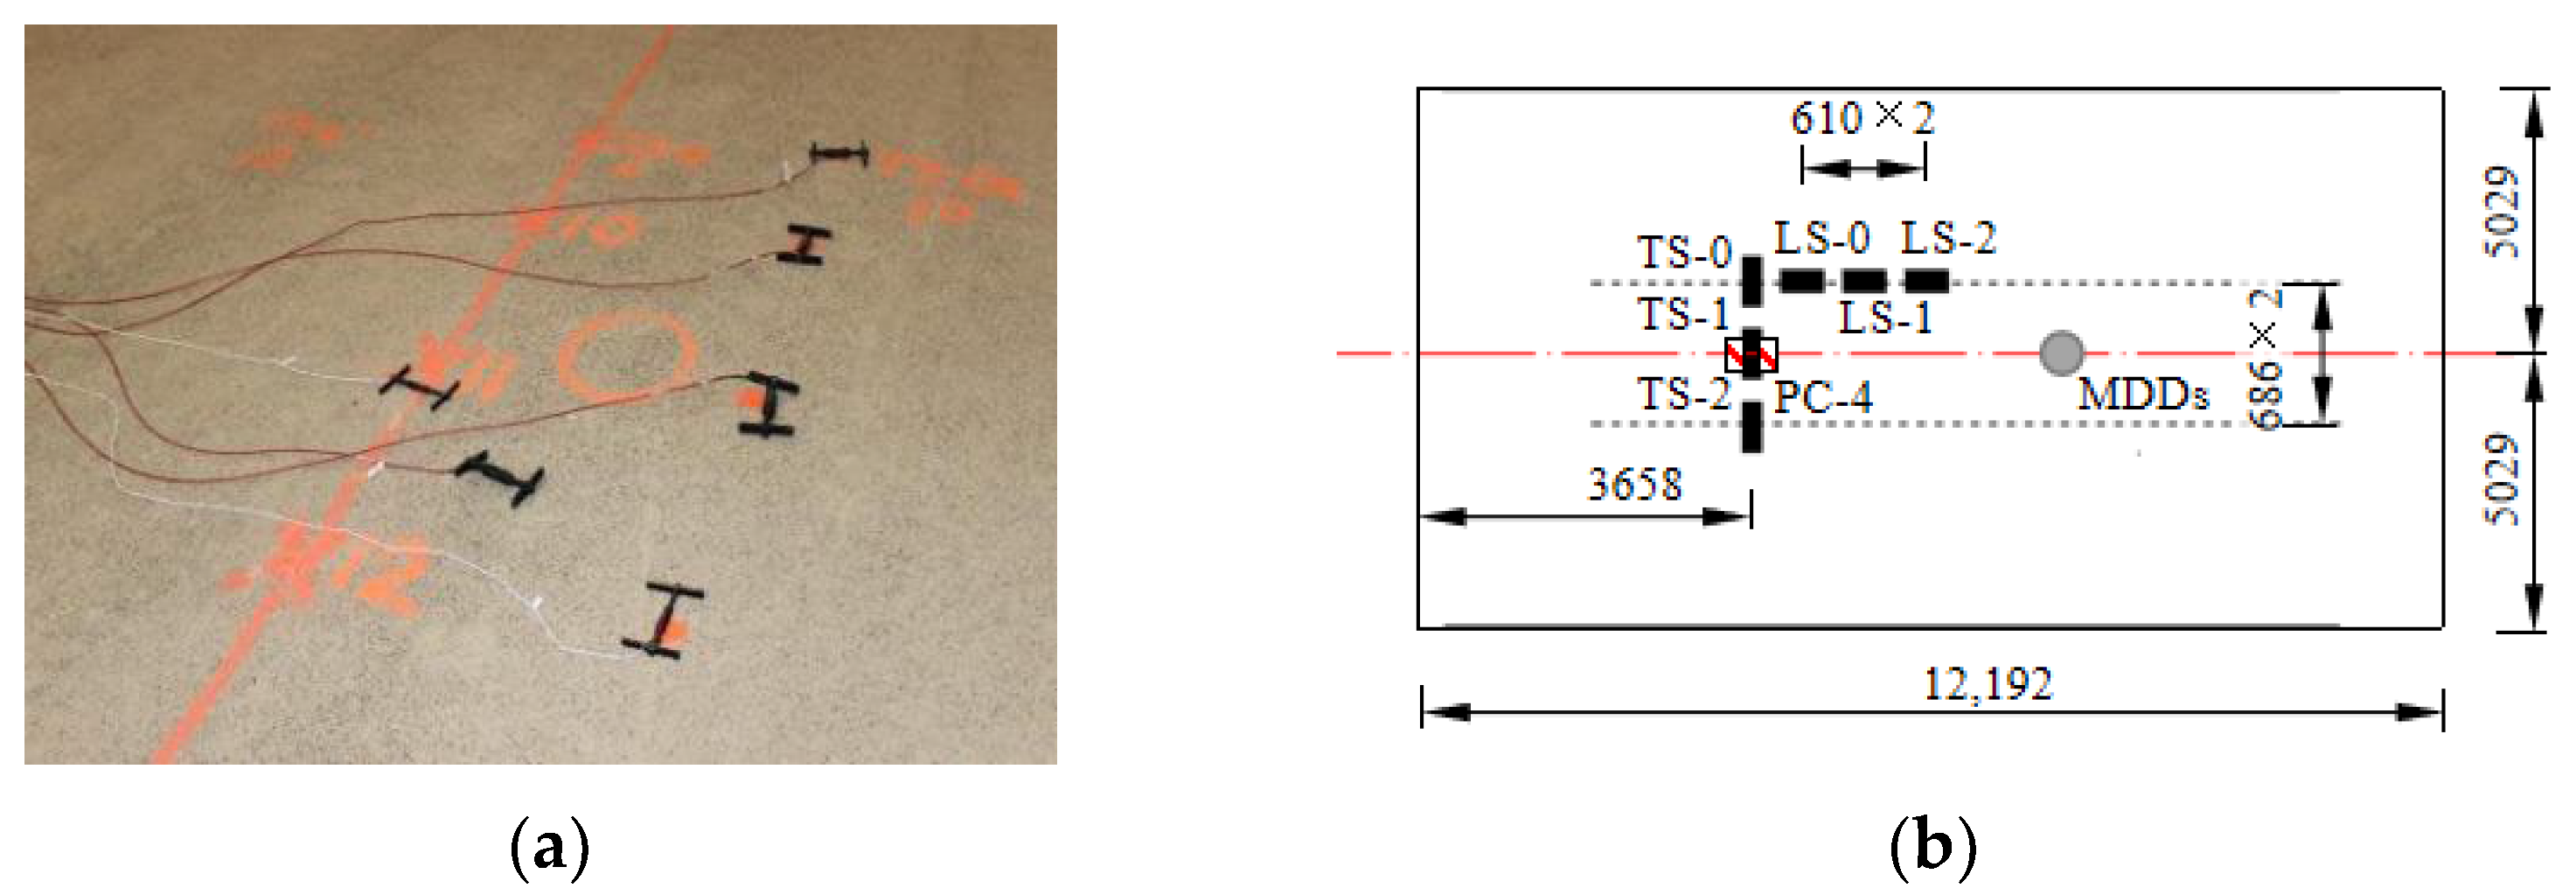
3.3. Arrangement of Measured Points
4. The State-of-Stress Analysis of the Tested Pavement
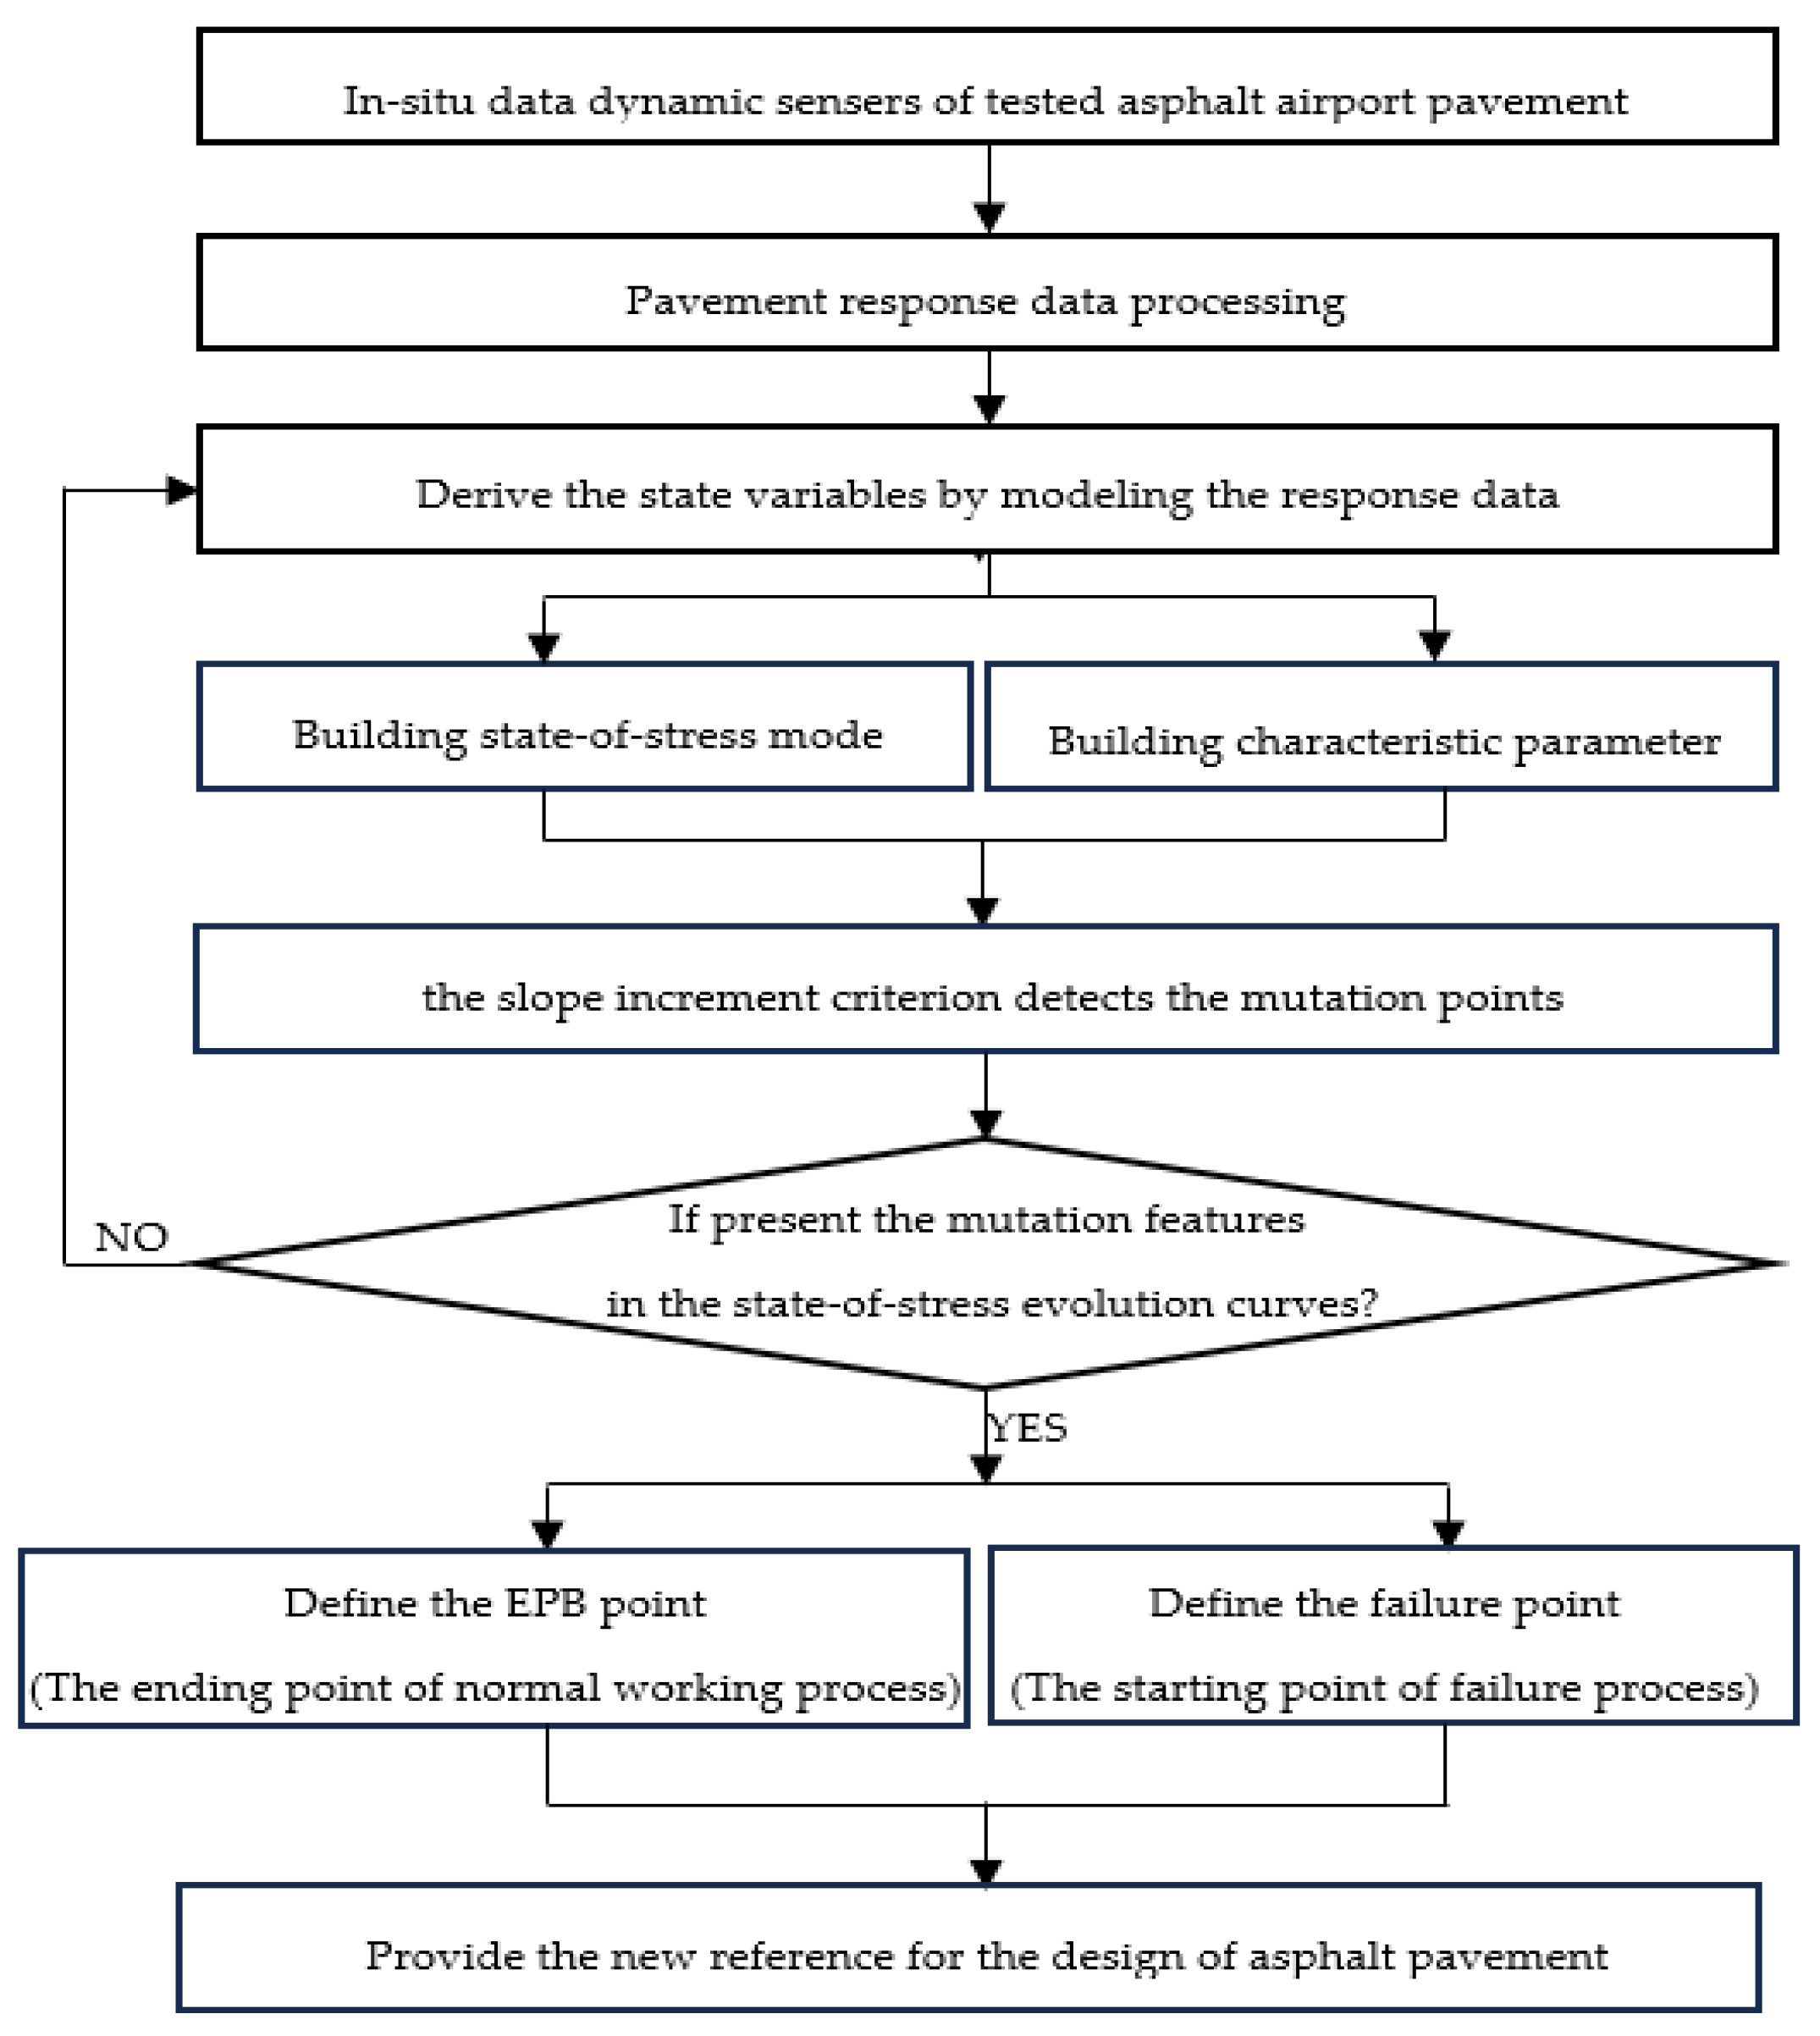
4.1. Procedure of State-of-Stress Analysis
4.2. Evolution Feature of Characteristic Parameter
4.3. Evolution of Characteristic Parameter
4.4. Evolution Feature of Characteristic Parameter
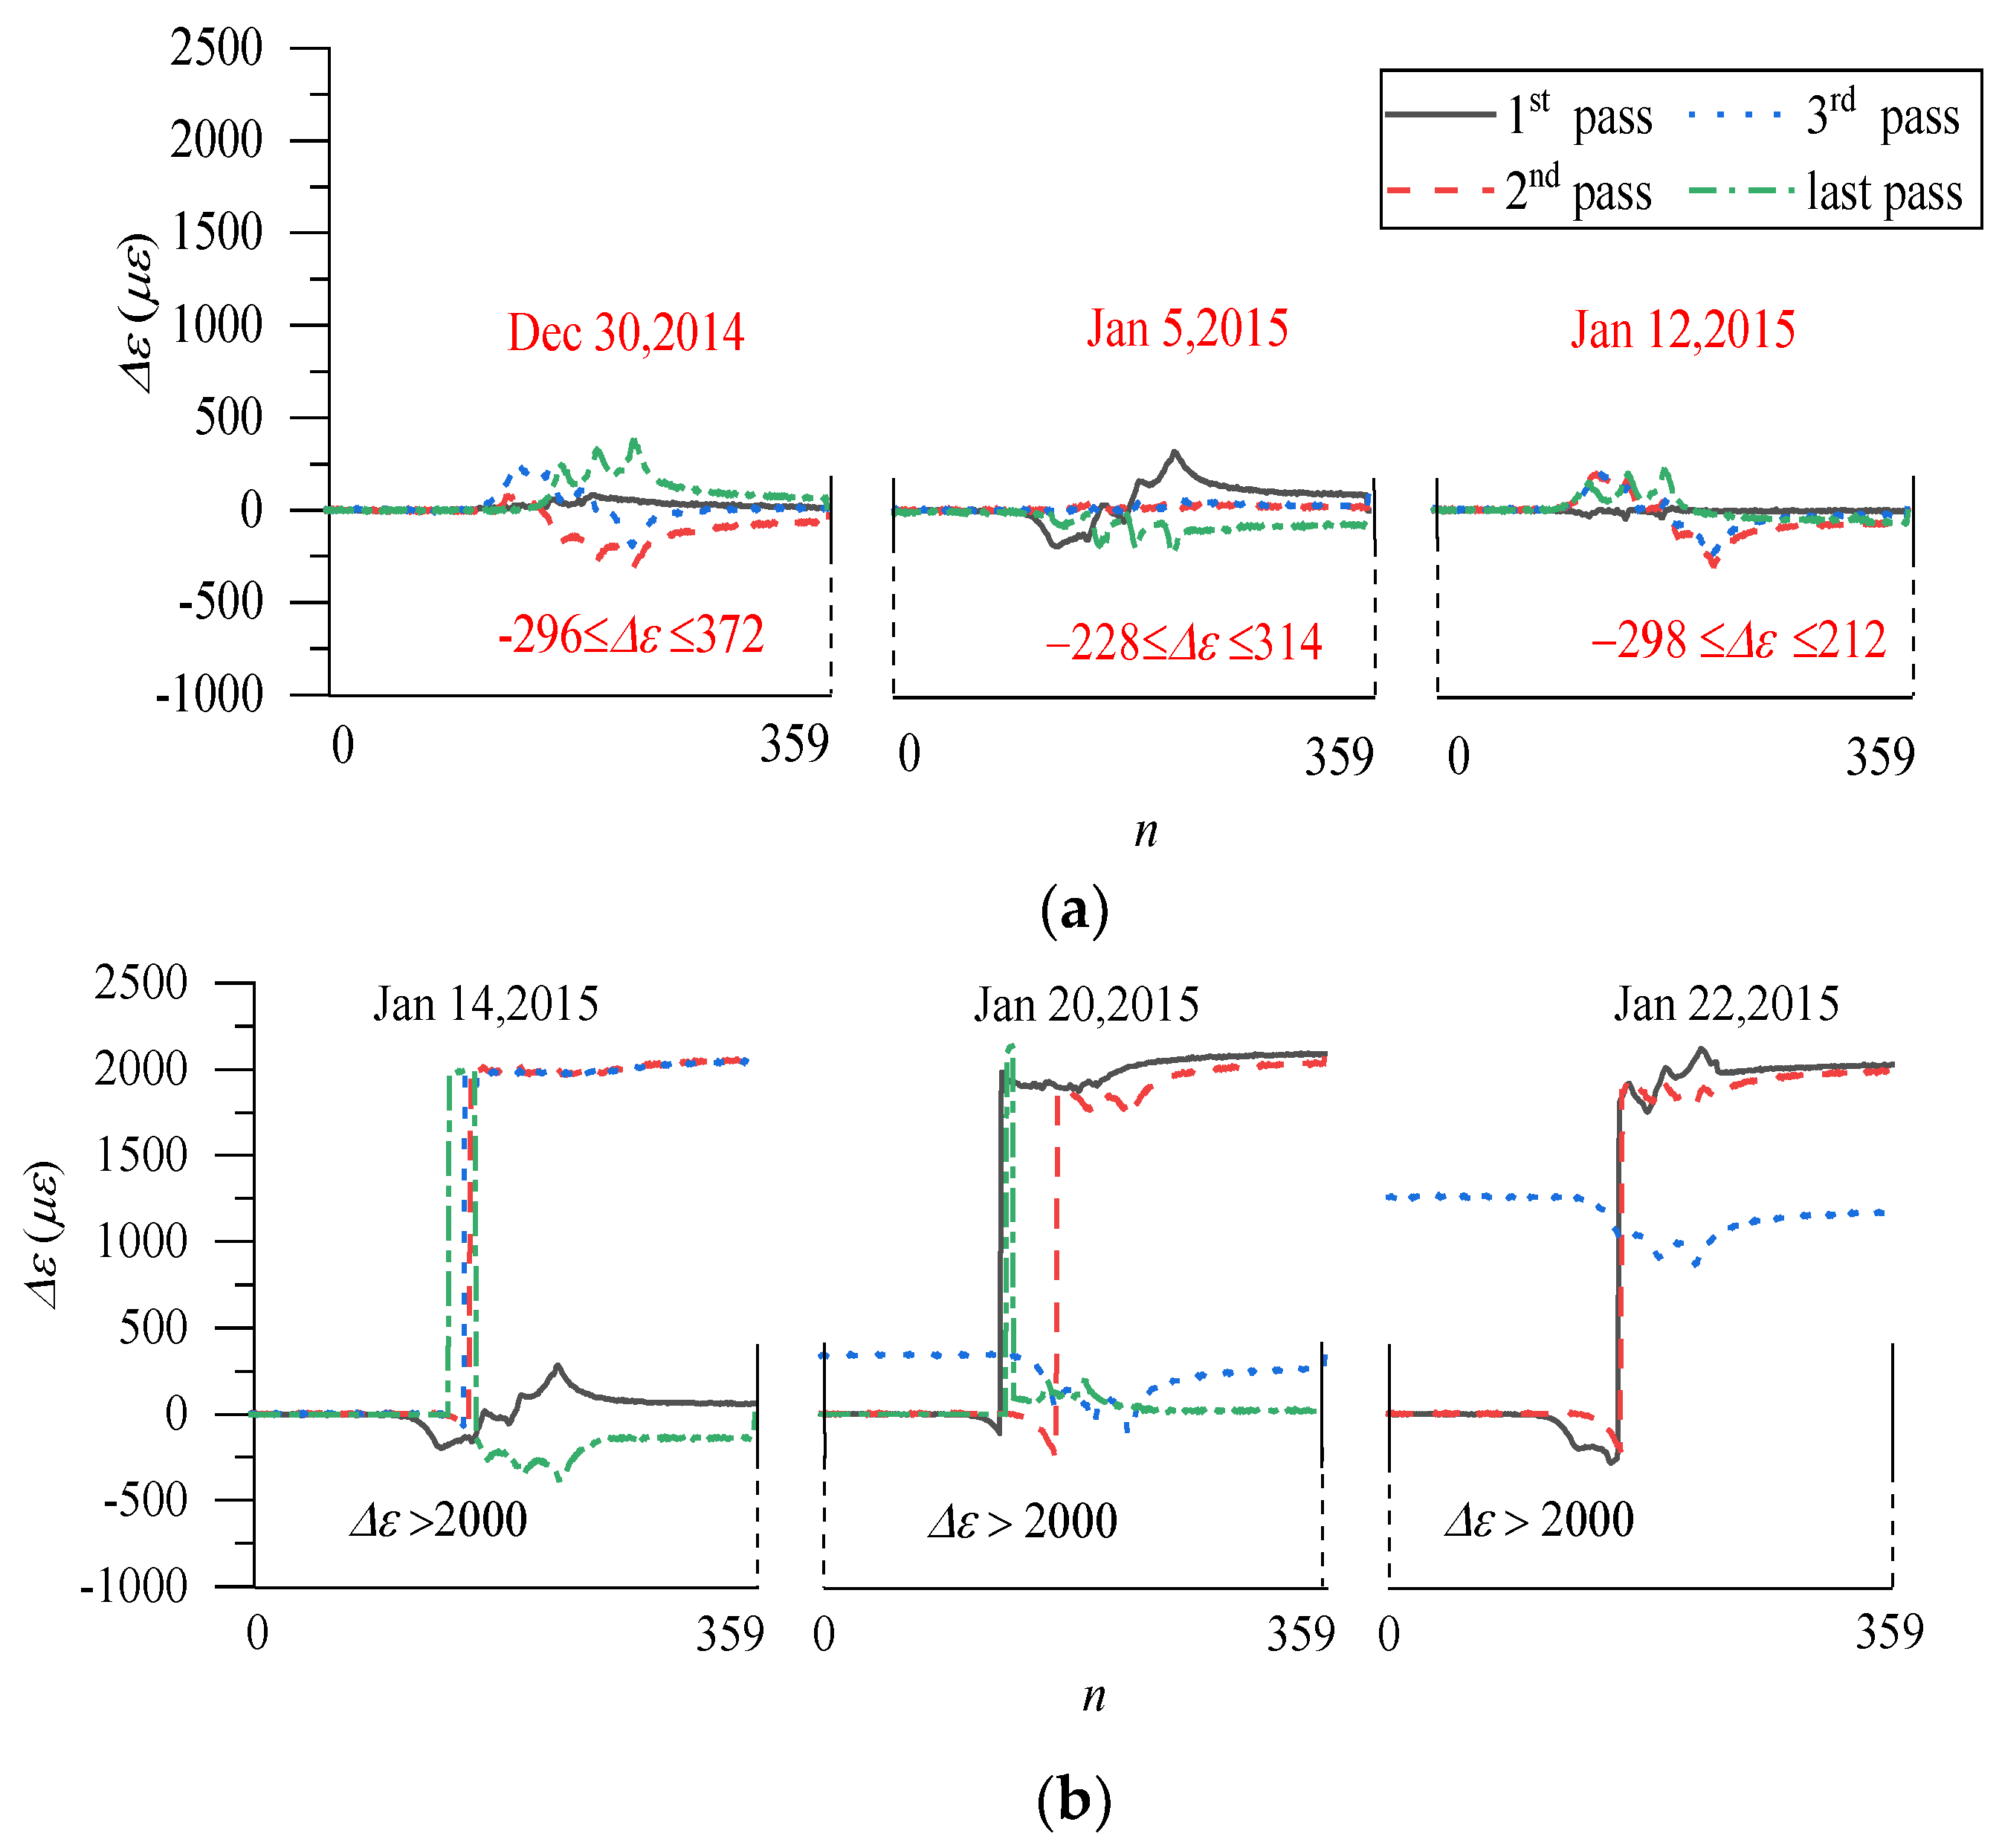
4.5. Evolution Feature of State-of-Stress Mode Δε around Point A
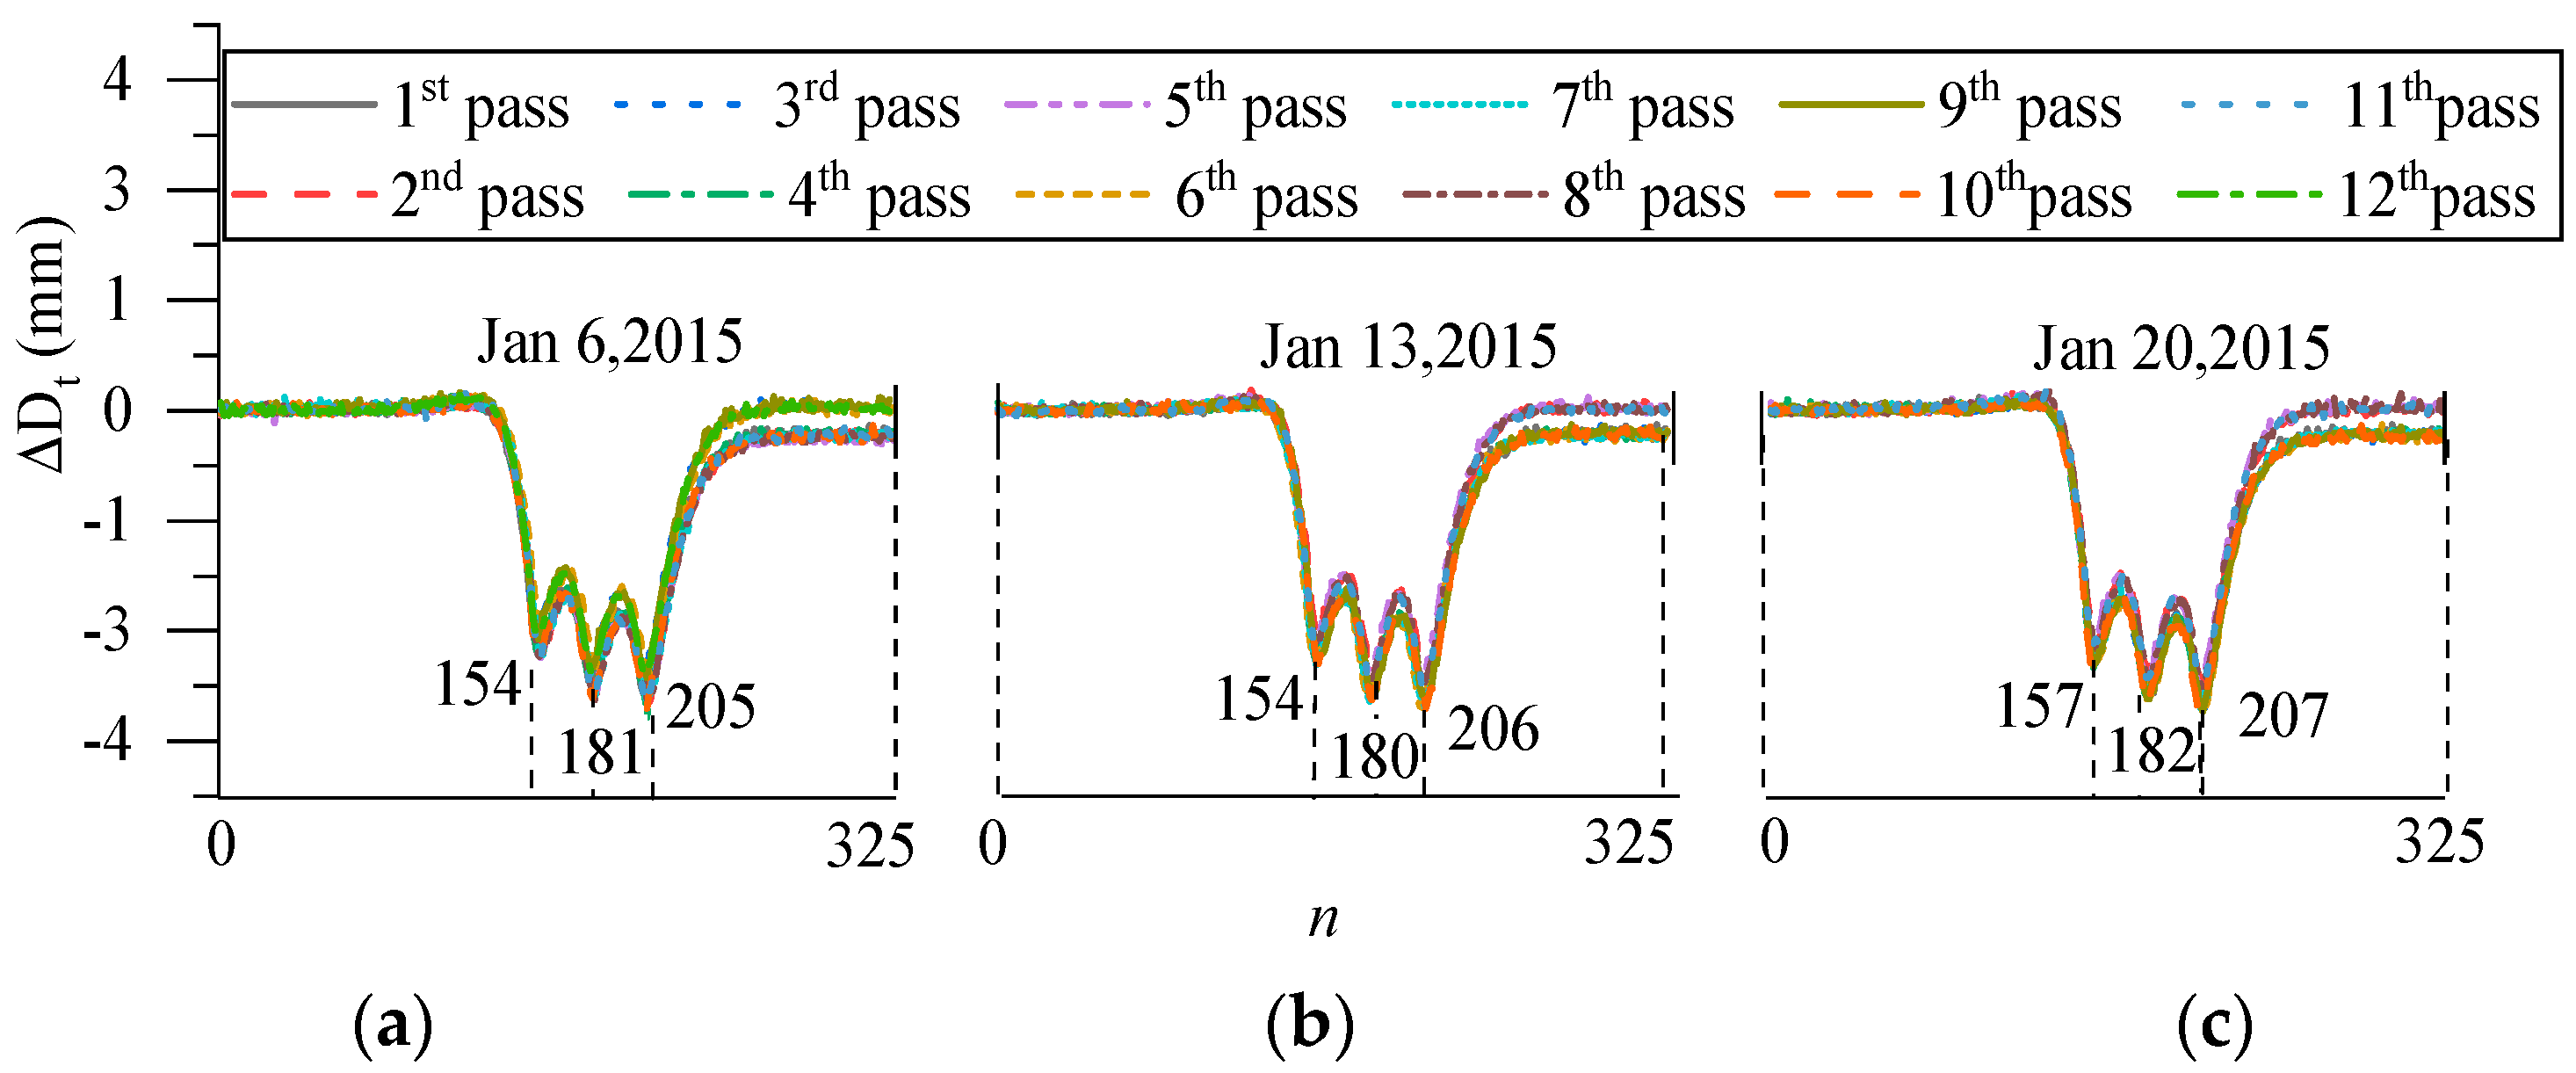
4.6. Evolution Features of State-of-Stress Mode around Points A, B and C
5. Discussion
6. Conclusions
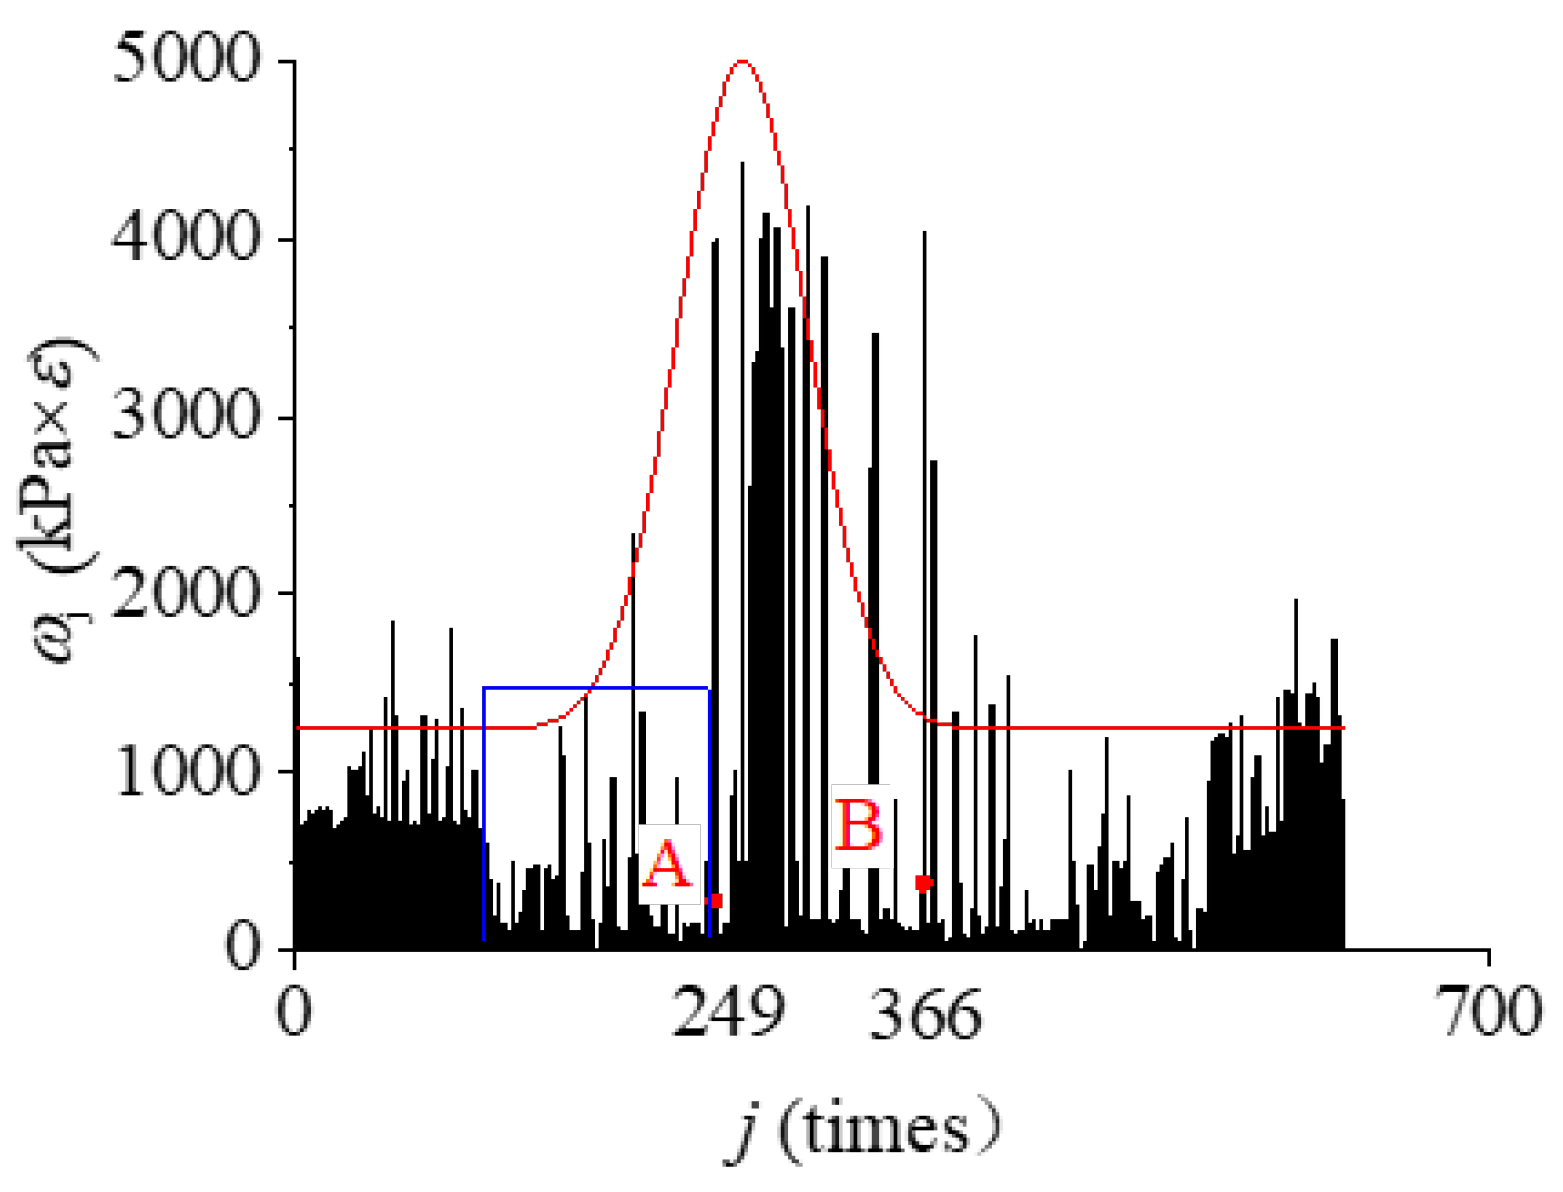
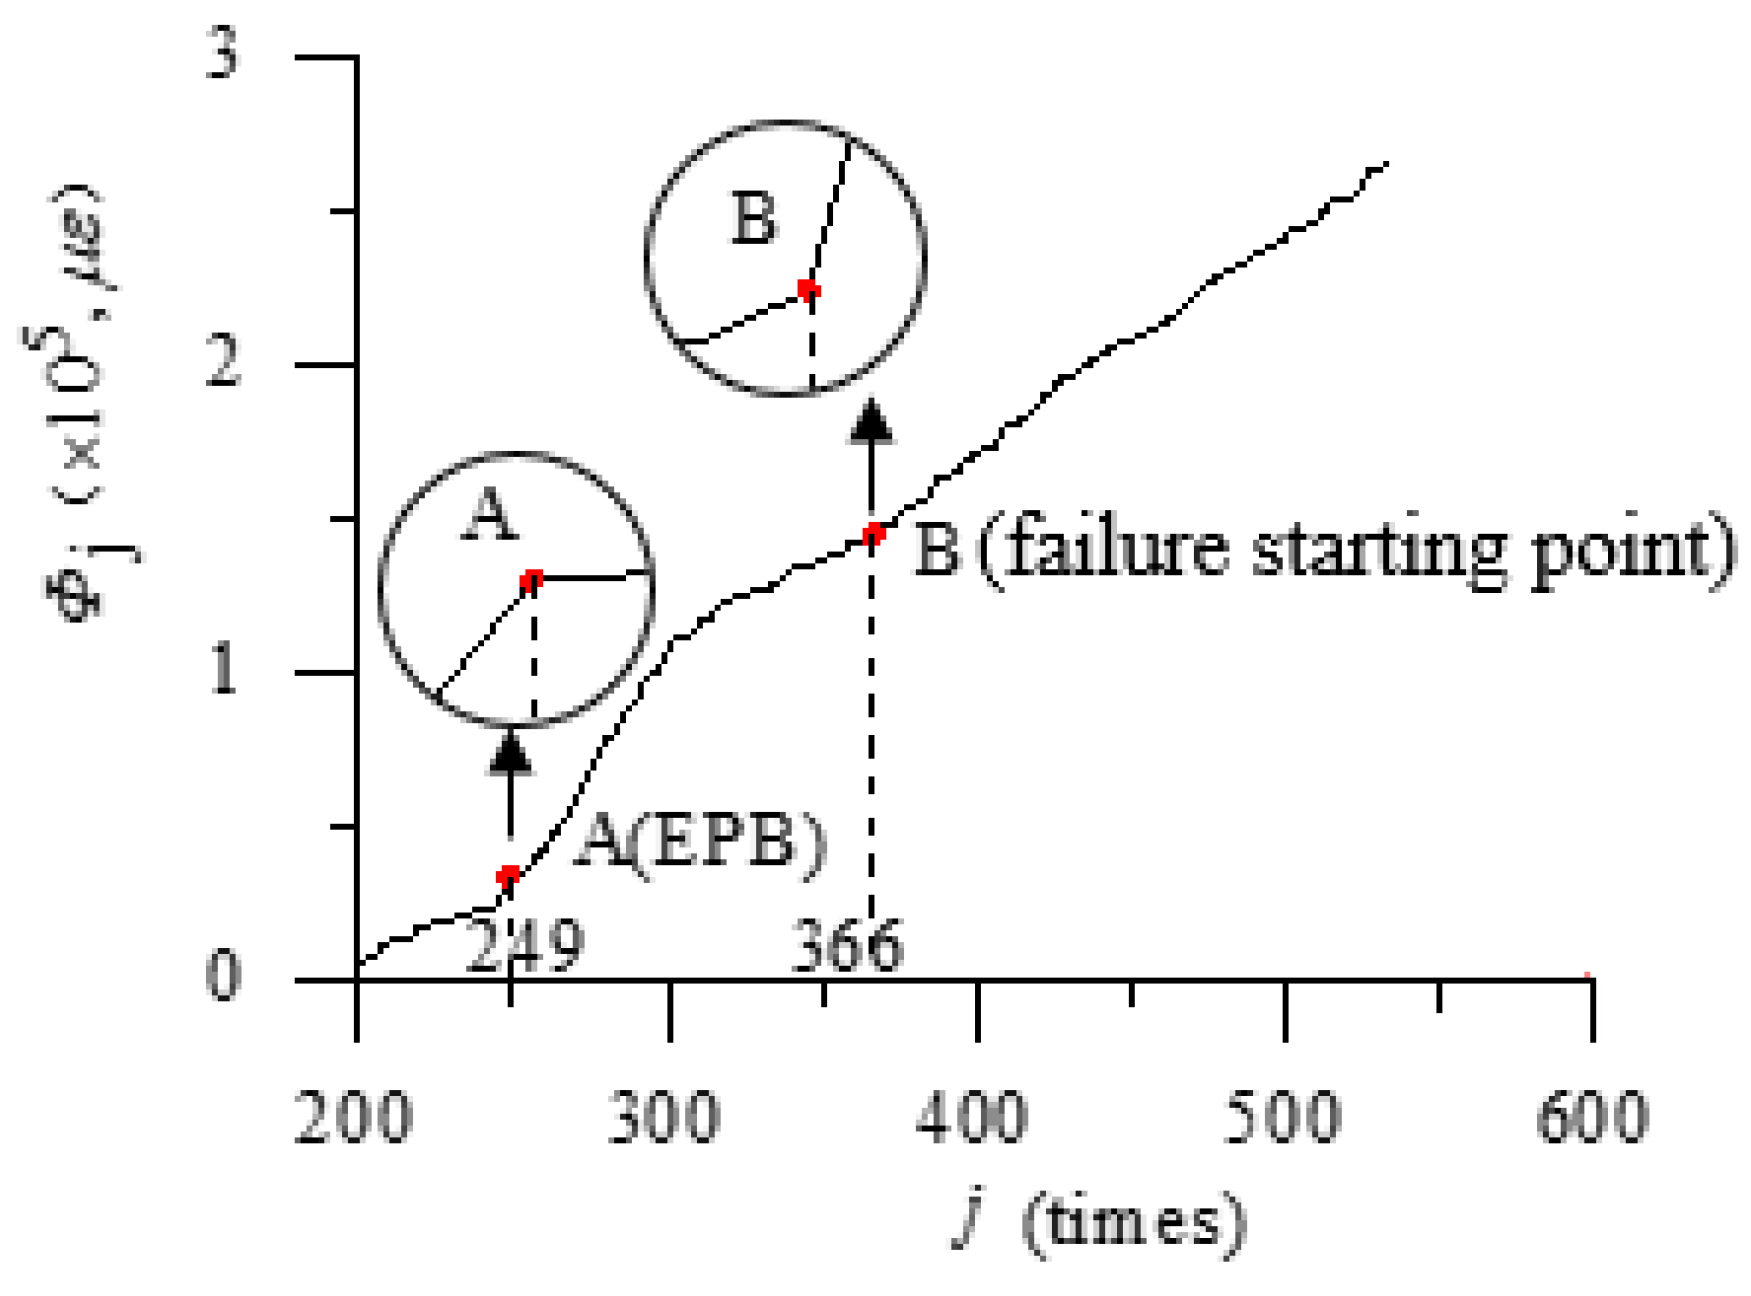
- The proposed methods can derive the state variables and form the state-of-stress modes and the characteristic parameters that embody the essential features in the working process of the asphalt airport pavement. The slope increment criterion can detect the essential state-of-stress mutation features in the evolution curves of the characteristic parameters. Correspondingly, the investigation into the evolution curves of the state-of-stress mode also presents the mutation features. The mutation points reveal the EPB point at the traffic pattern number 249 and the real traffic pass number 5762, the failure starting point at 367 and 10,004 and the progressive point at 422 and 11,548. The characteristic points of the asphalt airport pavement are the reflection of the natural law of a quantitative change to qualitative change.
- The evolution of the state-of-stress characteristic parameter presents the mutation feature around the EPB point with the strain accumulation inside the pavement. But, the state-of-stress mode has no obvious change around the EPB point, implying that elastic deformation is a major part of the total deformation before the EPB point.
- The deformation is obviously reflected by the evolution of the state-of-stress mode around the failure starting point. Compared with the state-of-stress mode of the EPB point and failure starting point, it is obvious that the plastic deformation gradually accumulates and becomes dominant from point EPB to the failure starting point. When the plastic accumulation develops to the failure starting point, the evolution curves of mutate to the other shape, which embodies the plastic deformation around the failure starting point from a quantitative change to qualitative change.
- The deformation around the progressive failure point is smallest even opposite among all the deformations in the working process of the pavement. This indicates that the elastic/plastic deformation has completely disappeared and that the pavement has entered a broken state. The state-of-stress mode and the characteristic parameter show that the evolution features are different from those before the progressive failure point.
- The EPB point is the normal working branch point of the pavement service, so it could be directly taken as the design point of the pavement’s load-bearing capacity. The failure starting point is the starting point of the pavement’s failure process, which provides a reference to the design and accurate estimation of safety for asphalt pavements. Therefore, this study could explore a new way to analyze the working law of asphalt airport pavements.
Author Contributions
Funding
Data Availability Statement
Acknowledgments
Conflicts of Interest
References
- Ren, G.; Shen, A.; Wu, H.; Pan, H.; Deng, S.; Wang, L. Mechanical response of flexible asphalt pavement under large temperature difference and temperatures during four seasons. Constr. Build. Mater. 2024, 437, 136967. [Google Scholar] [CrossRef]
- Gayfutdinov, R.; Bajmukhametov, G.; Hafizov, E. Pavement wear process and abrasive wear resistance of asphalt concrete[C]//E3S Web of Conferences. EDP Sci. 2021, 274, 02008. [Google Scholar]
- Bonaquist, R. Impact of Mix Design on Asphalt Pavement Durability; Number E-C 186, Enhancing the Durability Asphalt Pavements; Advanced Asphalt Technologies, LLC, Transportation Research Circular: Washington, DC, USA, 2014. [Google Scholar]
- Lv, S.; Yuan, J.; Peng, X.; Zhang, N.; Liu, H.; Luo, X. A structural design for semi-rigid base asphalt pavement based on modulus optimization. Constr. Build. Mater. 2021, 302, 124216. [Google Scholar] [CrossRef]
- Tan, Y.; Liang, Z.; Xu, H.; Xing, C. Research on Rutting Deformation Monitoring Method Based on Intelligent Aggregate. IEEE Trans. Intell. Transp. Syst. 2022, 23, 22116–22126. [Google Scholar] [CrossRef]
- Hesp, S.A.; Soleimani, A.; Subramani, S.; Phillips, T.; Smith, D.; Marks, P.; Tam, K.K. Asphalt pavement cracking: Analysis of extraordinary life cycle variability in eastern and northeastern Ontario. Int. J. Pavement Eng. 2009, 10, 209–227. [Google Scholar] [CrossRef]
- Kocak, S.; Haider, S.W. Performance and cost evaluations of 100% recycled hot asphalt mixtures for pothole patching applications in flexible pavements. Constr. Build. Mater. 2023, 392, 131921. [Google Scholar] [CrossRef]
- Di Mascio, P.; Moretti, L. Implementation of a pavement management system for maintenance and rehabilitation of airport surfaces. Case Stud. Constr. Mater. 2019, 11, e00251. [Google Scholar] [CrossRef]
- Zhang, Z.; Huang, S.; Zhang, K. Accurate detection method for compaction uniformity of asphalt pavement. Costr. Build. Mater. 2017, 145, 88–97. [Google Scholar] [CrossRef]
- Li, Y.; Liu, L.; Sun, L. Temperature predictions for asphalt pavement with thick asphalt layer. Constr. Build. Mater. 2018, 160, 802–809. [Google Scholar] [CrossRef]
- Zhao, X.; Shen, A.; Ma, B. Temperature response of asphalt pavement to low temperatures and large temperature differences. Int. J. Pavement Eng. 2020, 21, 49–62. [Google Scholar] [CrossRef]
- Miao, Y.; Sheng, J.; Ye, J. An assessment of the impact of temperature rise due to climate change on asphalt pavement in China. Sustainability 2022, 14, 9044. [Google Scholar] [CrossRef]
- Al-Suleiman, T.I.; Shiyab, A.M. Prediction of pavement remaining service life using roughness data—Case study in Dubai. Int. J. Pavement Eng. 2003, 4, 121–129. [Google Scholar] [CrossRef]
- Bailey, R.; Patrick, J.E.; Jackett, R. Relationship between Design and Predicted Performance of New Zealand Pavements; Land Transport New Zealand: Wellington, New Zealand, 2006. [Google Scholar]
- Garber, M.J.; Hoel, L.A. Traffic and Highway Engineering, 4th ed.; Cengage Learning: Boston, MA, USA, 2009. [Google Scholar]
- Yin, H.; Chehab, G.R.; Stoffels, S.M. A case study: Assessing the sensitivity of the coefficient of thermal contraction of AC mixtures on thermal crack prediction. In Asphalt Concrete: Simulation, Modeling, and Experimental Characterization; American Society of Civil Engineers: Reston, VA, USA, 2006; pp. 115–123. [Google Scholar]
- Wen, H.; Li, X. Development of a damage-based phenomenological fatigue model for asphalt pavements. J. Mater. Civ. Eng. 2013, 25, 1006–1012. [Google Scholar] [CrossRef]
- Sharma, H.; Swamy, A.K. Development of probabilistic fatigue curve for asphalt concrete based on viscoelastic continuum damage mechanics. Int. J. Pavement Res. Technol. 2016, 9, 270–279. [Google Scholar] [CrossRef]
- Brill, D.R.; Yin, H. Full-Scale Tests of Aircraft Overloads on Airport Flexible Pavements. In International Conference on Transportation and Development 2018: Airfield and Highway Pavements; American Society of Civil Engineers: Reston, VA, USA, 2018; pp. 66–77. [Google Scholar]
- Yin, H.; Brill, D.R. Concrete Pavement Overload Test at the FAA’s National Airport Pavement Test Facility. In Airfield and Highway Pavements; American Society of Civil Engineers: Reston, VA, USA, 2017; pp. 127–151. [Google Scholar] [CrossRef]
- Chen, E.; Zhang, X. Dynamic Analysis of Viscoelastic Asphalt Pavement under Vehicle–Bridge Interaction Load. J. Transp. Eng. Part B Pavements 2021, 147, 04021050. [Google Scholar] [CrossRef]
- Guo, Y.; Onifade, I.; Birgisson, B. A mass specific volume-based viscoelastic damage model to characterize fatigue damage in asphalt mixtures. Constr. Build. Mater. 2022, 325, 126729. [Google Scholar] [CrossRef]
- Wang, Y.D.; Underwood, B.S.; Kim, Y.R. Development of a fatigue index parameter, Sapp, for asphalt mixes using viscoelastic continuum damage theory. Int. J. Pavement Eng. 2022, 23, 438–452. [Google Scholar] [CrossRef]
- Garg, N.; Hayhoe, G.F. Asphalt concrete strain responses at high loads and low speeds at the national airport pavement test facility (NAPTF). In Advancing Airfield Pavements; American Society of Civil Engineers: Reston, VA, USA, 2001; pp. 1–14. [Google Scholar] [CrossRef]
- Tarefder, R.A.; Saha, N.; Hall, J.W.; Ng, P.T. Evaluating weak subgrade for pavement design and performance prediction: A case study of US 550. J. Geogr. Eng. 2008, 3, 13–24. [Google Scholar]
- Zhuang, C.Y.; Ye, Y.L. Analysis of Stress and Strain for Semi-rigid Asphalt Pavement Based on Accelerated Loading Test. In Applied Mechanics and Materials; Trans Tech Publications Ltd.: Bäch, Switzerland, 2014; Volume 587, pp. 939–942. [Google Scholar] [CrossRef]
- Huang, Q.; Yang, Z.; Yang, C.; Zhang, X. Structural Response of Asphalt Pavement under the Coupling Effect of Subgrade Permanent Deformation and Vehicle Load. In New Frontiers in Road and Airport Engineering; American Society of Civil Engineers: Reston, VA, USA, 2015; pp. 194–203. [Google Scholar]
- Ren, H.; Gu, X.; Liu, Z. Analysis of Mechanical Responses for Semi-Rigid Base Asphalt Pavement Based on MLS66 Accelerated Loading Test. In Proceedings of the 21st COTA International Conference of Transportation Professionals, Xi’an, China, 16–19 December 2021; pp. 732–742. [Google Scholar]
- Liu, Z.; Gu, X.; Ren, H.; Zhou, Z.; Wang, X.; Tang, S. Analysis of the dynamic responses of asphalt pavement based on full-scale accelerated testing and finite element simulation. Constr. Build. Mater. 2022, 325, 126429. [Google Scholar] [CrossRef]
- Ungureanu, D.; Țăranu, N.; Hoha, D.; Zghibarcea, Ș.; Isopescu, D.N.; Boboc, V.; Oprișan, G.; Scutaru, M.C.; Boboc, A.; Hudișteanu, I. Accelerated testing of a recycled road structure made with reclaimed asphalt pavement material. Constr. Build. Mater. 2020, 262, 120658. [Google Scholar] [CrossRef]
- Ma, Z.; Liu, L.; Sun, L. Investigation of top-down cracking performance of in-situ asphalt mixtures based on accelerated pavement testing and laboratory tests. Constr. Build. Mater. 2018, 179, 277–284. [Google Scholar] [CrossRef]
- Liu, Z.; Gu, X.; Ren, H.; Wang, X.; Dong, Q. Three-dimensional finite element analysis for structural parameters of asphalt pavement: A combined laboratory and field accelerated testing approach. Case Stud. Constr. Mater. 2022, 17, e01221. [Google Scholar] [CrossRef]
- Jiang, X.; Titi, H.; Ma, Y.; Polaczyk, P.; Zhang, M.; Gabrielson, J.; Bai, Y.; Huang, B. Evaluating the performance of inverted pavement structure using the accelerated pavement test (APT). Constr. Build. Mater. 2022, 346, 128489. [Google Scholar] [CrossRef]
- Gopalakrishnan, K.; Thompson, M.R. Assessing damage to airport pavement structure due to complex gear loads. J. Transp. Eng. 2006, 132, 888–897. [Google Scholar] [CrossRef]
- Gopalakrishnan, K.; Thompson, M.R. Use of deflection basin parameters to characterize structural degradation of airport flexible pavements. In Advances in Pavement Engineering. Proceedings of the Geo-Frontiers Congress, Austin, TX, USA, Austin, TX, USA, 24–26 January 2005; American Society of Civil Engineers (ASCE): Reston, VA, USA, 2005; pp. 1–15. [Google Scholar] [CrossRef]
- Gopalakrishnan, K.; Thompson, M. Evaluation of traffic induced subgrade stresses in flexible airfield pavements. Road Mater. Pavement Des. 2006, 7, 457–476. [Google Scholar] [CrossRef]
- Garg, N.; Pecht, F.; Jia, Q. Subgrade stress measurements under heavy aircraft gear loading at FAA national airport pavement test facility. In Proceedings of the Geo-Shanghai 2010, Shanghai, China, 3–5 June 2010; ASCE Special Publication No. 203. American Society of Civil Engineers: Reston, VA, USA, 2010; pp. 484–491. [Google Scholar] [CrossRef]
- Sarker, P.; Tutumluer, E.; Garg, N. Analyses of Airport Pavement Rutting Trends in FAA’s NAPTF Construction Cycle 5 Pavement Test Sections. In Airfield and Highway Pavements 2019: Innovation and Sustainability in Highway and Airfield Pavement Technology; American Society of Civil Engineers: Reston, VA, USA, 2019; pp. 407–417. [Google Scholar]
- Wang, H.; Zhao, J.; Hu, X.; Zhang, X. Flexible pavement response analysis under dynamic loading at different vehicle speeds and pavement surface roughness conditions. J. Transp. Eng. Part B Pavements 2020, 146, 04020040. [Google Scholar] [CrossRef]
- Peng, Y.; Xia, S.; Xu, Y.R.; Lu, X.Y.; Li, Y.W. Mechanical Response of Asphalt Surfaces under Moving Traffic Loads Using 3D Discrete Element Method. J. Transp. Eng. Part B Pavements 2022, 148, 04022006. [Google Scholar] [CrossRef]
- Zhou, G.C. Structural State-of-Stress Analysis Theory and Its Applications; Harbin Institute of Technology Press: Harbin, China, 2022; ISBN 978-7-5603-9097-0. [Google Scholar]
- Shen, Z.; Liu, B.; Zhou, G. Stressing state analysis of concrete airport pavement by modeling experimental strain data. Case Stud. Constr. Mater. 2022, 17, e01635. [Google Scholar] [CrossRef]
- Shi, J.; Li, W.T.; Zheng, K.K.; Yang, K.K.; Zhou, G.C. Experimental investigation into stressing state characteristics of large-curvature continuous steel box-girder bridge model. Constr. Build. Mater. 2018, 178, 574–583. [Google Scholar] [CrossRef]
- Shi, J.; Xiao, H.H.; Zheng, K.K.; Shen, J.Y.; Zhou, G.C. Essential stressing state features of a large-curvature continuous steel box-girder bridge model revealed by modeling experimental data. Thin-Walled Struct. 2019, 143, 106247. [Google Scholar] [CrossRef]
- Liu, B.; Zhang, Y.; Li, R.; Zhou, G.; Zhao, Y. Essential stressing state features of spirally reinforced concrete short columns revealed by modeling experimental strain data. Structures 2020, 25, 1–7. [Google Scholar] [CrossRef]
- Shi, J.; Li, P.; Chen, W.; Zheng, K.; Zhou, G. Structural state of stress analysis of concrete-filled stainless steel tubular short columns. Stahlbau 2018, 87, 600–610. [Google Scholar] [CrossRef]
- Liu, B.; Zhao, Y.; Liu, H.; Zhou, G. The hysteretic failure features of reinforced masonry shear walls revealed by modeling experimental residual strain data. J. Earthq. Eng. 2021, 26, 7353–7365. [Google Scholar] [CrossRef]
- Shi, J.; Yang, K.K.; Zheng, K.K.; Shen, J.Y.; Zhou, G.C.; Huang, Y. An investigation into working behavior characteristics of parabolic CFST arches applying structural stressing state theory. J. Civ. Eng. Manag. 2019, 25, 215–227. [Google Scholar] [CrossRef]
- Chen, Z.; Zhao, Y.; Shao, Y.; Zhou, G. Essential state-of-stress features of HBBC connections revealed by modeling simulative strain energy. Eng. Struct. 2021, 230, 111463. [Google Scholar] [CrossRef]
- Chowdury, R. Slope Analysis; Elsevier: Amsterdam, The Netherlands, 2012. [Google Scholar]
- Zhao, Y.; Liu, B.; Li, H.; Liu, H.; Zhou, G. Hysteretic stressing state features of RCB shear walls revealed by structural stressing state theory. Case Stud. Constr. Mater. 2021, 15, e00674. [Google Scholar] [CrossRef]
- Zhang, M.; Zhang, P.; Shao, Y.; Liu, D.; Zhou, G. General working features of axially compressive members revealed by structural stressing state theory. Case Stud. Constr. Mater. 2022, 17, e01292. [Google Scholar] [CrossRef]
- Federal Aviation Administration (2002) FAA’s Website. Available online: http://www.airporttech.tc.faa.gov/naptf/ (accessed on 10 March 2021).
 ” represents the asphalt strain gauges, “
 ” represents the pressure cell, “
 ” represents the multi-depth deflectometer.
” represents the asphalt strain gauges, “” represents the pressure cell, “” represents the multi-depth deflectometer.
” represents the multi-depth deflectometer.
” represents the asphalt strain gauges, “” represents the pressure cell, “” represents the multi-depth deflectometer.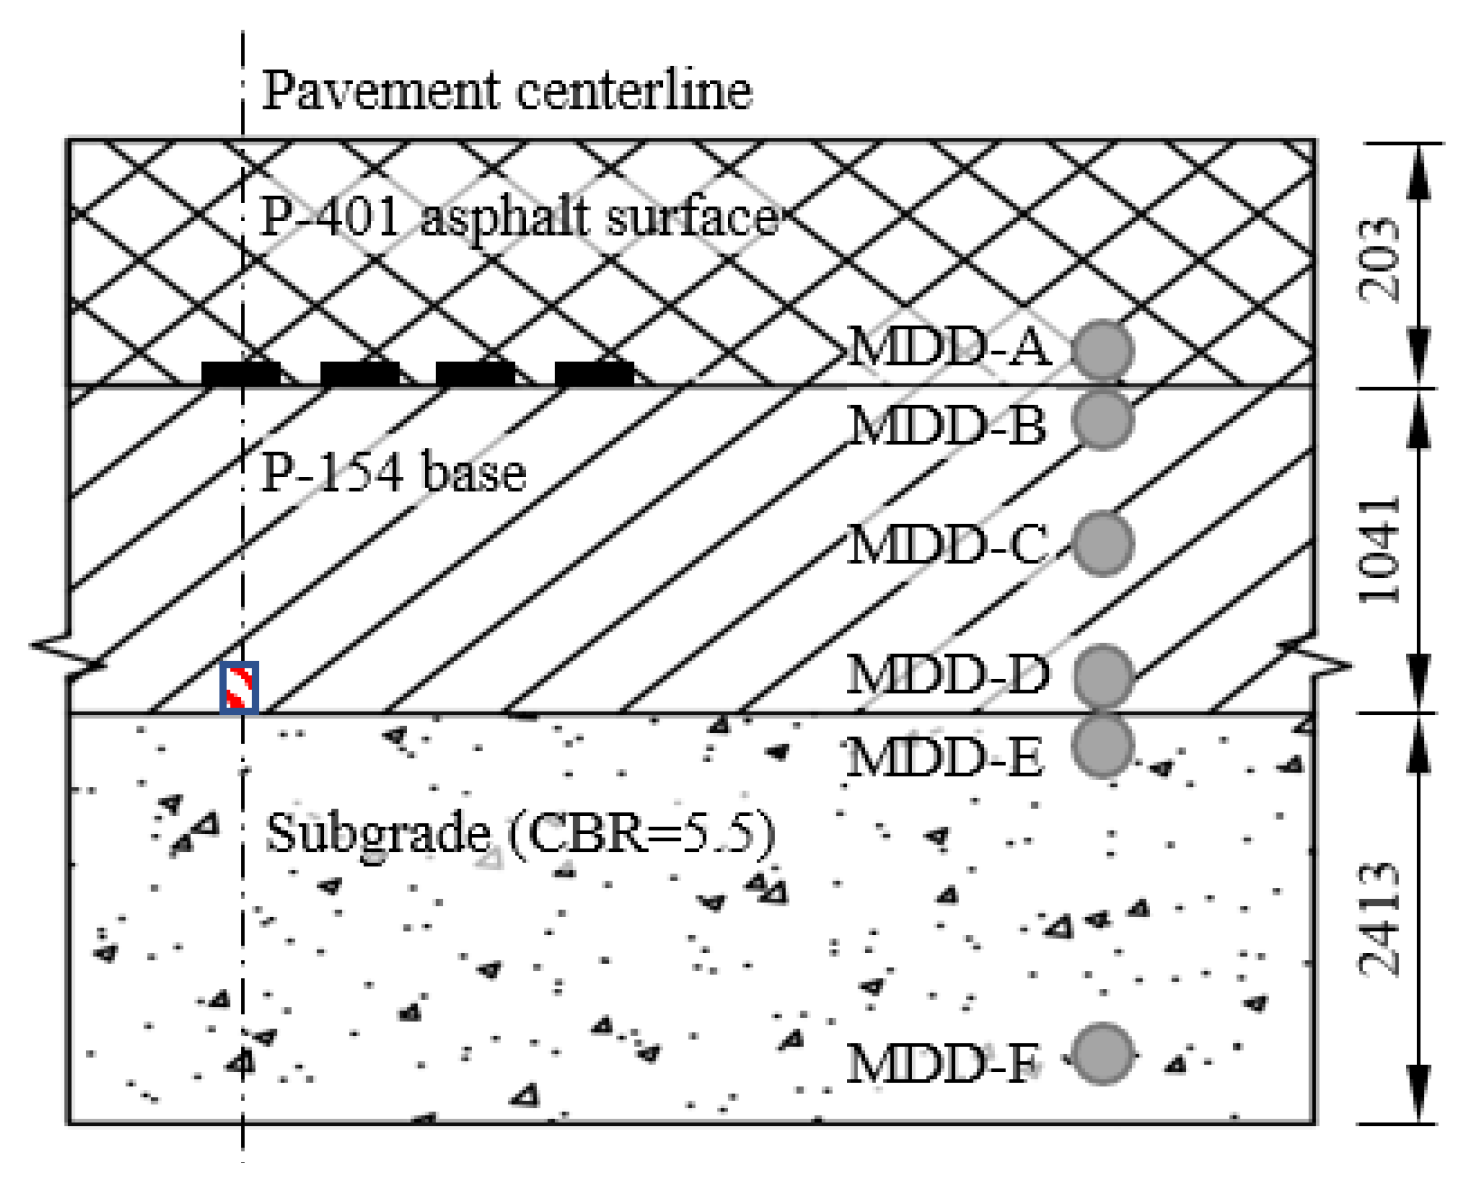


| Date Presenting Point A (13 January 2015) | Three Dates before and after Point A (Before: 30 December 2014 → 5 January 2015; After: 15 January 2015 → 22 January 2015) | |||||||
|---|---|---|---|---|---|---|---|---|
| No. of pass (1, 2, 3, k) | 1 | 2 | 3 | Last k | 1 | 2 | 3 | Last k |
|
Strains (l = 1, 2, …, n) | εl,1 | εl,2 | εl,3 | εl,k | ε′l,1 | ε′l,2 | ε′l,3 | ε′l,k |
|
State variables (Δεt) | ε′l,1 − εl,1 | ε′l,2 − εl,2 | ε′l,3 − εl,3 | ε′l,k − εl,k | ||||
| The Date Presenting Point A (13 January 2015) and the Date before and after Point A (Before: 6 January 2015; After: 20 January 2015) | ||||
|---|---|---|---|---|
| No. of selected pass | 1 | 2 | … | 12 |
|
MDD-A (l = 1, 2, …, n) | dAl,1 | dAi,2, | … | dAl,12 |
|
MDD-F (l = 1, 2, …, n) | dFl,1 | dFl,2 | … | dFl,12 |
|
State variables () | dFl,1 − dA,1l | dFl,2 − dAl,2 | … | dFl,12 − dAl,12 |
Disclaimer/Publisher’s Note: The statements, opinions and data contained in all publications are solely those of the individual author(s) and contributor(s) and not of MDPI and/or the editor(s). MDPI and/or the editor(s) disclaim responsibility for any injury to people or property resulting from any ideas, methods, instructions or products referred to in the content. |
© 2024 by the authors. Licensee MDPI, Basel, Switzerland. This article is an open access article distributed under the terms and conditions of the Creative Commons Attribution (CC BY) license (https://creativecommons.org/licenses/by/4.0/).
Share and Cite
Chen, S.; Liu, J.; Zhou, G.; Hou, X. Essential Working Features of Asphalt Airport Pavement Revealed by Structural State-of-Stress Theory. Buildings 2024, 14, 2707. https://doi.org/10.3390/buildings14092707
Chen S, Liu J, Zhou G, Hou X. Essential Working Features of Asphalt Airport Pavement Revealed by Structural State-of-Stress Theory. Buildings. 2024; 14(9):2707. https://doi.org/10.3390/buildings14092707
Chicago/Turabian StyleChen, Shuaikun, Jianmin Liu, Guangchun Zhou, and Xiaomeng Hou. 2024. "Essential Working Features of Asphalt Airport Pavement Revealed by Structural State-of-Stress Theory" Buildings 14, no. 9: 2707. https://doi.org/10.3390/buildings14092707
APA StyleChen, S., Liu, J., Zhou, G., & Hou, X. (2024). Essential Working Features of Asphalt Airport Pavement Revealed by Structural State-of-Stress Theory. Buildings, 14(9), 2707. https://doi.org/10.3390/buildings14092707