Article

Thermal Environments of Residential Areas: Sunlight and Building Shadow in a Chinese City with Hot and Humid Summers

1
School of Architecture and Art, Central South University, Changsha 410083, China
2
China Machinery International Engineering Design & Research Institute Co., Ltd., Changsha 410021, China
*
Author to whom correspondence should be addressed.
Buildings 2024, 14(9), 2730; https://doi.org/10.3390/buildings14092730
Submission received: 22 April 2024 / Revised: 24 August 2024 / Accepted: 27 August 2024 / Published: 31 August 2024

Abstract

:
With a primary focus on sunlight and building shadows, we studied the impact of residential building orientation angles, building heights, and area combinations, as well as the underlying surface materials, on the outdoor thermal environment in Changsha, a city located north of the Tropic of Cancer. On the basis of Changsha’s regulations, the research results indicate that building orientation angles of 15–45° and 315–345° can generate more building-shadow areas and have a better effect on improving the outdoor thermal environment. Based on the study of many common residential block building layouts in Changsha, we believe that, for point-pattern residential blocks, an increase in building lengths can be very effective for increasing building-shadow areas and thermal comfort. For row-pattern residential blocks, an increase in building heights can be regarded as more effective for increasing building-shadow areas and reducing air temperatures. Shadow areas formed on impervious surface material areas, such as concrete pavements, reduce the air temperature more than shadow areas formed on natural surfaces, such as grasslands. For the planning and regeneration of residential areas, urban planners should focus on placing more green spaces in areas which are seldom or never covered by building shadows; they should also focus on installing more impervious surfaces in areas covered by building shadows. These strategies are beneficial for making full use of building shadows to reduce air temperatures in residential areas.

1. Introduction

Anthropogenic CO2 emissions are the main cause of global warming [1]. In 2011–2020, the global surface temperature reached 1.1 °C above the 1850–1900 level. If no sufficient actions are taken, the global surface temperature might be 1.5 °C higher than the 1850–1900 level in the near future (2021–2040) [2]. If global warming continues, it will lead to an increased frequency of extreme weather events. This not only affects local ecological environments but also has an impact on human health [3,4,5]. In the increasingly urbanized world, an increasing number of cities tend to continuously expand outward [6]. These expansions can exacerbate the urban heat-island effect, leading to cities being less livable [7,8,9]. Urban planners should pay more attention to improving the thermal comfort of different cities in their efforts to make cities more socially, economically, and environmentally sustainable.
It is imperative to improve the urban outdoor thermal environment and reduce the negative impact of climate change and the urban heat-island effect. Scholars from various countries and fields have paid close attention to this issue and conducted many studies. These include studies of the atmospheric heat-island effect and the land-surface heat-island effect in cities [10,11]. Research on the atmospheric heat-island effect largely relies on observation data from meteorological stations or from data collected by researchers through portable devices. Computational fluid-dynamic software programs, such as ENVI-met 5.1, Ansys fluent 2020R2, and OpenFOAM v2012, have been used for simulation studies on the basis of the spatial layout and meteorological conditions of the study areas [12]. The number of meteorological stations is generally small, and the data collected from these meteorological stations may have a weak representativeness, limiting our understanding of the meteorological conditions of a given city [13]. Thus, the accuracy of studies on the thermal comfort of cities based on near-surface air temperatures can be influenced. These are the main reasons that explain why, in recent years, an increasing number of researchers have been focusing on the study of land-surface temperatures rather than near-surface air temperatures [14]. Xiang et al. (2023) used Changsha, China, as a case study and explored the relationship between near-surface air temperatures and land-surface temperatures. They pointed out that the reliability of either land-surface temperatures or near-surface air temperatures is limited for characterizing the long-term urban heat-island effect. Thus, near-surface air temperatures should be as highly valued as land-surface temperatures in urban heat-island studies [14].
As one of the most important elements of the urban surface, urban buildings, their layout, height, density, etc., can significantly affect the urban thermal environment [15]. Gago et al. (2013) found that different building layouts will produce different airflows, thus affecting the microclimate in a city [16]. Because different cities have different climate characteristics, land uses, building features, and vegetation types, the most beneficial building layout for thermal comfort may be different in different cities. For example, Ren et al. (2022) studied the thermal comfort of a metropolitan city (Zhengzhou, China) with a large amount of high-rise and multistory buildings based on local climate zones (LCZs). They found that, within LCZs with many high-rise and multistory buildings in a city center and on the periphery of the city, compact building layouts can contribute to higher air temperatures. Thus, a dispersed building layout is more beneficial for thermal comfort [17]. Li et al. (2022) studied the impacts of different residential area layouts on thermal comfort in the megacity of Beijing, China. They considered three different residential layouts (parallel, enclosed, and semi-enclosed layouts). They pointed out that the enclosed layout is the most beneficial for thermal comfort in the summer [18]. Kleerekoper et al. (2015) studied the impact of the urban form of buildings in the Netherlands on thermal comfort in the summer. They mainly studied low-rise buildings. Many urban areas in the Netherlands contain low-rise buildings rather than high-rise buildings, which is different from the urban areas in Beijing and Zhengzhou. They found that a more concentrated courtyard urban layout leads to the best summer thermal comfort and that a relatively dispersed singular and linear urban layout leads to relatively low summer thermal comfort [19]. Some scholars believe that the strength of the urban heat-island effect increases with an increase in building density. For example, Meng et al. (2022) studied the buildings in the fourth ring road of Beijing and found that the land-surface temperature in the urban building area is positively correlated with the building density, with correlations of 0.501, 0.536, 0.476, and 0.299 in the four seasons, respectively [20]. Some scholars also believe that the strength of the urban heat-island effect is inversely proportional to the building density. For example, in the high-density building area of Hong Kong, China, when the building density increases from 30% to 40%, the daytime heat-island effect decreases by 0.77 °C. However, the significance of building density on the urban heat-island effect is low at night [21].
Some researchers have previously studied the impact of building shadows on thermal comfort. For example, Han et al. (2023) explored the thermal comfort of several north–south-oriented urban-canyon scenario models considering the tree-coverage ratio, the green-coverage ratio, the water-coverage ratio, and time-varying building shadows. They found that trees can improve thermal comfort in the various built contexts of shaded and unshaded street canyons [22]. Sun et al. (2024) explored the cooling effects of green spaces and building shadows in urban communities. They found that building shadows and green spaces are the main drivers of cooling. In high-rise-building communities, the cooling effects of building shadows are greater than vegetation patterns [23]. Ramadhan et al. (2021) used Universitas Kebangsaan, Bandung City, as a case study for exploring the outdoor thermal comfort of an educational building complex. They pointed out that the sky-view factor (SVF) (an indicator of the shading factor) should be supported by vegetation-coverage conditions and pavement materials for the exploration of thermal comfort [24]. Galal et al. (2020) explored the impacts of urban form factors on the thermal comfort of five areas in Egypt. They found that the extent of closure, the floor-area ratio, and building orientation are factors that have considerable influence on thermal comfort at both block and street scales. In addition, they pointed out that shading is an important factor that can have a considerable influence on microclimate [25]. Rilatupa (2009) considered the impacts of building orientation on the thermal comfort of indoor environments. They pointed out that certain factors, including the shadow patterns, vegetation around the building, space volume, the material type used, and the opening widths, had an obvious impact on indoor thermal comfort. These should all be valued when people consider the thermal comfort of indoor environments [26]. Acero et al. (2021) studied the effect of building shadow and cloudiness on the mean radiant temperature in Singapore, which is a tropical country. They pointed out that street orientation and aspect ratio have an important effect on solar access and mean radiant temperature (Tmr). However, they believe it is necessary to conduct a detailed analysis of the effects that govern Tmrt in different climate contexts [27].
For urban planners, it is crucial to optimize the urban layout for the purpose of mitigating the negative impacts of the heat-island effect, since no human-made machinery/equipment (e.g., air conditioning) can be used effectively in the outdoor environment. Some areas are limited by certain conditions and cannot use increased greening measures to improve the outdoor thermal environment. Therefore, some scholars suggest that, under limited conditions, the layout of buildings can be used to form effective shadow areas, thereby improving the thermal environment of outdoor spaces [22,28,29]. In addition, an increasing number of scholars believe that adding some artificial structures is an effective way of providing a shading and cooling effect, thus mitigating the negative impact of heat islands. For example, Pont et al. (2022) designed a human-made smart and urban tree (an artificial structure) to increase shaded areas. These studies all show the critical necessity of the use of shade in mitigating the negative impact of urban heat islands [30].
Residential blocks are an important part of built-up urban areas. The comfortable outdoor activity spaces in residential areas can create a center for neighborhood interaction and can play an active role in solving the problem of apathy among neighbors [31]. The reasonable use of shade can improve outdoor spaces in residential areas; this can reduce the adverse impacts of urban heat islands and provide comfortable outdoor activity spaces. Therefore, from the perspective of urban planning and regeneration, it is particularly important to explore how we can reasonably utilize the areas shaded by residential buildings. Furthermore, different cities are located at different longitudes and latitudes and within different climate zones, and they also have different building characteristics. Thus, the optimum building layout to maximize thermal comfort will be different for different cities [27]. This study used Changsha, China, as a case of a city with a hot and humid summer; this study comprehensively explores the air temperature of residential areas based on sunlight and building shadows.

2. Materials and Methods
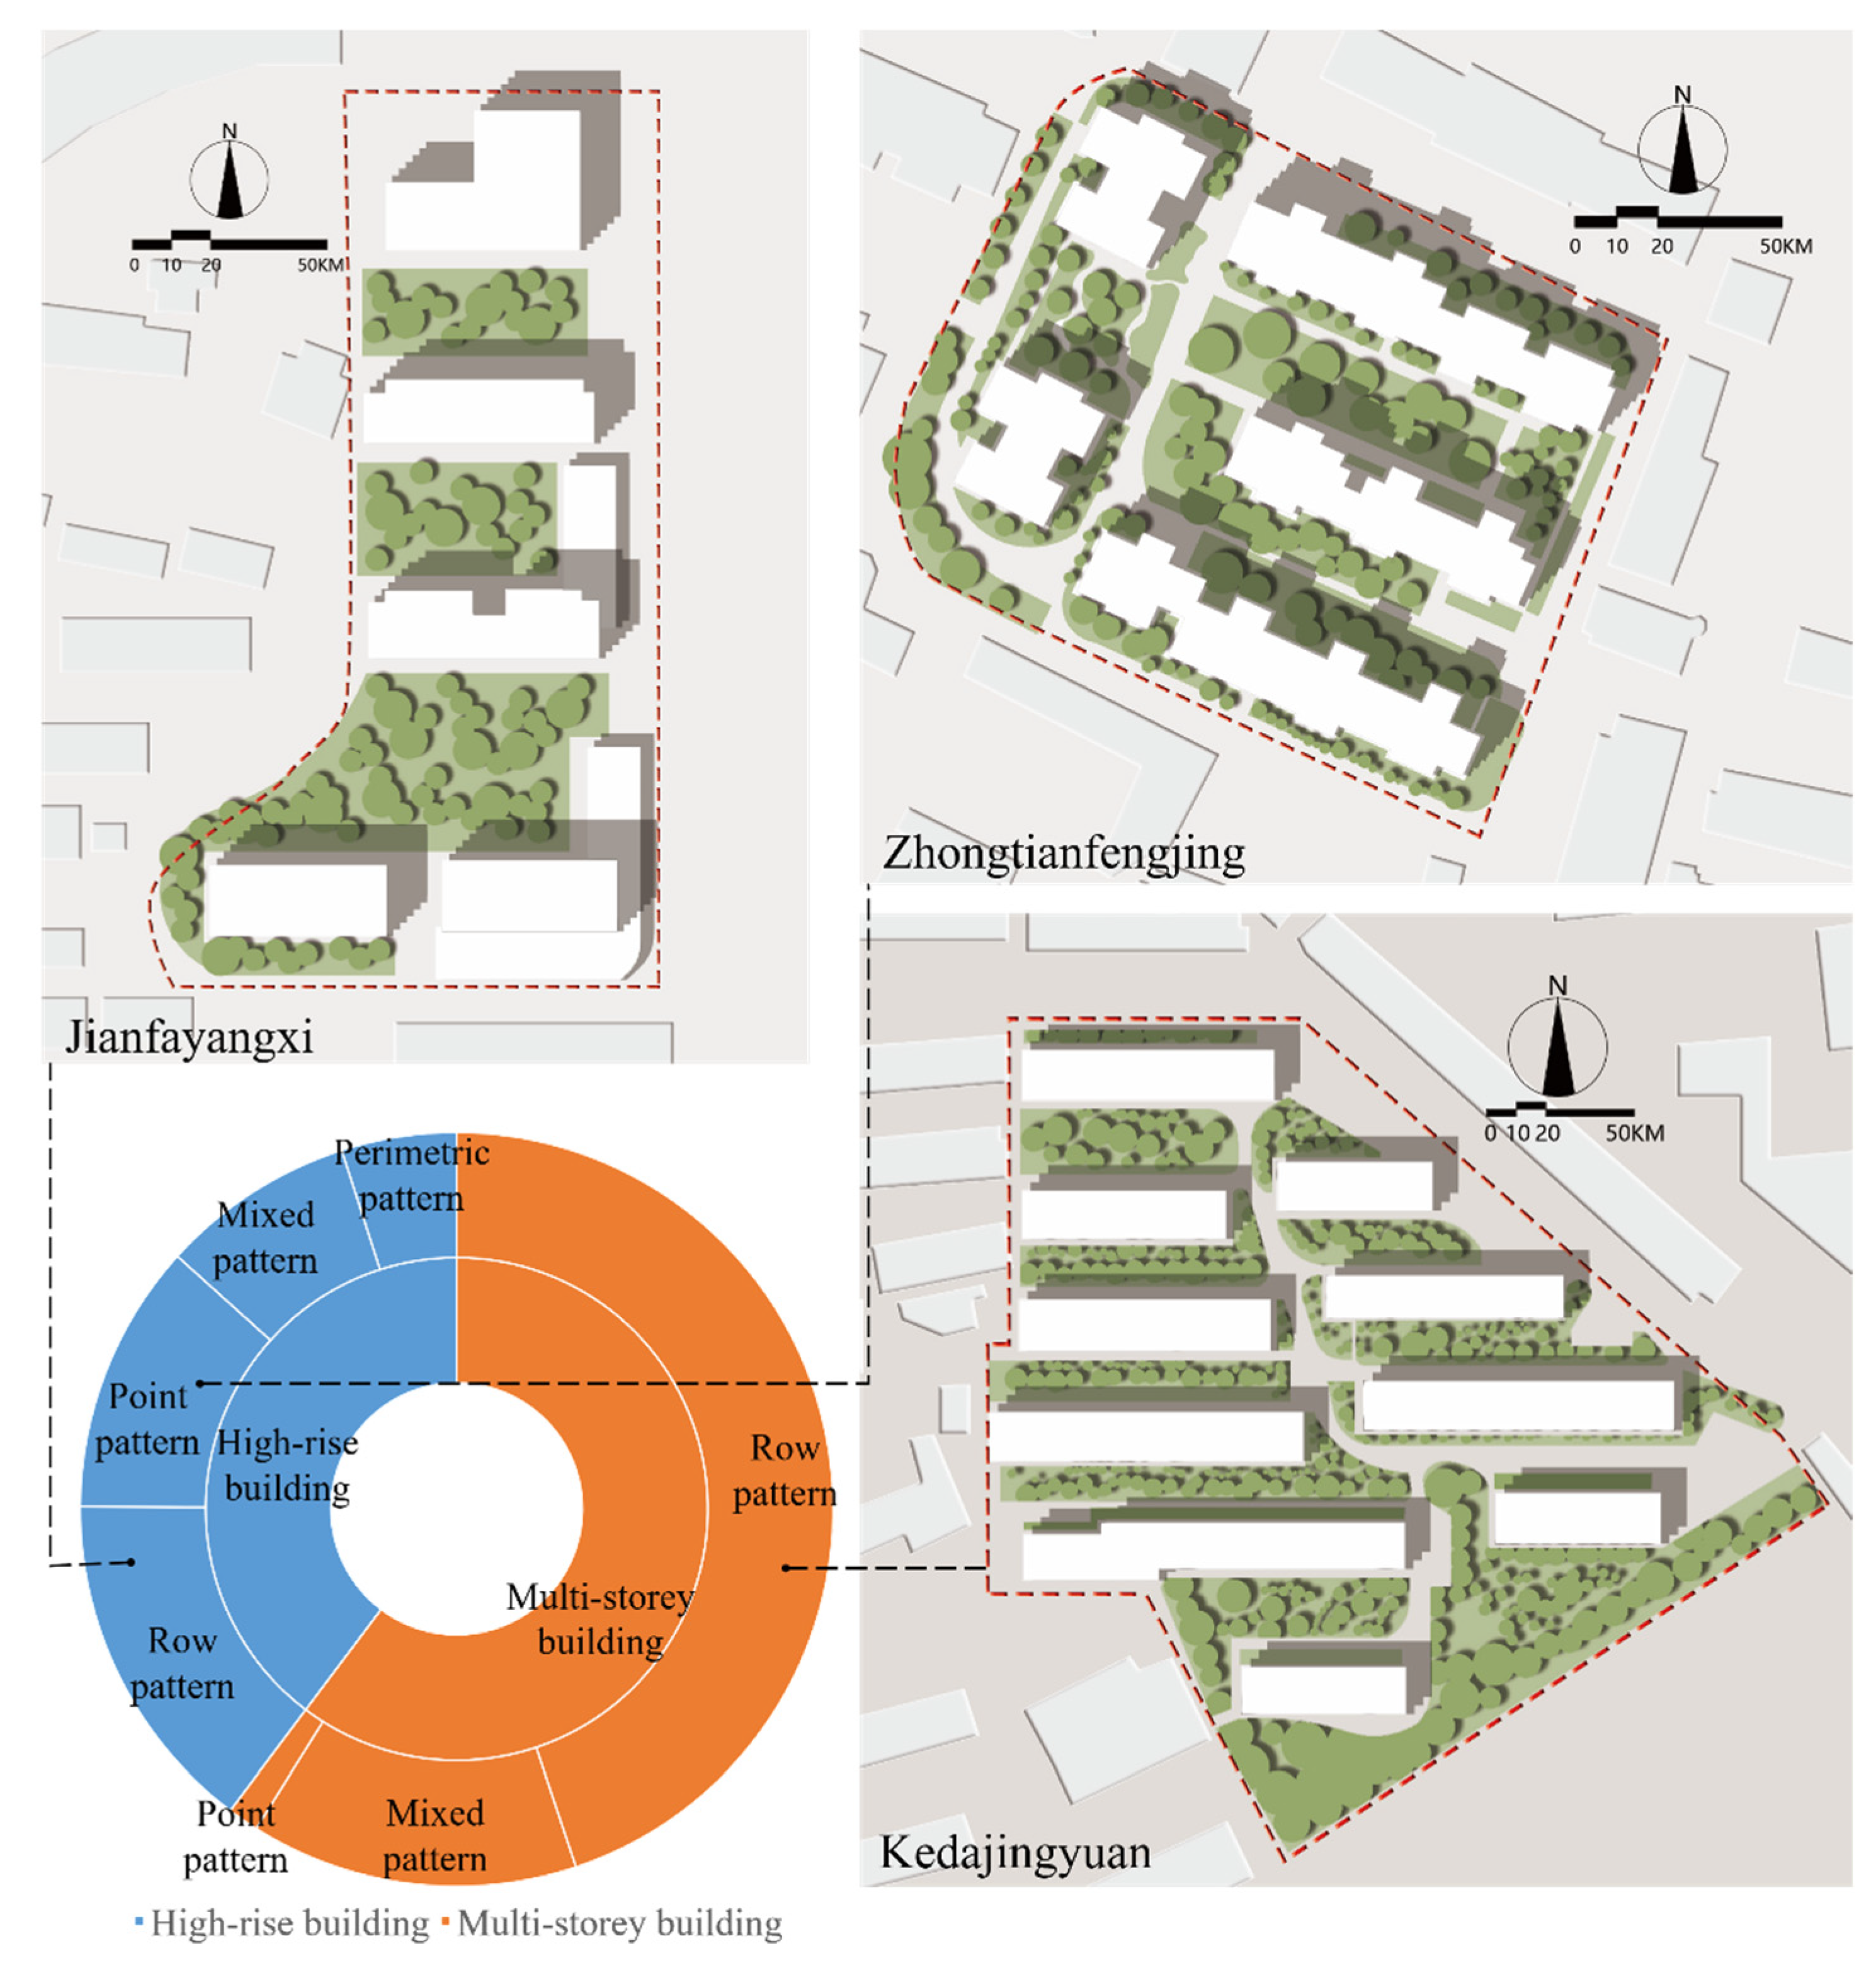
2.1. Study Area

Changsha (111°53′–114°15′ E and 27°51′–28°41′ N) is a metropolitan city located in the central–south part of China; it has a subtropical monsoon climate and is remote from the sea. According to the Köppen–Geiger climate classification, which was updated by Beck et al. (2018), Changsha is located in a Cfa zone. The main characteristic feature is temperature. There is no dry season, and the summer is hot [32]. The Chinese Uniform Standard for the Design of Civil Buildings (GB50352-2019) divides the different areas of China into seven building climate zones. Changsha is located in the hot summer–cold winter zone [33]. Figure 1 shows the geographical location of Changsha, as well as the main study area, i.e., the area within the second ring road. The location of the study area was marked by us based on the maps downloaded from Guihuayun [34]. The area within the second ring road of Changsha has a large number of skyscrapers and is quite representative of a Chinese metropolitan city. In 2023, the total permanent population of the city was 10.5131 million people [35,36]. The terrain of the city is like a funnel that opens northward. In the summer, the southeast monsoon cannot penetrate the city well. Meanwhile, in the winter, the northwest monsoon can accumulate southward. Therefore, Changsha is hotter in summer and slightly colder in winter than many other cities in the same latitude area [35].

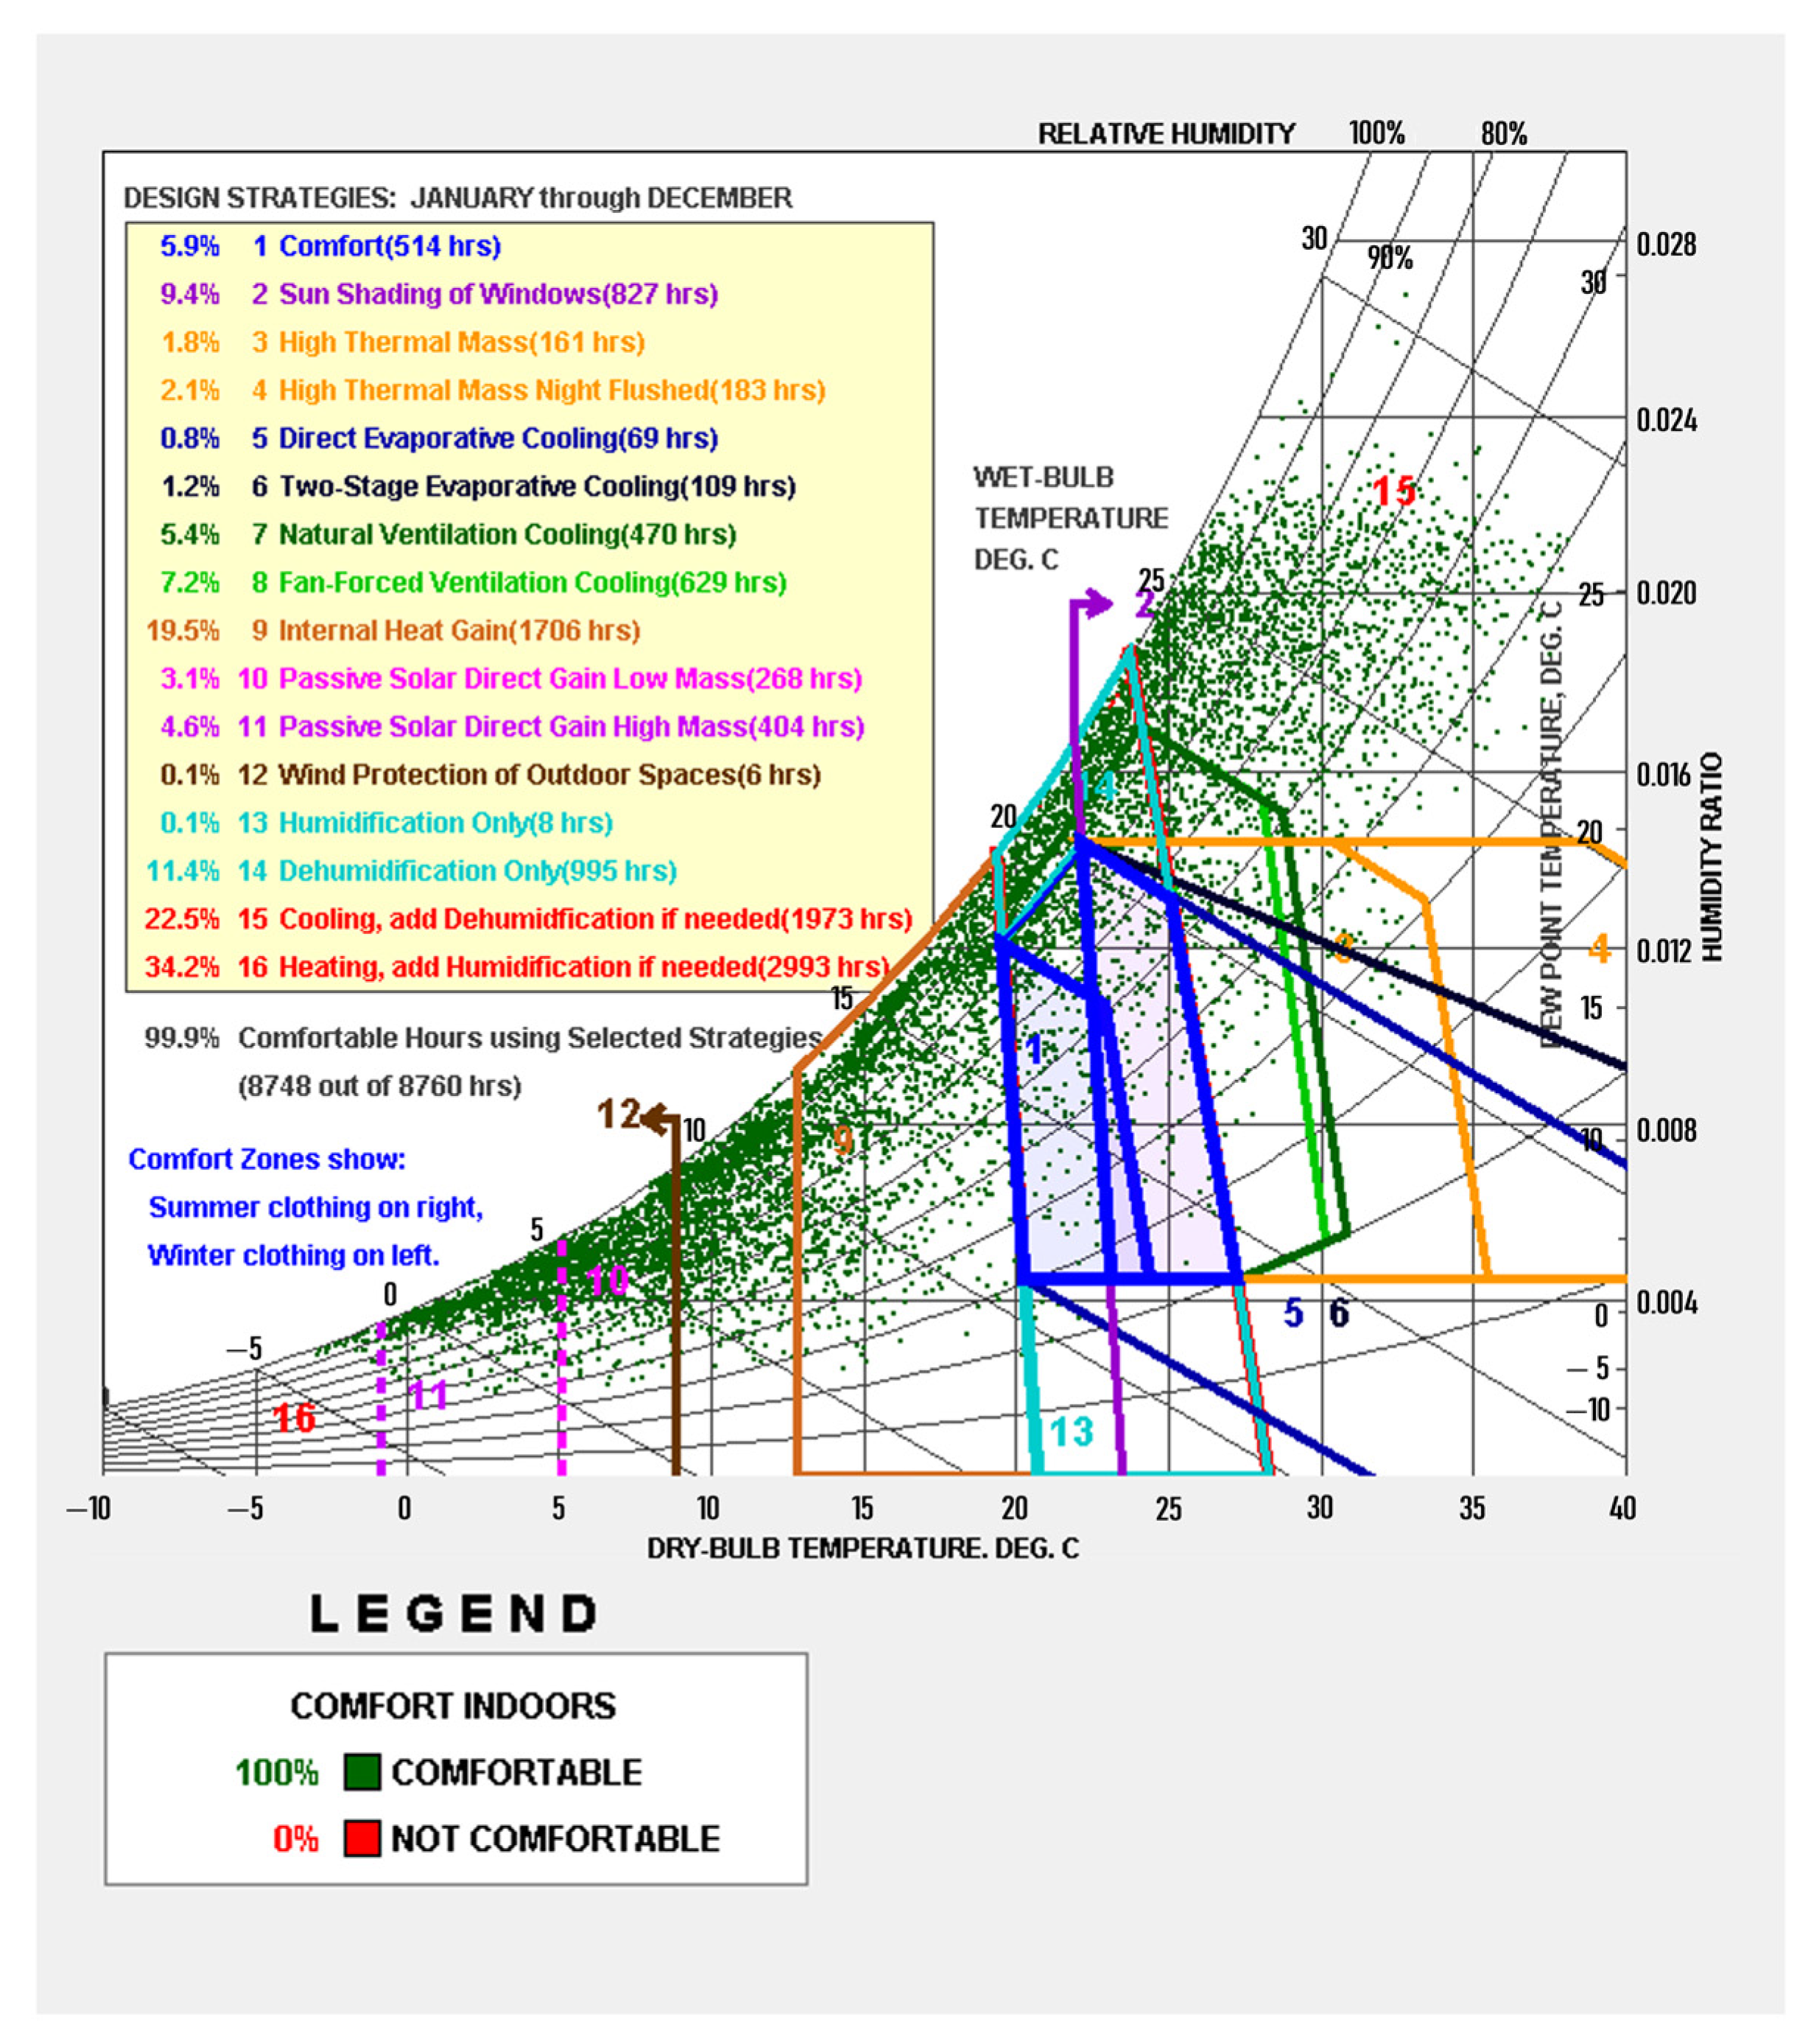
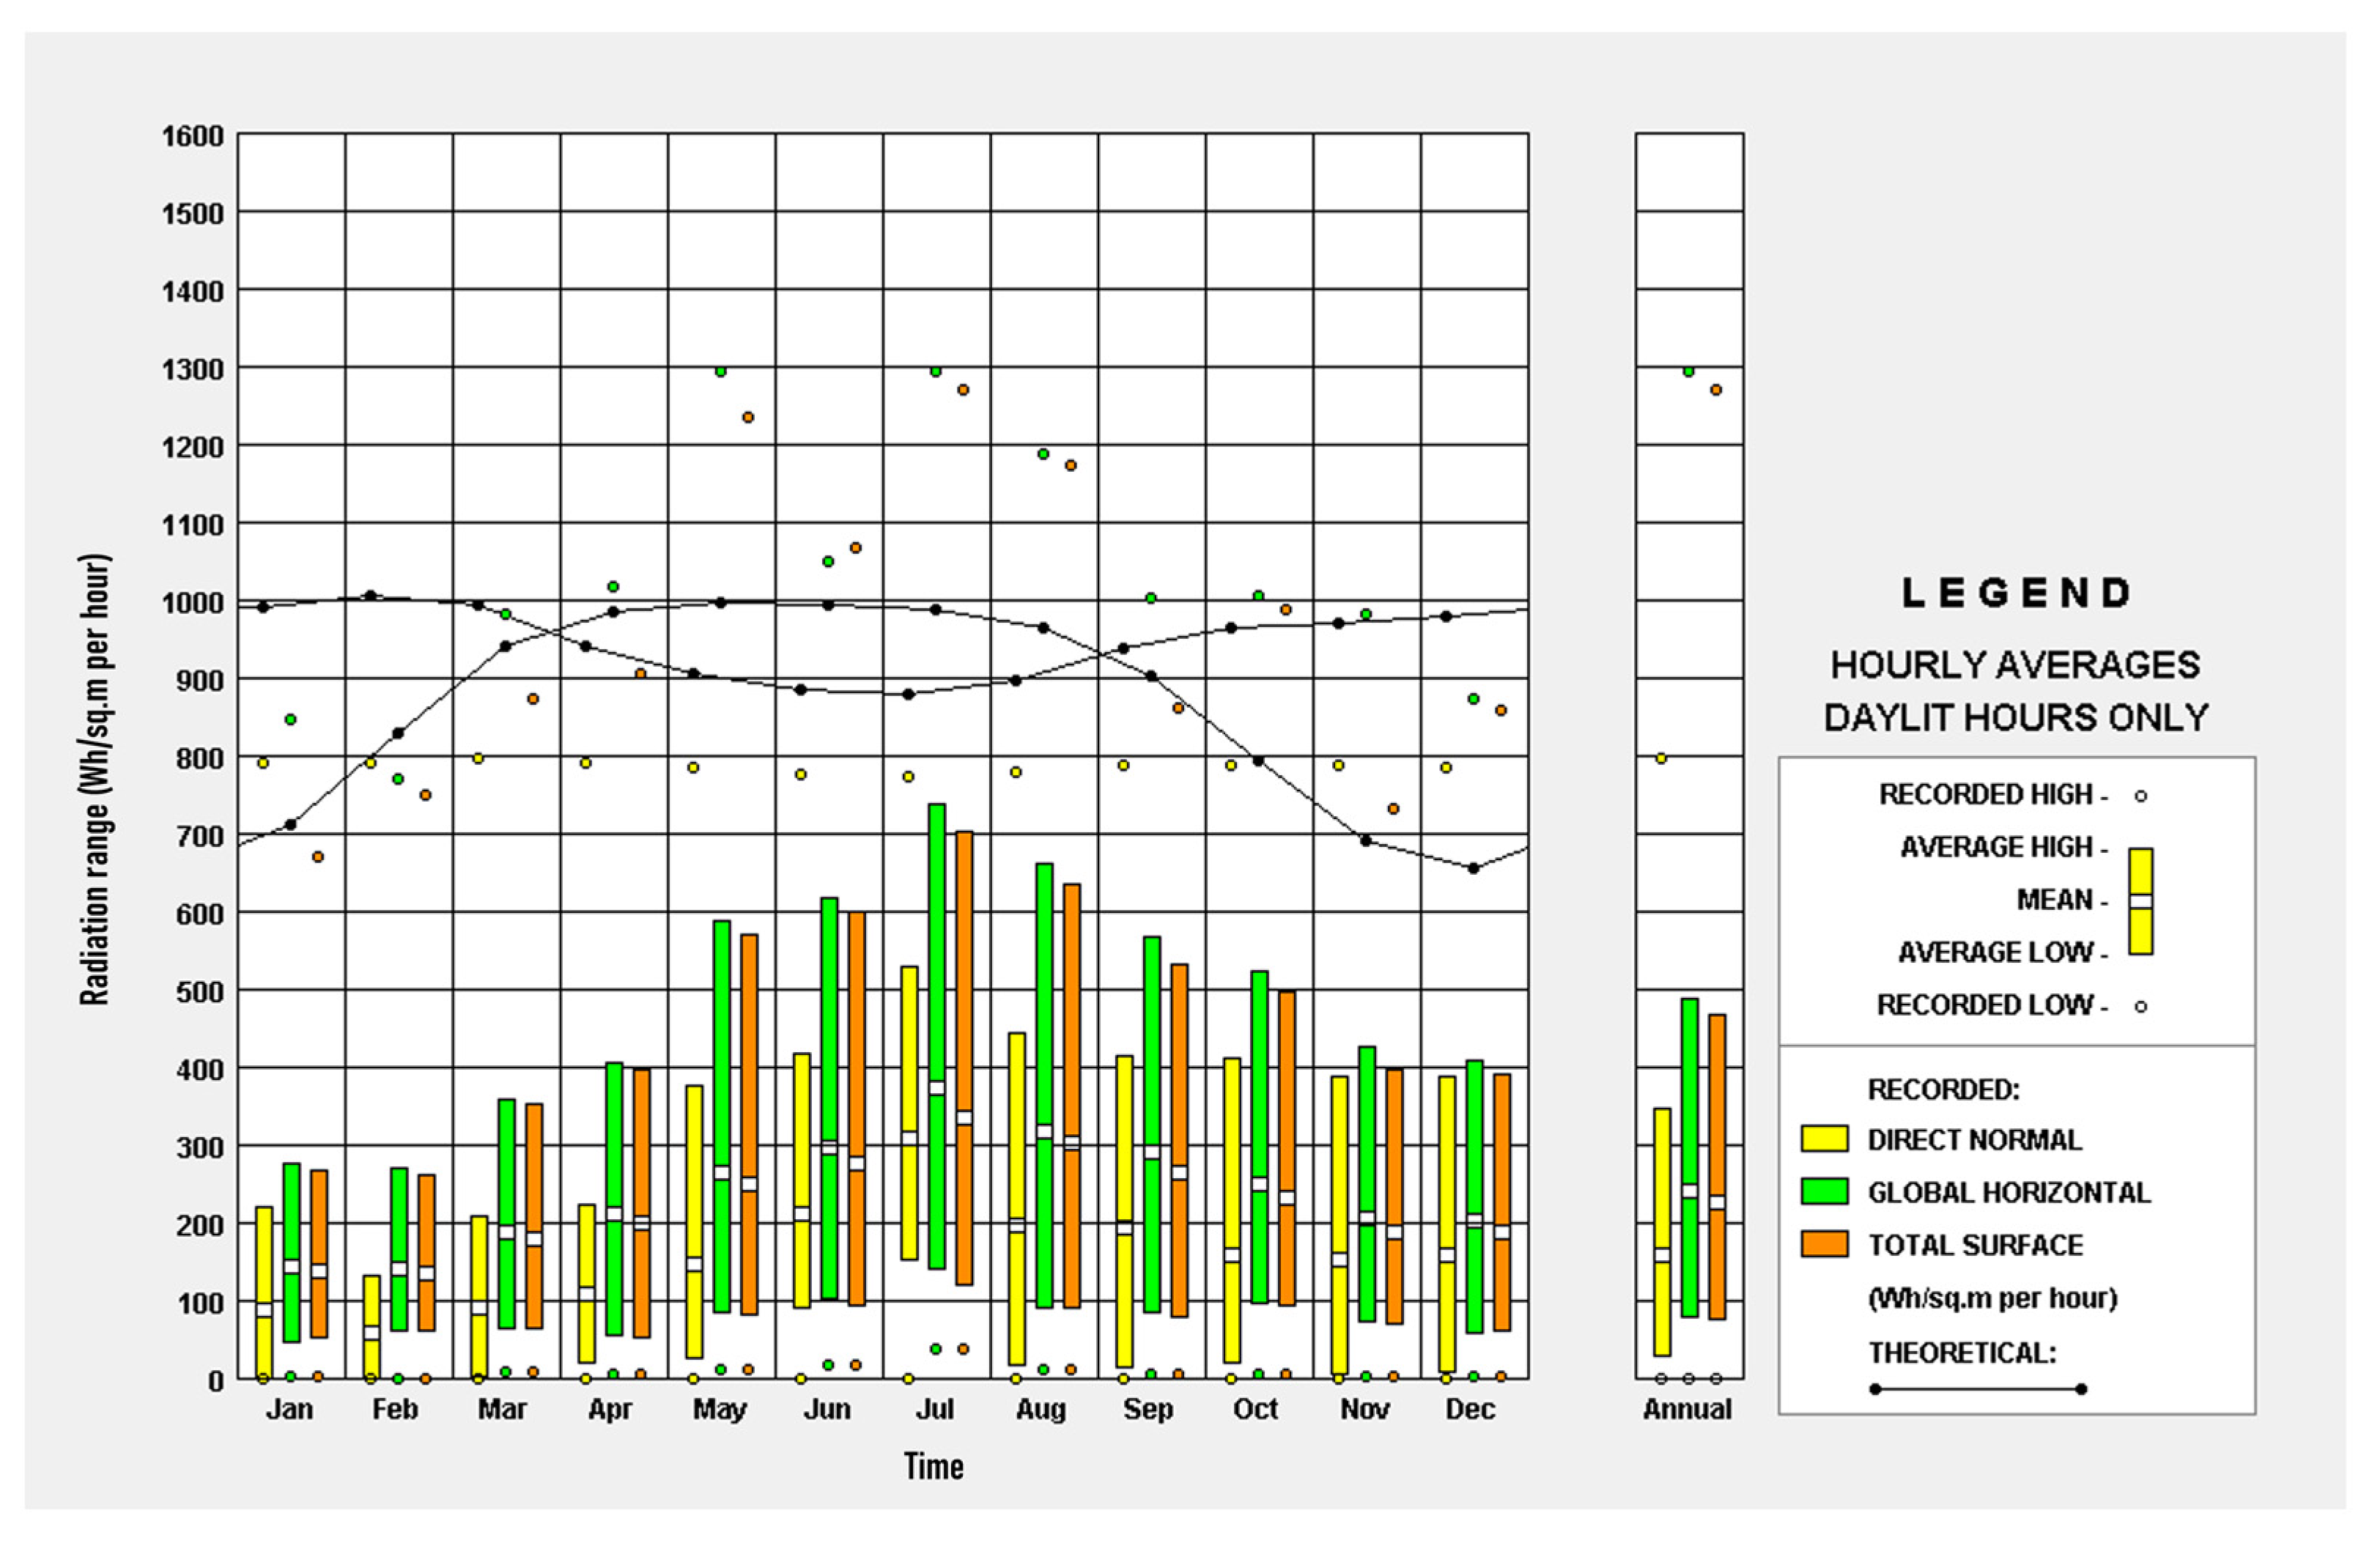
2.2. City-Scale Climate Analysis

To build a better understanding of the climate of Changsha and lay a solid foundation for the building shadow and microscale study, the meteorological analysis software Climate Consultant 6.0 was used for a city-scale climate analysis in Changsha. The software was developed by the Department of Architecture and Urban Design at the University of California, Los Angeles (UCLA), in Los Angeles, CA, the United States. It is based on the theoretical research results of Baruch Givoni and Murray Milne [37,38,39]. This software can be used to visualize the climate data in an EPW format on the Energy Plus website and convert the data into easily understandable graphics, such as the trajectory of the sun and temperature changes. At the same time, it can also be used to explore urban design strategies based on climate data like enthalpy and humidity maps. This software provides four thermal comfort models, including ① the California Energy Code Comfort Model, 2013 (DEFAULT); ② the ASHRAE Standard 55 and Current Handbook of Fundamental Model; ③ the ASHRAE Handbook of Fundamentals Comfort Model up through 2005; and ④ the Adaptive Comfort Model in ASHRAE Standard 55-2010. Considering that this study focuses on outdoor thermal environments, we have selected ③ the ASHRAE Handbook of Fundamentals Comfort Model up to 2005 to analyze the meteorological conditions in the research area.

2.3. Block-Scale Microclimate Simulation Study

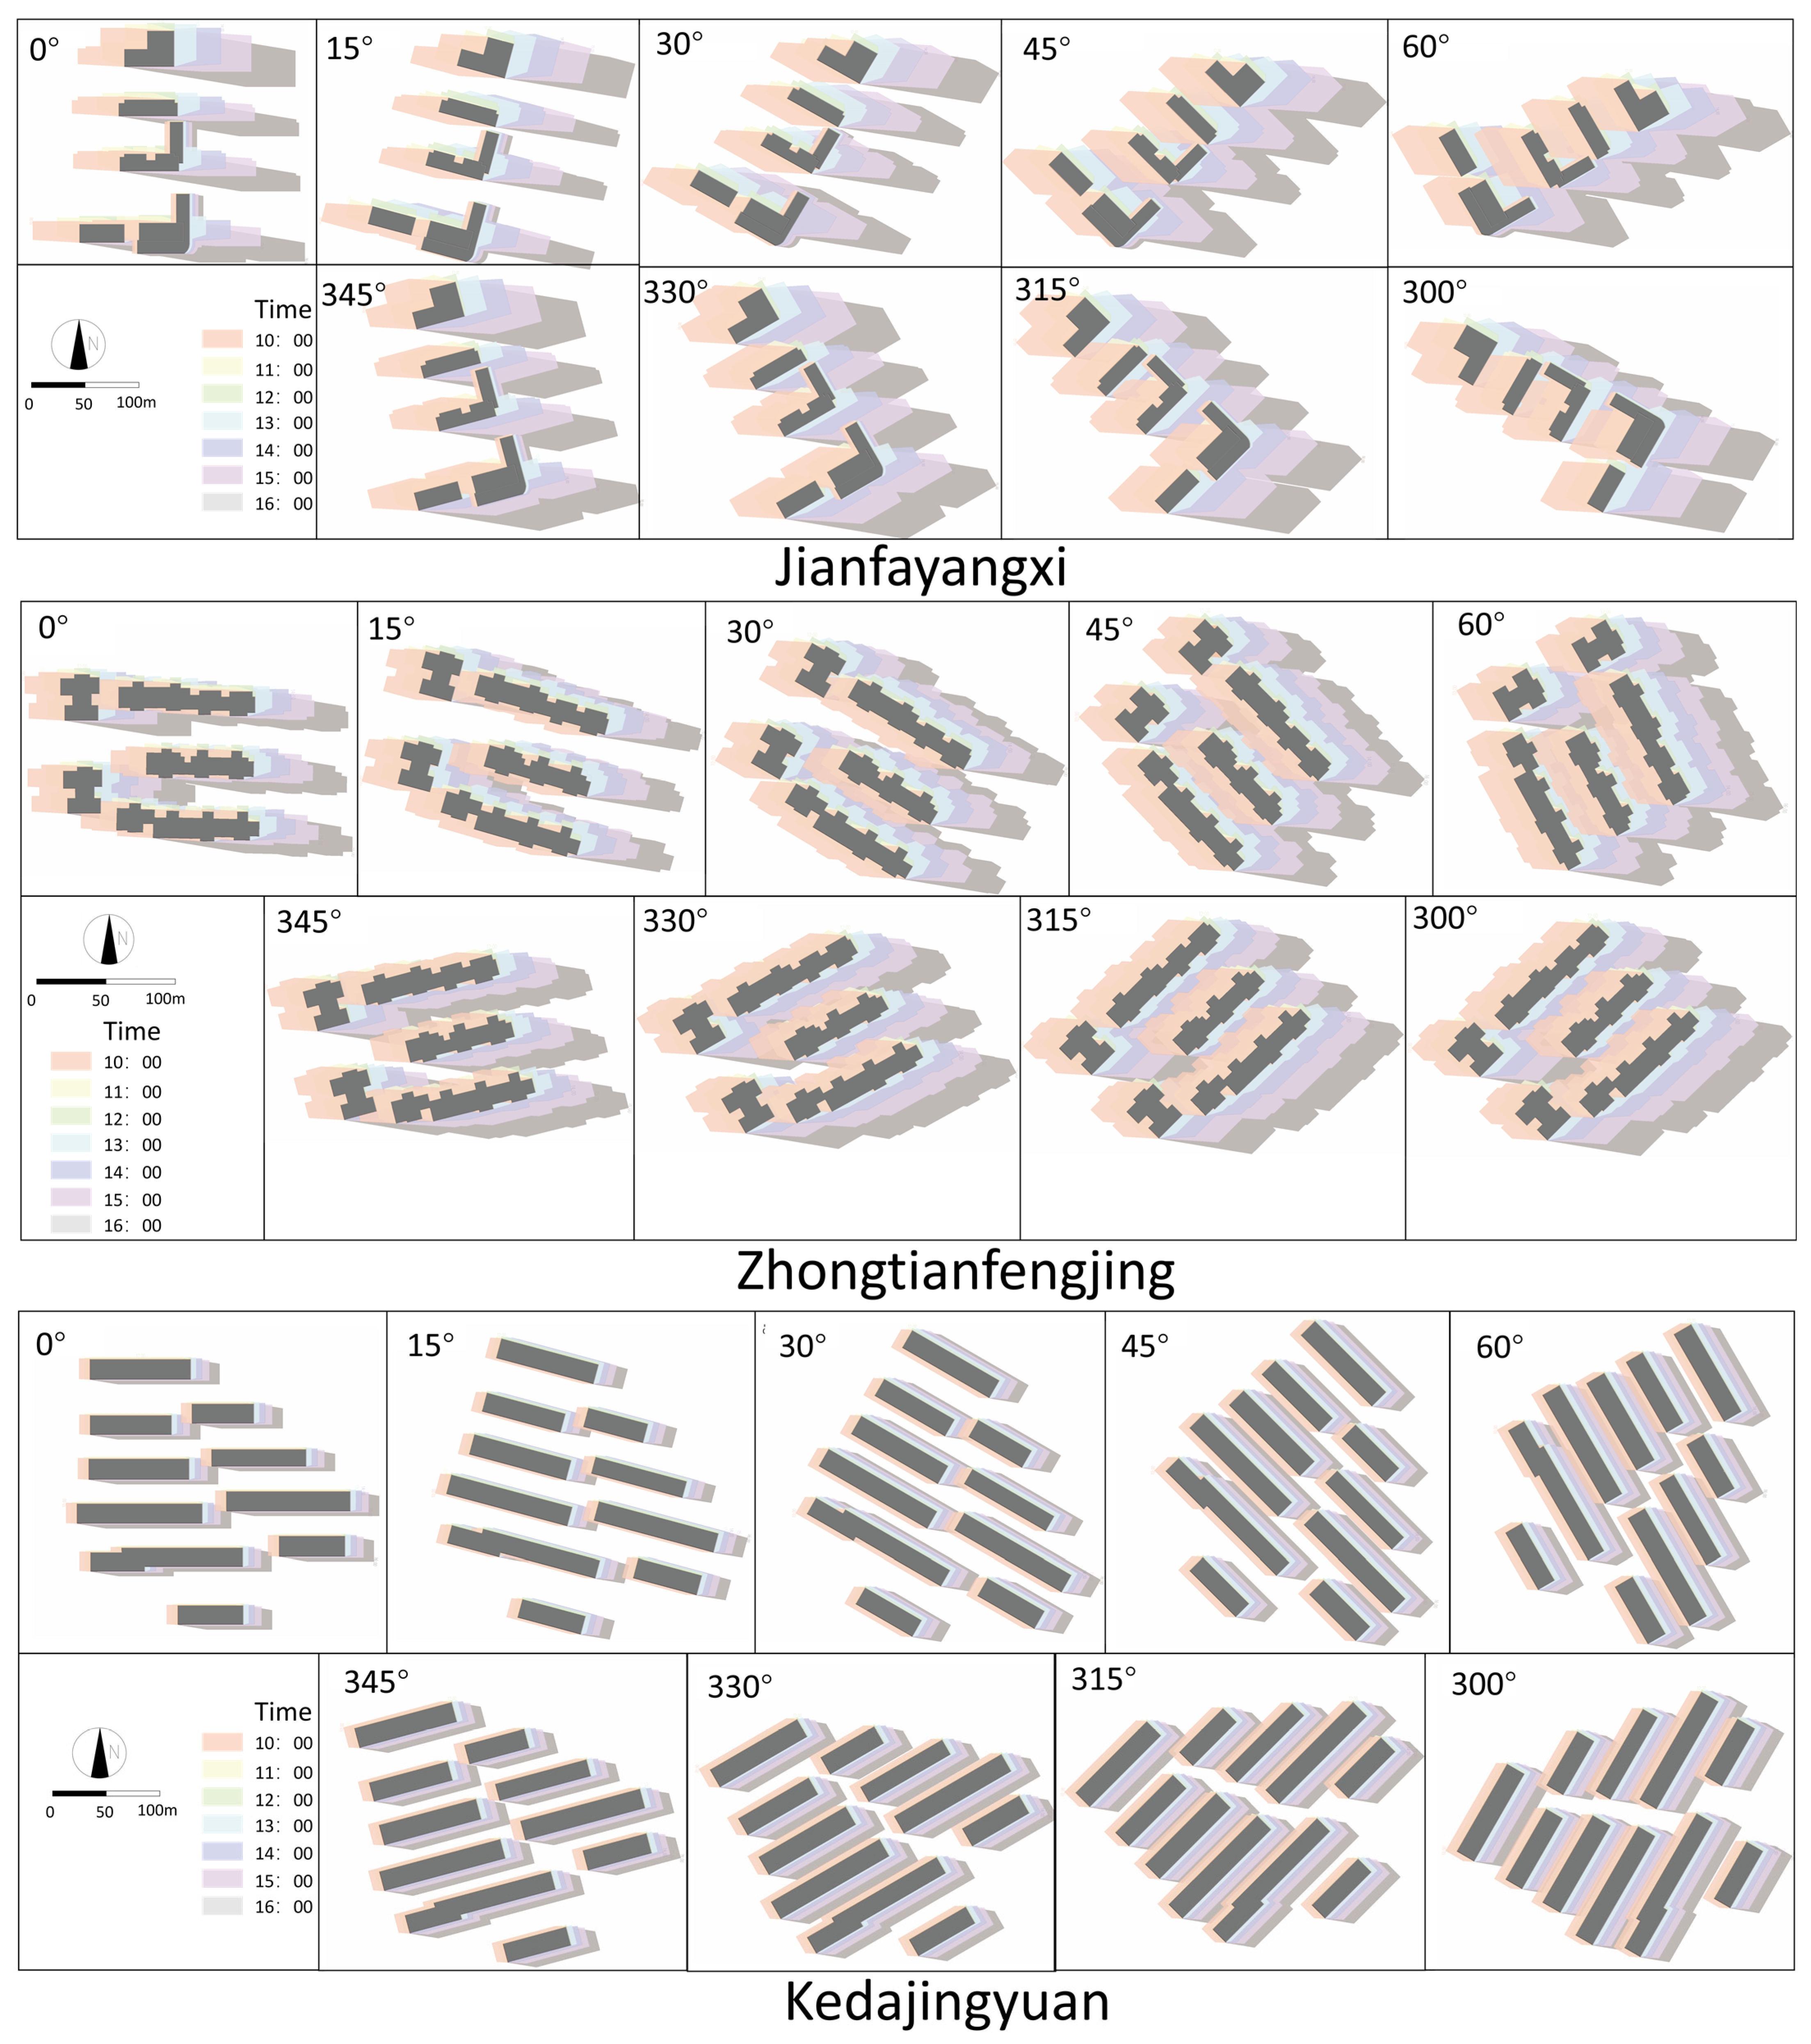
2.3.1. Building Orientations

This study tried to classify residential area layouts within the second ring road of Changsha and selected some representative residential blocks to study the impact of sunlight and building shadow on the microclimate of residential areas. ENVI-met 5.1.1 (ENVI-met GmbH, Essen, Germany) was used to conduct a microclimate simulation.
This study focused on three different types of models. The first set of models was based on the high-rise row-pattern residential area Jianfayangxi as a prototype. The second set of models was based on the high-rise point-pattern residential area Zhongtianfengjing as a prototype. The third set of models was based on the multistory row-pattern residential area Kedajingyuan as a prototype. The research process can be divided into the following steps.
(1) To study the impact of building shadows on the outdoor thermal environment under different building orientation angles, the first set of models was based on the residential layout of Jianfayangxi, with a building height of 90 m. In the second group of models, Zhongtianfengjing is the prototype, with a building height of 50 m. The third group of models is based on a prototype of Kedajingyuan, with a building height of 18 m. For the purpose of having more focus on the building shadows, the greening rate was uniformly set as 0 at this stage. The building orientation angles were set to 0°, 15°, 30°, 45°, 60°, 300°, 315°, 330°, and 345°, totaling 9 models for each study area. The choice of building orientation angles was based on the fact that we found that most buildings in Changsha have a building orientation angle within the ranges of 0–60° and 300–360°. This is required by some building regulations [40,41];
(2) Use T20-Sun V8.0 (Tangent, Beijing, China) to calculate the building-shadow contour lines of the above 27 models at different times on 28 June 2023;
(3) Simulate the above 27 models using ENVI-met and analyze the air-temperature results after overlaying them with the shadow calculation results.

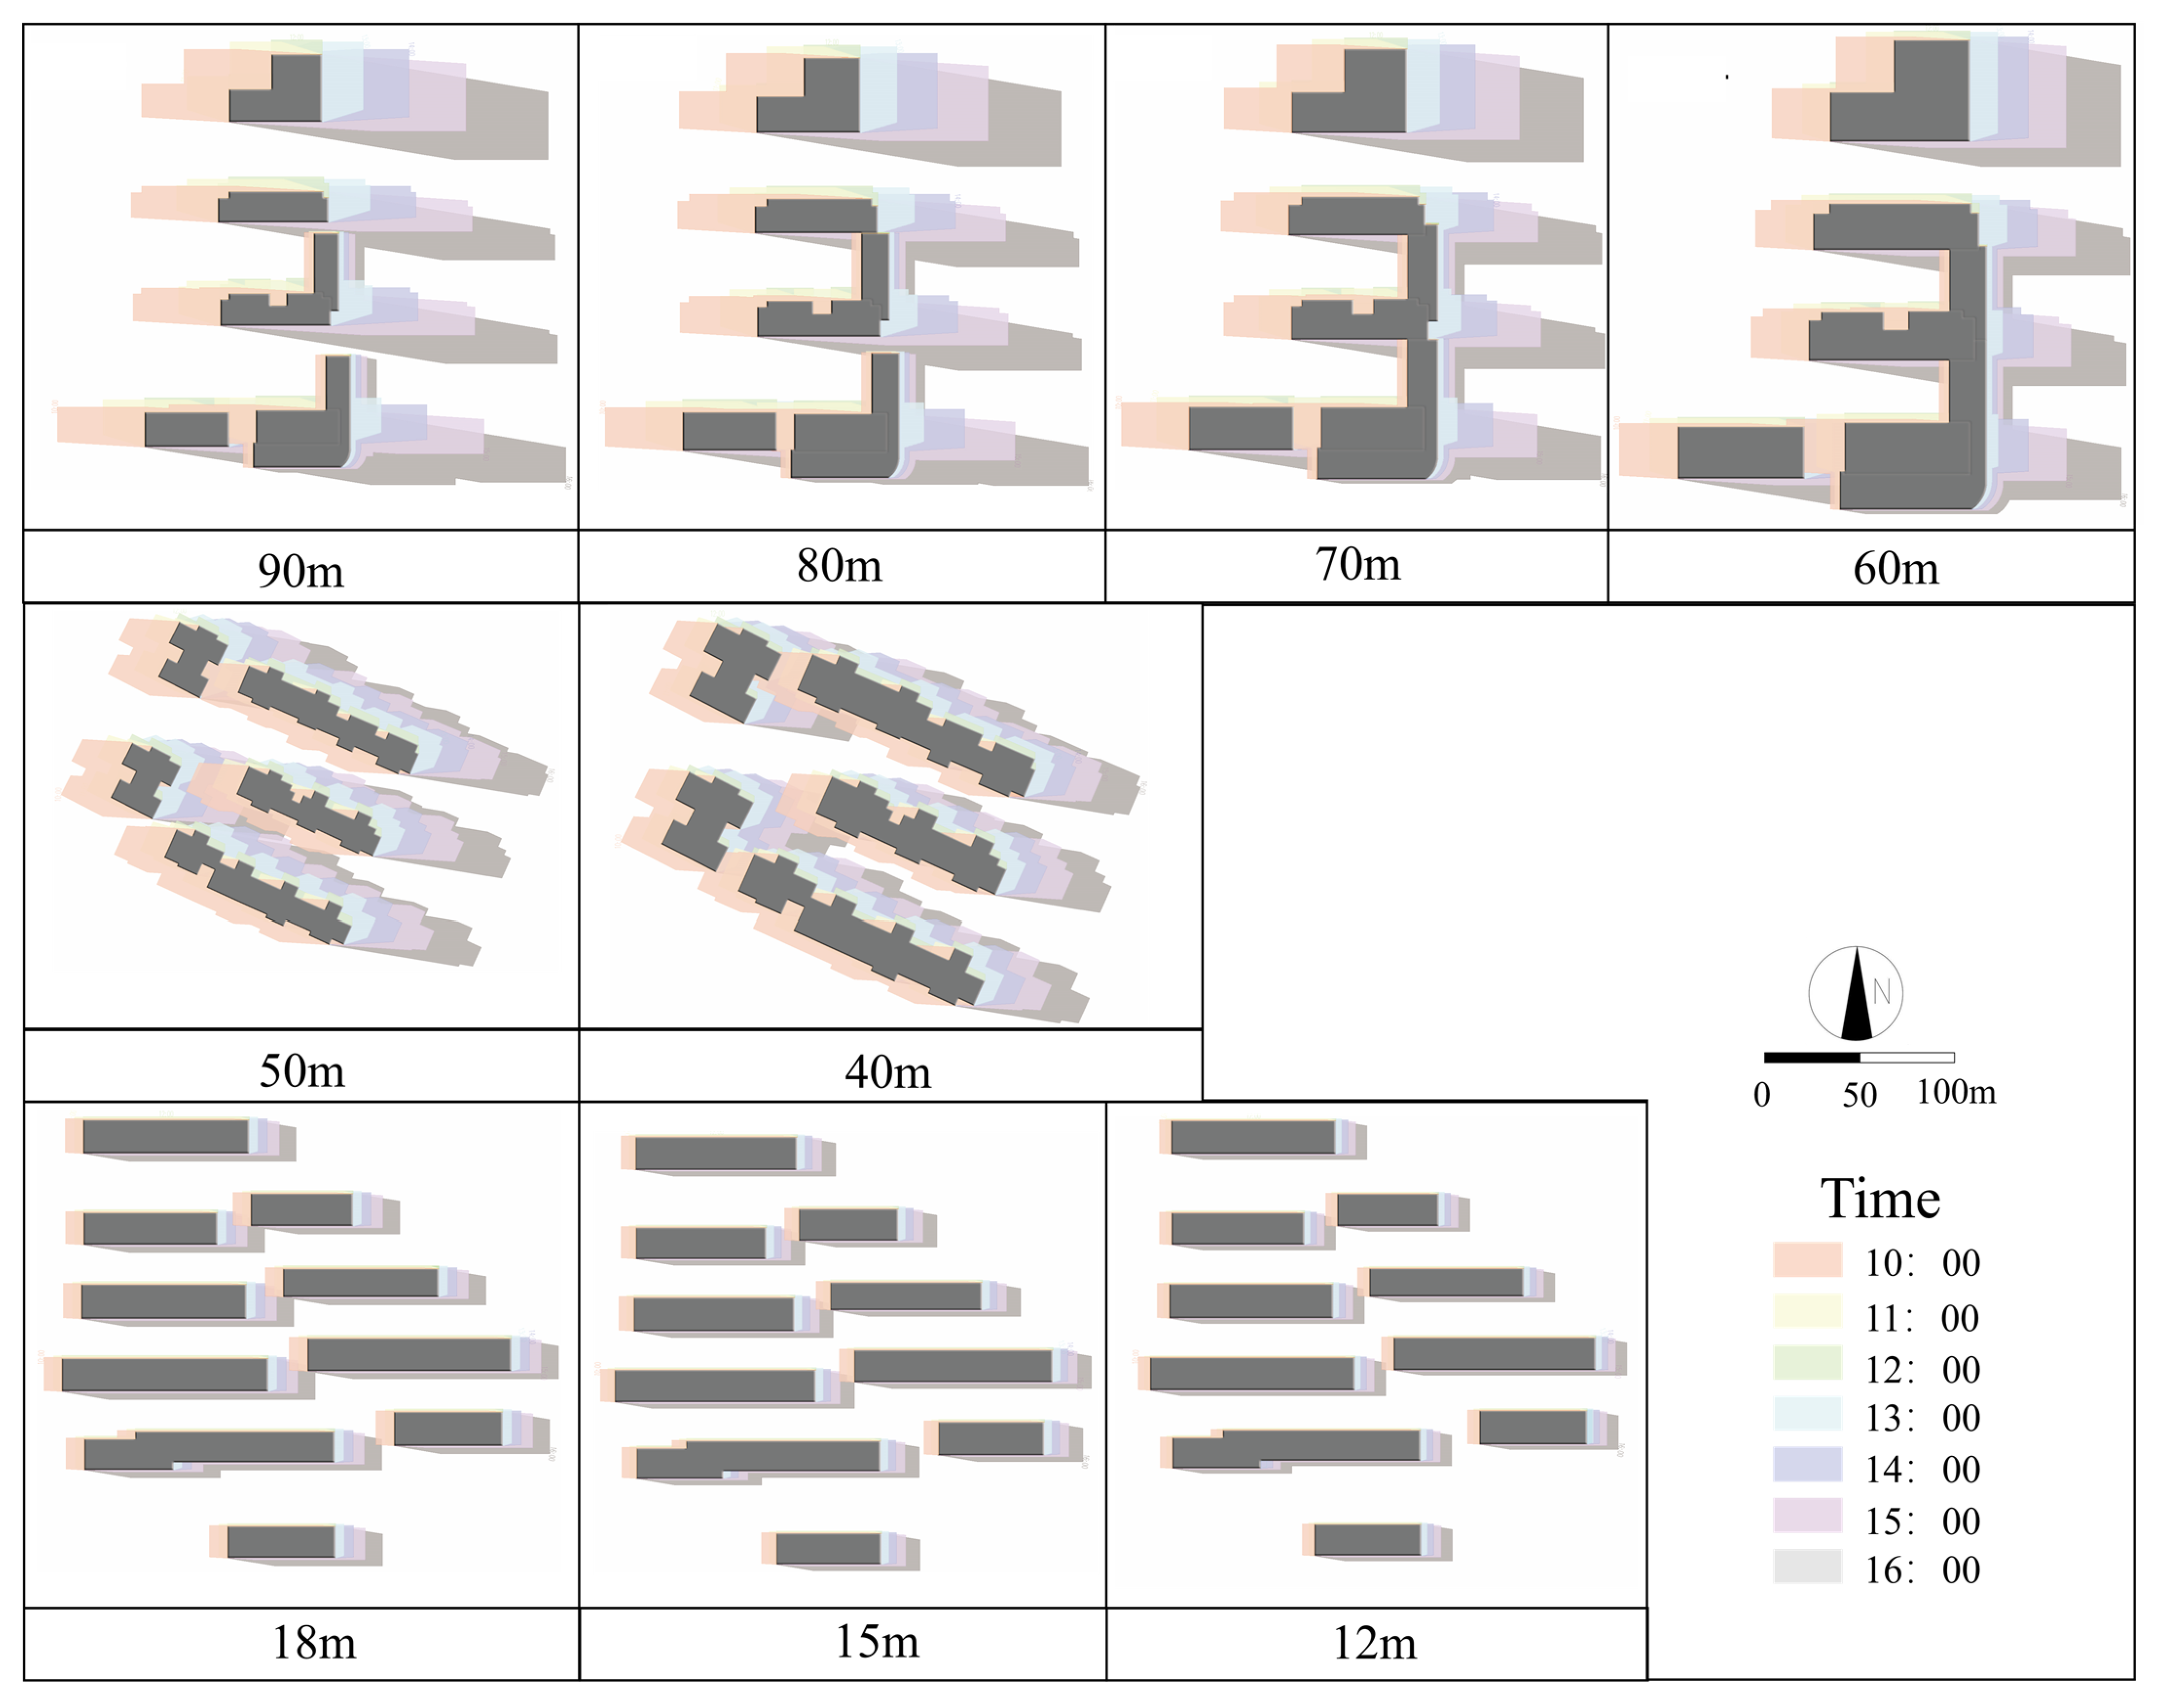
2.3.2. Building Height and Base Areas

Under the same sunlight conditions, different building heights and base areas of the buildings will bring different building-shadow areas. The higher the building or the larger base area of the building, the larger the building-shadow area, and vice versa. When the floor-area ratio remains unchanged, the higher the building height, the lower the base area of the building and the larger the building spacing. According to the Technical Regulations on Urban Planning and Management in Changsha, the second ring road in Changsha encompasses the main urban area, and the building spacing is controlled according to the main urban spacing area (Table 1) [41,42]. Formulas (1) and (2) below show how the floor-area ratio and building density were calculated [43,44].
F l o o r   a r e a   r a t i o = t o t a l   b u i l d i n g   f l o o r   a r e a g r o s s   p l o t   s i z e
B u i l d i n g   d e n s i t y = b u i l d i n g   s q u a r e   f o o t a g e l a n d   a r e a
In study 2, three sets of models were set, with a green-space ratio of 0. The underlying surface material was set as soil. The first group of models was developed based on Jianfayangxi (row-pattern high-rise buildings), with a height of 90 m and a floor-area ratio of 4.94. Meeting the requirements of the original regulatory detailed planning for building density and height control, the interests of developers, and the floor-area ratio requirements, three comparable models were set, with building heights of 80 m (about 27 floors), 70 m (about 24 floors), and 60 m (about 20 floors), respectively.
The second group of models was developed based on point-layout high-rise buildings. Zhongtianfengjing was chosen as a prototype; it has a height of about 50 m. A model with a building height of 50 m was built. In addition, a model with a building height of 40 m (about 13 floors) was built. The FAR of these models was set to 3.83.
The third group of models explored multistory line-pattern buildings on the basis of Kedajingyuan. The building height of Kedajingyuan is 18 m (about 6 floors), with an FAR of 2.0. This first model was set based on this. In addition, if we reduce the building height under the premise of keeping the floor-area ratio the same, this will cause the building density to exceed the limit of the regulation-detailed planning requirements of Changsha. This group of studies did not change the building density. The floor-area ratio changes with the change in building height. We set two other models with building heights of 12 m (approximately 4 floors) and 15 m (about 5 floors), respectively. Table 2 shows the setting conditions of the study.

2.3.3. Surface and Vegetation

Different underlying surface materials have different heat-absorption abilities. This can lead to there being different temperatures. In addition, the temperatures of the shaded area and the sun-lit area of the same underlying surface material are also different, because shadows have a cooling effect. This article chose several commonly used underlying materials in residential areas in Changsha. The soft underlying surface is mainly grassland, while the hard underlying surface materials are cement, asphalt, permeable bricks, and granite.
Based on the building layouts of Jianfayangxi, Zhongtianfengjing, and Kedajingyuan as prototypes, three sets of models were built, with cement, asphalt, permeable bricks, granite, and grassland as the underlying materials. A total of 15 models were constructed (including Jianfayangxi with a building height of 90 m, Zhongtianfengjing with a building height of 50 m, and Kedajingyuan with a building height of 18 m). The shadow contours of the building were as drawn in the study; we compared the simulation result of the average air temperature of the same community with different underlying materials. This includes a comparison of the average air temperatures of the sun-lit areas and the shaded areas.

2.3.4. Data Input and Simulation

With the development of technology, numerical simulation has become one of the main methods used in climate research. ENVI-met is a widely used software for microclimate studies. This software was developed by a German scholar, Michael Bruce, who led research groups on the bases of fluid mechanics, thermodynamics, and urban meteorology [45,46]. A large number of studies have shown that this computational fluid-dynamics-based software is a reliable one for use in microclimate studies [47,48,49]. The study used ENVI-met 5.1.1 to build various residential area models and simulate the thermal comfort of these areas. ENVI-met enables the construction of three-dimensional models, including many elements like buildings, vegetation, land surface coverage, and even terrain. In addition, the software enables people to set the building and road materials and choose vegetation types based on the real conditions of the study areas. This undoubtedly increases the accuracy of the simulation studies. The Z-axis of this three-dimensional model was extended to 2500 m. Then, the thermal environment calculations for the environmental parameters, such as the wind environment and radiation, were considered in pursuit of obtaining more accurate simulation data [45,46,50].
The grid sizes of all the study models were uniformly set as dx = dy = dz = 3 m. We used data from the following periods for the validation analysis: 10:00–23:00, 10 July 2022 (downloaded from the China Meteorological Data Service Center) [51]; 9:00–18:00, 28 June 2023 (collected via a Kestrel 5500, Nielsen-Kellerman, Upper Chichester, PA, the United States); and 5:00, 16th July 2024–17:00, 16 July 2024 (downloaded from Changsha Meteorological Bureau’s official website) [52]. After the validity analysis, data on the air temperature, relative humidity, wind speed, and wind direction in Changsha (Table 3), measured via a Kestrel 5500 (Table 4), were used to conduct our multi-scenario study.

3. Results and Discussion

3.1. City-Level Climate Analysis

To ensure a better exploration of the thermal comfort of residential areas in Changsha, a city-level climate analysis was conducted based on the meteorological data of the whole city in the Climate Consultant 9 software. Figure 2 shows an enthalpy and humidity map of Changsha. In the figure, we can see that only 5.9% of the year (514 h) can be considered to be comfortable. In addition, 22.5% of the year (1973 h) requires further cooling, and 34.2% of the year (2993 h) requires further heating. These data also show that Changsha has very hot summers. Figure 3 shows the solar radiation conditions in Changsha during different months. In this figure, July has the highest radiation. The monthly radiation values from May to September are higher than the annual average. These data show that it is important to make full use of building shadows in an effort to mitigate the negative influences of radiation and improve thermal comfort in Changsha during the summer.

3.2. Residential Blocks Classification

The residential area layout characteristics in China have undergone three main periods of change. The first stage was from 1949 to 1978. During this time, structuralism and functionalism were prevalent, and the layouts of residential areas were primarily characterized by row patterns and enclosed patterns. The second stage of change occurred from the 1980s to the end of the 20th century. During this time, humanism was advocated for, and the layouts of residential areas were mainly characterized by row patterns. The third stage of change occurred after the turn of the 21st century. Here, the predominant architectural ideology was ecologism. The layouts of residential areas have more combination forms, including point, row, perimetric, and mixed patterns [53]. Furthermore, Luo (2022) divided high-rise residential building layouts in Changsha into three types, namely the slab pattern, the point pattern, and the slab–point pattern [54].
In this article, we summarize the layouts of 526 residential areas within the second ring road of Changsha. We found that the residential area layouts in Changsha can be divided into four types, namely point, row, perimetric, and mixed patterns. The layout forms of high-rise residential building areas are diverse, while the layout forms of the multistory residential building areas are mainly row patterns. To fully study the impact of sunlight and shadow on the microclimates of residential areas under different layouts, we selected the following prototypes: a high-rise row-pattern residential area (Jianfayangxi); a high-rise point-pattern residential area (Zhongtianfengjing); and a row-pattern multistory residential building area (Kedajingyuan). Then, the different building orientations, heights, and underlying materials were set up. We conducted simulation studies on the role of shadows in improving the outdoor thermal environment during a hot summer day. Figure 4 shows the research samples.

3.3. Validation Analysis for the Simulation Study

This research used simulation data to analyze the impact of different residential block patterns on air temperature. In order to ensure the reliability of the research results, we verified the validity of the software used for air-temperature simulation for the study area in Changsha. We randomly chose a residential area (within Changsha’s second ring road) and used meteorology data collected by ourselves, as well as meteorological data released by the China Meteorological Data Service Center and Hunan [51,52]. We used data from 10:00 to 23:00 on 10 July 2022, from 9:00 to 18:00 on 28 June 2023, and from 5:00 on 16 July 2024 to 17:00 on 16 July 2024 for the validation study. We used the R2 and RMSE values to determine the validity of the model. The corresponding R2 and RMSE values between the simulated and measured air temperatures for the three analysis periods are shown in Table 5 below. These data show that the software is valid for the simulation study.

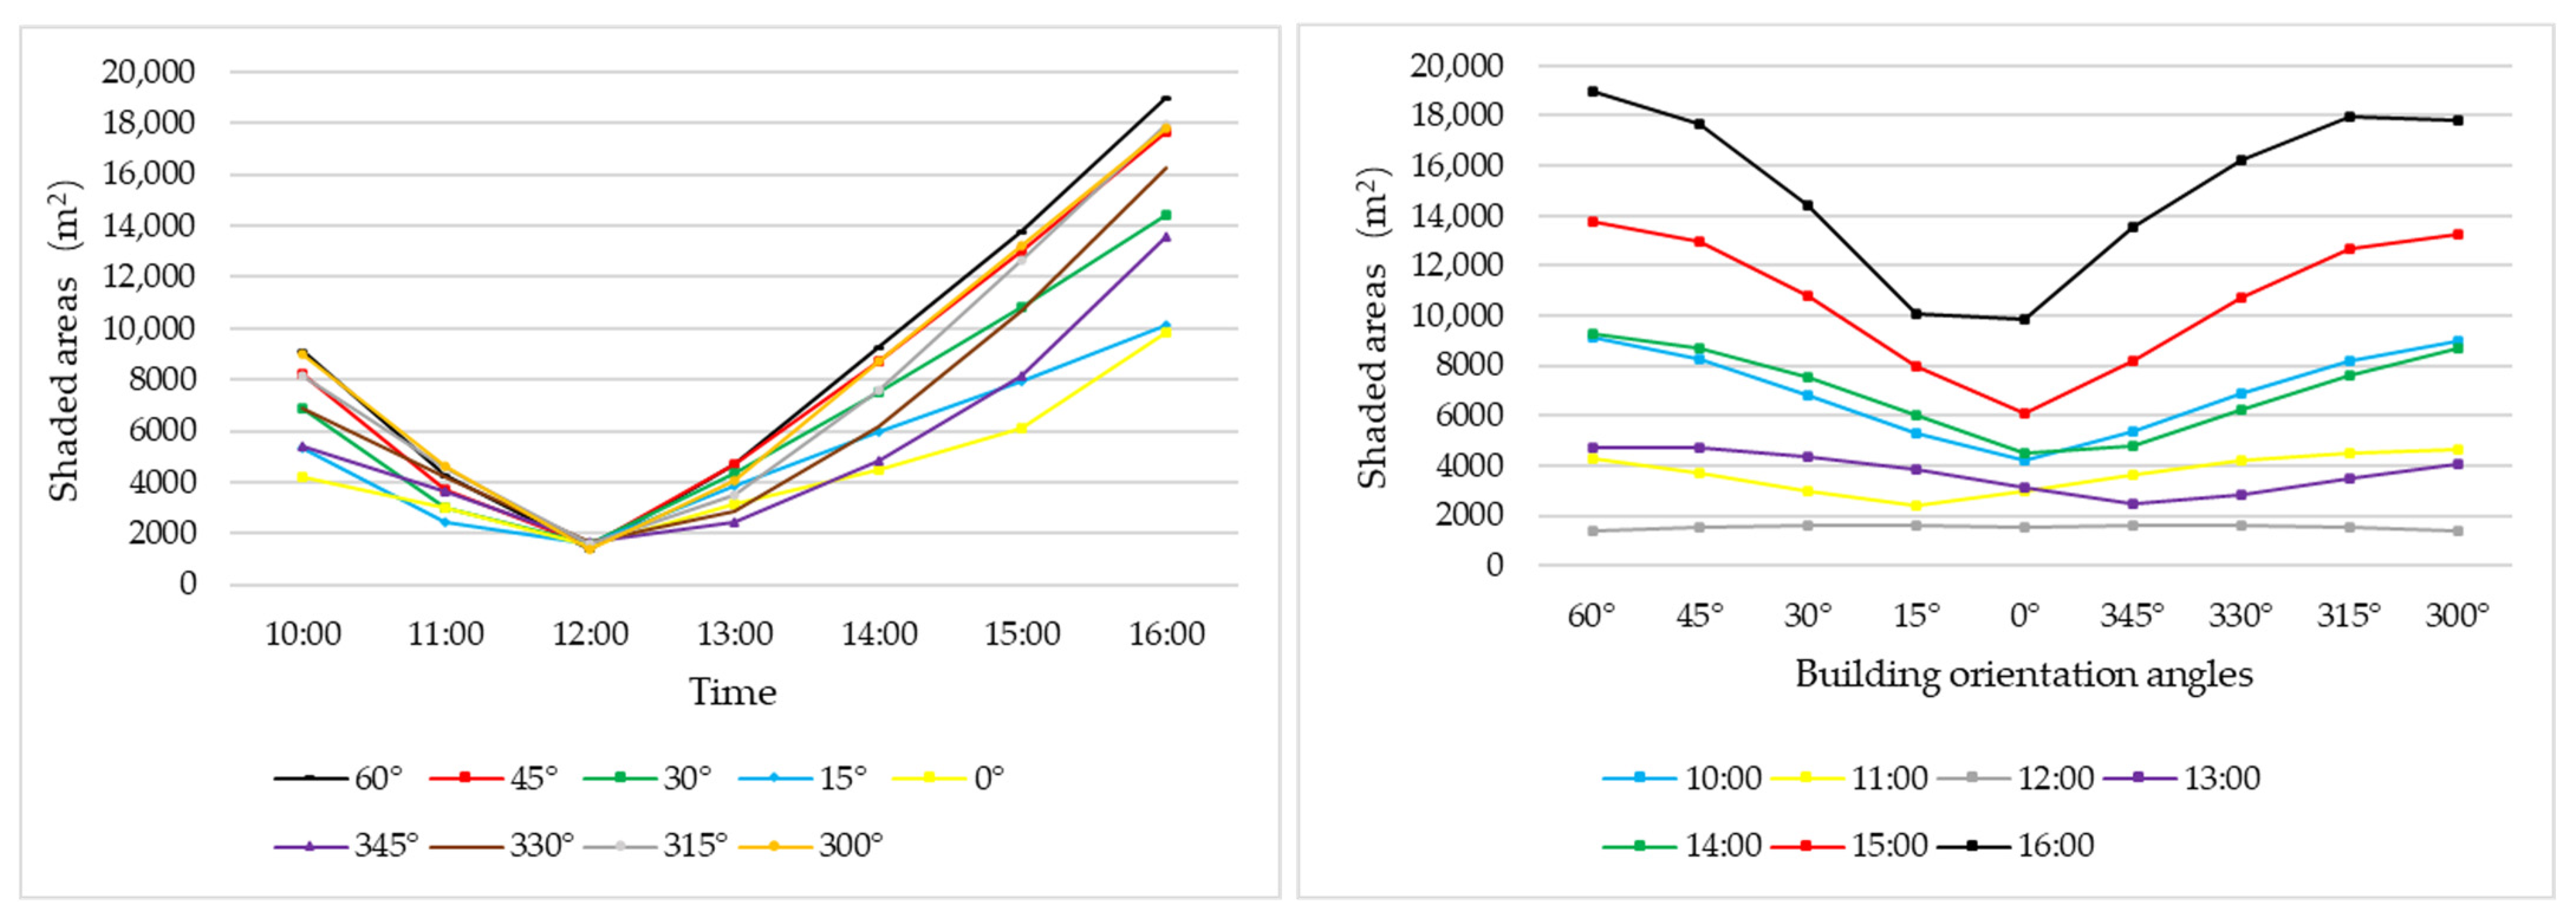
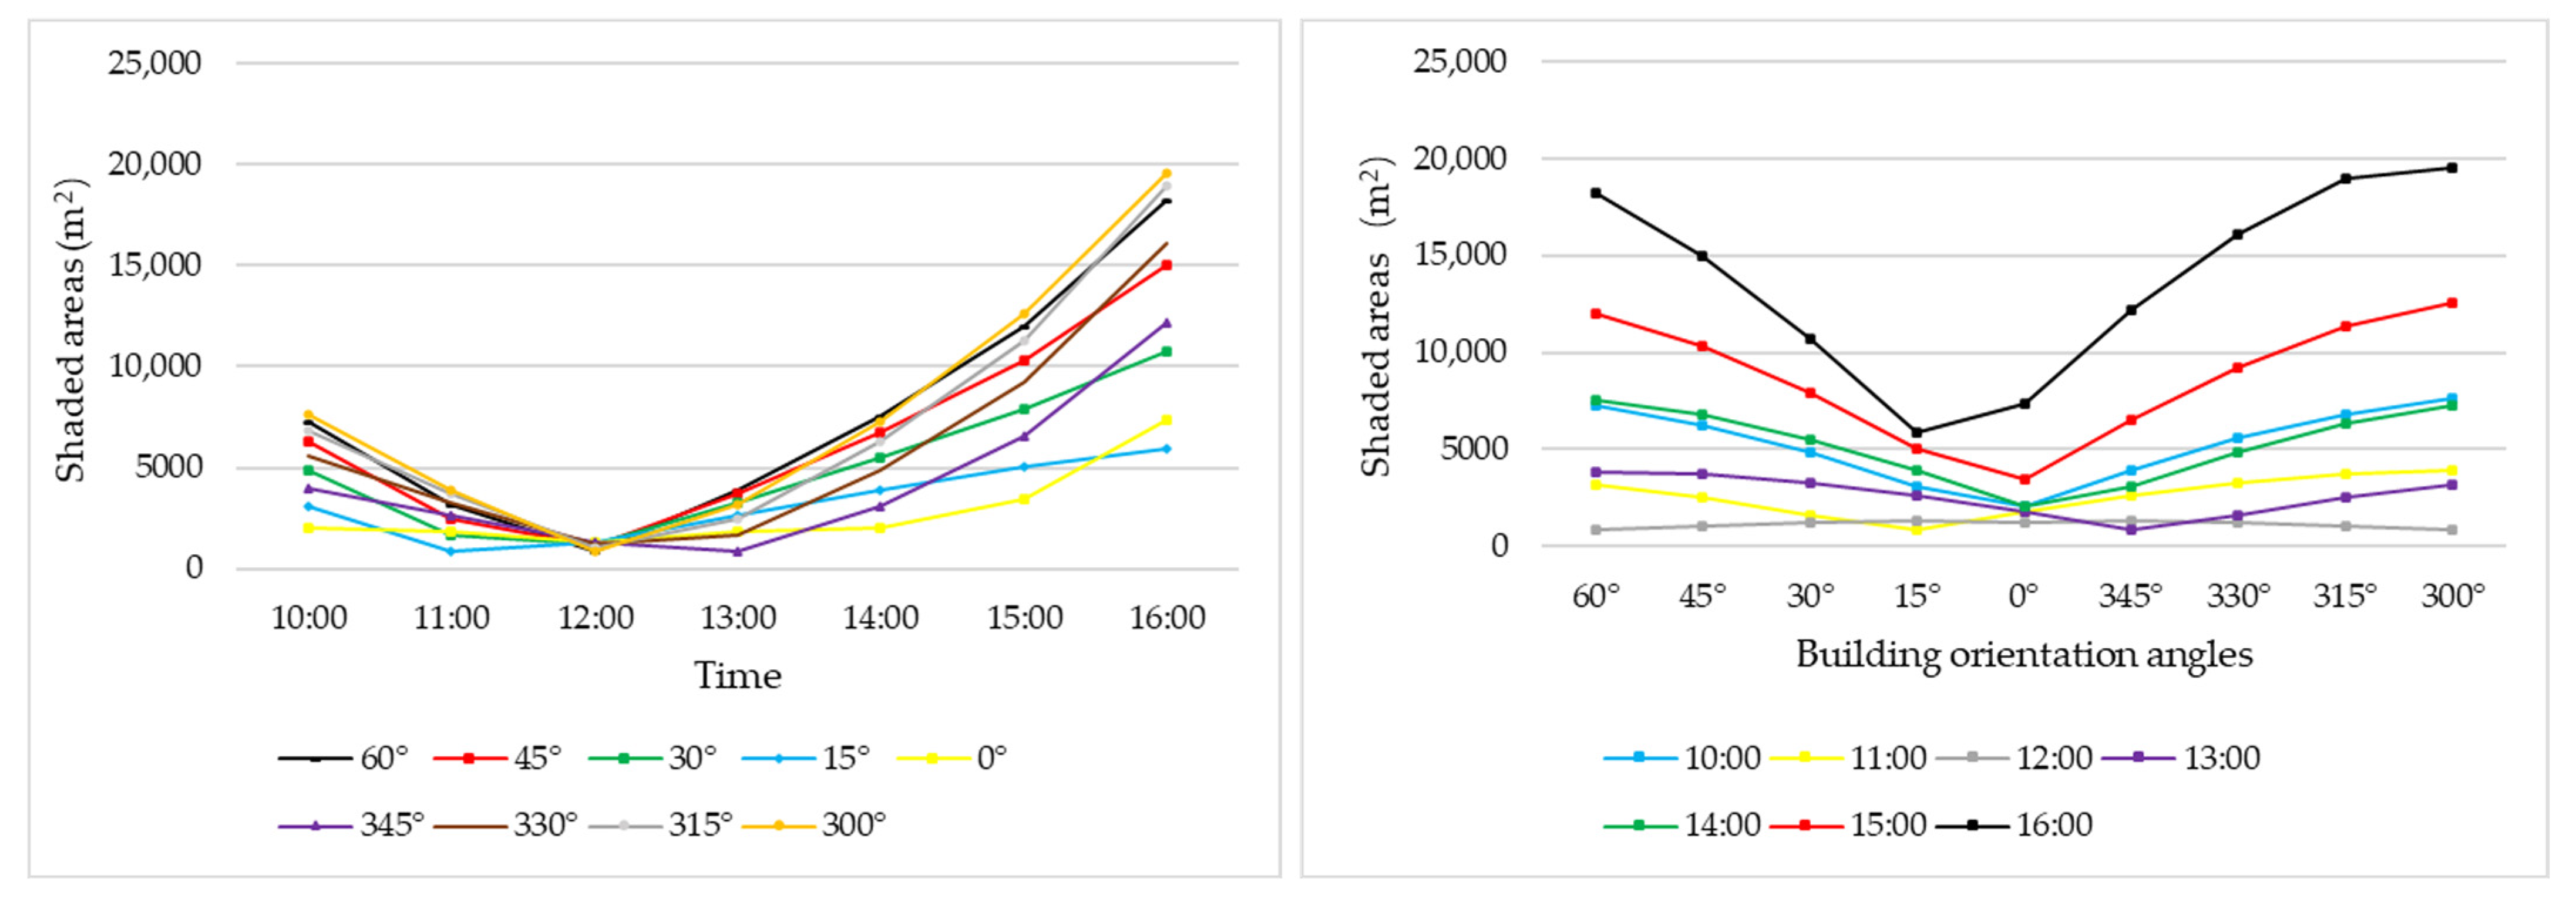
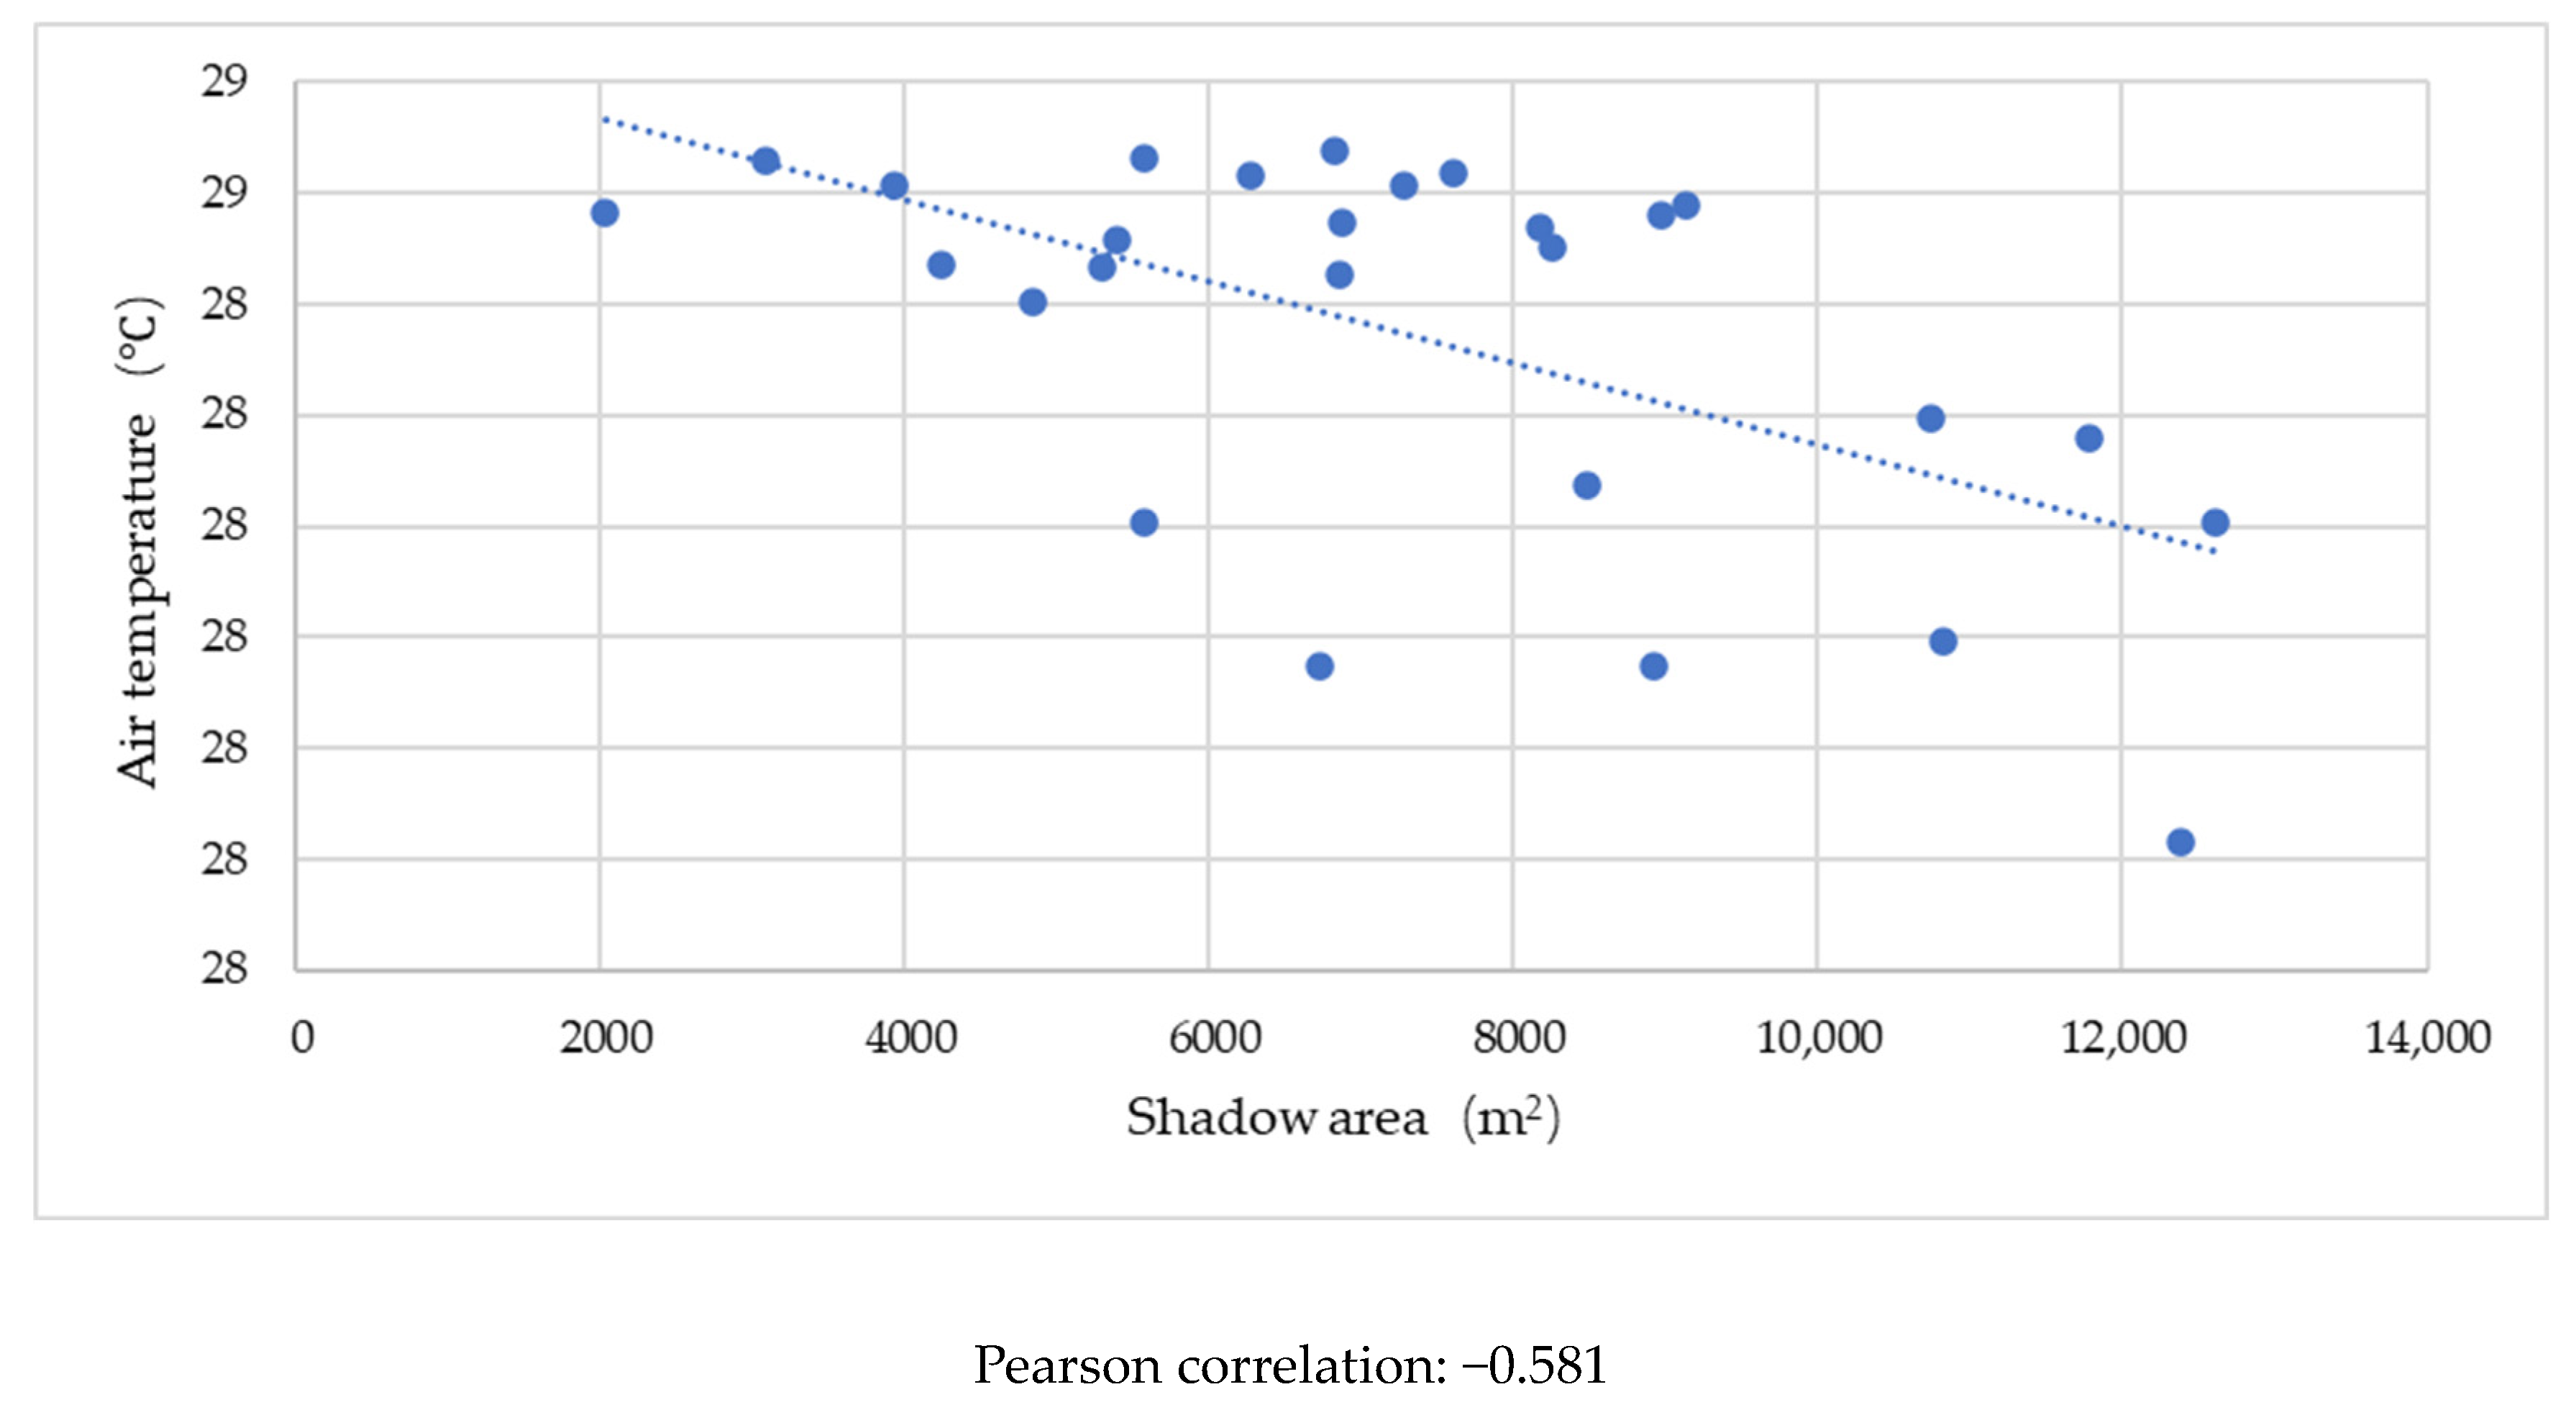
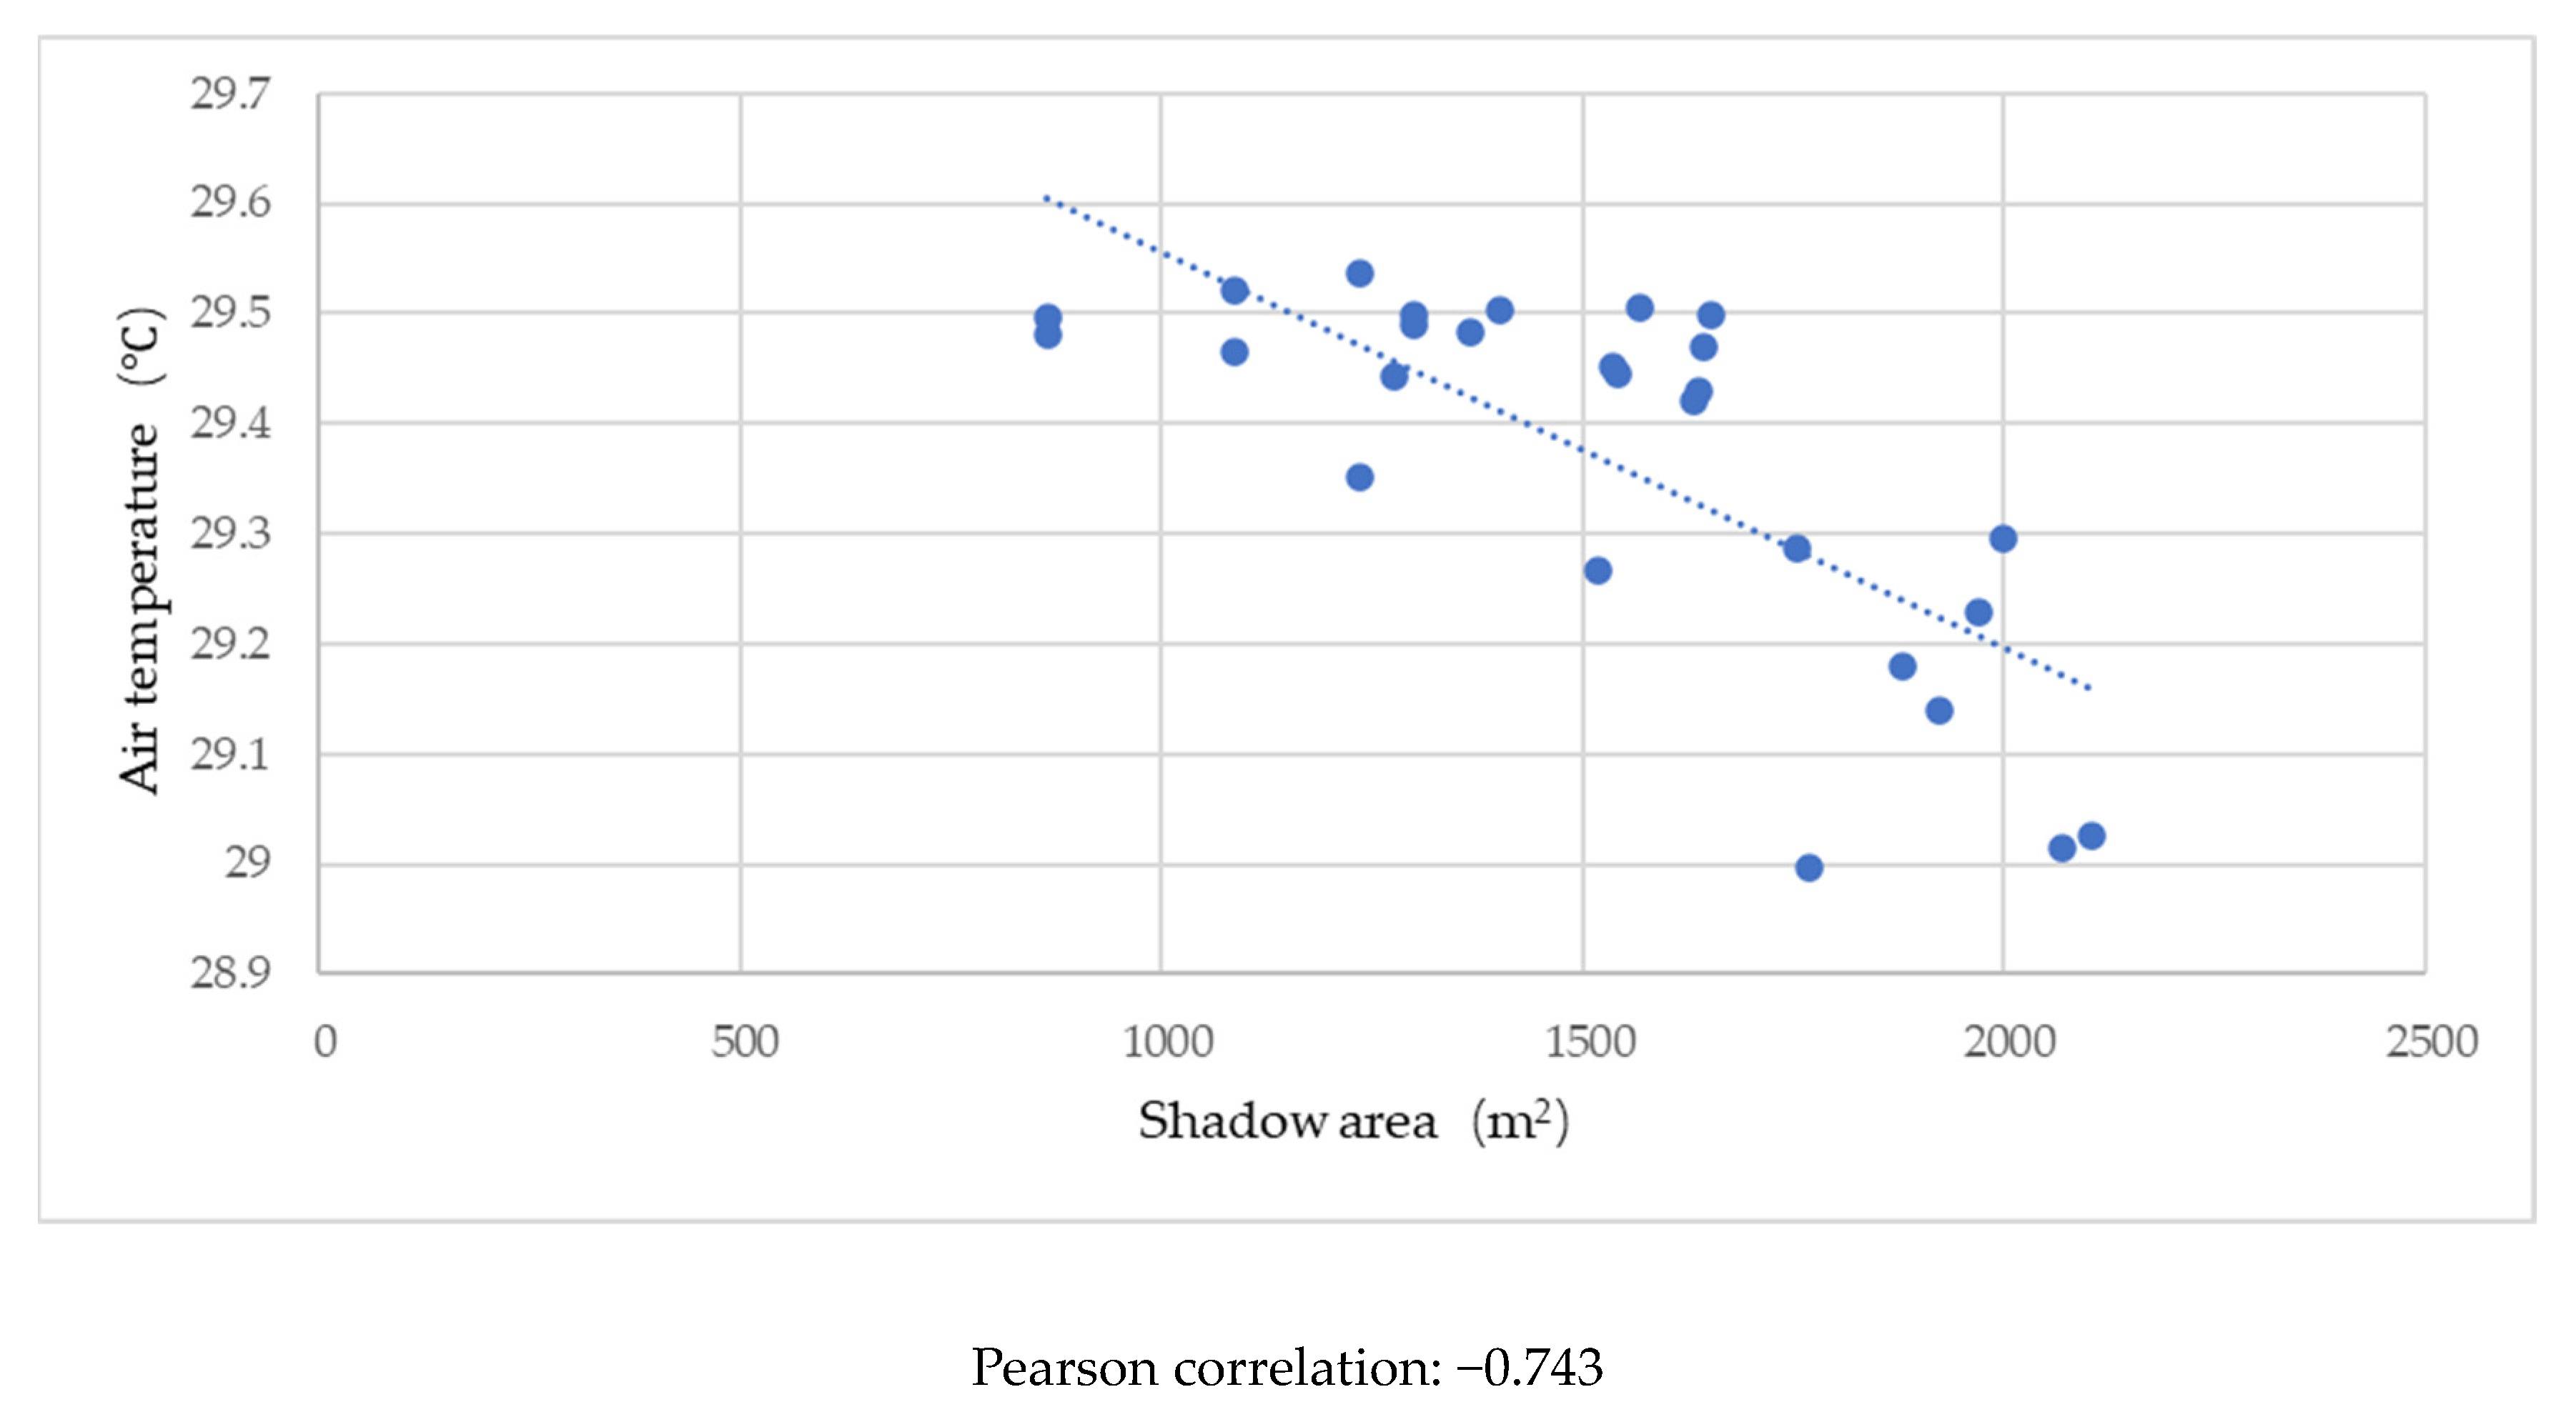
3.4. The Impact of Building Orientations on Air Temperature

During the day, buildings can cast shadowed areas that are not illuminated by sunlight (as shown in Figure 5). According to the motion law of the sun, different sun altitude angles and sun azimuth angles will form different building shadows at different times of the day. For example, on the summer solstice at a local time of 12:00 noon, the sun reaches its peak, the sun’s altitude angle is the largest, and the shadowed area cast by the building is the smallest. Therefore, the impact of building shadows on the outdoor thermal environment can be considered and analyzed during different time periods.
Figure 6 shows the building-shadow diagrams of the building orientation study. Cities in the Cfa zone generally have a relatively humid environment [32]. The coupled effects of air temperature, relative humidity, and wind speed can have considerable impacts on the intensity of human physiological thermal responses in summer. The sensory temperature is positively correlated with air temperature, while the relationship between relative humidity, wind speed, and sensory temperature depends on the air temperature [55,56]. It can be seen that air temperature has a considerable impact on the outdoor thermal environment, so temperature was selected as the indicator in this article.
We chose simple forcing rather than full forcing, since full forcing will lead to errors when the wind direction noticeably changes during different time periods. In this case, the wind-speed input for the ENVI-met software has a consistent value. In order to judge whether the wind speed has an impact on the microclimate in the residential area under different building orientation angles, this paper determined the statistics for the average wind speeds in the three groups of models with different building orientation angles in study 1. The results show that, under different building orientation angles, the difference in wind speed within the block is within 0.1 m/s. This is relatively low, and this means that wind speed has a small impact on the air temperature inside the residential area.
Figure 7, Figure 8 and Figure 9 show the statistical results of the changes in the building-shadow areas at different times under different building orientation angles for the three sets of models in study 1. The overall results indicate that the shadow area changes significantly at different times due to the influence of the solar altitude angle, which may have an impact on the outdoor thermal environments of residential blocks. The overall trend of change is that the shadow area gradually decreases from 10:00 a.m. to 12:00 noon, and gradually increases from 12:00 noon to 16:00 p.m., which is consistent with the law of the movement of the sunshine angle.
The influence of building orientation angles on the sizes of the shadow areas varies in different time periods. Figure 7, Figure 8 and Figure 9 show the statistical results of the changes in the building-shadow areas of three models under different building orientation angles during different time periods. Figure 7 shows that the sizes of the building-shadow areas are relatively stable in the high-rise row layout (Jianfayangxi) at 12:00 noon, indicating that the difference in building orientation angles has little effect on the shadow area. At other times, there is a significant difference in the sizes of the building-shadow areas under different building orientation angles. For example, at 10:00, 14:00, and 15:00, when the trend of the building orientation angles changes to 0°, the shadow area is at its smallest. At 11:00 and 16:00 at 15°, and at 13:00 at 345°, the shadow area is at its smallest.
Figure 8 shows that the high-rise point-pattern layout (Zhongtianfengjing) has no significant influence on the shadow area of the building at 12:00 noon. At 10:00, 14:00, 15:00, and 16:00, the shadow areas are the smallest at 0°, and the trend of building-shadow area change gradually decreases from 300° to 0° and gradually increases from 0° to 60°. At 11:00, the shadow area at 15° is the smallest, and the trend of building-shadow changes gradually decreases from 300° to 15° and increases from 15° to 60°. At 13:00, the minimum shadow area is at 345°, with a trend of a gradual decrease in the shadow area from 300° to 345°, and there is an increase from 345° to 60°.
Figure 9 shows that, at 12:00 noon, the building-shadow areas of the multistory row-pattern buildings, with different building orientation angles, show few differences. At 10:00, 14:00, and 15:00, the shadow areas shown in the model with a building orientation angle of 0° are the smallest. At 11:00 and 16:00, the shadow areas of the buildings with a building orientation angle of 15° are the smallest. At 13:00, the shadow areas of buildings with a building orientation angle of 15° are the smallest.
Figure 10, Figure 11 and Figure 12 show regression analysis models of the average temperatures and building-shadow areas in the three residential areas under different building orientation angles at 10:00, 12:00, and 16:00, respectively. The results show that there is a moderate negative correlation between the average temperature and shadow area at 10:00, a strong negative correlation at 12:00, and a moderate negative correlation at 16:00. Within the same time period, as the shadow area increases, the average temperature within the block will gradually decrease, indicating that building shadows have a good effect on improving the microclimate within the block. Therefore, using different building orientations to generate shadows is an effective way to reduce outdoor temperature.

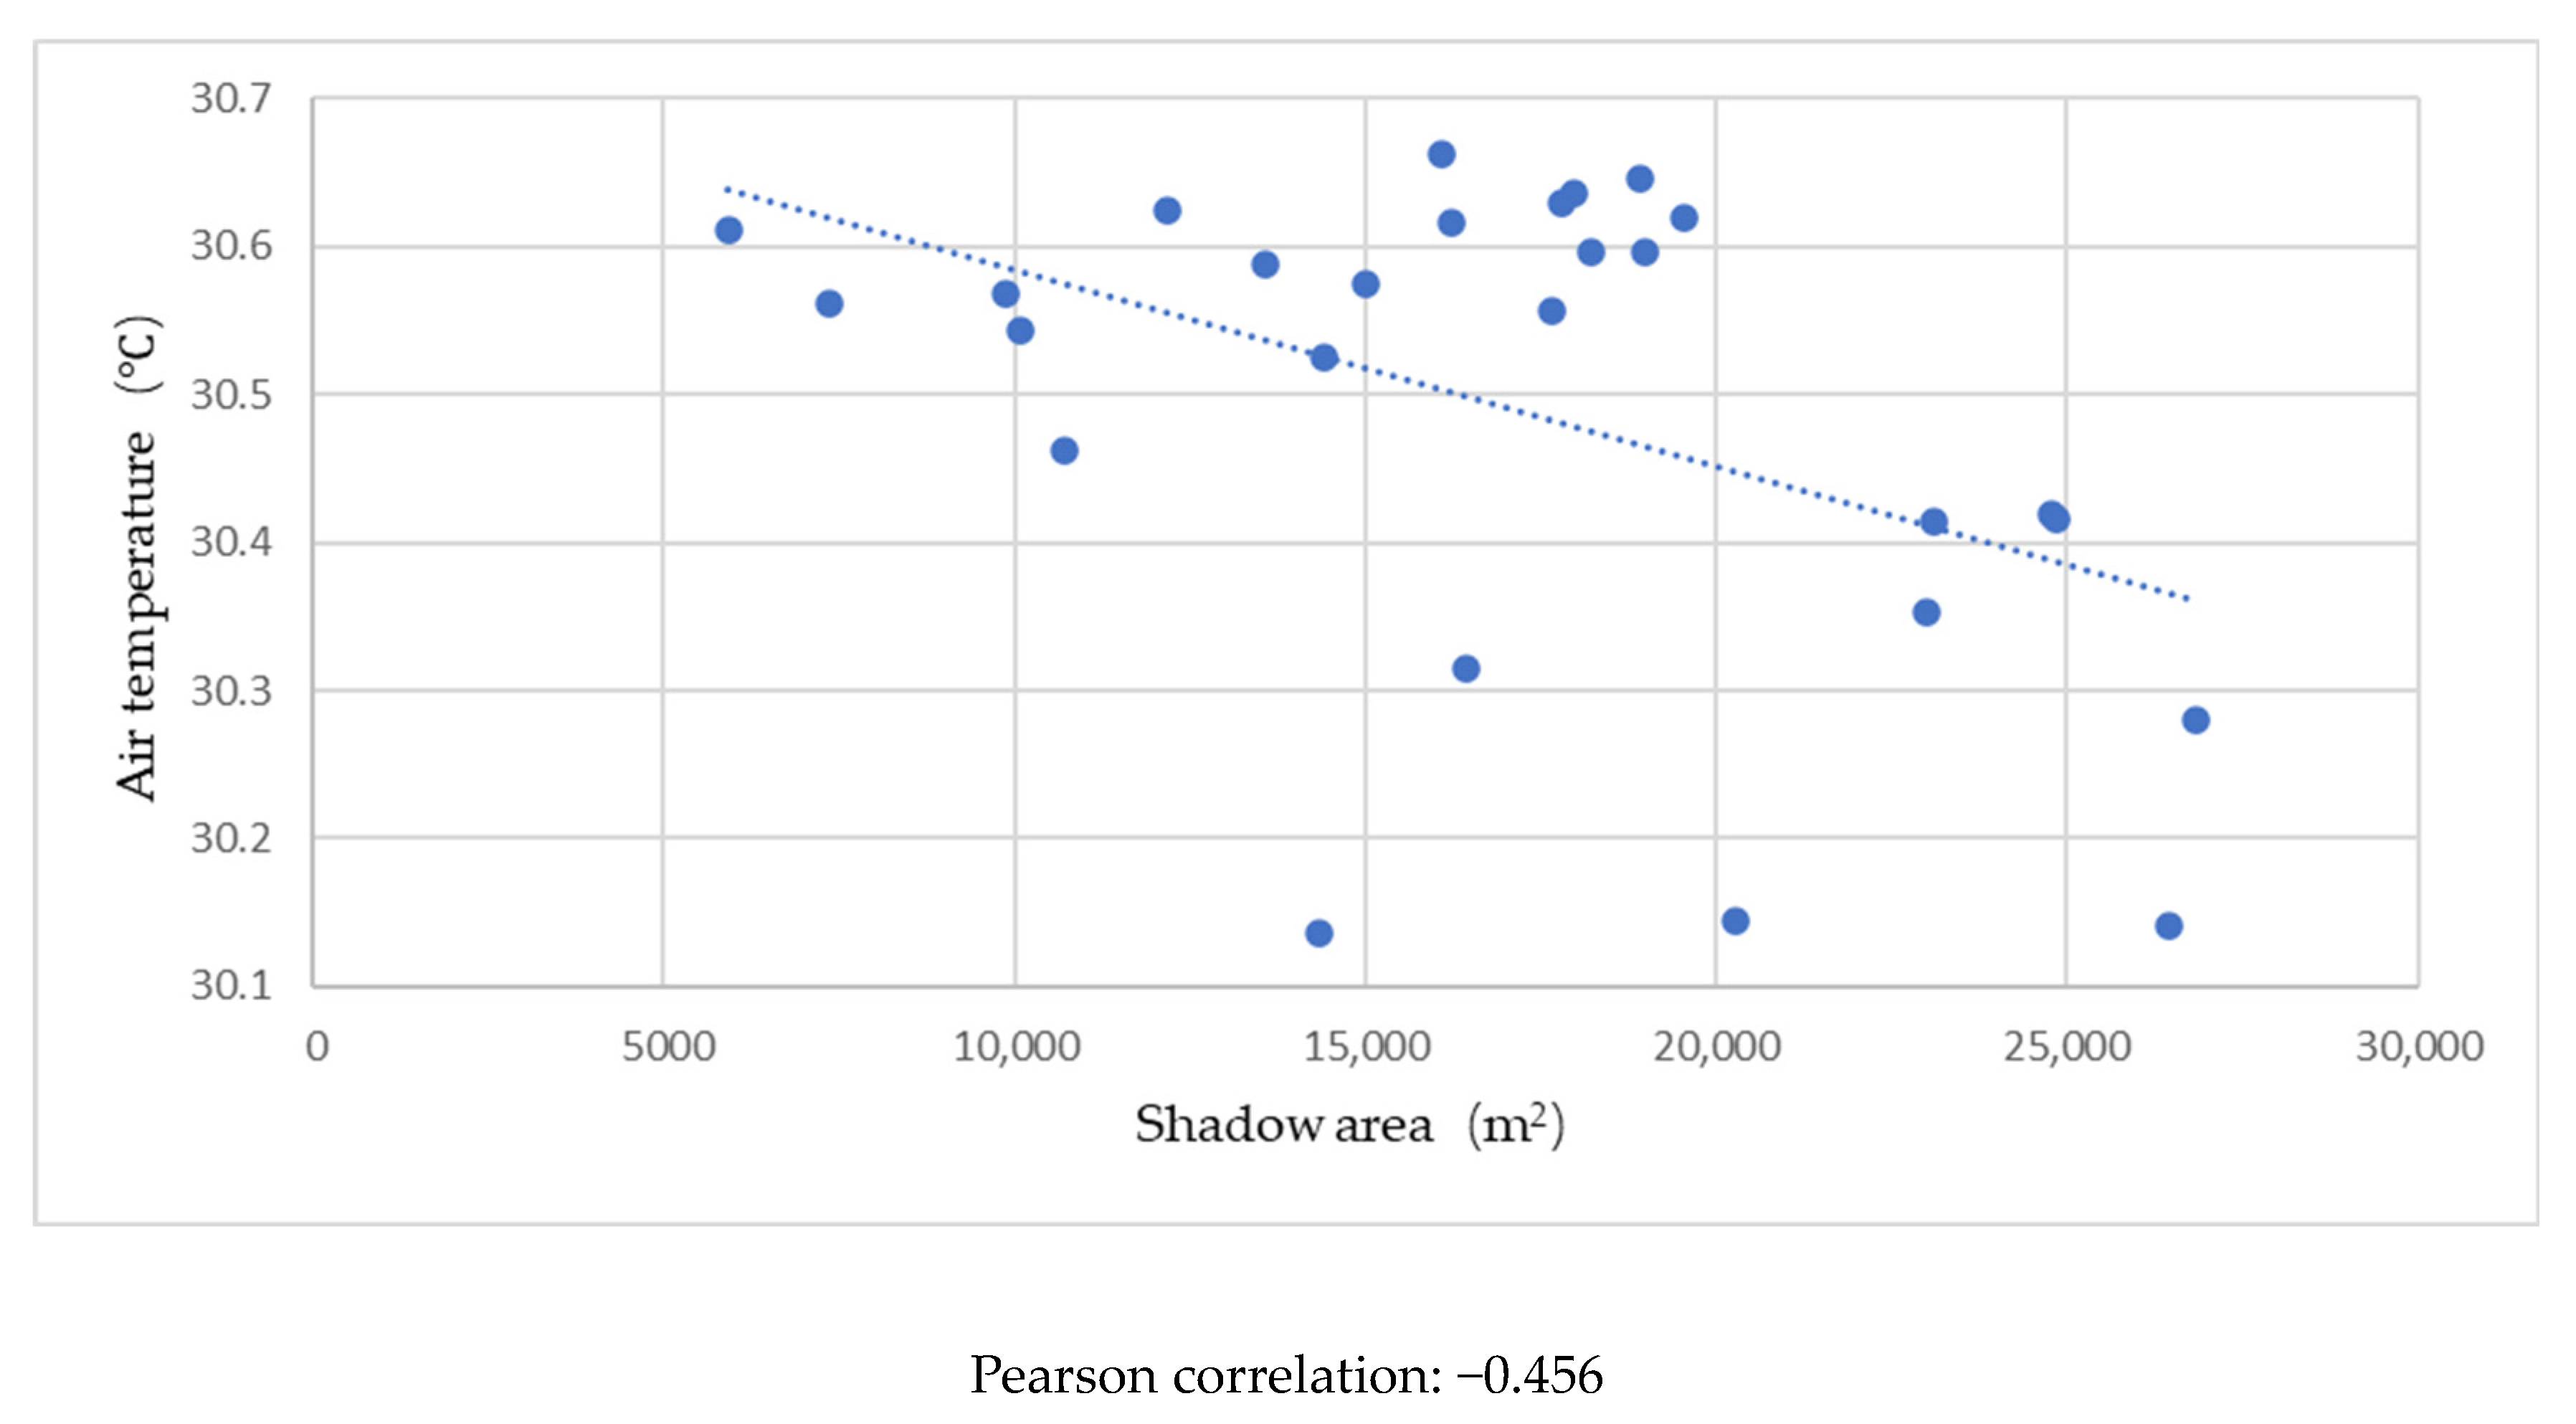
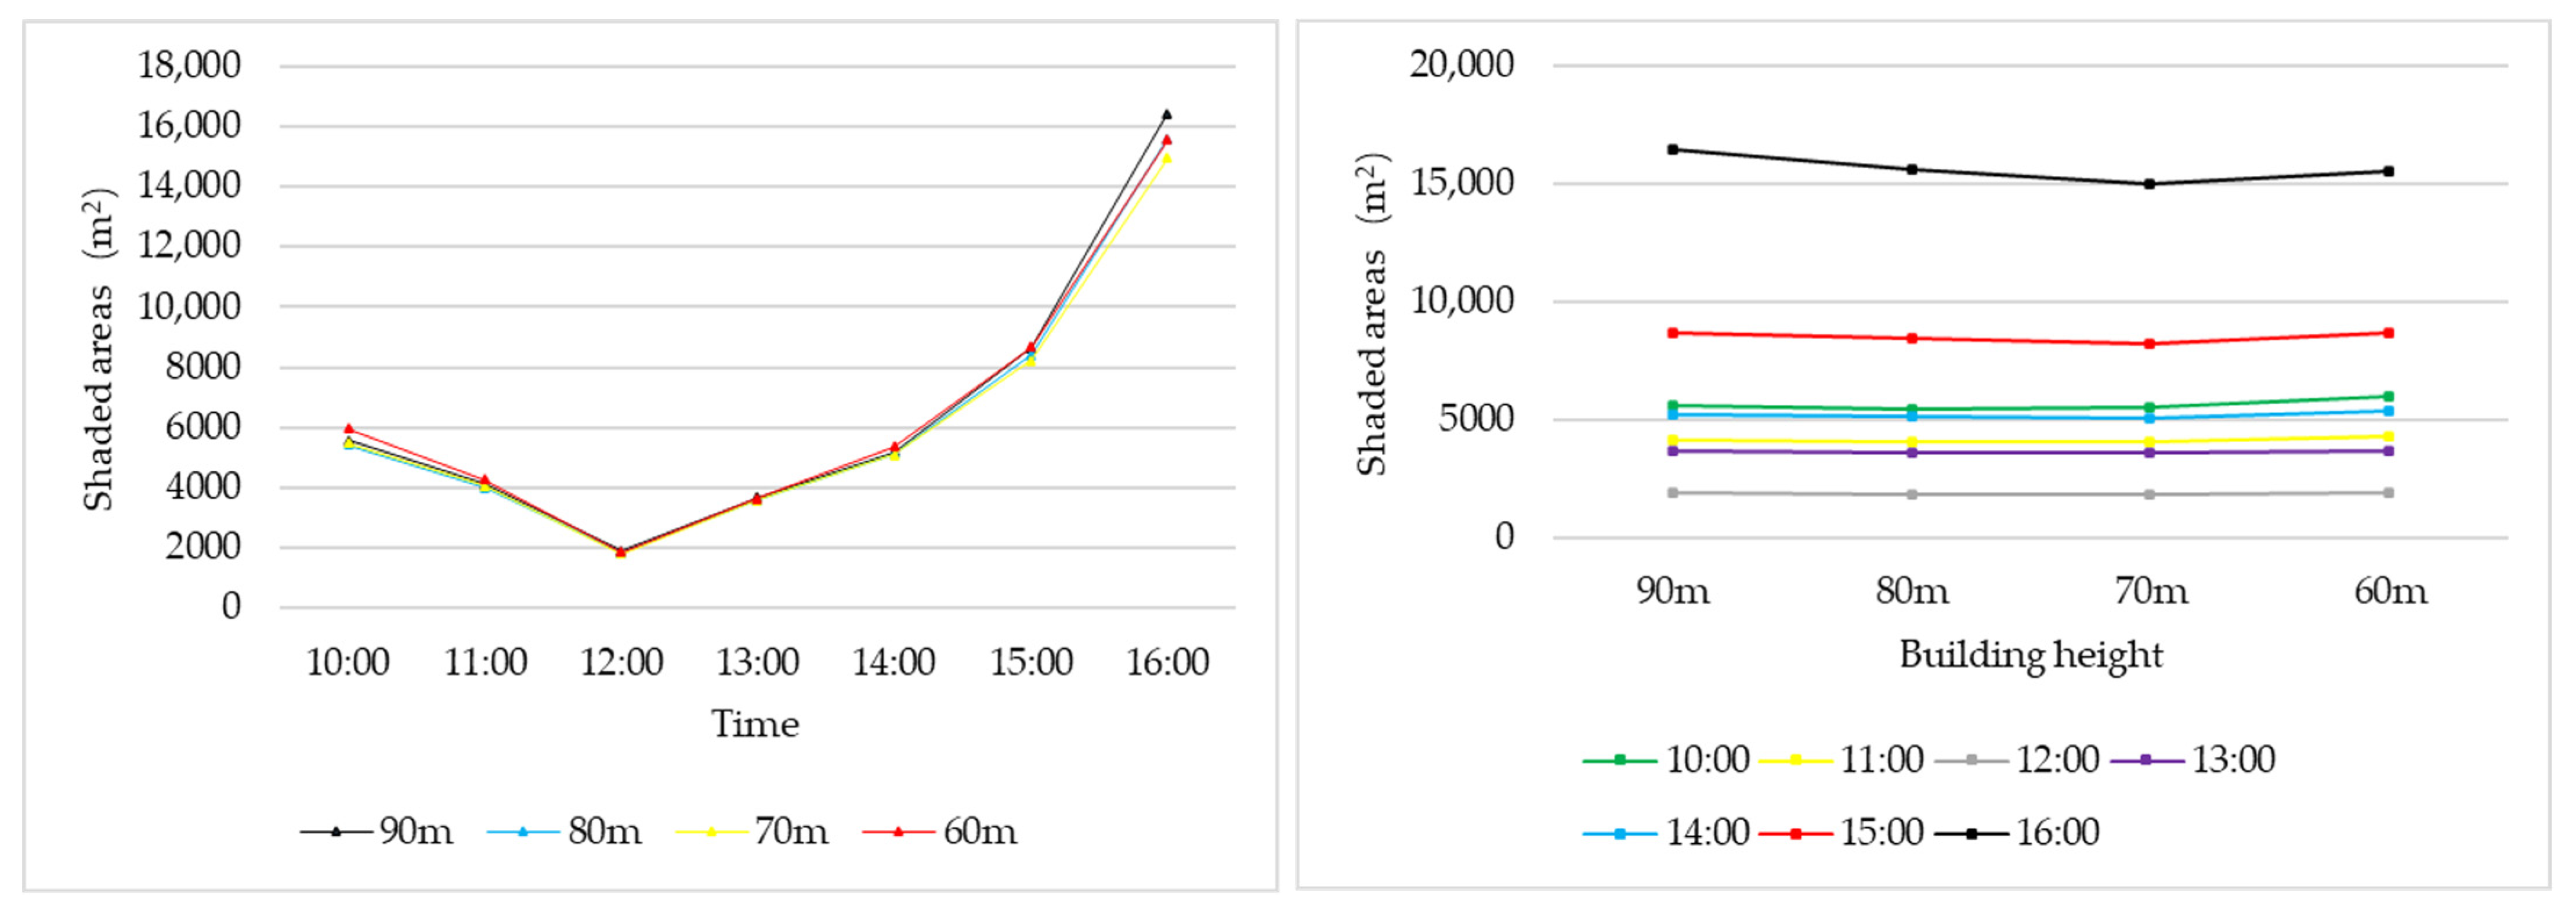
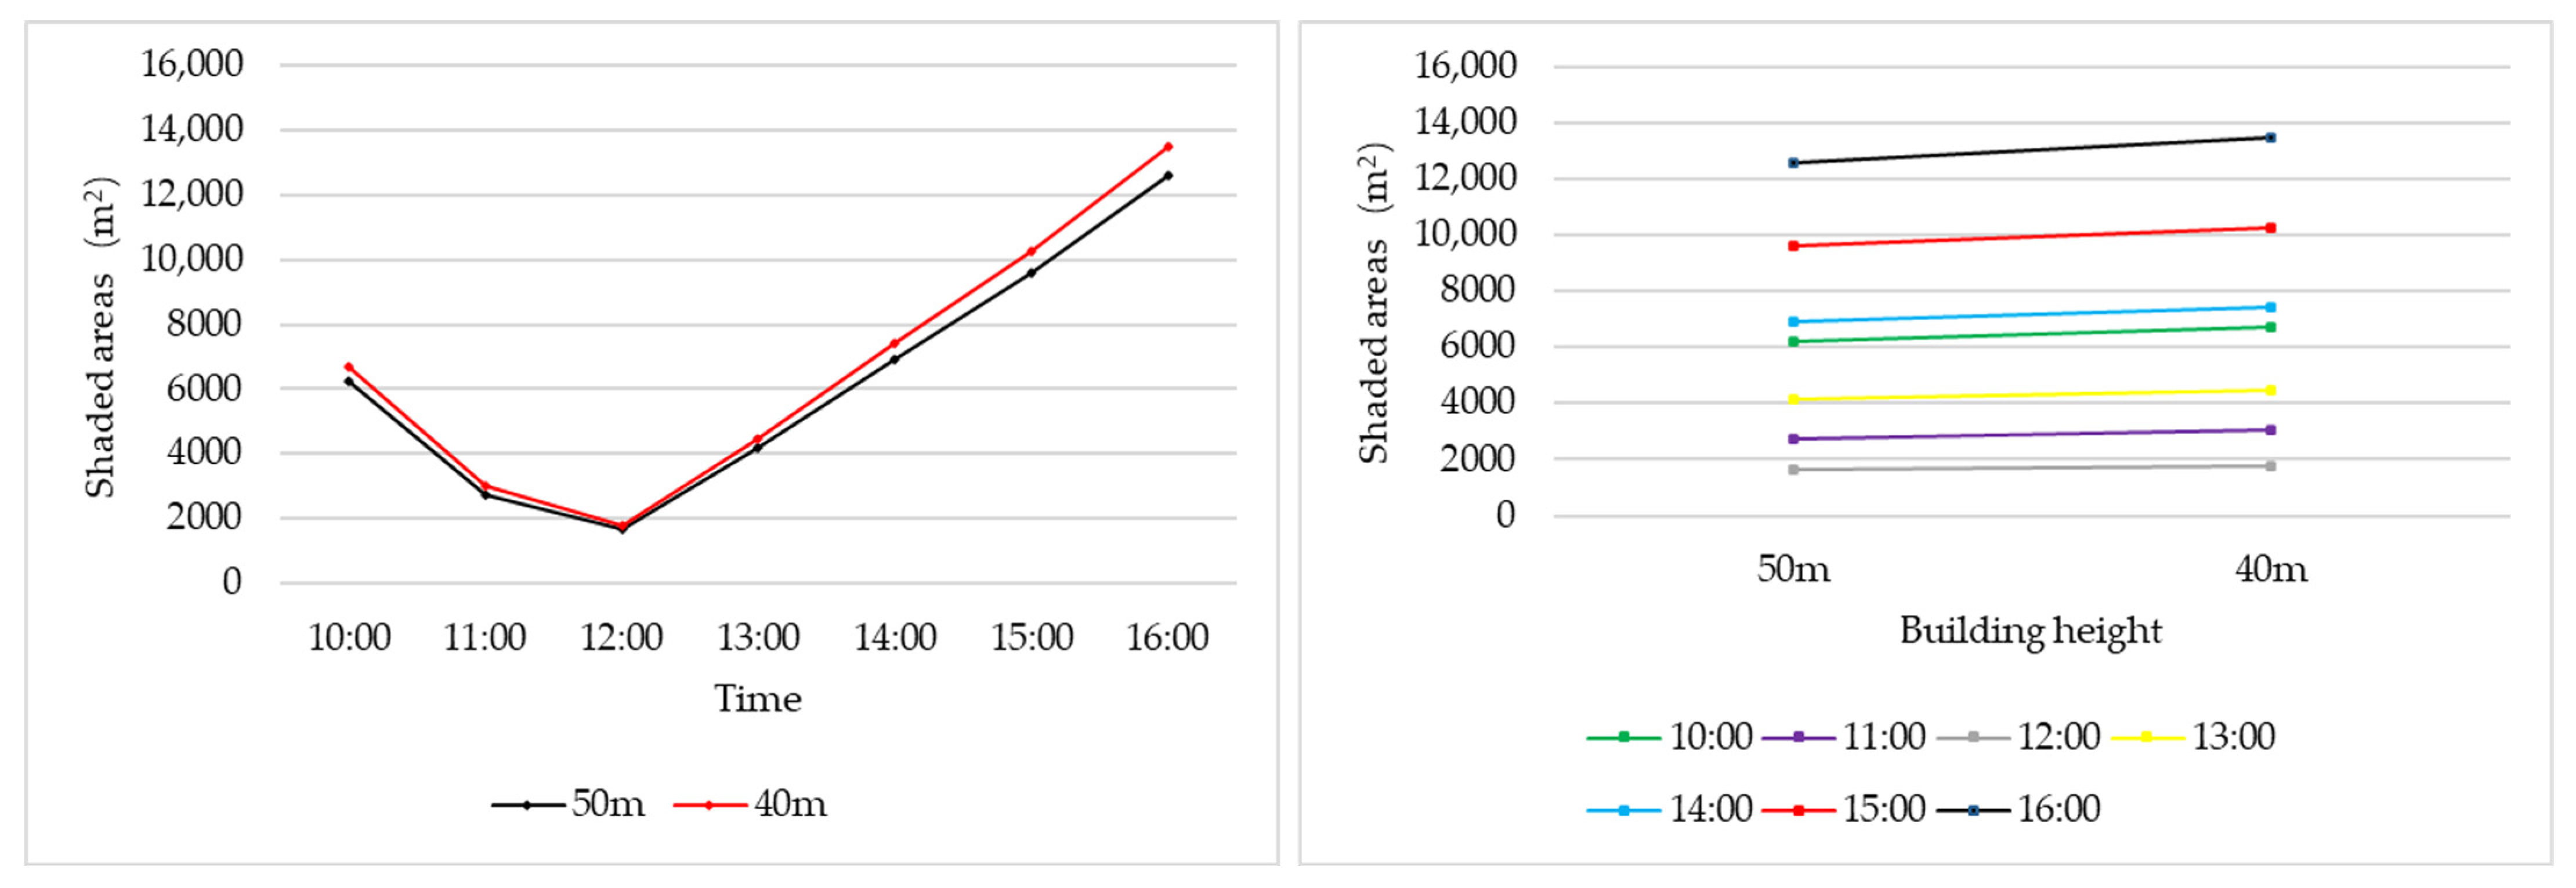
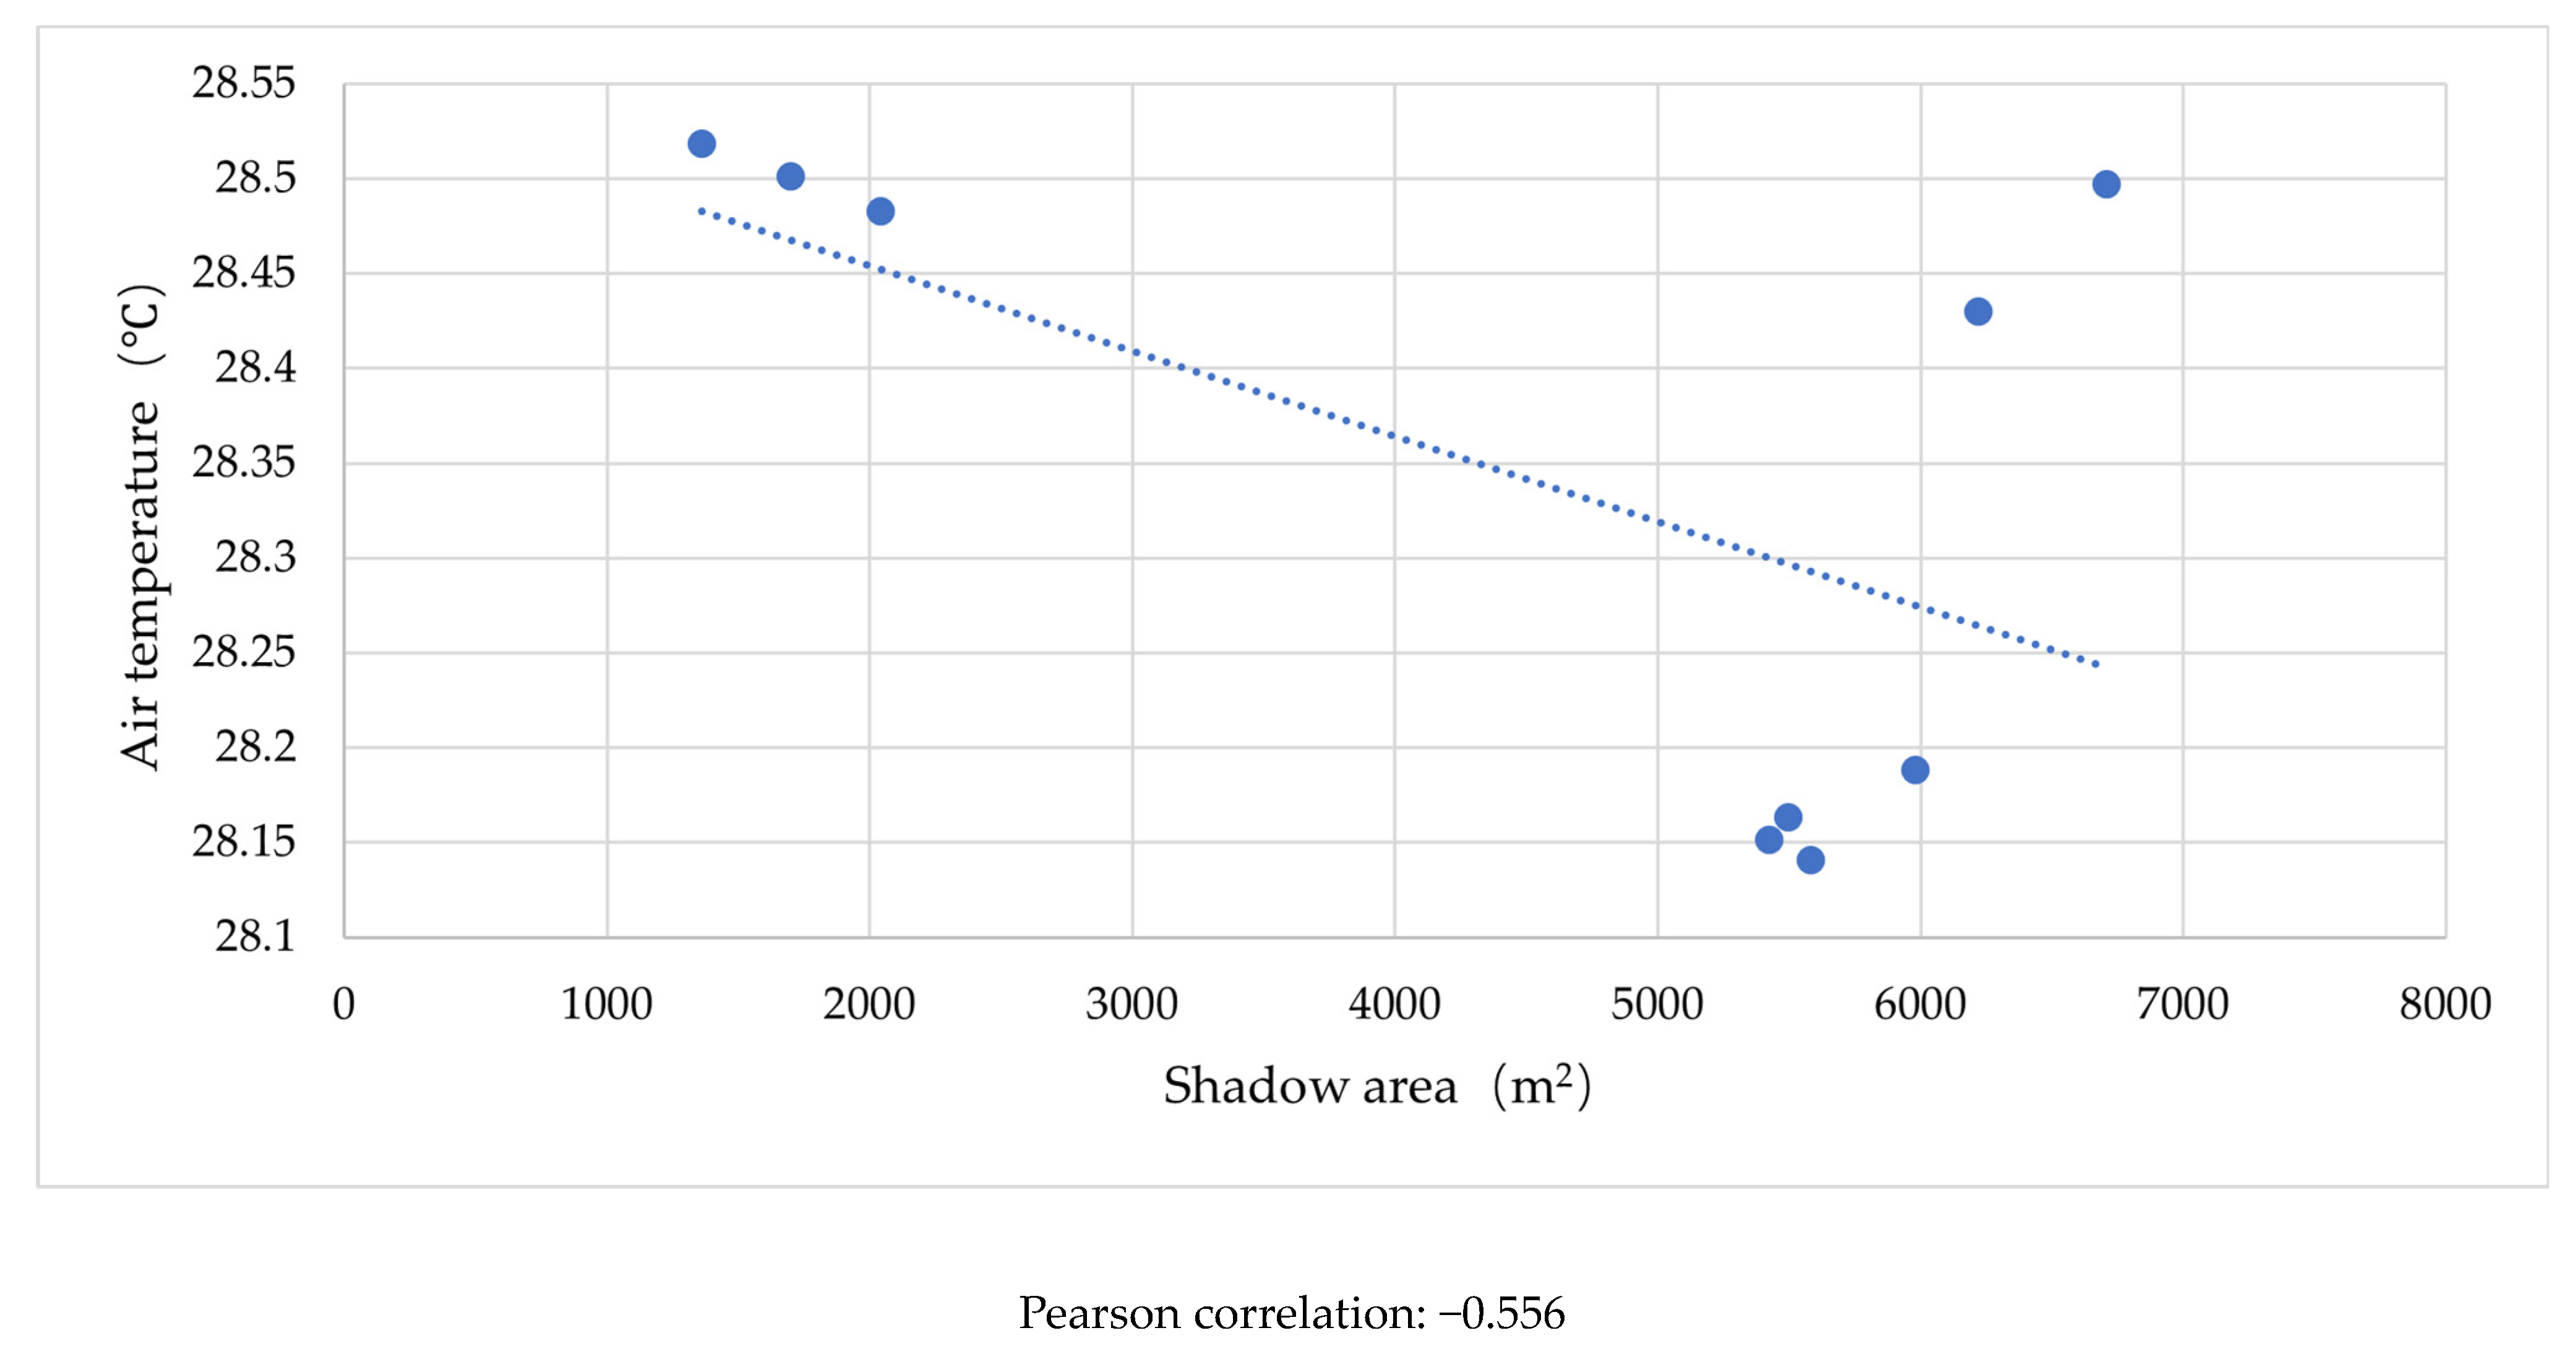
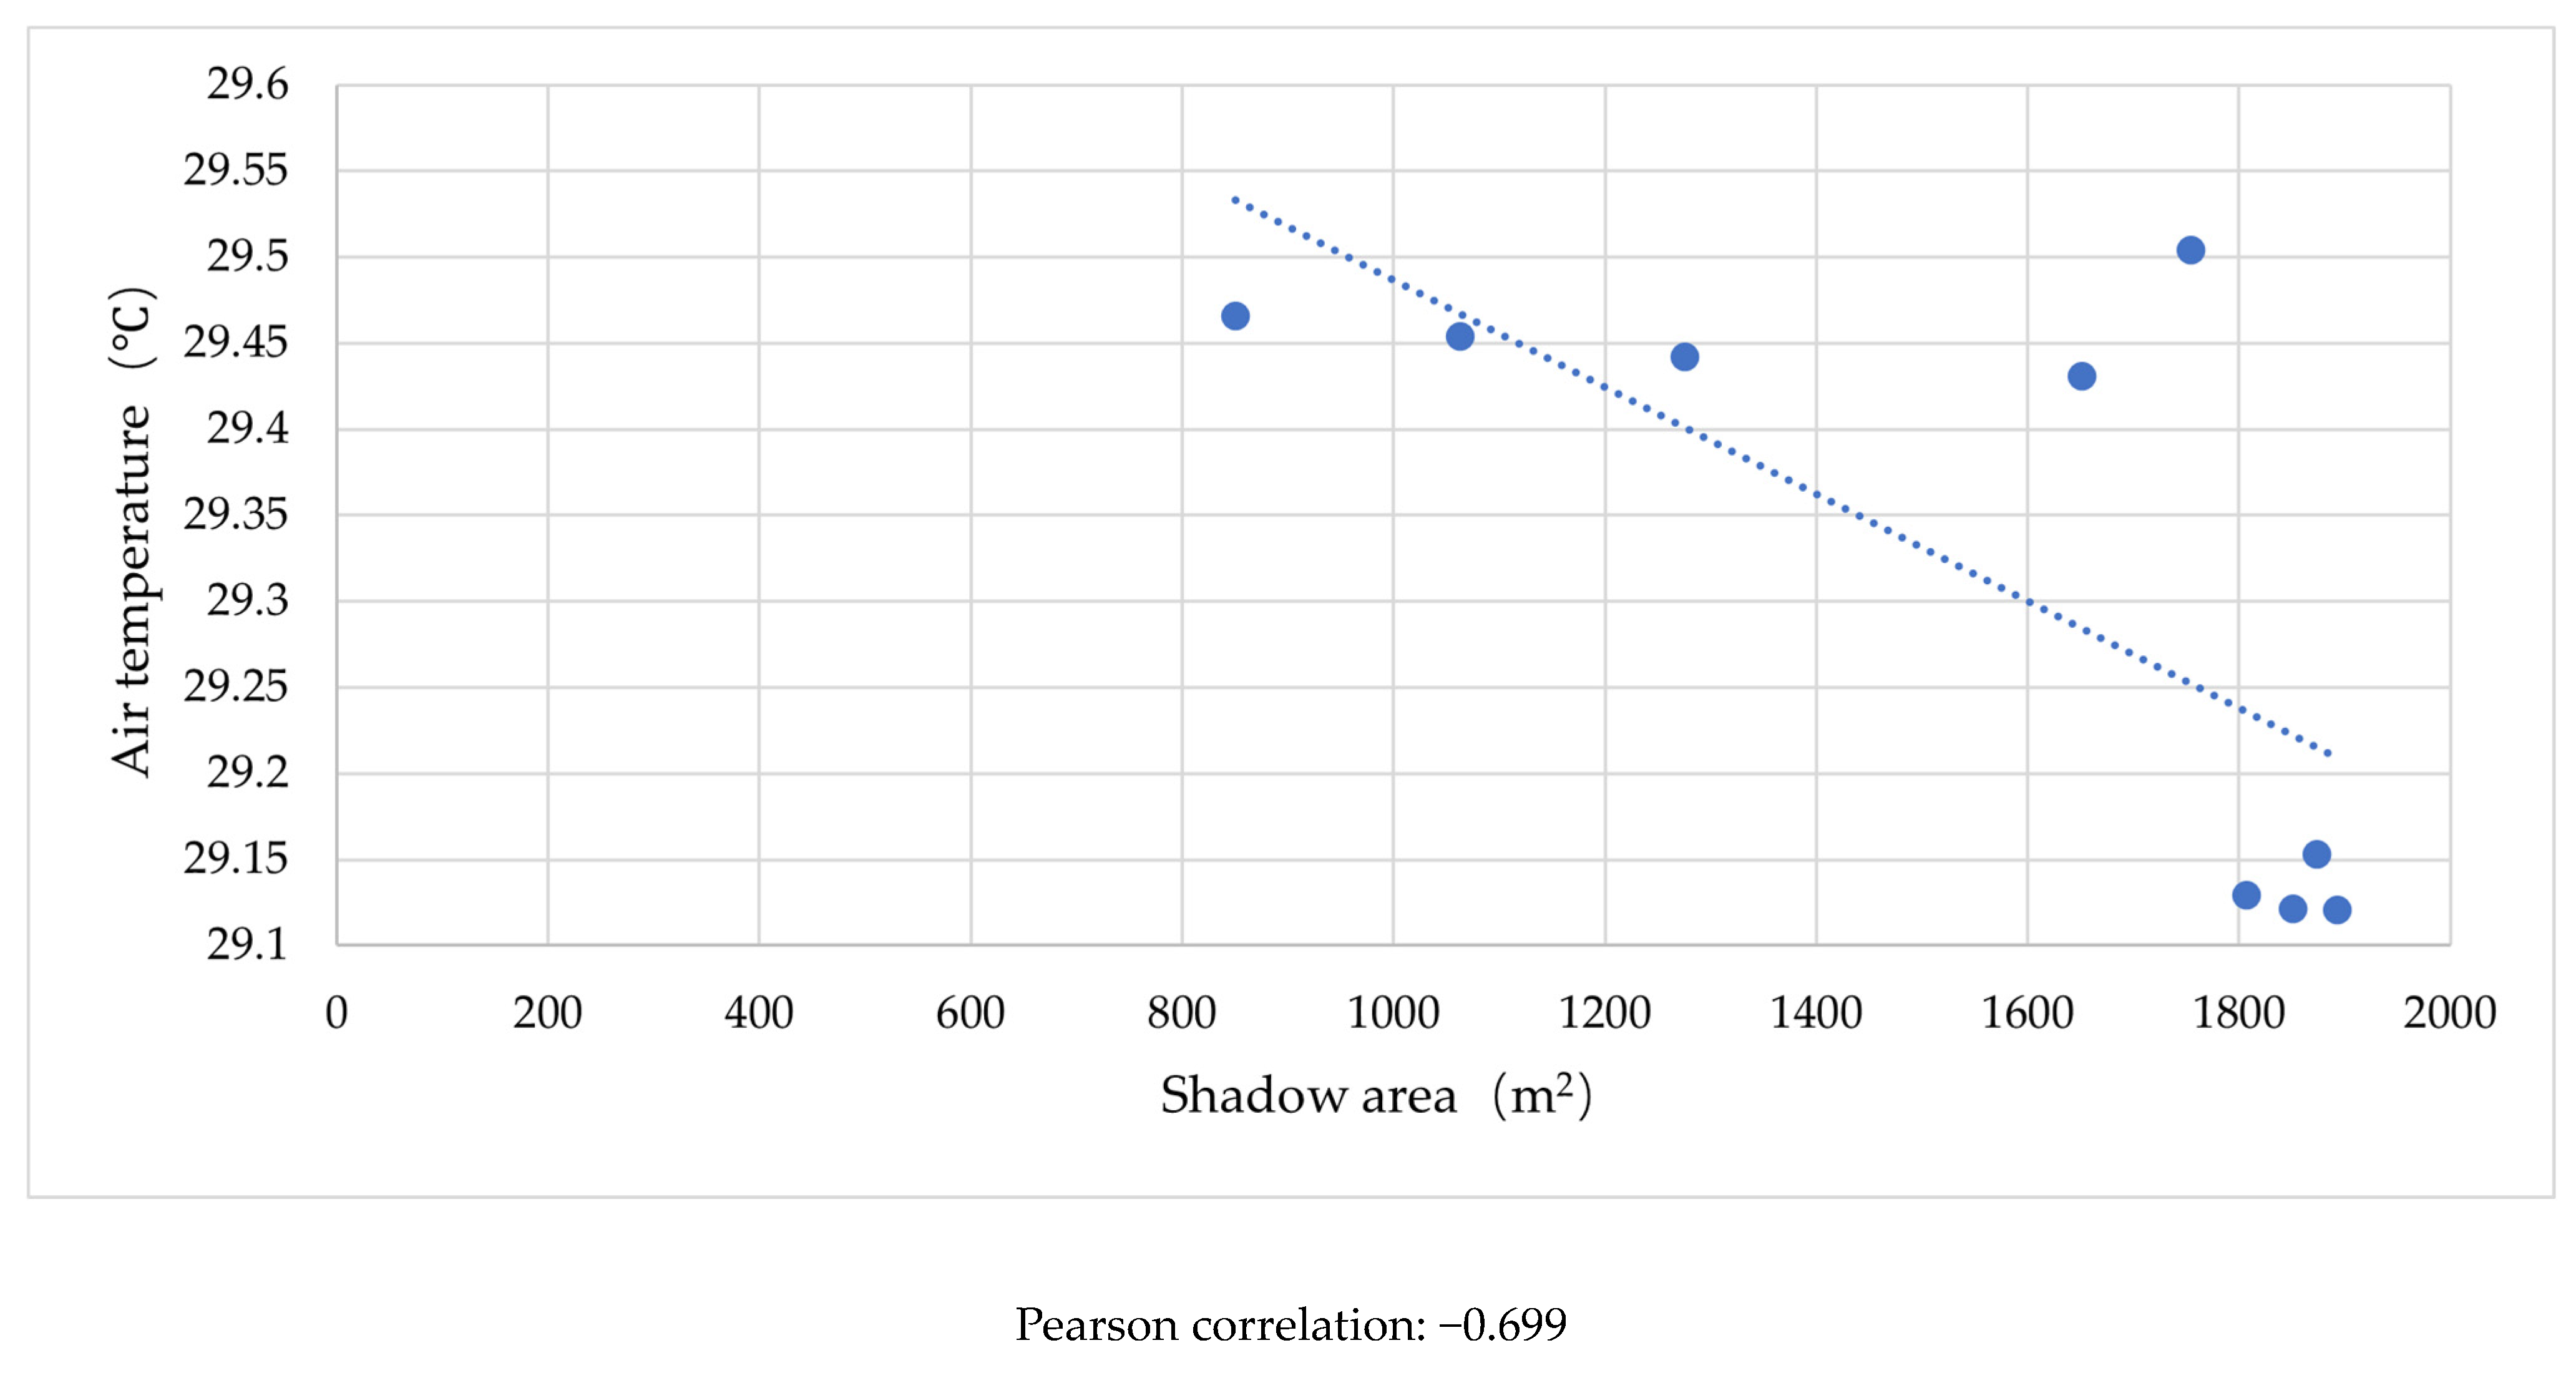
3.5. The Impact of Building Heights and Base Areas on Air Temperature

We calculated the building-shadow areas of the nine models in the three research groups mentioned above at different times on 28 June 2023 (Figure 13). We simulated the microclimate condition of the above nine models using ENVI-met, exported the surface air-temperature values at 10:00, 12:00, and 16:00, and calculated the average temperatures to analyze the correlation between the average air temperature of the block and the shadow area of the buildings.
Figure 14 and Figure 15 show the change in building shadows in Jianfayangxi and Zhongtianfengjing, respectively. During the study setup, in order to ensure that the floor-area ratio remains unchanged, we reduced the building height while also increasing the base area of the building. There are two variables in the study setup that can change the shadow area of the building. These results did not show a simple decrease in the area of shadow with the decrease in building height. In Jianfayangxi, the comparison results for the building-shadow areas show the following order: 90 m buildings > 60 m buildings > 80 m buildings > 70 m buildings. In the high-rise row pattern, the influence of building height on building shadow is more substantial compared to the building base area. In the Zhongtianfengjing prototype, the comparison results for the shadow areas show the following order: 40 m buildings > 50 m buildings. The influence of the building base area on the building shadow is greater than the influence of the building height in the small high-rise point-pattern buildings. However, regardless of the height of the buildings, the overall trend of the change in the shadow area remains as follows: the shadow area gradually decreases from 10:00 a.m. to 12:00 noon, gradually increases from 12:00 noon to 16:00 p.m., and is the smallest at 12:00 noon.
Figure 16 shows the trend of the changes in the shadow area of the building in the Kedajingyuan prototype. In this study, only the heights of the buildings were changed, and the base area of the building was constant. The size of the shadow area of the building was only related to the building’s height. The results indicate that, as the height of the building decreases, the building’s shadow area will decrease linearly. This is in line with the motion law of the sunlight angle.
Figure 17, Figure 18 and Figure 19 show the results of the regression analyses of the average air temperatures and building-shadow areas in the blocks at different building heights at 10:00, 12:00, and 16:00, respectively. The Pearson correlation coefficient of the regression model is −0.556 at 10:00, representing a moderate negative correlation. At 12:00, the Pearson correlation coefficient of the regression model is −0.699, representing a strong negative correlation. Figure 18, Figure 19 and Figure 20 show the regression analysis models of the average air temperatures and building-shadow areas in the block for different building heights at 10:00, 12:00, and 16:00, respectively. The Pearson correlation coefficient of the regression model is −0.556 at 10:00, representing a moderate negative correlation. At 12:00, the Pearson correlation coefficient of the regression model is −0.699, representing a strong negative correlation. At 16:00, the Pearson correlation coefficient of the regression model is −0.784, representing a strong negative correlation. This result indicates that the shadow area of the buildings is an important factor for improving the outdoor microclimate. As the buildings’ shadow areas increase, the outdoor temperature decreases. Therefore, within the allowable floor-area ratio range, within a determined building density, the height of the building can be increased to increase the building’s shadow area and improve the outdoor thermal comfort. However, if the floor-area ratio remains unchanged and the building density and height can change simultaneously, then it is not necessarily the case that the higher the building height (with a corresponding smaller base area), the larger the shadow area of the building. In this case, both factors should be considered simultaneously to determine an optimal solution and find a suitable combination of building height and base area.

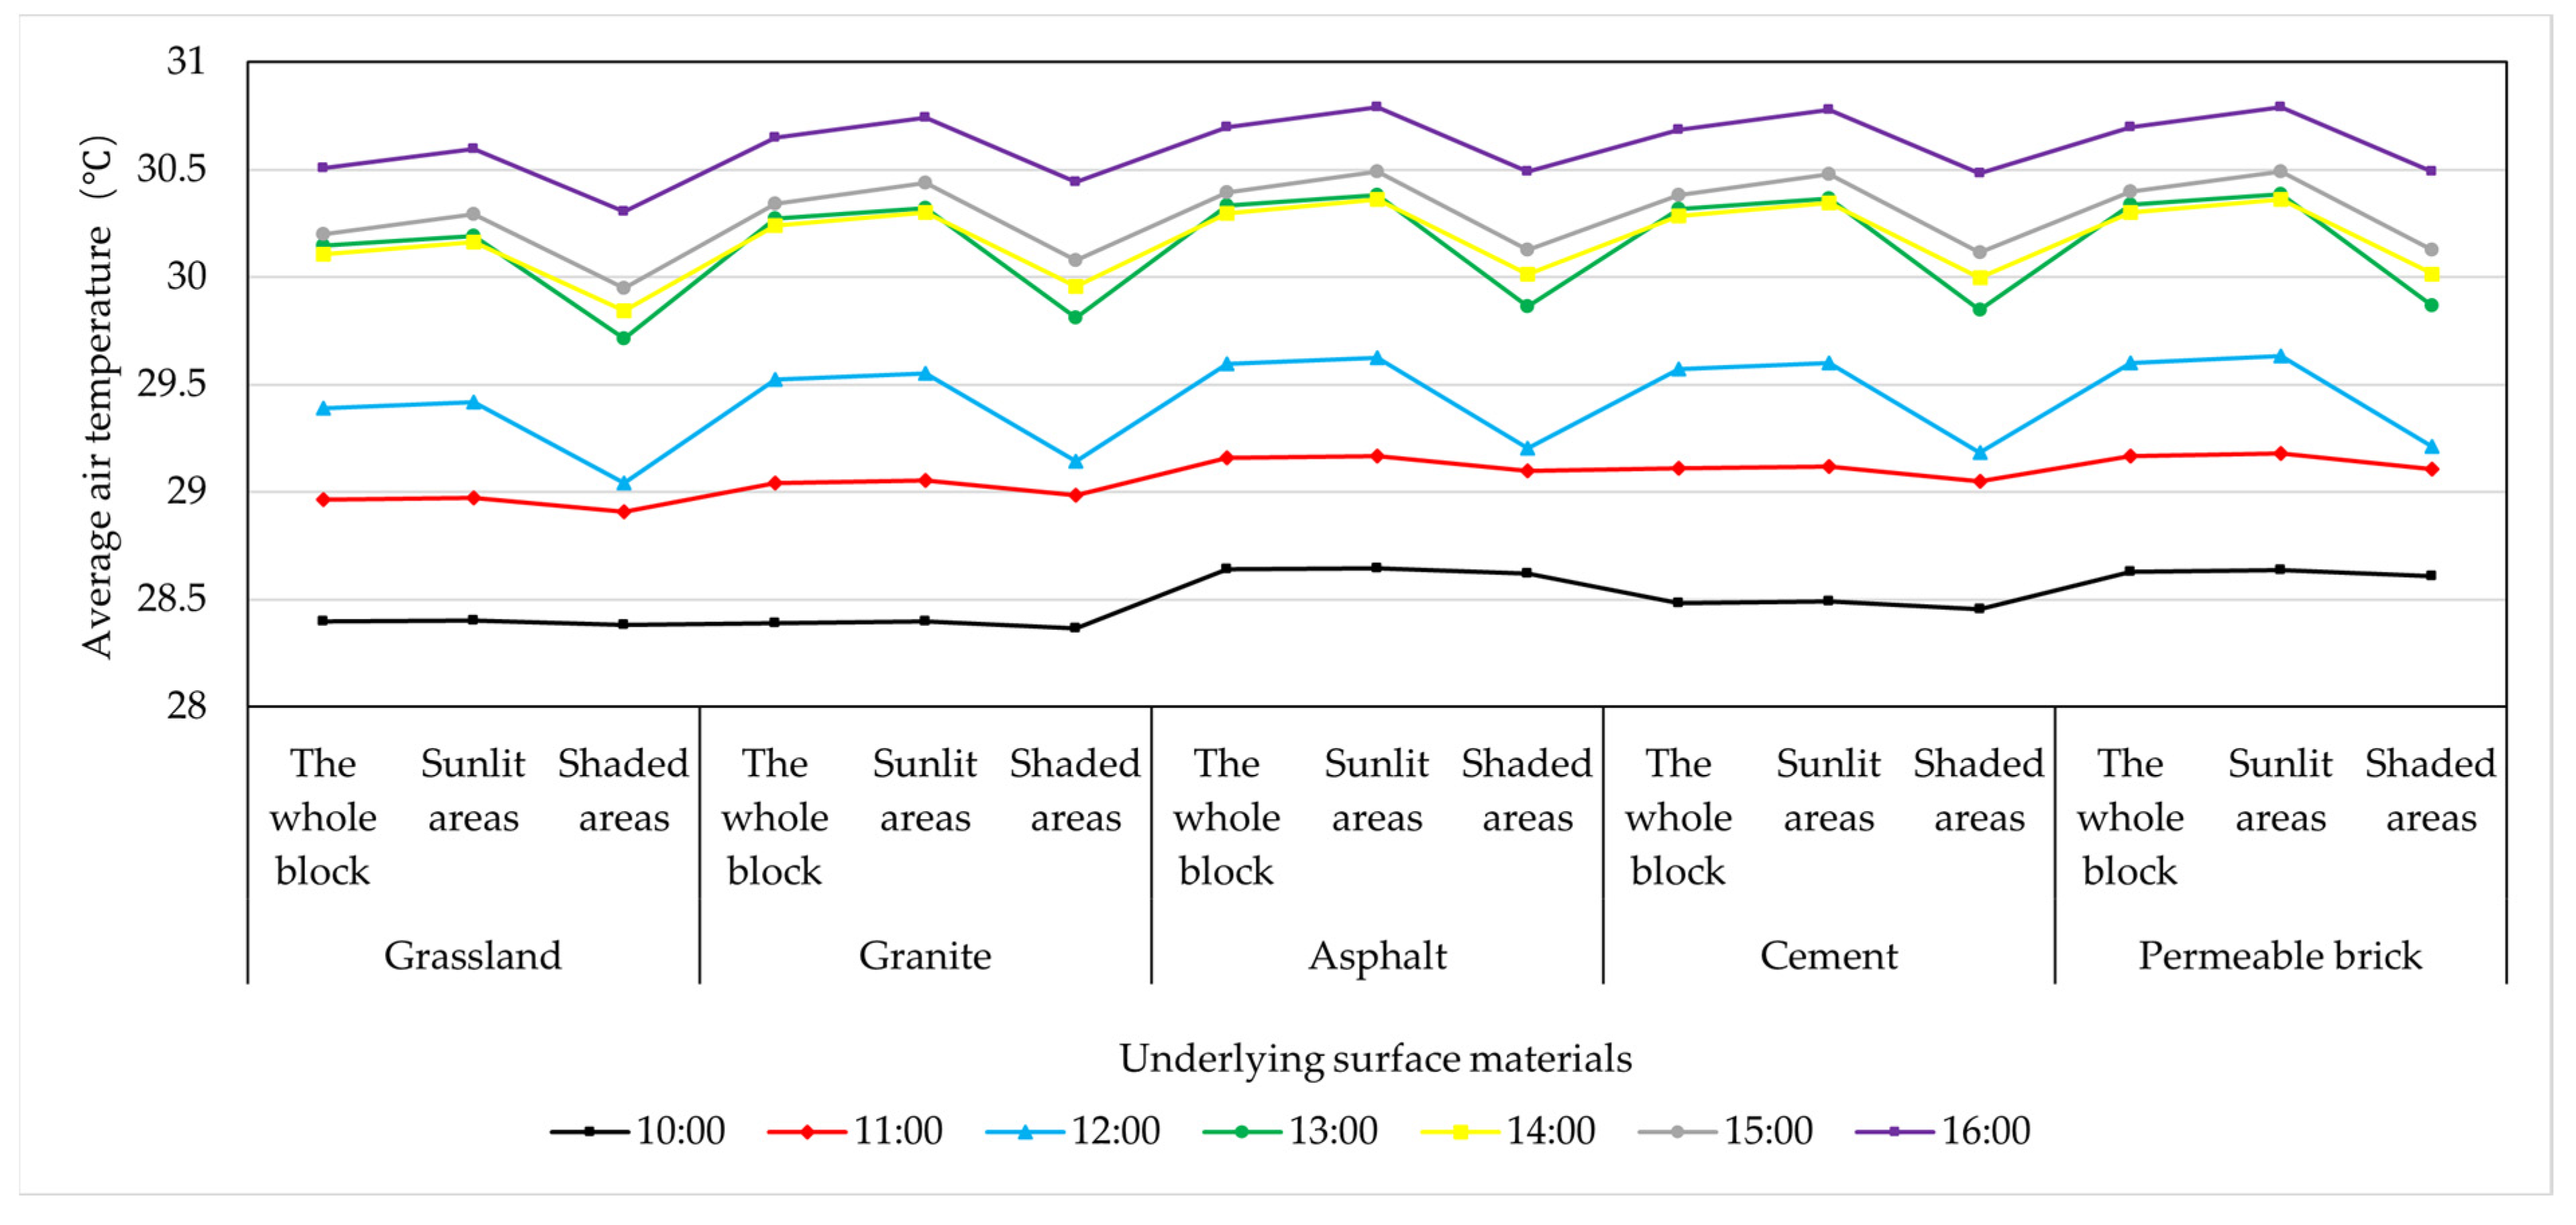
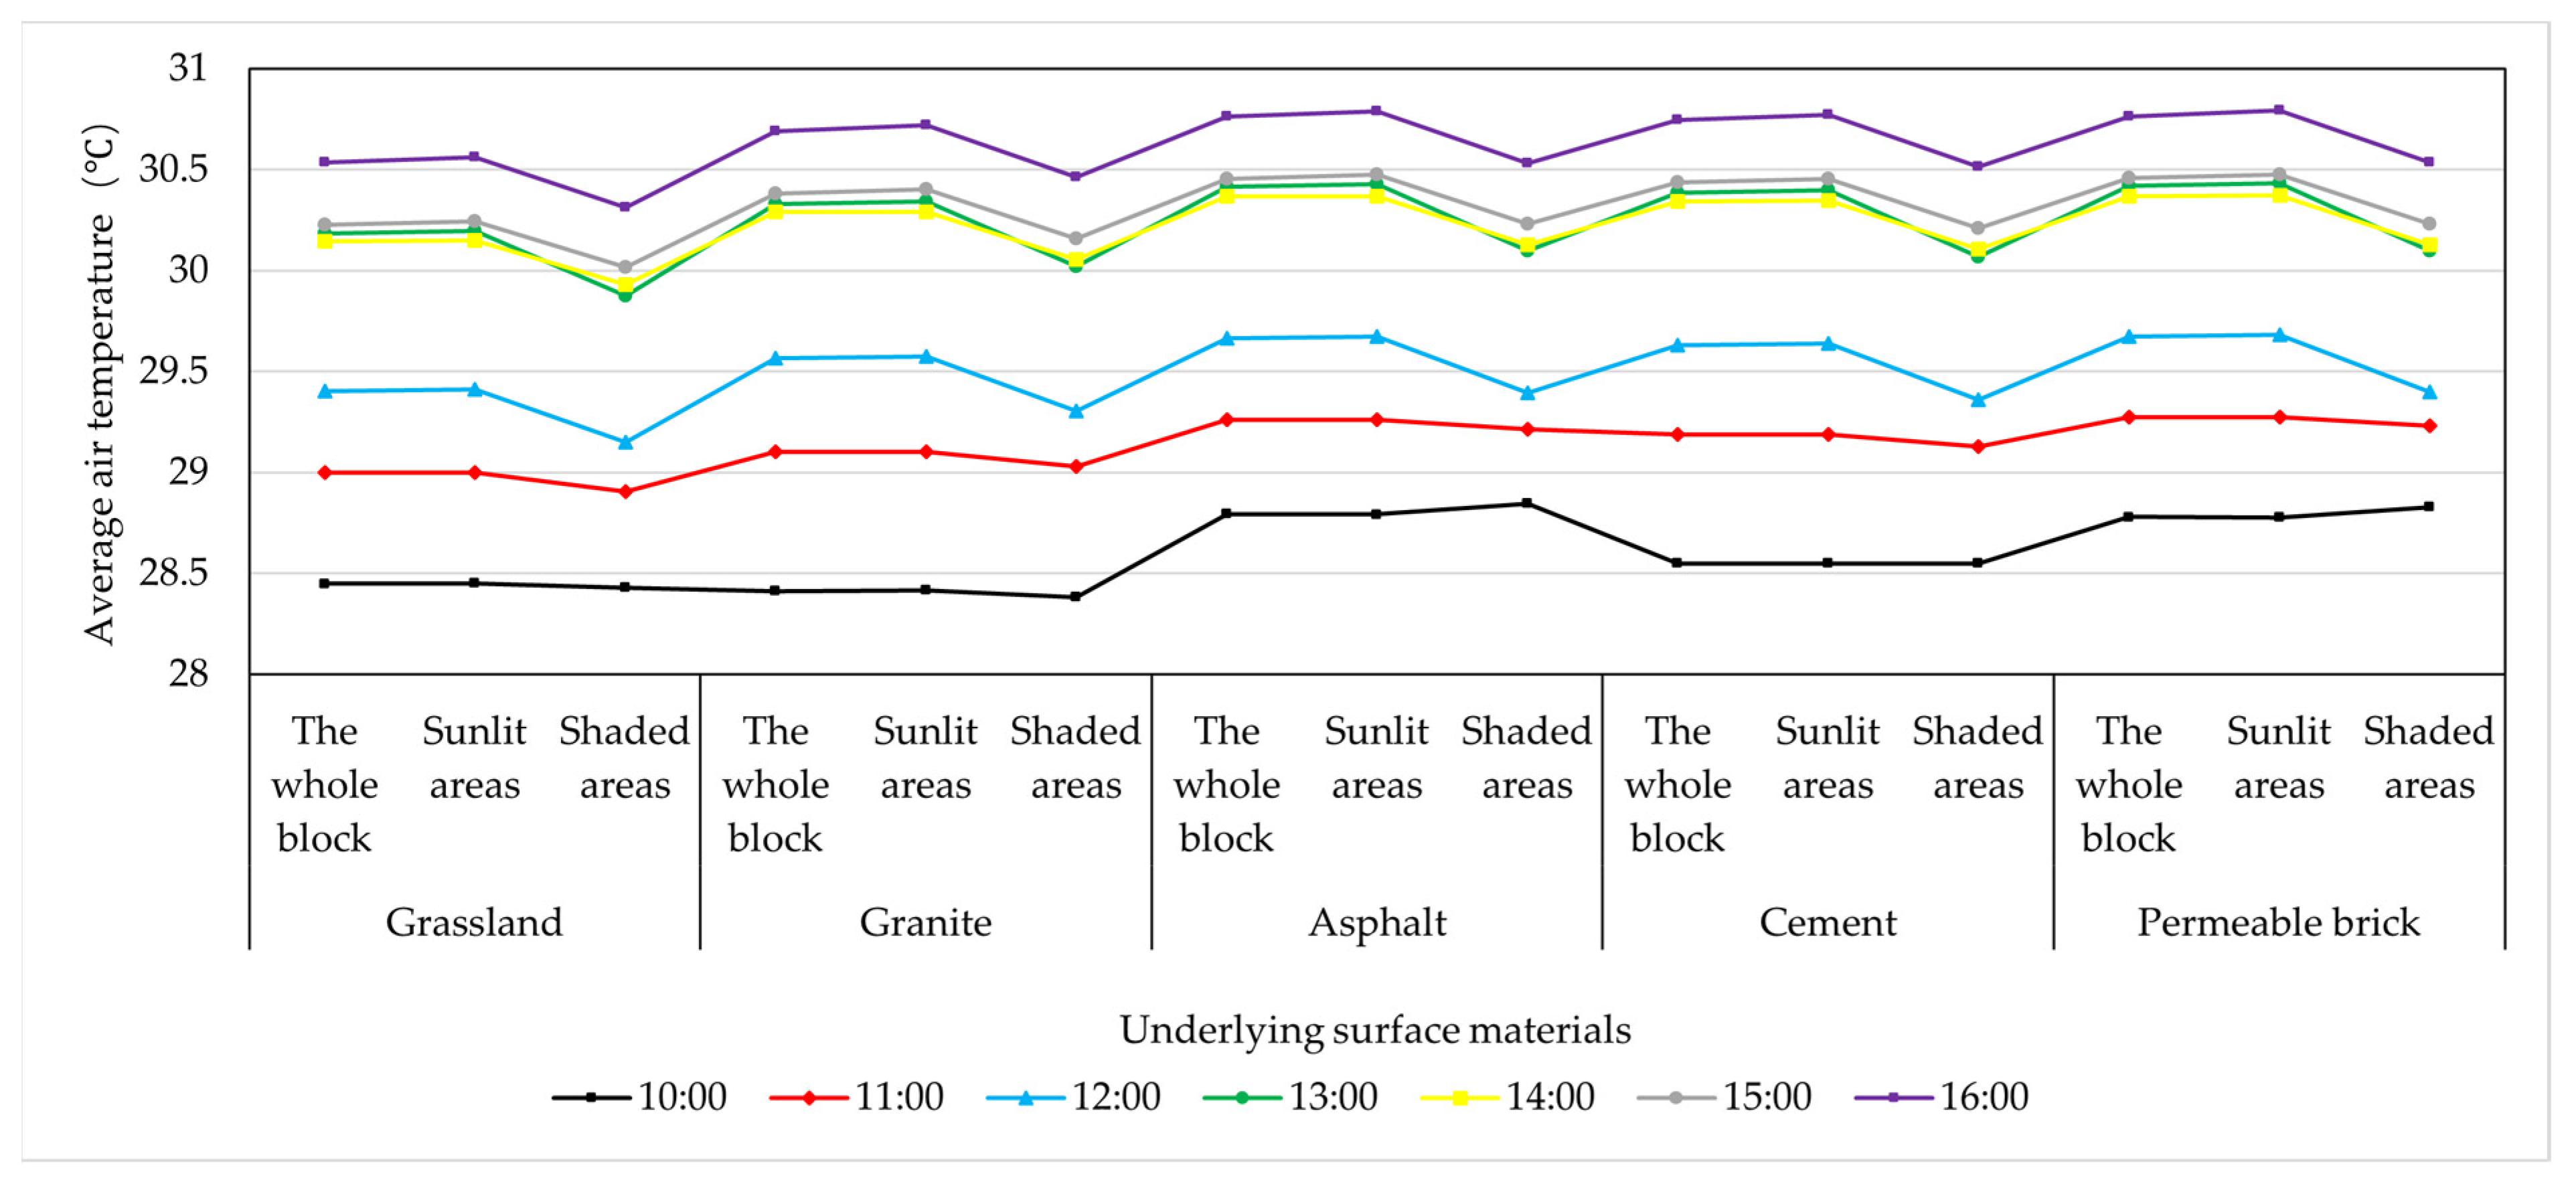
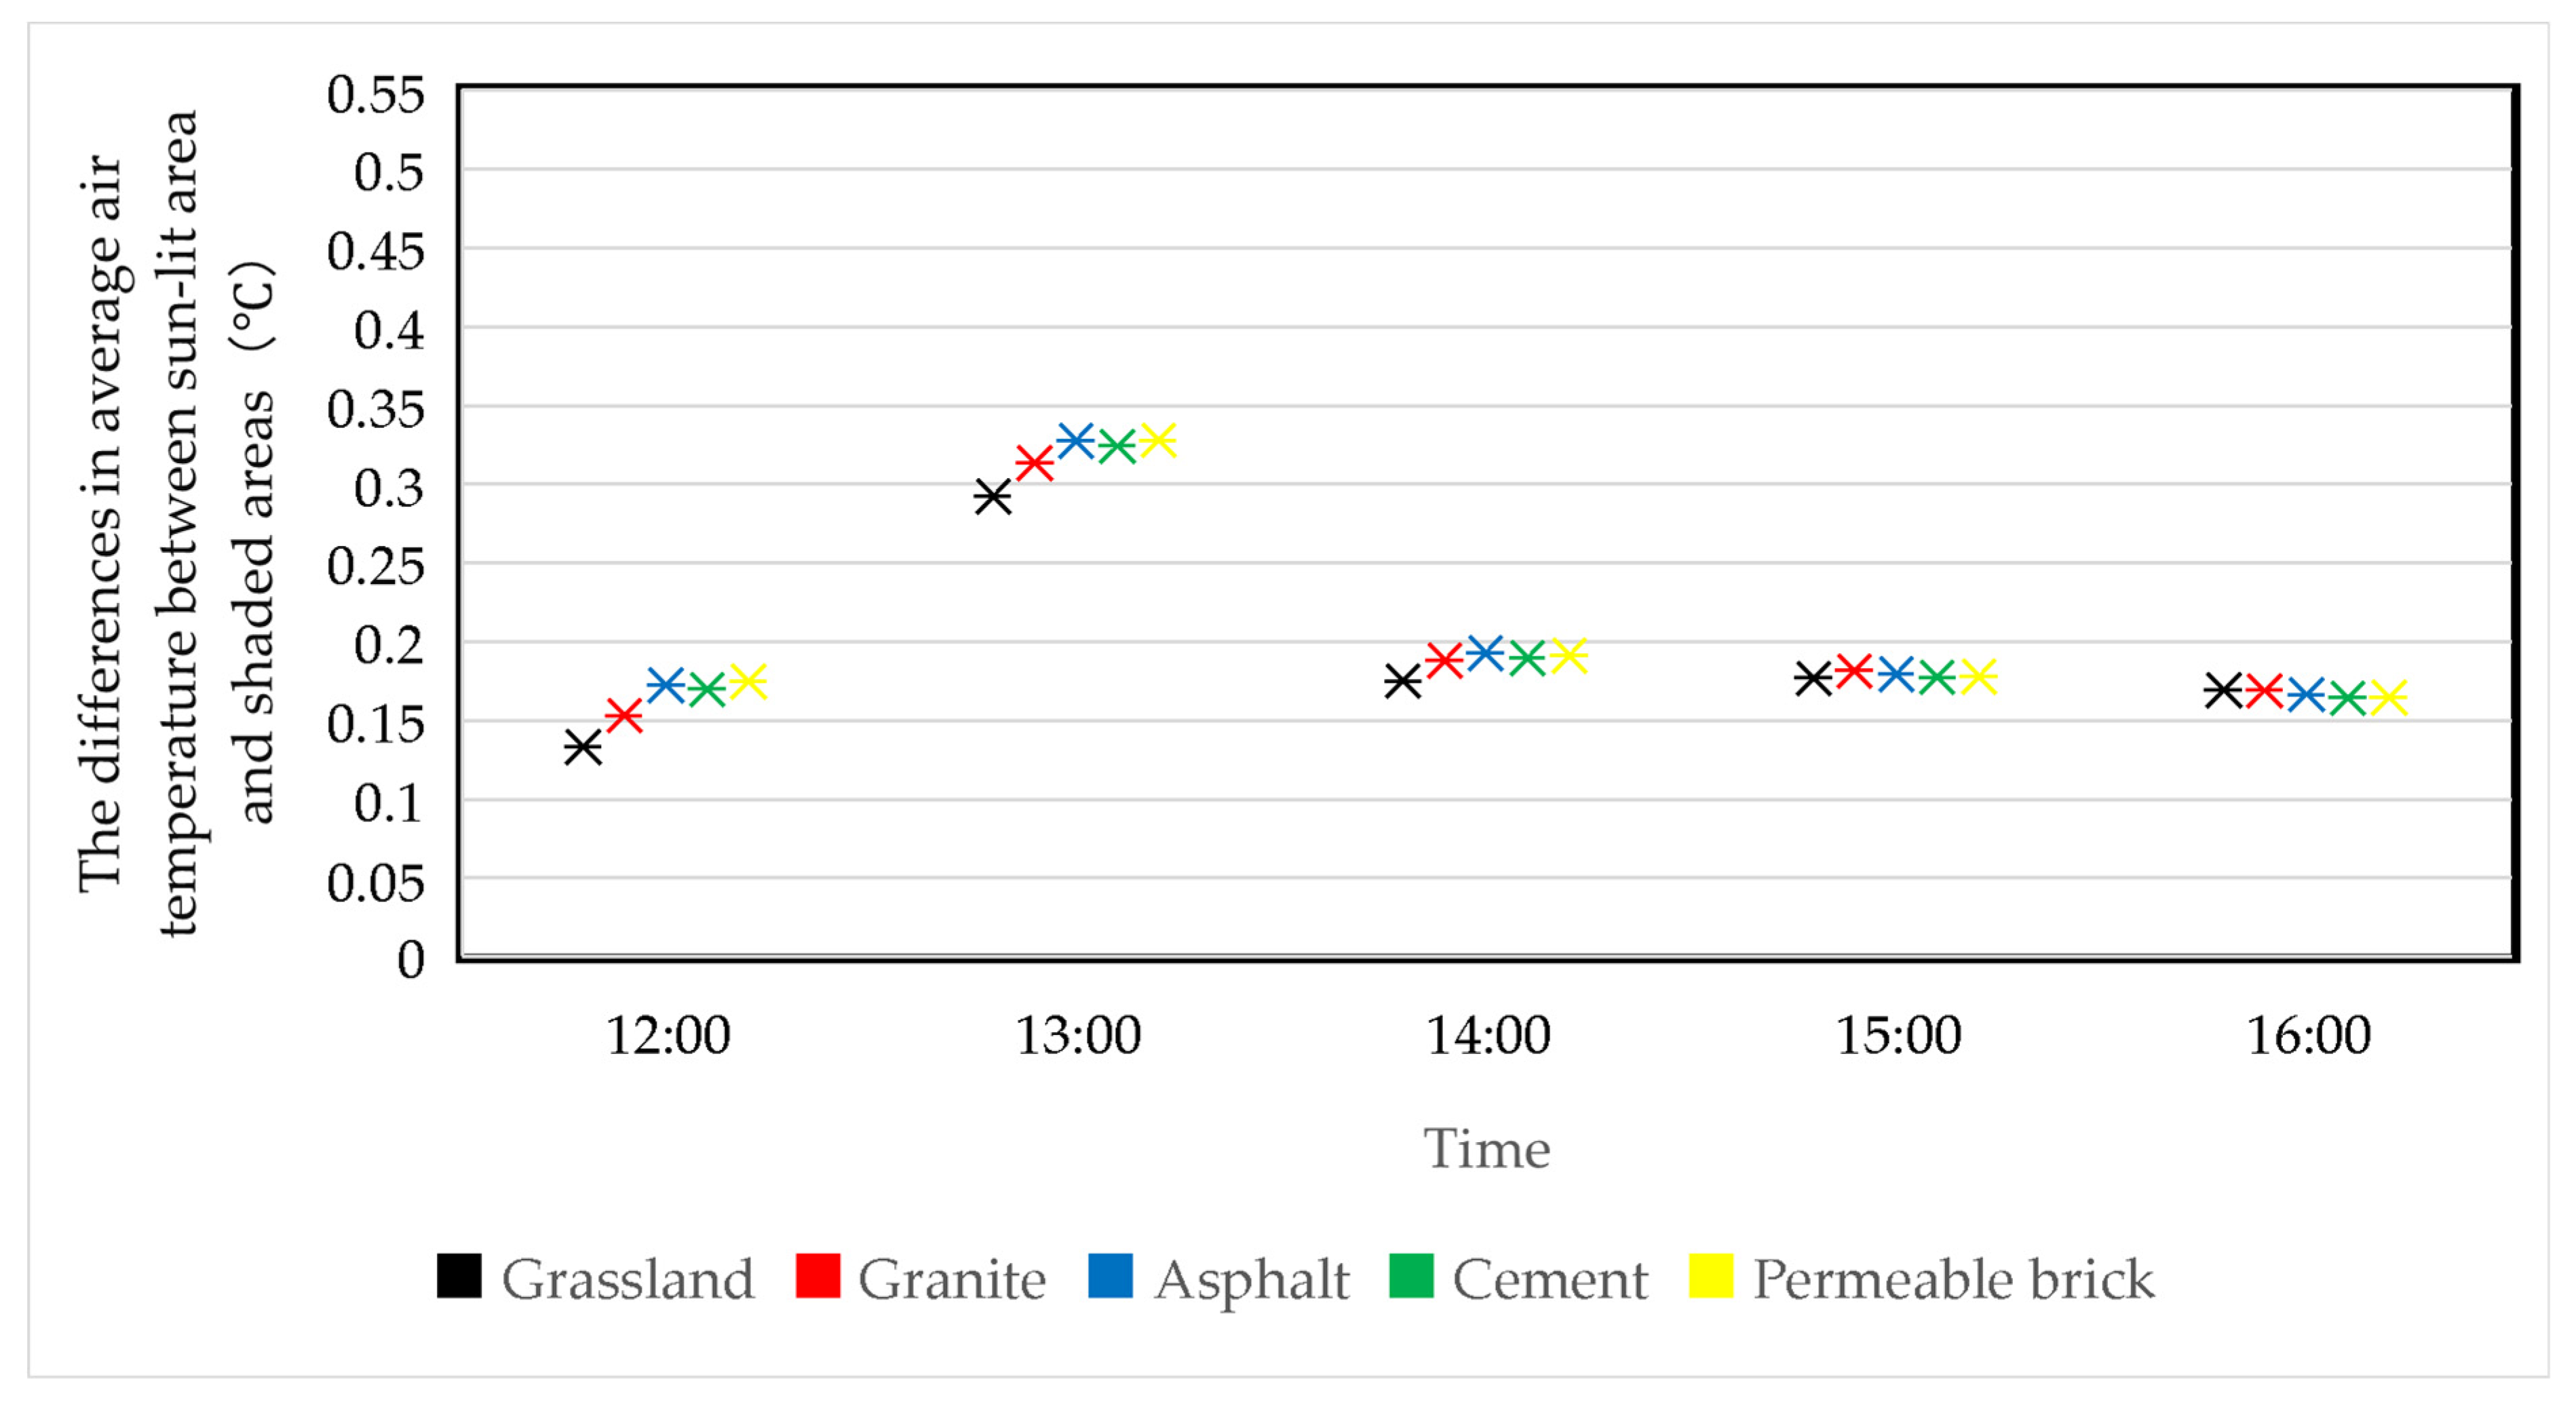
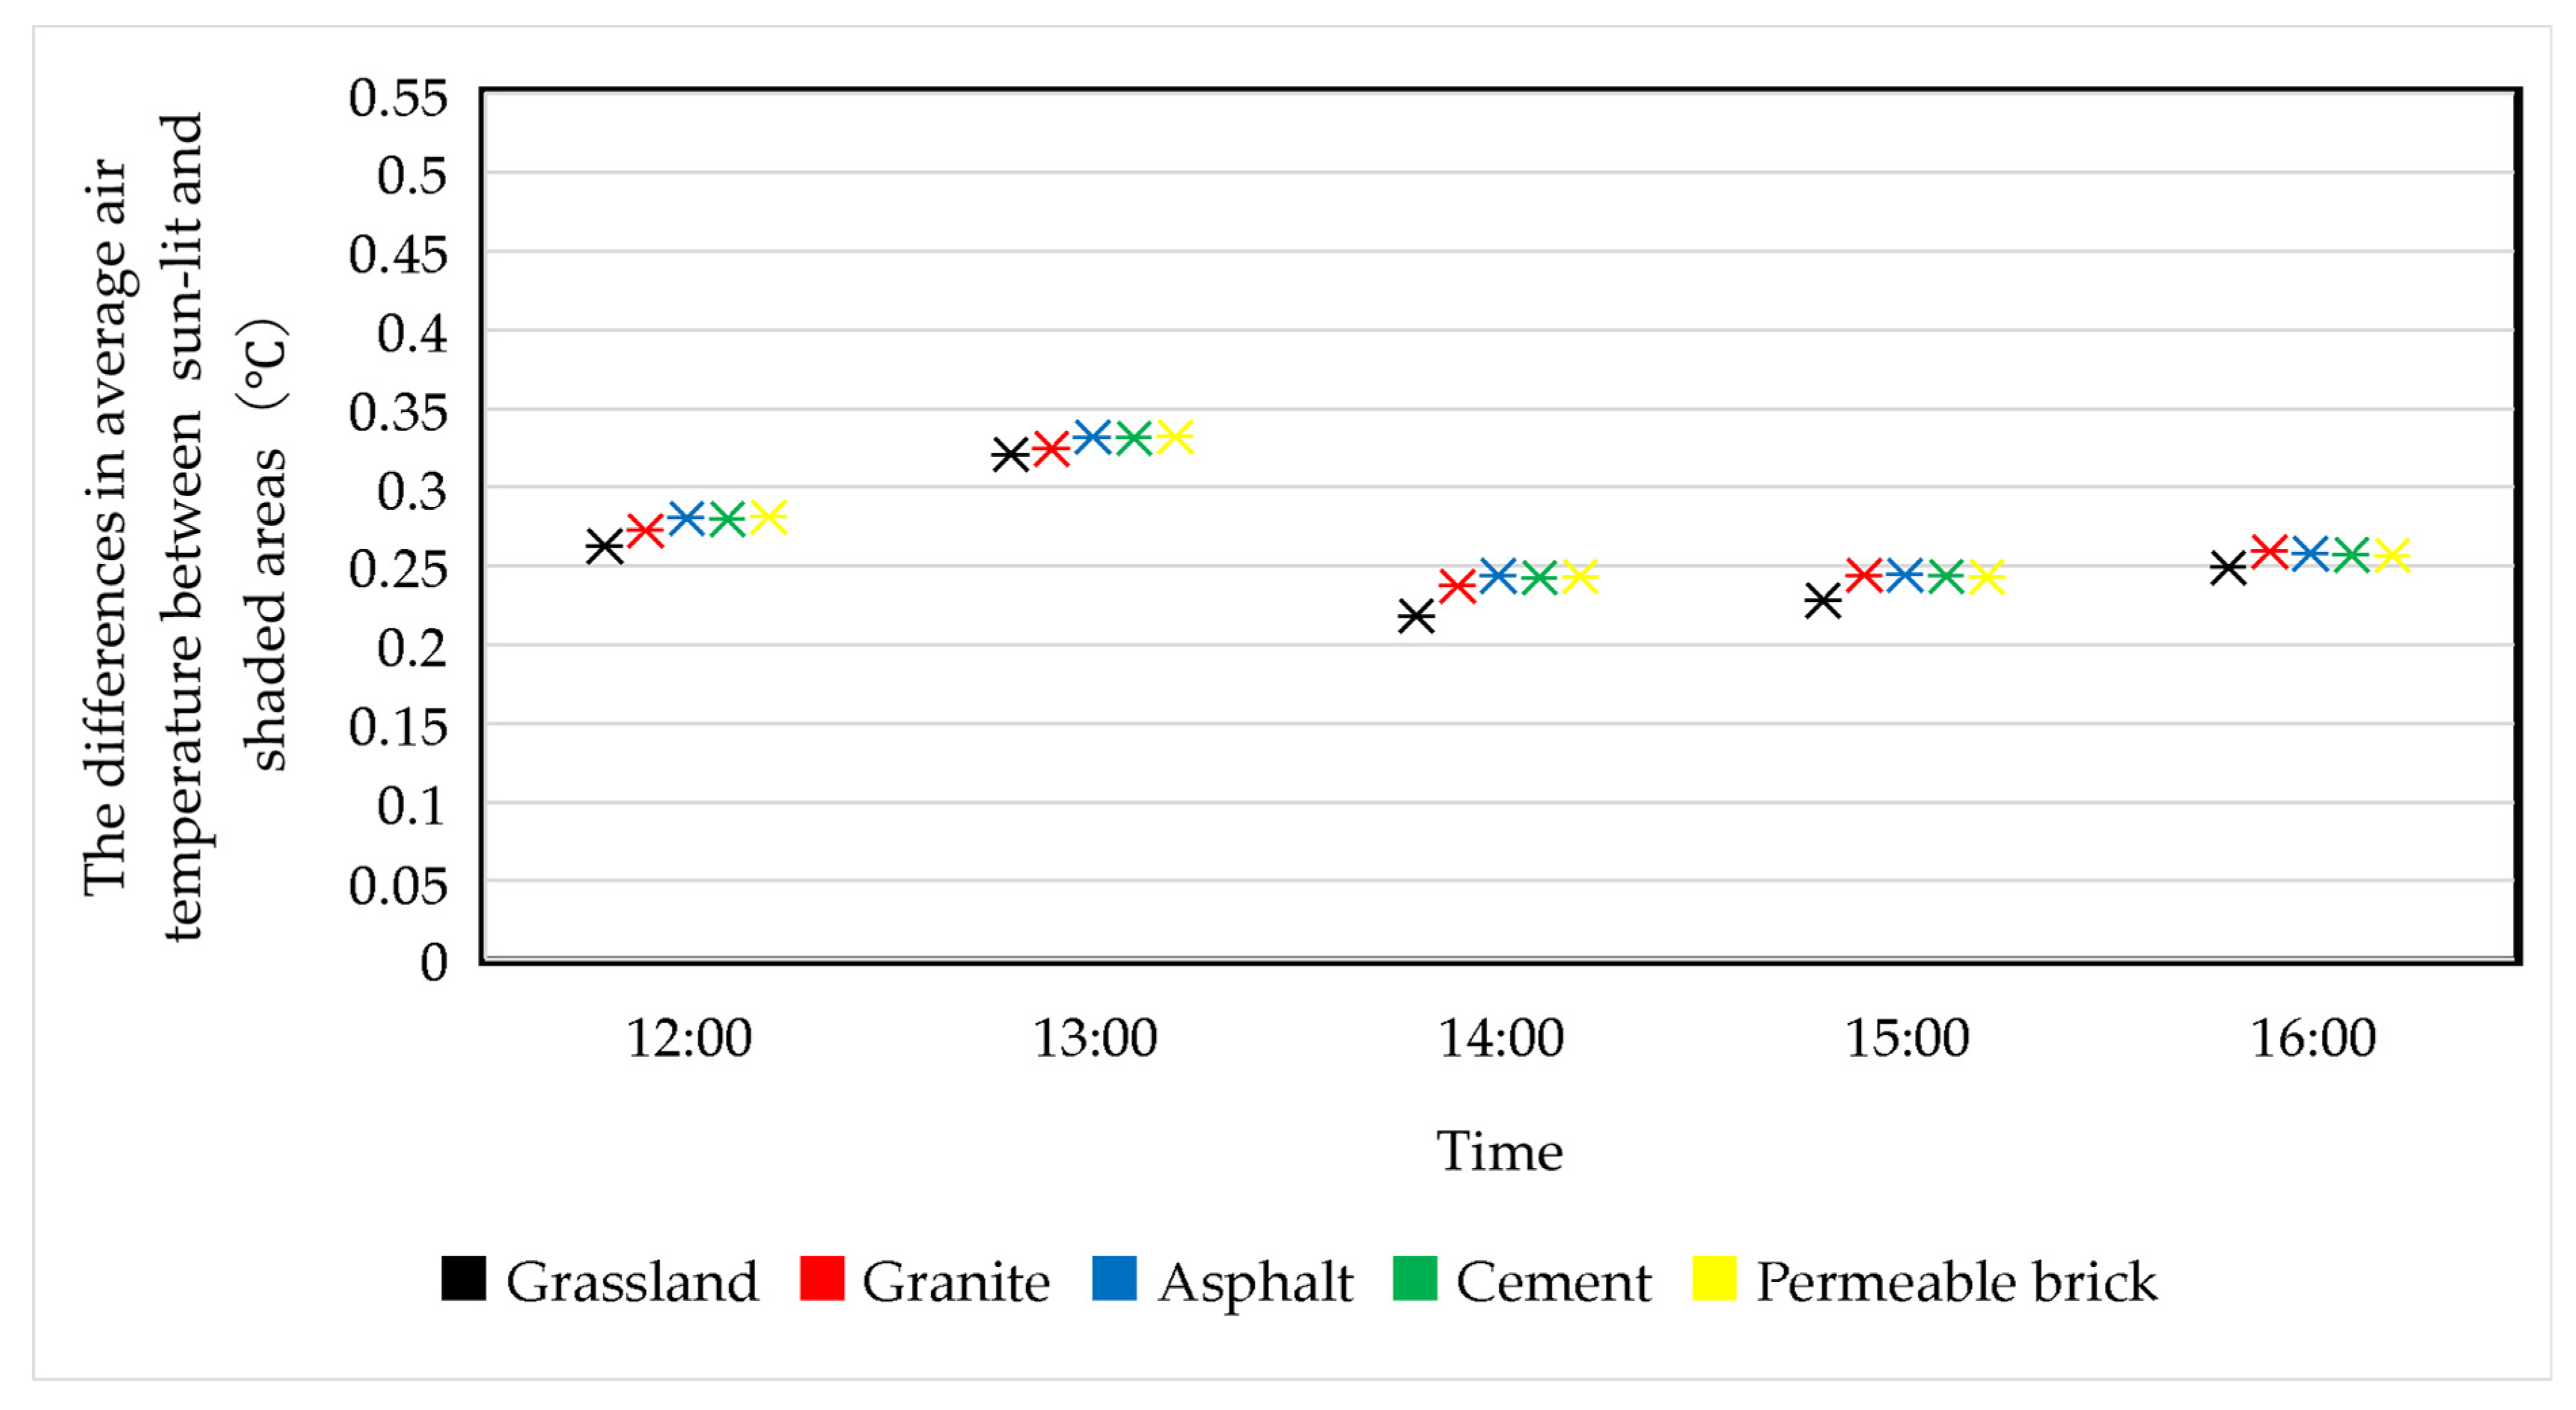
3.6. The Impacts of Surface Materials on Air Temperature in Sun-Lit and Shadow Areas

Figure 20, Figure 21 and Figure 22 show the average air temperature of the sun-lit area, the shadow area, and the whole study area under the different conditions of various underlying materials in the Jianfayangxi, Zhongtianfengjing, and Kedajingyuan prototypes. The results show that, regardless of the building layout, the overall average temperatures within the blocks show the same trend of change at 10:00, with asphalt > permeable bricks > cement > grassland > granite. From 11:00 to 16:00, the trend is as follows: permeable bricks > asphalt > cement > granite > grassland. The average temperature-change trend in the sun-lit area and the average temperature-change trend in the shadow area are the same as the overall temperature change in the whole study area. This indicates that, among the common underlying materials in residential areas, soft underlying surfaces (such as grass) can have a lower temperature than the hard underlying surfaces. Meanwhile, among the hard underlying materials, granite has the lowest temperature.
From 10:00 to 11:00, the average air temperature of the block, the average air temperature of the sun-lit area, and the average temperature of the shadow area did not differ significantly. The impact of shadows on the outdoor air temperature is not significant. From 12:00 to 16:00, the differences between the average air-temperature values of the whole study area and the sun-lit areas are small. Meanwhile, the average temperatures in the sun-lit areas are significantly higher than the average temperatures in the shaded areas.
From 12:00 to 16:00, the average air-temperature difference between the sun-lit areas and the shadow areas of the Jianfayangxi prototype was within the range of 0.1–0.35 °C (Figure 23). From 12:00 to 14:00, the average air-temperature difference between the sun-lit area and the shadow area of the grassland model was the smallest, followed by that of the granite model. The differences in the values between the sun-lit area and the shadow areas with asphalt, cement, and permeable brick materials were similar. Additionally, the differences were greater than those of grassland and granite. The differences between the sun-lit areas and the shaded areas of the five underlying materials were similar from 14:00 to 16:00. This indicates that the shadow had the smallest impact on soft underlying surfaces (grassland) from 12:00 to 14:00. Additionally, it indicates that it had similar effects on asphalt, cement, and permeable surfaces. Shadow had the greatest influence on granite. The influence of shadows on these five different underlying materials was similar between 14:00 and 16:00.
The average air temperature differences between the sun-lit and shaded areas in Zhongtianfengjing were within the range of 0.25–0.55 °C from 12:00 to 16:00 (Figure 24). From 12:00 to 16:00, the differences in air temperature between the sun-lit and shaded areas of grassland were the smallest among the five underlying materials. From 12:00 to 14:00, the differences in the values between the sun-lit and shadow areas of granite were greater than those of grassland and smaller than those of the other three underlying materials. The differences in the values between the sun-lit and shadow areas of asphalt, cement, and permeable bricks were similar. From 15:00 to 16:00, with the exception of grassland, the other four types of underlying materials had similar numerical differences in air temperature between the sun-lit and shaded areas. This indicates that the shadows had the smallest impact on air-temperature reduction for grasslands, followed by granite. The influence of shadows on air temperature is more evident when the underlying materials are asphalt, cement, and permeable bricks.
From 12:00 to 16:00, the average temperature difference between the sun-lit and shadow areas in the Kedajingyuan prototypes range from 0.2 to 0.4 °C (Figure 25). The pattern of the average temperature difference between the sun-lit and shadow areas is similar to that of the Zhongtianfengjing prototypes.

4. Residential Area Planning and Regeneration Suggestions

4.1. Spatial Layouts

The shaded area formed by buildings varies depending on their orientation angles. Through an analysis of the relationships between the shadow areas and the average air temperatures inside the residential blocks, this article concludes that, within the same time period, when a shadow area is inversely proportional to the average temperature inside a block, a building’s shadows are effective in reducing the outdoor air temperature. Therefore, it is feasible to use different building orientations to change the size of the shadow area and improve the internal thermal environment of a residential block. The optimal building orientation angles for reducing the air temperature during the summer may be different in different cities; this is a result of the different latitudes of different cities and their different climate characteristics. However, our study in Changsha (111°53′–114°15′ E and 27°51′–28°41′ N, hot and humid in summer) can provide valuable guidance for many different cities, especially those cities that have similar climate characteristics to Changsha and that are located at similar latitudes. In China, different cities have different regulations on building orientation angle ranges [33]. The building orientation angles that architects and urban planners can choose may be limited by regulations. Thus, it is important for architects and urban planners to explore optimal building orientation angles based on real situations. This study undoubtedly provides valuable guidance for choosing building orientation angles, especially for those Chinese cities that are located in areas with hot summers and cold winters and similar latitudes. After a statistical analysis of the changes in the shadow areas of high-rise buildings, small high-rise point-pattern buildings, and multistory row-pattern buildings with orientation angles of 0°, 15°, 30°, 45°, 60°, 300°, 315°, 330°, and 345°, it was found that the shadow areas of buildings with orientation angles of 345°–15° were the smallest at certain times. Additionally, the shadow areas of buildings with orientation angles of 300°–345° and 15°–60° gradually increased. At an orientation of 300°–315°, the growth rate slows down from 45° to 60°. Therefore, this article suggests that, in order to improve the internal thermal environment of residential blocks, the orientation angles of the buildings can be appropriately chosen. When arranging the spatial layout of residential areas, an orientation angle of 0° should be avoided. It is preferable to set an orientation angle of either 15°–45° or 315°–345°.

4.2. Architectural Forms

Building heights and building base areas are two important factors for assessing the area of shadows cast by buildings; it is also important to note that these factors have a significant impact on the outdoor thermal environment of residential blocks. Assuming a constant building spacing and base area, the higher the building, the larger the shadow area of the building will be. This is beneficial for reducing air temperature. In real life, the planning conditions that influence the residential area design process limit the permissible floor-area ratio, building density, and building height, which are interrelated. Therefore, simply increasing the building height without changing the building area or simply increasing the building area without increasing the building height is not feasible for urban planners and designers in many design cases. In order to create a good outdoor thermal environment in residential areas, urban planners and designers need to determine a reasonable building area and building height during the planning stage. Therefore, we propose the following suggestions:
  • For multistory row-pattern residential buildings, the building height can be appropriately increased without affecting the required sunshine spacing;
  • In the layout of high-rise point-pattern blocks, the base areas of the buildings can have a considerable impact on the size of the buildings’ shadows. In many cases of this block type, buildings can be very tall but not very long. Thus, priority can be given to increasing the building length for the purpose of maximizing shadow areas. In high-rise row-pattern blocks, the building lengths can be very long in many cases. The height of the buildings may have a greater impact on the size of the building shadow. Therefore, the optimum combination of building height and building area should be reasonably selected based on the real situation;
  • When the height and base area of the building cannot be changed, shading devices can be added to the building and on the ground to increase the shaded areas, e.g., human-made smart urban trees [33]. Under the irradiation of sunlight, the shadow area can also be increased.

4.3. Underlying Surface Materials

By comparing the average temperature within the block under different underlying surface materials, the results of this study showed that increases in air temperatures due to heat absorption and the reflection of sunlight are impacted by the underlying surface materials in the following order (from high to low): permeable bricks > asphalt > cement > granite > grassland. Note that grassland had the weakest air-temperature increase effect. Therefore, in order to improve the outdoor thermal environments of residential areas, soft underlying surfaces (grasslands) should be prioritized when selecting materials for the underlying surface. Granite is the preferred material for the hard underlying surface of outdoor activity spaces in residential areas. Asphalt, cement, and permeable bricks should not be prioritized when architects and urban planners are deciding on materials for improving the thermal comfort of neighborhoods in the summer months.
Since the average air temperature of a neighborhood is the lowest when the underlying surface is grassland, this study statistically analyzed the average temperature difference between the different underlying surface materials in sun-lit and shaded areas. It was found that the average temperature difference between the soft underlying surface (grassland) in the sun-lit and shaded areas is the smallest, followed by granite as a hard underlying surface. The differences between the other three types of hard underlying surface materials, i.e., permeable brick, asphalt, and cement, were bigger. This indicates that building shadows have the smallest impact on grasslands and the greatest impact on permeable bricks, asphalt, and cement. Therefore, when deciding on the environmental elements of residential areas, soft underlying surfaces, such as grasslands, can be arranged in sun-lit areas as needed, while hard underlying surfaces, especially road materials such as cement, asphalt, and permeable bricks, should be arranged in shaded areas. In the case considered in this study, the shaded areas are to the north of the buildings (Changsha is a city located in the northern hemisphere. Thus, during many times of the day, the building shadows are located to the north of the buildings). Due to excessive heat absorption by permeable bricks, it is recommended that grass block pavers should be used in conjunction with vegetation to reduce heat absorption.

5. Conclusions

In contrast to many previous studies conducted on the influence of changes in building orientation, floor-area ratios, and the underlying surface materials on indoor thermal comfort, this study focused on the impacts of building shadows on outdoor air temperature in residential areas. We believe that this is quite important for the improvement of neighborhood livability. On the basis of existing regulations for building orientation angles, devised so that indoor sunlight requirements are met [40], this study further explored the impact of building orientation angles on outdoor thermal comfort. This study mainly focused on air temperatures between 10:00 and 16:00. This time window corresponds to the period that is normally very hot during summer days in Changsha. This study used Changsha as a case study and found that building orientation angles of 15–45° and 315–345° can generate more shaded areas, having a better effect on reducing outdoor air temperatures during this period. Increases in building height and building base area are beneficial for increasing building-shaded areas. Based on the block building patterns in Changsha, we pointed out that, for point-pattern high-rise building blocks, the buildings are very tall, and increases in building lengths can be very effective for increasing the building-shaded area. For row-pattern high-rise building blocks, the building lengths are generally very long. Here, it may be easier to increase building heights to form more shaded areas to improve thermal comfort. We also found that natural surfaces are generally colder than impervious surfaces. Such surfaces are beneficial for improving thermal comfort in summer when designing green spaces in residential blocks. However, the shaded areas that form on impervious surfaces can lead to a more noticeable reduction in air temperature than in sun-lit areas, as compared with natural surface areas. Thus, neighborhood designers should consider placing more green spaces in sun-lit areas and more impervious surfaces in shaded areas.
This study provides guidance on improving thermal comfort based on building shadows; the guidance here is especially applicable for cities that are located north of the Tropic of Cancer, but there are several limitations. First of all, this study focused on a Chinese city, Changsha (111°53′–114°15′ E and 27°51′–28°41′ N), which is located north of Tropic of Cancer. The positions of building shadows relative to the buildings change constantly throughout the day, following a general pattern of moving from the southwest, west, or northwest sides of the buildings to the north side of the buildings and then to the northeast, east, or southeast sides of the buildings [57]. The building shadows are never located to the south of the buildings in this area. The law of change affecting building shadows in cities located south of Tropic of Cancer is different from that affecting building shadows in cities located north of the Tropic of Cancer. Thus, our findings on building orientation angles and air-temperature reductions cannot be directly used in cities located south of Tropic of Cancer. In addition, this study only considered buildings with building orientation angles of 0°–60° and 300°–360°. Traditional beliefs in China dictate that it is better for buildings to face south; this is reflected in some city-level building regulations [40,41]. Thus, we found that most multistory and high-rise residential buildings have orientation angles within this range. A very small number of residential buildings may have orientation angles that are different from this; we did not consider this factor due to the rarity of such residential buildings in Changsha. In China, many cities located north of the Tropic of Cancer may have slightly different regulations for building orientation angle ranges. We found that, within the 0°–60° and 300°–360° building orientation angle ranges, 15°–45° and 315°–345° are the optimum ranges. This finding provides valuable guidance for affected cities. For the study of building height, length, and floor-area ratio, we must consider that point-pattern and row-pattern blocks are common in China. Thus, our findings may also be able to provide guidance for many cities with similar residential block layouts and regulations in China. We believe that our findings on underlying surface materials can be used by neighborhood designers to inform them in their decision-making with regard to placing more green spaces in sun-lit areas and more impervious surfaces in shaded areas. We believe that this can be regarded as a widely useful strategy for making full use of the effect of building shadows in an effort to reduce air temperature.
The creation and optimization of building shadows is one among several effective approaches to improving thermal comfort in urban areas. The continued effort towards optimizing building shadows to improve the thermal comfort of residents requires that researchers and practitioners continue to conduct real-world research. One such proposed research direction might be the investigation of how building orientation angles can influence thermal comfort in cities to the south of the Tropic of Cancer. In addition, residential blocks in different cities, especially in foreign cities, have different characteristics, such as building style, height, length, and shape. Researchers can explore how we can optimize building layouts to maximize the improvement in thermal comfort brought about by building shadows on the basis of the characteristics of different residential areas in different cities. In addition, some human-made objects like smart and urban trees [30], as mentioned before, may have the potential to become very effective tools for microclimate improvement. These can release water vapor and form shaded areas, improving urban thermal comfort. This can also be researched further.

Author Contributions

J.L.: investigation, methodology, software, data analysis, visualization, writing—original draft, review, and editing. H.T.: investigation, methodology, software, data analysis, visualization, writing—original draft, review, and editing. B.Z.: supervision, writing—review and editing. All authors have read and agreed to the published version of the manuscript.

Funding

This research received no external funding.

Data Availability Statement

The data presented in this study are available on request from the corresponding author.

Conflicts of Interest

Author Haifang Tang was employed by the company China Machinery International Engineering Design & Research Institute Co., Ltd. The remaining authors declare that the research was conducted in the absence of any commercial or financial relationships that could be construed as a potential conflict of interest.

References

  1. U.S. Environmental Protection Agency. Sources of Greenhouse Gas Emissions. 2024. Available online: https://www.epa.gov/ghgemissions/sources-greenhouse-gas-emissions (accessed on 9 July 2024).
  2. IPCC. AR6 Synthesis Report: Climate Change 2023. 2023. Available online: https://www.ipcc.ch/report/sixth-assessment-report-cycle/ (accessed on 22 August 2023).
  3. Wu, X.; Wang, L.; Yao, R.; Luo, M.; Wang, S.; Wang, L. Quantitatively evaluating the effect of urbanisation on heat waves in China. Sci. Total Environ. 2020, 731, 138857. [Google Scholar] [CrossRef] [PubMed]
  4. Liao, W.; Li, D.; Liu, X. Examination and projection of urbanisation effect on summertime hot extremes in China. In Proceedings of the EGU General Assembly Conference Abstracts, Online, 4–8 May 2020. [Google Scholar] [CrossRef]
  5. Patz, J.A.; Campbell-Lendrum, D.; Holloway, T.; Foley, J.A. Impact of regional climate change on human health. Nature 2005, 438, 310–317. [Google Scholar] [CrossRef] [PubMed]
  6. World Bank Group. Ubran Development. 2023. Available online: https://www.worldbank.org/en/topic/urbandevelopment/overview (accessed on 8 July 2024).
  7. Zhao, M.Y.; Cai, H.Y.; Qiao, Z.; Xu, X.L. Influence of urban expansion on the urban heat island effect in Shanghai. Int. J. Geogr. Inf. Sci. 2016, 30, 2421–2441. [Google Scholar] [CrossRef]
  8. Angel, S.; Parent, J.; Civco, D.L.; Blei, A.; Potere, D. The dimensions of global urban expansion: Estimates and projections for all countries, 2000–2050. Prog. Plan. 2011, 75, 53–107. [Google Scholar] [CrossRef]
  9. Li, Y.; Li, Y.Q.; Zhao, J.S. A comparative study of atmospheric and surface urban heat island effects in China’s major cities. Clim. Chang. Res. 2023, 19, 605–615. [Google Scholar]
  10. Yuan, S.; Zhang, J.; Xu, Z.; Tang, G.; Wang, C.; Chen, J. Response of Urban Heat Island Effect to Morphology Characteristics of Buildings and Its Diurnal Variation. Geogr. Geo-Inf. Sci. 2022, 38, 40–46. [Google Scholar]
  11. Schwarz, N.; Schlink, U.; Franck, U.; Groszmann, K. Relationship of land surface and air temperatures and its implications for quantifying urban heat island indicators: An application for the city of Leipzig (Germany). Ecol. Indic. 2012, 18, 693–704. [Google Scholar] [CrossRef]
  12. Yang, S.; Wang, L.; Stathopoulos, T.; Marey, A.M. Urban microclimate and its impact on built environment—A review. J. Affect. Disord. 2023, 238, 110334. [Google Scholar] [CrossRef]
  13. Li, Y. A Comparative Study of Atmospheric and Surface Urban Heat Island Effects in China’s Major Cities. Master’s Thesis, Nanjing University of Information Science & Technology, Nanjing, China, 2022. [Google Scholar]
  14. Xiang, Y.; Zheng, B.; Bedra, K.; Ouyang, Q.; Liu, J.; Zheng, J. Spatial and seasonal differences between near surface air temperature and land surface temperature for Urban Heat Island effect assessment. Urban Clim. 2023, 52, 101745. [Google Scholar] [CrossRef]
  15. Chen, J.; Zhan, W.; Jin, S.; Han, W.; Du, P.; Xia, J.; Lai, J.; Li, J.; Liu, Z.; Li, L.; et al. Separate and combined impacts of building and tree on urban thermal environment from two- and three-dimensional perspectives. J. Affect. Disord. 2021, 194, 107650. [Google Scholar] [CrossRef]
  16. Gago, E.J.; Roldan, J.; Pacheco-Torres, R. The city and urban heat islands: A review of strategies to mitigate adverse effects. Renew. Sustain. Energy Rev. 2013, 25, 749–758. [Google Scholar] [CrossRef]
  17. Ren, J.Y.; Yang, J.; Zhang, Y.Q.; Xiao, X.M.; Li, X.M.; Wang, S.H.; Xia, J.C. Exploring thermal comfort of urban buildings based on local climate zones. J. Clean. Prod. 2022, 340, 130744. [Google Scholar] [CrossRef]
  18. Li, Y.; Chen, Q.; Cheng, Q.; Li, K.; Cao, B.; Huang, Y. Evaluating the Influence of Different Layouts of Residential Buildings on the Urban Thermal Environment. Sustainability 2022, 14, 10227. [Google Scholar] [CrossRef]
  19. Kleerekoper, L.; van den Dobbelsteen, A.; Taleghani, M.; Tenpierik, M. Outdoor thermal comfort within five different urban forms in the Netherlands. Build. Environ. 2015, 83, 65–78. [Google Scholar]
  20. Meng, Q.; Liu, W.; Zhang, L.; Allam, M.; Bi, Y.; Hu, X.; Gao, J.; Hu, D.; Jancsó, T. Relationships between Land Surface Temperatures and Neighboring Environment in Highly Urbanised Areas: Seasonal and Scale Effects Analyses of Beijing, China. Remot. Sens. 2022, 14, 4340. [Google Scholar] [CrossRef]
  21. Lin, P.; Lau, S.; Qin, H.; Gou, Z. Effects of urban planning indicators on urban heat: A case study of pocket parks in high-rise high density environment. Landsc. Urban Plan. 2017, 168, 48–60. [Google Scholar] [CrossRef]
  22. Han, Y.; Jo, Y.; Kim, E.J. Influence of landscape interventions on thermal comfort under time-varying building shadow; new Gwanghwamun square case, Seoul, South Korea. Heliyon 2023, 9, e19436. [Google Scholar] [CrossRef] [PubMed]
  23. Sun, T.; Chen, L.; Sun, R. Cooling effects in urban communities: Parsing green spaces and building shadows. Urban For. Urban Green. 2024, 94, 128264. [Google Scholar] [CrossRef]
  24. Ramadhan, T.; Jurizat, A.; Syafrina ARahmat, A. Investigating outdoor thermal comfort of educational building complex in urban area: A case study in Universitas Kebangsaan, Bandung city. Geogr. Pannonica 2021, 25, 85–101. [Google Scholar] [CrossRef]
  25. Galal, O.M.; Sailor, D.J.; Mahmoud, H. The impact of urban form on outdoor thermal comfort in hot arid environments during daylight hours, case study: New Aswan. Build. Environ. 2020, 184, 107222. [Google Scholar] [CrossRef]
  26. Rilatupa, J. Factor of building orientation direction as determinant the thermal comfort quality. IOP Conf. Ser. Mater. Sci. Eng. 2019, 620, 012009. [Google Scholar] [CrossRef]
  27. Acero, J.A.; Koh, E.J.Y.; Tan, Y.S.; Norford, L.K. Quantifying the Effect of Building Shadowing and Cloudiness on Mean Radiant Temperature in Singapore. Atmosphere 2021, 12, 1012. [Google Scholar] [CrossRef]
  28. Liu, J.; Tang, H.; Zheng, B. Simulation study of summer microclimate in street space of historic conservation areas in China: A case study in Changsha. Front. Environ. Sci. 2023, 11, 1146801. [Google Scholar] [CrossRef]
  29. Morakinyo, T.E.; Kong, L.; Lau KK, L.; Yuan, C.; Ng, E. A study on the impact of shadow-cast and tree species on in-canyon and neighborhood's thermal comfort. J. Affect. Disord. 2017, 115, 1–17. [Google Scholar] [CrossRef]
  30. Pont, U.; Wölzl, M.; Schober, P.; Swoboda, S.; Bauer, P. ‘Summer overheating mitigation in urban areas of rich cultural heritage: The Smart and Urban Tree Approach; Artificial structures as performance-optimizing supplement for historic cities’, in CHNT Editorial board. In Proceedings of the 27th International Conference on Cultural Heritage and New Technologies, Heidelberg, Germany, 8 November 2022. [Google Scholar]
  31. Al-Homoud, M.; Tassinary, L.G. Social interactions at the neighborhood-level as a function of external space enclosure. J. Archit. Plan. Res. 2004, 21, 10–23. [Google Scholar]
  32. Beck, H.E.; Zimmermann, N.E.; McVicar, T.R.; Vergopolan, N.; Berg, A.; Wood, E.F. Present and future Köppen-Geiger climate classification maps at 1-km resolution. Sci. Data 2018, 5, 180214. [Google Scholar] [CrossRef]
  33. GB50352-2019; The Ministry of Construction of the People’s Republic of China. Uniform Standard for Design of Civil Buildings. Architecture & Building Co., Ltd.: Beijing, China, 2019.
  34. Guihuayun. Planning Cloud Map Tools. 2023. Available online: http://guihuayun.com/ (accessed on 7 July 2024).
  35. Zhou, H.; Zhou, L.; Zhu, G.; Li, W.; Yin, Z. Application Analysis of Wind Profile Radar Data in Rare Severe Haze Pollution Weather Processes. In Proceedings of the 2021 Annual Conference of the Chinese Society of Environmental Sciences, Tianjin, China, 20 October 2021. [Google Scholar]
  36. People’s Government of Changsha. Changsha Overview. 2024. Available online: http://www.changsha.gov.cn/xfzs/zjmlzs/zsgl/200907/t20090727_5686409.html (accessed on 4 July 2024).
  37. Milne, M.; Liggett, R.; Al-Shaali, R. Climate Consultant 3.0: A Tool for Visualizing Building Energy Implications of Climates. 2007. Available online: https://energy-design-tools.sbse.org/papers/ASES07-CC.pdf (accessed on 7 July 2024).
  38. Givoni, B. Comfort, climate analysis and building design guidelines. Energy Build. 1992, 18, 11–23. [Google Scholar] [CrossRef]
  39. Milne, B.; Givoni, B. Architectural Design Based on C1imate, Energy Conservation through Building Design; Architectural Record Books/McGraw-Hill Book Co.: New York, NY, USA, 1979. [Google Scholar]
  40. People’s Government of Changsha. Notice of Changsha Municipal people’s Government on Issuing the Regulations on the Management of Residential Building Spacing and Sunlight in Changsha City; People’s Government of Changsha: Changsha, China, 2010.
  41. People’s Government of Changsha. Regulations on Planning and Technical Management of Changsha City. 2018. Available online: http://www.changsha.gov.cn/zfxxgk/zfwjk/srmzf/201809/P020190903361860518271.pdf (accessed on 18 July 2024).
  42. People’s Government of Changsha. Notice of the People’s Government of Changsha City on Issuing Supplementary Provisions to Regulations on Planning and Technical Management of Changsha City. 2021. Available online: http://cgj.changsha.gov.cn/zfxxgk/fdzdgknr/ghxx/202112/P020211221584840672170.pdf (accessed on 16 October 2023).
  43. Barr, J.; Cohen, J.P. The floor area ratio gradient: New York City, 1890–2009. Reg. Sci. Urban Econ. 2014, 48, 110–119. [Google Scholar] [CrossRef]
  44. Peiser, R. Real Estate Development. In International Encyclopedia of the Social & Behavioral Sciences, 2nd ed.; Wright, J.D., Ed.; Elsevier: Oxford, UK, 2015; pp. 12–19. [Google Scholar]
  45. ENVI-Met. Lateral Boundary Conditions. 2023. Available online: https://envi-met.info/doku.php?id=kb:lbc (accessed on 14 October 2023).
  46. Huttner, S. Further Development and Application of the 3D Microclimate Simulation ENVI-Met. Ph.D. Thesis, Johannes Gutenberg University Mainz, Mainz, Germany, 2012. [Google Scholar]
  47. Tsoka, S.; Tsikaloudaki, A.; Theodosiou, T. Analyzing the ENVI-met microclimate model’s performance and assessing cool materials and urban vegetation applications—A review. Sustain. Cities Soc. 2018, 43, 55–76. [Google Scholar] [CrossRef]
  48. Zhu, S.J.; Causone, F.; Gao, N.P.; Ye, Y.; Jin, X.; Zhou, X.; Shi, X. Numerical simulation to assess the impact of urban green infrastructure on building energy use: A review. J. Affect. Disord. 2023, 228, 20. [Google Scholar] [CrossRef]
  49. Lam, C.K.C.; Lee, H.; Yang, S.-R.; Park, S. A review on the significance and perspective of the numerical simulations of outdoor thermal environment. Sustain. Cities Soc. 2021, 71, 102971. [Google Scholar] [CrossRef]
  50. Bruse, M. ENVI-Met 3.0 Updated Model Overview. 2004. Available online: https://www.envi-met.com/company/ (accessed on 14 October 2023).
  51. China Meteorological Data Service Center. Monitoring Data. 2022. Available online: https://data.cma.cn/ (accessed on 14 July 2022).
  52. Hunan Meterological Berau. Monitoring Data. 2024. Available online: http://hn.cma.gov.cn/dsqx/zss/ (accessed on 18 July 2024).
  53. Li, M. The Study on Effect of Architecture Space Form on Wind Environment in Nanjing Residential Districts. Master’s Thesis, Southeast University, Nanjing, China, 2016. [Google Scholar]
  54. Luo, M. Research on the Optimization Strategy of Green Space in High-Rise Residential Areas in Hot Summer and Cold Winter Areas Based on the Evaluation of Outdorr Thermal Comfort in Summer—A Case Study of Changsha City. Master’s Thesis, Qingdao University of Technology, Qiangdao, China, 2022. [Google Scholar] [CrossRef]
  55. Pang, C.; Jiang, W. A study of Physiological Equivalent Effect Temperature. J. Astronaut. 1984, 2, 10345. [Google Scholar]
  56. Zheng, Y.; Yu, Y.; Tan, J.; Wu, R.; Xu, X. Influence of Meteorological Parameters on Human Comfort Index. Meteorol. Sci. Technol. 2007, 35, 827–831. [Google Scholar] [CrossRef]
  57. CGZDL. Point of Direct Solar Radiation, Direction of Shadow, Length of Day and Night. 2022. Available online: http://m.cgzdl.com/jiaoxue/jiexi/13174.html (accessed on 14 October 2023).
Figure 1. The geographical location of the research area.
Buildings 14 02730 g001
Figure 2. Enthalpy and humidity map of Changsha.
Buildings 14 02730 g002
Figure 3. Solar radiation conditions in Changsha.
Buildings 14 02730 g003
Figure 4. Selection of research samples.
Buildings 14 02730 g004
Figure 5. Building-shadow diagram.
Buildings 14 02730 g005
Figure 6. Building-shadow diagrams of the building orientation study.
Buildings 14 02730 g006
Figure 7. Changes in the shadow areas of the Jianfayangxi prototype under different building orientation angles.
Buildings 14 02730 g007
Figure 8. Changes in the shadow areas of the Zhongtianfengjing prototype under different building orientation angles.
Buildings 14 02730 g008
Figure 9. Changes in the shadow areas of the Kedajingyuan prototype under different building orientation angles.
Buildings 14 02730 g009
Figure 10. Air temperature and shadow area relationship at 10:00 in the building orientation study.
Buildings 14 02730 g010
Figure 11. Air temperature and shadow area relationship at 12:00 in the building orientation study.
Buildings 14 02730 g011
Figure 12. Air temperature and shadow area relationship at 14:00 in the building orientation study.
Buildings 14 02730 g012
Figure 13. Building-shadow outline.
Buildings 14 02730 g013
Figure 14. Changes in the shaded area of the Jianfayangxi prototype under different building heights.
Buildings 14 02730 g014
Figure 15. Changes in the shaded area of the Zhongtianfengjing prototype under different building heights.
Buildings 14 02730 g015
Figure 16. Changes in the shaded areas of the Kedajingyuan prototype under different building heights.
Buildings 14 02730 g016
Figure 17. Air temperature and shadow area relationship at 10:00 in the building height and base area study.
Buildings 14 02730 g017
Figure 18. Air temperature and shadow area relationship at 12:00 in the building height and base area study.
Buildings 14 02730 g018
Figure 19. Air temperature and shadow area relationship at 14:00 in the building height and base area study.
Buildings 14 02730 g019
Figure 20. Comparison of average temperatures under the different conditions in the Jianfayangxi prototype.
Buildings 14 02730 g020
Figure 21. Comparison of average temperatures under the different conditions in the Zhongtianfengjing prototype.
Buildings 14 02730 g021
Figure 22. Comparison of average temperatures under the different conditions in the Kedajingyuan prototype.
Buildings 14 02730 g022
Figure 23. Average temperature differences between the sun-lit and shaded areas of the Jianfayangxi prototype.
Buildings 14 02730 g023
Figure 24. Average temperature differences between the sun-lit and shaded areas of the Zhongtianfengjing prototype.
Buildings 14 02730 g024
Figure 25. Average temperature differences between the sun-lit and shadow areas of the Kedajingyuan prototype.
Buildings 14 02730 g025
Table 1. Minimum spacing of residential buildings when buildings are arranged in parallel.
Building HeightMinimum Spacing
Low-rise buildings and multistory buildings≥1.1H; ≥9 m
High-rise buildings ≤ 50 m≥22 + 0.2H; ≥29.7 m
50 m < High-rise buildings ≤ 100 m≥27 + 0.1H
Table 2. Setting conditions of the study.
The first set of models: Jianfayangxi, FAR = 4.94The second model: Zhongtianfengjing, FAR = 3.83
Model aModel bModel cModel dModel eModel f
Building height90 m80 m70 m60 m50 m40 m
Building density16%18%21%25%23%29%
Building distance36 m35 m34 m33 m32 m30 m
The third group of models: Kedajingyuan, building density = 33%
Model gModel hModel i
Building height18 m15 m12 m
Floor-area ratio2.001.671.33
Building distance20 m20 m20 m
Table 3. Measured climate data.
Simulation DurationTemperature (°C)Relative Humidity (%)Average Wind Speed (m/s)Average Wind Direction (°)
From 10:00 to 16:0032.3 (10:00)62.7 (10:00)1.29213
32.7 (11:00)60.9 (11:00)
33.3 (12:00)58.2 (12:00)
34.6 (13:00)57.5 (13:00)
33.5 (14:00)58.6 (14:00)
33.7 (15:00)57.1 (15:00)
34.2 (16:00)55.1 (16:00)
Table 4. Technical specifications of the Kestrel 5500.
Meteorological ParameterAccuracyResolutionMeasuring Range
Air temperature±0.5 °C0.1 °C−29.0~+70.0 °C
Relative humidity±2%RH0.1%RH5.0~95.0% RH non-condensing
Wind speedBetter than reading ± 3%0.1 m/s0.4~40.0 m/s
Wind direction±5°——
Table 5. Validation study results.
TimeFrom 10:00 to 23:00 on 10 July 2022From 9:00 to 18:00 28 June 2023From 5:00 16 July 2024 to 17:00 16 July 2024
R20.82 (p < 0.05)0.79 (p < 0.05)0.59 (p < 0.05)
RMSE (°C)2.63.61.8
Disclaimer/Publisher’s Note: The statements, opinions and data contained in all publications are solely those of the individual author(s) and contributor(s) and not of MDPI and/or the editor(s). MDPI and/or the editor(s) disclaim responsibility for any injury to people or property resulting from any ideas, methods, instructions or products referred to in the content.

