Abstract
Corroded concrete structures remain at risk of fire damage throughout their lifespan. This study explores the fire resistance of reinforced concrete columns, considering the simultaneous impact of corrosion and high temperatures. Thermal–structural models of the corroded concrete columns are developed using SAFIR software (2022). The numerical results are compared with published test data on temperature distributions and axial displacement–time curves. Then, parametric analyses are conducted to investigate the influence of various factors, such as corrosion degree, concrete compressive strength, cover thickness, and fire exposure models, on the fire performance of the concrete columns. The findings reveal that corrosion significantly undermines fire resistance: notably, columns with severe corrosion exhibited a 47% reduction in fire resistance. Conversely, increased concrete strength can bolster the fire resistance of intact columns, particularly when the concrete cover is minimal. Enhancing the cover thickness proves to be an effective strategy to mitigate the thermal degradation of steel reinforcements, thereby extending the columns’ fire resistance by as much as 23%. The study introduces coefficients to quantify the effects of corrosion, fire exposure, material strength, and cover thickness, culminating in a practical formula to calculate the fire endurance of corroded reinforced concrete columns. This formula could complement existing fire safety regulations.
1. Introduction
In reinforced concrete structures, columns are critical in bearing the vertical loads transferred from beams and slabs. The loss of load-bearing capacity in columns can lead to catastrophic failures, potentially causing partial or complete structural collapse. In marine environments, reinforcement corrosion is a common issue for existing concrete structures during their service life [1]. Corrosion not only diminishes the cross-sectional area and mechanical properties of the steel bars [2] but also leads to cracking of the concrete cover due to the expansion of corrosion products [3,4], effectively reducing the effective cross-sectional area [5]. Structures with corroded reinforcement remain at risk of fire exposure throughout their service life. Elevated temperatures adversely affect the mechanical properties of both steel bars [6,7] and concrete [8], leading to a marked reduction in the load-bearing capacity of reinforced concrete members and structures.
From a materials perspective, Ba [9,10] investigated the residual mechanical properties of corroded steel bars after high-temperature exposure, concluding that the dual impacts of corrosion and high temperatures expedites the degradation of steel bars’ mechanical properties. Ba [11] examined the bond performance between high-temperature-exposed, corroded steel bars and concrete, revealing that temperatures above 400 °C significantly accelerated bond performance deterioration. Liu [12] observed similar trends and noted that the thickness of the concrete cover greatly influences the failure modes and bond–slip performance. Ou [13] analyzed the bond performance of slightly corroded steel bars (less than 2% corrosion) after high-temperature exposure, finding increases in bond strength, stiffness, and pullout energy below 200 °C, which then substantially decreased beyond 400 °C.
Regarding structural components, research on the fire resistance of corroded concrete columns is scarce. Mishra [14] explored the impact of corrosion degree on the fire resistance of short concrete columns, discovering that rebar corrosion significantly affects their ductility and residual load-bearing capacity at high temperatures. Corroded stirrups with reduced cross-sectional areas weaken the lateral confinement of concrete, and columns with a 20% corrosion degree are prone to brittle failure. Chandra [15] performed fire resistance tests on columns with and without corrosion, finding that rebar corrosion impacts the columns’ strength and stiffness and corrosion-induced concrete cracking accelerates the internal temperature rise, corroborating findings of Ba [16]. Additionally, rebar corrosion resulted in a 31.3% reduction in the fire resistance of concrete columns. Sobhan [17] explored the combined effects of corrosion and fire on high-strength concrete structures, finding that the flexural capacity loss due to fire exposure increases with the compressive strength of the concrete. The residual moment capacity, based on analytically determined capacities of uncorroded and non-fire exposed beams, was significantly lower than those of uncorroded beams exposed to fire. Tariq [18] studied the fire resistance of corroded concrete beams, demonstrating that the combined effects of corrosion and high temperatures significantly reduce the load-bearing capacity and stiffness of the beams. Ba [16] found that reinforcement corrosion could alter the failure modes of concrete beams, with a corrosion degree of 0.174 leading to a 58% decrease in fire resistance.
Numerous studies have been conducted on the numerical simulation of concrete columns’ fire resistance. Wu [19] revealed the relationships of fire resistance with various parameters and proposed a simplified calculation formula. Gernay [20] used SAFIR [21] to study the fire resistance of columns exposed to natural fires, developing a calculation model based on fire duration. Kodur [22,23] proposed models considering load eccentricity, fire-induced spalling of concrete, and number of fire-exposed surfaces for calculating the fire resistance of concrete columns under standard fires. Fellah [24] compared Kodur’s empirical formula and SAFIR’s calculations, analyzing the differences between the two methods, and recommended SAFIR as the most universal method, guaranteeing safe and credible estimates in most cases. It is based on an advanced calculation model that can be used for individual structural members, subassemblies, or entire structures.
The Chinese standard [25] determines the fire resistance of reinforced concrete columns based on cross-sectional dimensions. The American standard [26], also considering cross-sectional dimensions, includes the type of concrete aggregate as a factor. The European standard EC2 [27] uses empirical formulas that take into account the column’s cross-sectional dimensions, concrete strength, reinforcement ratio, cover thickness, and steel strength. However, none of these standards considers the effects of reinforcement corrosion under high temperatures. Therefore, further research is needed to develop methods for calculating the fire resistance of corroded reinforced concrete columns.
The existing literature extensively covers the behavior of reinforced concrete structures after corrosion and their recovery from corrosion damage. However, the behavior of concrete structures when exposed to both corrosion and high temperatures is not well documented. Recent field inspections conducted by the authors further underscore the need for comprehensive research to quantify the impact of corrosion on the fire resistance of concrete columns. This study aimed to consider the effects of corrosion degree, concrete strength, concrete cover thickness, and fire exposure method, conducting numerical simulations on the fire resistance of corroded reinforced concrete columns under fire, and proposing a simplified calculation formula for fire resistance, which may serve as a reference for fire protection specifications.
2. Finite Element Models
2.1. Model Description
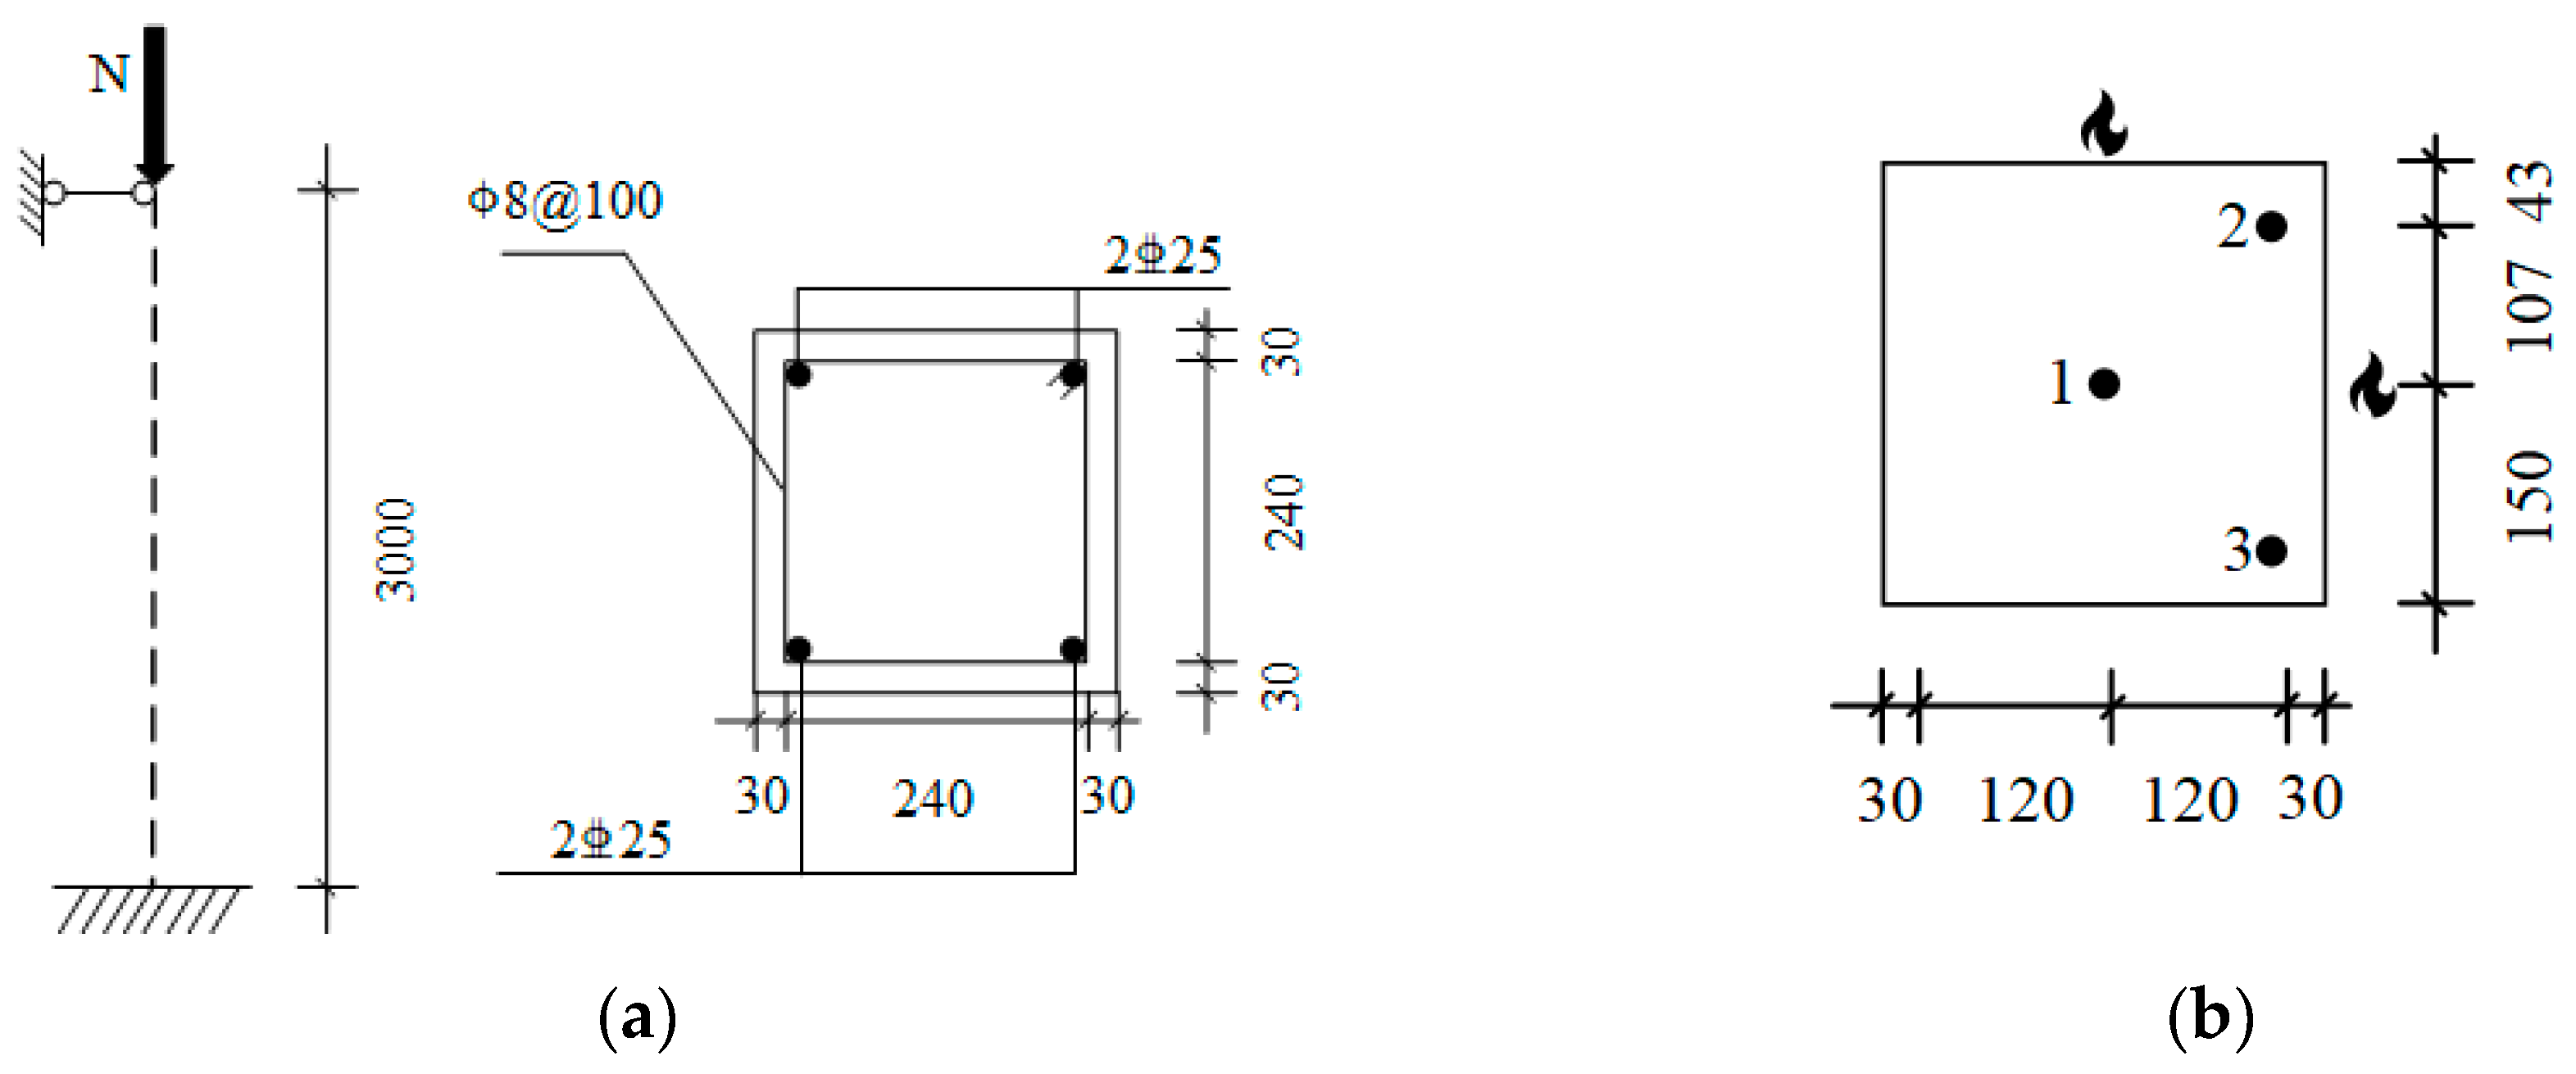
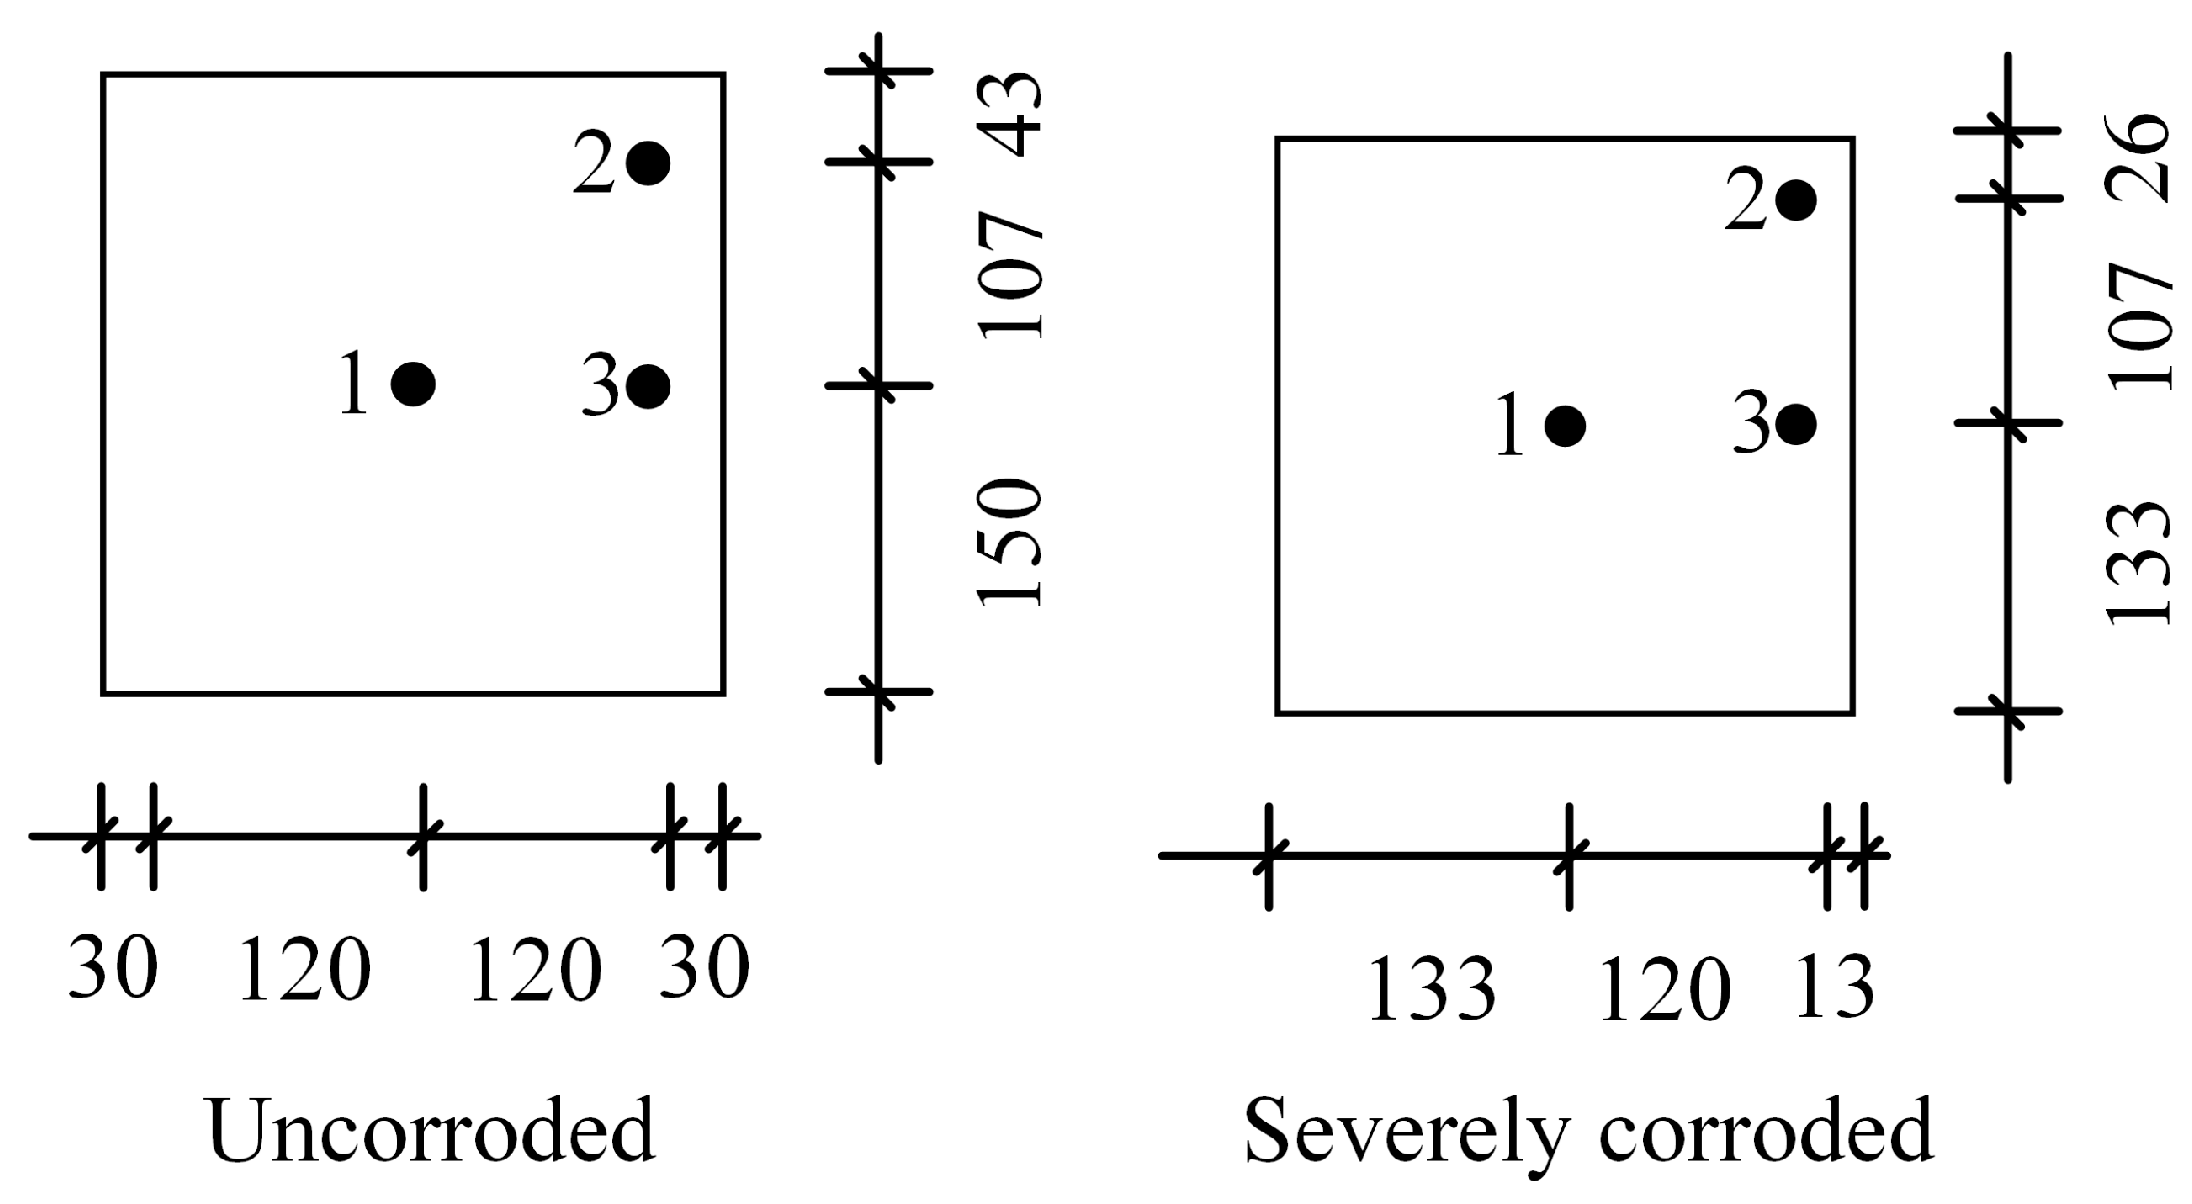
SAFIR [21] is widely used structural fire analysis software in the field of fire engineering. It can consider material and geometric nonlinearities, thermal elongation effects, and reductions in material strength and stiffness at high temperatures to simulate the behavior of structures under fires. This study validates a finite element model with three specimens from literature [28]. The samples include one column made of normal-strength concrete and two columns made of high-strength concrete, with cubic compressive strengths of 32.2 MPa and 70.7 MPa, respectively. The fire exposure methods include exposure on four sides, three sides, and two sides. The concrete column is designed with dimensions of 300 mm × 300 mm × 3000 mm, equipped with four longitudinal rebars with a diameter of 25 mm, a yield strength of 349.7 MPa, and an ultimate tensile strength of 536.5 MPa. The concrete cover thickness is 30 mm, and the ISO 834 standard heating curve is selected for the temperature rise curve. The bottom is designed with a fixed support. At the top, the directional supports are designed to limit the horizontal displacement, and rotational restraints exist at both ends. The specimen dimensions and the arrangement of temperature measurement points are shown in Figure 1, and Table 1 provides detailed information about the experimental columns, such as concrete strength, reinforcement ratio, axial compression ratio, applied load, and fire exposure method.
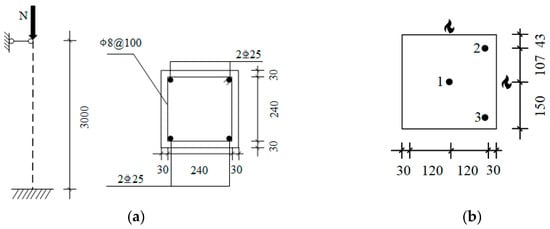
Figure 1.
Configurations of reinforced concrete columns: (a) specimen size and cross-sectional details; (b) locations of thermocouples.

Table 1.
Test parameters and results.
Given the complexity of analyzing the fire resistance of reinforced concrete columns under the combined effects of reinforcement corrosion and high temperatures, the following basic assumptions are proposed to simplify the model.
(1) It is assumed that both stirrups and longitudinal rebars undergo the same degree of corrosion, with the cross-sectional area uniformly decreasing according to the corrosion degree and diminishing equally along the length of the rebar.
(2) The influence of corrosion-induced cracking on the temperature field is disregarded. The two-dimensional temperature field across the transverse section of the concrete column remains constant along its height and is independent of the member’s stress state.
(3) The degradation of the bond performance between corroded rebars and concrete is not considered.
2.2. Thermal Model
Conduction is considered the primary heat transfer method within concrete columns, while convection and radiation are the main mechanisms of heat transfer from the external environment to the surface of the concrete columns. During thermal analysis, all selected specimens undergo a ISO 834 standard fire. The convective coefficients for the fire-exposed and unexposed surfaces of siliceous concrete are 25 W/(m2·°C) and 9 W/(m2·°C), respectively, with an emissivity of 0.8. The density of normal-strength concrete is 2300 kg/m3, and that of high-strength concrete is 2400 kg/m3. The thermal properties of concrete and steel are derived from the EC2 [27]. The specific heat capacity Cc and thermal conductivity λc of siliceous aggregate concrete are shown in Equation (1). The water content in concrete is calculated as 6% by weight. The discretization for plane sections of different shapes is possible by using triangular and/or quadrilateral elements, and the grid division of the concrete column cross-sectional temperature field model is shown in Figure 2.
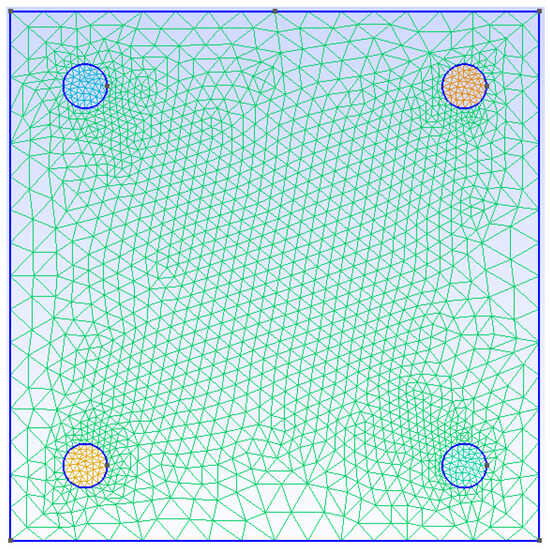
Figure 2.
Discretization of the cross section (number of nodes: 1753; number of triangular elements: 3440).
2.3. Structural Model
Structural analysis can be performed using either 2D or 3D beam elements. The integrations of longitudinal stress and stiffness across the section are based on the fiber model, meaning the section is considered to be composed of fibers that coincide with the finite elements used in the temperature field model. As such, each element in the thermal analysis, along with its material type and temperature, is treated as a fiber. The constitutive relationship adopted is determined through the strain decomposition method [20], where the strain in steel at high temperatures primarily includes the free expansion strain εths, the high-temperature instantaneous creep εcrs, and the strain produced by stress εσs. The total strain εs is given by the following equation:
Thermal strain is entirely influenced by temperature, and stress-related strain includes both elastic and plastic strains. Initial strain can be used to represent either initial prestress or the strain pre-applied during the hardening phase of cast-in-place concrete under load. Transient creep in concrete is explicitly resolved in the model through a definitive formula. It accounts for the irreversibility of transient creep strain during periods of stress and/or temperature reduction. This explicit approach is essential, because even under continuous temperature rise and sustained load, the stress in specific areas of the concrete section may decrease due to differential thermal expansion.
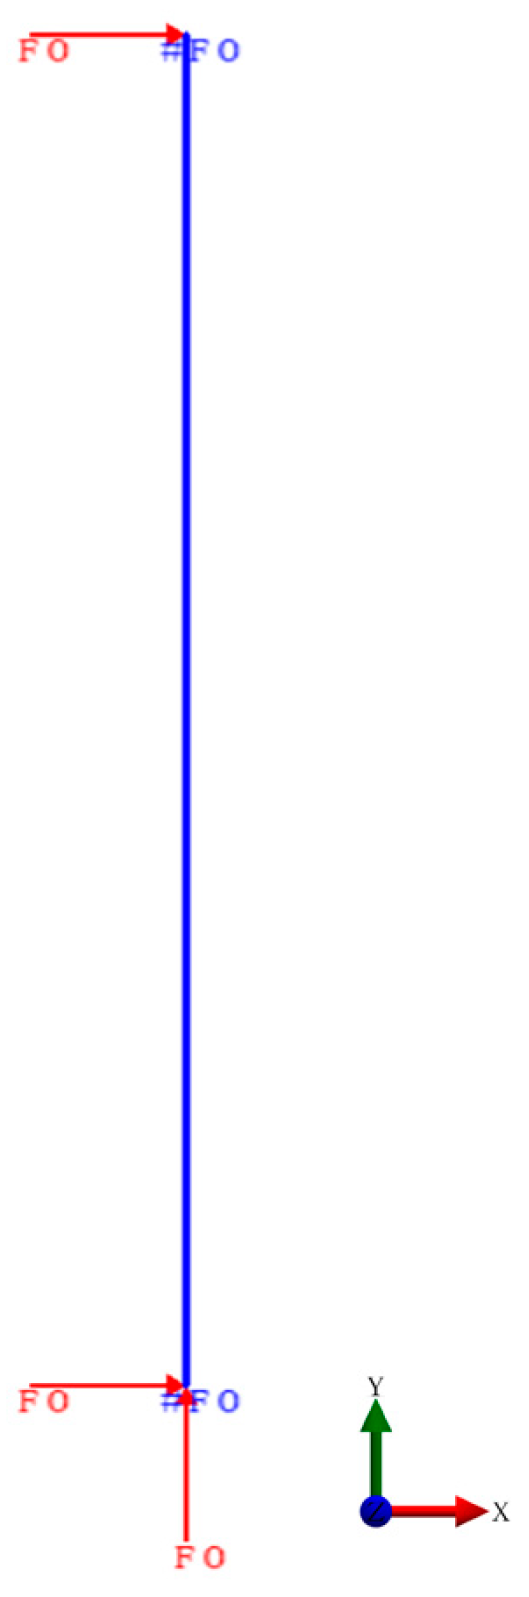
In this study, 2D beam elements are used to model columns entirely exposed to fire on all sides, while 3D beam elements are employed in cases of uneven exposure to capture the asymmetric response of the columns. The load is applied and maintained constant at the start of the simulation. Transient analysis is used throughout the fire exposure to calculate the evolution of displacement. The fire resistance represents the duration during which a concrete column maintains its load-bearing capacity, stability, and structural integrity under fire exposure. In the simulation, column failure occurs when the analysis can no longer reach an equilibrium state, leading to the termination of the simulation, indicating the time of failure. In experiments, it is determined according to the ISO 834 standard [29]. Front view of the structural model is shown in Figure 3.
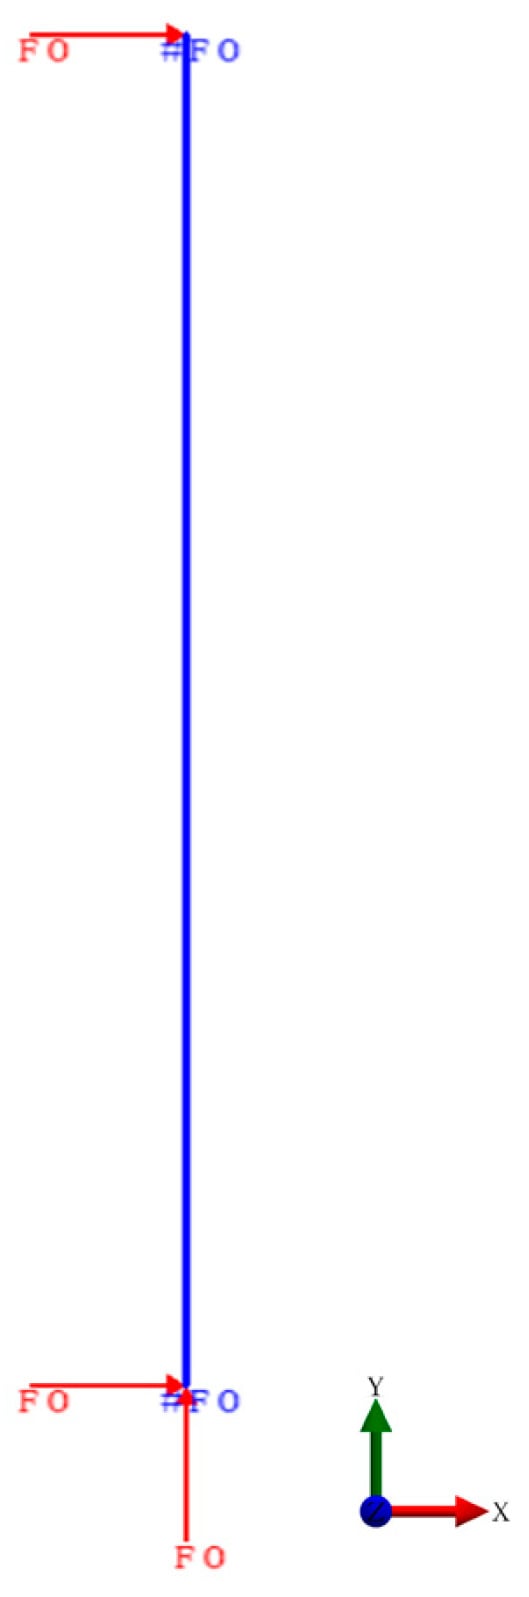
Figure 3.
Front view of the structural model.
The specific steps for establishing the structural analysis model are as follows.
(1) Create a column model with a height of 3000 mm and set the boundary conditions at the ends of the column. In this study, the bottom of the column is fixed, and the top end is set with constraints to limit the horizontal displacement of the column.
(2) Add physical parameters for steel and concrete and set the corresponding mechanical performance indicators. The high-temperature mechanical properties of concrete and steel reinforcement are both evaluated according to the EC2 values. The calculation method of the compressive strength of concrete fck(T) and yield strength of reinforcement fy(T) at high temperature is shown in Equations (3)–(5). When assigning material parameters, it is necessary to read the temperature field data of the column section, as the nodal temperatures in the structural analysis are retrieved from files created during the aforementioned temperature field analysis. An axial load is added at the top end of the column.
(3) Divide the established structural analysis model into a mesh, set the loading time and end time, and after setting parameters such as the maximum time step, generate the input file for the column structural analysis.
2.4. Model Validation
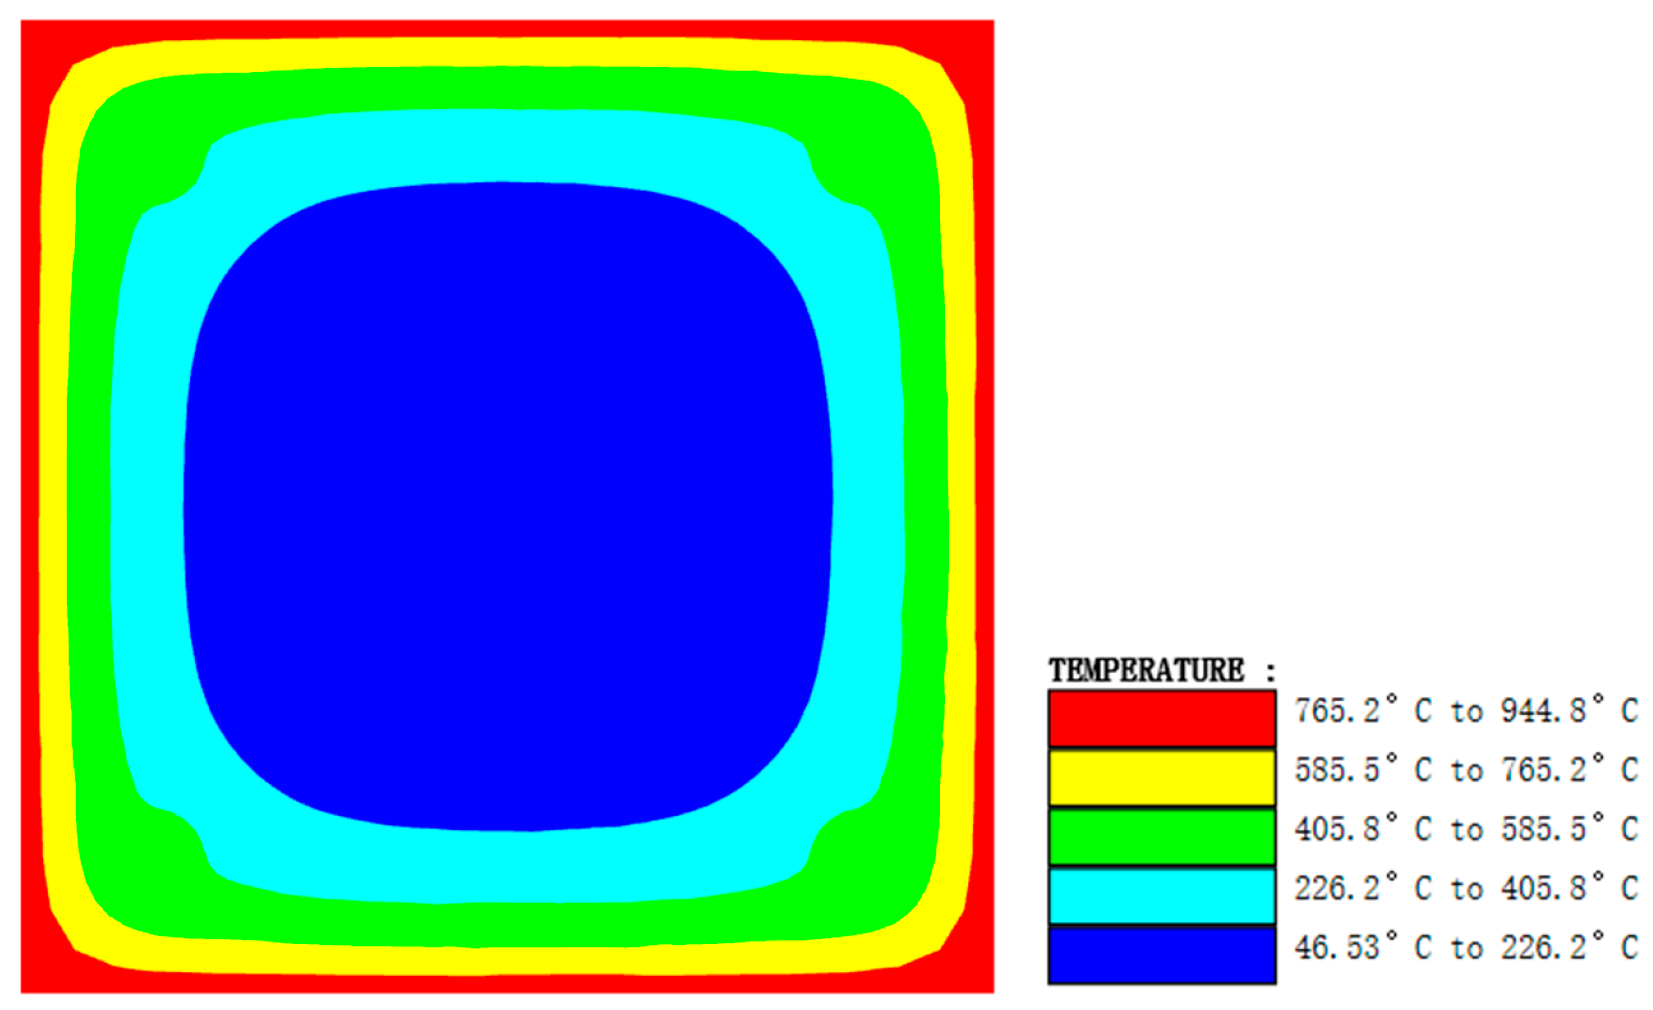
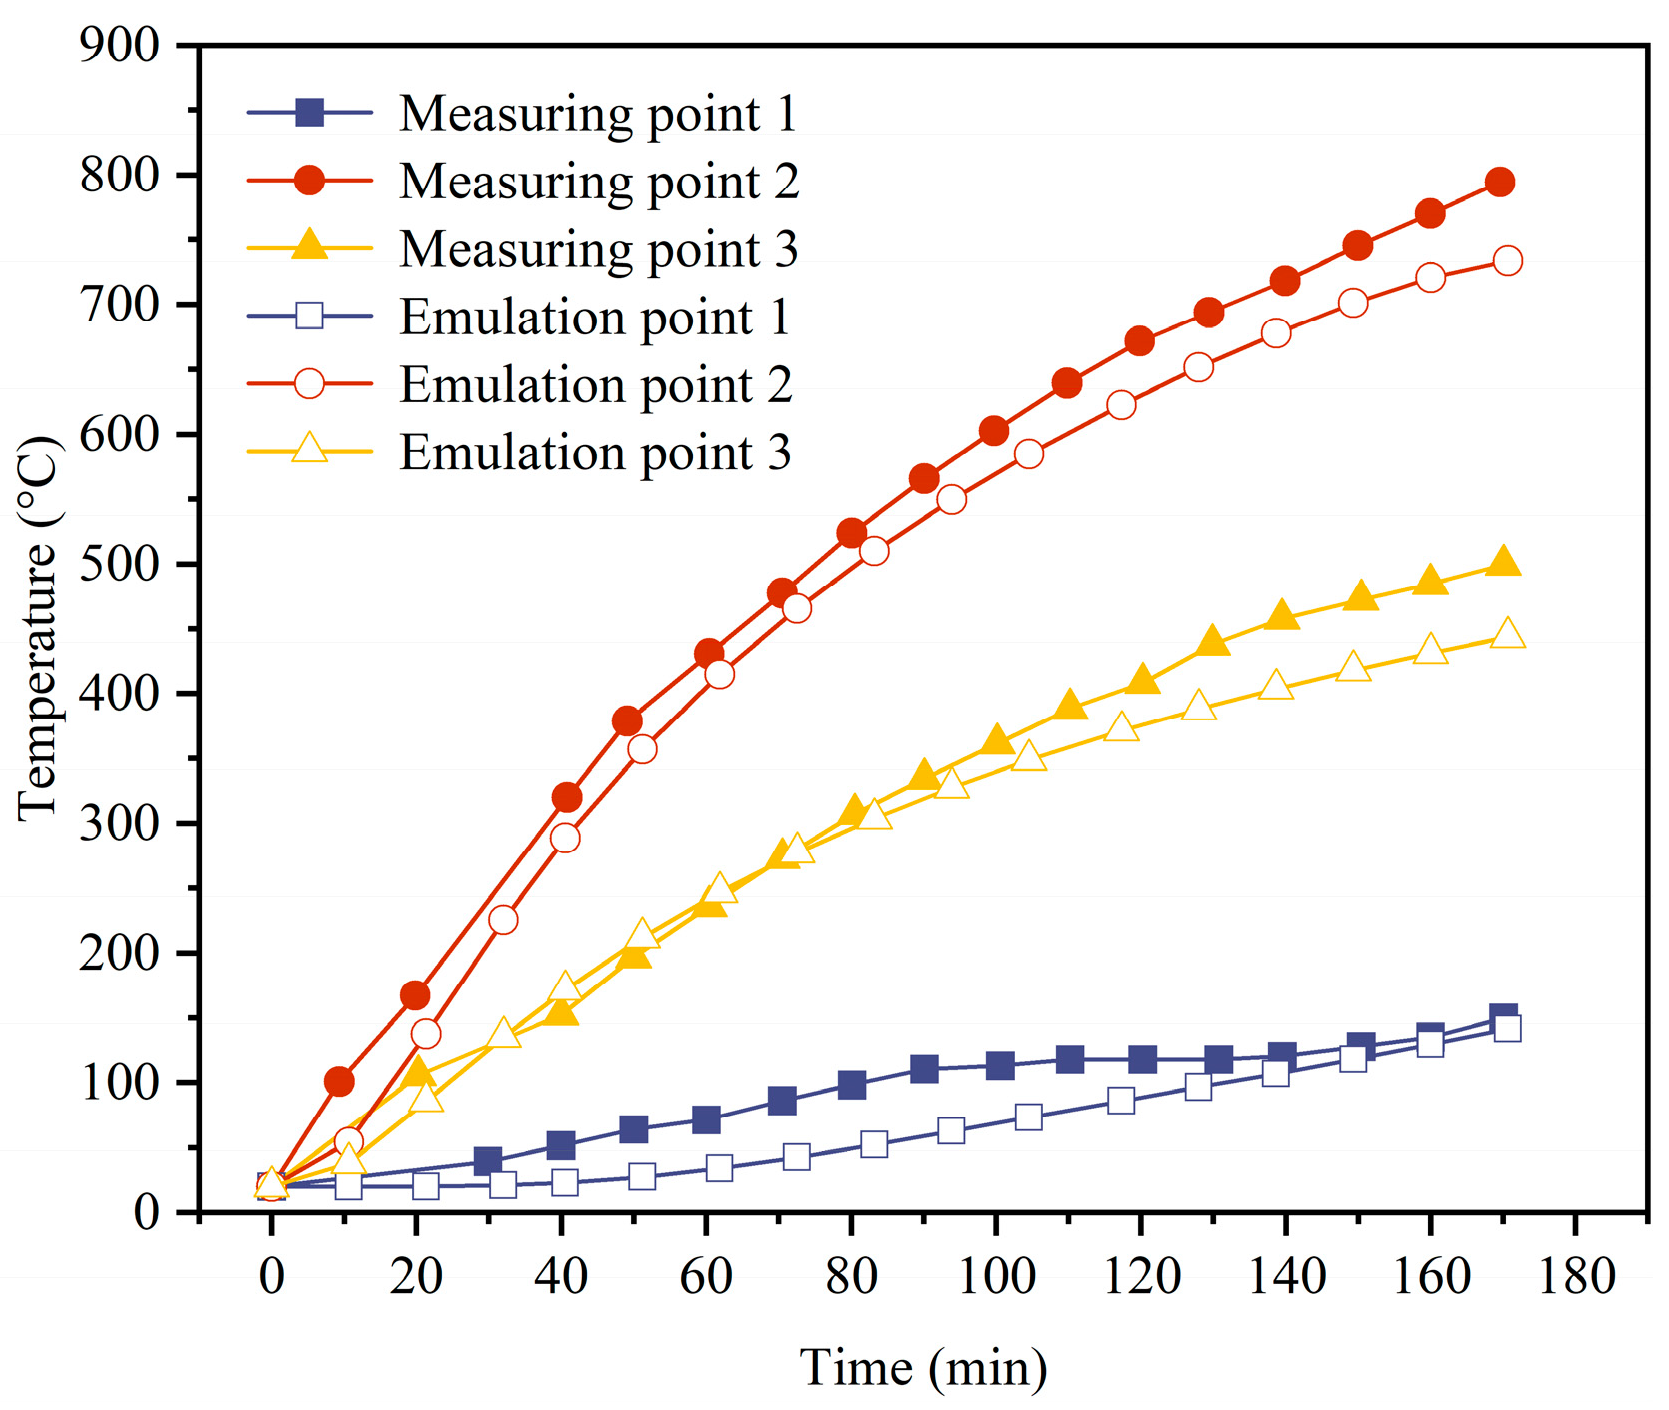
The reliability of the established finite element model is validated using experimental results. The temperature contour is shown in Figure 4, and the comparisons between the time–temperature simulation results and experimental results are shown in Figure 5. From the figures, it can be seen that the simulation results are satisfactory, with the maximum temperature difference between the measured and calculated values being 63 °C. The reason for the discrepancy is that SAFIR handles the influence of moisture content in a simplified manner when calculating the transient temperature of concrete, and it assumes that all moisture evaporates within a narrow temperature range without any transfer, resulting in the simulation curve generally being above the experimental temperature curve.
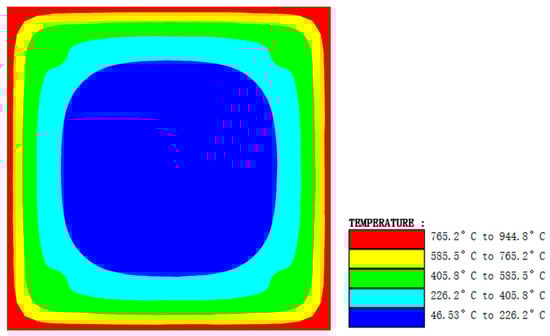
Figure 4.
Temperature contour of HC2.
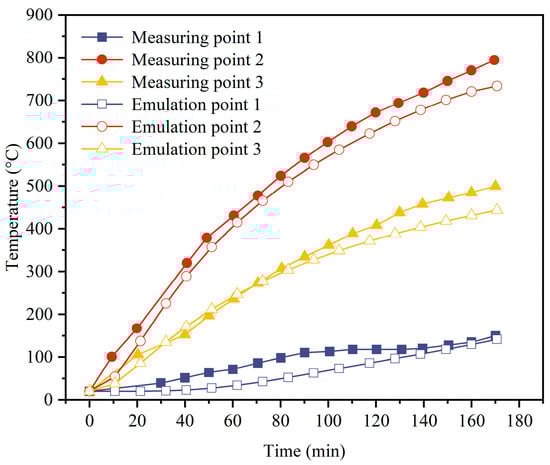
Figure 5.
Comparisons of the temperatures between the test and simulation results.
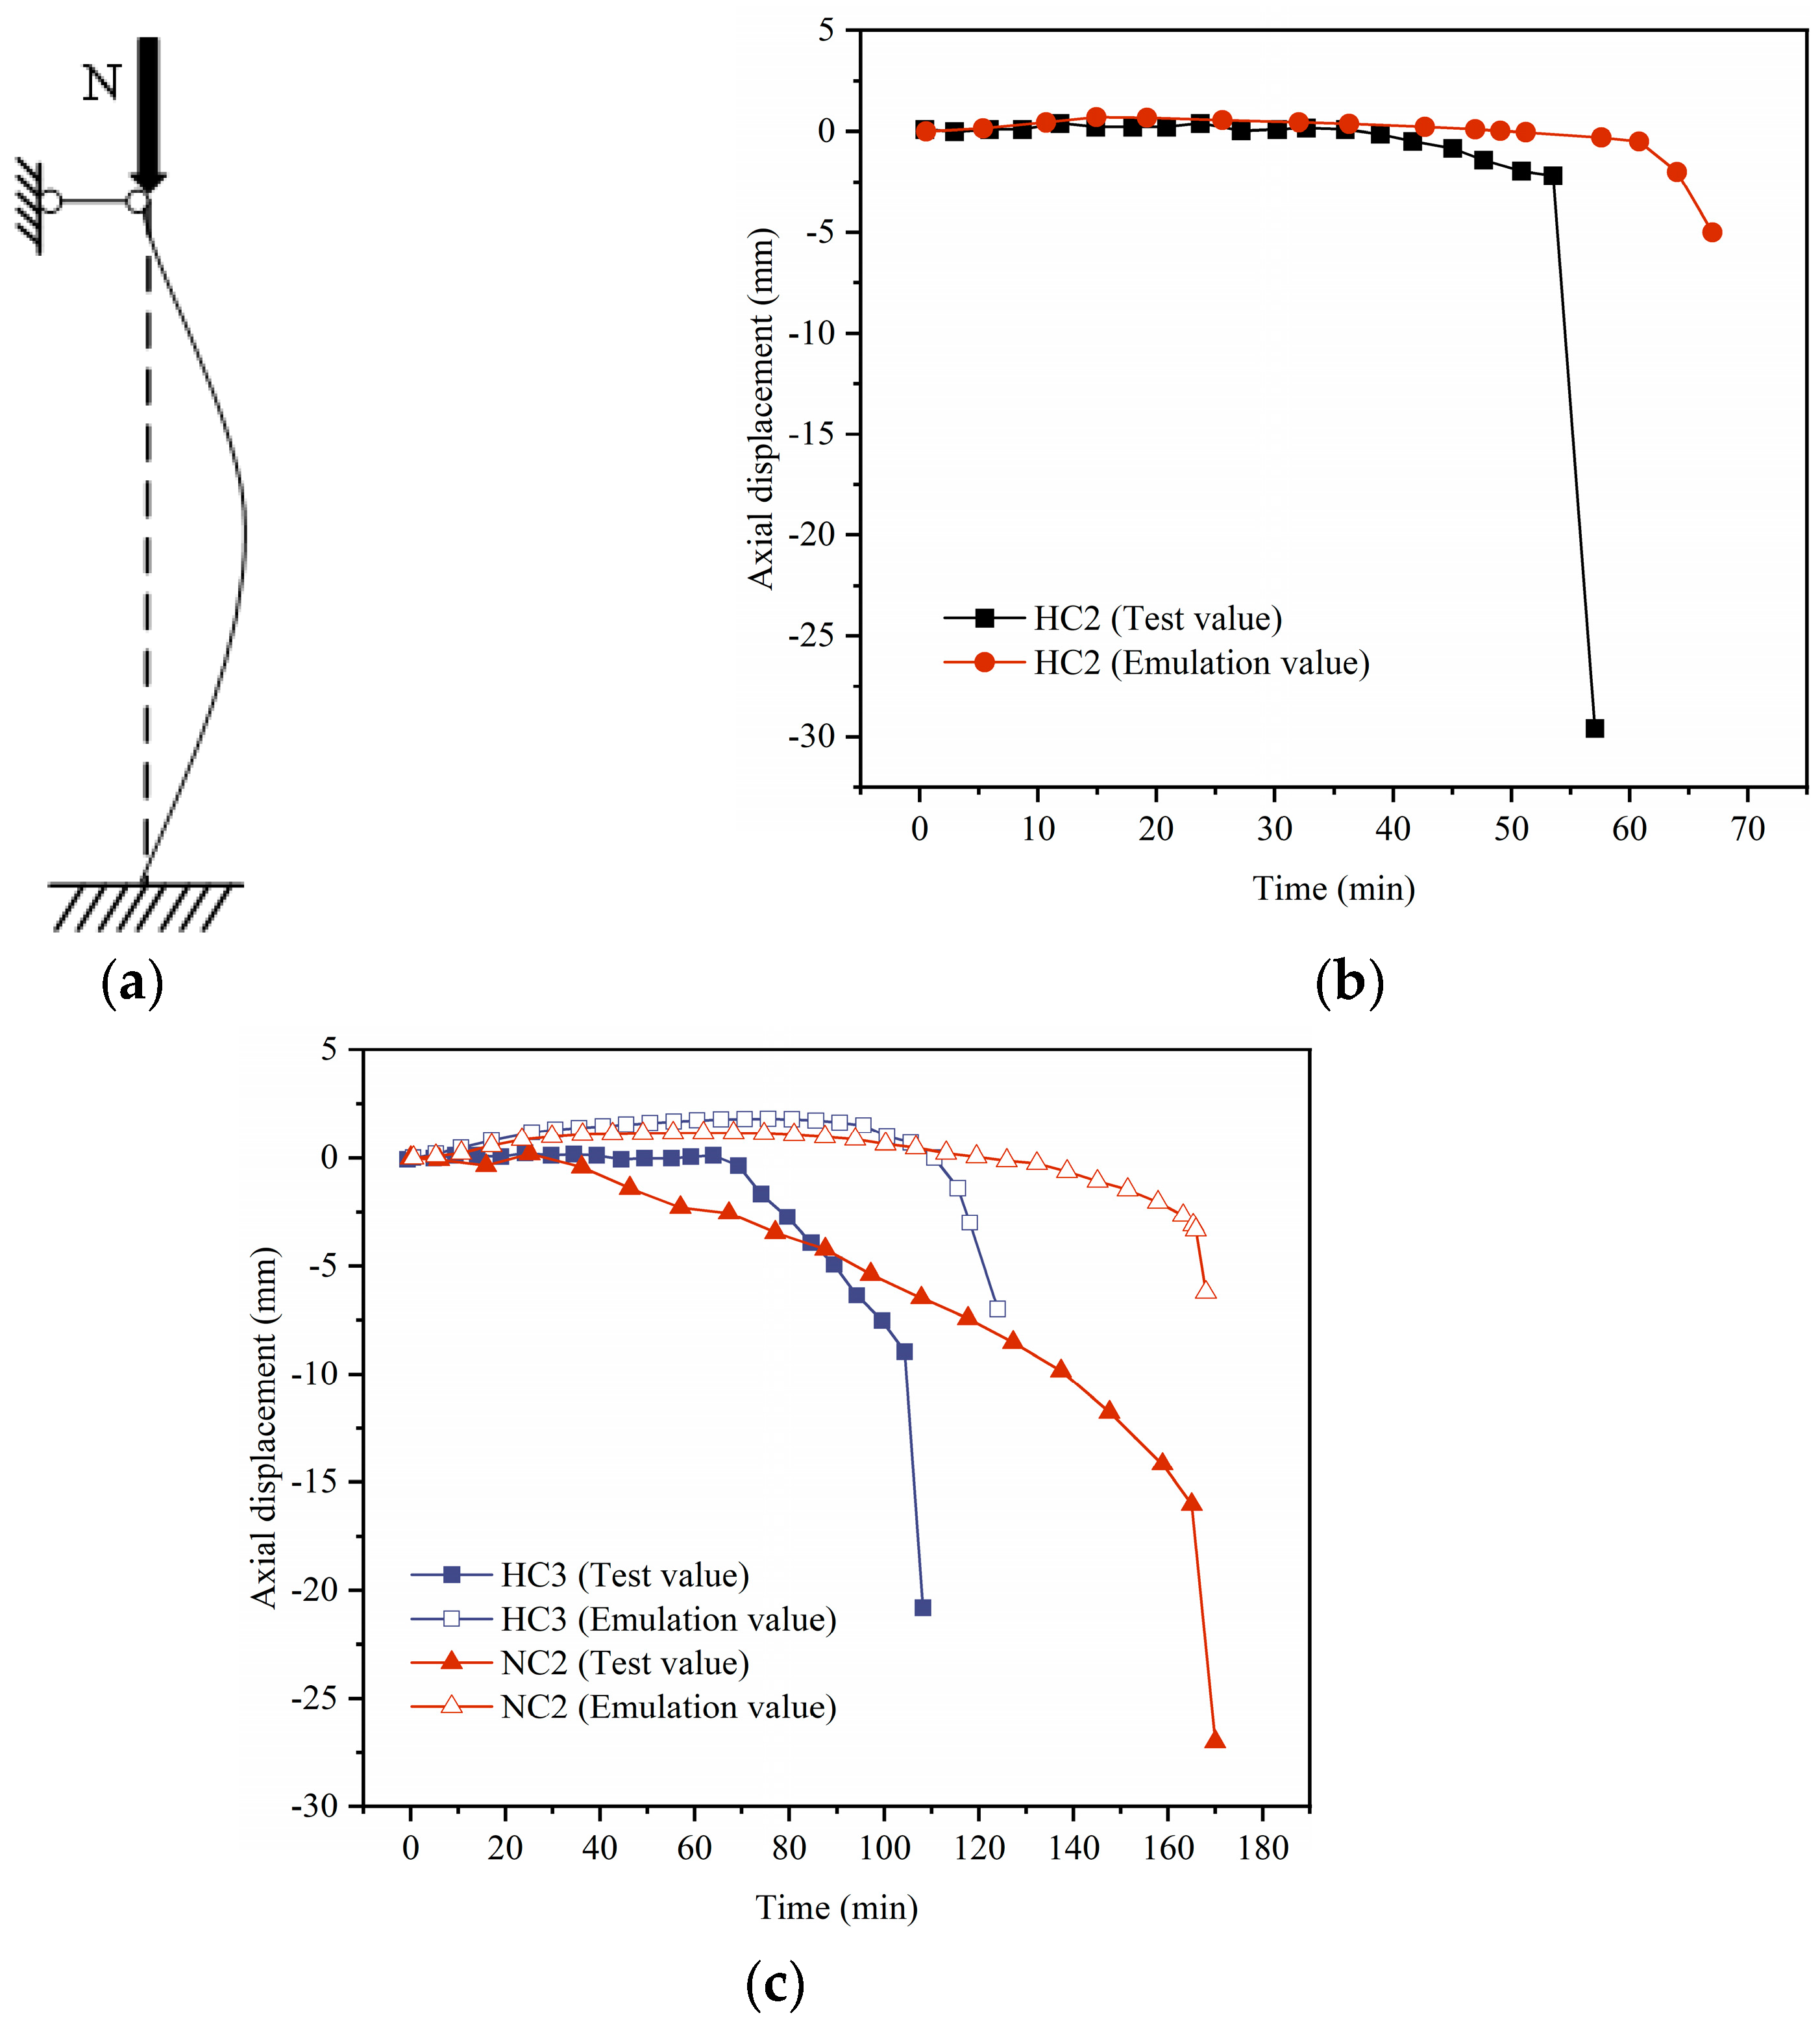
The axial deformation/displacement experiment simulation comparisons for specimens HC2, HC3, and NC2 are shown in Figure 6. The calculated and measured values of axial displacement follow similar trends over the duration of fire exposure and can be divided into three stages, as follows.
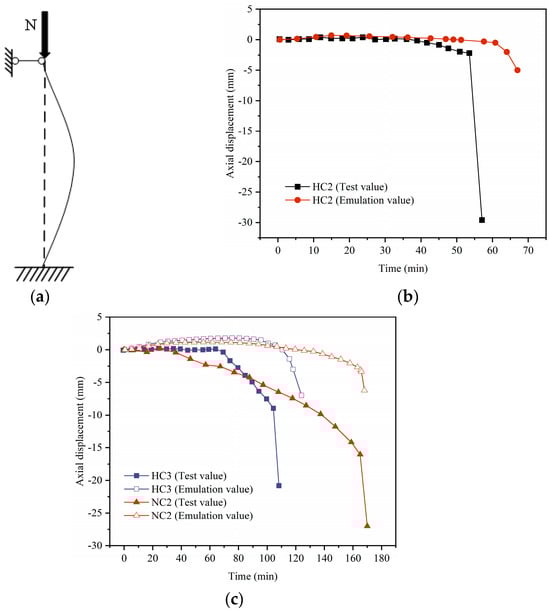
Figure 6.
Structural model validation: (a) column deformation under loading and high temperatures; (b) comparison of axial displacements (HC2); (c) comparison of axial displacements (HC3, NC2).
Initial stage of the fire: The concrete is affected by high temperatures, causing the bound water within the cement gel to escape and the volume to expand. During this phase, the specimens exhibit axial expansion, and cracks begin to develop within the concrete.
Second stage of the fire: The coarse aggregates in the concrete expand and fracture due to heat, leading to deformation differences due to the thermal incompatibility between the aggregates and the cement mortar. The strength of the concrete rapidly decreases, and the axial deformation begins to slowly decline.
Third stage of the fire: There is a sudden drop in axial displacement. Under the combined effects of high temperatures and vertical loads, HC2 and HC3 exhibit certain brittle characteristics. HC2 and HC3 drop to −2.56 mm and −9.48 mm, respectively, before plummeting, which may be related to the method of fire exposure and the strength of the concrete.
Comparing the fire resistance of the experimental and simulation values for HC2 and HC3, it is found that the simulation values are about 12 min higher than the experimental values. This discrepancy is due to severe concrete spalling observed in the experiments for HC2 and HC3, which was not considered in the simulation. In addition, the specimen size and equipment errors will also affect the results. For NC2, the duration of the axial displacement curves in the experiment and simulation do not differ significantly, with the simulation value only 4 min longer, mainly related to the deviation in the temperature field. Regarding the axial displacement deviation of the specimens, HC2 and HC3 have a maximum deviation of 6 mm. The experimental and simulation values for NC2 show a maximum deviation of 11.4 mm. Generally, the test values are greater than the simulation values. This discrepancy may be due to the simulation not accounting for the impact of concrete spalling and the simulated temperature field being smaller than the measured temperature field, resulting in a smaller simulated deformation value. Additionally, the impact of spalling reduces the actual size of the specimen, decreasing its compressive stiffness and leading to greater deformation. There is also an eccentric error in the loading, which produces greater deformation under combined compression and bending. Finally, during the specimen production process, there may be errors in the positioning of the steel bars and the size of the specimen.
3. Parametric Analyses
This study aimed to numerically explore the impact of four factors on the fire resistance of corroded reinforced concrete columns: rebar corrosion degree, concrete strength, fire exposure method, and concrete cover thickness, as detailed in Table 2. Based on the literature [30], corrosion can be generally divided into three degrees: slight corrosion (0–5%), moderate corrosion (5–12%), and severe corrosion (more than 12%). Values of 0.05, 0.1, and 0.2 represent slight corrosion, moderate corrosion, and severe corrosion degrees, respectively. Concrete with strength grades of C30, C40, and C50 is commonly used in current engineering practice. Concrete covers with thicknesses of 20 mm and 30 mm are also frequently applied to concrete beams and columns. Depending on the position within the concrete structures, concrete columns may be exposed to fire on two, three, or four sides. The column design dimensions are 300 mm × 300 mm × 3000 mm (length × width × height), with a fixed support at the lower end and a pinned support at the upper end to restrict horizontal displacement and rotation. Siliceous aggregates are chosen for the concrete, with concrete properties as shown in Table 3. Considering the actual usage scenario, the axial compression ratio is set at 0.6. The longitudinal reinforcement uses hot-rolled steel bars with a diameter of 25 mm, a yield strength of 400 MPa at room temperature, and an average tensile strength of 540 MPa. The analysis is conducted using the ISO 834 standard heating curve.
Table 2.
Numerical modeling parameters.
Table 3.
Mechanical properties of concrete under room temperature and axial load.
3.1. Influence of Corrosion Degree
The effect of corrosion degree on the specimens is primarily reflected in the reduction of the steel rebar cross-sectional area and yield strength due to corrosion, as well as the spalling of the concrete cover caused by corrosion expansion. The conversion issue between corrosion degree and steel rebar cross-sectional area refers to the calculation model derived by Du [31], which is expressed by the following formula:
where ηs represents the section loss rate, η is the mass corrosion rate, is the original diameter of the corroded rebar in mm, d is the diameter of the rebar after corrosion in mm, fyc is the yield strength of the corroded rebar in MPa, and fy0 is the initial yield strength of the rebar in MPa.
The calculated diameters and yield strengths of the corroded rebars are shown in Table 4.
Table 4.
Diameters of the corroded rebars and yield strengths.
Under the effect of the volumetric expansion of the corrosion products of the stirrups, the concrete cover on the surface of the stirrups will crack or even spall, resulting in a reduction in the effective cross-sectional area of the concrete. The effective width of the concrete cross section after rust expansion and spalling can be calculated using Equation (9). The calculated effective width can be found in Table 5. Figure 7 illustrates the cross-sectional dimensions of the concrete column before and after corrosion, as well as the positions of the thermocouples.
Table 5.
Dimensions of the corroded concrete columns.

Figure 7.
Cross-sectional dimensions of the corroded column and arrangement of thermocouples.
Here, is the effective width of the section after corrosion of the stirrup, is the original width of the cross section, is the spacing of stirrups and = 100 mm, is the concrete cover thickness of stirrups, and is the diameter of the stirrup.
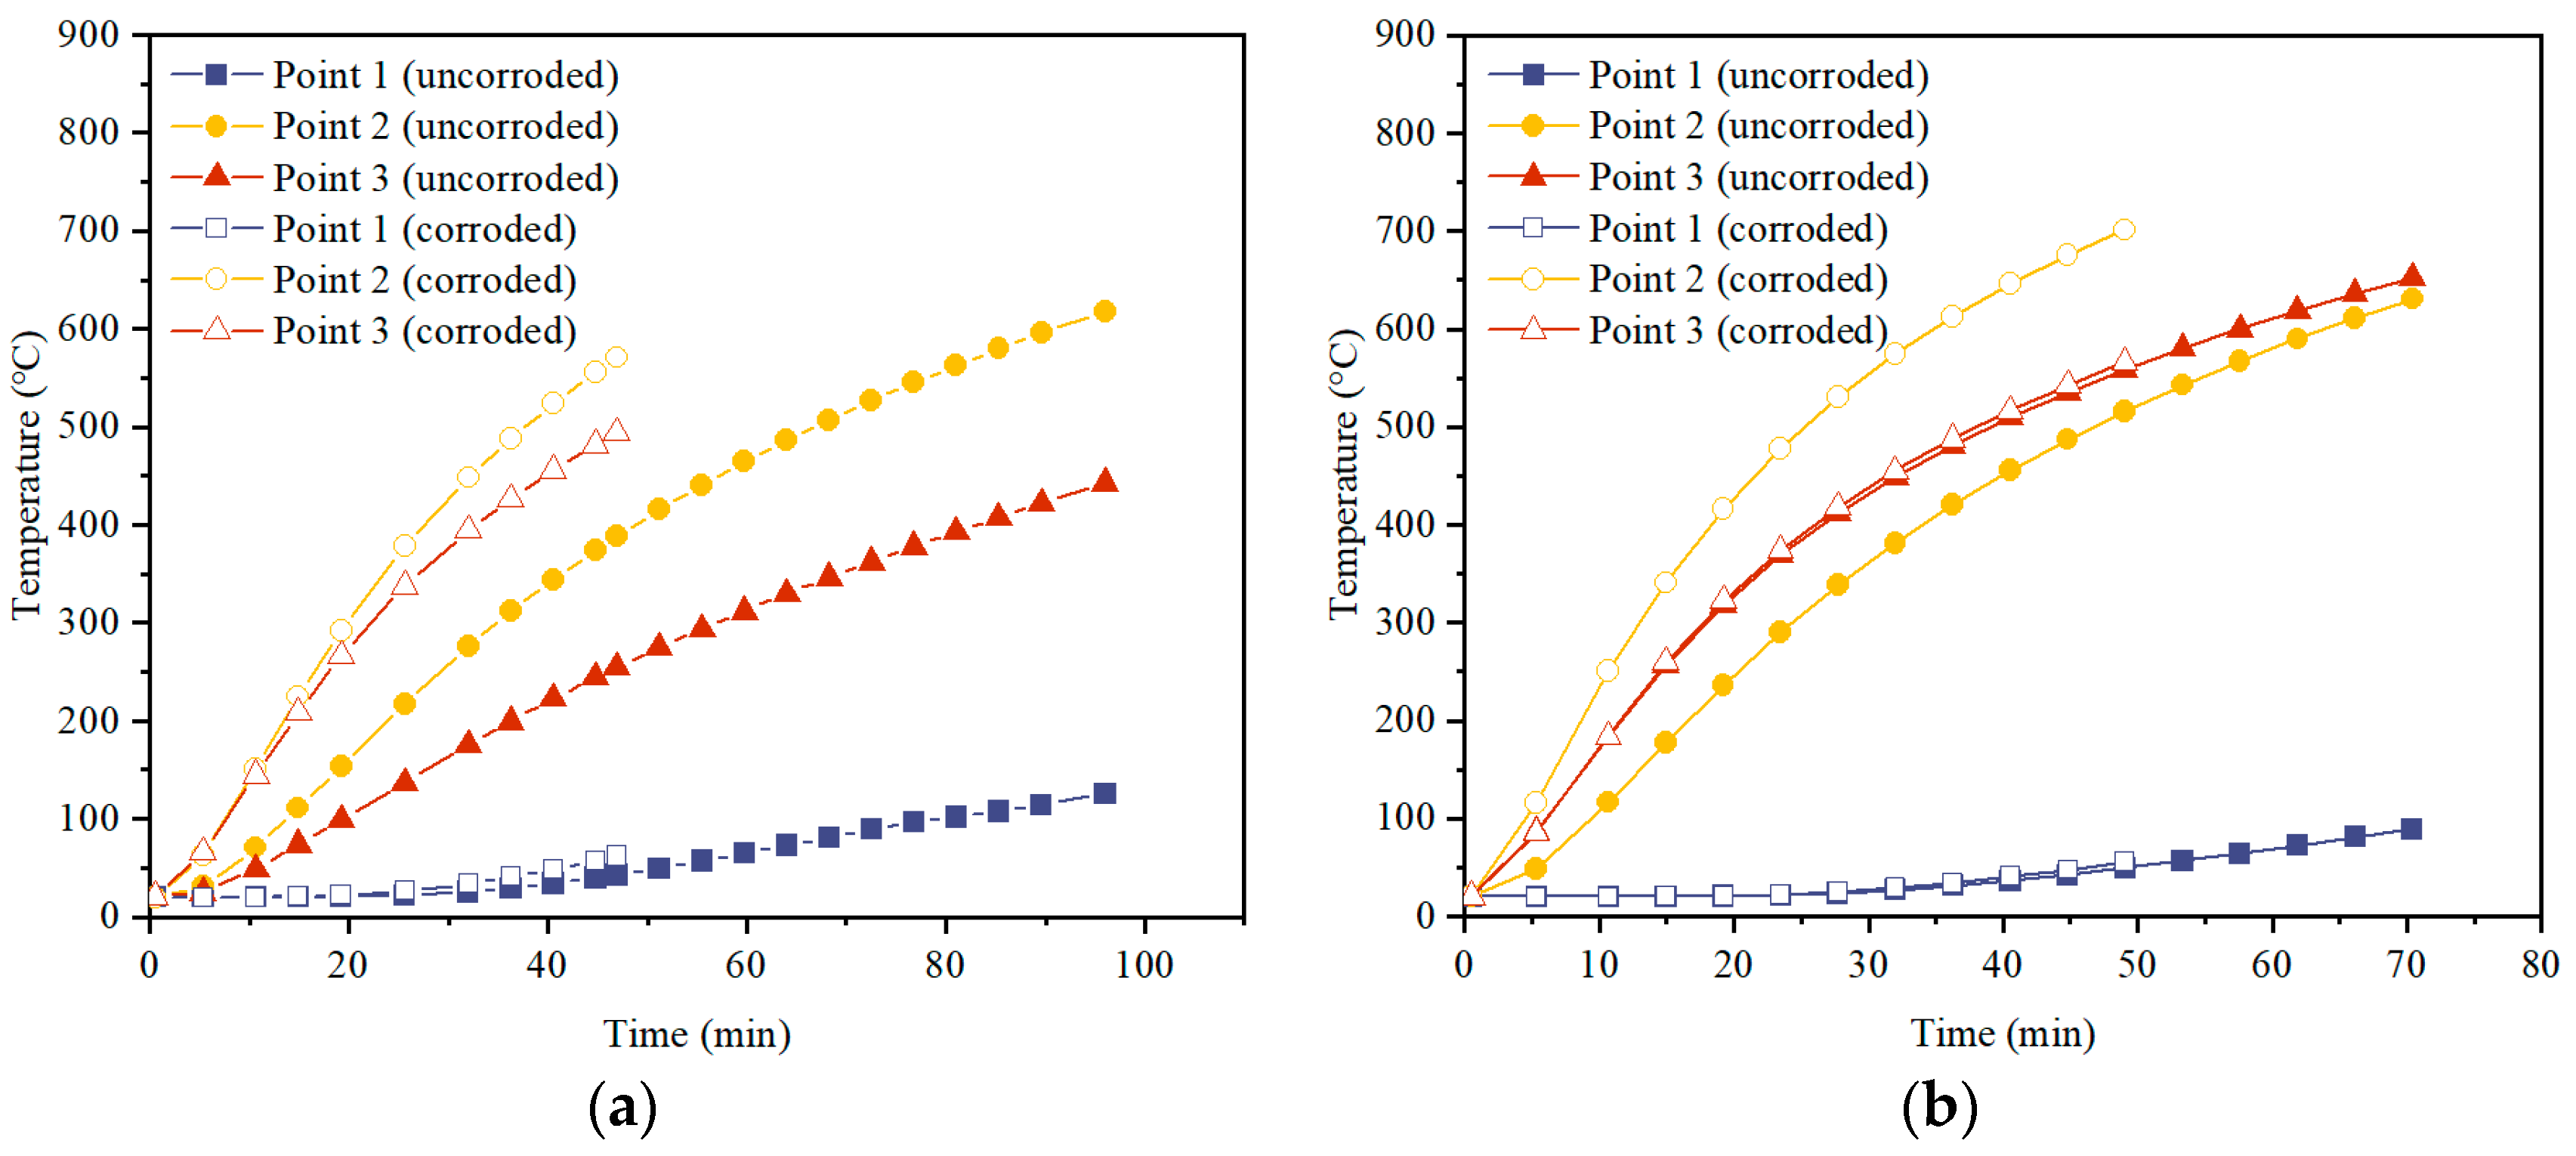
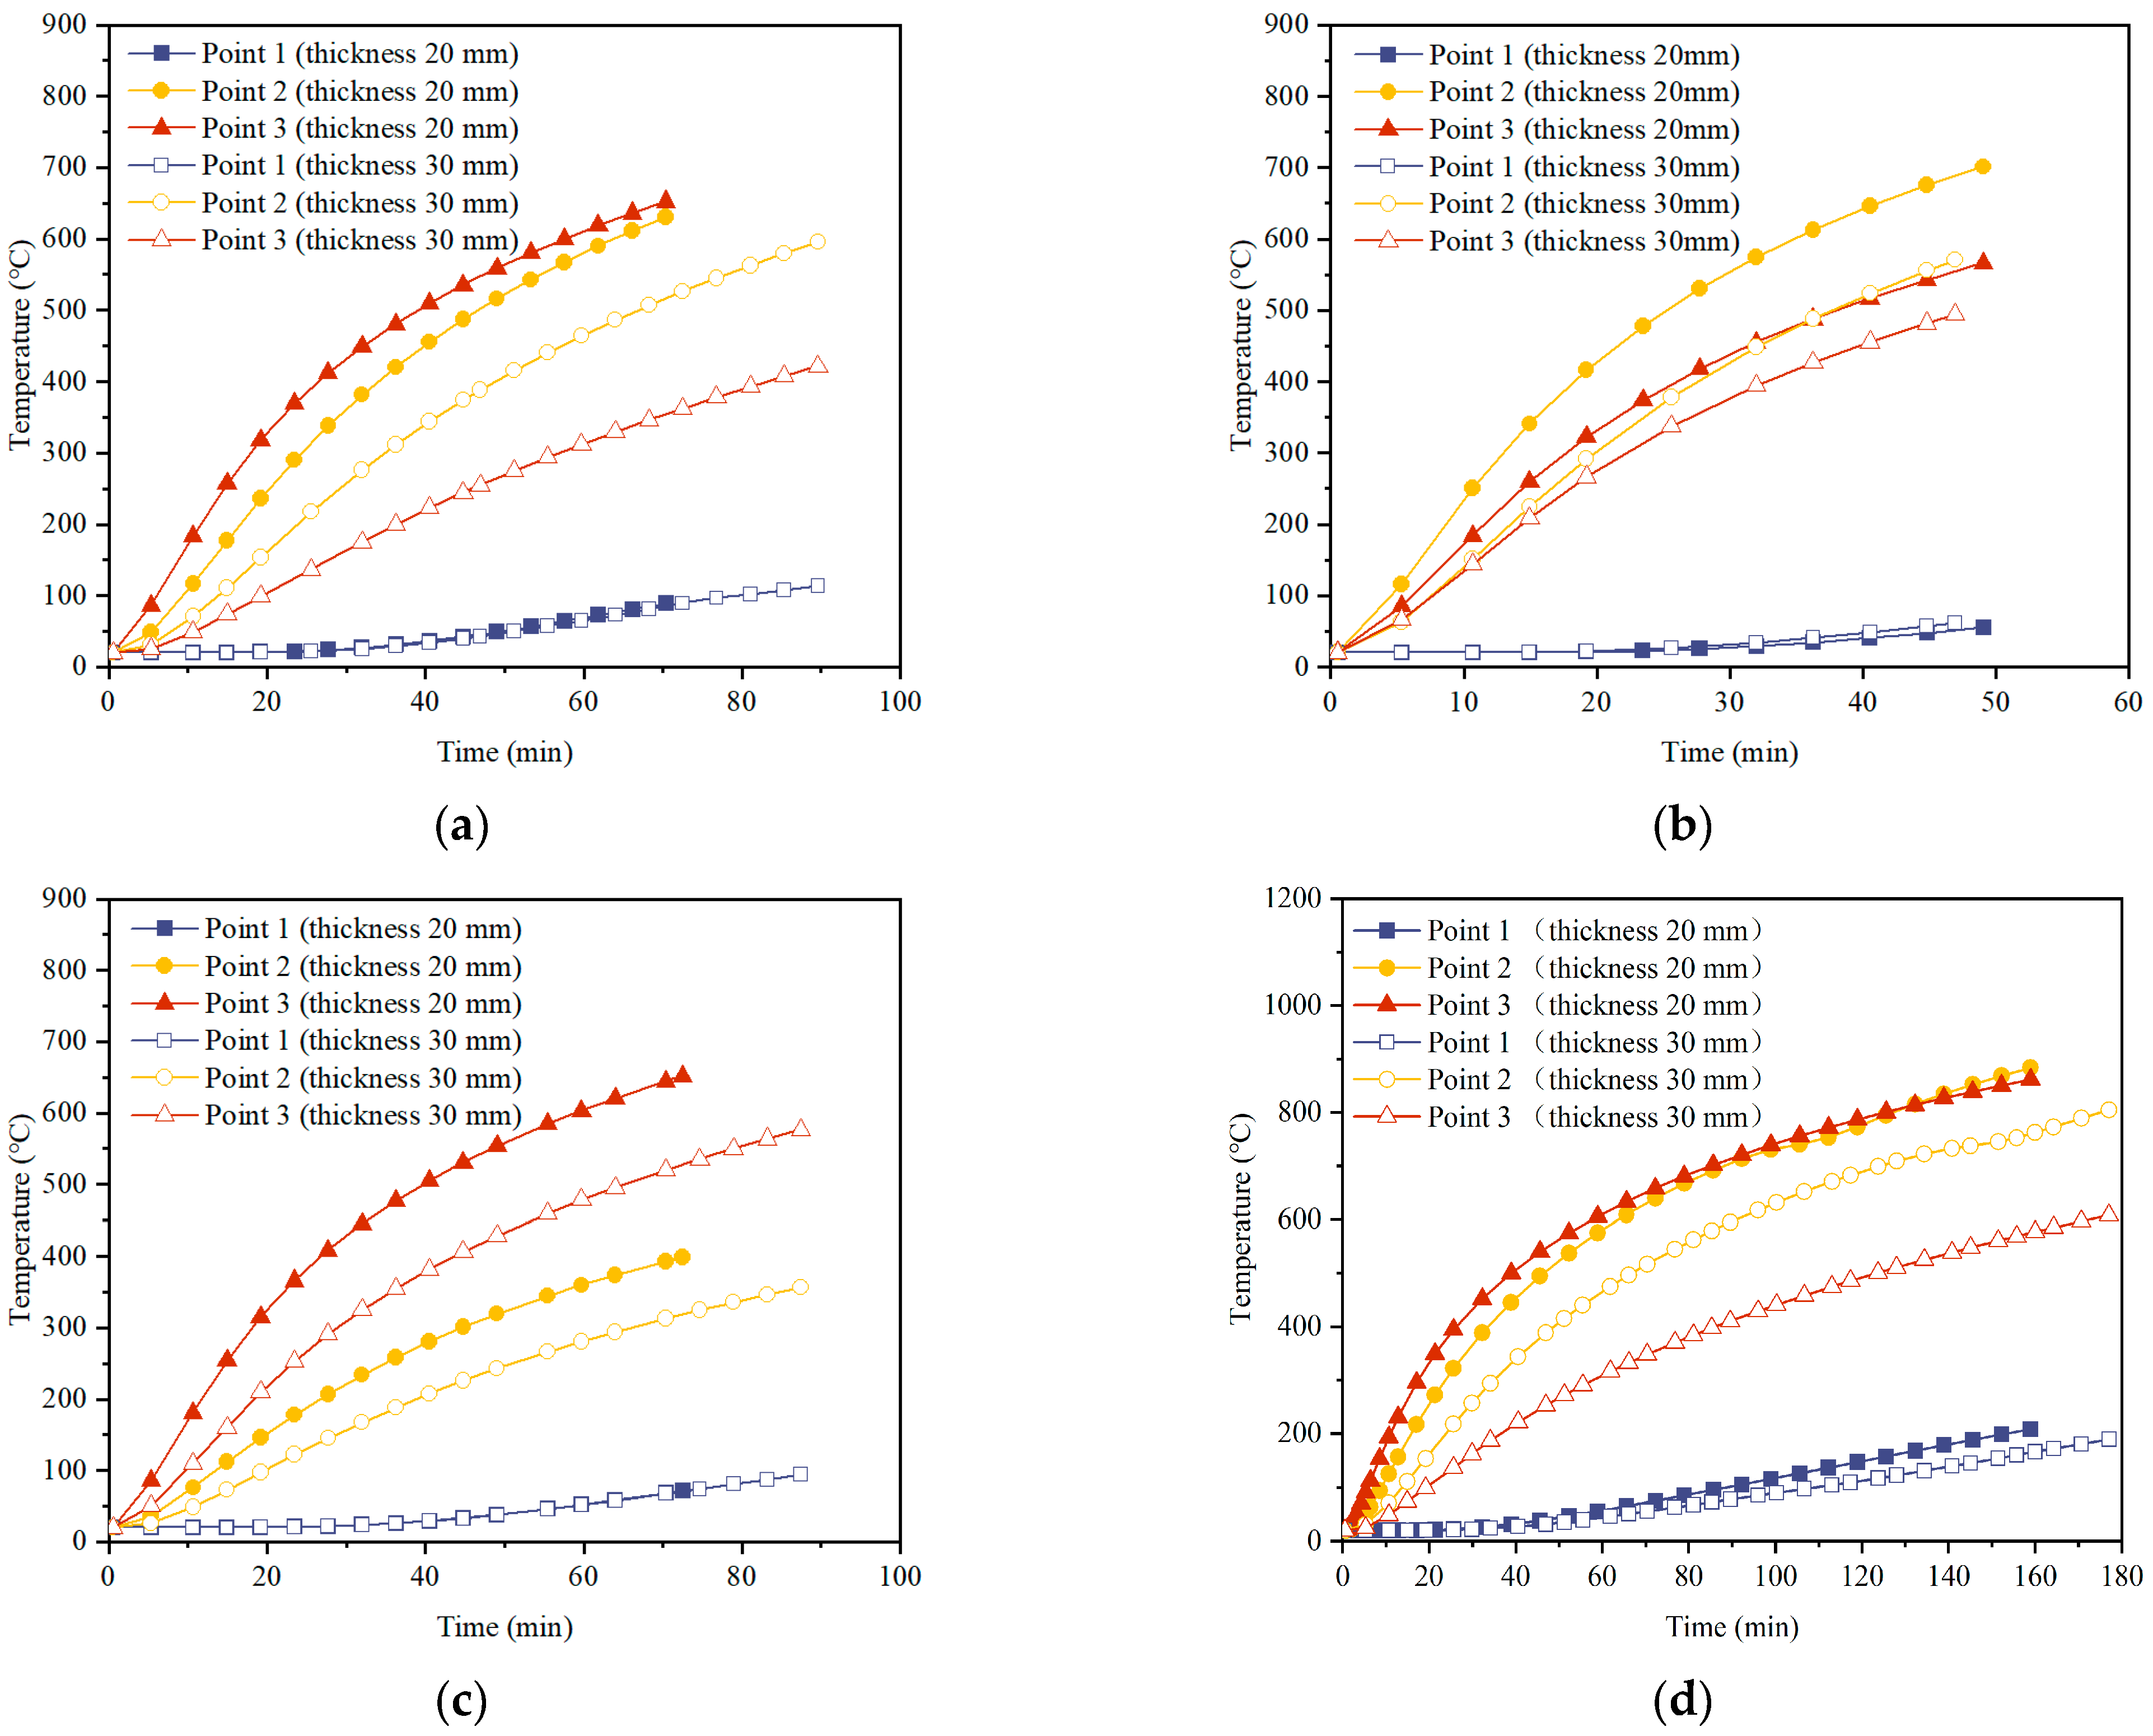
Figure 8 presents temperature comparisons between the uncorroded and severely corroded columns at the same measurement points, highlighting the significant impact of corrosion on the temperature field across the cross section. Corrosion undermines the effectiveness of the concrete cover and accelerates the rate of temperature rise at the location of the steel reinforcement. Notably, the temperature field of concrete columns exposed to fire on two adjacent sides is most affected by cross-sectional damage. At measurement point two, for instance, the location of the rebar in the uncorroded column requires an additional 64 min to reach the same temperature as the severely corroded column, the temperature rise curve of which is shortened by 56% due to the corrosion.

Figure 8.
Influence of corrosion on the temperature fields: (a) temperature–time curves of the columns with four faces under fire and a 30 mm concrete cover thickness; (b) temperature–time curves of the columns with four faces under fire and a 20 mm thick concrete cover.
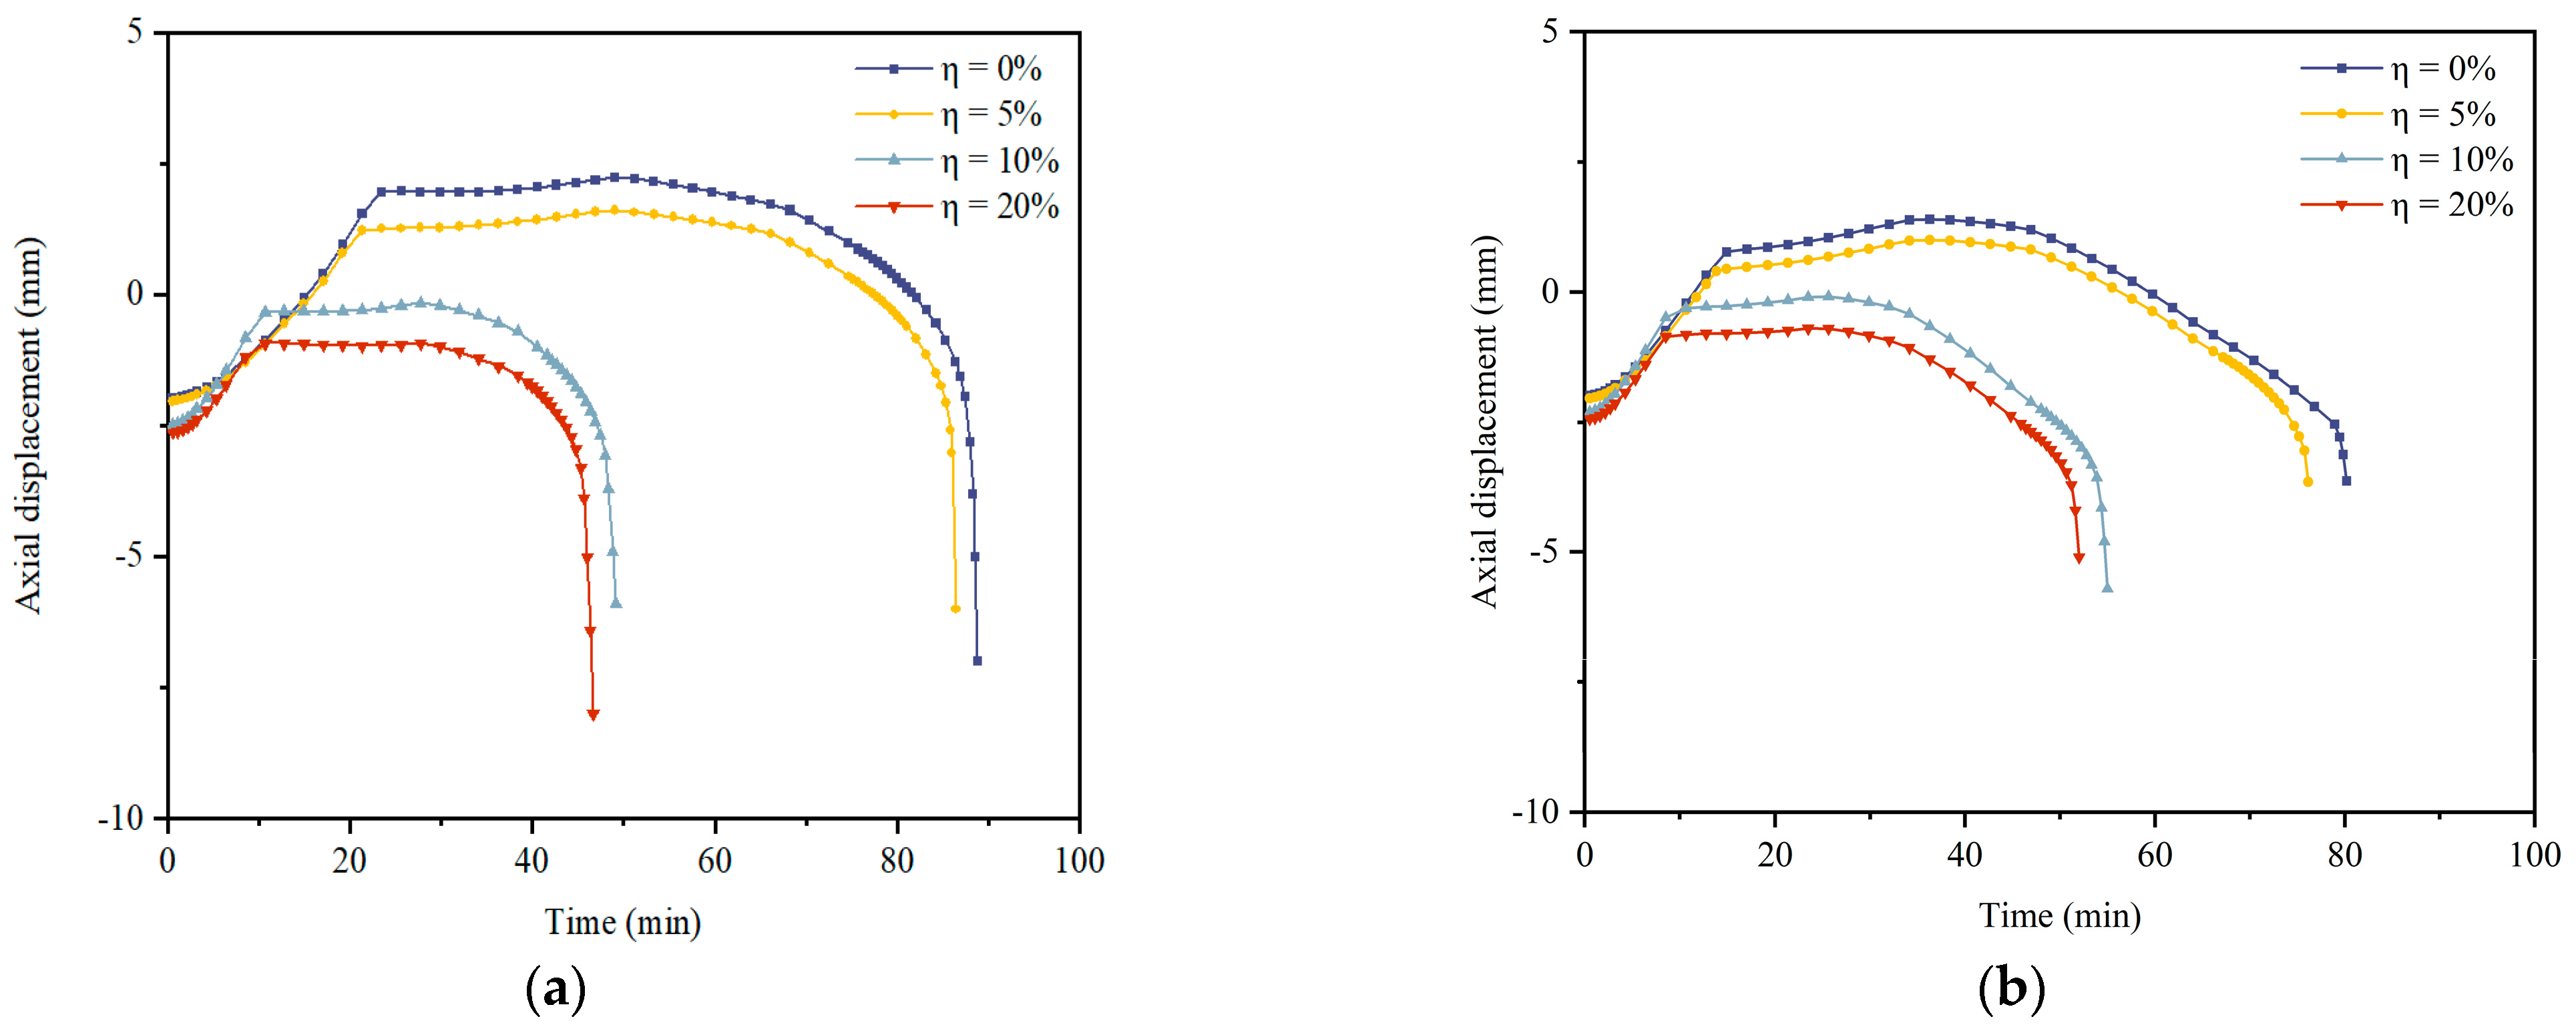
Figure 9 shows the axial displacement–time curves for columns with different corrosion degrees. It can be observed that in the initial phase of the simulation, the columns exhibit axial compression under the load, followed by axial expansion due to the high temperatures affecting the concrete. As the corrosion rate increases, the peak value of axial displacement caused by concrete expansion gradually shifts to the left, indicating that the deterioration in the mechanical properties of steel and concrete materials under fire becomes more severe with the increasing corrosion. It is important to note that minor corrosion (η = 5%) has a small impact on the axial displacement of the column, but severe corrosion weakens the axial expansion response of the concrete material, reducing the peak value of axial expansion by up to 2.9 mm. In the second stage, the process of slow axial displacement decline is shortened and the rate of axial deformation of the column accelerates, leading to premature failure of the column by up to 98 min. With a concrete cover thickness of 20 mm, the initial compression difference is only 0.4 mm, while with a concrete cover thickness of 30 mm, the initial axial compression increases with the corrosion degree.
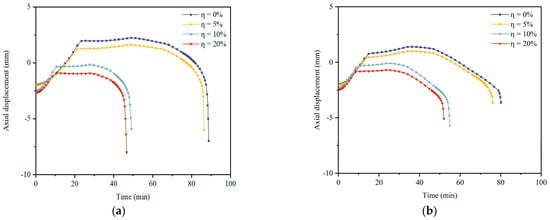
Figure 9.
Influence of corrosion on the axial displacement–time curves: (a) columns with 4 sides under fire and a 30 mm concrete cover thickness; (b) columns with 4 sides under fire and a 20 mm thick concrete cover.
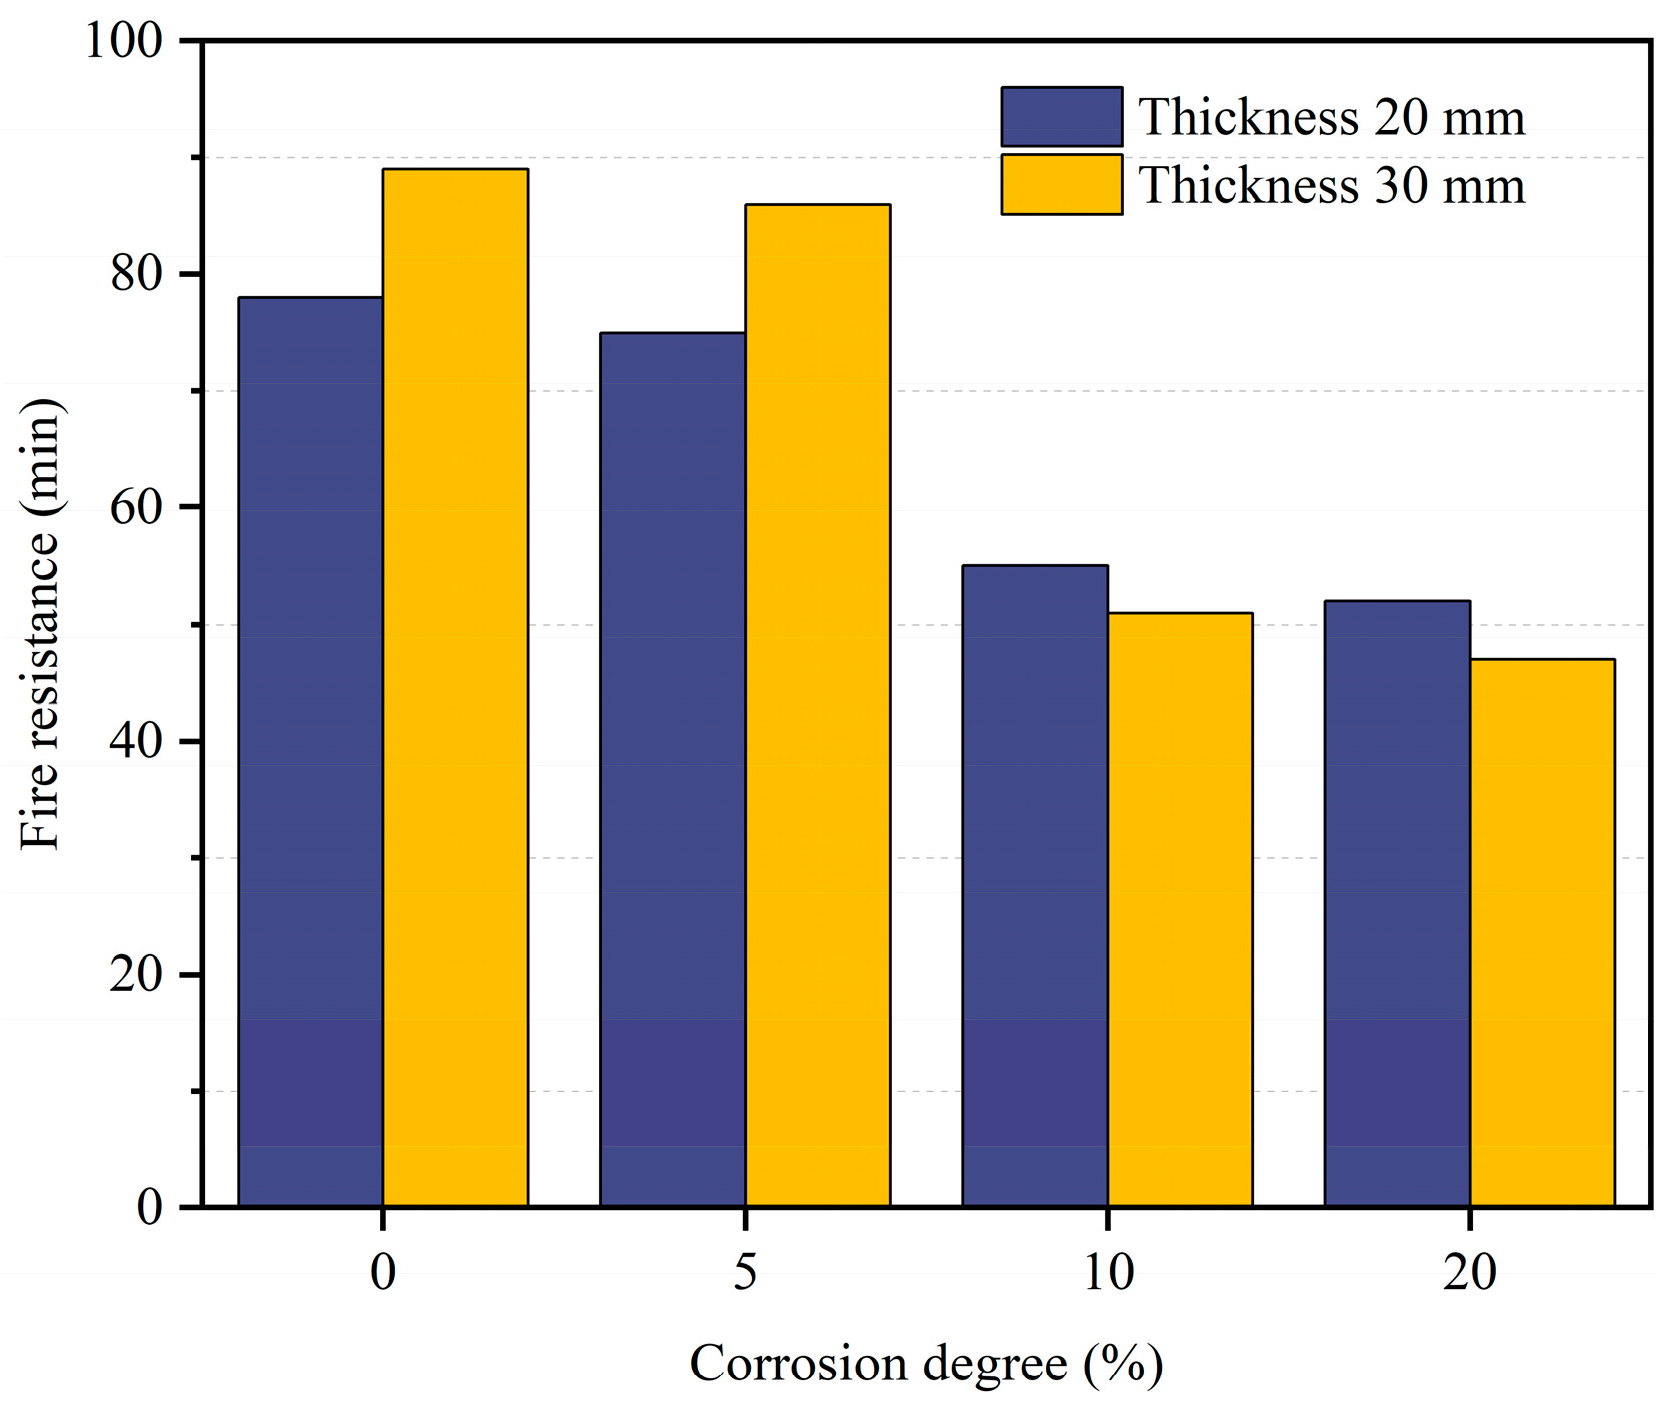
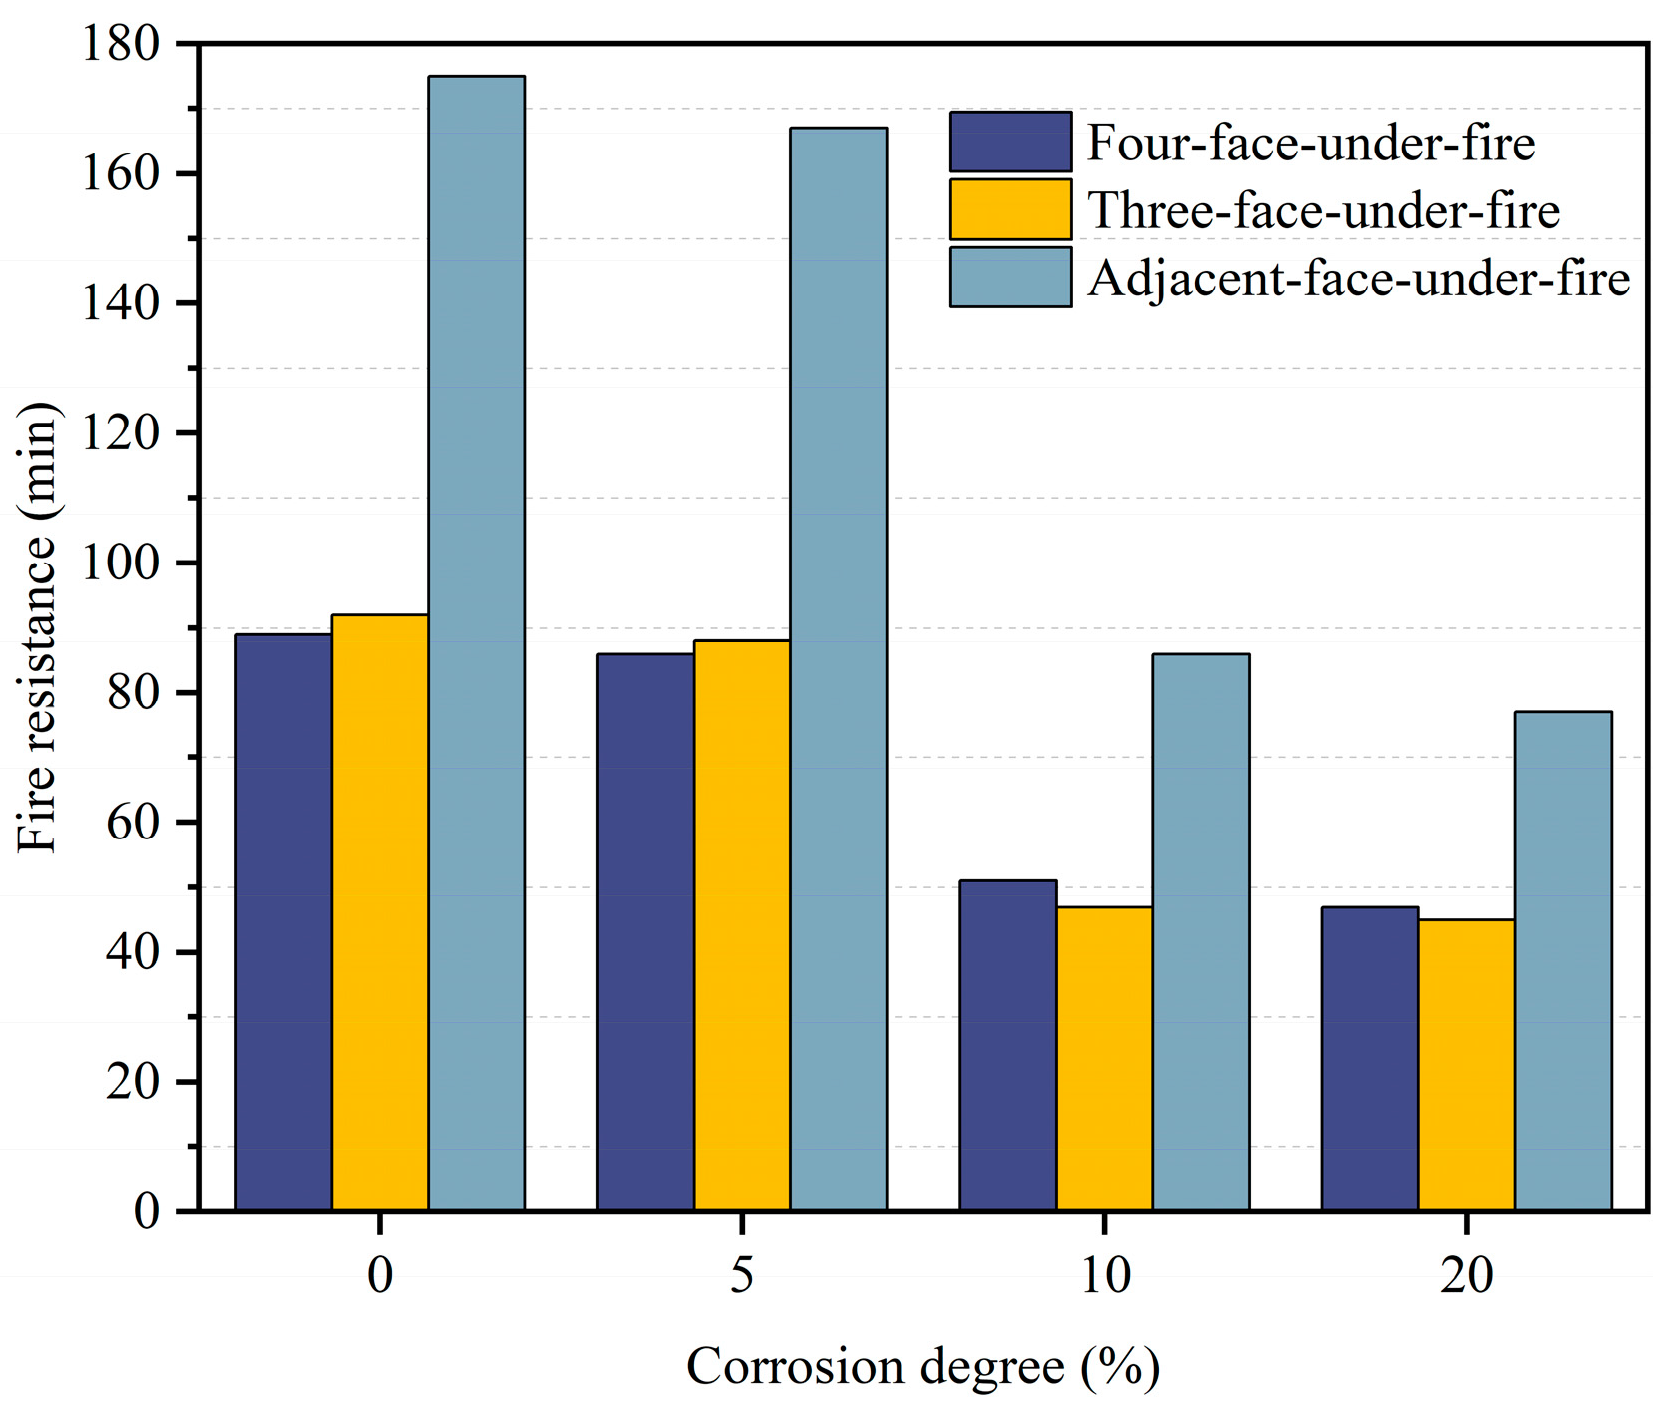
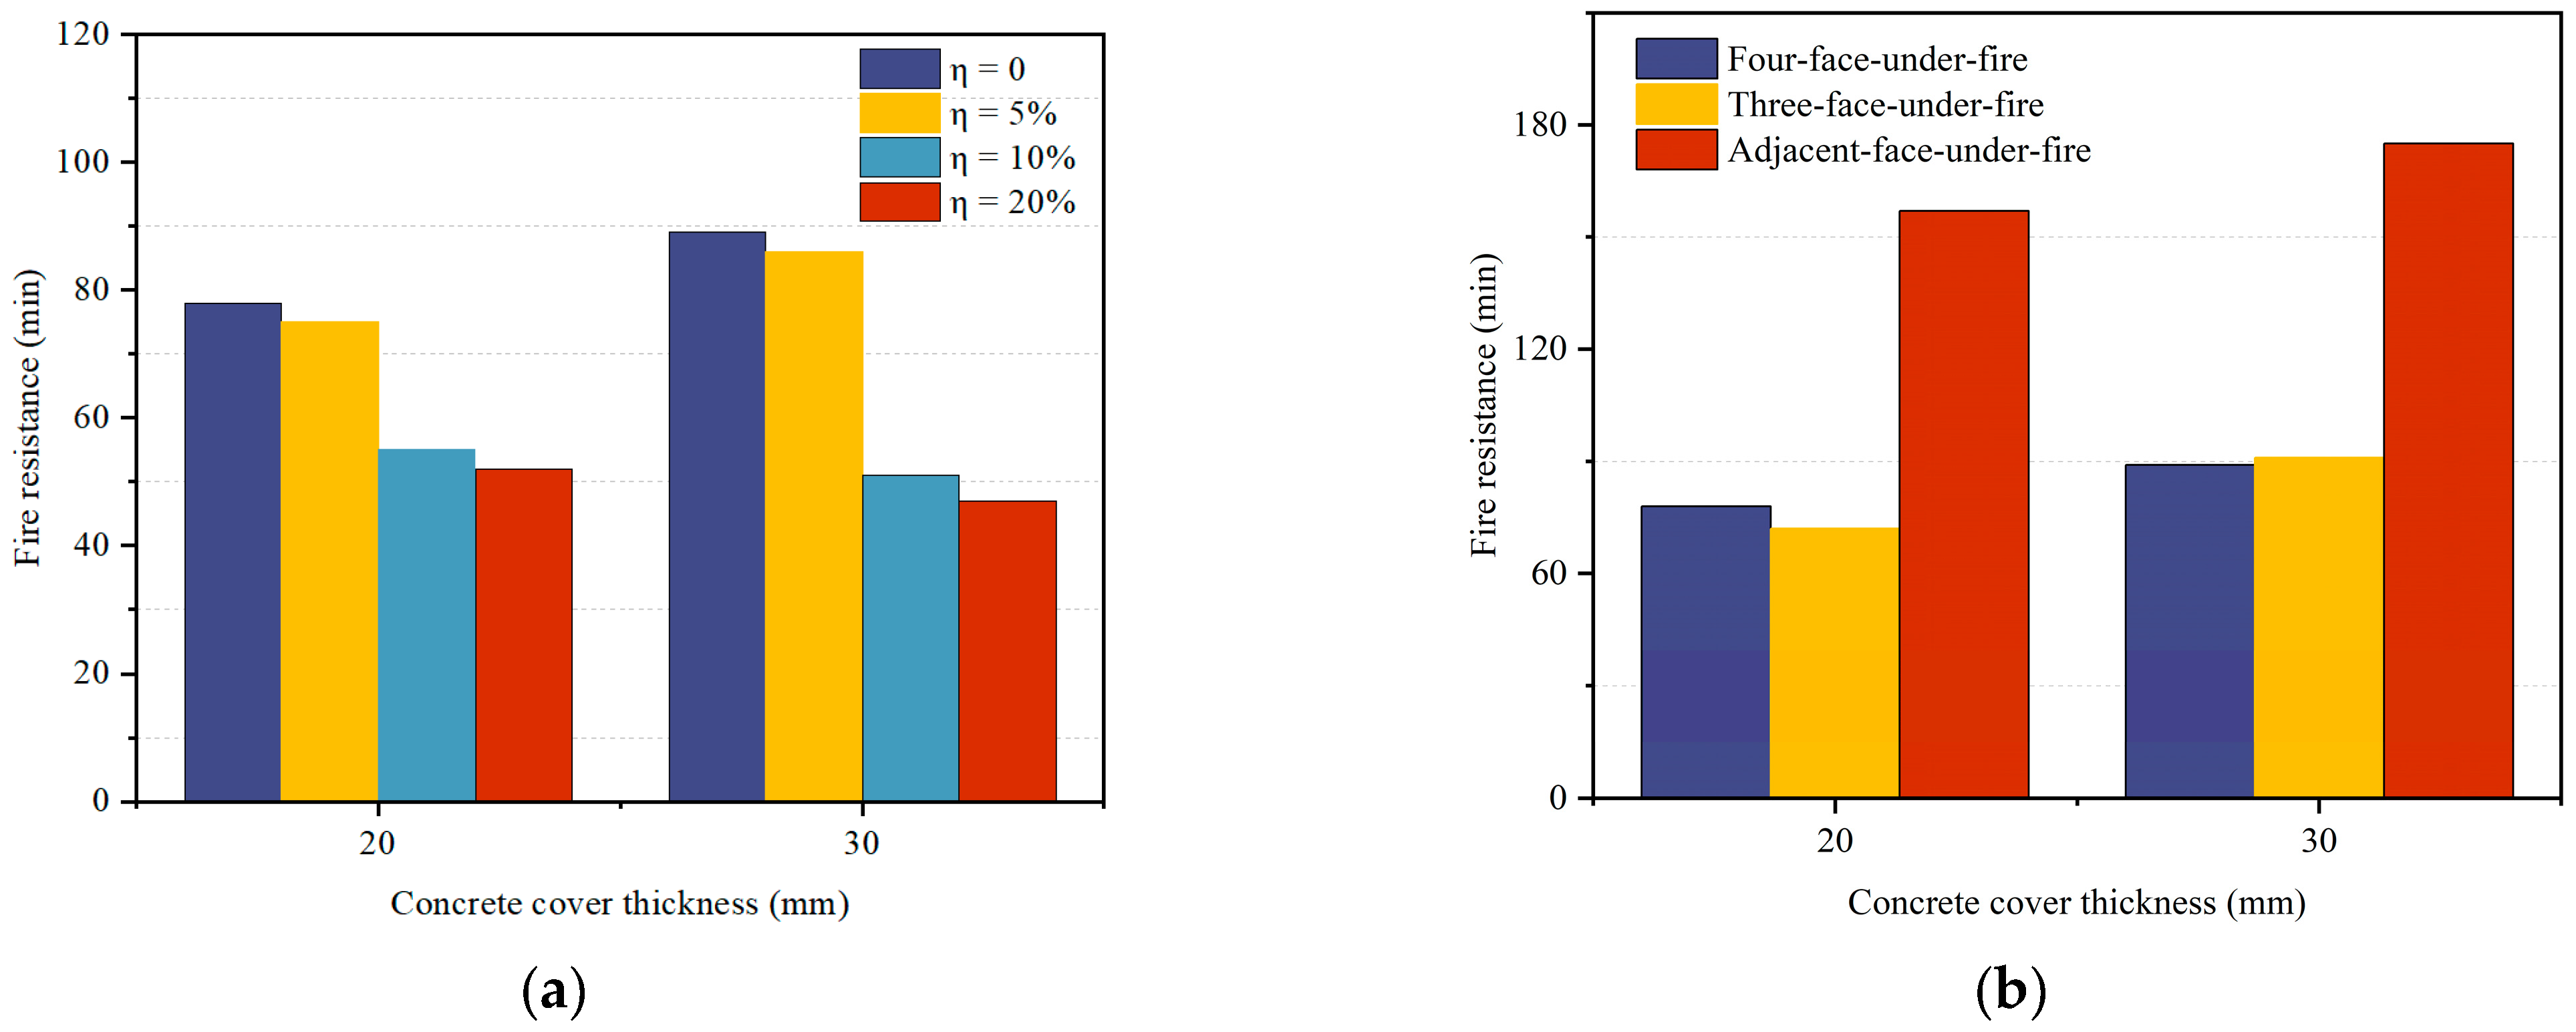
Figure 10 and Figure 11 illustrate the variations in fire resistance of concrete columns with different corrosion degrees. The figures indicate that when the corrosion degree is low and the concrete cover remains intact, the impact of steel rebar corrosion on the fire resistance of concrete columns is minimal. Severe corrosion (η ≥ 10%) has the most significant effect on the fire resistance of columns exposed to fire on adjacent sides, with a 56% reduction in fire resistance. Moreover, as the number of fire-exposed sides increases, the impact of corrosion on the fire resistance of concrete columns becomes greater. For columns with a concrete cover thickness of 20 mm affected by corrosion, the fire resistance performance is impacted, with a 33% reduction in fire resistance. In comparison, with a 30 mm concrete cover, severe corrosion leads to a 47% reduction in fire resistance. It is evident that severe corrosion has a more detrimental effect on concrete columns with a 30 mm concrete cover thickness. The reason is that the damage due to rust expansion and cracking is relatively less severe in concrete with a 20 mm concrete cover thickness.
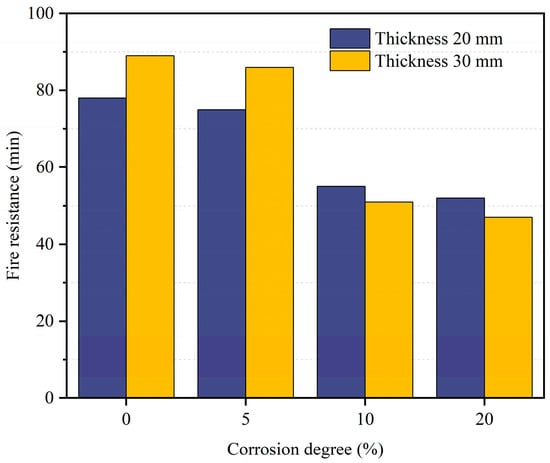
Figure 10.
Fire resistance of the corroded reinforced concrete columns with different concrete cover thicknesses.

Figure 11.
Fire resistance of the corroded reinforced concrete columns with different fire boundaries.
3.2. Influence of Concrete Compression Strength
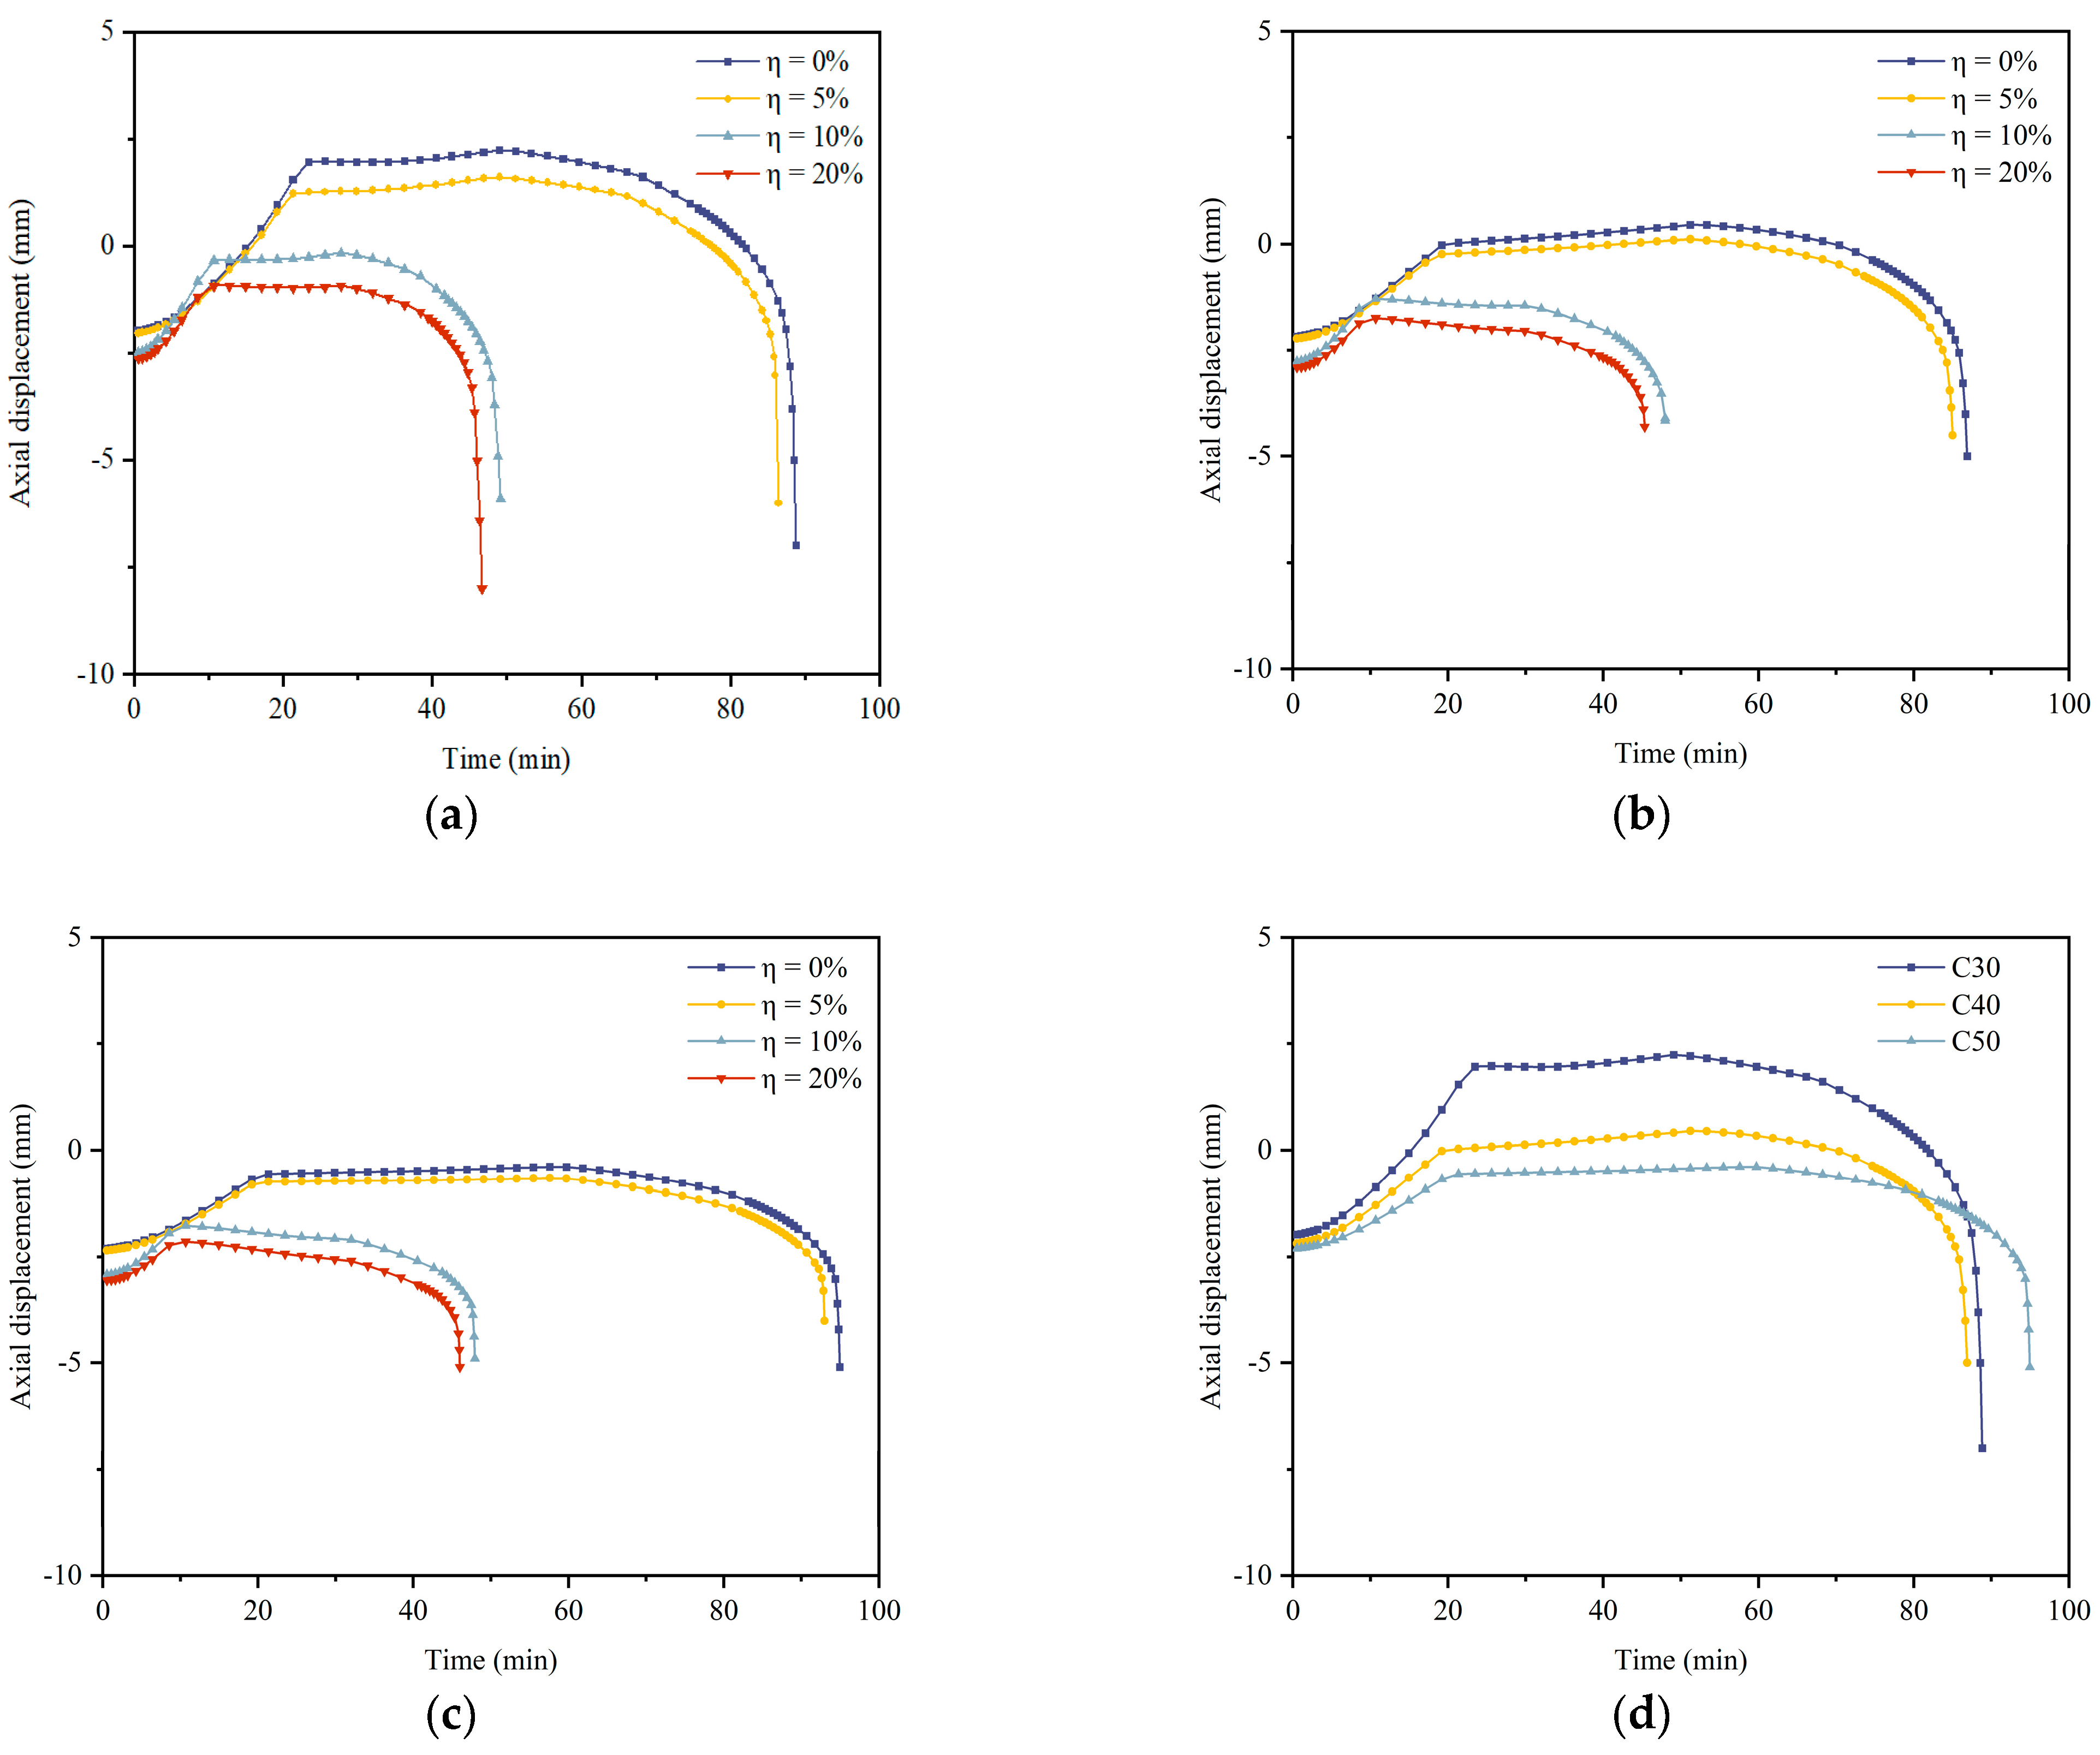
Figure 12a–d depict the time–axial displacement curves for concrete columns with different strengths (C30, C40, C50) and a concrete cover thickness of 30 mm. As the concrete strength increases, the curves become flatter, transitioning from three stages to two stages. This flattening is primarily due to the decrease in concrete’s deformation capacity with the increased strength. Figure 12d reveals that with higher concrete strength, the axial displacement caused by thermal expansion is reduced. For instance, the displacement due to thermal expansion for C30 concrete is 2.6 mm greater than that for C50 concrete. This reduction in expansion deformation capacity is mainly due to the larger loads applied to high-strength concrete at the same axial compression ratio, which suppresses the concrete’s ability to expand. Tan [32] also reached the same conclusion through their experiments.
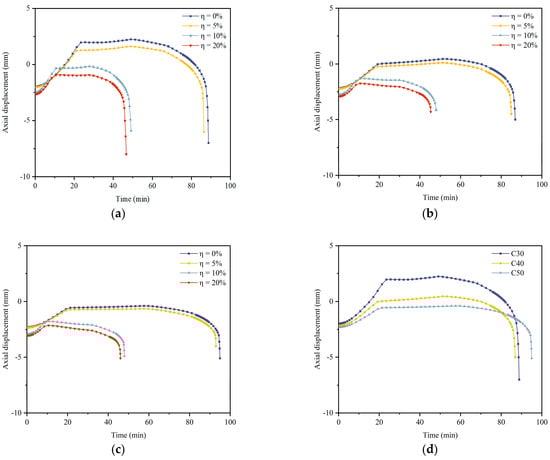
Figure 12.
Axial displacement–time curves of the reinforced concrete columns with different concrete strengths and 30 mm thick concrete cover: (a) C30; (b) C40; (c) C50; (d) comparison of axial displacement–time curves of the uncorroded reinforced concrete columns with different concrete strengths.
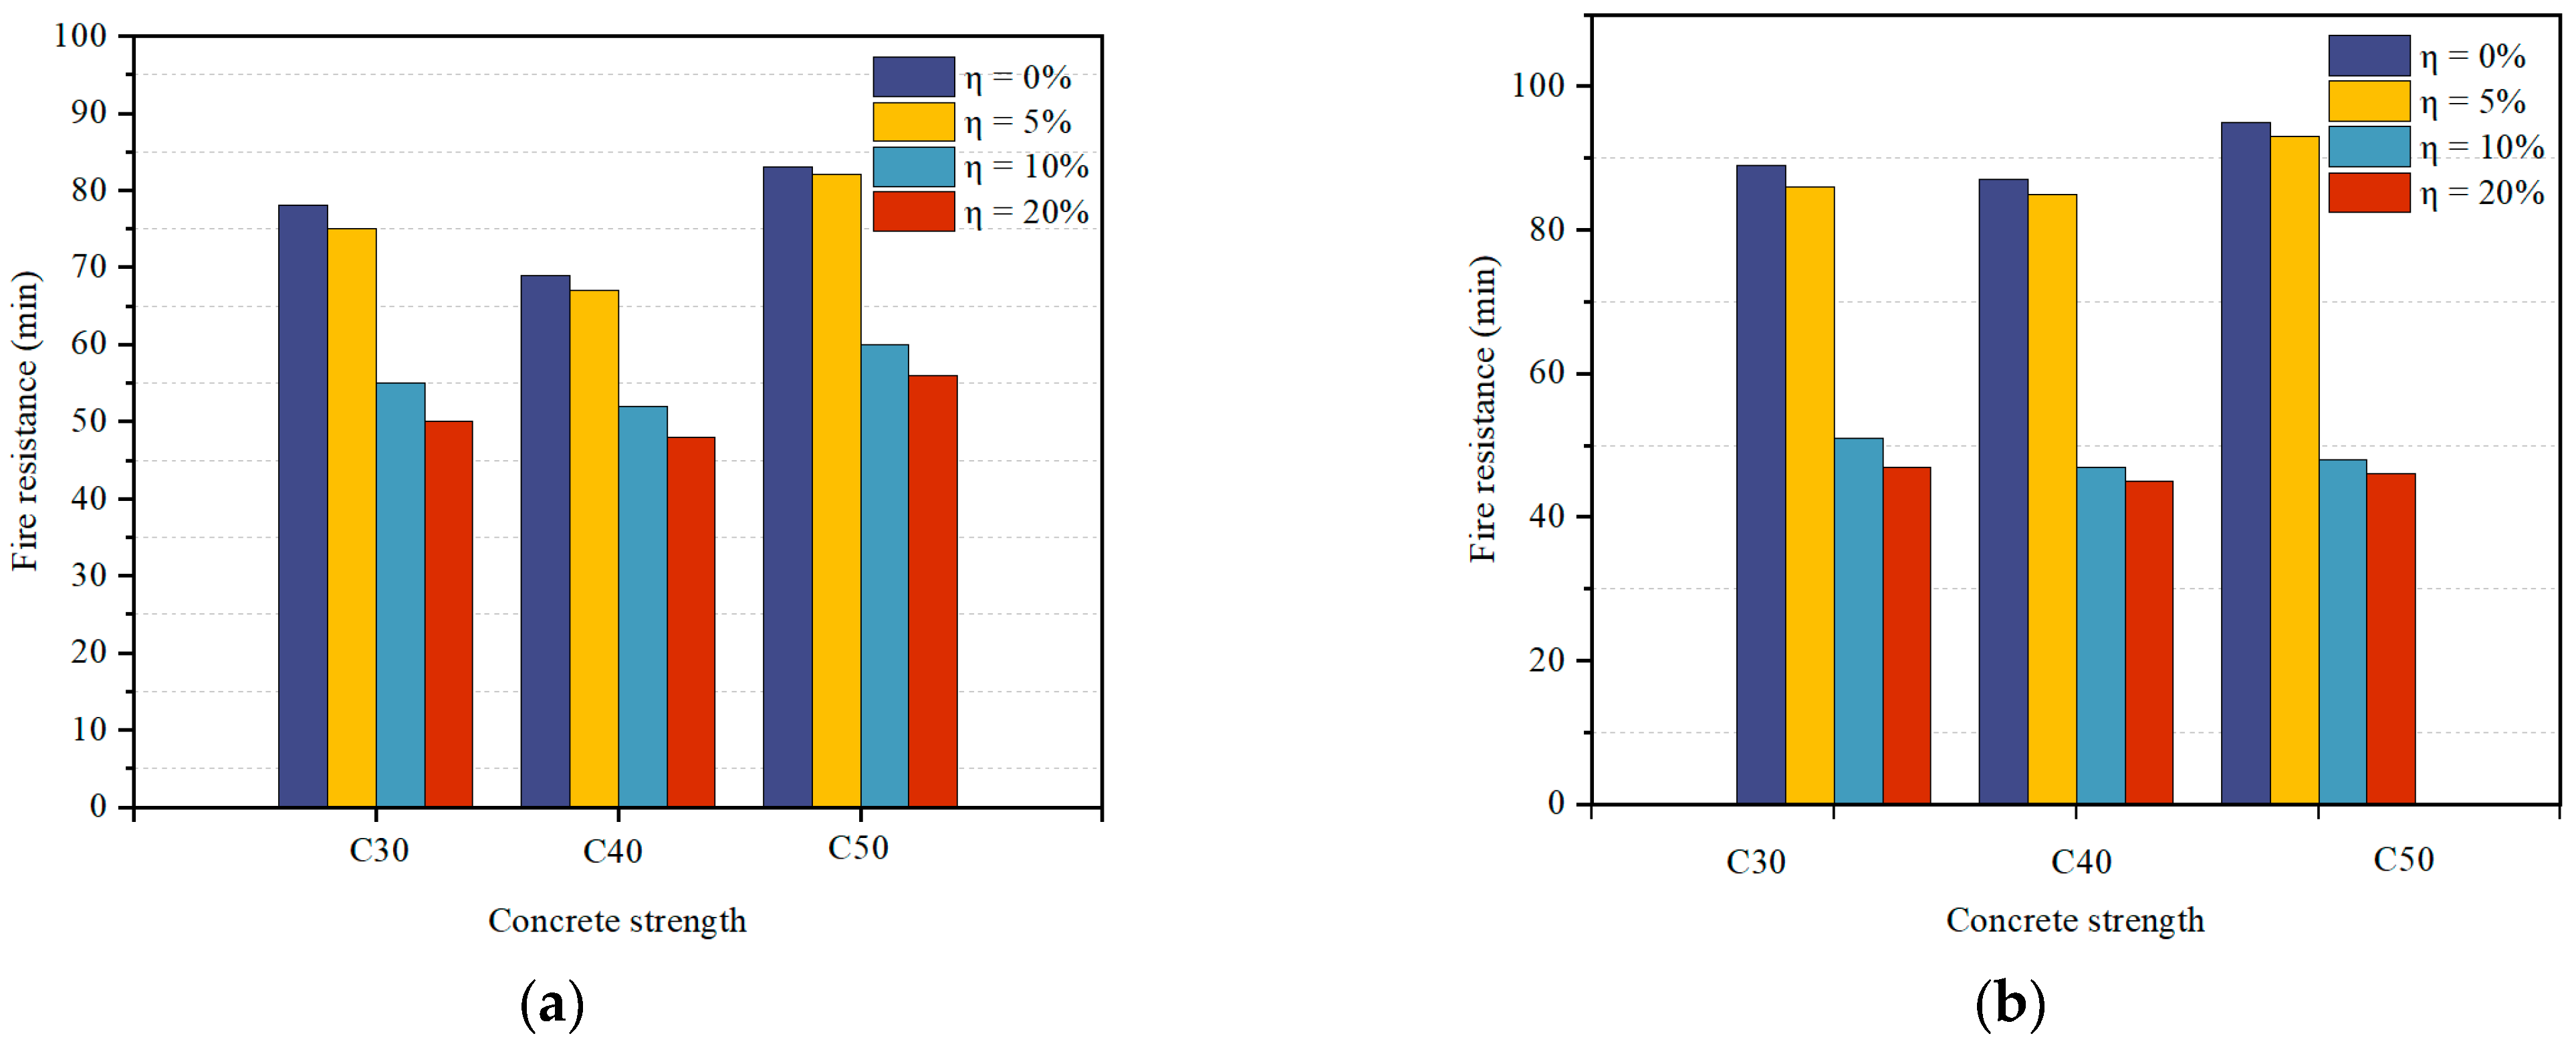
The influence of concrete strength on the fire resistance of concrete columns is shown in Figure 13. As can be seen from the figure, for a concrete cover thickness of 20 mm, increasing the concrete strength can mitigate the weakening effect of corrosion on the column’s fire resistance. For instance, a column with a concrete strength of C30 experiences a 36% reduction in fire resistance after corrosion, while a column with a strength of C40 sees a 25% reduction. For a concrete cover thickness of 30 mm, the fire resistance of uncorroded columns is enhanced with the increased concrete strength, mainly because higher concrete strength can enhance the ultimate load-bearing capacity of the column section. However, under severe corrosion conditions, an increase in concrete strength actually leads to a reduction in fire resistance, which is mainly related to the large-scale spalling of the concrete cover.
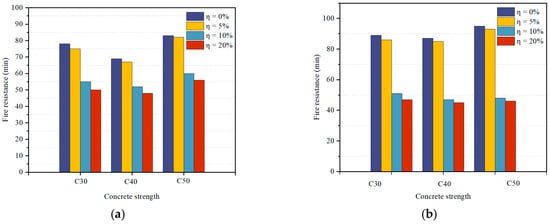
Figure 13.
Fire resistance of the corroded reinforced concrete columns with different concrete strengths: (a) 20 mm-thick concrete cover; (b) 30 mm-thick concrete cover.
3.3. Influence of Concrete Cover Thickness
Figure 14 is a comparative diagram of the temperature field in the cross section of columns under different concrete cover thicknesses. By comparing Figure 14a,b, it can be found that for uncorroded columns, the increase in the thickness of the concrete cover can effectively limit the rate of temperature rise at the location of rebar at measurement point 2, with a maximum temperature difference of 110 °C. However, under severe corrosion, the temperature at measurement point 2 is significantly reduced compared to the uncorroded state, with a maximum temperature difference of 90 °C. This indicates that corrosion weakens the protective effect of the concrete layer on the rebar, accelerating the rate of temperature rise in the rebar and reducing the fire resistance of the concrete column.
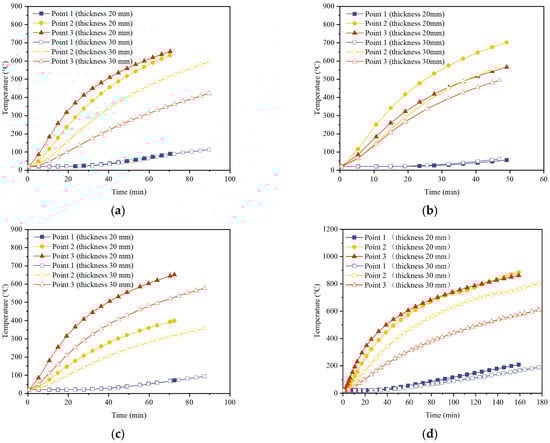
Figure 14.
Temperature fields of the reinforced concrete columns with different fire boundaries: (a) uncorroded columns with 4 sides under fire; (b) corroded columns with 4 sides under fire; (c) corroded columns with 3 sides under fire; (d) corroded columns with 2 adjacent sides under fire.
Comparing Figure 14a,c,d, it is observed that the increase in the thickness of the concrete cover most notably slows down the rate of temperature rise at the measurement points of the concrete column exposed to fire on all four sides. Moreover, comparing the duration of the temperature rise curves at the measurement points under three different fire exposure methods—on all four sides, three sides, and two adjacent sides—it is found that when the thickness of the concrete cover increases from 20 mm to 30 mm, the fire resistance increases by 12%, 20%, and 10%, respectively. This demonstrates that an increase in the thickness of the concrete cover does enhance the fire resistance of concrete columns to a certain extent.
Figure 15 presents the time–axial displacement curves for concrete columns under different concrete cover thicknesses (20 mm and 30 mm). For uncorroded columns, the overall axial displacement curves under different fire exposure conditions for the 30 mm concrete cover thickness cases last longer than those for the 20 mm concrete cover thickness cases. Moreover, during the initial stages of a fire, the rate of axial deformation for the former is slower compared to the latter, indicating that the thickening of the concrete cover has a significant effect on enhancing the fire resistance of concrete columns.
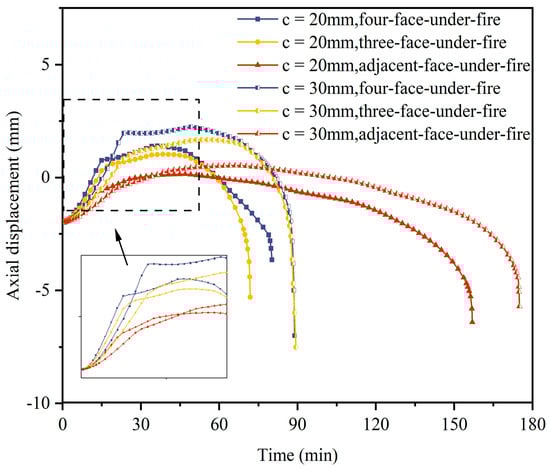
Figure 15.
Time–axial displacement curves of the reinforced concrete columns with different concrete cover thicknesses.
The concrete cover can effectively delay the weakening effect of high temperatures on the performance of steel bars, ensuring that the steel bars do not lose their load-bearing capacity rapidly under high temperatures [33]. The impact of the thickness of the concrete cover on the fire resistance of concrete columns is shown in Figure 16. It can be seen from the figure that increasing the thickness of the concrete cover does not provide effective protection for columns with severe corrosion. For uncorroded columns, however, increasing the thickness of the concrete cover can effectively extend their fire resistance. The fire resistance increases by 12%, 20%, and 10%, respectively, for columns exposed to fire on all four sides, three sides, and two adjacent sides.

Figure 16.
Fire resistance of the reinforced concrete columns with different concrete cover thicknesses: (a) four column faces to fire for different corrosion degrees; (b) different fire exposures.
3.4. Influence of Fire Exposure Model
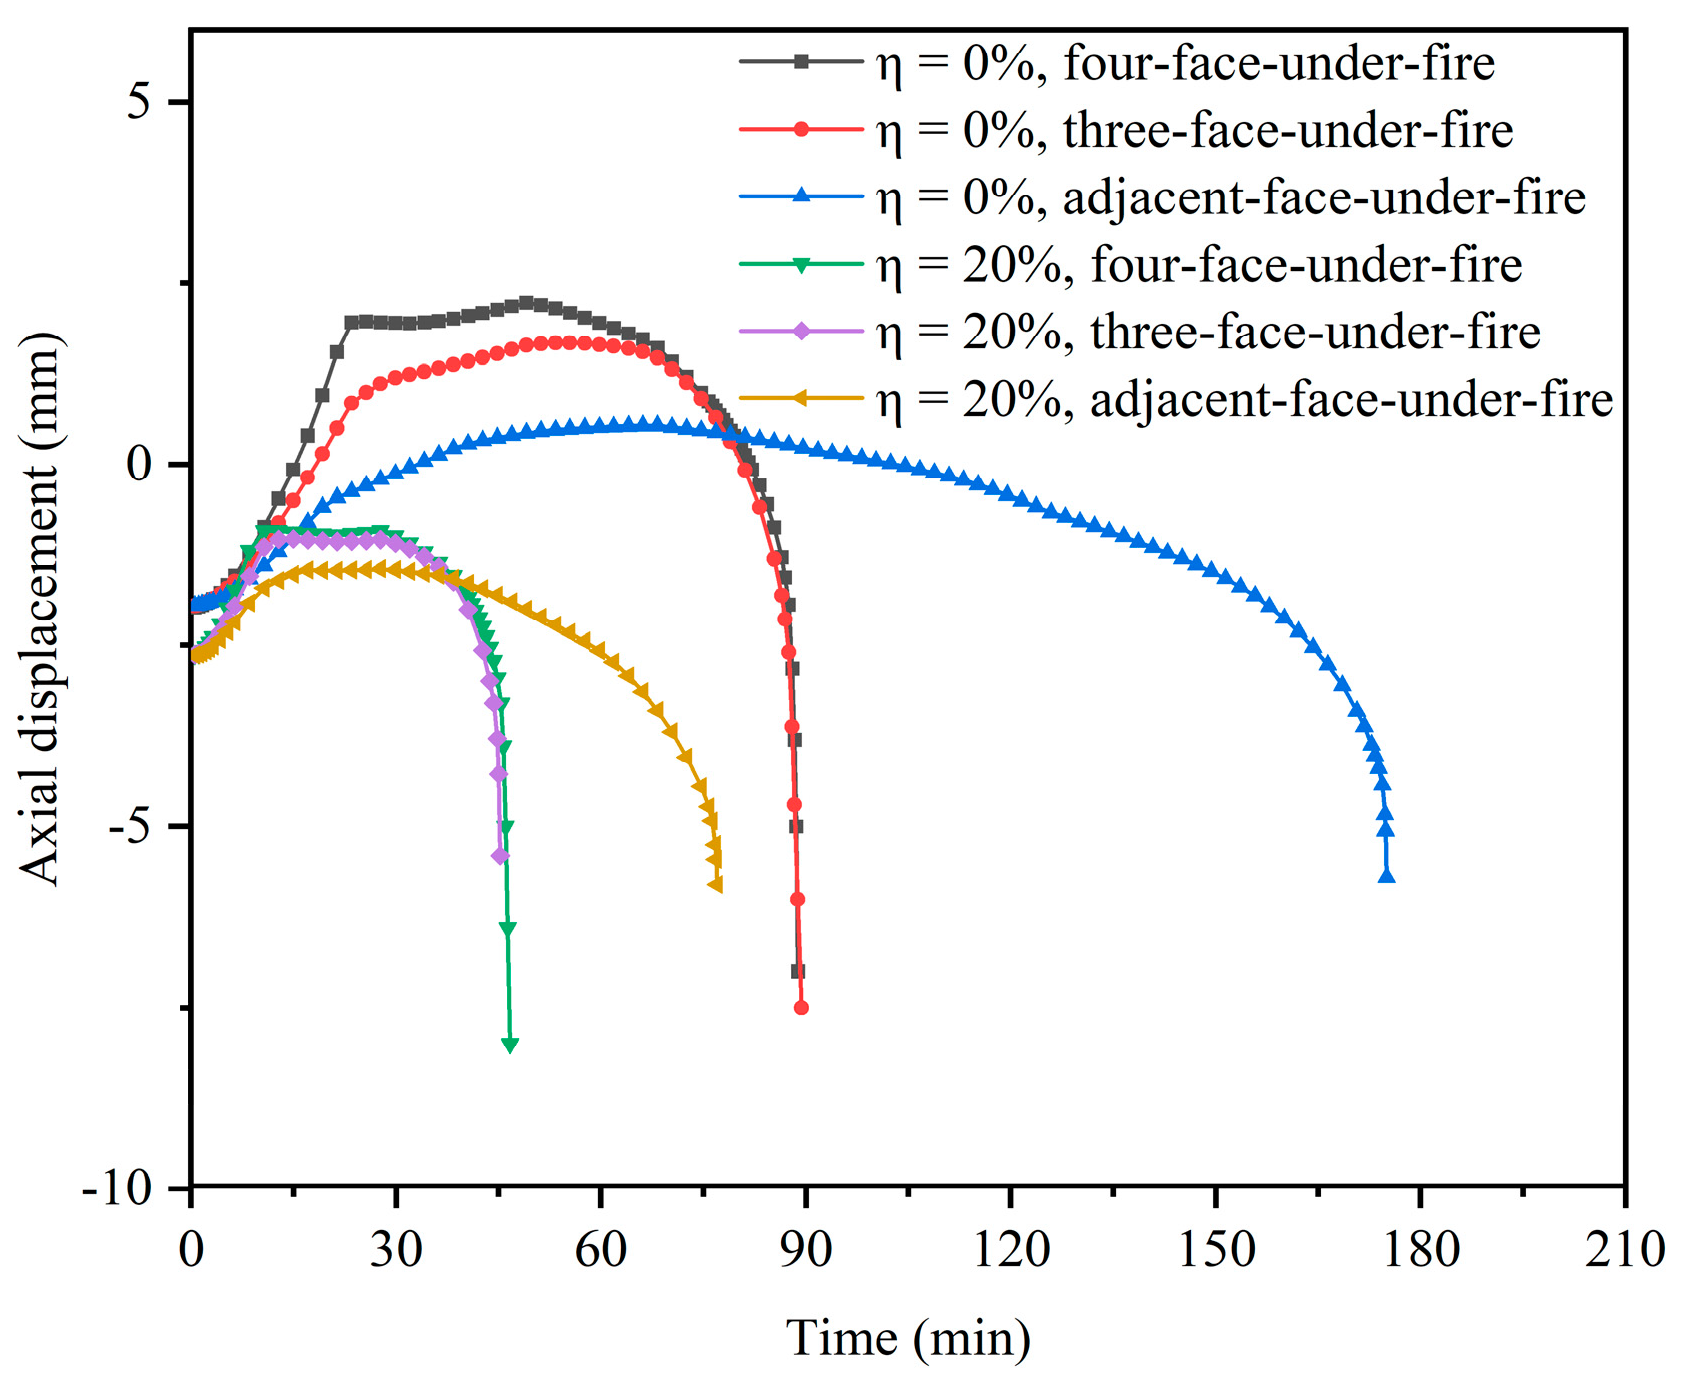
Figure 17 shows the axial displacement–time curves of concrete under different fire exposure conditions. It can be observed that as the number of exposed sides decreases, the positive axial displacement caused by the expansion of concrete also diminishes. Corrosion significantly reduces the duration of the time–axial displacement curves, and the resulting cross-sectional damage leads to a decline in deformation capacity. However, the axial development trends of both uncorroded and severely corroded conditions are similar.
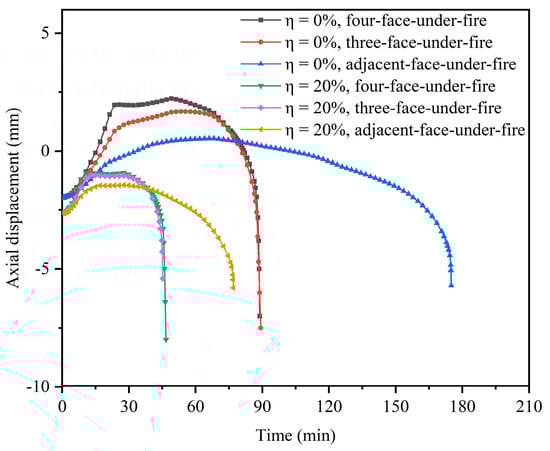
Figure 17.
Axial displacement–time curves of the reinforced concrete columns with 30 mm-thick concrete cover under different types of fire exposure.
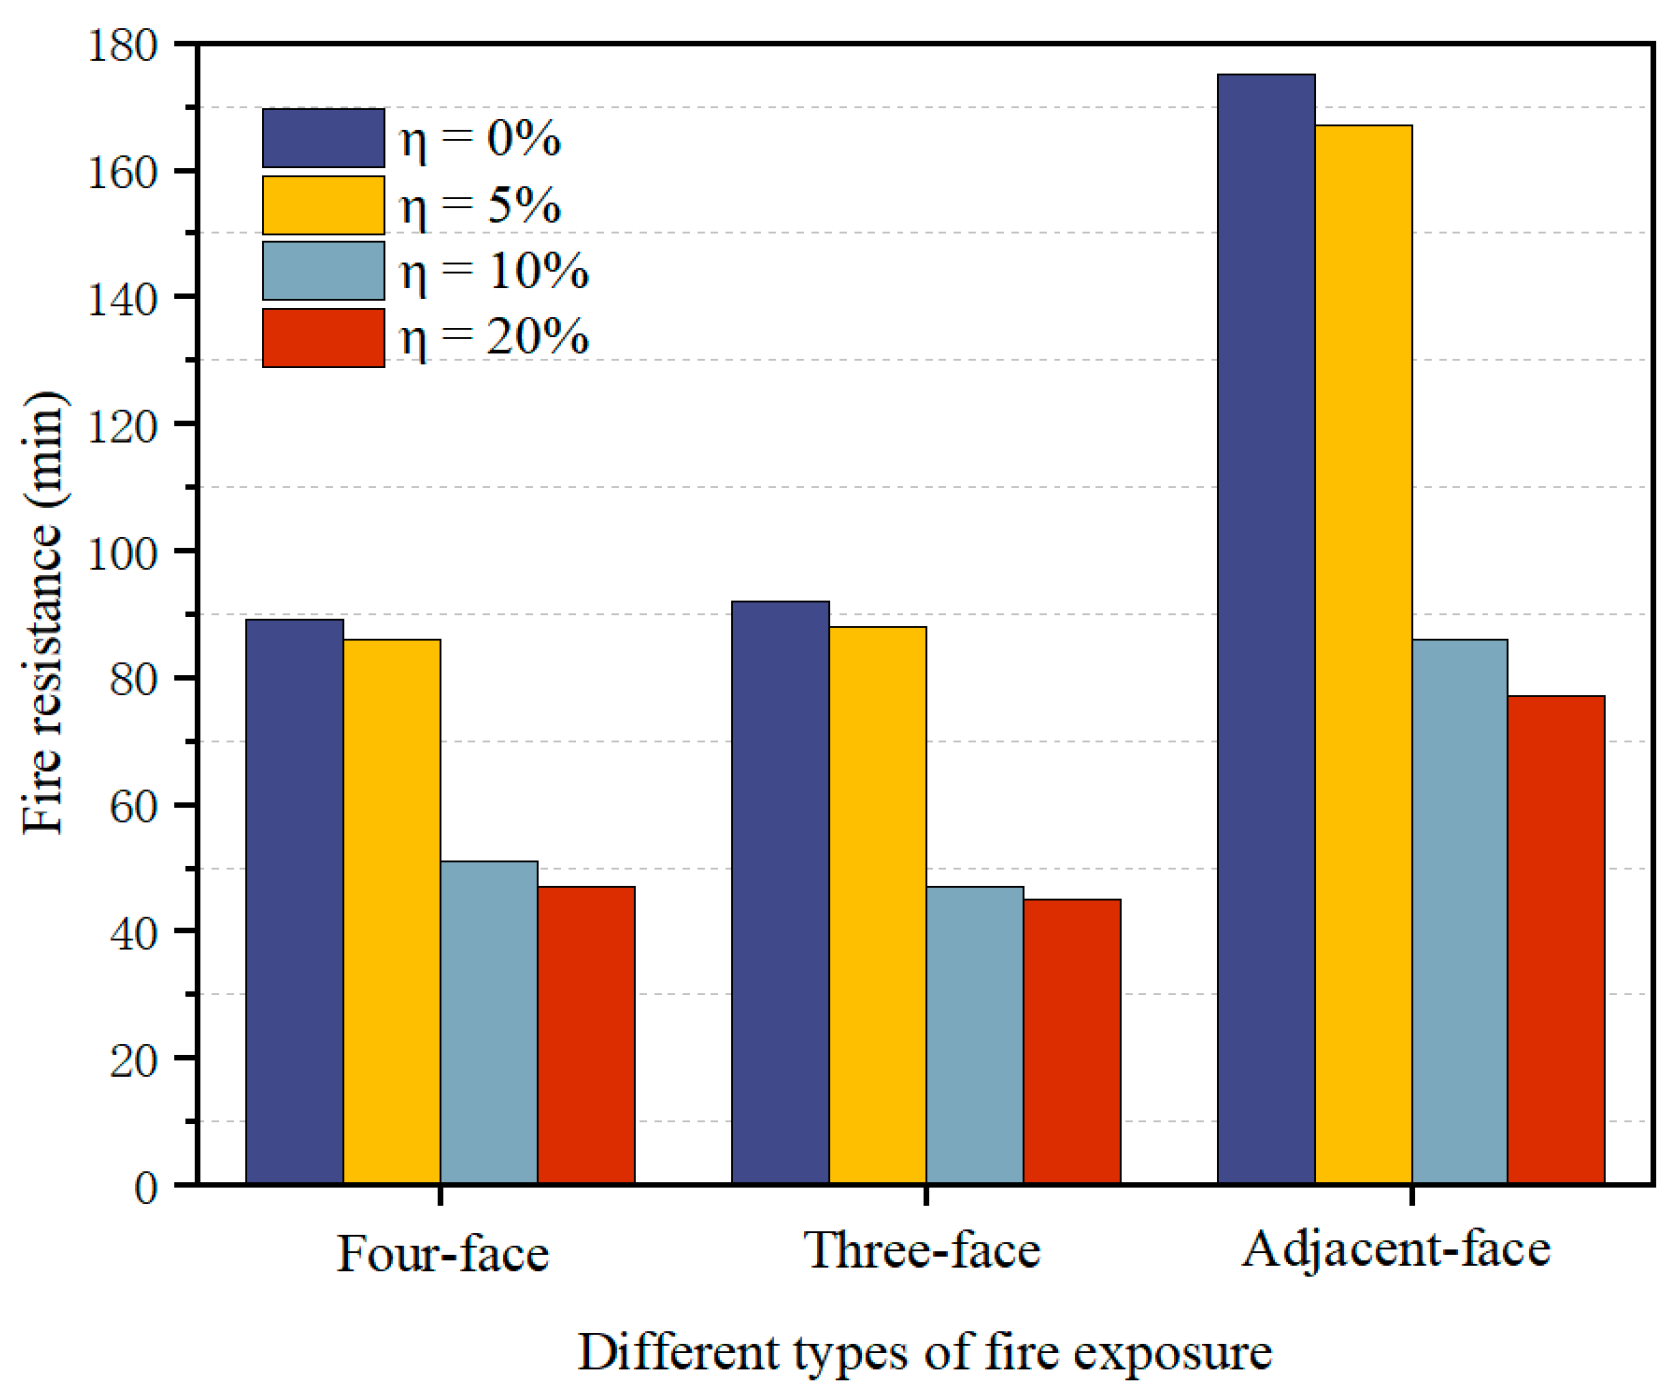
The impact of the fire exposure method on the fire resistance of concrete columns is illustrated in the following figure. In Figure 18, it can be seen that for columns with minor corrosion, the fire resistance is reduced by up to 5% under three different fire exposure methods. However, for columns with severe corrosion, the fire resistance performance decreases by 47%, 51%, and 56%, respectively, when exposed to fire on all four sides, three sides, and two adjacent sides. The adverse effects of corrosion intensify as the number of fire-exposed sides decreases. For uncorroded concrete columns, the fire resistance increases as the number of fire-exposed sides decreases [24]. The slightly lower fire resistance of columns exposed to fire on three sides with a 20 mm concrete cover compared to those exposed on all four sides with the same concrete cover thickness may be due to the fact that under uneven fire exposure, axially loaded specimens are actually in an eccentric compression state [34]. As the deflection of the concrete column begins to increase, the tensile properties of the rebars play an important role, but the thinner concrete cover has limited effectiveness. Therefore, when the concrete cover thickness is 30 mm, the fire resistance of columns exposed to fire on three sides is greater than that of columns exposed on all four sides. For columns exposed to fire on adjacent sides, high temperatures severely weaken only one rebar, not causing significant lateral deformation on one side.
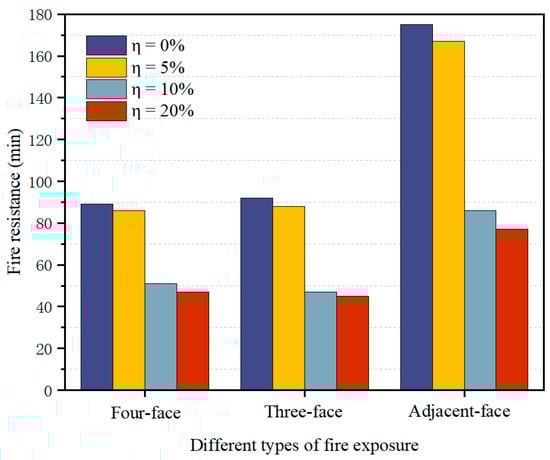
Figure 18.
Fire resistance of the reinforced concrete columns with a 30 mm-thick concrete cover under different fire exposures.
For uncorroded concrete columns, the fire resistance increases as the number of fire-exposed sides decreases. The slightly lower fire resistance of columns exposed to fire on three sides with a 20 mm concrete cover compared to those exposed on all four sides with the same concrete cover thickness may be due to the fact that under uneven fire exposure, axially loaded specimens are actually in an eccentric compression state. As the deflection of the concrete column begins to increase, the tensile properties of the rebar play an important role, but the thinner concrete cover has limited effectiveness. Therefore, when the concrete cover thickness is 30 mm, the fire resistance of columns exposed to fire on three sides is greater than that of columns exposed on all four sides. For columns exposed to fire on adjacent sides, high temperatures severely weaken only one rebar, not causing significant lateral deformation on one side.
4. Simplified Calculation Method for Fire Resistance
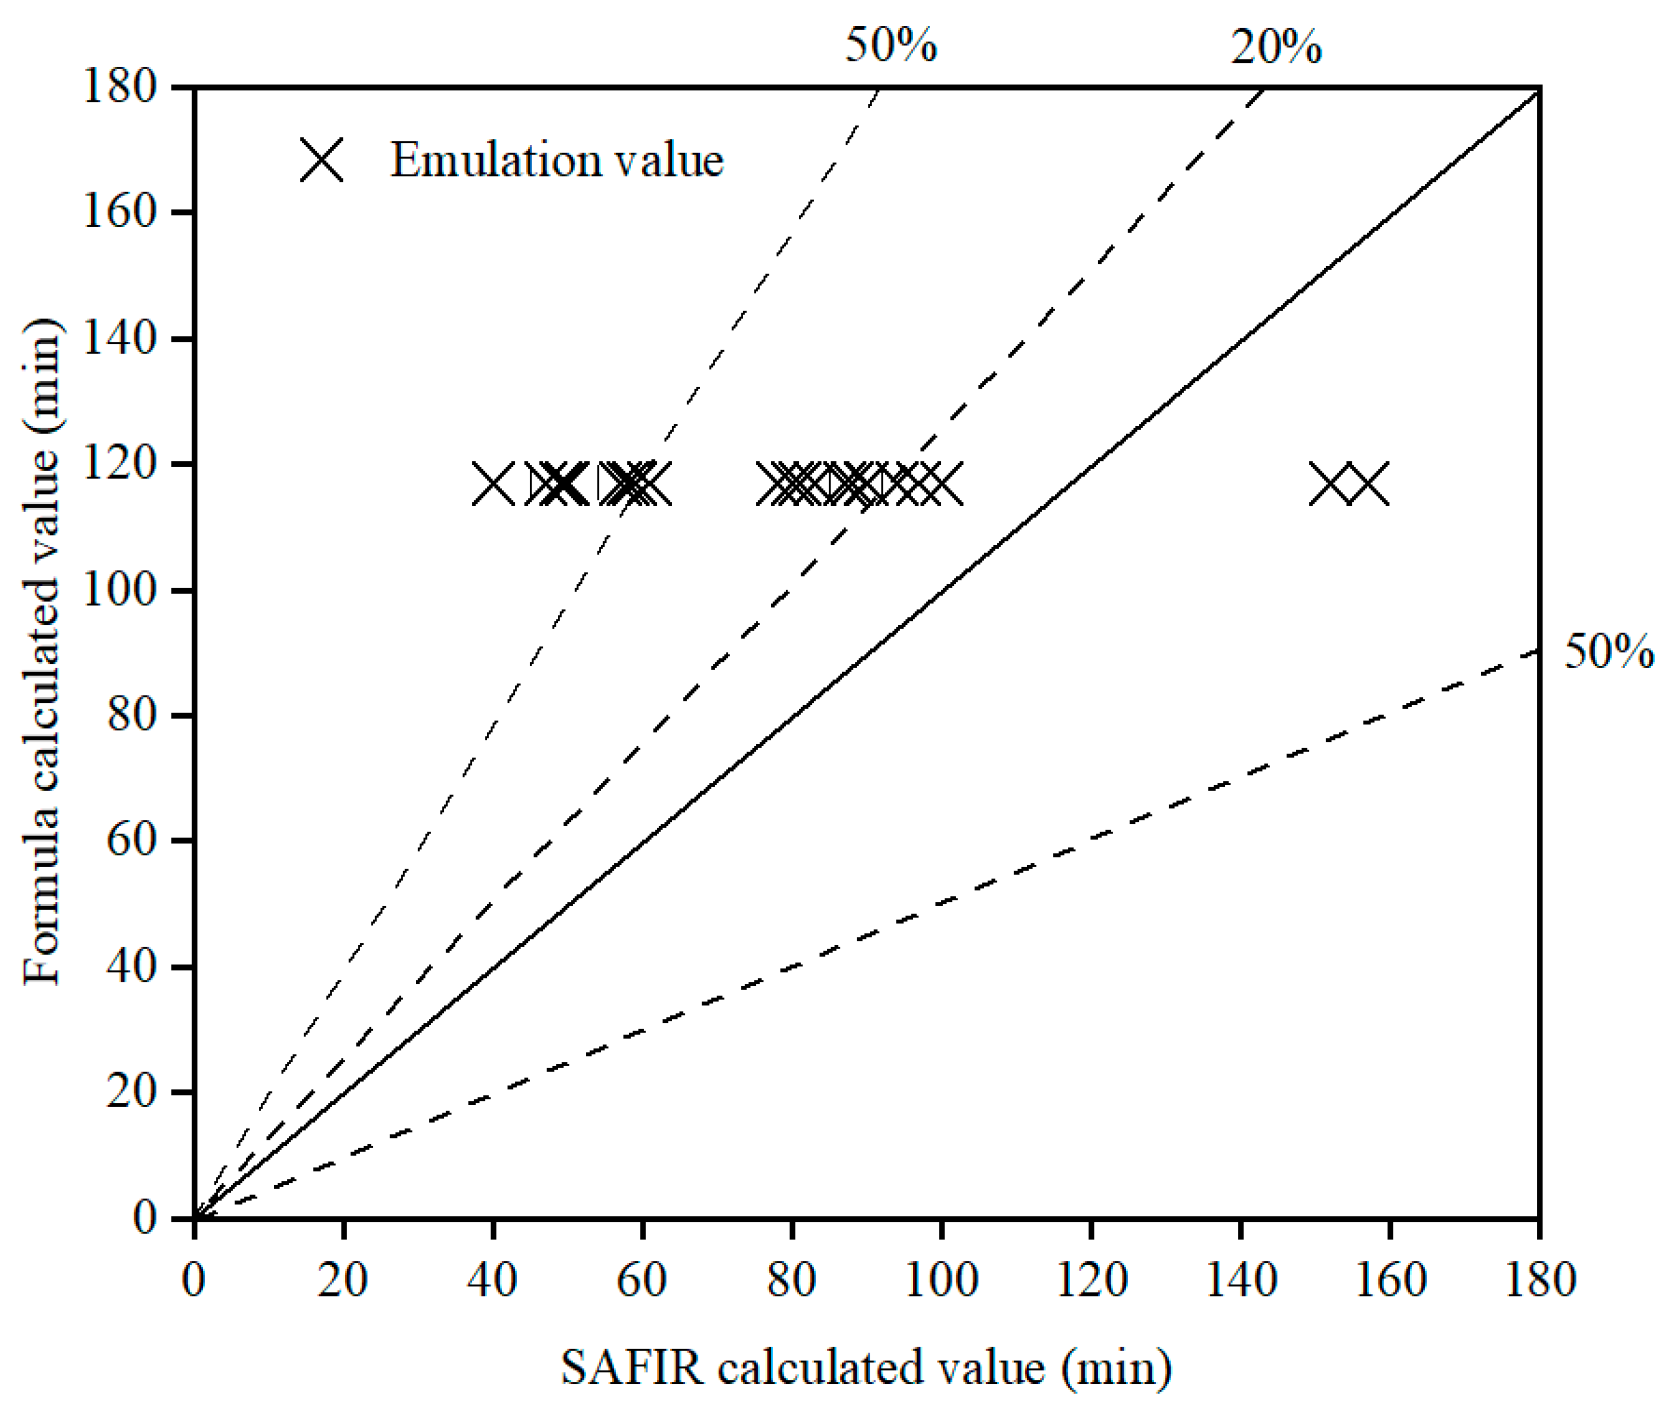
Equations (10) and (11) are the simplified calculation methods for fire resistance proposed by Wu [19], and Figure 19 presents a comparison of the fire resistance calculated by this method and the data obtained from SAFIR simulations. It can be seen from the figure that factors such as steel reinforcement corrosion, concrete cover thickness, concrete strength, and the method of fire exposure have significant impacts on the fire resistance performance of concrete. When assessing the fire resistance performance of reinforced concrete columns, it is necessary to consider more influencing factors.
Here, R0 is the fire resistance in minutes, a is the size of the cross section of the specimen in meters, ρ is the reinforcement ratio, and n is the axial compression ratio.
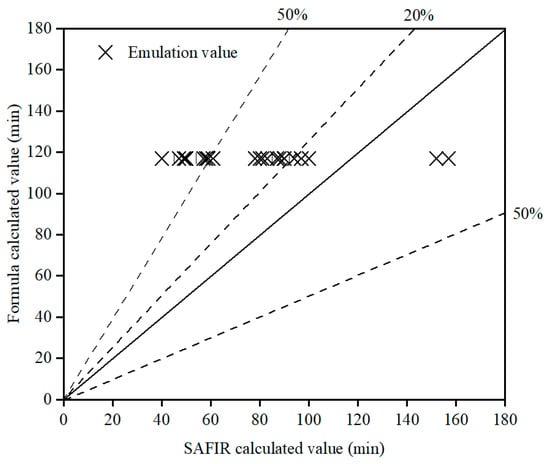
Figure 19.
Comparison of the calculated results from the literature [18] and SAFIR.
After organizing and analyzing the calculation results of the aforementioned 72 cases, the fire resistance of reinforced concrete columns is revised by introducing the corrosion influence coefficient β1, the fire exposure influence coefficient β2, and the material strength and concrete cover thickness influence coefficient β3 to modify the above formulas.
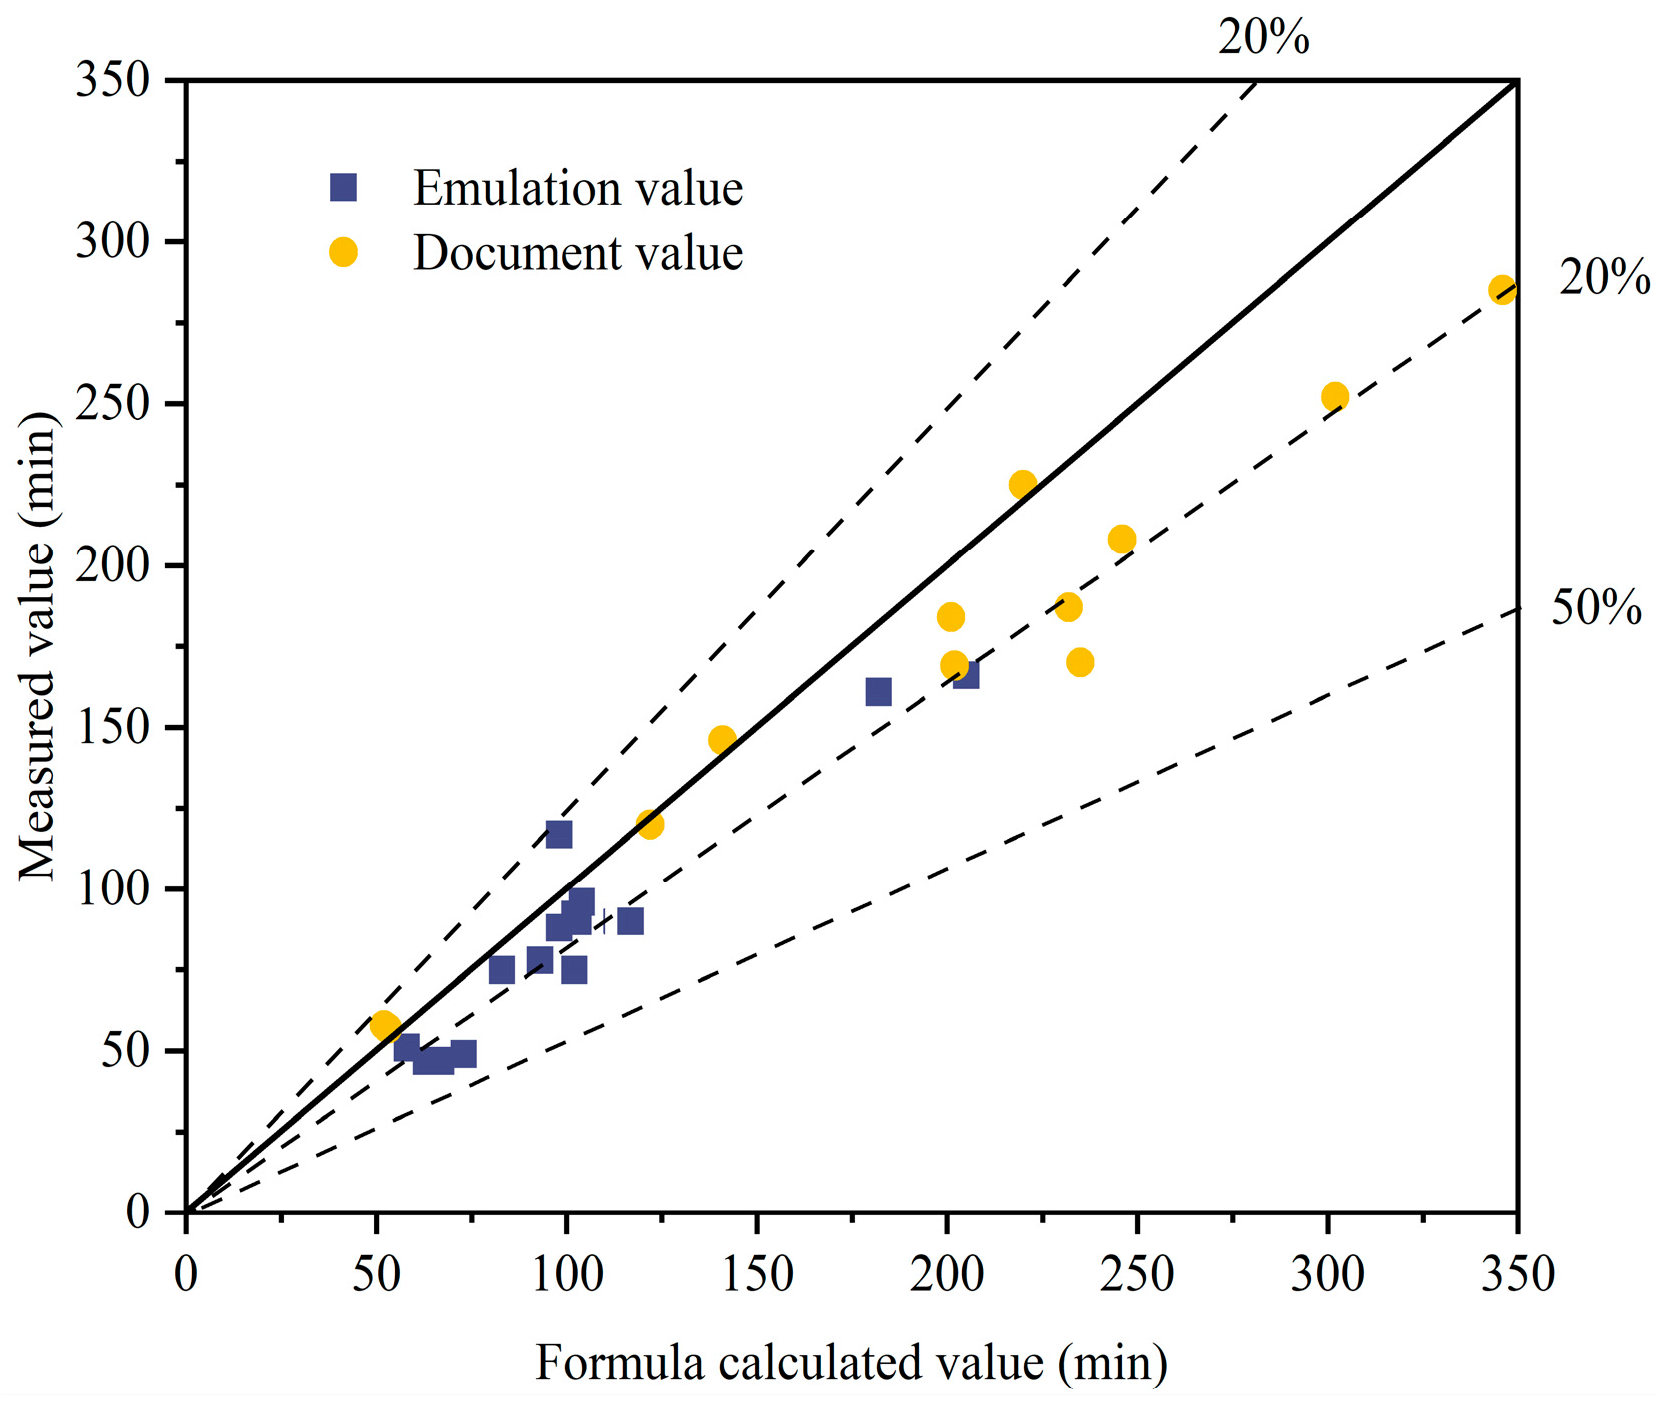
Figure 20 presents a comparison between the SAFIR simulation results and the experimental data from [35,36,37] against the outcomes of the revised calculation method. The figure demonstrates that the fire resistance obtained from the revised calculation method generally shows good agreement and tends to be on the conservative side.
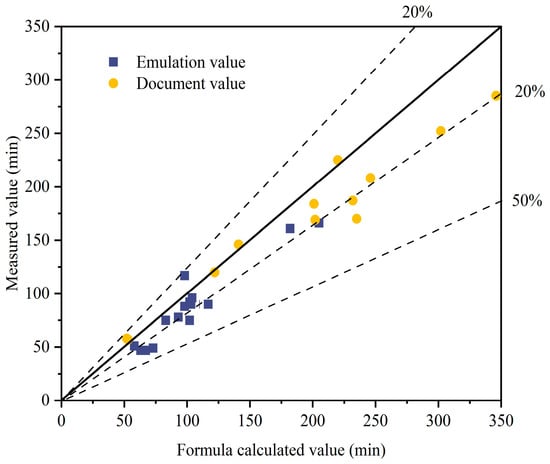
Figure 20.
Comparison of the results using the simplified calculation method and the experimental results.
5. Conclusions
Research on the fire resistance of existing corroded reinforced concrete structures holds significant engineering application value. This study highlights the need to be vigilant about the adverse effects of reinforcement corrosion on the fire resistance of concrete structures that may be exposed to high temperatures or fire while in service. The specific conclusions are as follows.
- Corrosion of reinforcement causes the concrete cover to spall and the reinforcement’s performance to degrade, and this hastens the rate at which the reinforcement reaches its failure temperature and the axial deformation rate. This significantly diminishes the fire resistance of concrete columns, with a potential reduction in fire resistance by up to 47% in cases of severe corrosions.
- Concrete strength influences the rate of deformation of concrete columns under high temperatures, with the axial deformation rate decreasing as the concrete strength increases. Enhanced concrete strength can improve the fire resistance of uncorroded concrete columns and mitigate the detrimental effects of corrosion when the concrete cover is thin. Increasing the thickness of the concrete cover can effectively slow the degradation of reinforcement performance at high temperatures, markedly extending the fire resistance of concrete columns by as much as 23%.
- The fire resistance of concrete columns increases as the fire-exposed surface area decreases. For severely corroded concrete columns, a smaller fire-exposed surface area exacerbates the negative impact of corrosion on fire resistance, leading to a maximum decrease of 56%.
- Introducing the corrosion influence coefficient, the fire exposure influence coefficient, and the material strength and concrete cover thickness influence coefficients, a practical calculation method for the fire resistance of reinforced concrete columns in marine environments has been proposed. This method demonstrates good accuracy and can act as a supplement to existing fire protection standards.
- Considering the impact of concrete spalling at high temperatures on the fire resistance of concrete columns, the uneven corrosion of reinforcement may cause failure of concrete columns at positions other than the maximum stress points. Additionally, the fire resistance of eccentrically loaded corroded columns, which are common in actual engineering, requires further study.
Author Contributions
Conceptualization, Y.J.; methodology, G.B. and H.D.; formal analysis, J.Z.; investigation, G.B.; writing—original draft preparation, W.W.; writing—review and editing, G.B.; supervision, H.D.; funding acquisition, G.B. All authors have read and agreed to the published version of the manuscript.
Funding
This research was funded by [National Natural Science Foundation of China] grant number [51708319].
Data Availability Statement
The data presented in this study are available on request from the corresponding author.
Conflicts of Interest
Author Weijian Wu is employed by the Huaneng (Fujian) Energy Development Co., Ltd. Author Hongchao Dai is employed by the Shanghai Housing Quality Inspection Station Co., Ltd. The remaining authors declare that the research was conducted in the absence of any commercial or financial relationships that could be construed as a potential conflict of interest.
References
- Fuhaid, A.F.A.; Niaz, A. Carbonation and corrosion problems in reinforced concrete structures. Buildings 2022, 12, 586. [Google Scholar] [CrossRef]
- Chen, H.P.; Jiang, Y.; Li, W.B. Residual load-bearing capacity of corroded reinforced concrete columns with an annular cross-section. Ocean Eng. 2023, 286, 115519. [Google Scholar] [CrossRef]
- Li, C.Q.; Zheng, J.J.; Lawanwisut, W.; Melchers, R.E. Concrete delamination caused by steel reinforcement corrosion. J. Mater. Civ. Eng. 2007, 19, 591–600. [Google Scholar] [CrossRef]
- Biondini, F.; Vergani, M. Deteriorating beam finite element for nonlinear analysis of concrete structures under corrosion. Struct. Infrastruct. Eng. 2015, 11, 519–532. [Google Scholar] [CrossRef]
- Zhang, W.P.; Ye, Z.W.; Gu, X.L. Effects of stirrup corrosion on shear behaviour of reinforced concrete beams. Struct. Infrastruct. Eng. 2017, 13, 1081–1092. [Google Scholar] [CrossRef]
- Yin, Z.; Jiang, B. Predicting equation of quasi-static and dynamic failures of steel columns under fire. Eng. Struct. 2023, 276, 115348. [Google Scholar] [CrossRef]
- Wang, M.; Lou, G.; Li, G.; Jiang, B. Experimental study on mechanical properties of Q690D high strength steel during the cooling stage of fire. Fire Saf. J. 2022, 132, 103639. [Google Scholar] [CrossRef]
- Zhu, J.; Zhang, C.; Yu, W. Compressive properties of self-compacting concrete after cooling from high temperatures. Buildings 2022, 12, 1875. [Google Scholar] [CrossRef]
- Ba, G.Z.; Liu, H.; Zhang, S.G.; Wang, J.H. Residual mechanical properties of corroded steel bars after high-temperature exposure. J. Mater. Civ. Eng. 2023, 35, 04023004. [Google Scholar] [CrossRef]
- Ba, G.Z.; Zhou, J.X.; Dong, M.C.; Liu, C.X.; Ma, Z.M. Residual behaviour of corroded reinforcements after high temperature exposure. Structures 2022, 45, 2162–2172. [Google Scholar] [CrossRef]
- Ba, G.Z.; Weng, X.Y.; Liu, C.W.; Miao, J.J. Bond strength of corroded reinforcements in concrete after high-temperature exposure. Constr. Build. Mater. 2021, 270, 121400. [Google Scholar] [CrossRef]
- Liu, C.W.; Yan, L.T.; Ba, G.Z.; Miao, J.J.; Liu, Y.C. Experimental evaluation of bond behavior between corroded reinforcing bars and concrete under elevated temperatures. J. Mater. Civ. Eng. 2023, 35, 04018209. [Google Scholar] [CrossRef]
- Yang, O.; Zhang, B.; Yan, G.R.; Chen, J. Bond performance between slightly corroded steel bar and concrete after exposure to high temperature. J. Struct. Eng. 2018, 144. [Google Scholar] [CrossRef]
- Mishra, L.; Sharma, U.K. Behaviour of deteriorated reinforced concrete columns under elevated temperatures. Fire Technol. 2024, 60, 1569–1607. [Google Scholar] [CrossRef]
- Chandra, S.; Sharma, U.K.; Green, M.; Gales, J.; Bhargava, P. Fire performance of corroded reinforced concrete columns. Fire Technol. 2023, 60, 2265–2295. [Google Scholar] [CrossRef]
- Ba, G.Z.; Miao, J.J.; Zhang, W.P.; Liu, J.L. Influence of reinforcement corrosion on fire performance of reinforced concrete beams. Constr. Build. Mater. 2019, 213, 738–747. [Google Scholar] [CrossRef]
- Sobhan, K.; Reddy, D.V.; Martinez, F. Fire resistance of corroded high-strength structural concrete. J. Struct. Fire Eng. 2021, 12, 17–34. [Google Scholar] [CrossRef]
- Tariq, F.; Bhargava, P. Flexural behaviour of corroded RC beams exposed to fire. Structures 2021, 33, 1366–1375. [Google Scholar] [CrossRef]
- Wu, B.; Hong, Z.; Tang, G.H.; Wang, C. Fire resistance of reinforced concrete columns with square cross section. Adv. Struct. Eng. 2007, 10, 353–369. [Google Scholar] [CrossRef]
- Gernay, T. Fire resistance and burnout resistance of reinforced concrete columns. Fire Saf. J. 2019, 104, 67–78. [Google Scholar] [CrossRef]
- Franssen, J.-M.; Gernay, T. Modeling structures in fire with SAFIR®: Theoretical background and capabilities. J. Struct. Fire Eng. 2017, 8, 300–323. [Google Scholar] [CrossRef]
- Kodur, V.; Raut, N. A simplified approach for predicting fire resistance of reinforced concrete columns under biaxial bending. Eng. Struct. 2012, 41, 428–443. [Google Scholar] [CrossRef]
- Kodur, V.K.R.; Raut, N.K. Design equation for predicting fire resistance of reinforced concrete columns. Struct. Concr. 2009, 10, 73–86. [Google Scholar] [CrossRef]
- Fellah, F. Comparative study of calculation models for the fire resistance of hollow steel columns filled with concrete. Period. Polytech. Civ. Eng. 2020, 64, 169–187. [Google Scholar] [CrossRef]
- GB 50016-2014; Code for Fire Protection Design of Buildings. Ministry of Housing and Urban-Rural Development of the People’s Republic of China: Beijing, China, 2018.
- ACI 216.1-07; Standard Method for Determining Fire Resistance of Concrete and Masonry Construction Assemblies. ACI Committee: Detroit, MI, USA, 2007.
- EN 1992-1-2-2004; Eurocode 2. Design of Concrete Structures—Part 1–2: General Rules—Structural Fire Design. European Committee for Standadization (CEN): Brussils, Builgium, 2004.
- Wu, B.; Tang, G.-H.; Wang, C. Experimental study on fire resistance of RC columns with different faces exposed to fire. China Civ. Eng. J. 2007, 40, 27–31. [Google Scholar]
- ISO 834-7:2000; Fire Resistance Tests—Elements of Building Construction—Part 7: Specific Requirements for Columns. The International Organization for Standardization (ISO): Geneva, Switzerland, 2000.
- Huang, L.; Ye, H.; Jin, X.; Jin, N.; Xu, Z. Corrosion-induced shear performance degradation of reinforced concrete beams. Constr. Build. Mater. 2020, 248, 118668. [Google Scholar] [CrossRef]
- Du, Y.G.; Chan, A.H.C.; Clark, L.A. Finite element analysis of the effects of radial expansion of corroded reinforcement. Comput. Struct. 2006, 84, 917–929. [Google Scholar] [CrossRef]
- Tan, K.H.; Nguyen, T.T. Structural responses of reinforced concrete columns subjected to uniaxial bending and restraint at elevated temperatures. Fire Saf. J. 2013, 60, 1–13. [Google Scholar] [CrossRef]
- Topçu, İ.B.; IşIkdağ, B. The effect of cover thickness on rebars exposed to elevated temperatures. Constr. Build. Mater. 2008, 22, 2053–2058. [Google Scholar] [CrossRef]
- Shi, X.; Li, H.; Guo, Z. Experimental investigation on behavior of reinforced concrete axial compression column at elevated temperature. J. Build. Struct. 1997, 18, 13–22. [Google Scholar]
- Wu, B.; Feng, W.; Wen, B. Random analyses of the sectional load bearing capacities of axially loaded reinforced concrete columns in fire. J. Hunan Univ. (Nat. Sci.) 2012, 39, 13–20. [Google Scholar]
- Nan, S.; Lin, T.D.; Lie, T.T. Fire resistance of reinforced concrete columns. China Civ. Eng. J. 1992, 26, 25–36. [Google Scholar]
- Feng, J.; Wang, L.; Van Coile, R. Fire resistance performance study on reinforced concrete columns under effects of different factors based on European norms. Build. Struct. 2017, 47, 98–103. [Google Scholar]


Disclaimer/Publisher’s Note: The statements, opinions and data contained in all publications are solely those of the individual author(s) and contributor(s) and not of MDPI and/or the editor(s). MDPI and/or the editor(s) disclaim responsibility for any injury to people or property resulting from any ideas, methods, instructions or products referred to in the content. |
© 2024 by the authors. Licensee MDPI, Basel, Switzerland. This article is an open access article distributed under the terms and conditions of the Creative Commons Attribution (CC BY) license (https://creativecommons.org/licenses/by/4.0/).