Article

Laboratory-Scale Limestone Rock Linear Cutting Tests with a Conical Pick: Predicting Optimal Cutting Conditions from Tool Forces

1
Department of Geotechnical Engineering Research, Korea Institute of Civil Engineering and Building Technology, 283 Goyangdae-ro, Ilsanseo-gu, Goyang-si 10223, Republic of Korea
2
Department of Civil and Environmental System Engineering, Hanyang University, 55 Hanyangdaehak-ro, Songnok-gu, Ansan-si 15588, Republic of Korea
*
Author to whom correspondence should be addressed.
Buildings 2024, 14(9), 2772; https://doi.org/10.3390/buildings14092772
Submission received: 8 August 2024 / Revised: 28 August 2024 / Accepted: 2 September 2024 / Published: 3 September 2024

Abstract

:
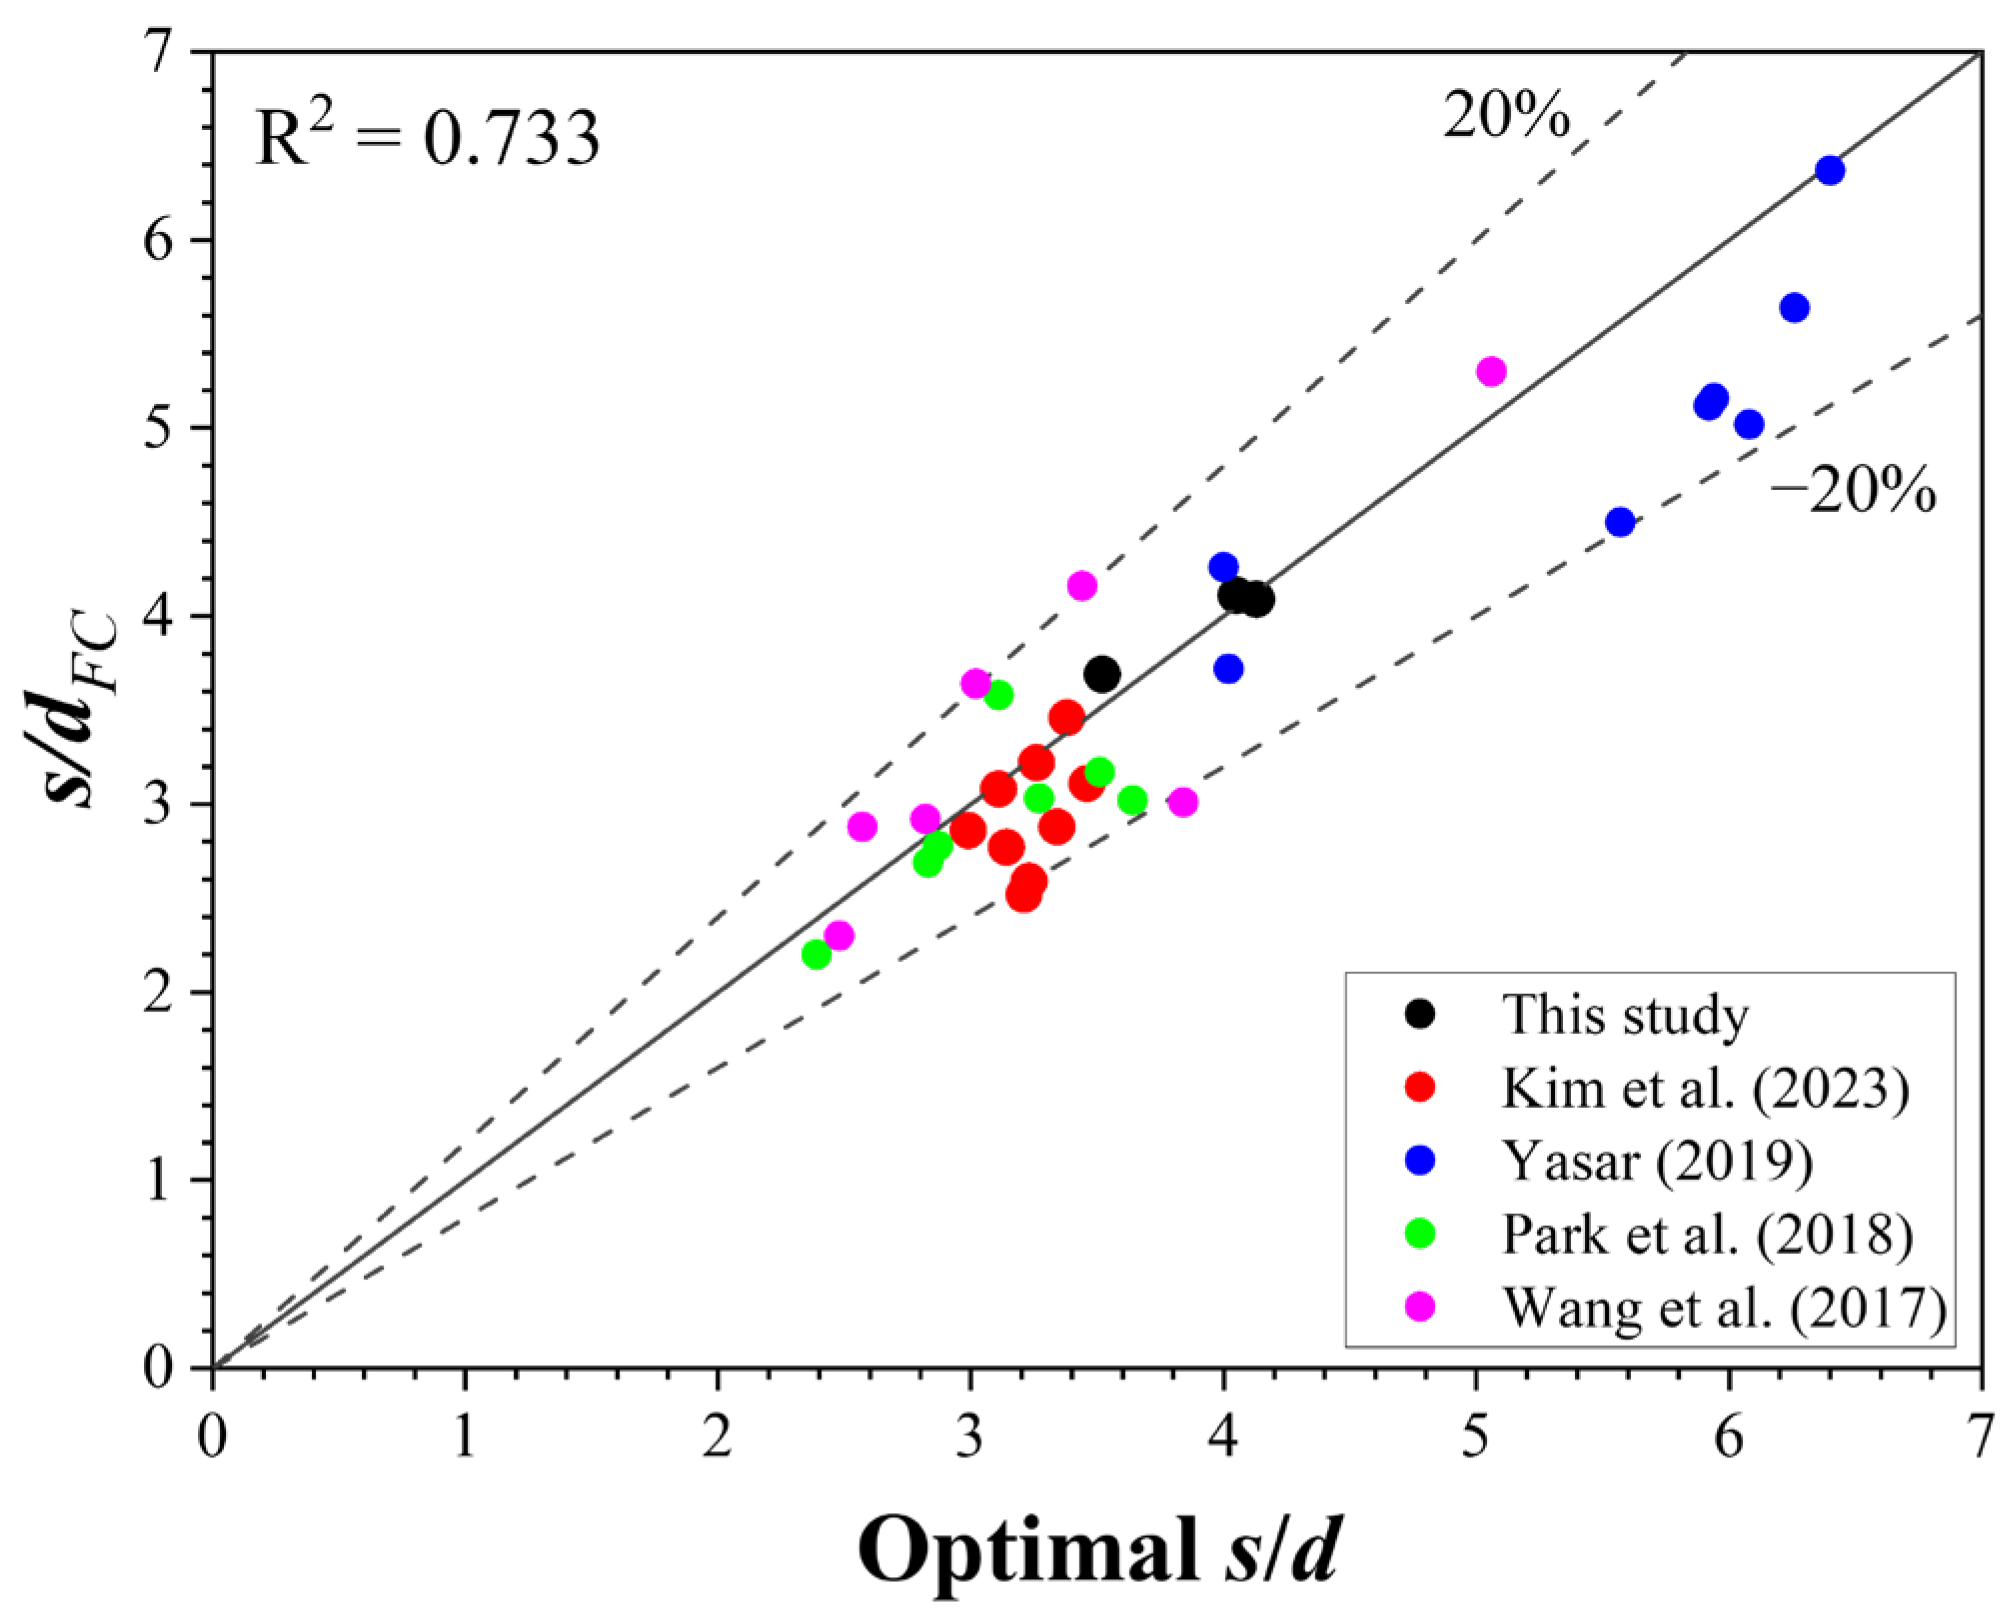
This study introduces a simplified method for predicting the optimal cutting conditions to maximize excavation efficiency based on tool forces. A laboratory-scale linear rock-cutting test was conducted using a conical pick on Finike limestone. The tool forces and their ratios were analyzed in relation to cutting parameters such as penetration depth and spacing. While the cutting force (FC) and normal force (FN) increased with the penetration depth and spacing, this relationship could not predict the optimal cutting conditions. The ratio of the mean normal force to the mean cutting force (FNm/FCm) increased with the penetration depth and the ratio of spacing to penetration depth (s/d). However, even while including this relationship, predicting optimal cutting conditions remained challenging. The ratio of the peak cutting force to the mean cutting force (FCp/FCm) reached a maximum value at a specific s/d, which is similar to the relationship between the specific energy (SE) and s/d. The optimal s/d obtained through the SE methodology was found to be between 3 and 5, and FCp/FCm reached a maximum at s/d. The error between the optimal s/d and the s/d in which FCp/FCm was maximized was less than 5%. Therefore, it was confirmed that the optimal cutting conditions could be predicted through the relationship between FCp/FCm and s/d. Additionally, by using the results from previous studies, the optimal cutting conditions obtained from the SE methodology and the proposed methodology were found to agree within a margin of error of 20%. The proposed methodology can be beneficial for the design of cutter heads and the operation of excavation machines.

1. Introduction

In mining and civil engineering, two primary methods are commonly employed for rock excavation: mechanical excavation and drilling and blasting. Mechanical excavation is preferred over drilling and blasting owing to its productivity, cost-effectiveness, reliability, and safety [1]. Consequently, mechanical excavation has been increasingly applied in rock excavation in the fields of mining and civil engineering in recent decades [2,3].
The efficiency of the mechanical excavation processes was evaluated using specific energy (SE). SE refers to the energy consumed to excavate a unit volume and is a property of the rock-cutting process, not a rock property [4]. A high SE indicates that more energy is required to remove a given volume of rock, potentially leading to increased civil and mining project costs [5]. The SE in MJ/m3 was calculated using Equation (1), as follows:
S E = W V = F C m   ×   L   ×   ρ M
where W is the work or energy required to cut the rock (MJ), V is the cutting volume (m3), FCm is the mean cutting force (kN), L is the cutting length (mm), ρ is the density of rock (g/cm3), and M is the mass of the rock fragments (g).
SE is more affected by spacing than by penetration depth [6]. If the spacing is too small, the rock is overcrushed, resulting in decreased excavation efficiency. Conversely, if the spacing is too wide, tensile fractures from adjacent cuts cannot form a rock chip, which also leads to reduced excavation efficiency. The minimum SE was obtained with the optimal spacing (Figure 1) [3]. Based on this principle, SE methodology has been widely employed to determine the optimal conditions for rock cutting. Under optimal cutting conditions, the excavation process is accelerated, which directly affects project schedules and cost planning. Therefore, various methods have been proposed to determine the optimal cutting conditions.
Full-scale linear cutting machine (LCM) testing is the most reliable method for predicting the performance and design of excavation machines [7]. This test is commonly employed to determine the optimal cutting conditions that can maximize excavation efficiency, as highlighted in various studies [2,6,8,9,10,11,12,13,14,15,16]. Nevertheless, full-scale LCM tests present inherent challenges because of their high cost, time consumption, and the difficulty or impossibility of obtaining full-sized rock samples [2,17,18]. Small-scale LCM tests can solve these shortcomings [19,20,21,22]. However, a fundamental issue affecting the accuracy of the LCM test lies in the volume measurement. Volume measurements in an LCM test are typically derived from the weight of the rock fragments produced during the cutting process. This reliance on rock fragment weight for volume measurement introduces challenges: larger rock chips may spill beyond the measurement area, and small rock chips and dust can scatter outside the measurement zone, potentially compromising the accuracy of the volume measurements. To address these challenges, Cho et al. [17] utilized the ShapeMetrix3D photogrammetric measurement system to obtain accurate volume measurements and predict the optimal conditions. Similarly, Choi et al. [23] and Kim [24] measured the cutting volume using 3D scanning. Ayawah et al. [5] measured the resulting underbreaks and overbreaks in excavated rocks using laser profilometry. They confirmed that the volume of overbreaks decreased up to optimal cutting conditions, suggesting a new method for determining optimal cutting conditions. Despite these improvements in volume measurement accuracy, the additional processes increase the complexity of the process and require significant time.
Numerical simulations have been employed as an alternative method to determine the optimal cutting conditions, as they can avoid the drawbacks inherent in physical tests. Cho et al. [25] utilized AUTODYN-3D, a finite element method (FEM) numerical simulation, to obtain the optimal spacing of tunnel boring machine (TBM) disc cutters for eight different types of Korean rock. Moon and Oh [26] investigated the optimal cutting conditions for hard rocks using the discrete element method (PFC2D). They reported that the brittleness of the rock was directly proportional to the optimal s/d ratio. Zhou et al. [27] conducted a linear cutting test using an FEM simulation and found that the optimal cutter spacing decreased as the rock strength increased. Additionally, various studies have employed numerical simulations to derive optimal cutting conditions [28,29,30,31,32]. However, numerical methods display some shortcomings, such as the inability to accurately replicate the crack propagation in rocks or the need for complex parameter calibration owing to the involvement of microscopic parameters [33].
Therefore, this study proposes a simplified approach for predicting optimal cutting conditions by analyzing the tool forces measured in LCM tests. Rock-cutting tests were performed at various penetration depths and spacings for Finike limestone using a conical pick. The tool forces measured during rock cutting were analyzed in relation to penetration depth and spacing. Additionally, an analysis was conducted to examine the relationship between the ratio of tool forces and the cutting conditions. The proposed approach verified the accuracy of predicting the optimal cutting conditions compared to results obtained using the existing SE methodology.

2. Rock Linear Cutting Test

2.1. Laboratory-Scale Linear Cutting Machine

The laboratory-scale LCM (LLCM) used for rock cutting in this study is shown in Figure 2. The LLCM was electronically driven. The rock box could accommodate samples measuring up to 470 mm × 500 mm × 450 mm, and it was repositioned using x-axis and y-axis servomotors. The x-axis servomotor, which was responsible for the movement in the spacing direction, had a stroke of 500 mm. The y-axis servomotor, which is responsible for the movement in the cutting direction, can achieve a maximum speed of 100 mm/s and has a stroke of 700 mm. The penetration depth was controlled by adjusting the z-axis servomotor, which moved the cutting tool up and down (Figure 2a,c).
The tool forces generated in the three axis directions were measured by installing load cells in all direction, each with a data accumulation capacity of 10 Hz. The x-axis load cell, with a capacity of 15 tons (150 kN), measures the side force (FS), whereas the y- and z-axis load cells, both with capacities of 25 tons (250 kN), measure the cutting force (FC) and normal force (FN), respectively (Figure 2b).
The cutting parameters, such as penetration depth, spacing, and cutting speed, were set in the control box. Real-time tool forces were visualized on the display and simultaneously stored in the CSV (comma-separated values) format.

2.2. Conical Pick and Rock Sample

The LLCM can be considered a small-scale LCM. In small-scale LCM tests, observing the interactions between adjacent cutting grooves becomes challenging when the rock sample is insufficiently large. In addition, when using a downsized cutting tool, it is impossible to estimate the cutting performance directly or to obtain the design parameters of the cutter head [20,34]. Therefore, in this study, a linear rock-cutting test was performed using a full-sized conical pick and a sufficiently large rock sample to ensure interaction between cutting grooves.
Model SM06, a conical pick manufactured by Kennametal Inc. (Pittsburgh, PA, USA), was used for the linear rock-cutting tests in this study. The tip angle of the conical pick was 90°, and the pick gauge and shank lengths were 45.25 mm and 41.91 mm, respectively. Detailed specifications of the conical pick are shown in Figure 3a. The attack angle was set to 45° and was applied equally in all tests (Figure 3b).
The rock selected for this study was Finike limestone. This medium-strength rock is a calcareous sedimentary rock obtained from the Finike district in southern Turkey. The rock samples selected for the cutting tests contained no bedding planes and or and were cut into dimensions of 350 mm × 350 mm × 250 mm. Subsequently, to expand the measurement range and the usable portion for the experiment, the sample was placed in a mold with dimensions of 400 mm × 400 mm × 300 mm, and the surrounding space was filled with concrete. The mechanical properties of Finike limestone are listed in Table 1. The uniaxial compressive strength (σc), elastic modulus (E), and Poisson’s ratio (ν) were determined based on ASTM D 7012-14 [35]. Tensile strength (σt) and density (ρ) were determined using the testing methods recommended in ASTM D3967-08 [36] and ASTM C97/C97M-15 [37], respectively.

2.3. Cutting Parameters and Data Processing

In all cutting tests, the attack angle was set to 45°, as mentioned earlier, whereas the skew angle and tilt angle were both set to 0°. The penetration depths were set to 3, 6, and 9 mm, and the spacing was adjusted to maintain a ratio of spacing to penetration (s/d) between 1 and 6. This adjustment is based on the findings of Bilgin et al. [3], who reported that the optimal s/d for a conical pick is between 2 and 5. Compared with other parameters, such as the penetration depth, the cutting speed does not significantly affect the specific energy [38]. Consequently, the effect of cutting speed on rock cutting was ignored, and cutting was conducted at a slow speed of 4 mm/s to minimize the loss of rock chips used for volume measurement during the cutting process. Cutting was performed at least three times under identical conditions.
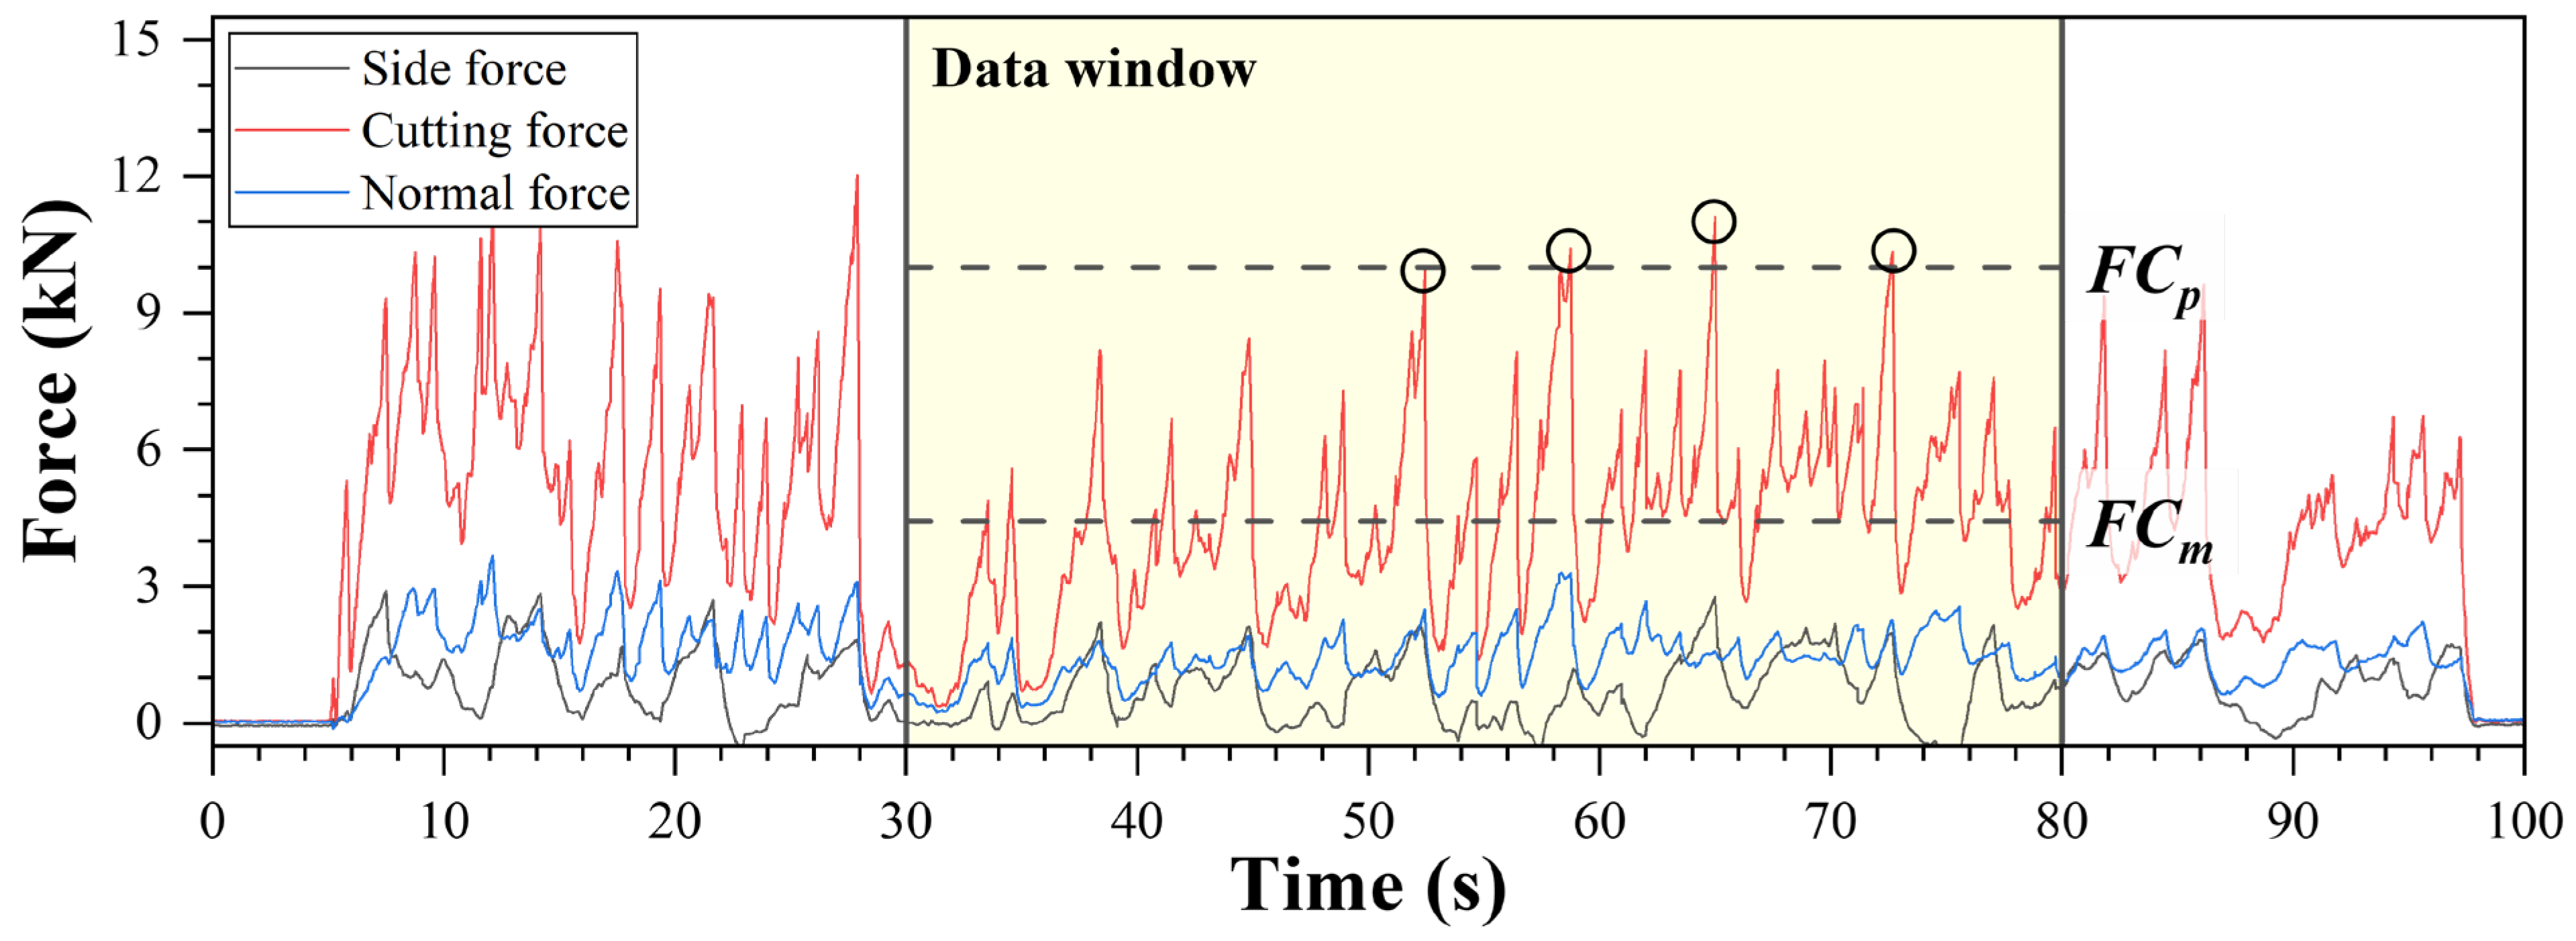
The tool forces measured during a single cutting in the rock-cutting test were recorded, as illustrated in Figure 4. The red line represents the FC, whereas the blue and black lines correspond to the FN and FS, respectively. The mean tool forces were obtained using the values recorded in the data window (represented by a yellow box) to mitigate the impact of cutting the concrete and excessive crushing at the beginning and end of the rock sample. For example, in Figure 4, FCm is an illustration of the mean tool force. The peak tool forces, such as the peak cutting force (FCp) shown in Figure 4, were calculated as the average of the peak values within the data window. The FC is directly related to the torque requirement and the specific energy of the excavation machine. In contrast, the FN is used to estimate the effective capacity and thrust of a machine. Meanwhile, the FS is related to the vibration of the machine and has relatively little effect on the excavation process [9]. Therefore, in this study, the analysis was performed only for FC and FN. The results of the linear rock-cutting tests are summarized in Table 2.

3. Results and Discussions

3.1. Analysis of Tool Forces

3.1.1. Correlation between Tool Forces and Cutting Conditions

The penetration depth is a fundamental parameter that defines the cutting conditions. In rock cutting, an increase in penetration depth correlates with higher production; however, an escalation in tool forces accompanies it. Although deep penetration is advantageous for enhancing production, it has the drawbacks of accelerating tool wear and reducing tool lifespan.
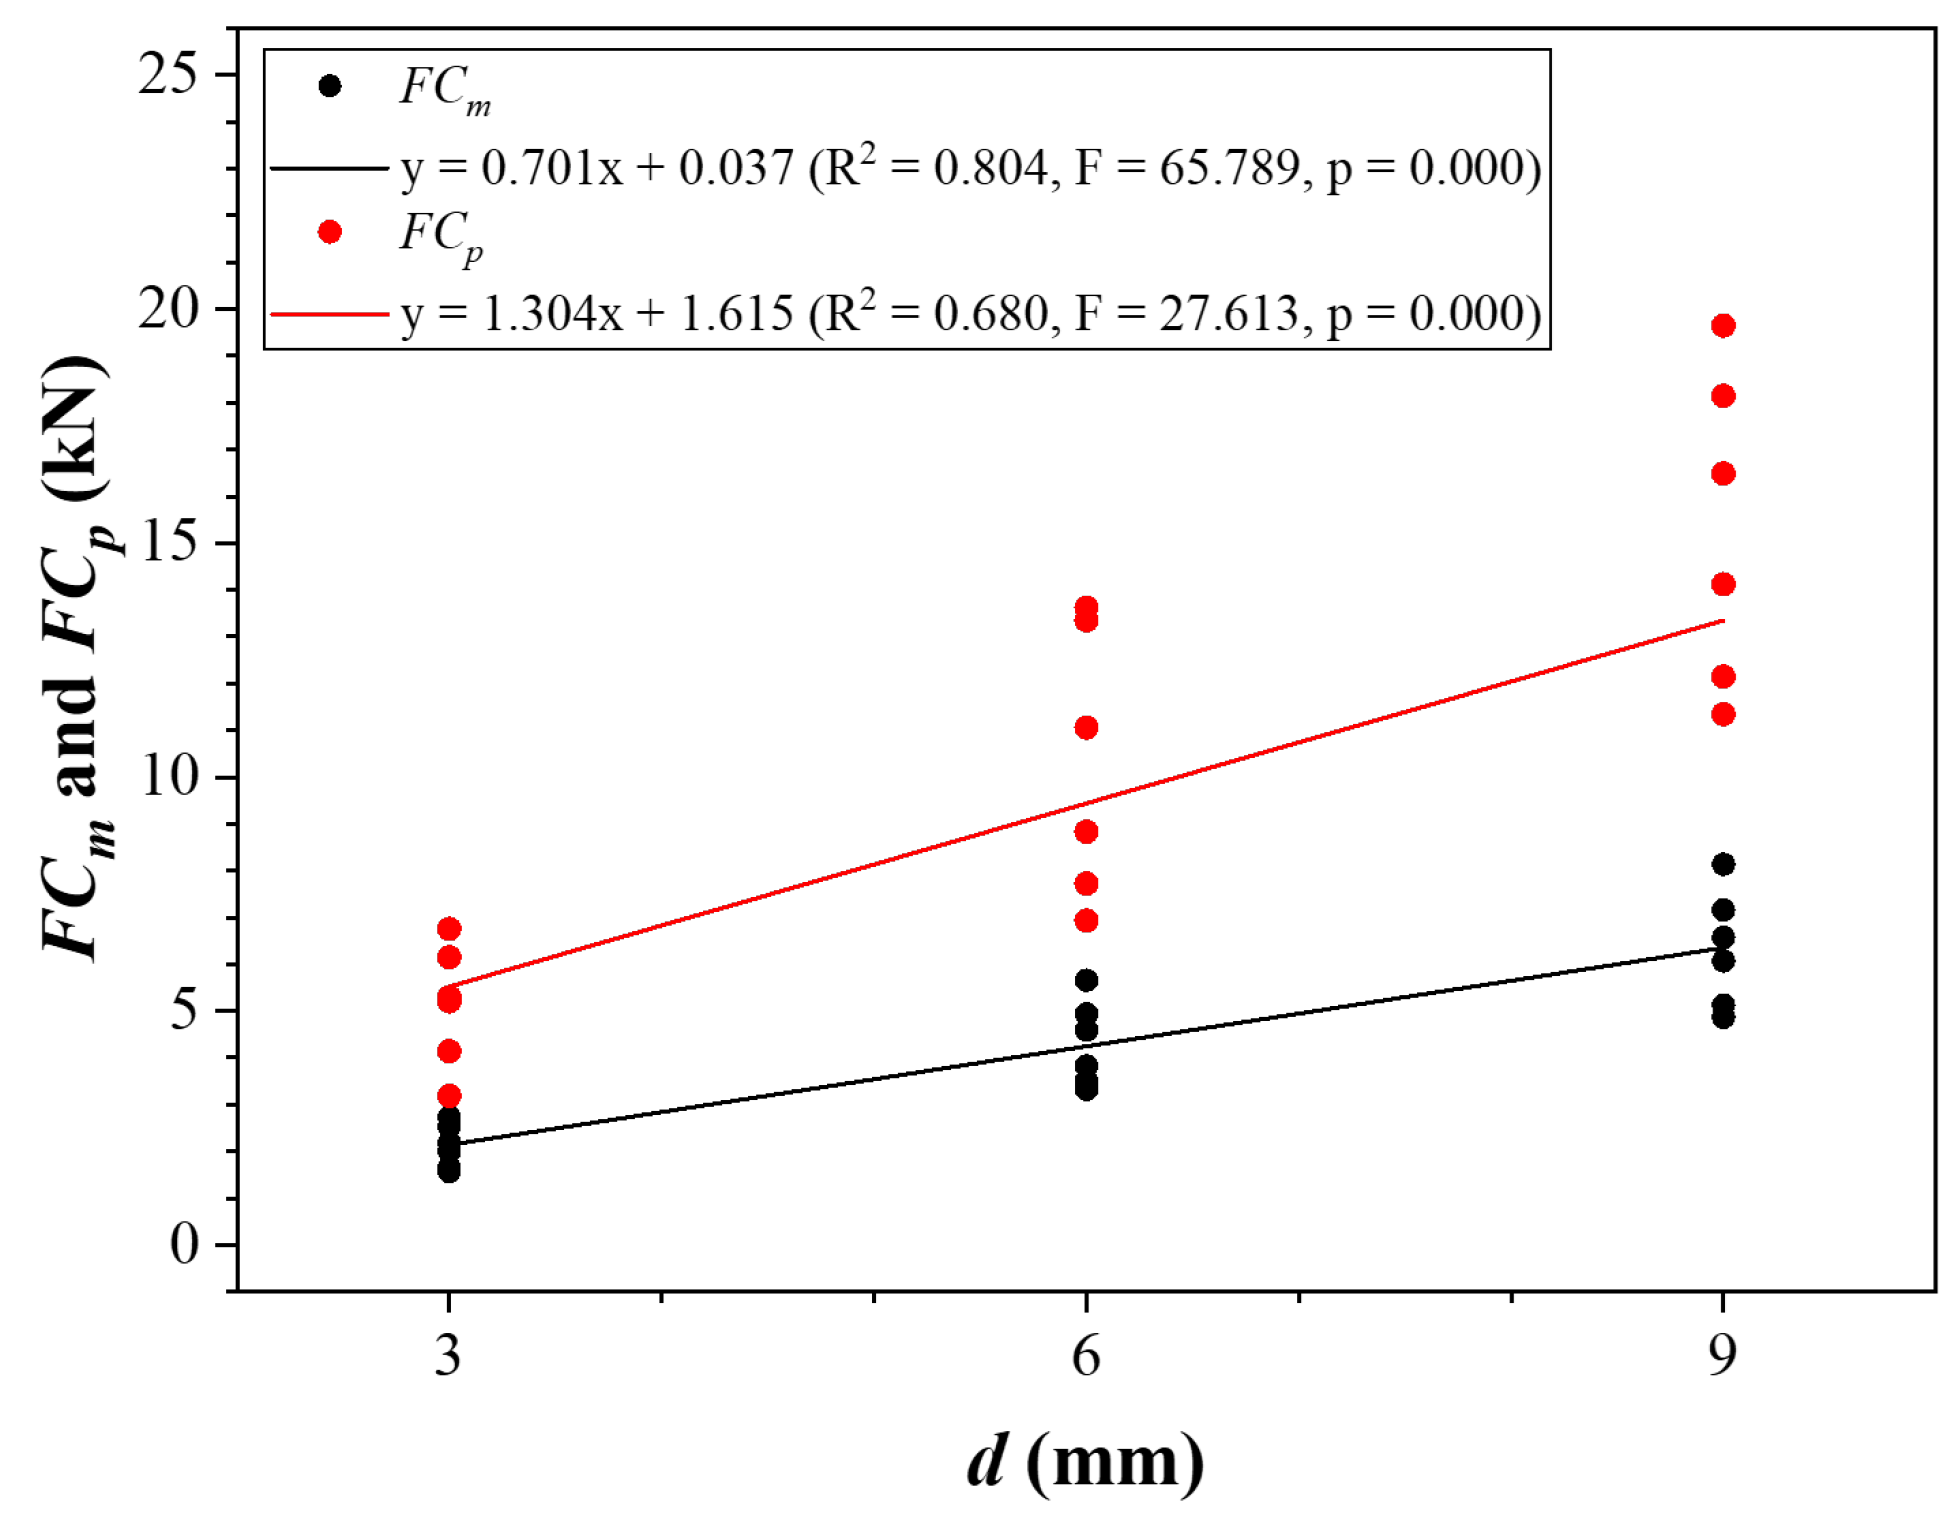
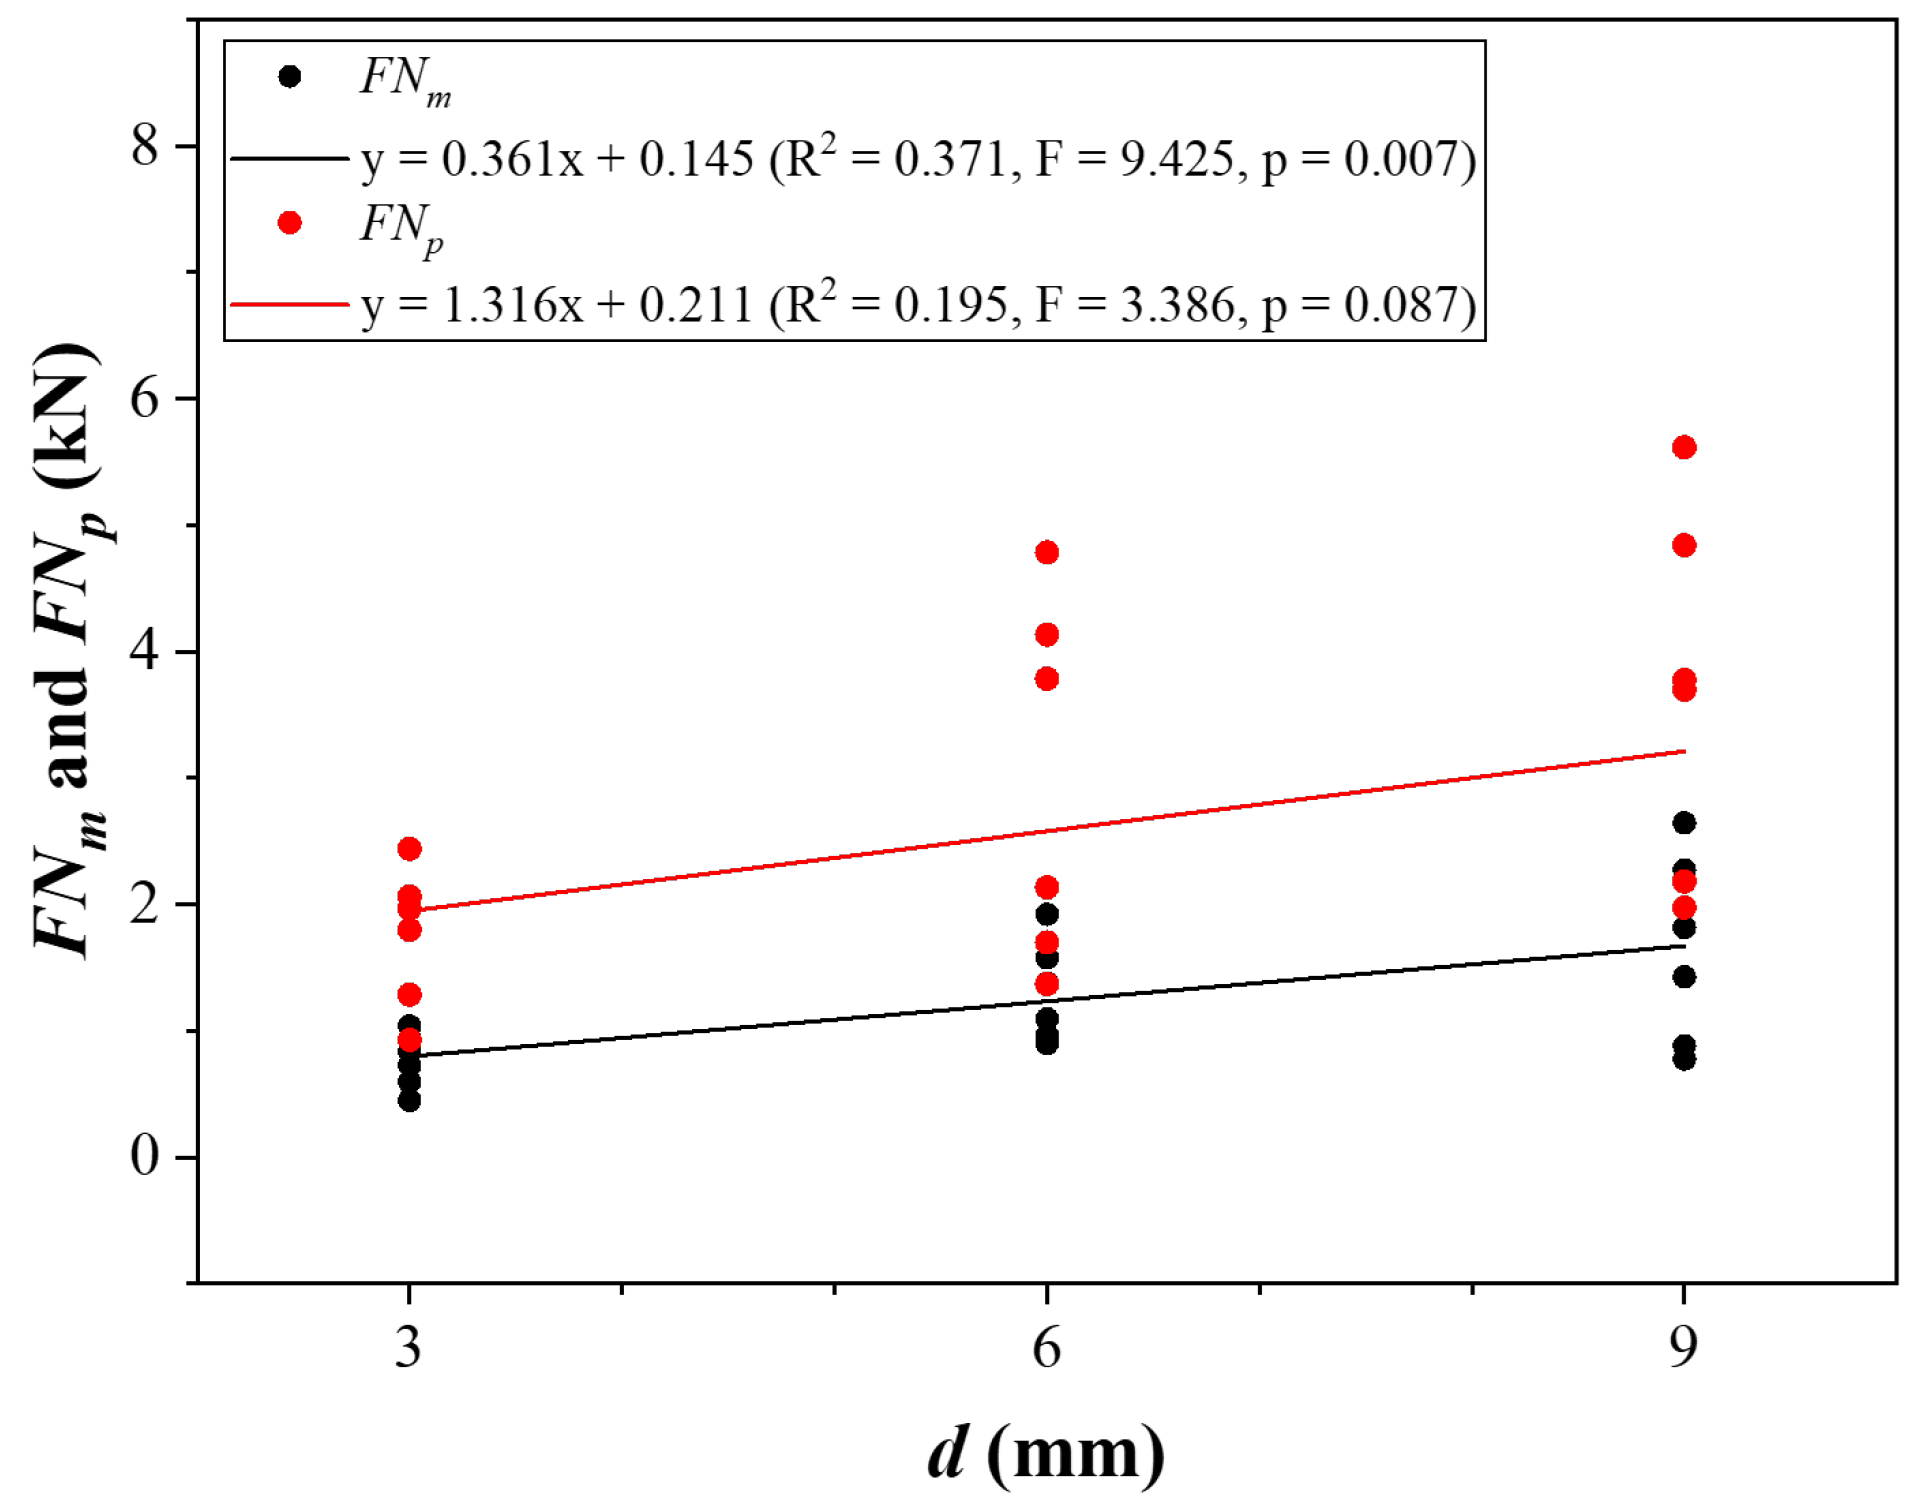
The correlation between the penetration depth and the tool forces was analyzed for all data that underwent cutting, with penetration depths of 3 mm, 6 mm, and 9 mm (Table 2). Figure 5 illustrates the variations in FCm and FCp with respect to penetration depth. Both FCm and FCp increased linearly as the penetration depth increased (R2 = 0.680–0.804, F = 27.613–65.789, p = 0.000). In Figure 6, the variations in FNm and FNp with respect to penetration depth are depicted. While both FNm and FNp demonstrated a linear increase with penetration depth, the correlation coefficient remained lower than 0.371 (R2 = 0.195–0.371, F = 3.386–9.425, p = 0.007–0.087). This implies that the FC is more affected by the penetration depth. Moreover, FCp and FNp increased significantly compared to FCm and FNm. Wang et al. [39] confirmed that FC and FN have a repetitive pattern of building up to a peak and then dropping as cutting is performed. As the penetration depth increased, the peak value rose, and the pattern period extended, indicating the generation of larger rock chips at greater depths. Therefore, it can be expected that FCp and FNp increase significantly more than FCm and FNm because the period of the pattern becomes longer. The expected equations for the tool forces, depending on the penetration depth, are summarized in Table 3.
Tool spacing is a critical parameter in cutter head design, directly influencing rock chip size and excavation efficiency [40,41]. Wide spacing results in unrelieved cutting, in which cutting grooves do not interact, increasing tool forces and reducing excavation efficiency. Conversely, a close spacing results in decreased tool forces but causes over-crushing and excavation occurring deeper than the penetration depth, ultimately diminishing excavation efficiency.
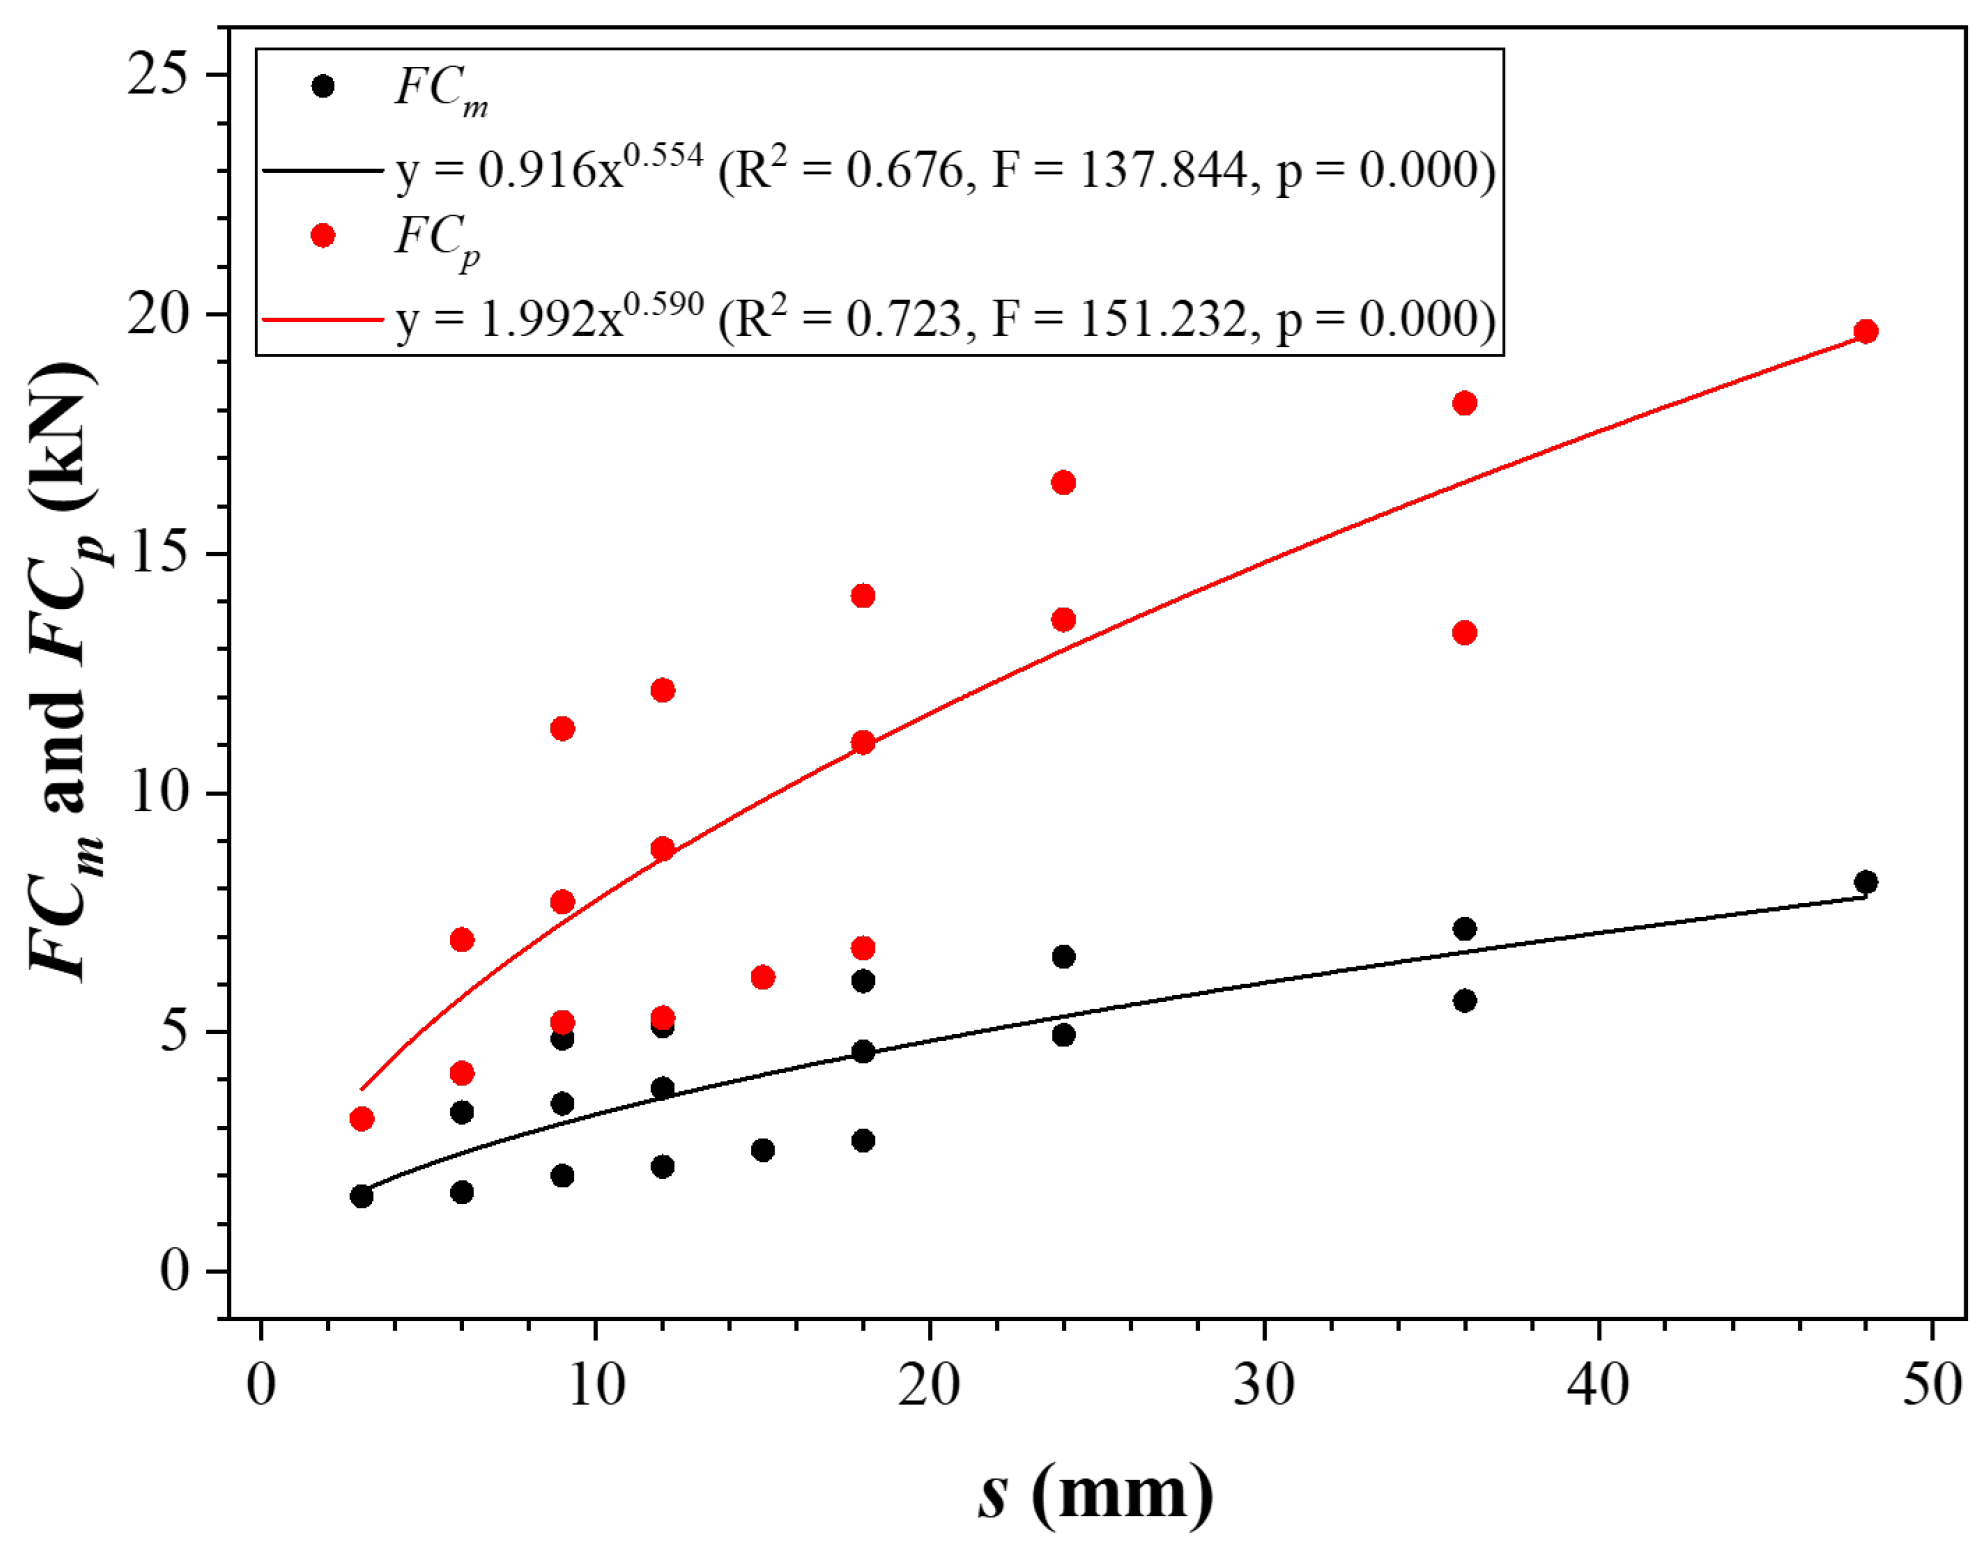
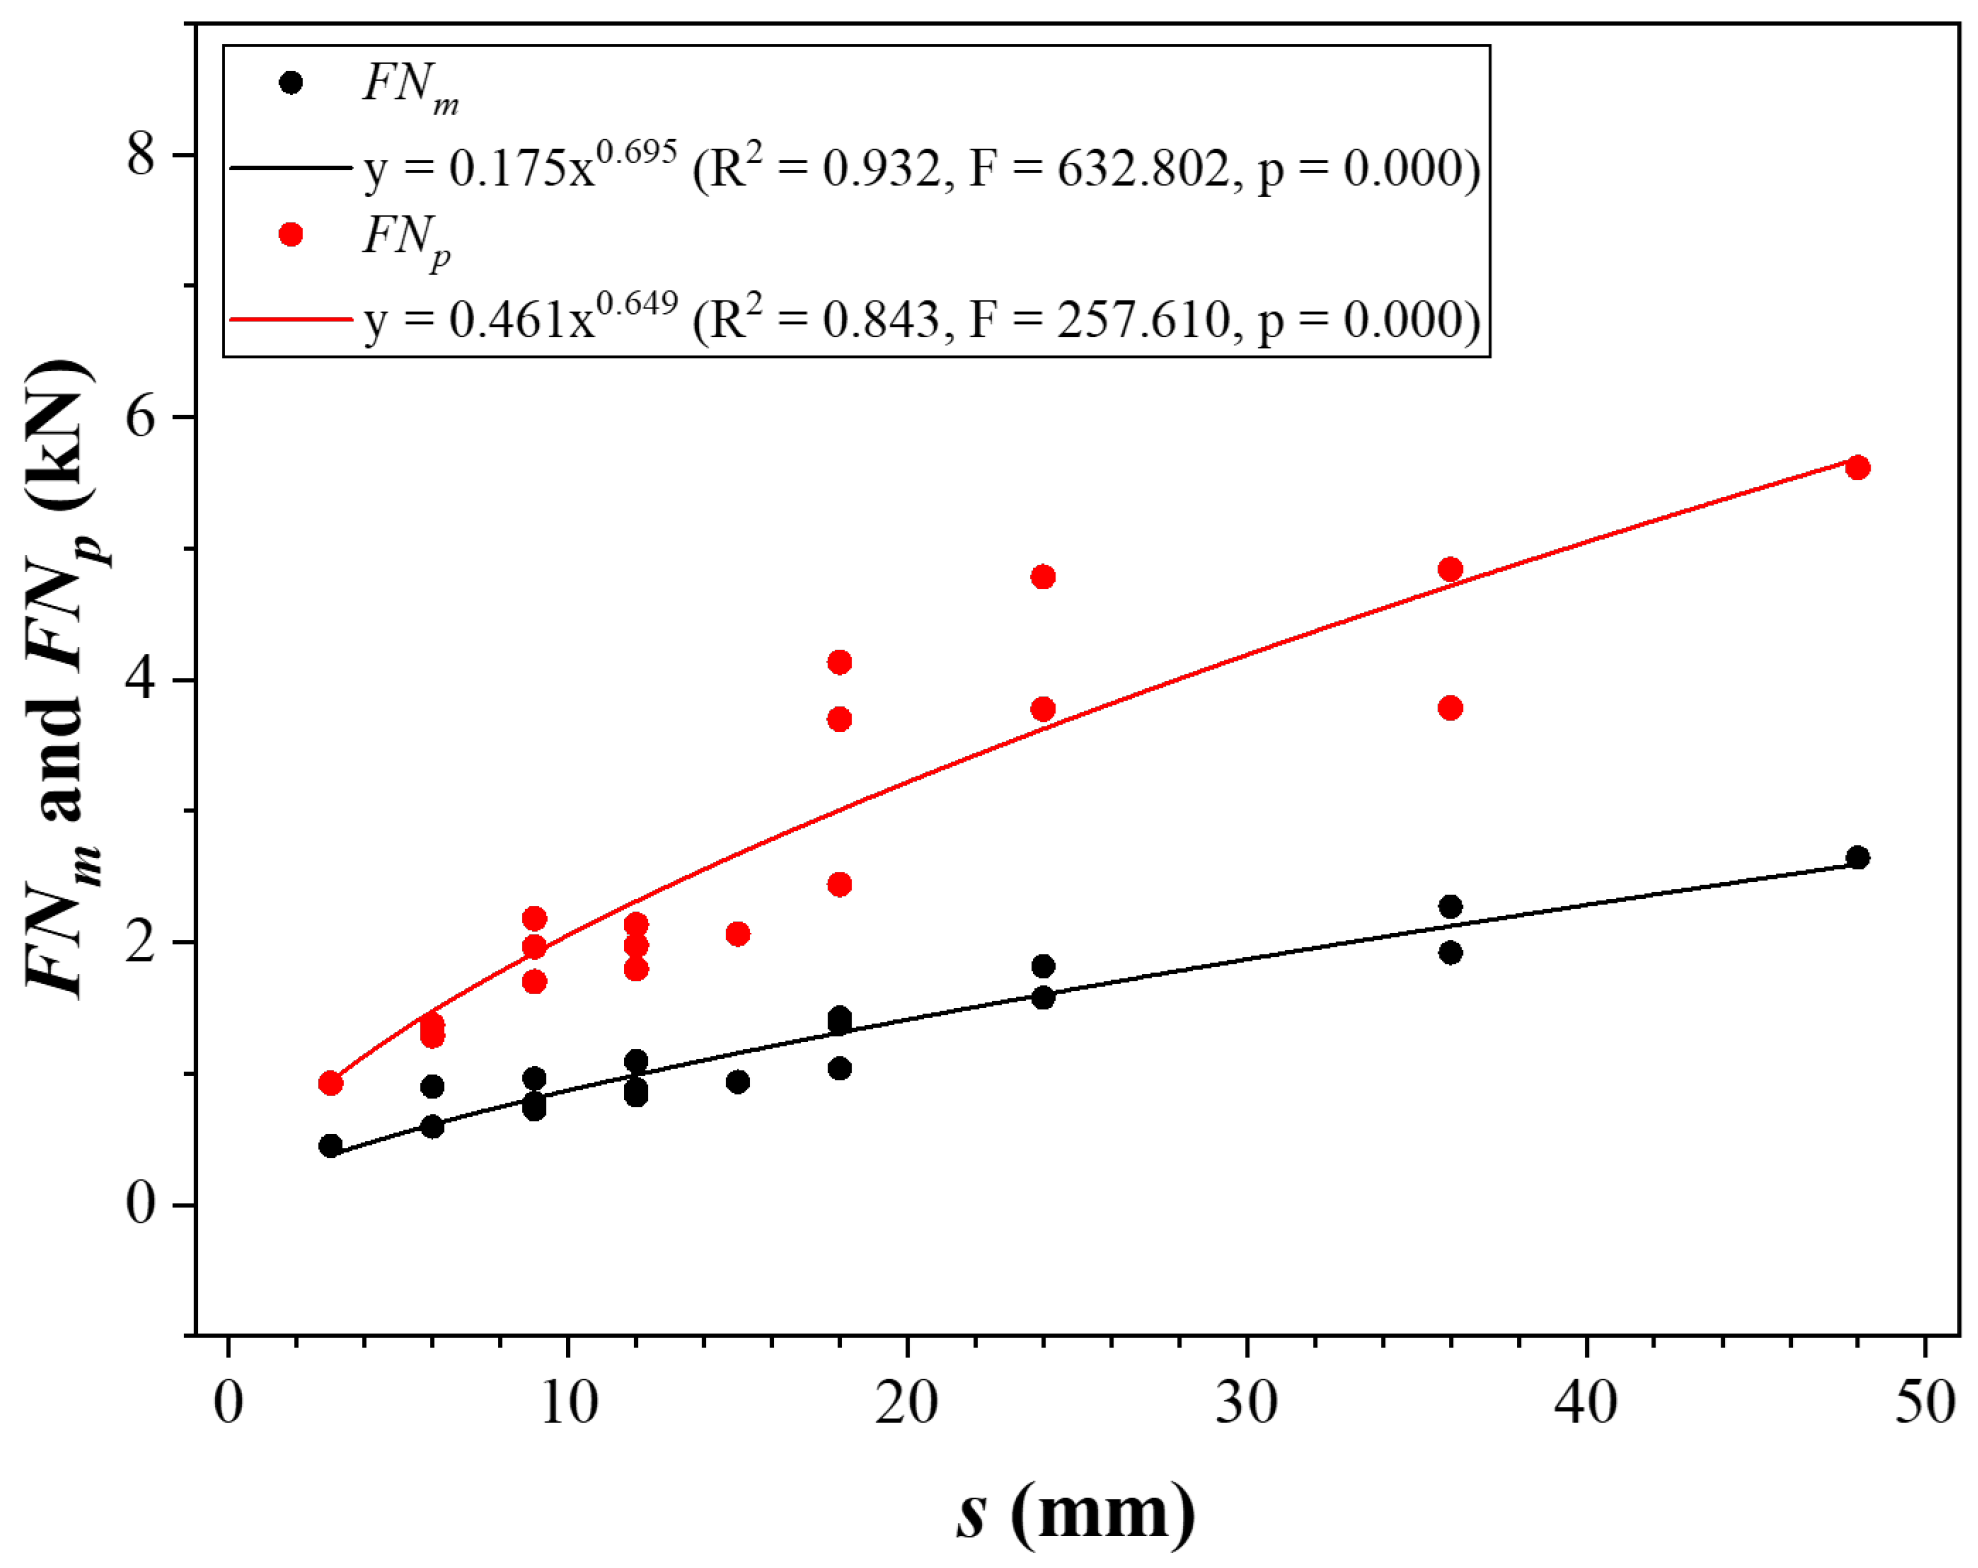
The correlation between spacing and tool forces was analyzed using the cutting data obtained at spacings ranging from 3 to 48 mm. Accordingly, the s/d ratio is between 1 and 6, and it is noted that it is a relieved mode in which interactions occur between cutting grooves. As illustrated in Figure 7 and Figure 8, the tool forces exhibited an increase following a power–function relationship, with an increase in spacing. Table 4 provides the regression equation and statistical parameters detailing the relationship between the tool forces and the spacing. Because all F-values were greater than 31, and all p-values were less than 0.05, all regression curves were considered statistically significant at a confidence level of 99%. Moreover, the correlation coefficient ranged from 0.676 to 0.923, which was stronger than the correlation with the penetration depth (R2 = 0.195–0.804). Therefore, it can be seen that both FC and FN are more affected by the spacing than by the penetration depth. This correlation was notably more robust for FNm and FNp (R2 = 0.676–0.723) than for FCm and FCp (R2 = 0.843–0.932), suggesting that FN was more sensitive to spacing variations than was FC.
In summary, it was confirmed that increasing the penetration depth and spacing increases the tool forces. Table 5 summarizes the multiple regression model and the statistical parameters of the tool forces for the penetration depth and spacing. However, this relationship did not confirm the ability to predict optimal cutting conditions.

3.1.2. Correlation between Ratio of Normal to Cutting Force and Cutting Condition

The FN/FC ratio is an essential parameter for determining the efficiency of excavation machines. As the tool wears, FN increases rapidly, leading to a corresponding increase in FN/FC [42]. Moreover, FN/FC is related to the excavation efficiency. A high FN/FC ratio causes excessive tool wear, increased crushing, less chipping, and low penetration rates [43]. However, a lower FN/FC indicates a more efficient cutting tool performance [39]. Therefore, the FN/FC is expected to be associated with the optimal cutting conditions for achieving maximum efficiency.
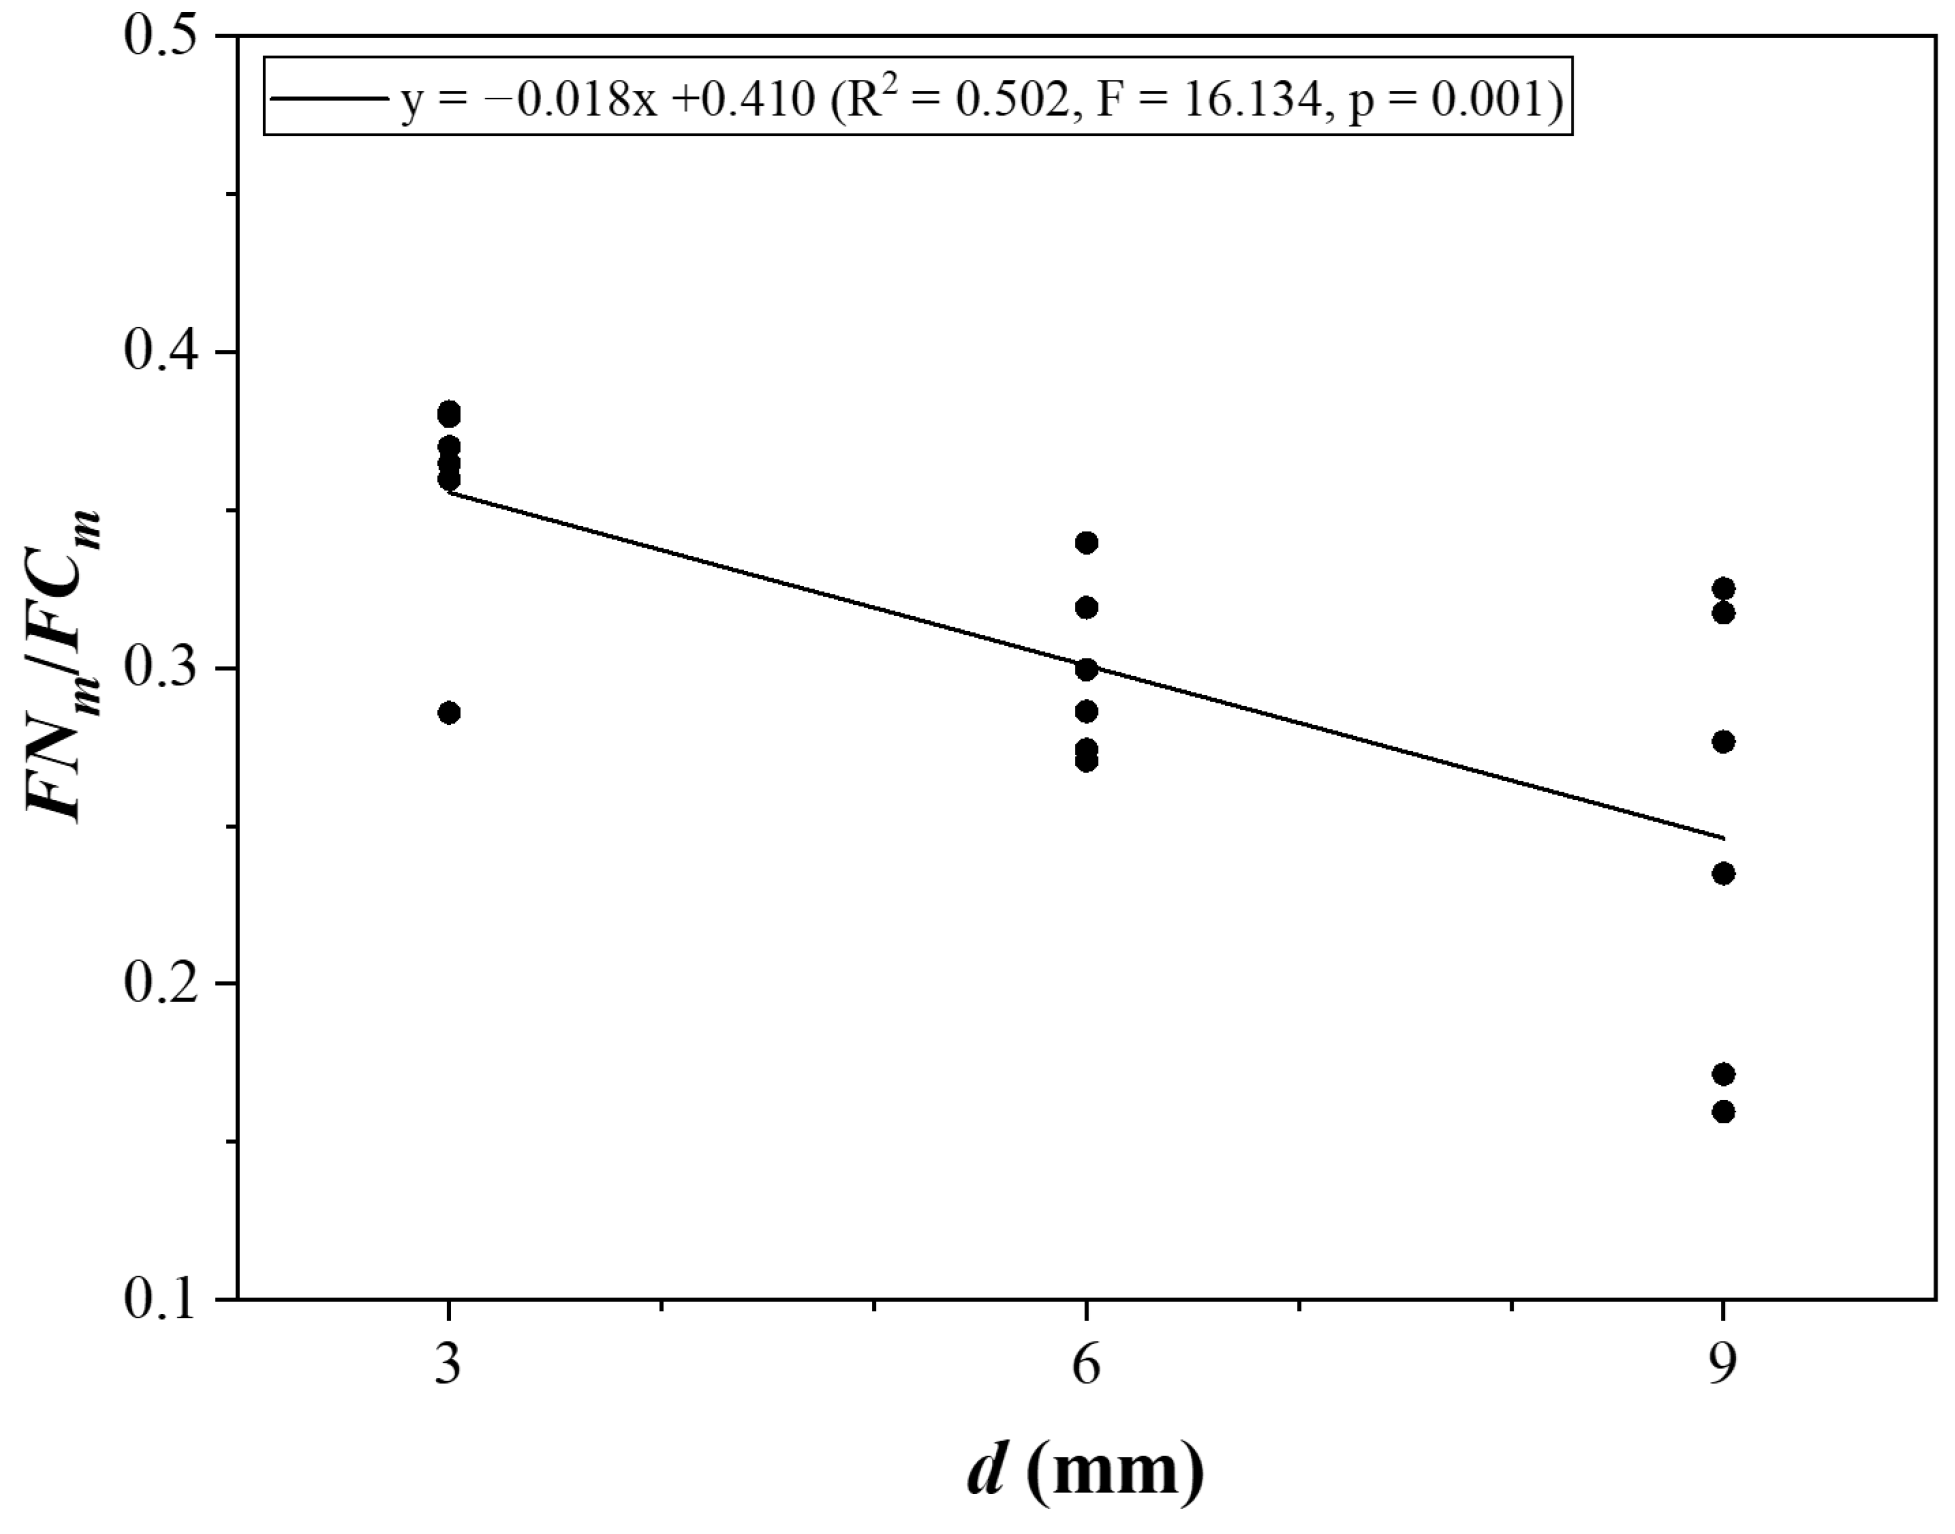
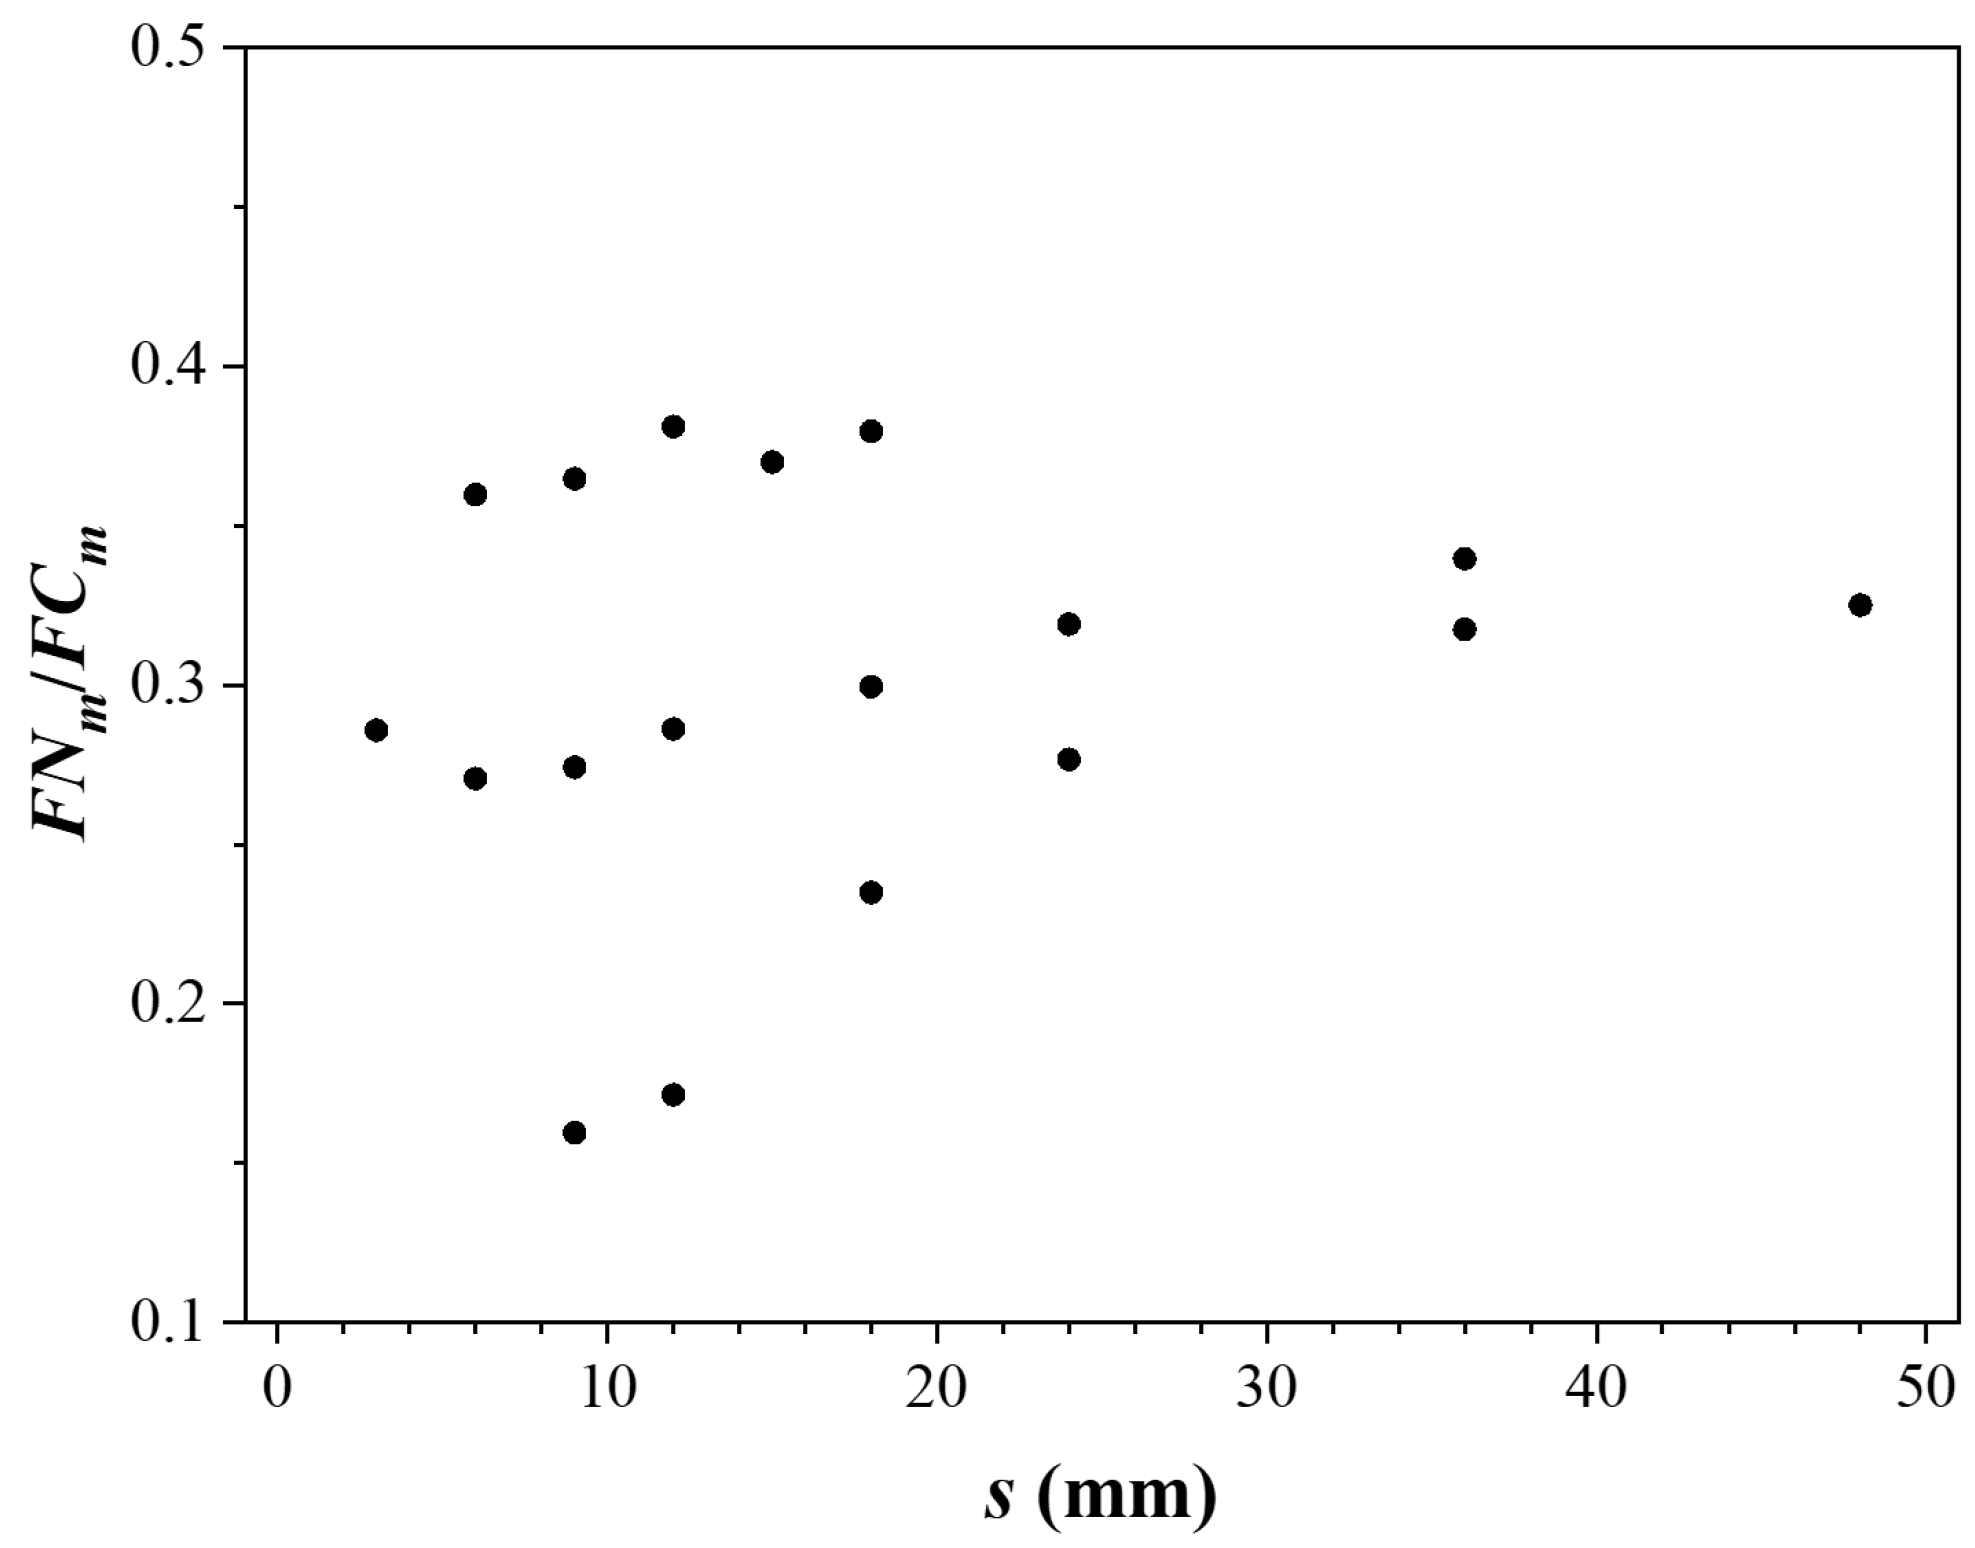
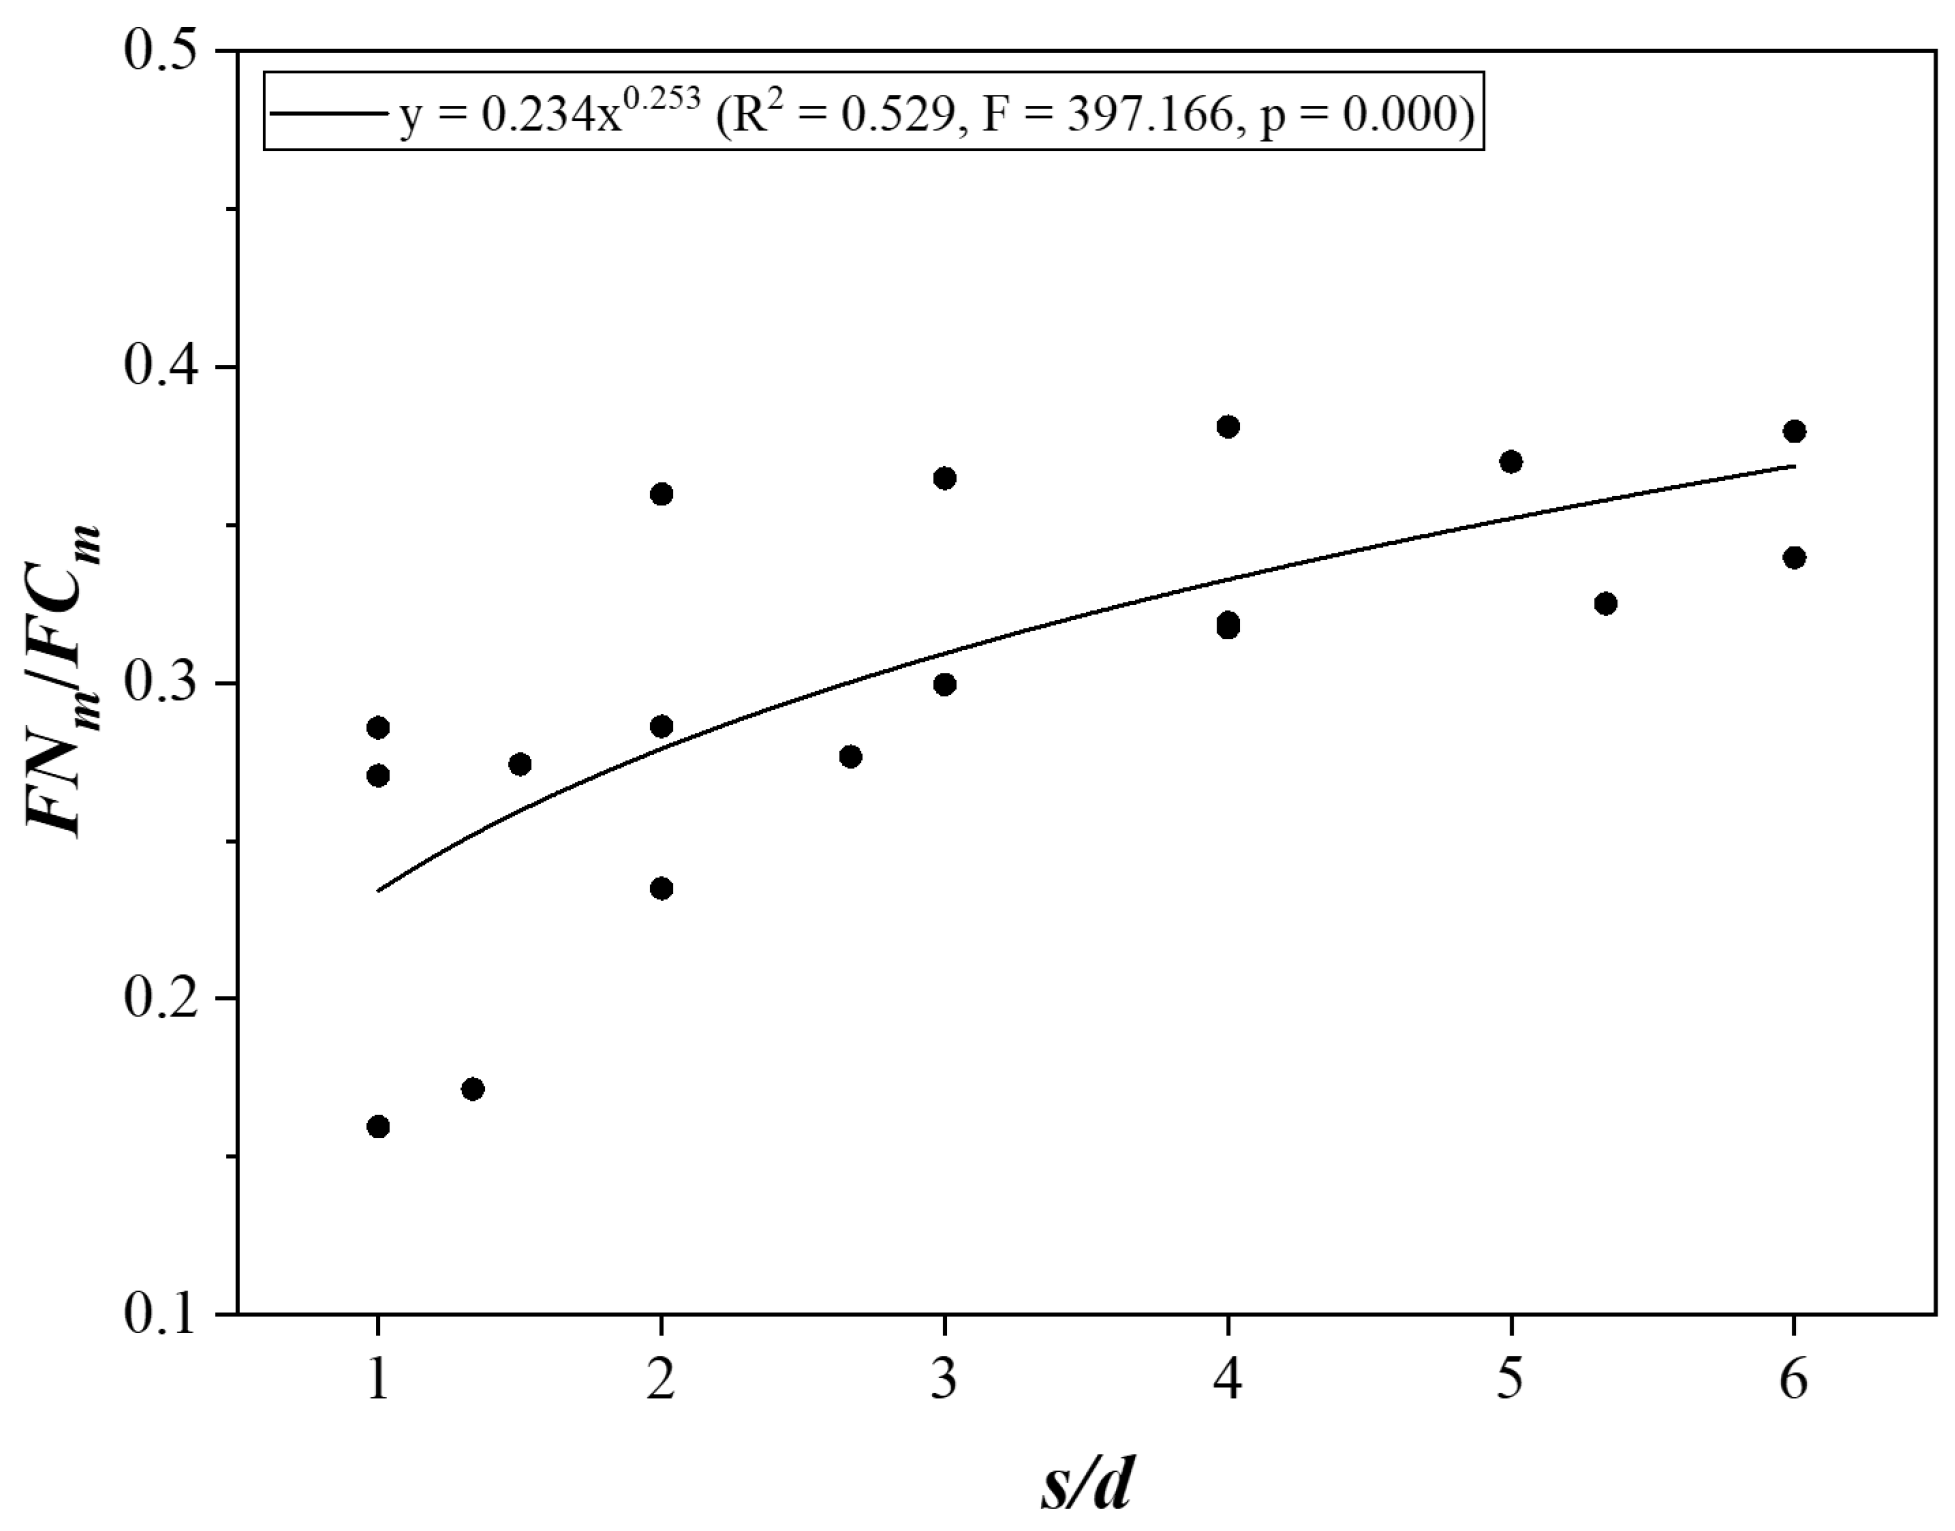
Figure 9 and Figure 10 illustrate the variations in FNm/FCm according to the penetration depth and spacing, respectively. In this study, FNm/FCm was between 0.160 and 0.381 (Table 2). It was confirmed that the FNm/FCm decreased linearly as the penetration depth increased. In this relationship, the correlation coefficient was 0.502, and the F-value and p-value were 16.134 and 0.001, respectively, which were statistically significant at the 99% confidence level. However, FNm/FCm did not show any correlation with spacing. This is partly inconsistent with the results of Wang et al. [39], where FNm/FCm increased linearly as the penetration depth increased and decreased within the power function as the spacing increased. However, as shown in Figure 11, this study confirmed that FNm/FCm was significantly correlated with s/d (R2 = 0.529, F = 397.166, and p = 0.000). FNm/FCm increased within the power–function relationship as s/d increased. The regression equation and statistical parameters of the correlation between FNm/FCm and the cutting parameters are summarized in Table 6. The multiple regression model and parameters of FNm/FCm considering the penetration depth and spacing are listed in Table 7. Nevertheless, predicting the optimal cutting conditions remains challenging, both in the correlation between FNm/FCm and the penetration depth and the correlation between FNm/FCm and s/d.

3.1.3. Correlation between Ratio of Peak-to-Mean Tool Force and Cutting Condition

The peak-to-mean tool force ratio is an essential factor in design and practice. This ratio plays a significant role in influencing the vibration of the cutter head and the potential breakdown of mechanical parts [9]. The peak-to-average tool force ratio is also related to the excavation efficiency during rock cutting. Bilgin et al. [3] found that, in relieved cutting under optimal conditions, this ratio was higher than that in unrelieved cutting, which was attributed to the larger rock chips obtained in the relieved mode. Additionally, the FCp/FCm ratio represents the ease of cutting the rock, as a rock with a high FCp/FCm ratio is harder to cut than a rock with the same SE but a lower FCp/FCm ratio [44]. Kim et al. [21] suggested that FCp/FCm may be related to the optimal cutting conditions. Barker [45] and Copur et al. [9] found that the ratio of the peak-to-mean tool force did not correlate with the penetration depth and spacing, which was verified by the results of the multiple regressions performed in this study (Table 7). Therefore, in this study, an analysis was performed on the relationship between the ratio of peak to mean tool forces and s/d.
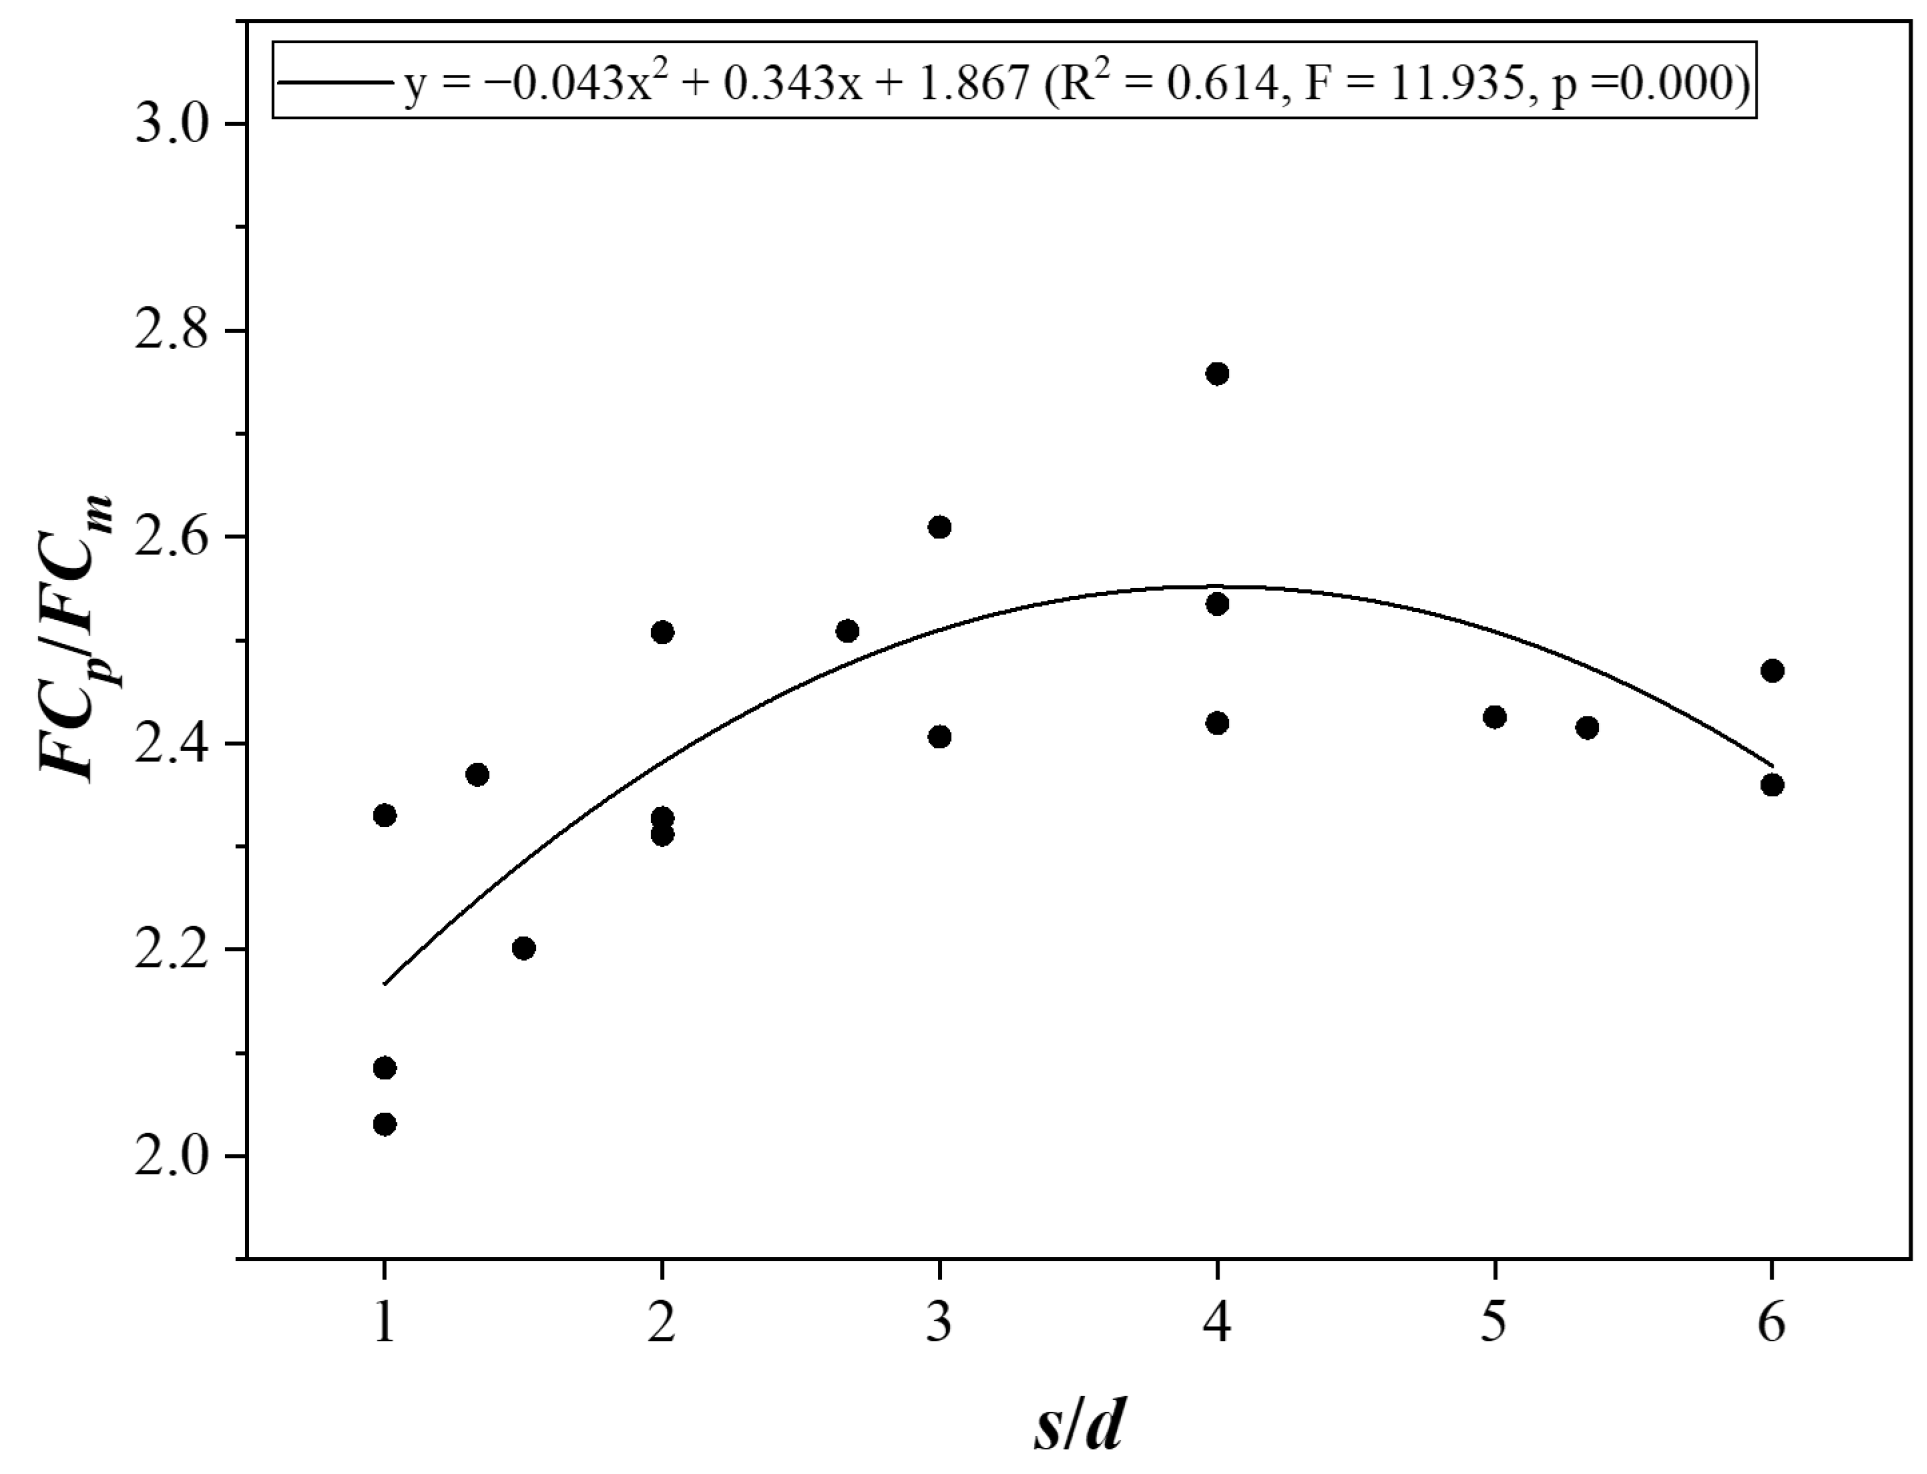
In this study, FNp/FNm was determined to be 2.271 ± 0.411, while FCp/FCm was found to be 2.393 ± 0.174 (Table 2). Figure 12 and Figure 13 illustrate the relationships between s/d and FNp/FNm, as well as FCp/FCm, and the regression equations and statistical parameters are listed in Table 6. Both FNp/FNm and FCp/FCm tended to reach their maximum values when s/d was between 3 and 4. It is noticeable that this resembles the concept of the SE methodology, where the optimal cutting conditions are determined by the theory that the SE reaches a minimum at a particular s/d. Nevertheless, FCp/FCm and s/d were statistically significant at the 99% confidence level (R2 = 0.614, F = 11.935, and p = 0.000). In contrast, FNp/FNm and s/d were not statistically significant, with correlation coefficients, F-values, and p-values of 0.154, 1.367, and 0.285, respectively. Therefore, in this study, it was assumed that the optimal cutting conditions could be predicted based on the relationship between FCp/FCm and s/d.

3.2. Simplified Approach to Predicting Optimal Cutting Conditions

3.2.1. Optimal Cutting Conditions Using SE Methodology

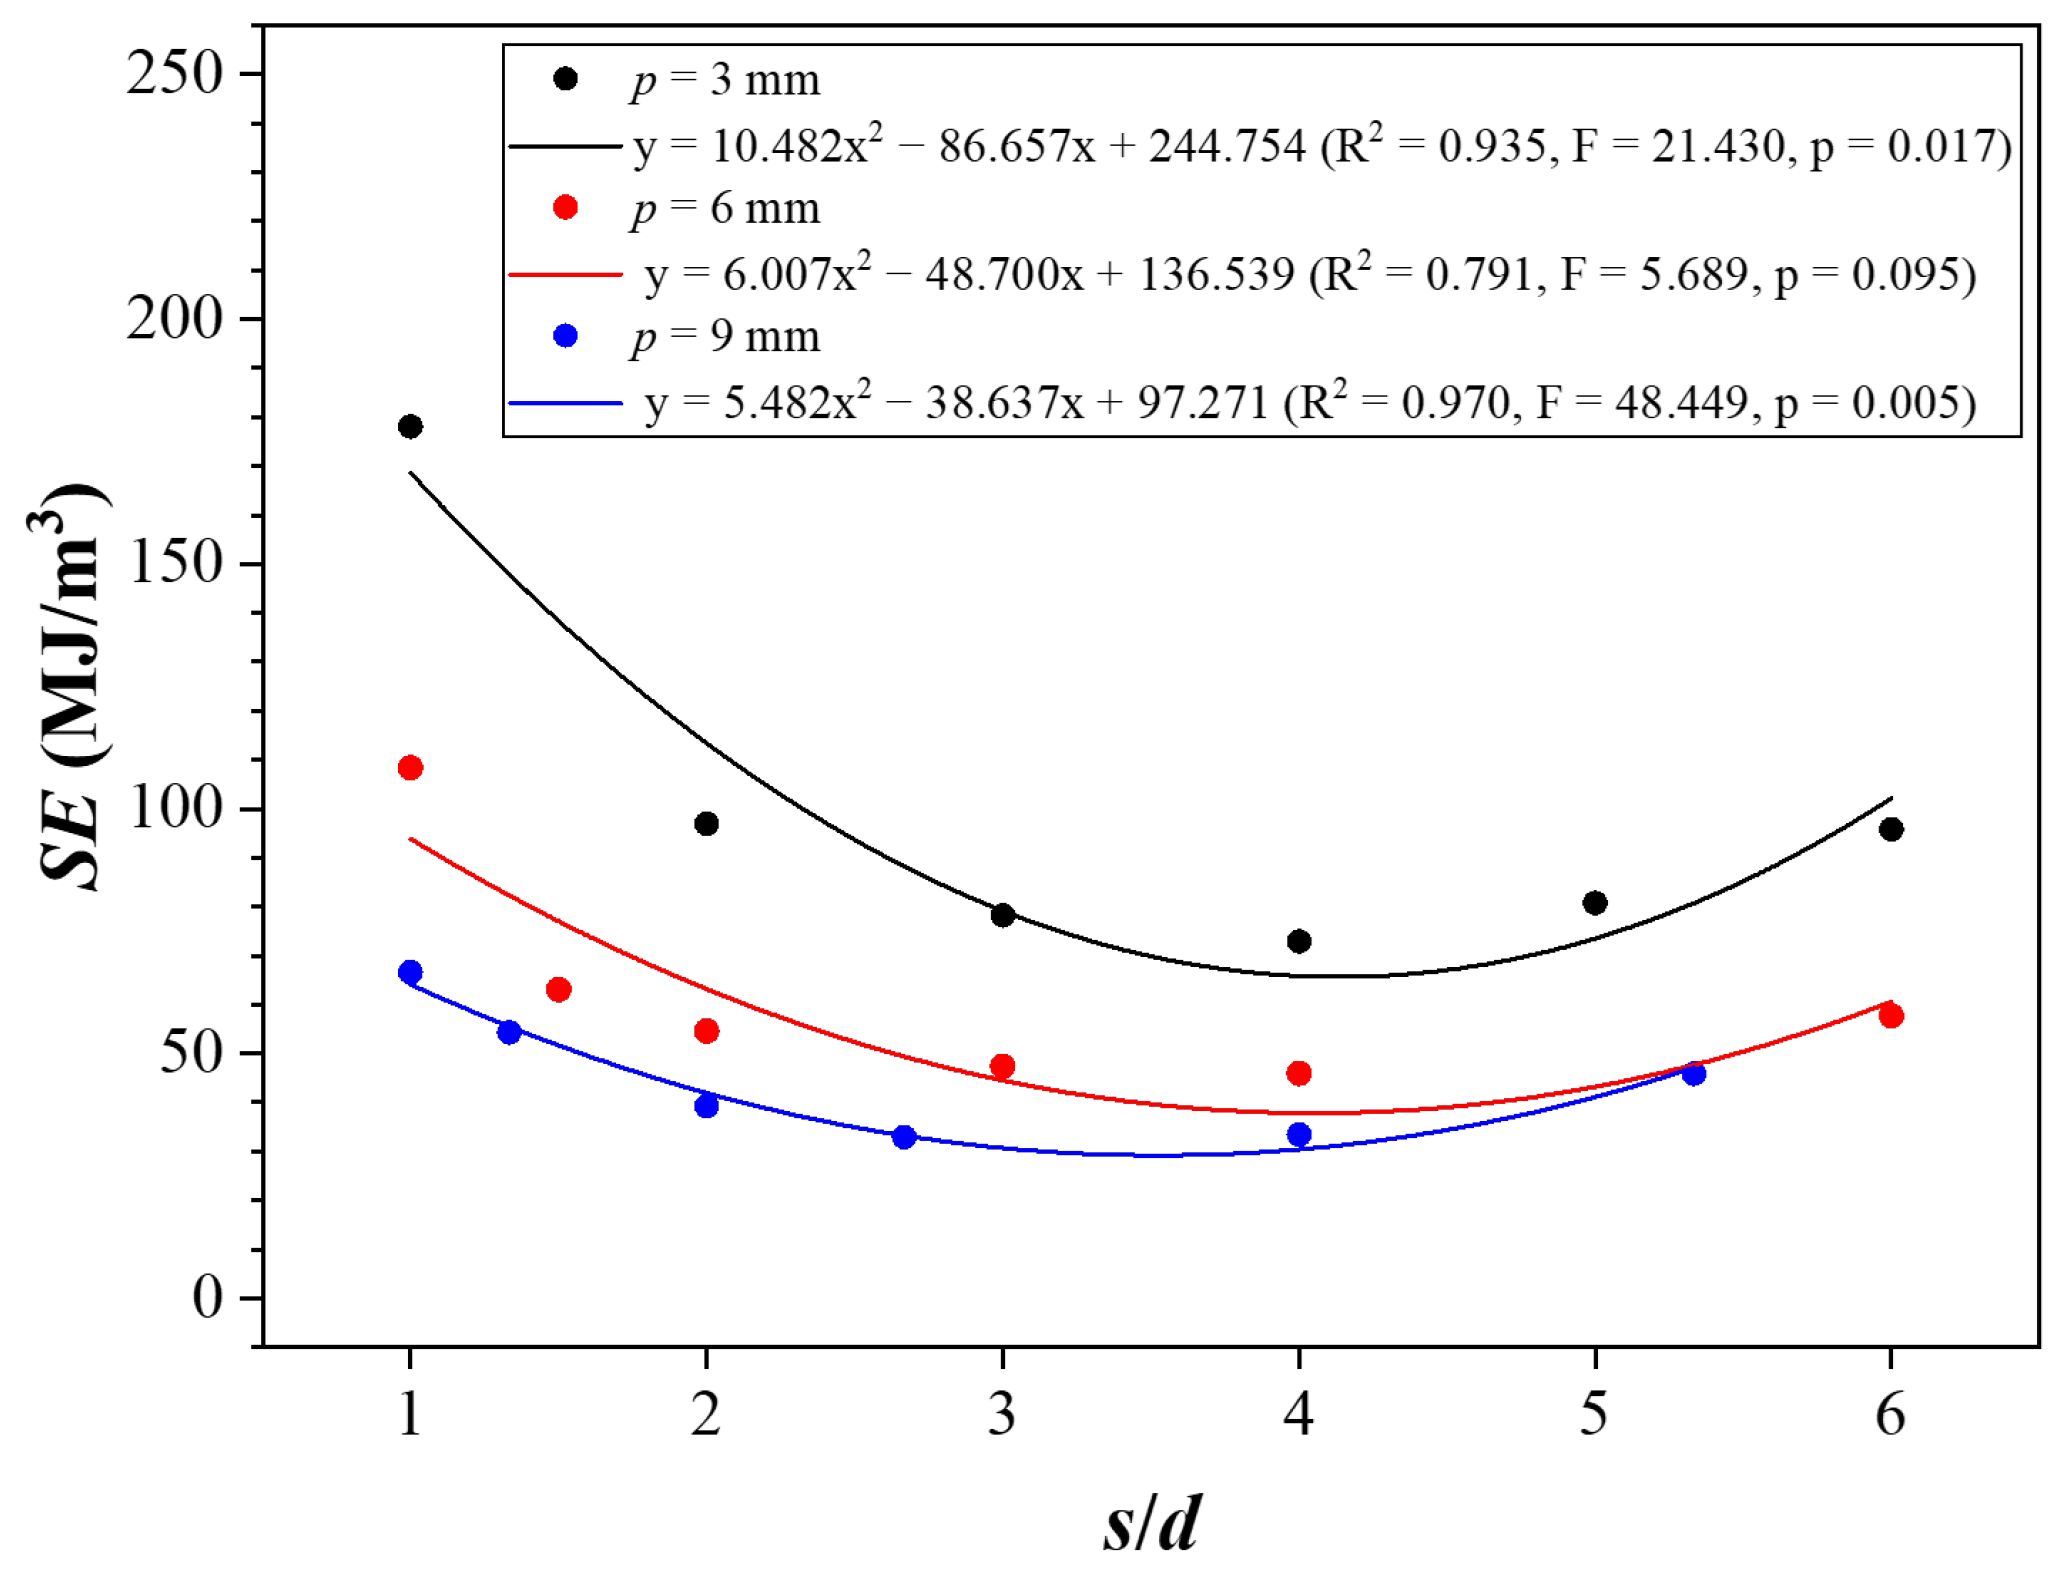
In this study, the SE was calculated using Equation (1) by collecting the rock fragments generated by cutting. The SE was found to be vary from 72.89 to 178.02 MJ/m3 for cutting with a penetration depth of 3 mm, from 45.95 to 108.33 MJ/m3 for cutting with a 6 mm depth, and from 32.89 to 66.61 MJ/m3 for cutting with 9 mm depth (Table 2). This indicates an increase in SE with increasing penetration depth. The SE was the highest when s/d was 1 compared to when s/d was greater than 5 at all penetration depths, indicating that cutting was performed exclusively in the relieved mode.
Figure 14 shows the relationship between SE and s/d according to the penetration depth. At all penetration depths, a significant correlation between SE and s/d was observed, with a 90% confidence level (R2 = 0.791–0.970, F = 5.689–48.449, p = 0.005–0.095). The corresponding regression equations and statistical parameters are listed in Table 6. The regression curves indicated that the minimum SE was 65.65 MJ/m3 at a 3 mm penetration depth, decreasing to 37.83 MJ/m3 and 29.19 MJ/m3 at depths of 6 mm and 9 mm, respectively. Additionally, the optimal s/d ratio for minimizing SE, irrespective of the penetration depth, was found to be between 3 and 5. This is consistent with the results of Bilgin et al. [3], who found that the optimal s/d for a conical pick was between 2 and 5. Table 8 lists the optimal s/d ratios derived from the regression curve, which illustrates the SE and s/d relationships.

3.2.2. Comparison with SE Methodology

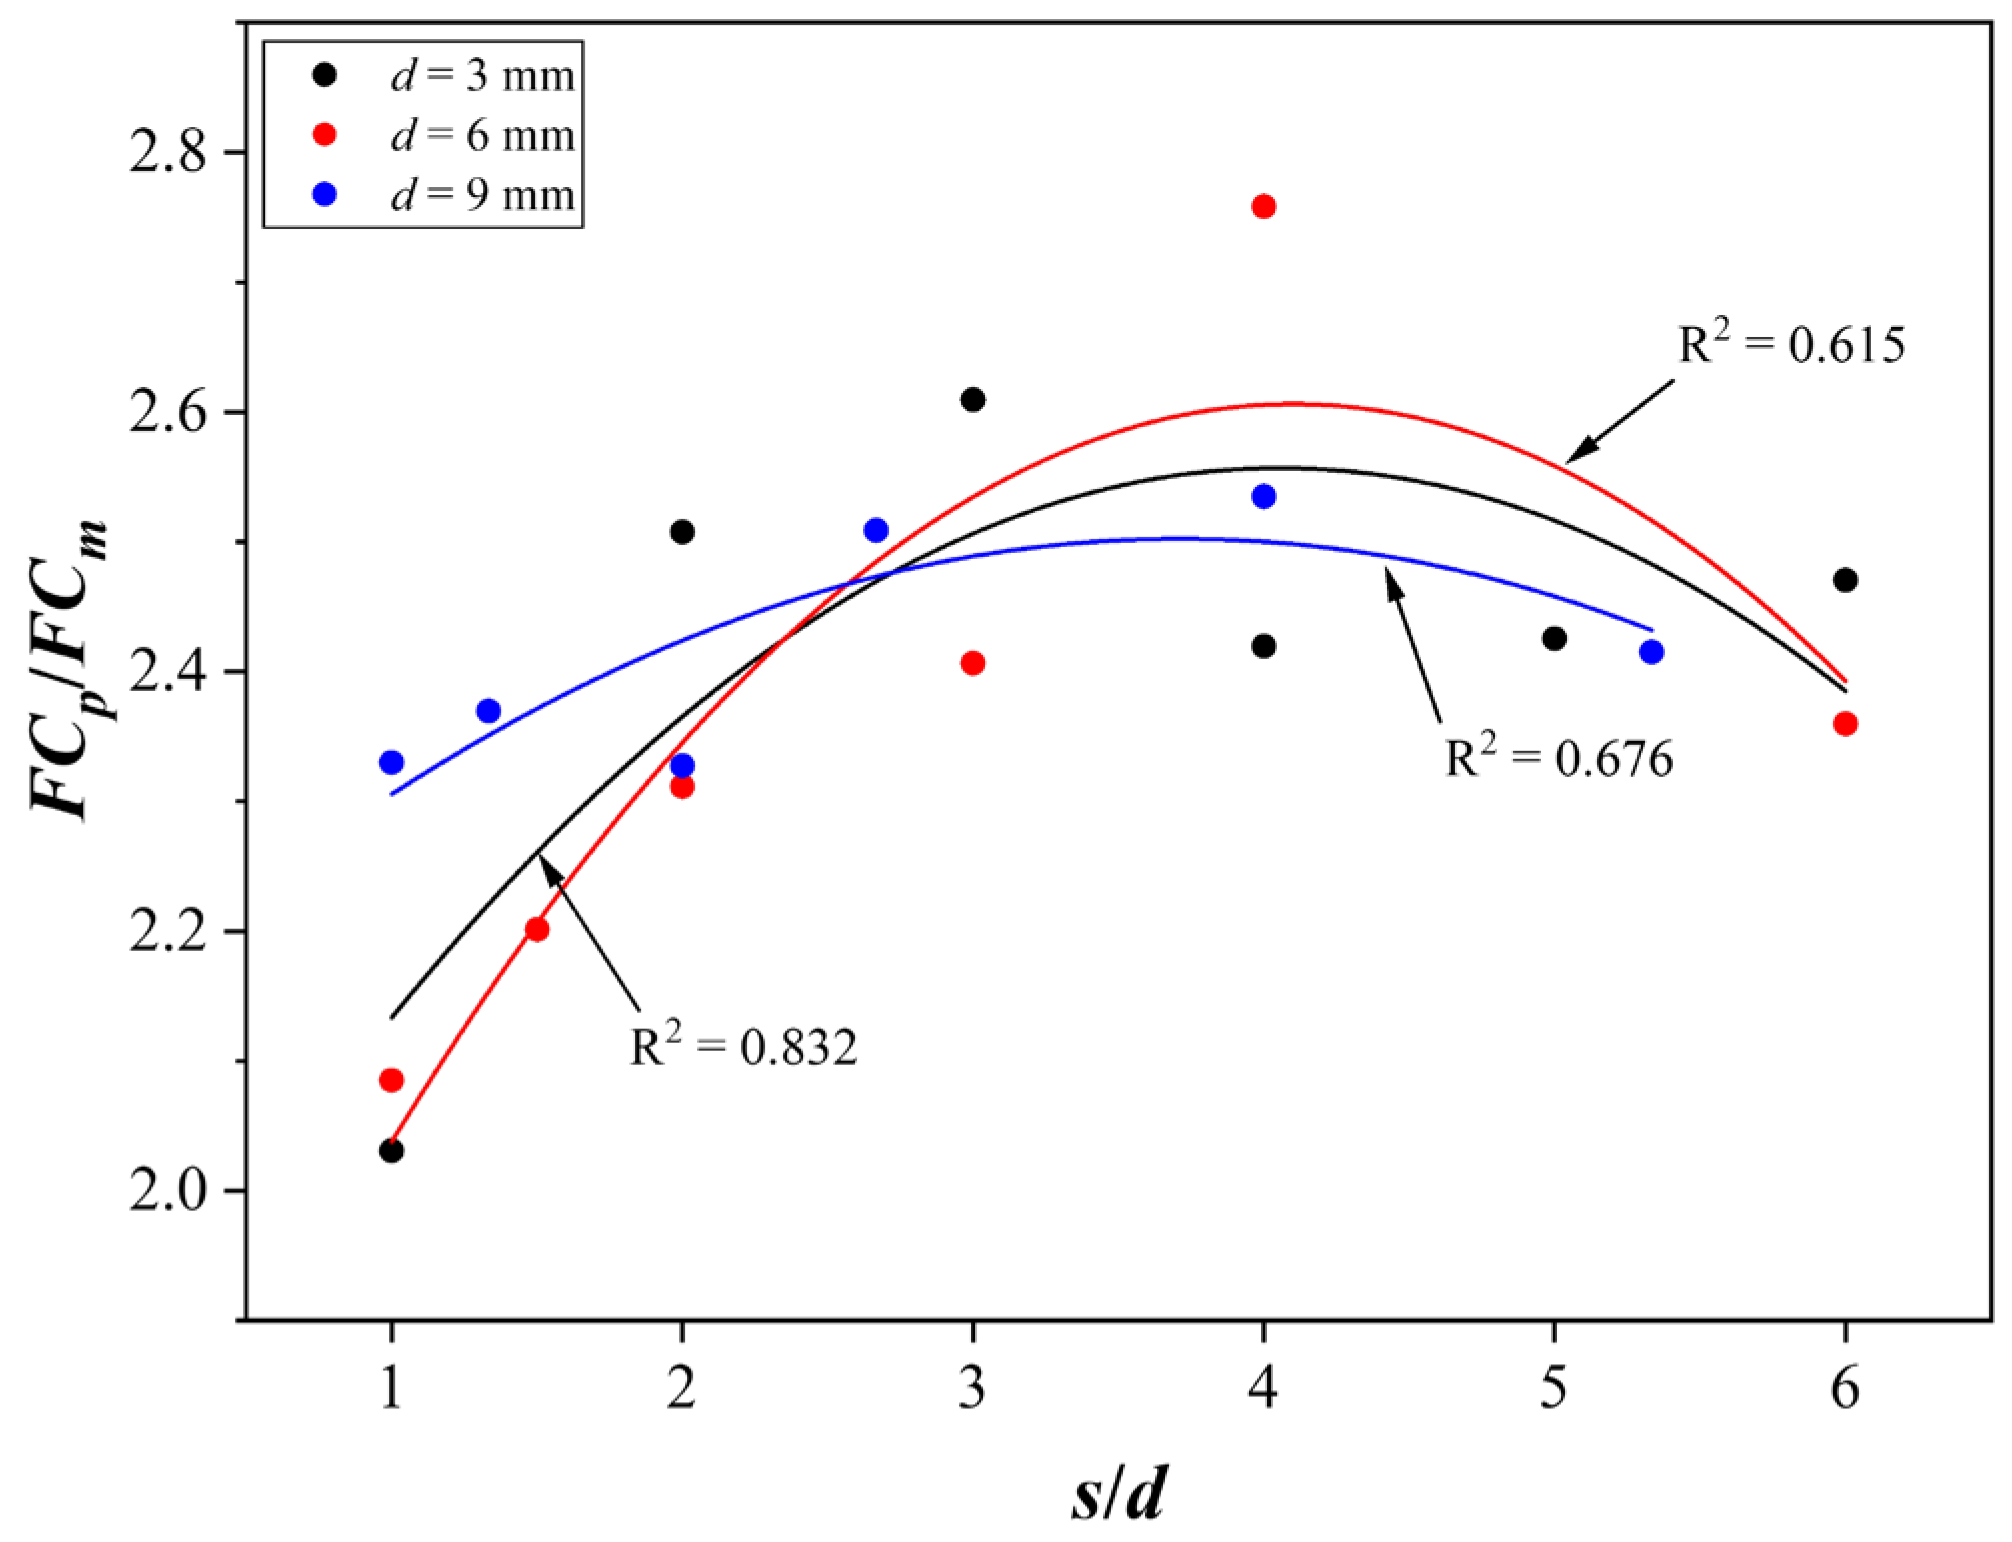
The relationship between FCp/FCm and s/d is shown in Figure 15, according to penetration depth. As confirmed in Section 3.1.2, a parabolic relationship was observed, indicating that FCp/FCm reaches its maximum value at a specific s/d (s/dFC). The s/dFC was found to be between 3 and 5, which corresponds to the optimal s/d range. Therefore, it may be seen that s/dFC can serve as a substitute for the optimal s/d determined by the SE methodology. Figure 16 illustrates the proposed methodology, based on these findings.
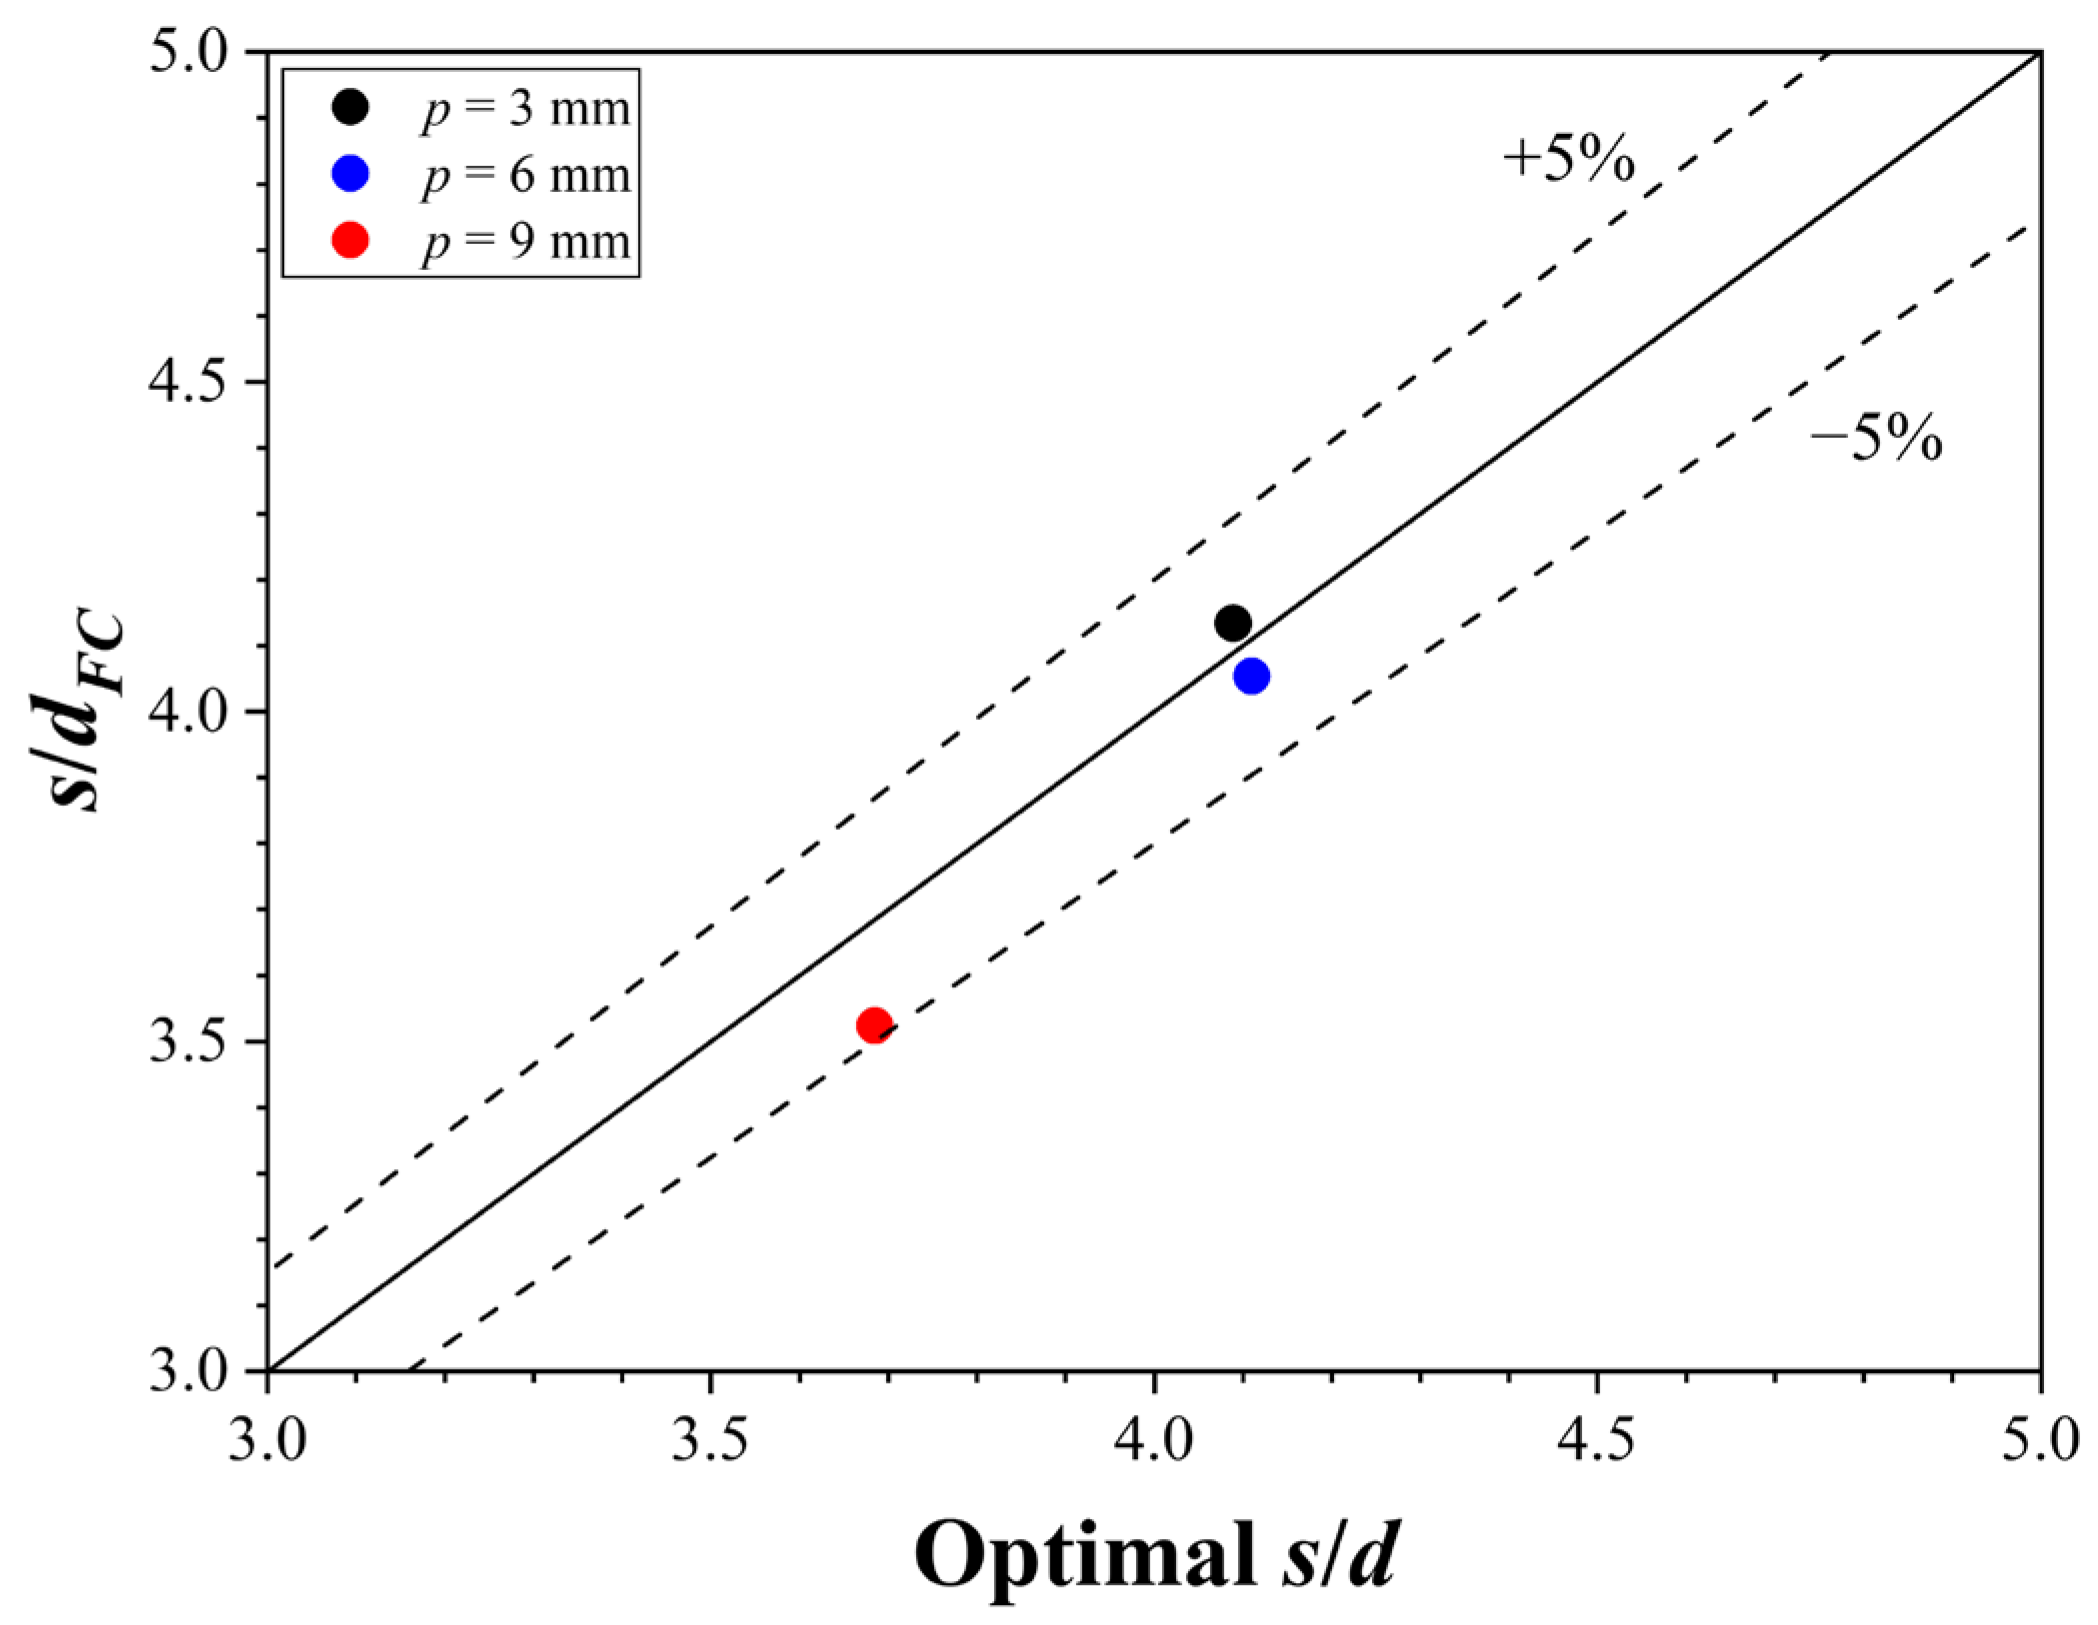
To validate the proposed methodology, the optimal s/d and s/dFC values were compared for each penetration depth. Figure 17 presents a comparison of s/dFC, derived from the FCp/FCm and s/d relationship, with the optimal s/d ascertained through SE methodology. The discrepancy between the optimal s/d and s/dFC was found to be less than 5%, demonstrating high precision. Consequently, the simplified approach introduced in this study has been demonstrated to be highly accurate in determining optimal cutting conditions.

3.2.3. Assessment of Proposed Methodology

To further verify the methodology proposed in this study, the data obtained from the LCM test, using drag-type tools performed in four studies, were analyzed. Table 9 shows a summary of the LCM tests from the references and this study, including the cutting tool used, rock type, penetration depth, and the resulting optimal s/d and s/dFC. It is noteworthy that the optimal s/d ratio was determined by the regression curve. Additionally, some cases were excluded from the analysis because either the correlation between SE and s/d or the correlation between FCp/FCm and s/d was not clear, or the optimal s/d or s/dFC could not be determined.
Figure 18 compares s/dFC with the optimal s/d in Table 9. In all cases, the error of s/dFC for the optimal s/d was less than approximately 20%, and the coefficient of determination was 0.774. This demonstrates the potential generalizability of the proposed simplified approach for drag-type tools.

4. Conclusions

This study introduces a simplified approach for predicting optimal cutting conditions based on the tool forces measured during rock cutting. A laboratory-scale linear rock-cutting test was conducted on Finike limestone using a conical pick. Tool forces and the ratios between tool forces were analyzed in relation to cutting parameters such as penetration depth and spacing. The proposed prediction methodology was validated by comparing it with the SE methodology. The main conclusions are summarized as follows:
  • FC and FN exhibited linear and power function relationships, respectively, with increasing penetration depth and spacing. Spacing more significantly influenced both FC and FN than did penetration depth. However, the optimal cutting conditions could not be predicted based on the relationship between the tool forces and cutting parameters.
  • FNm/FCm exhibited a linear decrease as the penetration depth increased, but it did not show any correlation with the spacing. Additionally, FNm/FCm demonstrated the strongest correlation with s/d, increasing within the power function relationship as s/d increased. However, the optimal cutting conditions could not be predicted, even for the relationship between FNm/FCm and the cutting parameters.
  • FNp/FNm and FCp/FCm exhibited a parabolic relationship with s/d. They increased as s/d increased up to a certain point, after which they decreased, behavior similar to that observed for the relationship between SE and s/d. However, the relationship between FNp/FNm and s/d was not significant. Therefore, it was assumed that the optimal cutting conditions could be predicted based on the relationship between FCp/FCm and s/d.
  • The optimal s/d for the conical pick in Finike limestone was between 3 and 5, and FCp/FCm reached its maximum value when s/d was between 3 and 5. The difference between the optimal s/d and s/dFC was less than 5%. Furthermore, the proposed methodology showed reasonable agreement with the results of standard techniques, with a margin of error within 20%, when compared with the results of the LCM test performed in previous studies that employed drag-type tools.
It was found that the optimal cutting conditions could be predicted from the relationship between FCp/FCm and s/d. The proposed methodology provides valuable information for cutterhead design and ensures accelerated excavation during operation. However, this study considered only drag-type tools and limited rock types. Therefore, further research using other types of cutting tools and rocks is required to test the generalizability of the proposed methodology.

Author Contributions

H.-e.K. proposed the concept of the research, developed the study, and conducted the experiment. S.-p.H., W.-k.Y. and W.-s.K. contributed to reviewing the final paper and made recommendations for revisions. C.-y.K. and H.-k.Y. supervised the study and provided important suggestions. All authors have read and agreed to the published version of the manuscript.

Funding

This work was supported by a grant from the Korea Agency for Infrastructure Technology Advancement (KAIA), funded by the Ministry of Land, Infrastructure, and Transport (Grant RS-2024-00416524).

Data Availability Statement

The original contributions presented in the study are included in the article, further inquiries can be directed to the corresponding authors.

Conflicts of Interest

The authors declare no conflicts of interest.

References

  1. Bao, R.H.; Zhang, L.C.; Yao, Q.Y.; Lunn, J. Estimating the peak indentation force of the edge chipping of rocks using single point-attack pick. Rock Mech. Rock Eng. 2011, 44, 339–347. [Google Scholar] [CrossRef]
  2. Balci, C.; Bilgin, N. Correlative study of linear small and full-scale rock cutting tests to select mechanized excavation machines. Int. J. Rock Mech. Min. Sci. 2007, 44, 468–476. [Google Scholar] [CrossRef]
  3. Bilgin, N.; Demircin, M.A.; Copur, H.; Balci, C.; Tuncdemir, H.; Akcin, N. Dominant rock properties affecting the performance of conical picks and the comparison of some experimental and theoretical results. Int. J. Rock Mech. Min. Sci. 2006, 43, 139–156. [Google Scholar] [CrossRef]
  4. Vogt, D. A review of rock cutting for underground mining: Past, present, and future. J. S. Afr. Inst. Min. Metal. 2016, 116, 1011–1026. [Google Scholar] [CrossRef]
  5. Ayawah, P.E.A.; Kaba, A.G.A.; Gertsch, L.S. A novel approach for determining cutting geometry for TBM using full-scale laboratory linear rock cutting and PFC3D-based numerical simulations. Tunn. Undergr. Space Technol. 2024, 144, 105559. [Google Scholar] [CrossRef]
  6. Gertsch, R.; Gertsch, L.; Rostami, J. Disc cutting tests in Colorado Red Granite: Implications for TBM performance prediction. Int. J. Rock Mech. Min. Sci. 2007, 44, 238–246. [Google Scholar] [CrossRef]
  7. Rostami, J.; Ozdemir, L.; Nilson, B. Comparison between CSM and NTH hard rock TBM performance prediction models. In Proceedings of the Annual Technical Meeting of the Institute of Shaft Drilling Technology, Las Vegas, NV, USA, 1–3 May 1996. [Google Scholar]
  8. Chang, S.-H.; Choi, S.-W.; Bae, G.-J.; Jeon, S. Performance prediction of TBM disc cutting on granitic rock by the linear cutting test. Tunn. Undergr. Space Technol. 2006, 21, 271. [Google Scholar] [CrossRef]
  9. Copur, H.; Bilgin, N.; Balci, C.; Tumac, D.; Avunduk, E. Effects of Different Cutting Patterns and Experimental Conditions on the Performance of a Conical Drag Tool. Rock Mech. Rock Eng. 2017, 50, 1585–1609. [Google Scholar] [CrossRef]
  10. Abu Bakar, M.Z.; Gertsch, L.S. Evaluation of saturation effects on drag pick cutting of a brittle sandstone from full scale linear cutting tests. Tunn. Undergr. Space Technol. 2013, 34, 124–134. [Google Scholar] [CrossRef]
  11. Balci, C. Correlation of rock cutting tests with field performance of a TBM in a highly fractured rock formation: A case study in Kozyatagi-Kadikoy metro tunnel, Turkey. Tunnl. Undergr. Space Technol. 2009, 24, 423–435. [Google Scholar] [CrossRef]
  12. Balci, C.; Tumac, D. Investigation into the effects of different rocks on rock cuttability by a V-type disc cutter. Tunn. Undergr. Space Technol. 2012, 30, 183–193. [Google Scholar] [CrossRef]
  13. Ma, H.; Gong, Q.; Wang, J.; Yin, L.; Zhao, X. Study on the influence of confining stress on TBM performance in granite rock by linear cutting test. Tunn. Undergr. Space Technol. 2016, 57, 145–150. [Google Scholar] [CrossRef]
  14. Shaterpour-Mamaghani, A.; Copur, H.; Gumus, A.; Tumac, D.; Balci, C.; Erdogan, T.; Dogan, E.; Kocbay, A. Full-Scale linear cutting tests using a button cutter and deterministic performance prediction modeling for raise boring machines. Tunn. Undergr. Space Technol. 2022, 127, 104609. [Google Scholar] [CrossRef]
  15. Tumac, D.; Balci, C. Investigations into the cutting characteristics of CCS type disc cutters and the comparison between experimental, theoretical and empirical force estimations. Tunn. Undergr. Space Technol. 2015, 45, 84–98. [Google Scholar] [CrossRef]
  16. Copur, H.; Shaterpour-Mamaghani, A.; Tumac, D.; Balci, C. Relationships between performances of a button cutter and a disc cutter based on full-scale linear cutting tests. Acta Geotech. 2023, 19, 2731–2752. [Google Scholar] [CrossRef]
  17. Cho, J.W.; Jeon, S.; Jeong, H.Y.; Chang, S.H. Evaluation of cutting efficiency during TBM disc cutter excavation within a Korean granitic rock using linear-cutting-machine testing and photogrammetric measurement. Tunn. Undergr. Space Technol. 2013, 35, 37–54. [Google Scholar] [CrossRef]
  18. Pan, Y.; Liu, Q.; Peng, X.; Liu, Q.; Liu, J.; Huang, X.; Cui, X.; Cai, T. Full-Scale Linear Cutting Tests to Propose Some Empirical Formulas for TBM Disc Cutter Performance Prediction. Rock Mech. Rock Eng. 2019, 52, 4763–4783. [Google Scholar] [CrossRef]
  19. Copur, H. Linear stone cutting tests with chisel tools for identification of cutting principles and predicting performance of chain saw machines. Int. J. Rock Mech. Min. Sci. 2010, 47, 104–120. [Google Scholar] [CrossRef]
  20. Jeong, H.; Jeon, S. Characteristic of size distribution of rock chip produced by rock cutting with a pick cutter. Geomech. Eng. 2018, 15, 811–822. [Google Scholar]
  21. Kim, H.E.; Ha, S.G.; Rehman, H.; Yoo, H.K. Analysis of Mechanical Excavation Characteristics by Pre-Cutting Machine Based on Linear Cutting Tests. Appl. Sci. 2023, 13, 1205. [Google Scholar] [CrossRef]
  22. Copur, H.; Balci, C.; Tumac, D.; Bilgin, N. Field and laboratory studies on natural stones leading to empirical performance prediction of chain saw machines. Int. J. Rock Mech. Min. Sci. 2011, 48, 269–282. [Google Scholar] [CrossRef]
  23. Choi, S.-W.; Kang, T.-H.; Lee, C.; Chang, S.-H. Measurement of Pick Cutting Volumes by a 3D Scanner. In Proceedings of the KSCE 2016 Convention, Jeju, Republic of Korea, 19–21 October 2016. [Google Scholar]
  24. Kim, H.E. Proposal of Optimum Cutting Condition for Pre-Cutting Machine and Indicator of Excavation Efficiency Based on Linear Cutting Tests. Ph.D. Thesis, Hanyang University, Seoul, Republic of Korea, 2023. [Google Scholar]
  25. Cho, J.W.; Jeon, S.; Yu, S.H.; Chang, S.H. Optimum spacing of TBM disc cutters: A numerical simulation using the three-dimensional dynamic fracturing method. Tunn. Undergr. Space Technol. 2010, 25, 230–244. [Google Scholar] [CrossRef]
  26. Moon, T.; Oh, J. A study of optimal rock-cutting conditions for hard rock TBM using the discrete element method. Rock Mech. Rock Eng. 2012, 45, 837–849. [Google Scholar] [CrossRef]
  27. Zhou, P.; Guo, J.; Sun, J.; Zou, D. Theoretical Research and Simulation Analysis on the Cutter Spacing of Double Disc Cutters Breaking Rock. KSCE J. Civ. Eng. 2019, 23, 3218–3227. [Google Scholar] [CrossRef]
  28. Gong, Q.M.; Zhao, J.; Hefny, A.M. Numerical simulation of rock fragmentation process induced by two TBM cutters and cutter spacing optimization. Tunn. Undergr. Space Technol. 2006, 21, 263. [Google Scholar] [CrossRef]
  29. Choi, S.O.; Lee, S.J. Three-dimensional numerical analysis of the rock-cutting behavior of a disc cutter using particle flow code. KSCE J. Civ. Eng. 2015, 19, 1129–1138. [Google Scholar] [CrossRef]
  30. Naghadehi, M.Z.; Mikaeil, R. Optimization of tunnel boring machine (TBM) disc cutter spacing in jointed hard rock using a distinct element numerical simulation. Period. Polytech. Civ. Eng. 2017, 61, 56–65. [Google Scholar] [CrossRef]
  31. Jiang, B.; Zhao, G.F.; Gong, Q.; Zhao, X.B. Three-dimensional coupled numerical modelling of lab-level full-scale TBM disc cutting tests. Tunn. Undergr. Space Technol. 2021, 114, 103997. [Google Scholar] [CrossRef]
  32. Tang, M.; Huang, X.; Wang, S.; Zhai, Y.; Zhuang, Q.; Zhang, C. Study of the cutter-rock interaction mechanism during TBM tunnelling in mudstone: Insight from DEM simulations of rotatory cutting tests. Bull. Eng. Geol. Environ. 2022, 81, 298. [Google Scholar] [CrossRef]
  33. Wang, T.; Yan, C.; Zheng, H.; Ke, W.; Ali, S. Optimum spacing and rock breaking efficiency of TBM double disc cutters penetrating in water-soaked mudstone with FDEM. Tunn. Undergr. Space Technol. 2023, 138, 105174. [Google Scholar] [CrossRef]
  34. Jeong, H.; Choi, S.; Jeon, S. Effect of skew angle on the cutting performance and cutting stability of point-attack type picks. Tunn. Undergr. Space Technol. 2020, 103, 103507. [Google Scholar] [CrossRef]
  35. ASTM D7012-14; Standard Test Methods for Compressive Strength and Elastic Moduli of Intact Rock Core Specimens under Varying States of Stress and Temperatures. ASTM International: West Conshohocken, PA, USA, 2014.
  36. ASTM D3967-08; Standard Test Method for Splitting Tensile Strength of Intact Rock Core Specimens with Flat Loading Platens. ASTM International: West Conshohocken, PA, USA, 2008.
  37. ASTM C97/C97M-15; Standard Test Methods for Absorption and Bulk Specific Gravity of Dimension Stone. ASTM International: West Conshohocken, PA, USA, 2015.
  38. He, X.; Xu, C. Specific energy as an index to identify the critical failure mode transition depth in rock cutting. Rock Mech. Rock Eng. 2016, 49, 1461–1478. [Google Scholar] [CrossRef]
  39. Wang, X.; Su, O.; Wang, Q.F.; Liang, Y.P. Effect of cutting depth and line spacing on the cuttability behavior of sandstones by conical picks. Arab. J. Geosci. 2017, 10, 525. [Google Scholar] [CrossRef]
  40. Yang, W.; Xue, Y.; Zhang, X. Experimental study on rock fragmentation by the 19-inch TBM cutter and statistical analysis of debris. In Proceedings of the ISRM International Symposium—8th Asian Rock Mechanics Symposium (ARMS 2014), Sapporo, Japan, 14–16 October 2014. [Google Scholar]
  41. Gong, Q.M.; Zhao, J.; Jiang, Y.S. In situ TBM penetration tests and rock mass boreability analysis in hard rock tunnels. Tunn. Undergr. Space Technol. 2007, 22, 303–316. [Google Scholar] [CrossRef]
  42. Bilgin, N.; Copur, H.; Balci, C. Mechanical Excavation in Mining and Civil Industries, 1st ed.; CRC Press: New York, NY, USA, 2013; pp. 1–355. [Google Scholar]
  43. Khair, A.W. The Effect of Bit Geometry on Rock Cutting Efficiency. Appl. Occup. Environ. Hyg. 1996, 11, 695–700. [Google Scholar] [CrossRef]
  44. Cook, N.G.W. Analysis of hard-rock cuttability for machines. In Proceeding of the Tunnel and Shaft Conference, Minneapolis, MN, USA, 15–17 May 1968. [Google Scholar]
  45. Barker, J.S. A laboratory investigation of rock cutting using large picks. Int. J. Rock Mech. Min. Sci. 1964, 1, 519–534. [Google Scholar] [CrossRef]
  46. Park, J.Y.; Kang, H.; Lee, J.W.; Kim, J.H.; Oh, J.Y.; Cho, J.W.; Rostami, J.; Kim, H.D. A study on rock cutting efficiency and structural stability of a point attack pick cutter by lab-scale linear cutting machine testing and finite element analysis. Int. J. Rock Mech. Min. Sci. 2018, 103, 215–229. [Google Scholar] [CrossRef]
  47. Yasar, S. Determination of optimum rock cutting data through single pick cutting tests. Geotech. Lett. 2019, 9, 8–14. [Google Scholar] [CrossRef]
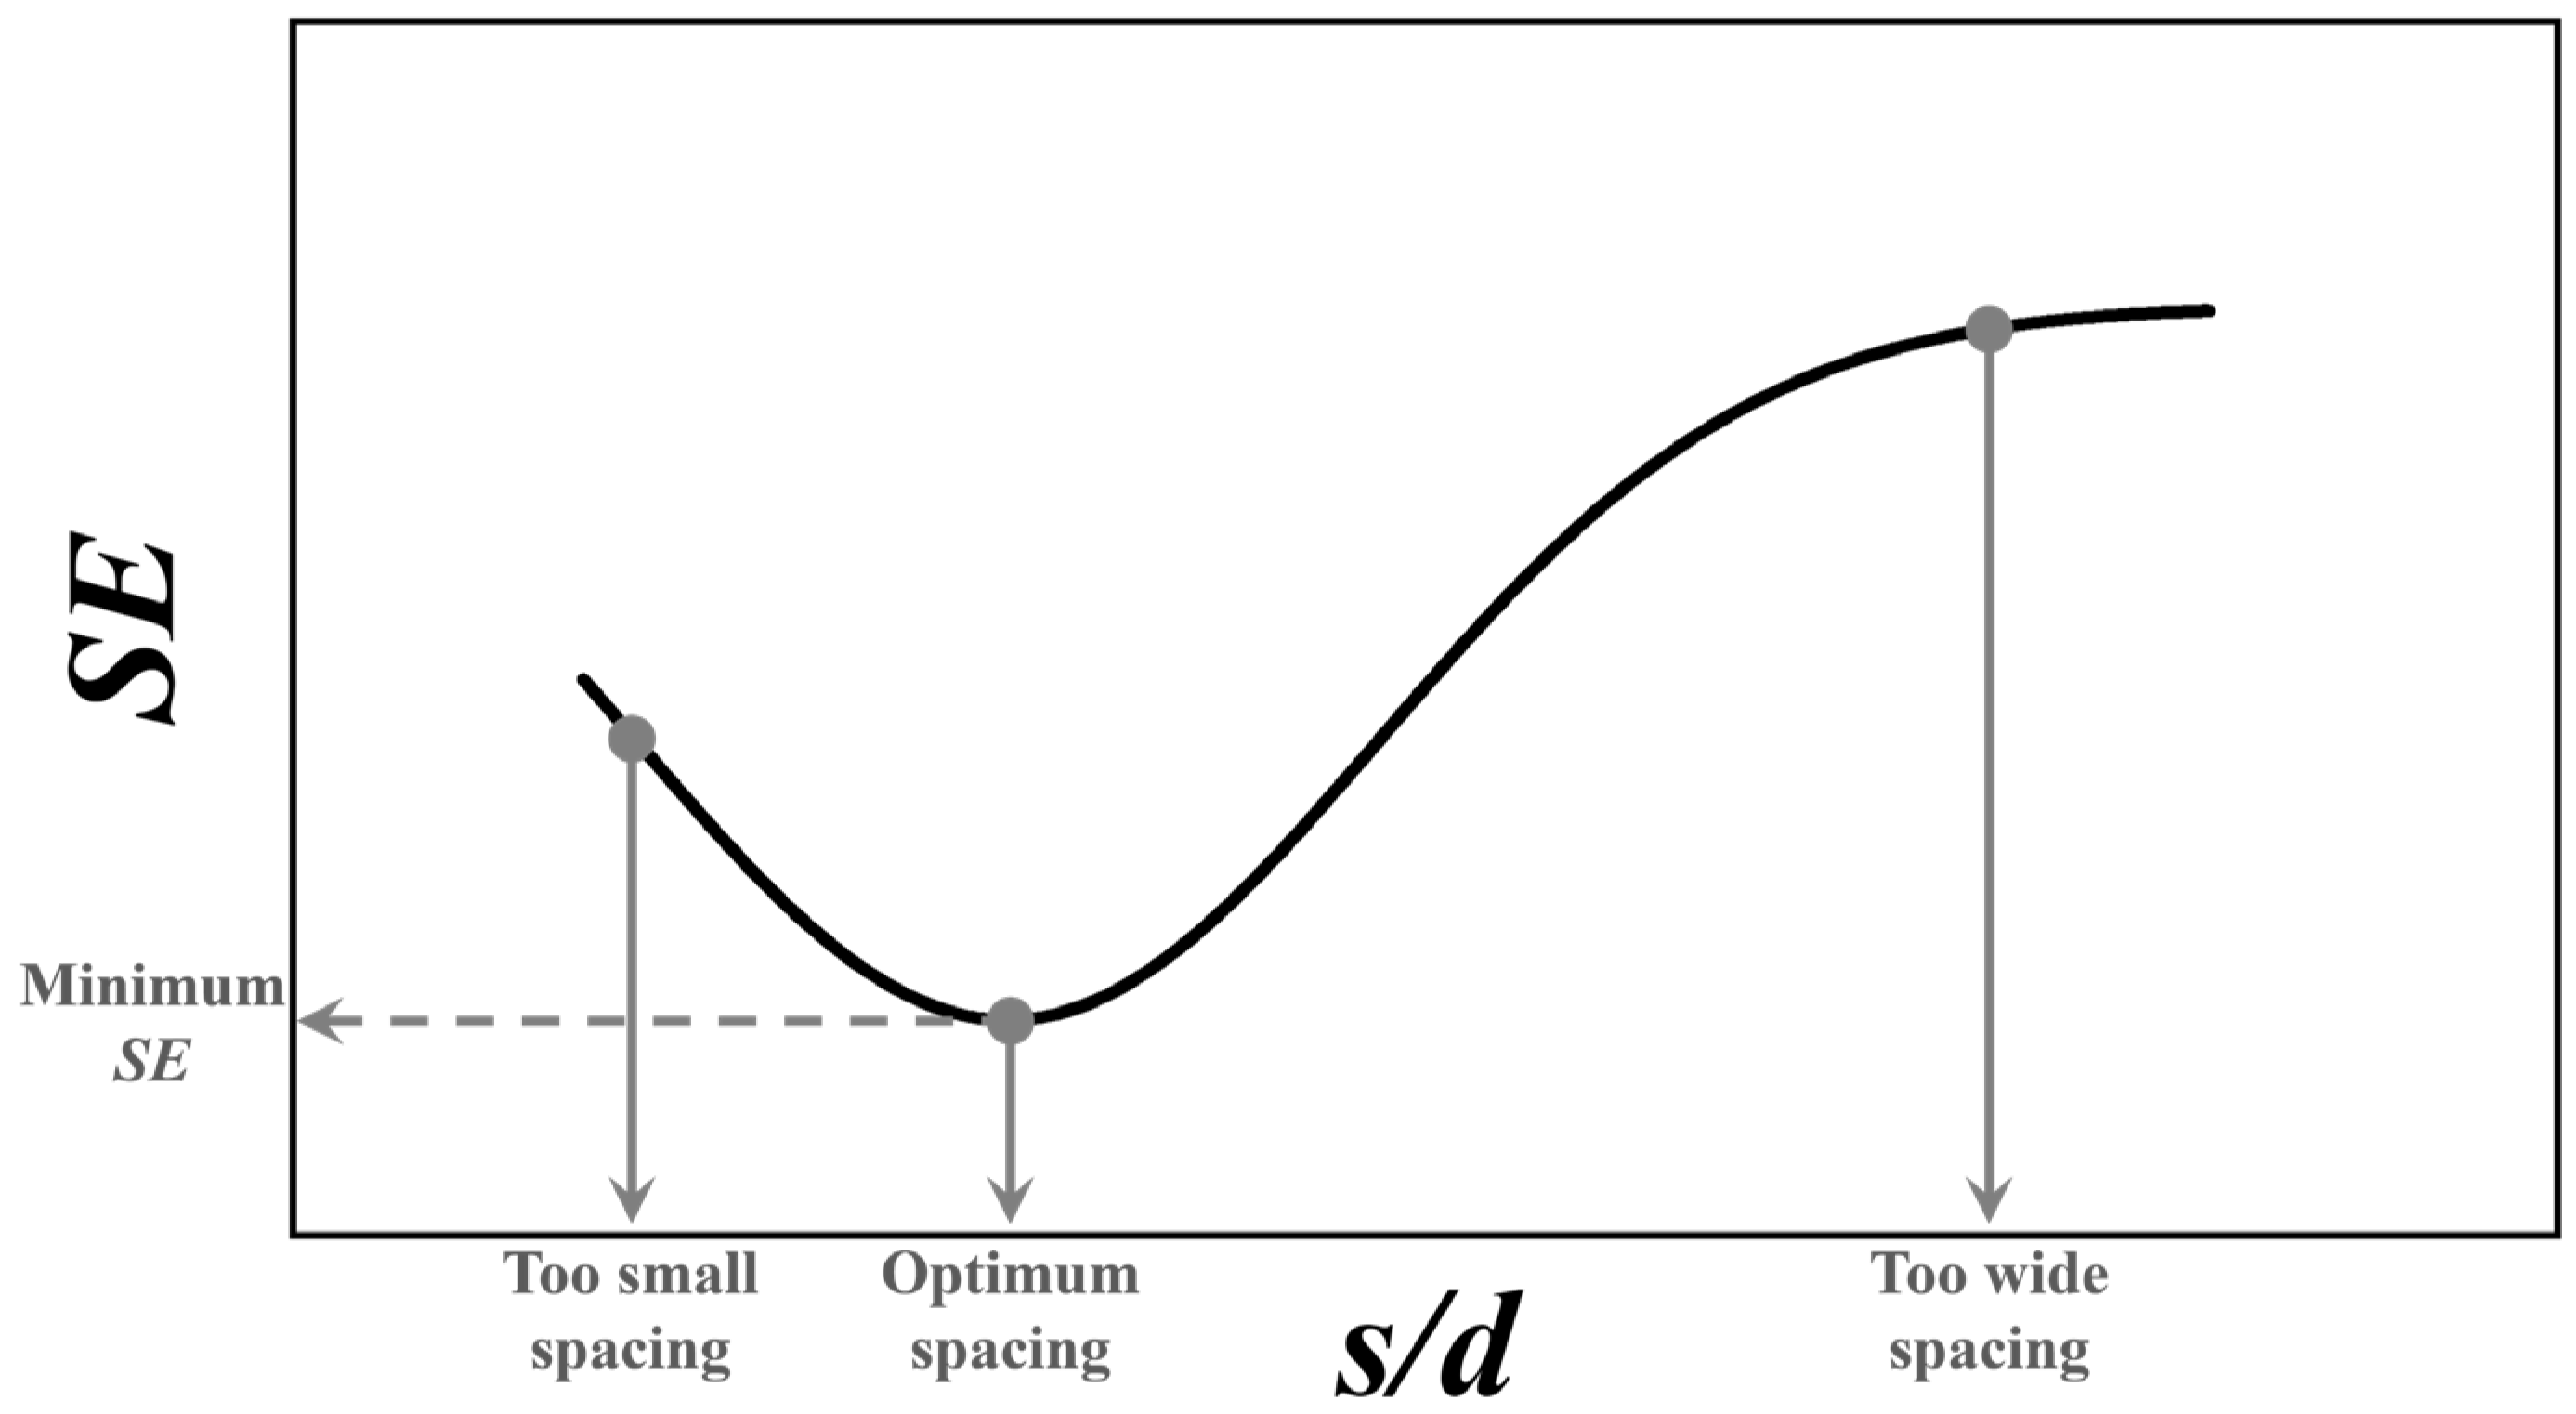
Figure 1. Relationship between spacing and SE (shown as spacing/penetration).
Buildings 14 02772 g001
Figure 2. Components of LLCM: (a) full view of LLCM, (b) detailed view of load cells and cutting tool, and (c) a rock sample after a series of cuttings.
Buildings 14 02772 g002aBuildings 14 02772 g002b
Figure 3. Conical pick used for cutting tests: (a) geometry and specifications of SM06 and (b) attack angle of conical pick.
Buildings 14 02772 g003
Figure 4. Tool forces recorded during a single cutting in the LLCM test.
Buildings 14 02772 g004
Figure 5. Variation of FCm and FCp with penetration depth.
Buildings 14 02772 g005
Figure 6. Variation of FNm and FNp with penetration depth.
Buildings 14 02772 g006
Figure 7. Variation of FCm and FCp with spacing.
Buildings 14 02772 g007
Figure 8. Variation of FNm and FNp with spacing.
Buildings 14 02772 g008
Figure 9. Relationship between FNm/FCm and penetration depth.
Buildings 14 02772 g009
Figure 10. Relationship between FNm/FCm and spacing.
Buildings 14 02772 g010
Figure 11. Relationship between FNm/FCm and s/d.
Buildings 14 02772 g011
Figure 12. Relationship between FNp/FNm and s/d.
Buildings 14 02772 g012
Figure 13. Relationship between FCp/FCm and s/d.
Buildings 14 02772 g013
Figure 14. Relationship between SE and s/d by penetration depth.
Buildings 14 02772 g014
Figure 15. Relationship between FCp/FCm and s/d by penetration depth.
Buildings 14 02772 g015
Figure 16. Description of a simplified approach for predicting optimal cutting conditions.
Buildings 14 02772 g016
Figure 17. Relationship between optimal s/d and s/dFC.
Buildings 14 02772 g017
Figure 18. Performance of a simplified approach for predicting optimal cutting conditions for various LCM tests [21,39,46,47].
Buildings 14 02772 g018
Table 1. Mechanical properties of Finike limestone.
Rock Nameρ (g/cm3)E (GPa)νσc (MPa)σt (MPa)
Finke limestone2.2221.10.13495
Table 2. Results of linear rock-cutting test with LLCM.
d
(mm)
s
(mm)
s/dFCm
(kN)
FNm
(kN)
FCp
(kN)
FNp
(kN)
FCp/FCmFNp/FNmFNm/FCmFNp/FCpSE
(MJ/m3)
3311.5670.4483.1830.9252.0312.0660.2860.291178.02
621.6500.5944.1391.2842.5082.1640.3600.31096.91
931.9940.7275.2041.9652.6102.7010.3650.37878.22
1242.1870.8345.2941.7962.4192.1540.3810.33972.89
1552.5330.9376.1142.0622.4252.2000.3700.33680.75
1862.7331.0376.7522.4402.4702.3520.3800.36195.80
6613.3250.9006.9331.3692.0851.5210.2710.197108.33
91.53.5060.9617.7181.6992.2011.7680.2740.22063.04
1223.8201.0938.8302.1352.3121.9530.2860.24254.57
1834.5941.37611.0554.1352.4063.0050.2990.37447.37
2444.9371.57513.6184.7832.7583.0360.3190.35145.95
3665.6561.92113.3463.7862.3601.9710.3400.28457.71
9914.8680.77711.3422.1822.3302.8090.1600.19266.61
121.335.1250.87812.1441.9722.3702.2470.1710.16354.26
1826.0661.42514.1883.6992.3282.5970.2350.26239.21
242.676.5701.81816.4833.7742.5092.0760.2770.22932.89
3647.1572.27118.1414.8402.5352.1310.3170.26733.46
485.338.1352.64419.6465.6152.4152.1230.3250.28645.87
Note: d is the penetration depth, and s is the spacing; FCm and FNm are the mean cutting and normal forces, respectively; FCp and FNp are the peak cutting and normal forces, respectively.
Table 3. Regression equations for tool forces based on penetration depth.
Regression EquationR2F-Valuep-Value
F C m = 0.701 d   +   0.037 0.80465.7890.000
F C p = 1.304 d   +   1.615 0.68027.6130.000
F N m = 0.361 d   +   0.145 0.3719.4250.007
F N p = 1.316 d   +   0.211 0.1953.3860.087
Table 4. Regression equations of tool forces based on spacing.
Regression EquationR2F-Valuep-Value
F C m = 0.916 s 0.554 0.676137.8440.000
F C p = 1.992 s 0.590 0.723151.2320.000
F N m = 0.175 s 0.695 0.932632.8020.000
F N p = 0.461 s 0.649 0.843257.6100.000
Table 5. Multiple regression models and statistical parameters of tool forces by penetration depth and spacing.
Regression EquationR2F-Valuep-ValueCoefficient
dsConstant
tp-Valuetp-Valuetp-Value
F C m = 0.507 d   +   0.081 s 0.229 0.9951454.4680.00030.8200.00023.6980.000−2.4420.027
F C p = 1.176 d   +   0.088 s 0.750 0.977320.8380.00013.4120.00012.2590.000−1.4980.155
F N m = 0.043 d   +   0.044 s   +   0.208 0.961183.1040.0003.0990.00714.9960.0002.6060.020
F N p = 0.103 d +   0.094 s   +   0.538 0.83939.1890.0001.5570.1406.8590.0001.4290.173
Table 6. Regression equations for ratios between tool forces considering penetration depth and s/d.
Regression EquationR2F-Valuep-Value
F N m / F C m = 0.018 d +   0.410 0.50216.1340.001
F N m / F C m =   0.234 s / d 0.253 0.529397.1660.000
F N p / F N m = 0.064 s / d 2 +   0.461 s / d +   1.645 0.1541.3670.285
F C p / F C m = 0.043 s / d 2 +   0.343 s / d +   1.867 0.61411.9350.000
Table 7. Multiple regression models and statistical parameters of ratios between tool forces by penetration depth and spacing.
Regression EquationR2F-Valuep-ValueCoefficient
dsConstant
tp-Valuetp-Valuetp-Value
F N m / F C m   = 0.027 d + 0.004 s + 0.397 0.89262.0240.000−10.8820.0007.3640.00027.8530.000
F N p / F C p   = 0.024 d + 0.003 s + 0.374 0.66514.8980.000−5.4100.0003.2640.00514.6410.000
F C p / F C m = 0.016 d + 0.007 s + 2.364 0.1951.8180.196−0.8920.3861.9060.07622.6260.000
F N p / F N m = 0.009 d + 0.001 s + 2.212 0.0040.0270.9740.1790.8600.0420.9678.0560.000
Table 8. Regression equations for SE based on s/d.
d (mm)Regression EquationR2F-Valuep-Value
3 S E = 10.482 s / d 2 86.657 s / d + 244.754 0.93521.4300.017
6 S E = 6.007 s / d 2 48.700 s / d + 136.539 0.7915.6890.095
9 S E = 5.482 s / d 2 38.637 s / d + 97.271 0.97048.4490.005
Table 9. Summary of LCM tests obtained from the references and this study.
No.ReferencesCutting ToolsRock Typesσc (MPa)d (mm)Optimal s/ds/d FC
1This studyConical pickFinike limestone49.0034.134.09
64.054.11
93.523.69
2Kim et al. [21]Chisel pickCement mortar18.0033.342.88
63.263.22
93.383.46
29.3093.212.52
42.0033.463.11
62.992.86
93.232.59
51.8063.113.08
93.142.77
3Wang et al. [39]Conical pickSandstone17.9135.065.30
62.482.30
92.572.88
123.023.64
79.2032.822.92
63.444.16
93.843.01
4Park et al. [46]Conical pickCement mortar21.0043.513.17
3.113.58
63.273.03
41.0043.643.02
62.822.92
57.0043.444.16
2.392.20
62.872.78
2.832.69
5Yasar [47]Conical pickRed andesite72.8594.023.72
Grey andesite99.9295.945.16
Green tuff51.6595.925.12
Grey tuff62.6396.265.64
Brown vitric tuff88.1596.085.02
Yellow vitric tuff62.4893.682.59
Metasiltstone1.8995.574.50
Crystal tuff2.4494.004.26
Volcanic sandstone12.3496.406.37
Disclaimer/Publisher’s Note: The statements, opinions and data contained in all publications are solely those of the individual author(s) and contributor(s) and not of MDPI and/or the editor(s). MDPI and/or the editor(s) disclaim responsibility for any injury to people or property resulting from any ideas, methods, instructions or products referred to in the content.