Article

Enhancing Building Services in Higher Education Campuses through Participatory Science

1
Univ. Lille, IMT Nord Europe, JUNIA, Univ. Artois, ULR 4515—LGCgE, Laboratoire de Génie Civil et géo-Environnement, F-59000 Lille, France
2
Institut de Recherche, ESTP, 28 Avenue du Président Wilson, F-94230 Cachan, France
3
Lille University, 59650 Lille, France
*
Author to whom correspondence should be addressed.
Buildings 2024, 14(9), 2784; https://doi.org/10.3390/buildings14092784
Submission received: 26 July 2024 / Revised: 30 August 2024 / Accepted: 2 September 2024 / Published: 4 September 2024
(This article belongs to the Special Issue Smart Asset Management for Sustainable Built Environment)

Abstract

:
This paper explores how participatory science can enhance building services on a higher education campus. The use of participatory science aims to involve students, faculty members, and technical teams in improving the management of the campus through their participation in data collection and evaluation of the building services. It represents a valuable alternative for campuses needing more building monitoring. The paper also shows how the performance of participatory science could be improved by combining digital technologies such as Building Information Modeling (BIM) and artificial intelligence (AI). The framework is applied to the Faculty of Engineering at An-Najah National University to improve the building services of the campus. A combination of users’ feedback and AI-generated synthetic data is used to explore the performance of the proposed method. Results confirm the high potential of participatory science for improving the services and quality of life on higher education campuses. This is achieved through students’ active participation and involvement in data collection and reporting on their individual experiences.

1. Introduction

In recent years, the management of building services in higher education campuses has become increasingly complex, driven by the growing demand for sustainability, efficiency, and enhanced user experience [1,2]. Leveraging human sensing constitutes a valuable approach or a complement to the technical approach focusing on smart sensing [3,4,5,6]. Integrating human sensing through crowdsourcing provides a rich real-time data source and insights that traditional sensor-based systems may overlook [7,8,9]. Tapping into the lived experiences of individuals helps a deeper understanding of building dynamics [10], thereby enhancing the adaptability and resilience of these systems to meet users’ needs. Scholars have highlighted the emergent discourse on participatory approaches in building design and management [11,12,13]. They underscore the value of engaging users in data collection and decision-making, enhancing the adaptability and relevance of smart building solutions [14,15,16].
The concept of a smart campus presents challenges and opportunities that encompass the complexities of the higher education environment [17]. This concept has gained considerable attention [18]. The Internet of Things (IoT) has been the cornerstone of enhancing the efficiency and sustainability of campus facilities [19,20,21]. The literature on smart campuses covers a range of subtopics, such as energy management, security systems, infrastructure optimization, and data analytics [22,23,24].
Sustainability is a core concern in campus management [25], particularly as institutions strive to minimize their environmental impact while maintaining high service standards for users. Achieving campus sustainability involves reducing energy consumption, promoting inclusivity, and enhancing the educational environment through innovative practices [26,27].
Acknowledging the human element as a fundamental aspect of the smart campus has been widely recognized [28,29,30]. Many studies have underscored the importance of considering the experiences, preferences, and contributions of the individuals who inhabit and interact with the campus environment [31,32]. However, amidst the rapid proliferation of technology-driven initiatives, a significant disparity and inadvertent sidelining of the human element has emerged. While the discourse on smart campuses may reference the human component, the focus has been on the technological facets of smart campus development [2,33]. It is worth recognizing that while sensors provide essential data, they fall short in capturing the interactions between users and their environment [34]. This oversight underscores a gap in the smart campus narrative, i.e., a gap in the application and incorporation of user-driven contributions into the operational fabric of smart campuses.
Moreover, the participatory approach constitutes an excellent alternative in areas facing difficulties or restrictions in implementing smart sensors. This approach enables the capture of personal aspects of the user experience and enhances users’ engagement in building a smart campus. However, studies that emphasize user-centered approaches frequently underutilize technological tools, leading to challenges in scalability and integration [35,36,37]. This lack of connecting technology-driven solutions and user-centric approaches represents a real gap in the current literature.
This research addresses this gap by proposing a balanced framework that effectively integrates the participatory approach with advanced technologies such as AI, BIM, and web services. Unlike existing studies focusing on technological solutions like IoT and big data analytics, this research emphasizes the importance of incorporating user feedback and participatory approaches to enhance campus services and infrastructure. Previous studies have demonstrated the effectiveness of sensor-based systems in data collection, but often overlook the qualitative aspects of user experiences and interactions. The high potential of this framework will be illustrated through its application to the campus of the Faculty of Engineering at An-Najah National University. This application will investigate the transformational potential of users’ involvement in developing smart campus services. In addition, this paper introduces the use of artificial intelligence to generate data to prove the proposed framework.
In addition, this study is closely aligned with several Sustainable Development Goals (SDGs) [38], particularly SDG 11: Sustainable Cities and Communities, and SDG 4: Quality Education. SDG 4 highlights the need to provide inclusive, equitable, and high-quality education while promoting lifelong learning opportunities for all. By enhancing campus infrastructure and services through smart technology and participatory approaches, this research creates safer, more effective learning environments that support high-quality education. User feedback-driven improvements foster better learning conditions, improving students’ well-being and academic success. Additionally, the active involvement of users ensures that sustainability efforts are guided by real-time data, making them more adaptive and impactful. This approach directly supports SDG 7 by offering affordable solutions through data-driven insights to optimize systems and SDG 9 by fostering innovation in campus infrastructure and management, ultimately promoting sustainable practices.
This paper is structured as follows. First, it presents the research methodology of using participatory science to improve campus quality of life and services. Then, it describes the case study, including a description of the campus of the Faculty of Engineering at An-Najah National University, the construction of the digital model of the faculty environment, the construction of the participatory platform, and the analysis of the performance of the proposed framework using the AI-generated data. Finally, the last sections present a discussion of the results of applying the framework to the AI-generated data and the significant outcomes and recommendations of this research.

2. Methodology

The research methodology is based on the analysis of papers dealing with (i) the construction of a framework for smart systems [3,4,5,6,39,40,41,42], (ii) participatory science [12,15,16,43,44,45,46,47,48,49], and (iii) research on smart campuses [18,19,20,21,22,23,24]. These studies show that creating a participatory smart campus starts with a definition of the project goal and a comprehensive identification of the components of the campus, including the built environment, the expected services, and the campus stakeholders, including their roles and expectations.
Figure 1 describes the components of the methodology followed to construct a participatory smart campus service.
The construction starts by defining the system functions. It aims to determine the specific functions to perform, which could range from traffic management on the city scale to energy conservation on the building scale. It involves a detailed analysis of the context, its current challenges, and the opportunities for technological intervention. These functions are aligned with users’ needs and system sustainability to ensure. Clearly defined goals and functions help align the participatory project with broader development plans and ensure that all stakeholders have a shared understanding of the desired outcomes [50]. The project must have a clear purpose, with specific goals and objectives [47,51,52].
The system components include physical elements such as roads, buildings, or hardware and human components, such as stakeholders and end users, whose needs and interactions with the system are critical for its success. This phase outlines user engagement, from data collection to active decision-making. Determining the engagement level helps design participation methods appropriate for the project’s goals and the community’s capabilities [53,54].
The creation of a participatory science platform aims to provide web services [55,56]. It includes developing tools to support data collection [57], analysis [58], and validation [59].

3. Application to University Campus

This section presents the implementation of the proposed participatory framework at An-Najah University’s Faculty of Engineering. It shows how the proposed framework can be implemented and discusses its limitations and future improvements. It also illustrates how the AI-based approach could generate data for the proposed framework’s proof of concept.

3.1. Overview

An-Najah National University, situated in Nablus City, Palestine, is the city’s preeminent institution of higher education and the largest in the country. The university is located on the city’s western side, occupying a prominent position at one of the main entrances to Nablus. The engineering faculty at the university holds the distinction of being the largest in Palestine, both in terms of physical area and academic community. The faculty represents a crowded educational environment with more than 5000 users and an area of about 4000 square meters [60].
The general structure of the work is based on creating a digital environment that enables users to assess campus services. This structure entails digitizing the campus environment, including modeling buildings, defining users, and designing the communication channels between them. Figure 2 presents the framework architecture based on that presented in the methodology section.
The framework uses an online platform as the primary interface for user interaction and data exchange. This platform is conceptualized as a digital environment that encapsulates the diverse processes of the proposed framework, symbolized by the encompassing boundary observed in the system architecture visualization. The platform’s intuitive and user-friendly design allows for seamless navigation and engagement for users of varying technical proficiencies. It bridges the user’s data and the framework’s analytical capabilities, facilitating data entry and the retrieval of processed information. The following points describe the key main functionalities, features, and mechanisms of the platform:
I. User Registration
User registration is the starting point for interacting with the platform. Students, academic staff, administrative personnel, and security members engage with the system via a sign-up process. The user’s identity is authenticated upon creating an account, ensuring the system’s input is secured and validated. Verified users can then contribute to the system by providing feedback or data regarding their interaction with the campus environment.
II. Contribution Mechanism
The contribution mechanism within our framework is a streamlined process that enables users to provide information to campus facility assessments directly. Initiated through a user-friendly interface on the online platform, users select relevant identifiers for the floor and room, engage with an interactive blueprint for accuracy, and fill out a series of structured assessment parameters. They are also prompted to offer qualitative feedback, providing a rich narrative to accompany quantitative data. This input is subsequently submitted and integrated into the system’s databases, ensuring that each user’s experience contributes to the evolving digital representation of the campus. This mechanism captures the dynamic interplay between users and their environment, fostering a continuously adaptive smart campus model.
III. Data Integration and Management
User-generated data is stored in two central repositories: The Users and Contribution databases. The Users Database maintains essential profile information and a history of the user’s contributions, whereas the Contribution Database archives the specific input related to the campus facilities and environment.
IV. Building Information Modeling (BIM) Database
Concurrently, the system utilizes a BIM Database that contains detailed information about campus facilities, including identification numbers, spatial positioning, and various assessment parameters. This database is continuously updated to reflect any changes or modifications within the campus infrastructure, ensuring an up-to-date digital model of the physical campus.
V. API Functionality
An API is an intermediary that analyzes the collated data and generates comprehensive reports. These reports are synthesized by analyzing user-contributed data and BIM data, producing diagnostic assessments in text, graphs, charts, tables, and heat maps. This allows for a multidimensional view of the user-environment interactions, contributing valuable insights into the daily operations and user experiences on campus.
VI. System Interaction, Reporting, and Output
The system architecture facilitates interaction with various stakeholders, such as university administration and faculty managers. The system can initiate report requests; input variables such as duration, rating parameters, and assessment scales are specified. The generated reports are dispatched to the respective stakeholders, providing actionable insights that can influence policymaking and campus management strategies.
The flowchart in Figure 3 outlines the data flow, including user input, facility information, and AI-generated data. It shows how users’ contributions, stored in the User and Assessment databases, interact with the campus environment through an Online Participatory Platform, while facility data is managed via a BIM system using object-based modeling. Additionally, AI-driven data generation contributes synthetic data housed in the Mimicked Database to validate the system. The following section explains this study’s data collection, integration, and feedback mechanisms.

3.2. Facilities Mapping and Parameters Assessment

The research included creating a BIM detailing the faculty’s existing facilities; thirteen assessment parameters, ranging from cleanliness to safety, were identified to quantify user experiences precisely. These parameters were selected through collaboration with the university administration and students to determine the most critical aspects of building services that impact users’ daily experiences and ensure that the parameters align closely with the actual needs and priorities of the campus community. However, the parameters are adjustable based on context and time. Based on the services administration office, facilities are divided into five categories according to their use. Subsequent graphs describe the distribution of the selected parameters among the facilities (Figure 4).
We followed the object-based modeling and rooming system approaches [61,62,63] to digitize the faculty environment and build the BIM. Utilizing Autodesk Revit, we accurately digitized the faculty’s environment into a comprehensive BIM model. The building has 7 floors distributed over 3 basic blocks on a lot area of 4000 m2 and a floor area of around 20,000 m2. As shown in Figure 5, this model represents a digital documentation of the physical layout and is an essential asset for future enhancements, including integrating smart services.
The digitization process involved assigning identifiers to facilities using the university’s rooming system. The approach followed in this step is crucial in raising the maturity of the BIM and moving it from a Digital Model to a Digital Twin [8,64,65,66]. The BIM model includes 214 objects corresponding to a facility, a classroom, a corridor, an office, etc. (Figure 6).

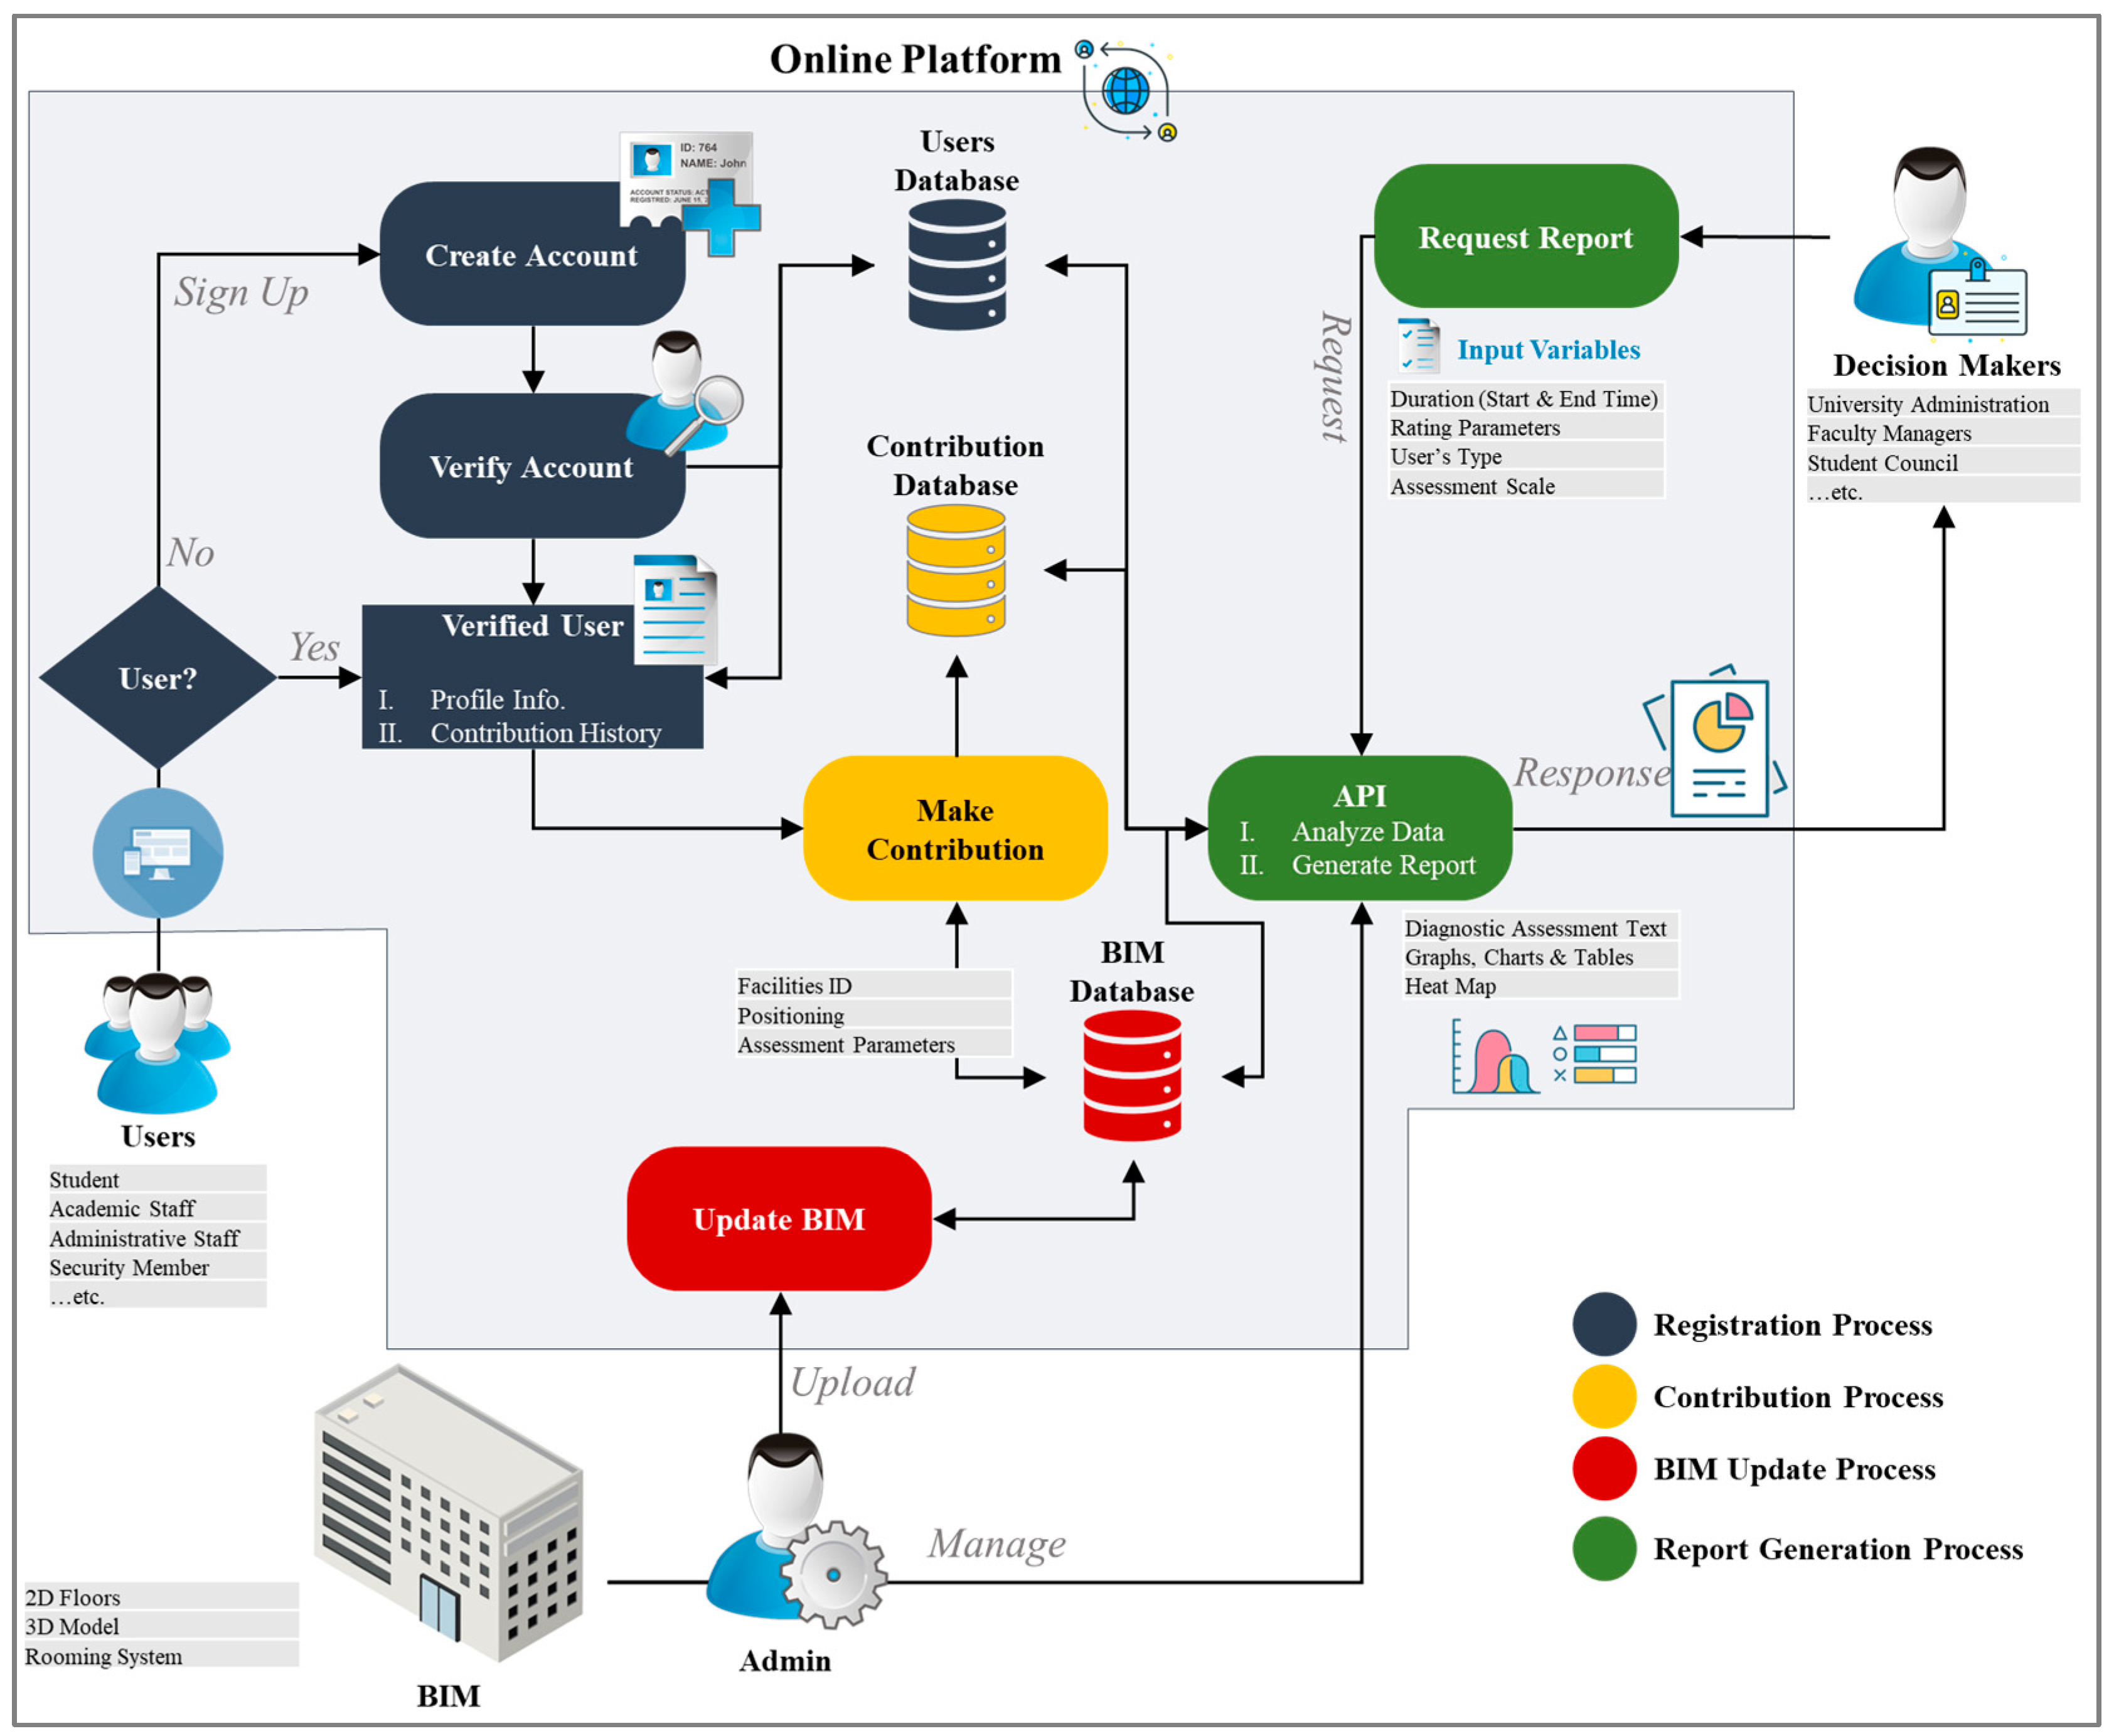
3.3. Online Participatory Platform

The online participatory platform was created as a gateway for users’ contributions and evaluations. It offers a welcome page that outlines the initiative and the project’s aims, enhancing user engagement through clear language and a welcoming layout. Users are guided through a structured process to submit their assessments. This process is facilitated by an intuitive interface that prompts users to select specific locations via drop-down lists and provide ratings for the predetermined assessment parameters. Additionally, the platform features an interactive aid where users can view floor blueprints to identify and assess facilities precisely, ensuring accuracy in their contributions. Each parameter provides a rating system and a comment section for users to elaborate on their experience or clarify their ratings, allowing for detailed qualitative feedback.
Moreover, the platform offers a formal and streamlined service for decision-makers. It includes a function to request reports automatically generated based on user input within a chosen timeframe. The automated report generation function compiles user ratings and comments into a cohesive report and harnesses real-time and historical data, presenting decision-makers with insights into facility performance across various parameters such as cleanliness, space adequacy, and equipment functionality. The algorithmic synthesis of quantitative ratings enables a multidimensional understanding of user experiences, thereby informing strategic improvements and the optimization of campus facilities and services. This functionality epitomizes the framework’s commitment to a user-centric approach, ensuring that the assessments reflect the campus community’s experiences and needs and translating these assessments and feedback into actionable intelligence for campus administration.

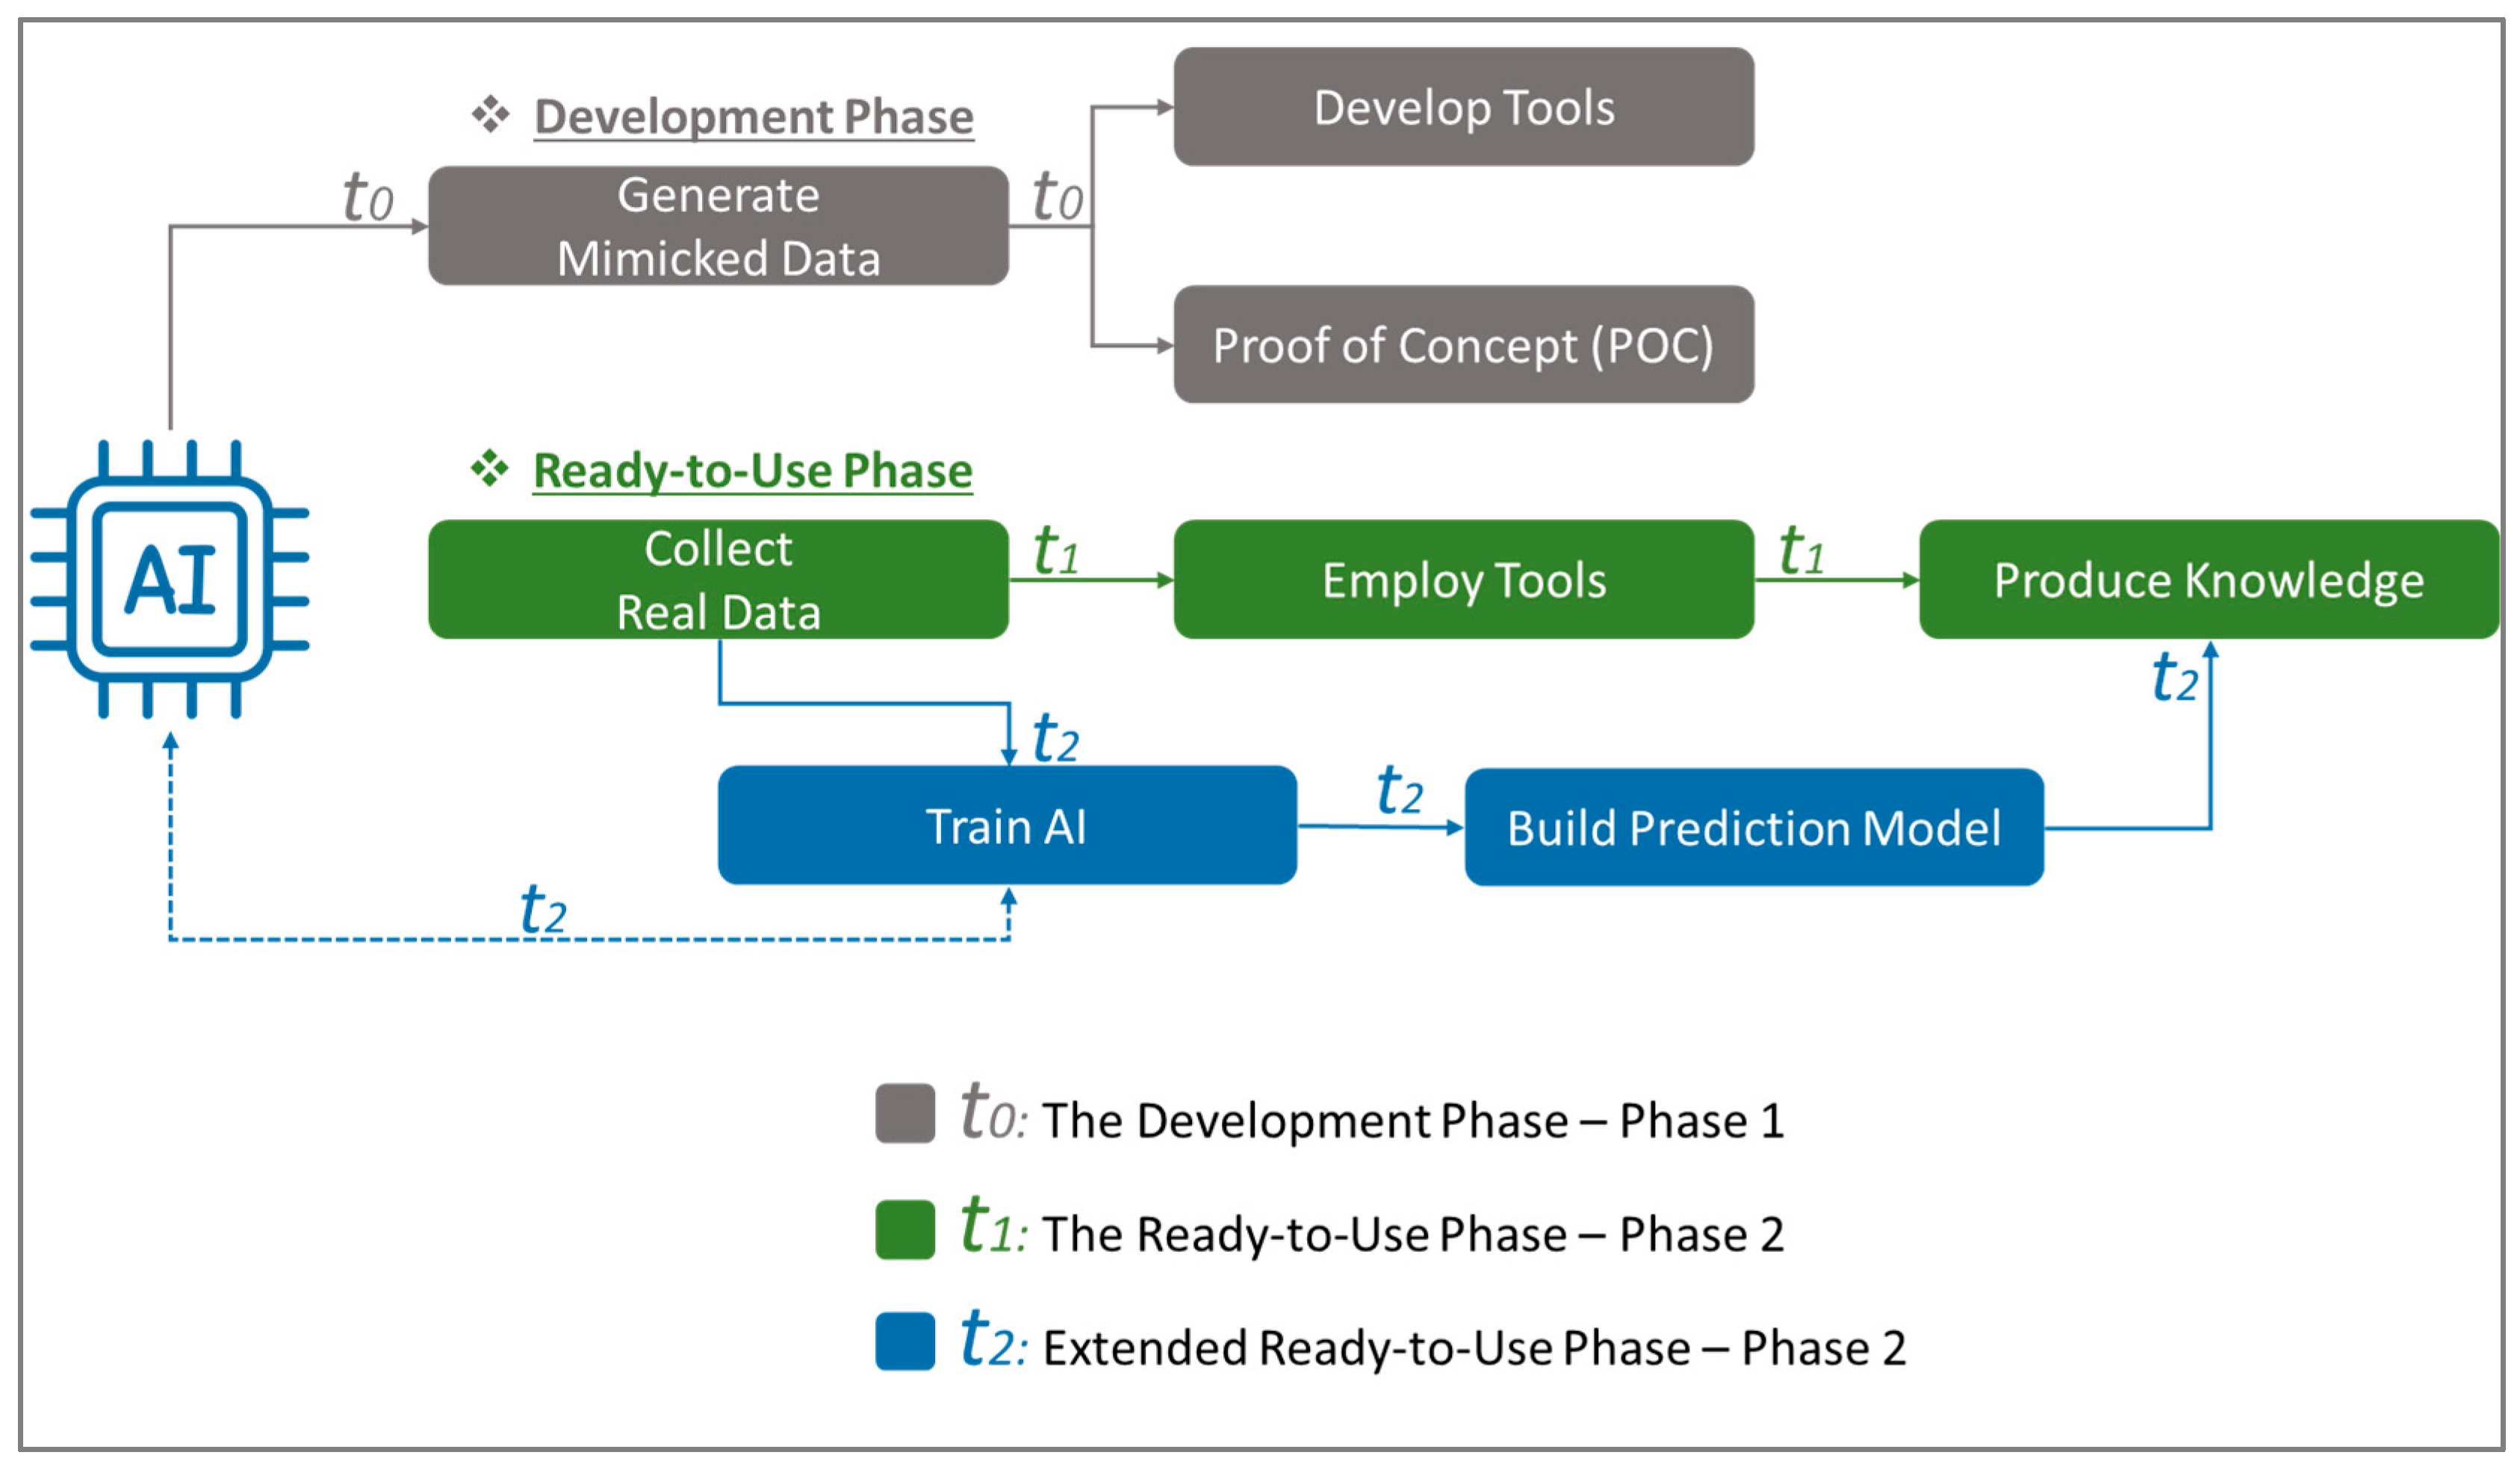
3.4. AI-Driven Data Generation

AI was used to generate data to validate the proposed system’s concept. This study is based on research into using AI, like ChatGPT [67], to generate synthetic data to validate concepts [68,69,70,71]. Figure 7 illustrates the approach used in this study.
Generating mimicked data involves creating artificial datasets replicating real data characteristics for various purposes, such as compromising privacy [72] and accelerating research [73]. Multiple methods, such as generative artificial intelligence and conditional generative adversarial networks, generate synthetic data in health sciences, economics, and software development [73,74]. This research used AI to create datasets representing the campus users and their assessment contributions. Figure 8 shows the work process used to generate the mimicked data. The method includes four steps.
The first step, ‘Setup Phase,’ defines user types such as students, academic staff, and security. It then distributes these users according to predefined ratios (e.g., 80% students and 10% academic staff). This step also includes defining facilities with specified types (e.g., academic use, open areas, etc.) and setting up assessment parameters (like cleanliness, temperature, etc.) that reflect the data points to be collected. Rules and constraints are established to ensure the validity of the generated data. For example, user types have associated element types they can assess—students may not evaluate faculty offices, and each element type may have unique assessment parameters.
The second step, ‘Prompt Generation’, takes inputs from the setup step to generate prompts. It involves assigning a user, facility, and parameter and then a rating to simulate the assessment process. The AI request preparation involves tailoring comments based on user type, facility type, and assessment parameters. Behavior-driven guidance is also introduced, ensuring the generated comments are congruent with expected user interactions. For example, when evaluating seating adequacy in a studio, the comment will differ based on the perspective: the student’s interaction is described as “use”, while the security’s interaction is described as “observe”. Hence, the student might comment on the poor quality of the seats, while the security personnel might remark on the crowded conditions. The third step, ‘Request ChatGPT’ utilizes ChatGPT to process the prompts and generate a list of comments that mimic real user feedback. The fourth step, ‘Generate Assessment’, involves reorganizing the data obtained from the AI, parsing the outputs, and assigning comments to create the mimicked dataset.
While this study critiques the over-reliance on technology in smart campus initiatives, it employs AI and technology to enhance, rather than replace, user participation. The AI-generated data is a preliminary step in validating the framework, ensuring its robustness before full-scale implementation with real user input. In addition, the rules, constraints, and guidelines used in employing AI in this study are based on real users’ contributions. This approach leverages technology to facilitate and improve the integration of user feedback, ultimately bridging the gap between technological advancements and the human element in smart campus development. By doing so, the framework ensures that user contributions remain central to the smart transformation process.

4. Results

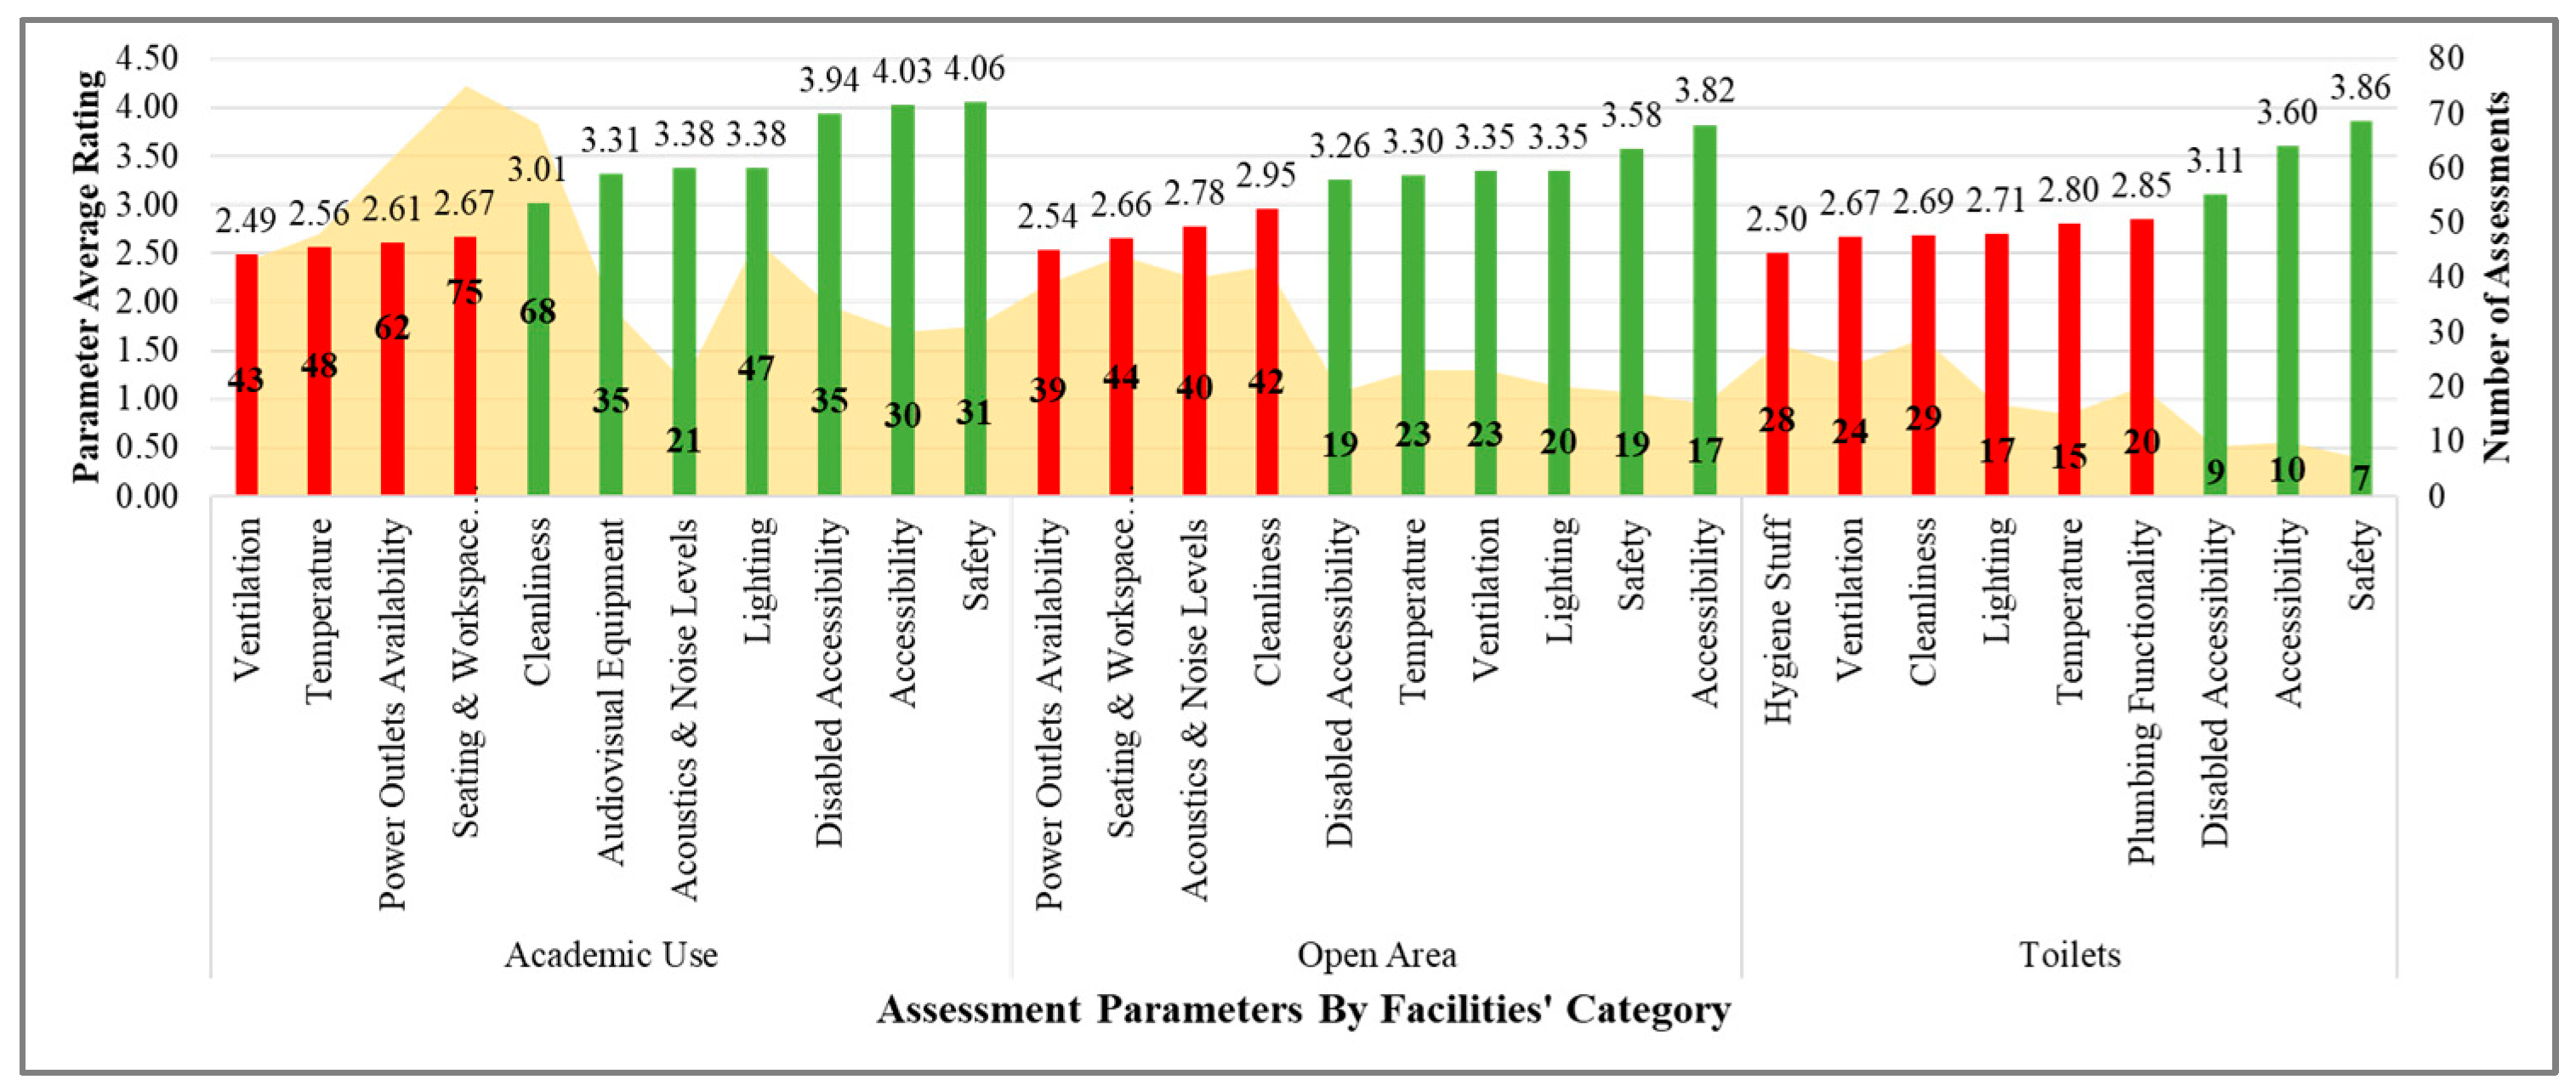
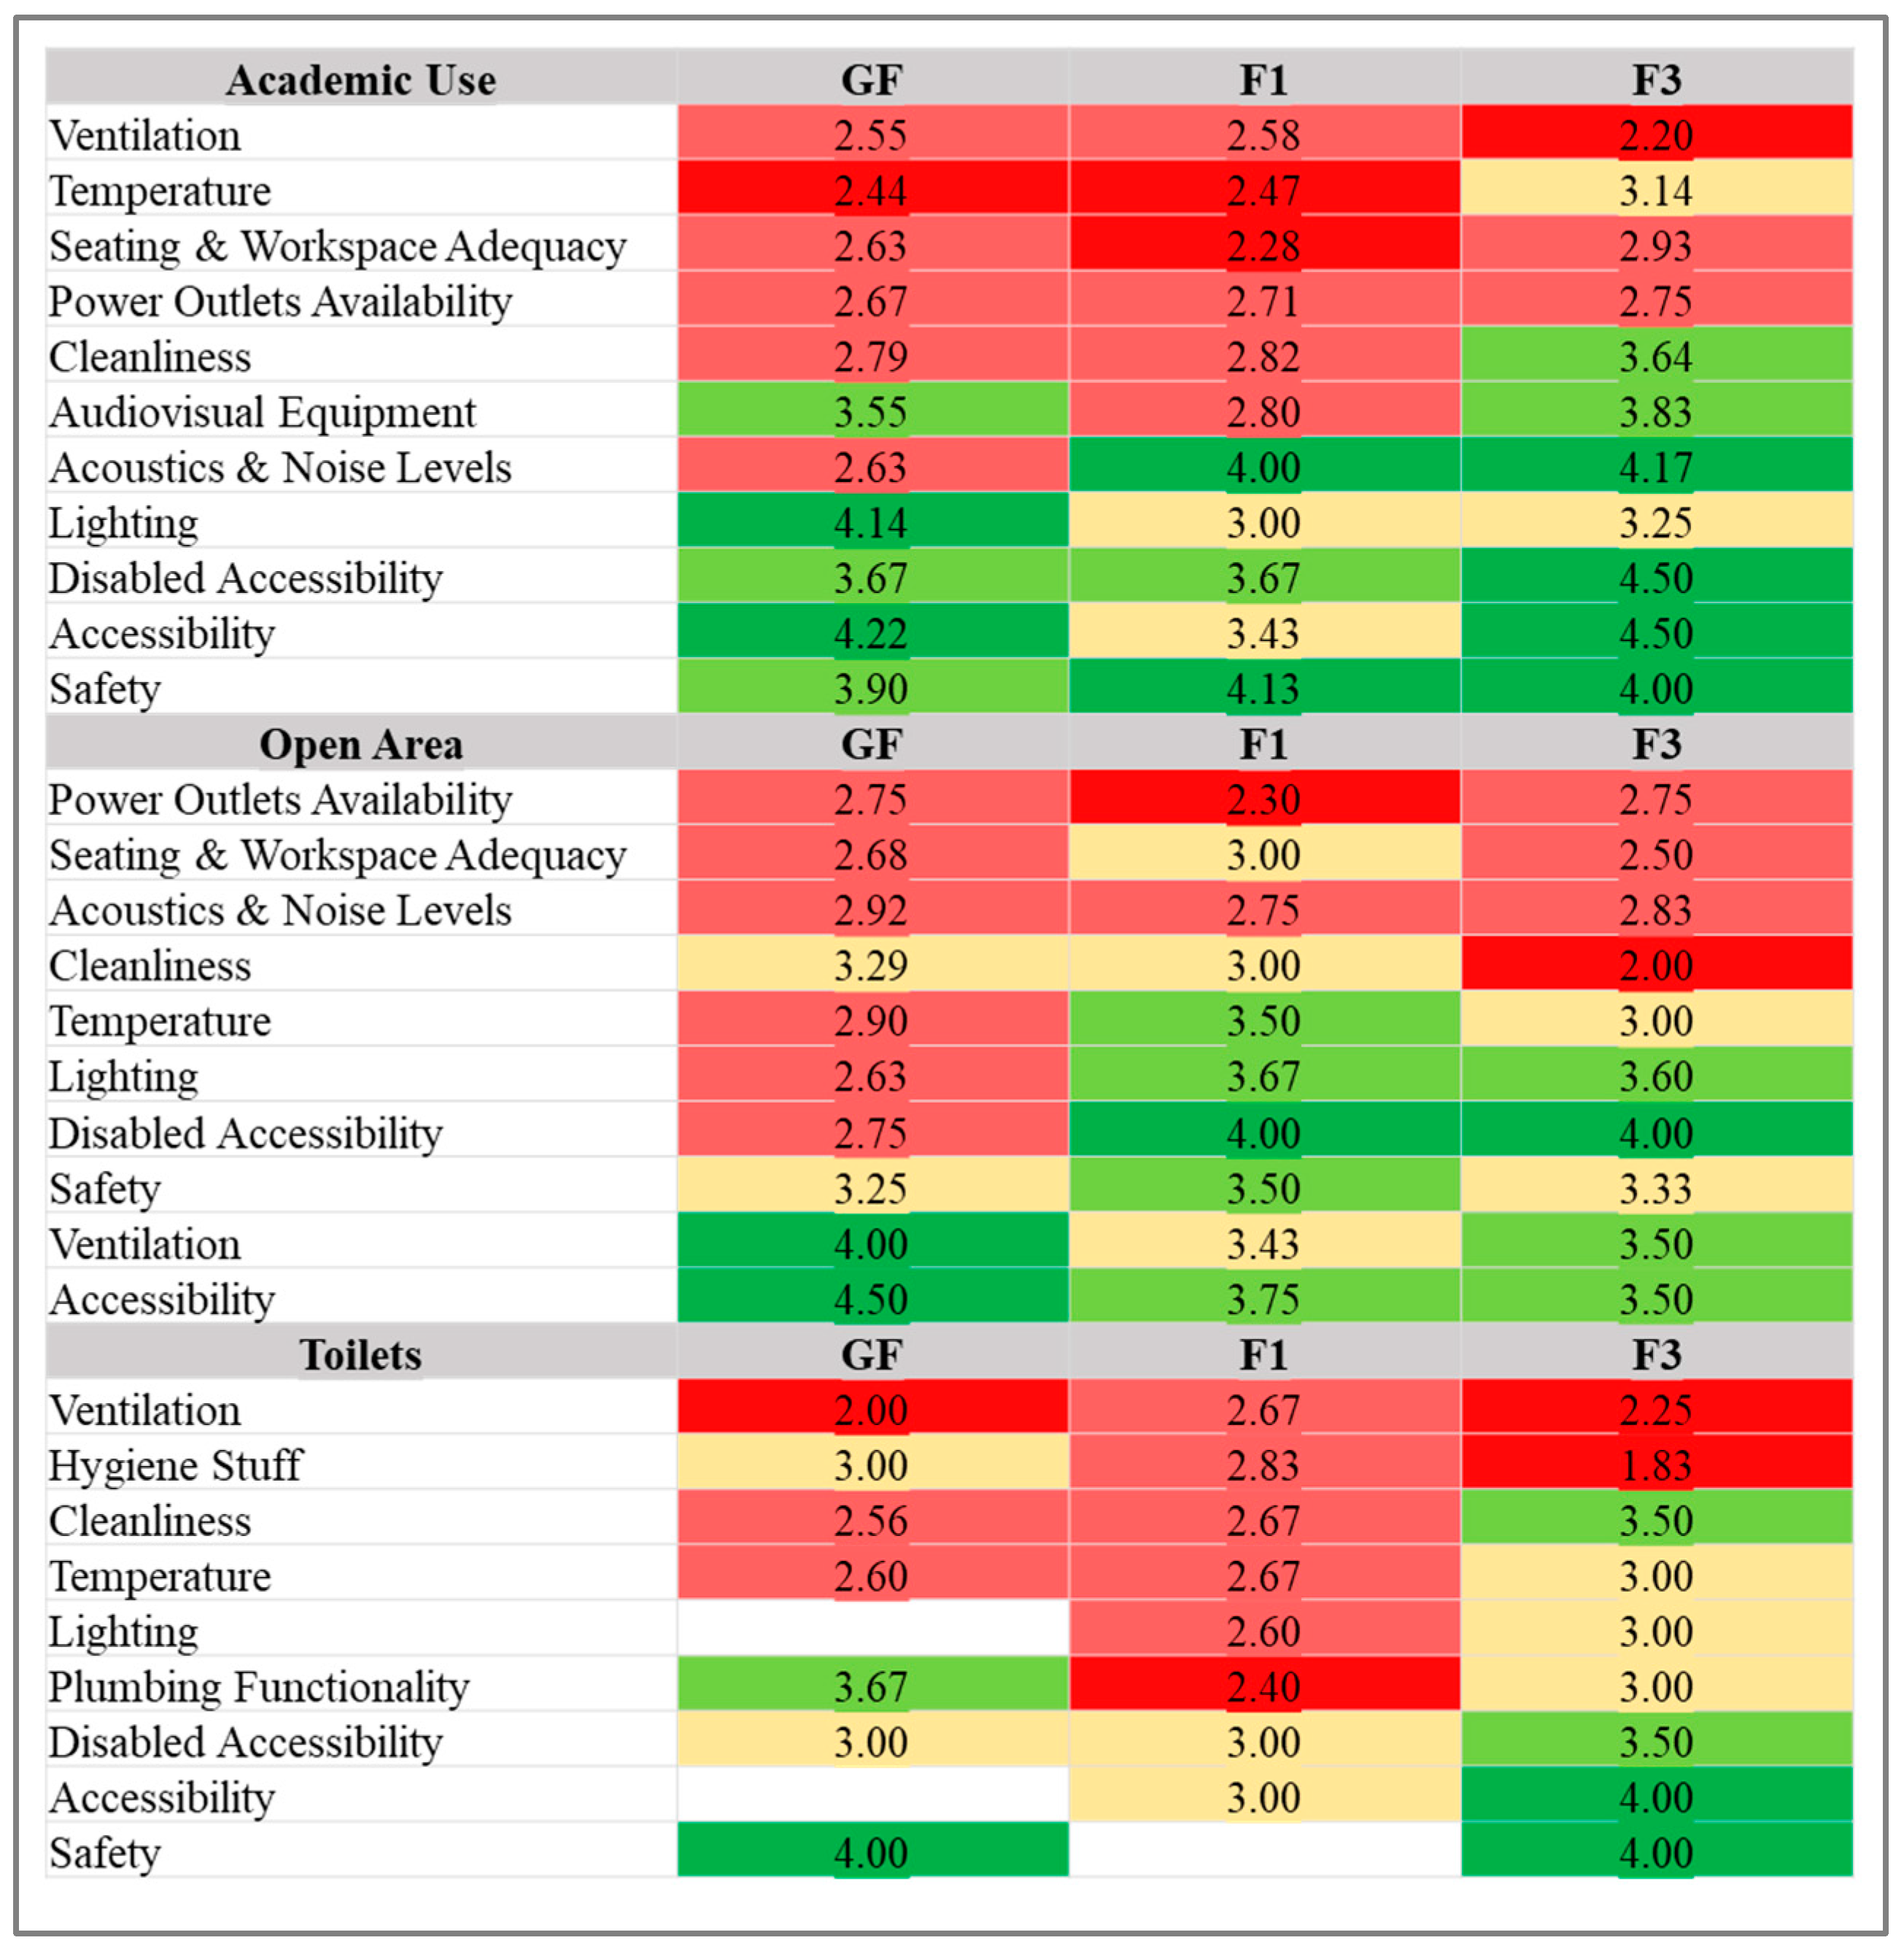
4.1. Overview of the AI-Generated Data

The generated dataset included 325 participants who conducted 1000 assessments of the campus facilities. Table 1 shows the distribution of participants and assessments over the user type: students, comprising 80.3% of the simulated population, conducted 82.1%, averaging 3.1 assessments each. Academic members and staff, though fewer, participated actively, simulating close to real-world engagement within a university setting.
Table 2 shows that the assessments were distributed across various floors and facility categories, with the ground floor (GF), first floor (F1), and third floor (F3) receiving the highest level of interaction represented by 32.7%, 22.5%, and 17.2% of all the assessments, respectively, especially in academic use areas, open areas, and toilets, that comprise 49.5%, 28.6%, and 15.9% of all the assessments. This highlights the central role of these spaces in the simulated user experience and the system’s responsiveness to high-traffic areas.
The following sections will focus on the most assessed categories (academic use, public spaces, and toilets) and the three most assessed floors (ground, first, and third).

4.2. User’s Satisfaction

The results indicate a variation in the average satisfaction across the various assessment parameters. Parameters such as power outlet availability, seating and workspace adequacy, ventilation, and cleanliness received low scores. Indeed, scoring below the threshold of 3 is considered critical.
Figure 9 illustrates the average user satisfaction across several key service parameters by facility category. For instance, in academic areas, parameters such as power outlet availability, seating adequacy, noise level, and cleanliness consistently received lower ratings, signaling critical areas for improvement. In open areas, power outlet availability and seating adequacy appear to be pressing issues in addition to noise level and cleanliness, with scores ranging between 2.54 and 2.95. Toilet facilities reveal several shortcomings, from hygiene provisions to ventilation, cleanliness, lighting, temperature, and plumbing functionality. These low scores suggest that essential services impacting users’ daily activities must meet expectations.
The shaded area beneath the bars in Figure 9 corresponds to the frequency of assessments per parameter. It reveals an increase in assessment for lower satisfaction ratings. This pattern demonstrates a typical human behavior: being more claimant about critical issues than satisfactory ones [75].
Figure 10 presents the heat map of the spatial distribution of the parameters on the most assessed floors and categories. It enables a better understanding of the assessment, highlighting key areas where service quality issues are concentrated within the campus. For instance, the academic areas show a non-critical status for cleanliness in the initial assessment. However, the heatmap reveals that cleanliness on the ground and first floors is a critical issue that requires attention. Conversely, the public areas, previously highlighted as problematic regarding cleanliness, show this concern mainly on the third floor. The heatmap draws particular attention to the toilets’ service quality across various floors, with a notable clustering of critical evaluations on the first floor. This assessment pattern suggests that while toilets on other levels meet acceptable standards, those on the first floor suffer from deficiencies that could stem from higher usage intensity or insufficient intervention. These spatial insights underscore the importance of targeted interventions that address specific problem areas rather than blanket approaches across the campus.
Figure 11 explores the temporal dimension of user satisfaction, uncovering patterns that suggest service quality fluctuates throughout the week. For example, on the third floor, the absence of critical evaluations on Wednesday contrasts with the other days of the week. This could be attributed to the nature of the use of academic facilities on that floor on Wednesday, which is characterized by a short period of use and a small number of students, unlike other days, such as Sunday and Tuesday. Moreover, temporal analysis reveals systemic issues. For example, a consistent pattern of high ratings during the middle of the week could indicate effective service recovery following intense usage at the week’s start. Alternatively, consistently poor ratings towards the week’s end may signify accumulating strain on facilities that must be adequately addressed in real time.
This variation indicates the need for dynamic management strategies that consider peak usage times and adjust maintenance schedules accordingly. By aligning service efforts with temporal facility use patterns, management can more effectively sustain high service quality throughout the week.
Figure 12 displays the assessment distribution during the day. It shows that feedback for academic facilities tends to be concentrated in the morning. Then, there’s a noticeable drop during the university break time from noon to 1 PM, which coincides with the peak use of other facilities like toilets and open areas.
In addition to the specific outcomes observed within the context of our study, the framework we developed has significant potential for scalability across different application levels. This framework, which integrates participatory methods with digital technologies such as BIM and AI, can be adapted to larger, more complex environments. For instance, in larger campuses or multi-building institutions, the participatory approach can be scaled by engaging a broader range of stakeholders while leveraging the technological components to manage the increased data and operational complexities. Furthermore, this model can be extended to other institutional types, such as hospitals, corporate campuses, or governmental facilities, where user-centered service management is crucial. The framework’s flexibility ensures that it can be tailored to the unique needs of different environments, making it a valuable tool for enhancing building services at various scales.

5. Conclusions

This paper presents how participatory science could enhance building services on higher education campuses. It aims to adapt the concept of participatory science to the campus environment and explore its potential through its implementation on a campus that needs building monitoring.
Our research compared our approach with those focusing on technical applications such as IoT, BIM, and AI, showing the importance of involving campus stakeholders in the campus management process. The participatory approach ensures that the services align with the users’ needs, enhancing user satisfaction and operational effectiveness.
This study combines advanced technologies and user engagement, which is crucial for the seamless integration of user insights without overwhelming the process with technology, thus ensuring that the solutions are technically robust and user-friendly.
Results showed that participatory science had a high capacity for capturing spatial and temporal insights about users’ satisfaction and areas requiring interventions, such as cleanliness, seating adequacy, and toilet hygiene. These insights underscore the practical implications of user feedback in shaping campus services.
However, while this study demonstrates the potential of participatory science for enhancing building services on higher education campuses, some limitations must be acknowledged. Firstly, while AI-generated data helped validate the concept’s significance implementation, the sample size used for training the AI model was relatively limited, which may affect the model’s accuracy and generalizability. Additionally, the potential bias in participant feedback was not explicitly tested, which could impact the reliability of the insights gathered. Furthermore, maintaining consistent and meaningful user participation over time remains a challenge and was not fully explored in this study.
Additionally, there is a need to monitor the response to users’ assessments and the level of users’ engagement. This includes tracking the timeliness and appropriateness of responses to user feedback and assessing whether interventions meet their intended goals. The engagement level should be measured to ensure user participation remains active and meaningful throughout the process.
The balanced integration of participatory methods and digital technologies highlighted in this research provides a flexible framework that can be adapted to different scales, from individual buildings to large, multi-site institutions. Thanks to this scalability, the proposed approach is powerful for enhancing building services across diverse environments.

Author Contributions

Conceptualization, M.I. and I.S.; methodology, M.I. and I.S.; software, M.I. and N.H.; validation, M.I., I.S. and R.E.M.; formal analysis, M.I.; writing—review and editing, M.I., I.S. and R.E.M.; supervision, I.S. All authors have read and agreed to the published version of the manuscript.

Funding

This research received no external funding.

Data Availability Statement

The data presented in this study are available from the corresponding author upon reasonable request.

Conflicts of Interest

The authors declare no conflict of interest.

References

  1. Pupiales-Chuquin, S.-A.; Tenesaca-Luna, G.-A.; Mora-Arciniegas, M.-B. Proposal of a Methodology for the Implementation of a Smart Campus. In Proceedings of the Sixth International Congress on Information and Communication Technology, London, UK, 25–26 February 2021; Yang, X.-S., Sherratt, S., Dey, N., Joshi, A., Eds.; Springer: Singapore, 2022; pp. 589–602. [Google Scholar]
  2. Villegas-Ch, W.; Palacios-Pacheco, X.; Luján-Mora, S. Application of a Smart City Model to a Traditional University Campus with a Big Data Architecture: A Sustainable Smart Campus. Sustainability 2019, 11, 2857. [Google Scholar] [CrossRef]
  3. Radu, L.-D. Disruptive Technologies in Smart Cities: A Survey on Current Trends and Challenges. Smart Cities 2020, 3, 1022–1038. [Google Scholar] [CrossRef]
  4. Rieder, E.; Schmuck, M.; Tugui, A. A Scientific Perspective on Using Artificial Intelligence in Sustainable Urban Development. Big Data Cogn. Comput. 2023, 7, 3. [Google Scholar] [CrossRef]
  5. Shahrour, I.; Xie, X. Role of Internet of Things (IoT) and Crowdsourcing in Smart City Projects. Smart Cities 2021, 4, 1276–1292. [Google Scholar] [CrossRef]
  6. Wang, J.; Nguyen, D.Q.; Bonkalo, T.; Grebennikov, O. Smart Governance of Urban Data. E3S Web Conf. 2021, 301, 5005. [Google Scholar] [CrossRef]
  7. Lazarova-Molnar, S.; Logason, H.; Andersen, P.G.; Kjærgaard, M.B. Mobile Crowdsourcing of Occupant Feedback in Smart Buildings. SIGAPP Appl. Comput. Rev. 2017, 17, 5–14. [Google Scholar] [CrossRef]
  8. Mansour, S.; Sassine, R.; Guibert, S. Leveraging Diverse Data Sources for ESTP Campus Digital Twin Development: Methodology and Implementation. In Innovations in Smart Cities Applications Volume 7; Lecture Notes in Networks and Systems; Ben Ahmed, M., Boudhir, A.A., El Meouche, R., Karaș, İ.R., Eds.; Springer Nature: Cham, Switzerland, 2024; pp. 243–257. [Google Scholar]
  9. Zhu, H.; Chau, S.C.-K.; Guarddin, G.; Liang, W. Integrating IoT-Sensing and Crowdsensing with Privacy: Privacy-Preserving Hybrid Sensing for Smart Cities. ACM Trans. Internet Things 2022, 3, 1–30. [Google Scholar] [CrossRef]
  10. Li, Z.; Zhang, J.; Li, M.; Huang, J.; Wang, X. A Review of Smart Design Based on Interactive Experience in Building Systems. Sustainability 2020, 12, 6760. [Google Scholar] [CrossRef]
  11. Calvo, M.; Galabo, R.; Owen, V.; Cruickshank, L.; Sara, R. Strategies and Tactics of Participatory Architecture. In Proceedings of the DRS Conference Proceedings 2022, Bilbao, Spain, 25 June–3 July 2022. [Google Scholar]
  12. Cardamone, C.; Lobel, L. Using Citizen Science to Engage Introductory Students: From Streams to the Solar System. J. Microbiol. Biol. Educ. 2016, 17, 117–119. [Google Scholar] [CrossRef]
  13. Schweiger, G.; Eckerstorfer, L.V.; Hafner, I.; Fleischhacker, A.; Radl, J.; Glock, B.; Wastian, M.; Rößler, M.; Lettner, G.; Popper, N.; et al. Active Consumer Participation in Smart Energy Systems. Energy Build. 2020, 227, 110359. [Google Scholar] [CrossRef]
  14. Goh, C.S.; Chong, H.-Y. Opportunities in the Sustainable Built Environment: Perspectives on Human-Centric Approaches. Energies 2023, 16, 1301. [Google Scholar] [CrossRef]
  15. Rymarzak, M.; den Heijer, A.; Curvelo Magdaniel, F.; Arkesteijn, M. Identifying the Influence of University Governance on Campus Management: Lessons from the Netherlands and Poland. Stud. High. Educ. 2020, 45, 1298–1311. [Google Scholar] [CrossRef]
  16. Sanabria, Z.J.; Alfaro-Ponce, B.; González Peña, O.I.; Terashima-Marín, H.; Ortiz-Bayliss, J.C. Engagement and Social Impact in Tech-Based Citizen Science Initiatives for Achieving the SDGs: A Systematic Literature Review with a Perspective on Complex Thinking. Sustainability 2022, 14, 10978. [Google Scholar] [CrossRef]
  17. Omotayo, T.; Moghayedi, A.; Awuzie, B.; Ajayi, S. Infrastructure Elements for Smart Campuses: A Bibliometric Analysis. Sustainability 2021, 13, 7960. [Google Scholar] [CrossRef]
  18. Ahmed, V.; Khatri, M.F.; Bahroun, Z.; Basheer, N. Optimizing Smart Campus Solutions: An Evidential Reasoning Decision Support Tool. Smart Cities 2023, 6, 2308–2346. [Google Scholar] [CrossRef]
  19. Nachandiya, N.; Gambo, Y.; Joel, N.B.; Davwar, P. Smart Technologies for Smart Campus Information System. Asian J. Res. Comput. Sci. 2018, 1–7. [Google Scholar] [CrossRef]
  20. Valks, B.; Arkesteijn, M.; Koutamanis, A.; Den Heijer, A. Towards Smart Campus Management: Defining Information Requirements for Decision Making through Dashboard Design. Buildings 2021, 11, 201. [Google Scholar] [CrossRef]
  21. Valks, B.; Arkesteijn, M.H.; Koutamanis, A.; den Heijer, A.C. Towards a Smart Campus: Supporting Campus Decisions with Internet of Things Applications. Build. Res. Inf. 2021, 49, 1–20. [Google Scholar] [CrossRef]
  22. Ali, Z.; Shah, M.A.; Almogren, A.; Ud Din, I.; Maple, C.; Khattak, H.A. Named Data Networking for Efficient IoT-Based Disaster Management in a Smart Campus. Sustainability 2020, 12, 3088. [Google Scholar] [CrossRef]
  23. Eltamaly, A.M.; Alotaibi, M.A.; Alolah, A.I.; Ahmed, M.A. IoT-Based Hybrid Renewable Energy System for Smart Campus. Sustainability 2021, 13, 8555. [Google Scholar] [CrossRef]
  24. Jabbar, W.A.; Wei, C.W.; Azmi, N.A.A.M.; Haironnazli, N.A. An IoT Raspberry Pi-Based Parking Management System for Smart Campus. Internet Things 2021, 14, 100387. [Google Scholar] [CrossRef]
  25. Nagowah, S.; Sta, H.; Gobin-Rahimbux, B. Modelling Sustainability for an IoT-Enabled Smart Green Campus Using an Ontology-Based Approach. In Proceedings of the WOP@ ISWC, Athens, Greece, 6–7 November 2023. [Google Scholar]
  26. Islam, M.M.; Nafiz Ahmed, T. A Greener Campus: Reusing Water, Reducing Waste and Protecting the Environment. In Proceedings of the IN4OBE Global Virtual Summit, Virtual, 9–10 June 2023. [Google Scholar]
  27. Mohd Nawi, N.F.; Er, A.C. Campus Sustainability: A Case Study in Universiti Malaysia Sabah (UMS). J. Sustain. Sci. Manag. 2018, 2018, 113–124. [Google Scholar]
  28. Min-Allah, N.; Alrashed, S. Smart Campus—A Sketch. Sustain. Cities Soc. 2020, 59, 102231. [Google Scholar] [CrossRef] [PubMed]
  29. Polin, K.; Yigitcanlar, T.; Limb, M.; Washington, T. The Making of Smart Campus: A Review and Conceptual Framework. Buildings 2023, 13, 891. [Google Scholar] [CrossRef]
  30. Prandi, C.; Monti, L.; Ceccarini, C.; Salomoni, P. Smart Campus: Fostering the Community Awareness Through an Intelligent Environment. Mob. Netw. Appl. 2020, 25, 945–952. [Google Scholar] [CrossRef]
  31. Alrashed, S. Key Performance Indicators for Smart Campus and Microgrid. Sustain. Cities Soc. 2020, 60, 102264. [Google Scholar] [CrossRef]
  32. Yip, C.; Zhang, Y.; Lu, E.; Dong, Z.Y. A Hybrid Assessment Framework for Human-centred Sustainable Smart Campus: A Case Study on COVID-19 Impact. IET Smart Cities 2022, 4, 184–196. [Google Scholar] [CrossRef]
  33. Fortes, S.; Santoyo-Ramón, J.A.; Palacios, D.; Baena, E.; Mora-García, R.; Medina, M.; Mora, P.; Barco, R. The Campus as a Smart City: University of Málaga Environmental, Learning, and Research Approaches. Sensors 2019, 19, 1349. [Google Scholar] [CrossRef]
  34. Tuzcuoğlu, D.; de Vries, B.; Yang, D.; Sungur, A. What Is a Smart Office Environment? An Exploratory Study from a User Perspective. J. Corp. Real. Estate 2022, 25, 118–138. [Google Scholar] [CrossRef]
  35. Glass, J.E.; Matson, T.E.; Lim, C.; Hartzler, A.L.; Kimbel, K.; Lee, A.K.; Beatty, T.; Parrish, R.; Caldeiro, R.M.; McWethy, A.G.; et al. Approaches for Implementing App-Based Digital Treatments for Drug Use Disorders Into Primary Care: A Qualitative, User-Centered Design Study of Patient Perspectives. J. Med. Internet Res. 2021, 23, e25866. [Google Scholar] [CrossRef]
  36. Rodriguez, N.M.; Burleson, G.; Linnes, J.C.; Sienko, K.H. Thinking Beyond the Device: An Overview of Human- and Equity-Centered Approaches for Health Technology Design. Annu. Rev. Biomed. Eng. 2023, 25, 257–280. [Google Scholar] [CrossRef]
  37. Crooks, R. Toward People’s Community Control of Technology: Race, Access, and Education. Just Tech 2022. [Google Scholar] [CrossRef]
  38. UN DESA THE 17 GOALS|Sustainable Development. Available online: https://sdgs.un.org/goals (accessed on 23 August 2024).
  39. Aljer, A.; Itair, M.; Akil, M.; Sharour, I. Knowledge Infrastructure Data Wizard (KIDW): A Cooperative Approach for Data Management and Knowledge Dissemination. In Innovations in Smart Cities Applications Volume 7; Lecture Notes in Networks and Systems; Ben Ahmed, M., Boudhir, A.A., El Meouche, R., Karaș, İ.R., Eds.; Springer Nature: Cham, Switzerland, 2024; pp. 34–43. [Google Scholar]
  40. Corbari, C.; Paciolla, N.; Ben Charfi, I.; Skokovic, D.; Sobrino, J.A.; Woods, M. Citizen Science Supporting Agricultural Monitoring with Hundreds of Low-Cost Sensors in Comparison to Remote Sensing Data. Eur. J. Remote Sens. 2022, 55, 388–408. [Google Scholar] [CrossRef]
  41. Itair, M.; Shahrour, I.; Hijazi, I. The Use of the Smart Technology for Creating an Inclusive Urban Public Space. Smart Cities 2023, 6, 2484–2498. [Google Scholar] [CrossRef]
  42. Pallavi, S.; Yashas, S.R.; Anilkumar, K.M.; Shahmoradi, B.; Shivaraju, H.P. Comprehensive Understanding of Urban Water Supply Management: Towards Sustainable Water-Socio-Economic-Health-Environment Nexus. Water Resour. Manag. 2021, 35, 315–336. [Google Scholar] [CrossRef]
  43. Aburas, H.; Shahrour, I.; Giglio, C. Route Planning under Mobility Restrictions in the Palestinian Territories. Sustainability 2024, 16, 660. [Google Scholar] [CrossRef]
  44. Itair, M.; Hijazi, I.; Mansour, S.; Shahrour, I. Empowering Sustainability Advancement in Urban Public Spaces Through Low-Cost Technology and Citizen Engagement. In Innovations in Smart Cities Applications Volume 7; Lecture Notes in Networks and Systems; Ben Ahmed, M., Boudhir, A.A., El Meouche, R., Karaș, İ.R., Eds.; Springer Nature Switzerland: Cham, Switzerland, 2024; pp. 292–299. [Google Scholar]
  45. Itair, M.; Shahrour, I.; Dbeis, A.; Bian, H.; Samhan, S. Leveraging Participatory Science for Tackling Water Supply Challenges in Water-Scarce Developing Regions. Water 2024, 16, 2080. [Google Scholar] [CrossRef]
  46. Paul, J.D.; Cieslik, K.; Sah, N.; Shakya, P.; Parajuli, B.P.; Paudel, S.; Dewulf, A.; Buytaert, W. Applying Citizen Science for Sustainable Development: Rainfall Monitoring in Western Nepal. Front. Water 2020, 2, 581375. [Google Scholar] [CrossRef]
  47. Pocock, M.J.O.; Roy, H.E.; August, T.; Kuria, A.; Barasa, F.; Bett, J.; Githiru, M.; Kairo, J.; Kimani, J.; Kinuthia, W.; et al. Developing the Global Potential of Citizen Science: Assessing Opportunities That Benefit People, Society and the Environment in East Africa. J. Appl. Ecol. 2019, 56, 274–281. [Google Scholar] [CrossRef]
  48. Roche, J.; Bell, L.; Galvão, C.; Golumbic, Y.N.; Kloetzer, L.; Knoben, N.; Laakso, M.; Lorke, J.; Mannion, G.; Massetti, L.; et al. Citizen Science, Education, and Learning: Challenges and Opportunities. Front. Sociol. 2020, 5, 613814. [Google Scholar] [CrossRef]
  49. Sagers, M. How Can Citizen Science Be Used Effectively within Environmental Education in Order to Foster Environmental Change? Hamline University: St Paul, MN, USA, 2020. [Google Scholar]
  50. Cornish, F.; Breton, N.; Moreno-Tabarez, U.; Delgado, J.; Rua, M.; de-Graft Aikins, A.; Hodgetts, D. Participatory Action Research. Nat. Rev. Methods Primer 2023, 3, 34. [Google Scholar] [CrossRef]
  51. Pocock, M.J.O.; Chapman, D.S.; Sheppard, L.J.; Roy, H.E. Choosing and Using Citizen Science: A Guide to When and How to Use Citizen Science to Monitor Biodiversity and the Environment; NERC/Centre for Ecology & Hydrology: Wallingford, UK, 2015; p. 24. [Google Scholar]
  52. Shirk, J.L.; Ballard, H.L.; Wilderman, C.C.; Phillips, T.; Wiggins, A.; Jordan, R.; McCallie, E.; Minarchek, M.; Lewenstein, B.V.; Krasny, M.E.; et al. Public Participation in Scientific Research: A Framework for Deliberate Design. Ecol. Soc. 2012, 17, 1–20. [Google Scholar] [CrossRef]
  53. Herman Assumpção, T.; Popescu, I.; Jonoski, A.; Solomatine, D. Citizen Observations Contributing to Flood Modelling: Opportunities and Challenges. Hydrol. Earth Syst. Sci. 2018, 22, 1473–1489. [Google Scholar] [CrossRef]
  54. Roche, A.J.; Rickard, L.N.; Huguenard, K.; Spicer, P. Who’s Tapped Out and What’s on Tap? Tapping Into Engagement Within a Place-Based Citizen Science Effort. Soc. Nat. Resour. 2022, 35, 667–683. [Google Scholar] [CrossRef]
  55. Batsaikhan, A.; Hachinger, S.; Kurtz, W.; Heller, H.; Frank, A. Application of Modern Web Technologies to the Citizen Science Project BAYSICS on Climate Research and Science Communication. Sustainability 2020, 12, 7748. [Google Scholar] [CrossRef]
  56. Schmuderer, S.; Zink, R.; Gamerith, W. Citizen Participation via Digital Maps: A Comparison of Current Applications. GIForum 2019, 7, 34–46. [Google Scholar] [CrossRef]
  57. Maund, P.R.; Bentley, J.W.; Austen, G.E.; Irvine, K.N.; Fish, R.; Dallimer, M.; Davies, Z.G. The Features and Processes Underpinning High-Quality Data Generation in Participatory Research and Engagement Activities. Methods Ecol. Evol. 2022, 13, 68–76. [Google Scholar] [CrossRef]
  58. Santos-Tapia, C.; Verderau, M.; Borràs, S.; Flórez-Santasusana, M.; Flórez, F.; Morales, J.J.; Moli, P.; Borràs, A.; Cirach, M.; Ubalde-López, M. Citizen Science and Social Innovation as Citizen Empowerment Tools to Address Urban Health Challenges: The Case of the Urban Health Citizen Laboratory in Barcelona, Spain. PLoS ONE 2024, 19, e0298749. [Google Scholar] [CrossRef]
  59. Moor, T.D.; Rijpma, A.; López, M.P. Dynamics of Engagement in Citizen Science: Results from the “Yes, I Do!”-Project. Citiz. Sci. Theory Pract. 2019, 4. [Google Scholar] [CrossRef]
  60. ANU-FEIT Welcome Message|Faculty of Engineering and Information Technology. Available online: https://eng.najah.edu/en/about/welcome-message/ (accessed on 20 October 2023).
  61. Abreu, N.; Pinto, A.; Matos, A.; Pires, M. Procedural Point Cloud Modelling in Scan-to-BIM and Scan-vs-BIM Applications: A Review. ISPRS Int. J. Geo-Inf. 2023, 12, 260. [Google Scholar] [CrossRef]
  62. Beck, S.F.; Abualdenien, J.; Hijazi, I.H.; Borrmann, A.; Kolbe, T.H. Analyzing Contextual Linking of Heterogeneous Information Models from the Domains BIM and UIM. ISPRS Int. J. Geo-Inf. 2021, 10, 807. [Google Scholar] [CrossRef]
  63. Raza, M.S.; Tayeh, B.A.; Abu Aisheh, Y.I.; Maglad, A.M. Potential Features of Building Information Modeling (BIM) for Application of Project Management Knowledge Areas in the Construction Industry. Heliyon 2023, 9, e19697. [Google Scholar] [CrossRef]
  64. Bosch, A.; Volker, L.; Koutamanis, A. BIM in the Operations Stage: Bottlenecks and Implications for Owners. Built Environ. Proj. Asset Manag. 2015, 5, 331–343. [Google Scholar] [CrossRef]
  65. Deng, M.; Menassa, C.; Kamat, V. From BIM to Digital Twins: A Systematic Review of the Evolution of Intelligent Building Representations in the AEC-FM Industry. J. Inf. Technol. Constr. 2021, 26, 58–83. [Google Scholar] [CrossRef]
  66. Hijazi, I.H.; Krauth, T.; Donaubauer, A.; Kolbe, T. 3DCITYDB4BIM: A system architecture for linking bim server and 3d citydb for bim-gis-integration. ISPRS Ann. Photogramm. Remote Sens. Spat. Inf. Sci. 2020, 4, 195–202. [Google Scholar] [CrossRef]
  67. Lingo, R. Exploring the Potential of AI-Generated Synthetic Datasets: A Case Study on Telematics Data with ChatGPT. arXiv 2023, arXiv:2306.13700. [Google Scholar]
  68. Hittmeir, M.; Ekelhart, A.; Mayer, R. On the Utility of Synthetic Data: An Empirical Evaluation on Machine Learning Tasks. In Proceedings of the 14th International Conference on Availability, Reliability and Security, Canterbury, UK, 26–29 August 2019; Association for Computing Machinery: New York, NY, USA, 2019; pp. 1–6. [Google Scholar]
  69. Korakakis, M.; Mylonas, P.; Spyrou, E. A Short Survey on Modern Virtual Environments That Utilize AI and Synthetic Data. In Proceedings of the MCIS 2018 Proceedings, Corfu, Greece, 28–30 September 2018. [Google Scholar]
  70. Lu, Y.; Shen, M.; Wang, H.; Wang, X.; van Rechem, C.; Wei, W. Machine Learning for Synthetic Data Generation: A Review. arXiv 2023, arXiv:2302.04062. [Google Scholar] [CrossRef]
  71. Reiner Benaim, A.; Almog, R.; Gorelik, Y.; Hochberg, I.; Nassar, L.; Mashiach, T.; Khamaisi, M.; Lurie, Y.; Azzam, Z.S.; Khoury, J.; et al. Analyzing Medical Research Results Based on Synthetic Data and Their Relation to Real Data Results: Systematic Comparison From Five Observational Studies. JMIR Med. Inform. 2020, 8, e16492. [Google Scholar] [CrossRef]
  72. Braddon, A.E.; Robinson, S.; Alati, R.; Betts, K.S. Exploring the Utility of Synthetic Data to Extract More Value from Sensitive Health Data Assets: A Focused Example in Perinatal Epidemiology. Paediatr. Perinat. Epidemiol. 2023, 37, 292–300. [Google Scholar] [CrossRef]
  73. D’Amico, S.; Dall’Olio, D.; Sala, C.; Dall’Olio, L.; Sauta, E.; Zampini, M.; Asti, G.; Lanino, L.; Maggioni, G.; Campagna, A.; et al. Synthetic Data Generation by Artificial Intelligence to Accelerate Research and Precision Medicine in Hematology. JCO Clin. Cancer Inform. 2023, 7, e2300021. [Google Scholar] [CrossRef]
  74. Koenecke, A.; Varian, H. Synthetic Data Generation for Economists. arXiv 2020, arXiv:2011.01374. [Google Scholar]
  75. Mr, N.; Gyasi, S. Customer Dissatisfaction and Complaining Responses Towards Mobile Telephony Services. Afr. J. Inf. Syst. 2012, 4, 1. [Google Scholar]
Figure 1. General Methodology.
Buildings 14 02784 g001
Figure 2. System architecture of the participatory framework applied to the case study.
Buildings 14 02784 g002
Figure 3. The Data Collection Flowchart.
Buildings 14 02784 g003
Figure 4. The distribution of the assessment parameters among the facilities’ categories.
Buildings 14 02784 g004
Figure 5. Faculty digitalization—Creating the BIM.
Buildings 14 02784 g005
Figure 6. The distribution of facilities based on category and function.
Buildings 14 02784 g006
Figure 7. The phases of the AI-driven data generation approach used in the study.
Buildings 14 02784 g007
Figure 8. AI-Driven Process for Generating Mimicked User Assessments in a Campus Environment.
Buildings 14 02784 g008
Figure 9. The Parameters Average Rating and Assessments Count by Facilities’ Category.
Buildings 14 02784 g009
Figure 10. Spatial Perspective of Assessment Parameters Across Floors.
Buildings 14 02784 g010
Figure 11. Temporal Distribution of the Academic Areas Assessment Parameters by Day.
Buildings 14 02784 g011
Figure 12. Temporal Distribution of Facilities Assessments During the Day.
Buildings 14 02784 g012
Table 1. The Distribution of Participants and Assessment Over User Type.
User TypeNumber of ParticipantsPercentage of ParticipantsNumber of AssessmentsPercentage of AssessmentsAssessment Frequency
Student26180.3%82182.1%3.1
Academic Member3711.4%10810.8%2.9
Administrative Staff154.6%363.6%2.4
Security Member123.7%353.5%2.9
Total325100.0%1000100.0%3.1
Table 2. Assessments Distribution Over Floor & Facilities’ Category.
Floor ID/Facilities’ CategoryAcademic UseOpen AreaToiletsEmergencyVertical Circulation% By Floor
B21.6%0.5%0.5%0.3% 2.9%
B16.2%2.4%1.5%0.3% 10.4%
GF18.0%10.3%3.1%1.3% 32.7%
F112.3%5.8%3.5%0.9% 22.5%
F20.2%4.4%3.4%0.5% 8.5%
F39.3%4.1%3.0%0.8% 17.2%
F41.9%1.1%0.9%0.2% 4.1%
Vertical Circulation 1.7%1.7%
% By Facilities’ Category49.5%28.6%15.9%4.3%1.7%100.0%
Disclaimer/Publisher’s Note: The statements, opinions and data contained in all publications are solely those of the individual author(s) and contributor(s) and not of MDPI and/or the editor(s). MDPI and/or the editor(s) disclaim responsibility for any injury to people or property resulting from any ideas, methods, instructions or products referred to in the content.

