Abstract
The article presents an analysis of changes in energy efficiency of new office buildings designed and constructed during the implementation period of the Energy Performance of Buildings Directive (2014–2024). Common criteria on energy efficiency were collected from Energy Performance Certificates (EPCs) and processed. The changes in final and primary energy for space heating, cooling and hot water production of certified office buildings were determined, and the improvements in buildings, their energy systems and energy sources were analysed. It was determined that buildings of Class C, designed between 2006 and 2017, showed an average thermal energy consumption for heating of 61, for cooling of 13 and for hot water production of 30 kWh/(m2·year), while buildings of Class A++, designed after 2020, consumed, respectively, 6, 9 and 17 kWh/(m2·year). The main reasons for these changes in energy consumption are the significant improvement of thermal insulation, increase of renewable energy in the heat supplied by district heating, the use of heat pumps for cooling, more efficient hot water boilers and optimized and insulated distribution pipelines. Even better results were hindered by the increased area of glazing, insufficient use of solar protection, users’ preference for buildings of complex shape, and technically complicated electricity production. The results revealed that EPCs are an appropriate database for the analysis of changes in energy efficiency of buildings and for setting tasks for further improvement.
1. Introduction
Energy efficiency in buildings is crucial for sustainable and responsible building construction and operation. It involves the optimization of building structure and energy consumption within a building to reduce the use of resources and their impact on the environment.
To improve the energy performance of buildings, evenly reduce the non-renewable primary energy consumption in buildings and CO2 emissions, the EU has created a long-term and permanent legal framework starting from the first version of the Energy Performance of Buildings Directive (EPBD) in 2002 (Directive 2002/91/EC) [1], which, for clarity, was recast in 2010 (Directive 2010/31/EU) [2]; a revised version of the EPBD implementing a stronger role for energy performance standards was published in 2018 (Directive 2018/844/EU) [3]. The Directive contributes to the target of reducing CO2 emissions in the buildings sector by not less than 60% by 2030 compared to 2015 and achieving climate neutrality by 2050 to ensure that buildings comply with the EU’s increased climate ambitions under the European Green Deal [4]. Furthermore, increasing the energy efficiency of buildings is one of the most important priorities of Lithuania’s national energy independence strategy [5].
The Directive on energy efficiency of buildings was implemented in Lithuania in 2006, i.e., 2 years after it joined the EU in 2004. Normative documents implementing the Directive were legalized, and a system of energy efficiency certification of buildings was created. Substantial changes in building energy performance requirements in normative documents for construction appeared in 2011, where stages to reach the energy performance level of nearly zero-energy buildings (NZEBs) were determined. It was specified that from 2016 no lower than A class, from 2018 A+ class, and from 2021 only A++ energy efficiency class buildings would be built. Specific requirements for primary energy consumption, energy consumption for heating, normative heat transfer coefficients of external partitions, airtightness, efficiency of engineering systems and other requirements for buildings of various purposes of each class were detailed in normative documents. According to the provisions of the legislation implementing the Directive, new or renovated buildings that did not meet the indicators specified in these requirements were not recognized as suitable for operation. Thus, a 10-year period was set in 2011 to develop new or improve existing building design methods and new structural and engineering system solutions in order to achieve the goals specified in the Directive. Since the EPBD is not a document of direct application, each member state creates its own path for achieving the goals, so the analysis of these is important for evaluating achievements and demonstrating how the energy efficiency indicators of new buildings have changed during this period and for sharing experiences.
The energy performance of building is the amount of energy consumed in a building used according to its purpose, which is calculated according to the method described in EPBD implementing regulation STR 2.01.02:2016 [6] and expressed as a building energy performance class. The energy performance is defined as the total energy consumption of a building, determined using numeric indicators of thermal insulation and energy system characteristics, design and location, energy conversion in the building and other impacts on net energy demand.
The aforementioned Directive imposed upon EU members mandatory energy certification for new and existing buildings. Energy performance certification of a building is a normative process of assessment of building energy demand, during which the building is assigned a certain energy performance class (in Lithuania, A++, A+, A, B, C, D, E, F, G), and the Energy Performance Certificate is issued. The validity period of the Certificate is 10 years.
The Energy Performance Certificate (EPC) is an official document which contains the results of the energy performance evaluation of a building. The measures of the newly revised EPBD (EU/2024/1275) [7] include greater reliability and quality of energy performance information data and the level of digitization of Energy Performance Certificates and emphasize the importance of the EPC in assessing the impact of the entire period of implementation of the Directive on the construction and energy sectors and the use of EPC data in the development of guidelines for improvement in the efficiency of these sectors in the member states.
The energy performance of buildings through analyses of EPCs has been studied by many researchers, as EPCs are currently an important source of energy performance assessment data for buildings and are used by building energy researchers and policy makers (Platten et al.) [8]. Pasichnyi et al. [9] conducted a literature review of the use of EPC data in EU member states and found that they were used to assess the energy performance achievements of national building stock, to analyse the need for renovation, to perform energy planning and to predict future energy demands. Bull et al. [10] analysed the influence of building energy certificates to promote the improvement of energy efficiency of buildings. The authors of the article concluded that building energy certificates are not the main cause of reducing emissions of public buildings; however, issuing and publicizing building energy certificates can be a factor in increasing the efficiency of energy consumption in buildings. Gangolells et al. [11] admit that EPC databases are considered as the main source of information on the energy efficiency characteristics of buildings and that the results of EPC analyses will help policy makers to develop new and improve existing energy performance improvement strategies. Gangolells et al. [12] also presented a method for identifying reference buildings for cost-optimal analysis to determine the optimal level of building modernization by examining the database of energy performance certificates. The results were used to make strategic decisions about energy savings in modernized Spanish offices. Amecke [13] investigated the impact of EPCs on investment increase in building energy efficiency. The results presented in the paper show that the EPC is well suited for statistical evaluation of trends, the formation of general understanding and improvement recommendation. The study of Hjortling et al. [14] defined the current energy consumption levels of buildings in Sweden using the data of energy performance certificates collected during 2007–2015. The results of the study show that new building regulations have an impact on buildings’ energy performance. When new building codes and energy performance requirements were introduced, energy consumption was reduced compared to the energy use of existing buildings. The stricter requirements introduced by the EPBD impacted the main indicators of energy performance of buildings.
An assessment of energy policy impact on building energy efficiency was performed through the analyses of EPC data in Italy (Pagliaro et al. [15]). The main energy performance indicators were calculated and analysed for an assessment of the Italian building stock. The results of the study show that analysis of EPC data can provide a large amount of information on different parameters of the building stock and on the impact of energy policy on buildings’ energy performance. The study of de Rubeis et al. [16]) aimed to create an energy modeling tool for defining the energy performance of an entire building stock and determining the effectiveness of energy efficiency measures applied. The model is based on a physics-based bottom-up approach with statistical assumptions of data calculated according EN standards. Martínez-de-Alegría et al. [17] analysed many indicators for evaluating the energy performance of buildings and found that disaggregated indicators, particularly energy for heating and cooling, appear to be suitable indicators for comparing buildings certified by different schemes and are fundamental for the evaluation of energy performance of buildings. Li et al. [18] proposed an integrated building energy performance evaluation method using 13 significant impact factors on building energy consumption. These factors were divided into three sets: the envelope-related parameters—materials’ thermal conductivity, density and specific heat; geometry-related parameters—specific building design and shape; and location-related parameters—heat losses and solar radiation. The authors of the article stated that these factors can properly define the energy performance of buildings.
Khakian et al. [19] investigated energy performance of buildings and energy-saving measures. They examined the impact of wall-to-window ratio, glazing type, shading devices and thermal insulation on the energy performance of building located in Iran. The results showed that the optimal case of implementation of these measures could save 32.2% of the total energy compared to a conventional building, and photovoltaic electricity generation was also efficient.
Investigations on building energy performance trends according to EPC data have also been carried out in Lithuania. It was established that the energy efficiency of residential buildings increased significantly during the implementation period of the EPBD [15,16,17,18,19,20]. The statistical analysis of certificates of multi-apartment buildings showed the impact of stricter energy performance requirements introduced following the implementation of the first EPBD issued in Lithuania in 2006: the average thermal transfer of the building envelope decreased from 0.35 W/(m2·K) for class C (established for buildings in 2006) to 0.215 W/(m2·K) for class A++ (required for buildings from 2021) due to the increased thermal insulation of the building envelope and the lowered building compactness ratio, achieved through the reasonable volumetric design solutions of the buildings. The average final heating energy consumption of C energy performance class buildings decreased from 56 kWh/(m2·year) compared to 13 kWh/(m2·year) for A++ energy performance class buildings due to improved thermal insulation of buildings and more sustainable heating sources. In general, the energy consumption in multi-apartment buildings extracted from EPC data showed that the measures introduced were successful in developing the residential building stock, encouraging for the achievement of the required indicators for energy performance Class A++ (nearly zero-energy buildings (NZEB)) by 2021.
Zhang et al. [21] assessed the energy-saving possibilities of building residents’ behavior in the range of 10–25% for residential buildings and 5–30% for commercial buildings, according to analyses of performed investigations. Also, during the period of implementation of the provisions of the Directive, the concept and occupant behaviour of office buildings changed more than that of multi-apartment buildings, so it was decided to analyse the changes in office building stock during the period of implementation of energy performance requirements.
After performing the EPC analysis of the buildings, the changes in design and energy consumption of the office buildings were determined, and the potential directions for increasing the energy efficiency of these buildings were identified. Comparing the obtained results with the energy consumption data of Latvian office buildings, it was found that the energy efficiency of office buildings in this country is at a lower level, which can be improved by the technological advancements analysed in this study and stringent policy interventions.
2. Scope of the Investigated Buildings Stock
According to data from the Real Estate Property Register and data presented in Lithuania’s long-term renovation strategy [22], 2.654 million buildings with a total living area of 249.7 million m2 were registered in Lithuania on 1 April 2024. The building stock in Lithuania consists of 10,505 office buildings with a total area of around 10.782 million m2. The data for office buildings are shown in Table 1.

Table 1.
Office buildings according to their year of construction.
At the beginning of 2020, the total area of office buildings in Lithuania reached 5% of the total area of all building stock. The major proportion of office buildings was built between 1961 and 1992.
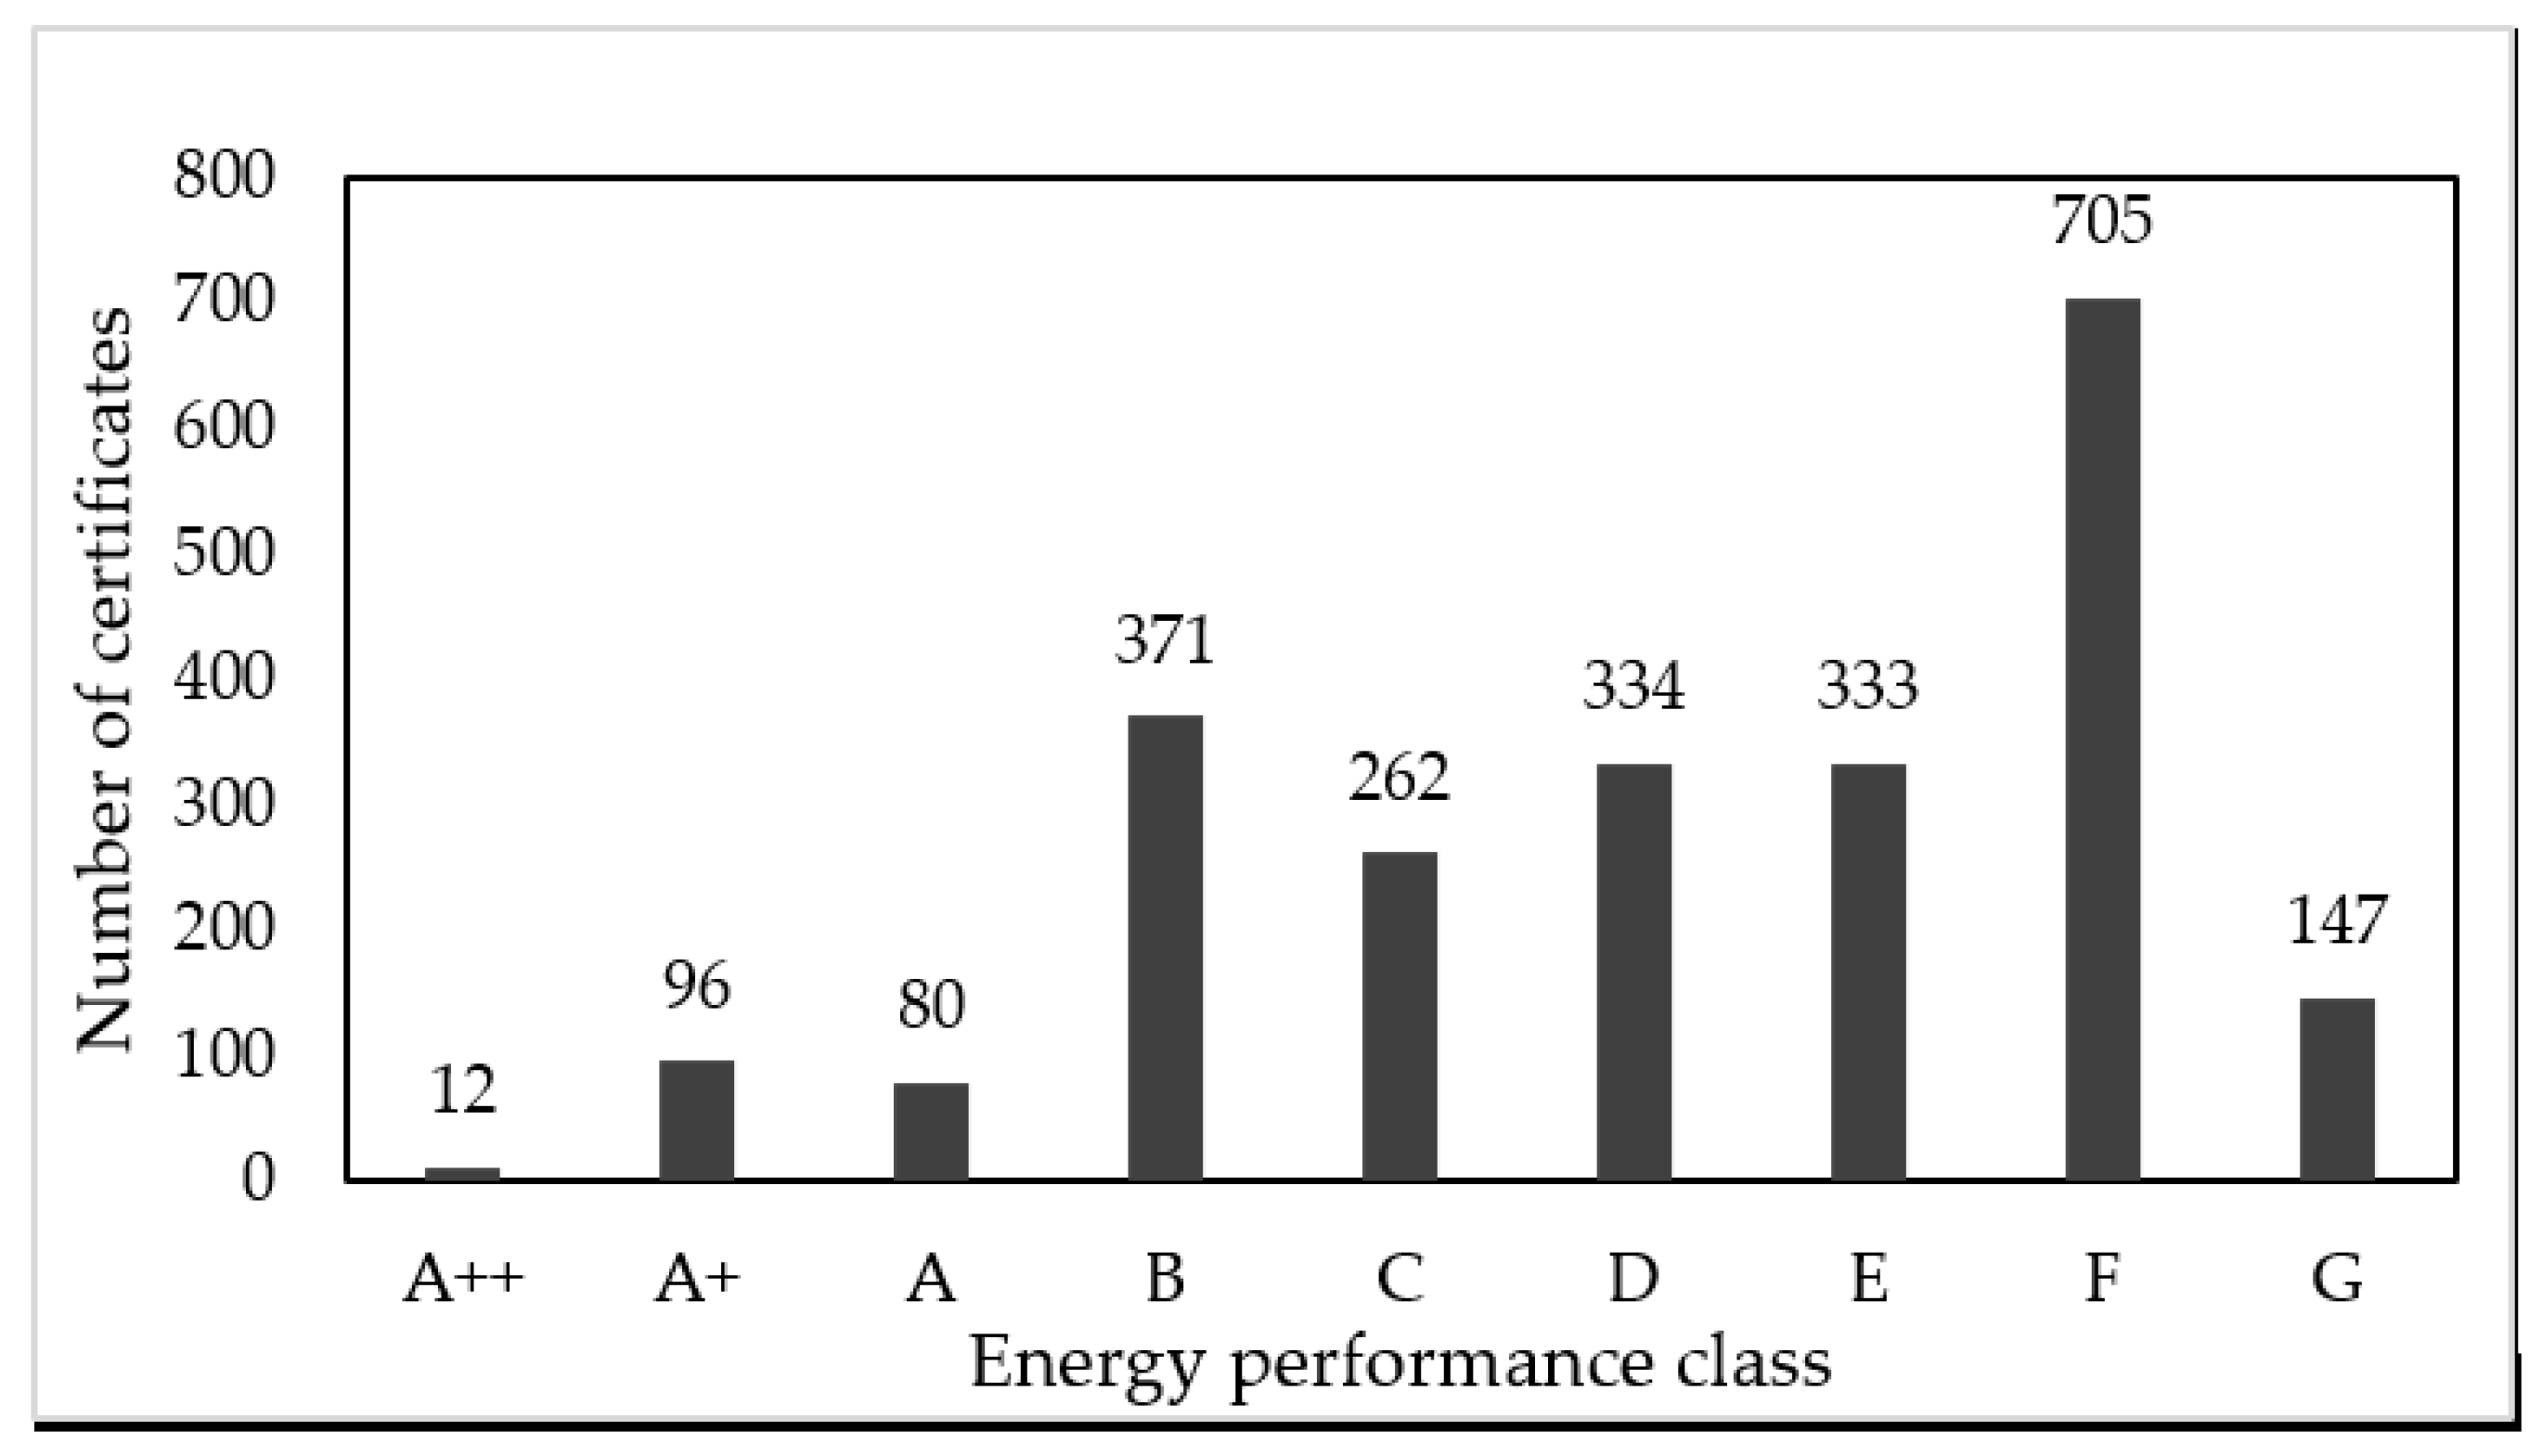
The Real Estate Property Register also dispenses information (attributes) on the energy performance class of buildings. However, information issued on the energy performance of certified buildings is collected in the register (the ‘SSVA register’) managed by the Construction Sector Development Agency, a state-owned company [23]. Figure 1 shows the distribution of energy performance classes assigned for certified office buildings. For the purposes of this study, the data for energy performance analyses comprised 2340 EPCs of office buildings, issued and registered in the period 2014–2024.

Figure 1.
The energy performance classes of office buildings certified in the period from 12-2014 to 01-2024.
3. Methods
When preparing the EPC of an office building and calculating its energy performance, detailed data analyses were performed using NRG7 certification software in accordance with the energy performance assessment methodology presented in STR 2.01.02-2016 [6]. However, only final data on building energy performance, including heated area, energy consumption for space heating, cooling and domestic hot water, and building energy performance class are published in the register of building EPCs, so detailed information remains in data collection documents and calculation files. The data on building structures and energy consumption dependencies required for the analysis presented in this article were extracted from building data collection sheets and building energy performance certification files using an Excel program specially created for that purpose. These are the building’s length, width, height, window area and heated volume, as well as data on the building’s specific heat losses. All these data were used to calculate the energy efficiency indicators of the building required for the study. The selection of data and the formation of dependencies was carried out purposefully in order to find and demonstrate changes in building design solutions, external partitions and heating, cooling and hot water production systems in order to achieve higher energy efficiency requirements of buildings. After analysing various dependencies, presented in the figures, the conclusions about building typology changes were formulated.
After calculating the areas of all building partitions Aenv.x, their sum and the internal volume of the building Vx, the value of the compactness ratio Lc.x, (m−1) for each “x” building was calculated as follows:
where ΣAenv.x is the total area of the building’s external partitions (m2).
In order to compare the level of insulation of the external partitions of buildings of different energy performance classes, the average heat transfer coefficients Ux.avg of the external partitions of each building “x” were calculated according to the formula:
where Hx is the specific heat loss of building “x” (W/K).
When calculating the specific heat loss Hx of the building, heat transfer through roofs Hr, walls Hw, windows Hwin, doors Hd, floors Hf and through longitudinal thermal bridges Htb was evaluated.
The average heat loss of the building envelopes was calculated in order to show the general level of thermal insulation of the building, since the heat transfer coefficient of each external partition and the heat loss through this envelope may be different: the building designer has the opportunity to design external partitions of various insulation levels in order to achieve the normative values of energy consumption of the entire building. The overall need of thermal insulation in the building is also affected by the inflow of solar heat and the efficiency of the ventilation system, so the average heat transfer coefficients of the building’s external partitions permit a comparison of the level of thermal insulation of buildings of different structures.
Thermal energy consumption values for building heating, cooling and hot water production are taken from the EPC register. They show the amount of thermal energy that is used in the building regardless of the fuel type or source. This energy consumption best reflects the energy efficiency of the building and its engineering systems.
Primary energy consumption values for building heating, cooling and domestic hot water are also taken from the EPC register. They are calculated by multiplying the thermal energy consumption by the values of the primary energy factors corresponding to the fuel type or source, which are presented in STR 2.01.02-2016 [6]. Primary energy consumption shows the efficiency of the choice of fuel type and source in order to minimize the use of non-renewable natural resources.
Using data on energy consumption taken from the EPC of the building and also the calculated compactness ratio, the average heat transfer coefficients were recalculated into average weighted values Kavg by dividing them by the heated area of the building:
where Kx is the corresponding indicator of building “x”, for example, the area of the windows, the average U-value of the partitions (Uavg.x), the value of the compactness ratio (Lc.x), energy consumption, etc., and Ax is the heated area of building “x” (m2).
This recalculation was performed to compare the energy performance indicators of buildings of various structures, shapes and sizes, i.e., to have all indicators for 1 m2 of heated area. These values are also compared with the energy performance requirements presented in the normative documents, which are also presented per 1 m2 of heated area.
The data from the 2340 EPCs were then divided into nine sections and assigned to the classes of building energy efficiency, i.e., A++, A+, A, B, C, D, E, F, G.
All office buildings covered by this study are located in the same climate zone, which is defined as the Dfb climate zone according to the Koeppen–Geiger climate classification [24].
4. Results
Directly from the EPC register [23], the energy performance class of the building, its heated area, final and primary energy for space heating and cooling, and for domestic hot water were extracted. Other indicators used in this analysis were calculated according to the formulas presented in Section 3 using data from certification files and documents.
4.1. Heated Area and Compactness Ratio of Office Buildings
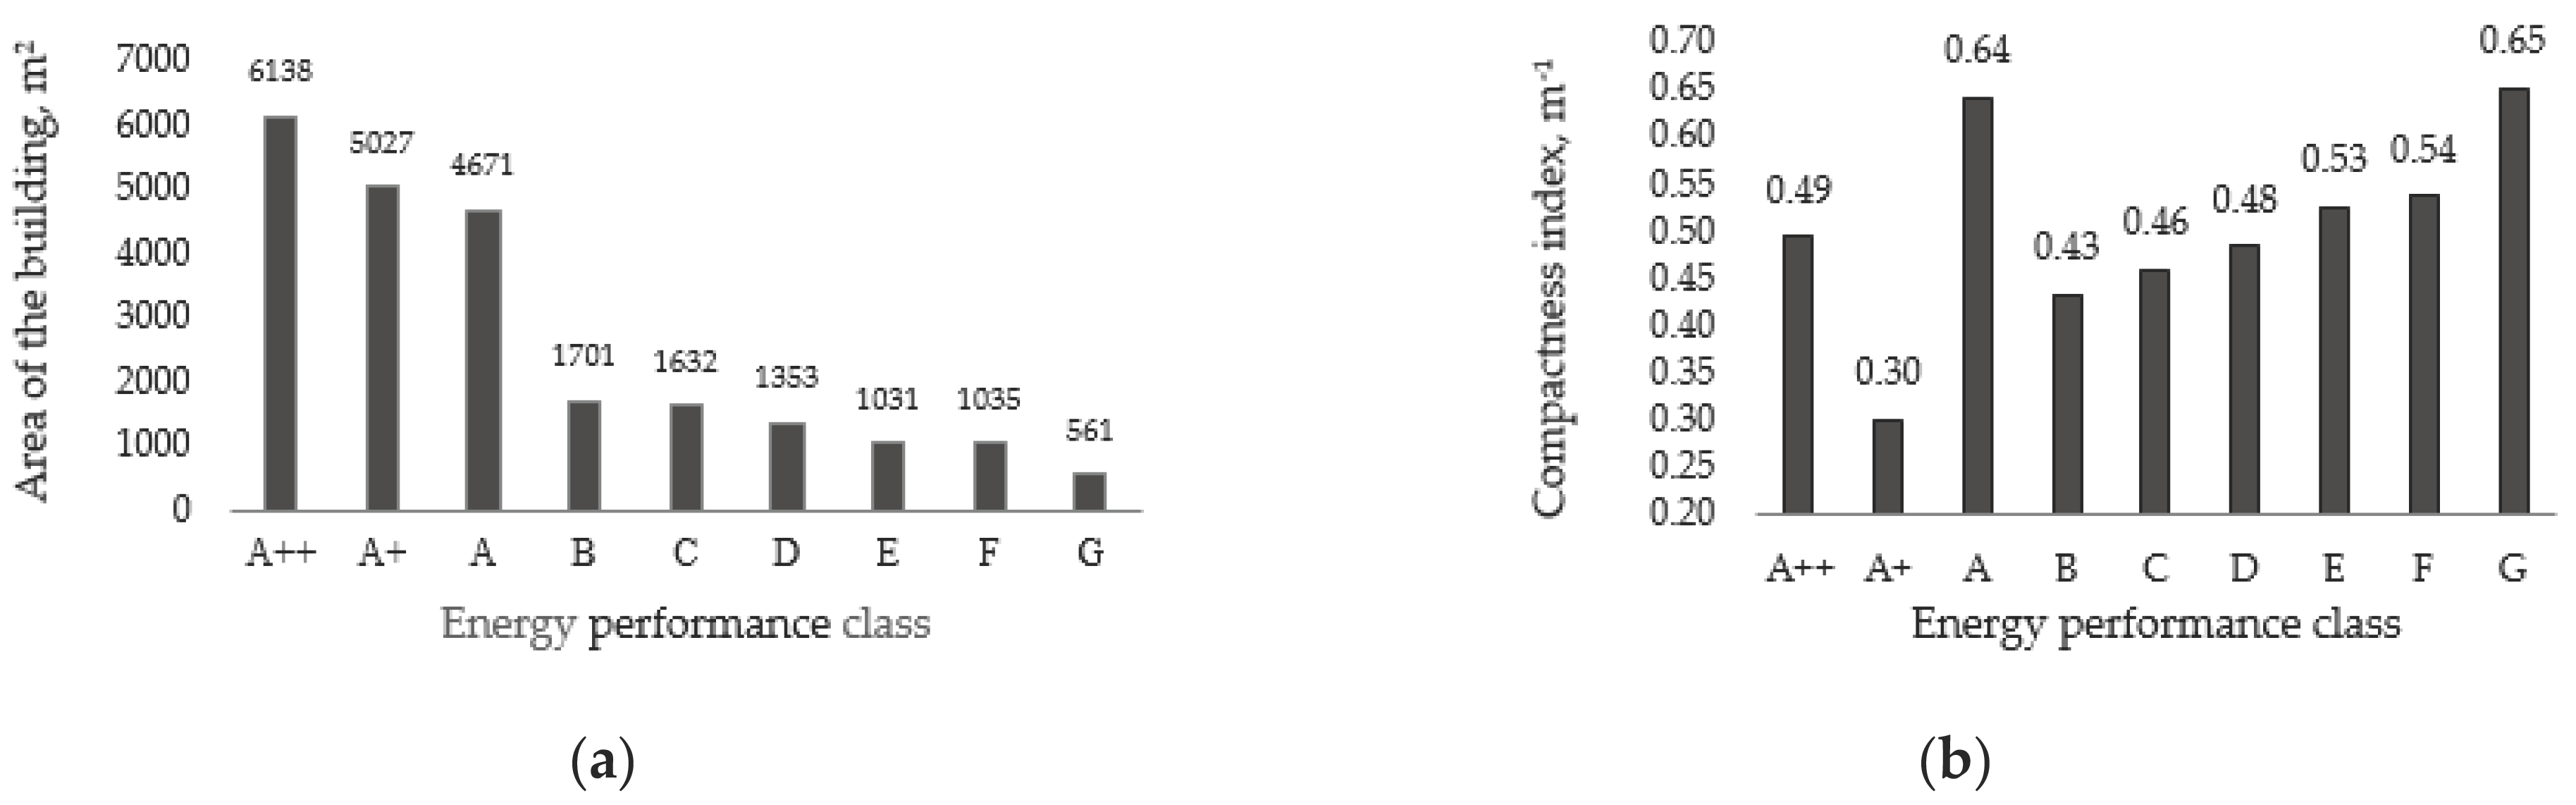
After collecting information about the geometric data of office buildings, the average heated area of certified buildings and the compactness ratio of each class were calculated. This analysis is important in determining the factors influencing the increase in energy efficiency of buildings. Figure 2a shows how the increase in energy efficiency class of buildings is followed by an increase in the heated area of office buildings. This means that office buildings with an increasingly large area were built, whose heat losses related to 1 m2 of heated area decreased even with the same thermal insulation of the external partitions. Therefore, the results suggest that increasing the size of buildings was an important factor in reducing their energy demand.
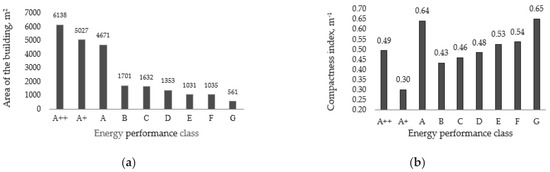
Figure 2.
Average heated area (a) and building compactness ratio (b) of office buildings.
Optimizing the shape of the building in order to achieve a smaller area of external partitions per 1 m3 of heated volume is also an effective means of reducing building heating energy, the economic payback of which is even difficult to assess. From the point of view of building construction, investments in building structures with more complex shapes are higher, and building energy consumption is also higher. However, office building developers measure investments in more sophisticated shape of buildings in terms of attractiveness of use and success in renting, so the purpose of energy efficiency requirements is to influence this process and search for a rational balance. A decreasing trend in the compactness ratio of buildings of classes before A was observed (Figure 2b). These are old buildings, the design and construction of which were not yet affected by modern prestige standards, so requirements of efficient construction and use were dominant. The higher compactness ratio of class A buildings is explained by the intensive development of prestigious office buildings, when energy efficiency requirements were still easily achievable. After increasing the energy efficiency requirements for office buildings to level A+, it was therefore necessary to optimize the form of the building, reducing the compactness ratio, since buildings with a complicated shape required increased thermal insulation, which became expensive and technically complicated to achieve. Along with the transition to the A++ class requirements, the amount of renewable energy in the heat supplied by district heating, mainly used for office buildings, and in the total energy consumed by the building, increased significantly, so it became easier to meet the requirements, and architects returned to the design of buildings of various shapes with a higher compactness ratio to better satisfy customers’ wishes to be in fashion. According to the Passivhaus Primer: Designer’s Guide [25], 0.4 is a good compactness ratio for a high-rise building.
4.2. Glazed Area of Office Buildings
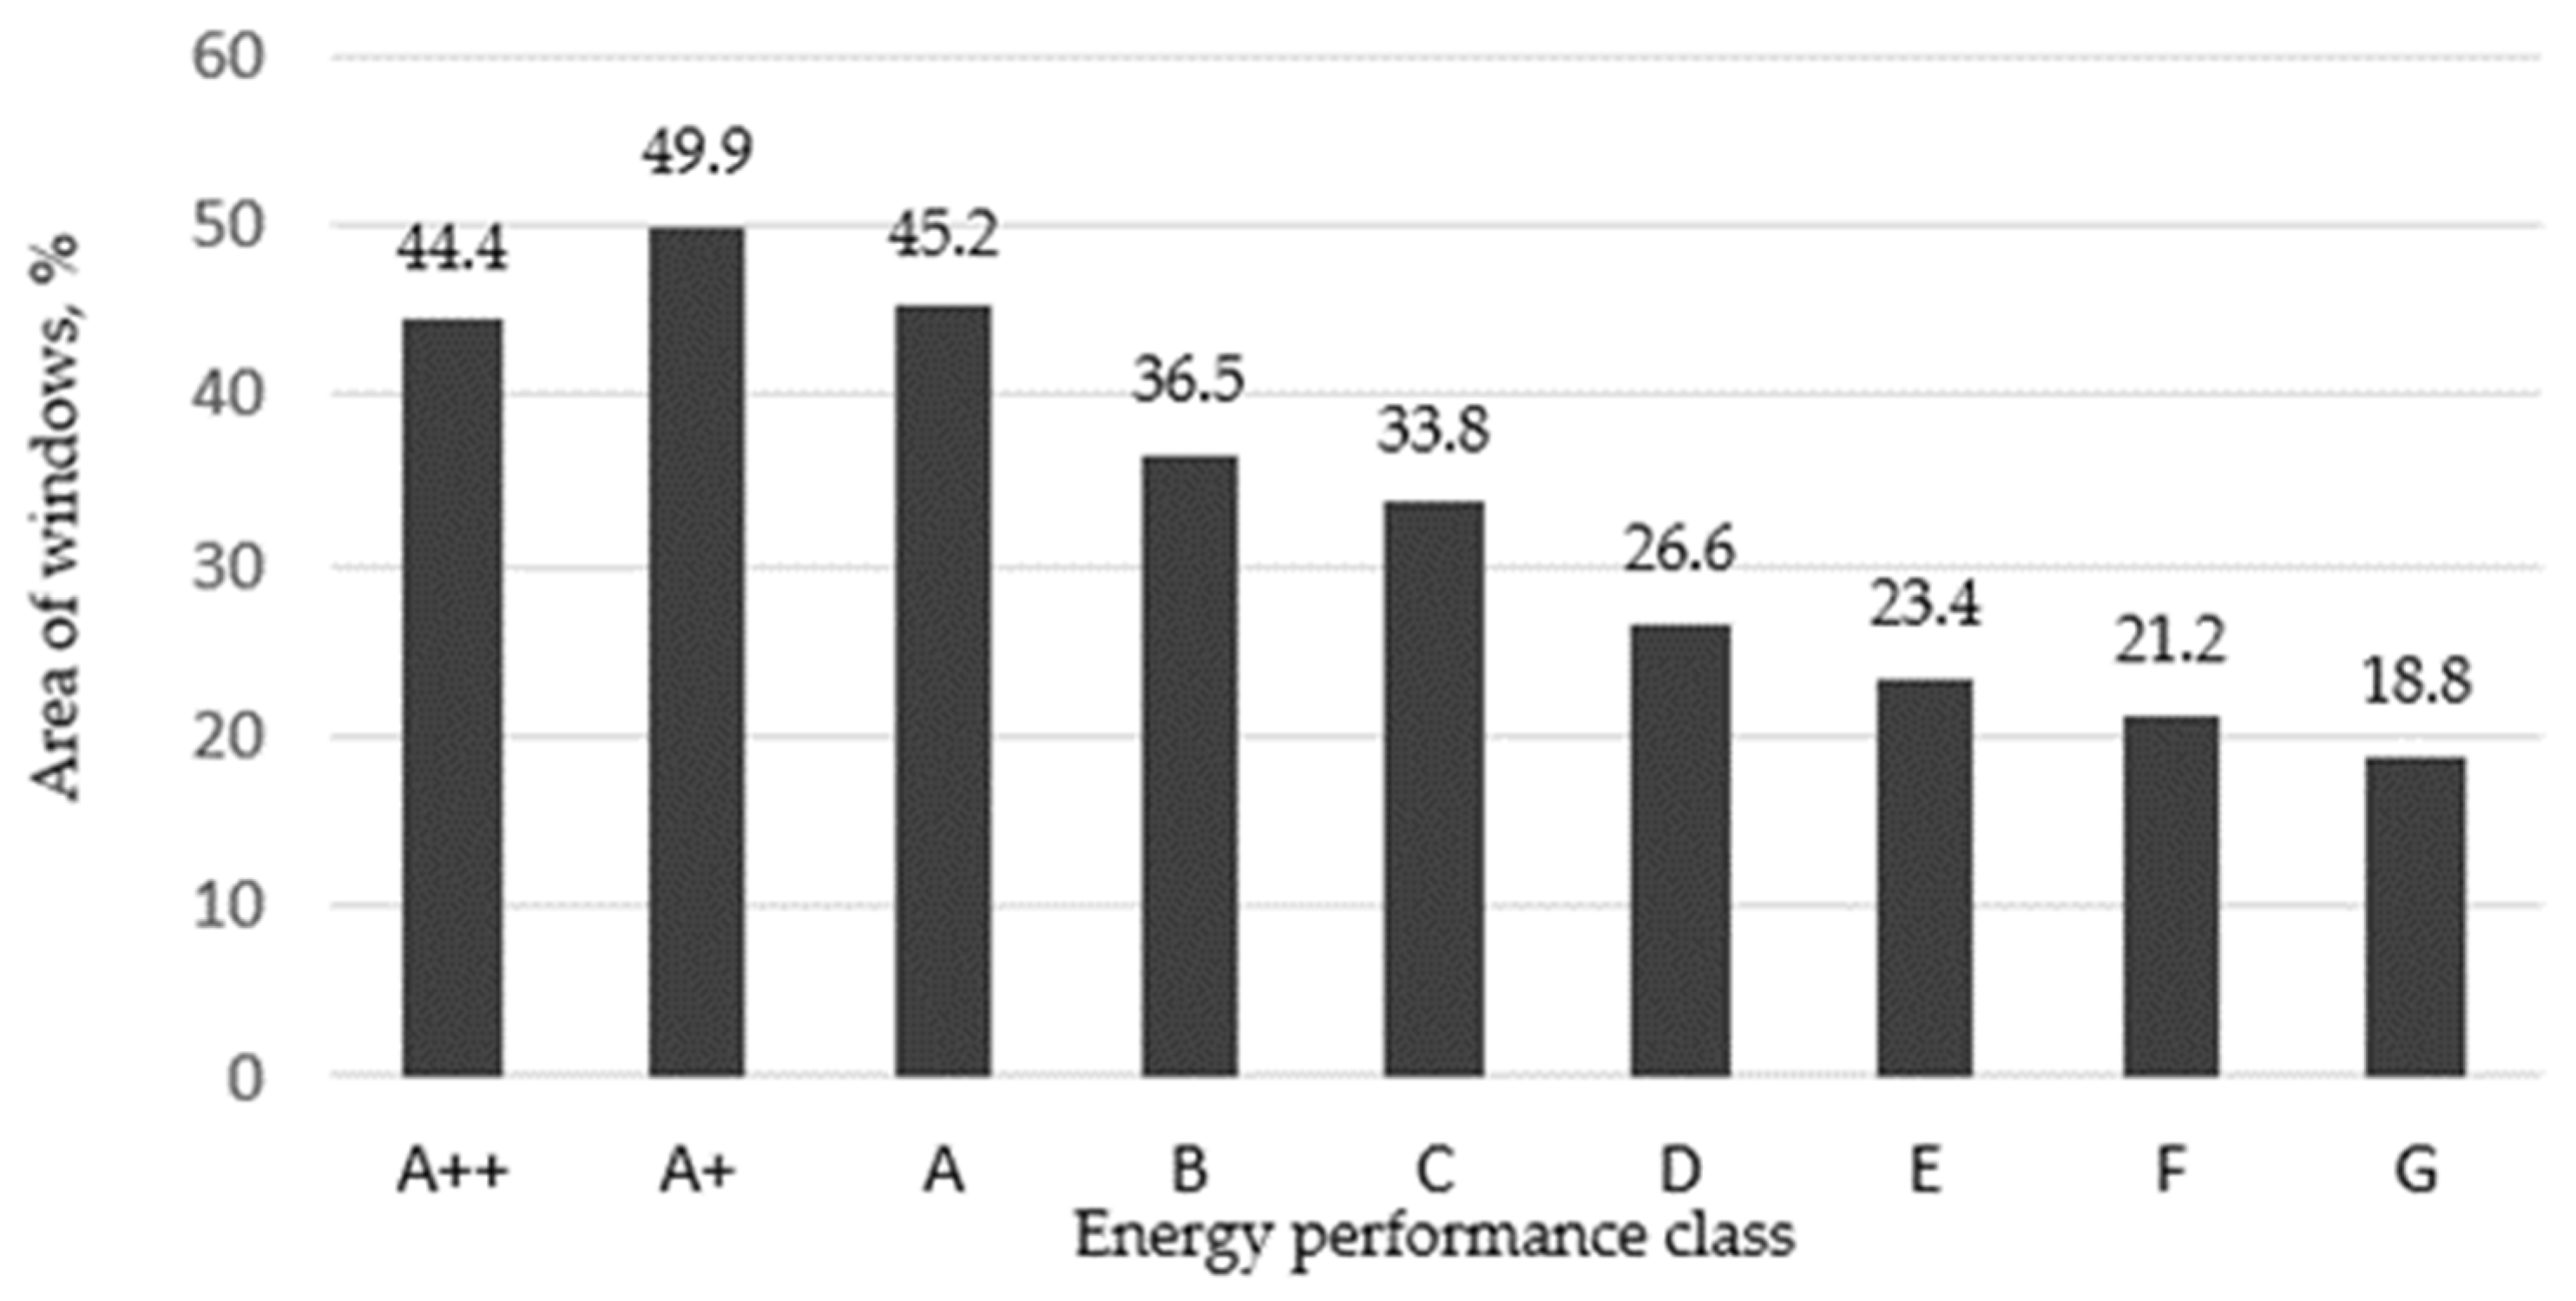
The number of transparent partitions in a building also has a significant influence on the energy efficiency of the building, so the average glazing area of each class of buildings was calculated. When designing office buildings, contradictions are also encountered here: the larger the glazing area, the greater the building’s heat loss (in cold climates, solar heat gains are unable to compensate for heat loss during the heating season). Lithuania’s geographical location also determines that a larger glazing area causes a greater energy demand for cooling during long summer days. Therefore, it would be logical, in order to achieve overall efficiency of the construction and use of office buildings, to minimize the area of transparent partitions, taking into account the requirements of natural lighting and environmental monitoring. However, designers of buildings followed a popular architectural trend, that a greater amount of glazing is one of the most visible indicators of a building’s prestige and value, so the area of glazing in buildings kept increasing. Figure 3 shows that the use of glazing in building envelopes has increased, including in class A+.
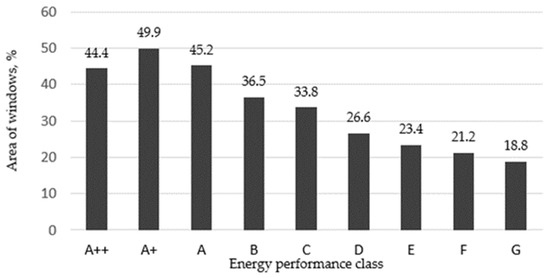
Figure 3.
The glazed area in buildings’ external partitions (%).
Only in A++ class buildings has the proportion of glazing in the total area of the external walls decreased, decreasing to the level of A class buildings. The increase in the amount of glazed partitions in buildings is mainly determined by architectural design trends and the specifics of the activities of office buildings (increase in the amount of available natural light, prestige external view), while energy efficiency requirements related to higher heating and cooling energy demand usually remain secondary. The influence of daylighting requirements of premises is also avoided because daylighting requirements of office buildings are not well regulated in Lithuania: hygiene standards determine the level of illumination in the premises, and the user of the building must ensure it by designing and installing missing artificial lighting. However, we can see from the analysis that the increase in the area of glazing in a building’s external partitions has slowed down, and this will contribute to the reduction of energy consumption in office buildings.
4.3. Thermal Insulation and Space Heating Energy Consumption
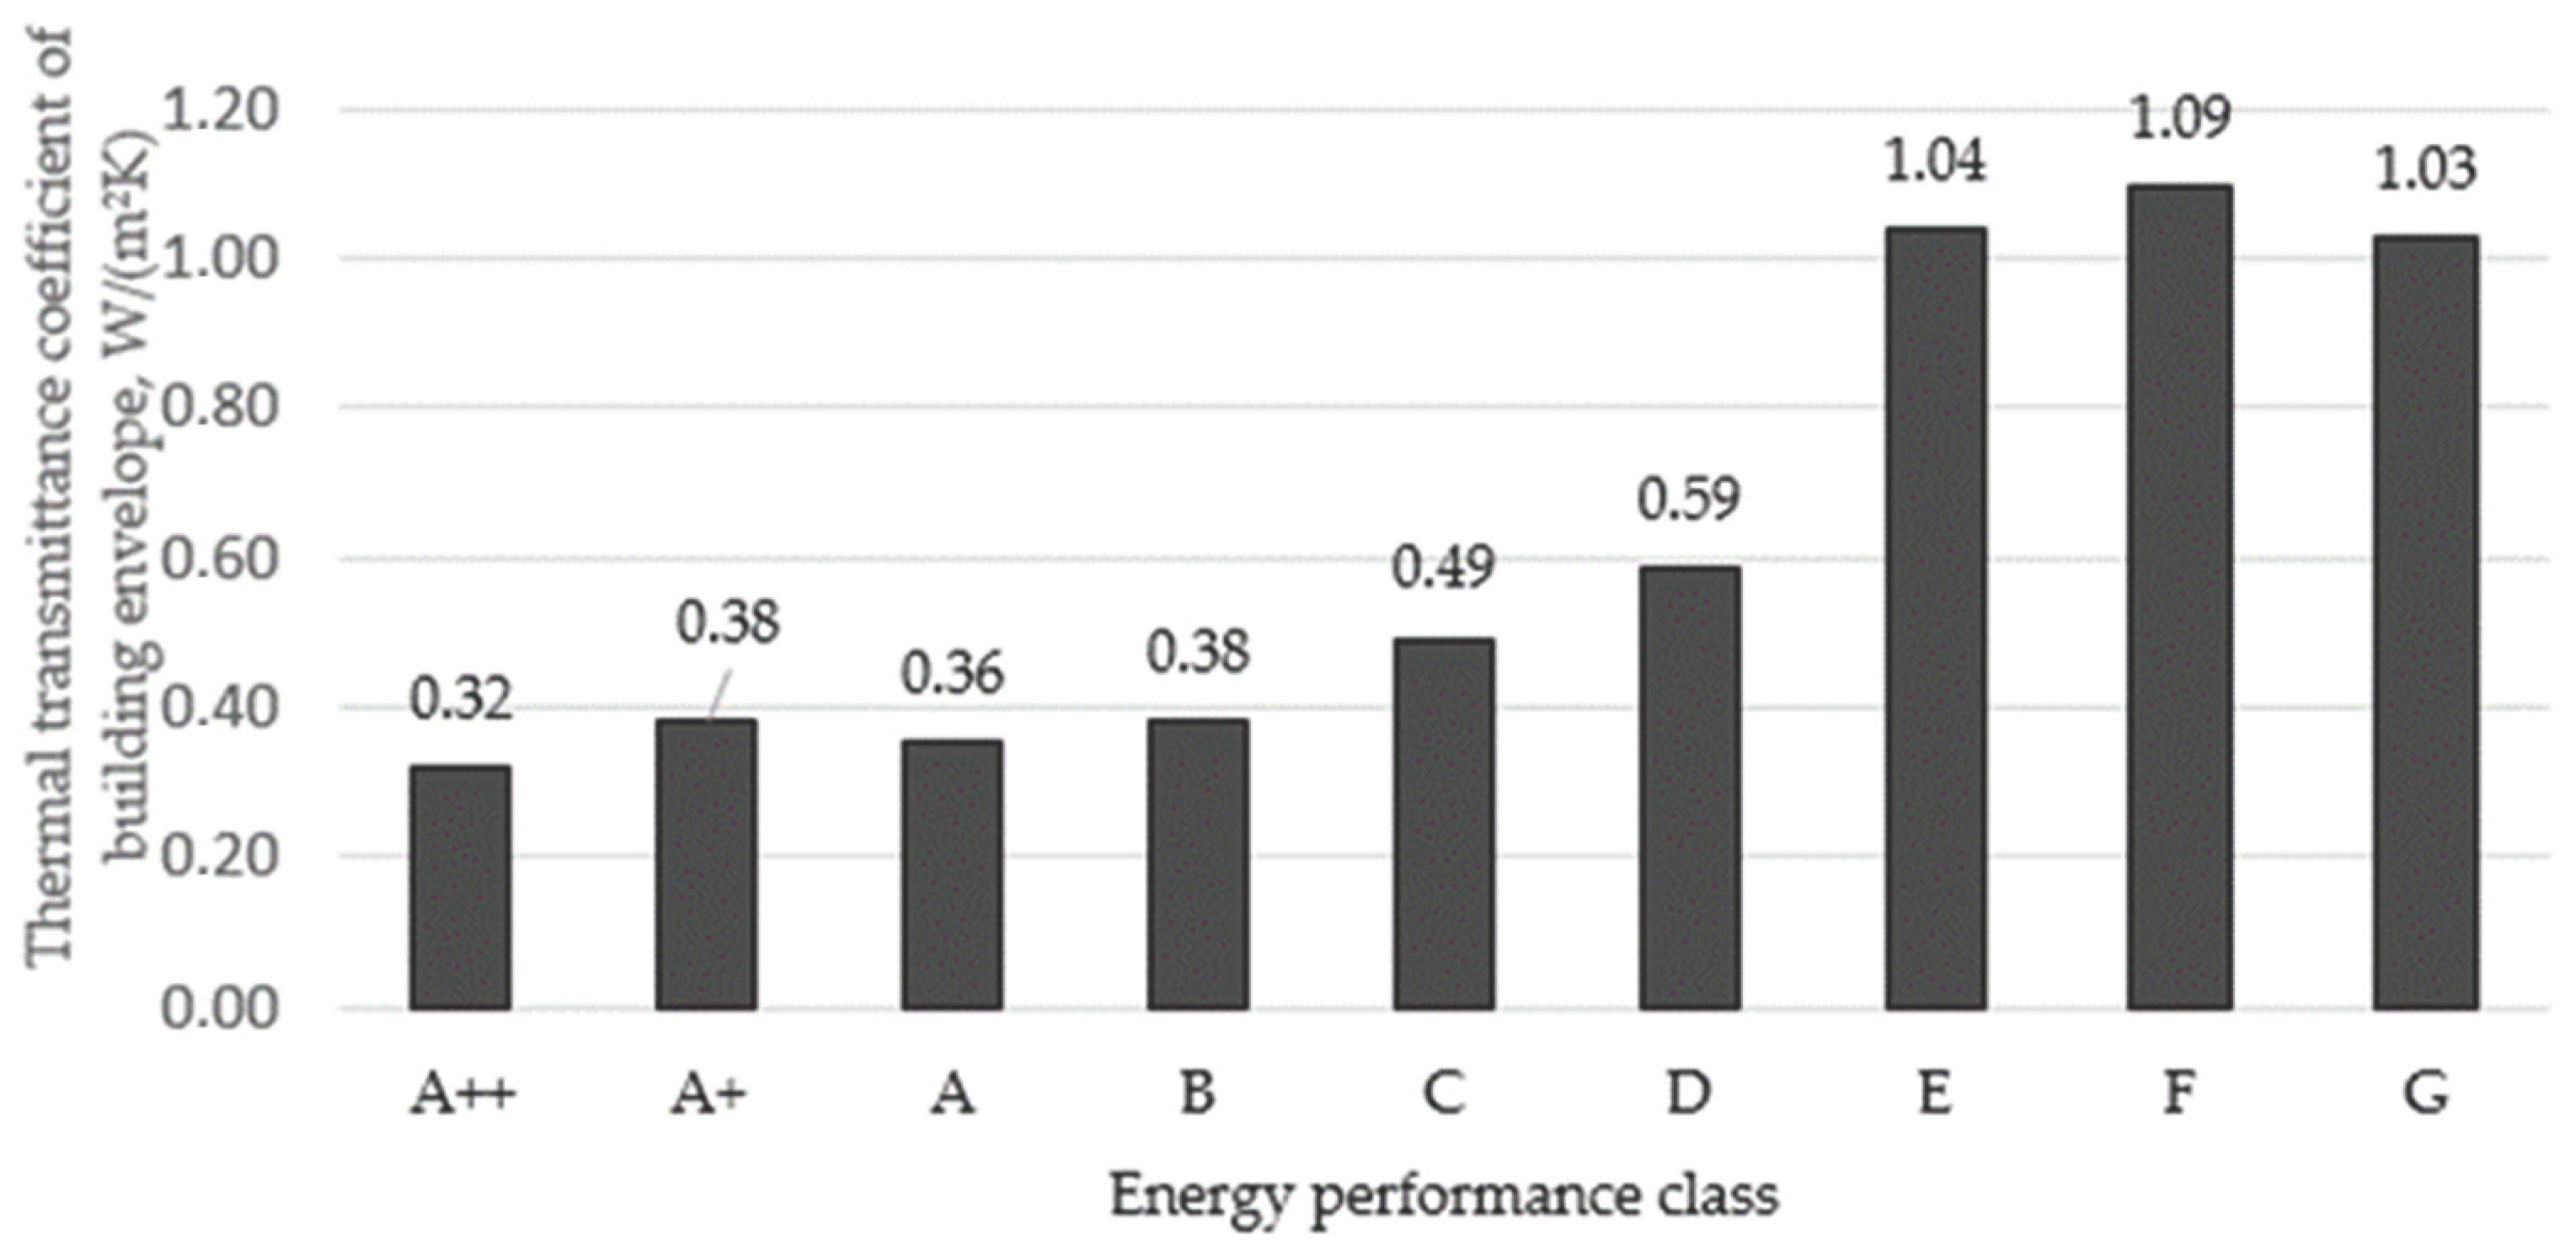
Thermal insulation of building external partitions in cold climate locations is considered as the main indicator affecting energy consumption for building heating. On the one hand, the use of thermal insulation and lower U-value windows in the building increases the price of the building; on the other hand, it reduces energy consumption and costs for thermal energy for a long period of the building’s operation. To achieve this balance, cost-optimal calculations are carried out on the basis of which the limits of optimal thermal insulation are determined, but due to constant changes in the prices of building materials, construction works and energy, individual insulation solutions within defined limits are adopted during the design of each building. The heating energy demand of the building also depends on the efficiency of the energy systems and the type of fuel they use [26]; therefore, an analysis of the dependence of average thermal insulation of external partitions on building energy efficiency class was carried out in order to demonstrate the changes in the insulation of buildings and their impact on the thermal energy demand of buildings. According to data extracted from EPCs and analysed (Figure 4), the thermal insulation of buildings has improved: the average thermal transmittance of the building envelope has decreased from 1.03 W/(m2·K) for class G to 0.32 W/(m2·K) for class A++.
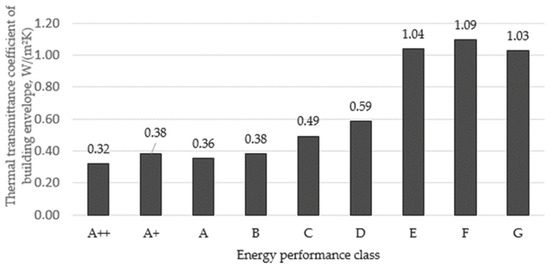
Figure 4.
Average thermal transmittance of the building envelope, depending on energy performance classes.
During the period of implementation of the EU Directives, from 2006 (Class C), i.e., the year the first EPBD was transposed into Lithuanian law, until Class A++ became the minimum mandatory requirement, thermal insulation improved by about 1.5 times, with the average U-value of the building envelope decreasing from 0.49 W/(m2·K) for Class C to 0.32 W/(m2·K) for Class A++. Here, it is necessary to point out the increase in the number of glazed partitions, so the thermal insulation of other partitions increased much more than the average insulation of the building envelope.
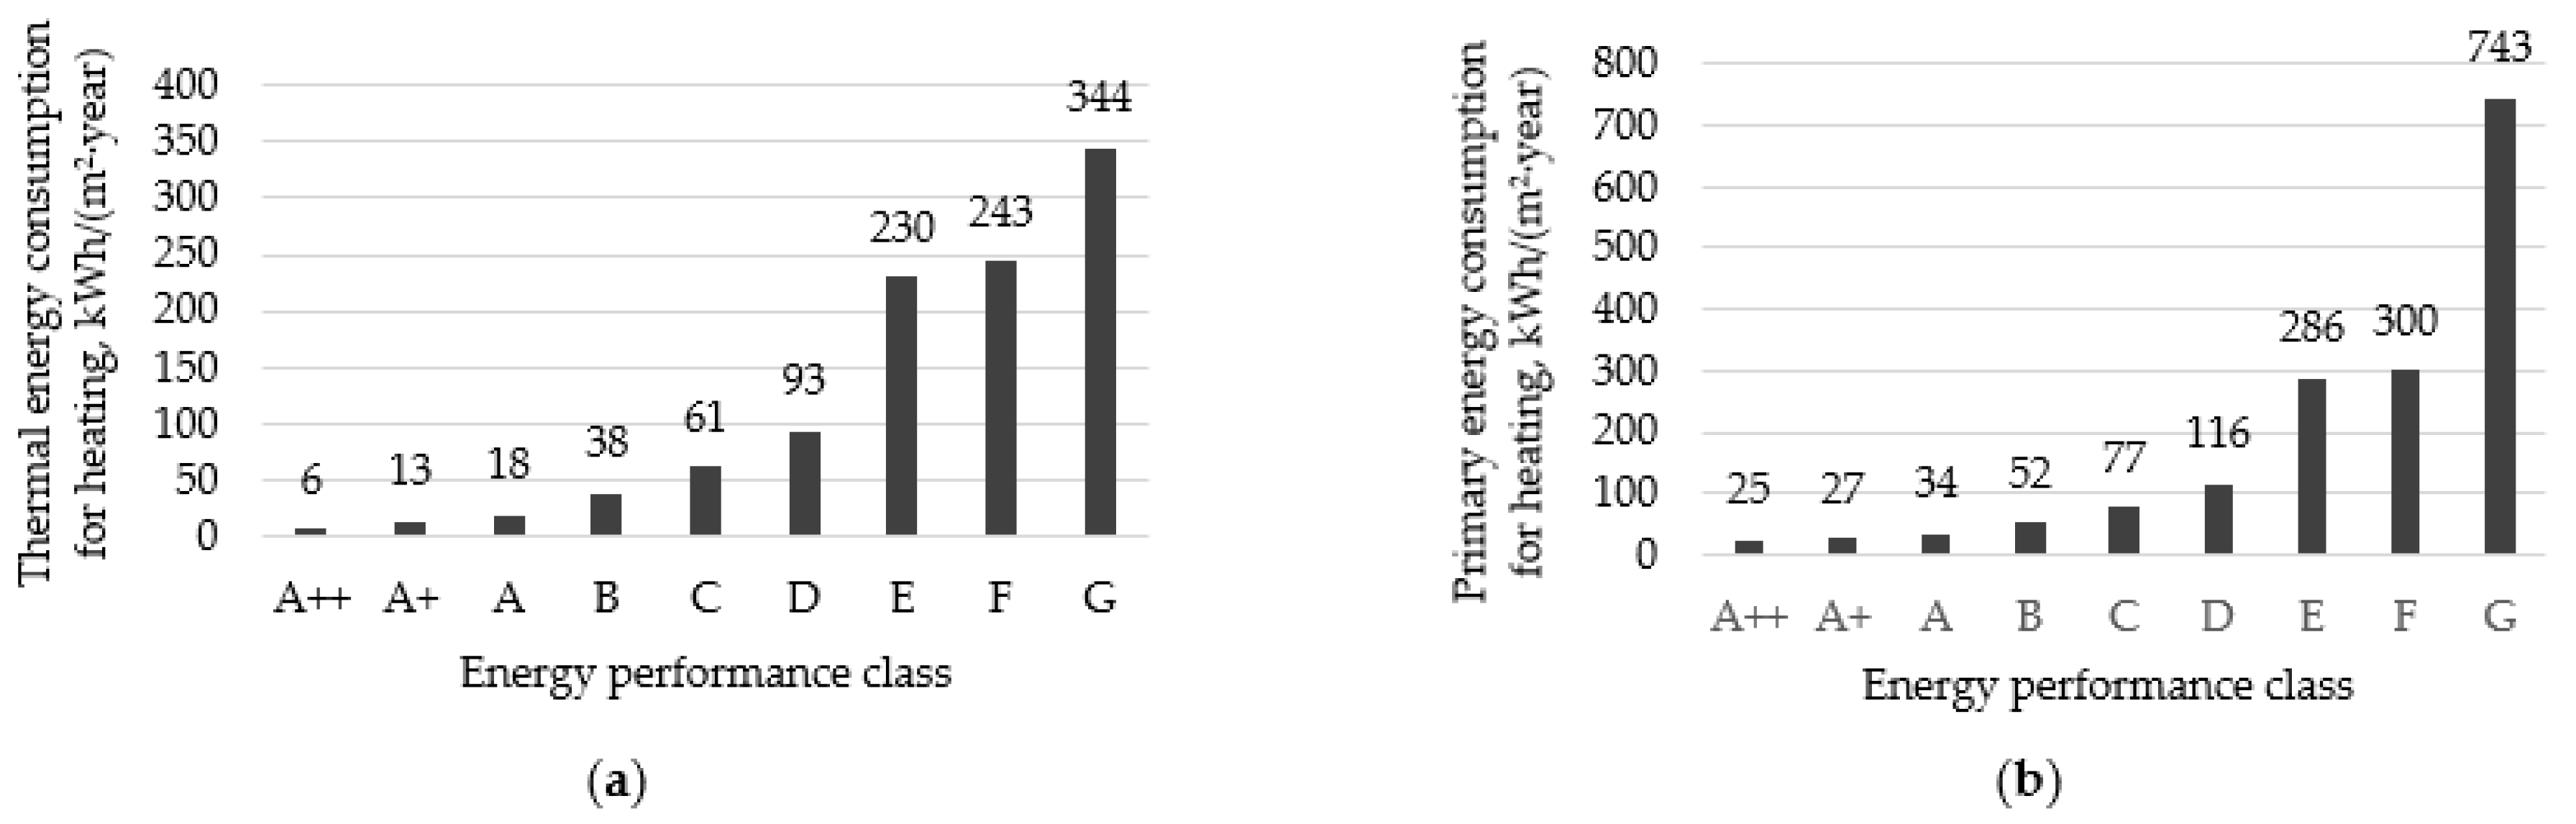
The improved thermal insulation of the building envelope decreased the average final energy consumption for heating from 344 kWh/(m2·year) for buildings of energy efficiency class G to 6 kWh/(m2·year) for buildings of energy efficiency class A++ (Figure 5a). Similarly, primary energy consumption reduced from 743 kWh/(m2·year) for class G buildings to 25 kWh/(m2·year) for A++ class buildings (Figure 5b).

Figure 5.
Average thermal (a) and primary (b) energy for heating, depending on building energy performance class.
The average final energy consumption of the analyzed period (from 2006) for space heating decreased from 61 kWh/(m2·year) to 6 kWh/(m2·year), comparing buildings of C to A++ energy performance classes. Such a low value of average energy consumption for heating was achieved because the energy performance requirements of A++ class buildings came into force only from the beginning of 2021,and so, until the beginning of 2024, only 12 office buildings were built and certified (see Figure 1). These are large buildings with a large heated area (see Figure 2a); 1 m2 of heated area has a relatively small area of external partitions, so heat losses are small, and therefore low average heating energy consumption is obtained. They are also very similar in size and shape, as they were designed within a few years, so the energy consumption of each of them differs only by fractions of a unit. Similarly, primary energy consumption decreased from 77 kWh/(m2·year) to 25 kWh/(m2·year) for buildings of C and A++ energy efficiency class, respectively. In terms of numbers, these are significantly smaller drops in average heat transfer and energy consumption than in the previous period (1992–2006), but it is necessary to mention that the usual increase in thermal insulation was not enough to achieve this and many other technical and engineering measures were implemented. The significant reduction of energy consumption can be assigned to introduced air permeability measurement requirements in 2014 [6] and to the use of more efficient heating energy sources with a smaller portion of non-renewable primary energy.
4.4. Energy for Cooling the Building
The results of the analysis of the final energy for building space cooling must be evaluated taking into consideration the calculation methodology. The final energy for cooling is calculated based on the number of glazed partitions and their thermal properties, the thermal insulation of walls and roofs and also the airtightness of the building. Very low cooling energy demand of the lowest—G, F, E, and partially D—class buildings are explained by the low airtightness of the buildings, which means intensive infiltration and the related natural cooling of the building. Buildings of classes C and higher have mandatory airtightness requirements, so their energy consumption for cooling is much higher.
It was observed that the trend of energy demand for cooling (see Figure 6a) correlates with the trend of the window area in the building envelopes (see Figure 3). This means that the walls and roofs in buildings of class C and higher are already insulated to such a level that the heat does not pass through it during the day, so their influence on cooling energy consumption is small. The explanation of this trend is also related to the glazed partitions: from C to A++ class, the heat transfer coefficient of walls decreased from 0.25 W/(m2·K) to 0.12 W/(m2·K), of roofs from 0.20 W/(m2·K) to 0.11 W /(m2·K), and at the same time of windows from 1.6 W/(m2·K) to 0.9 W/(m2·K). As mentioned earlier, the cooling demand of buildings is mainly influenced by the area of windows, and their lower heat transfer coefficient only further reduces the heat flow from the premises to the outside, which increases the cooling energy demand.
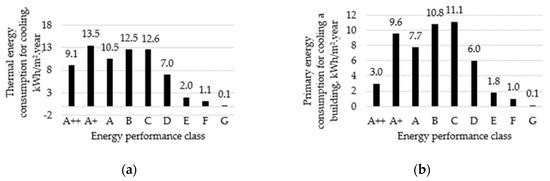
Figure 6.
Average of final (a) and primary (b) energy for space cooling, depending on energy performance class.
In order to achieve comparable results, the amount of the final energy for cooling for energy certification purposes is recalculated into the primary energy for cooling, considering that heat pump technology will be used for cooling, the efficiency of which depends on the class of the building. A positive trend can be seen in primary energy consumption for cooling of Class A++ buildings (Figure 6b), since the highest cooling efficiency of the heat pump was used in the calculation. The reduction of primary energy consumption for cooling to 3 kWh/(m2·year) is a good achievement, additionally considering the fact that only small investments are required because the same heat pumps are used for cooling the buildings as for heating.
According to the calculation methodology, the energy consumption for cooling the building is calculated uniformly in all certified buildings—where the cooling system is installed and where it is not. The decrease in cooling energy consumption of A++ class buildings shows that installing modern cooling systems in actual buildings of lower energy performance classes would reduce cooling energy demand. By installing more solar heat protection measures, including solar control glasses and adaptive screens, the energy consumption for cooling in office buildings can be further reduced or avoided completely.
4.5. Energy for Domestic Hot Water
The thermal energy for domestic hot water includes the consumption of thermal energy for the production of hot water considering the efficiency of heating equipment and the compensation for heat losses in distribution pipes between hot water production and use.
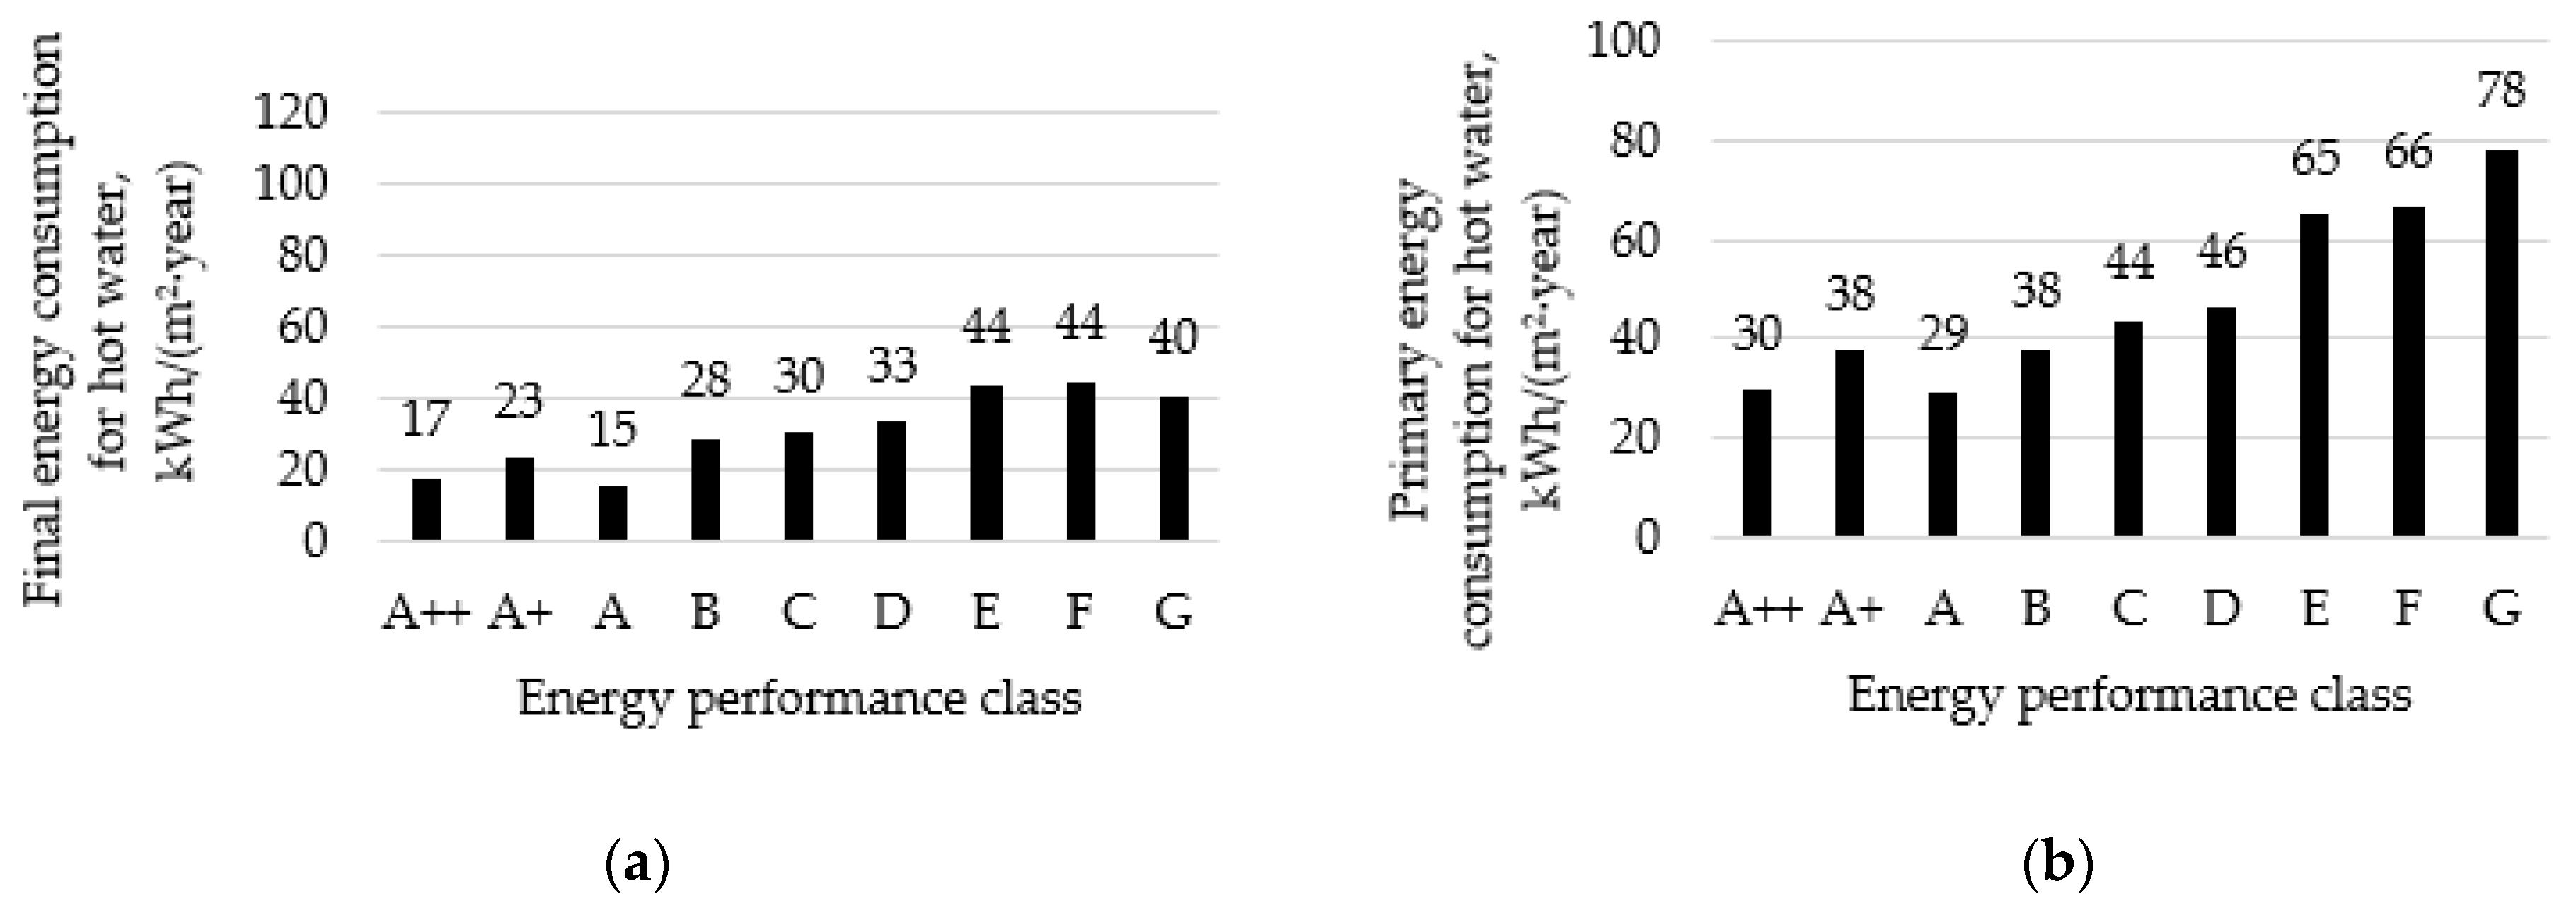
Figure 7a shows the final energy consumption for hot water production in buildings of different energy performance classes. Compared to the energy consumption in buildings of class C to class A++, the thermal energy for domestic hot water decreased by 57% (from 30 kWh/(m2·year) to 17 kWh/(m2·year), with a corresponding reduction in primary energy consumption (from 44 kWh/(m2·year) to 30 kWh/(m2·year)). This is a good achievement considering that the amount of energy needed to heat water is constant and determined by the laws of physics. The reduction of energy consumption was achieved through a number of measures including shortening pipelines, insulating hot water pipes and improving the efficiency of appliances for water heating and distribution.

Figure 7.
Average thermal (a) and primary (b) energy for domestic hot water, depending on energy performance classes.
Figure 7b shows that the primary energy for domestic hot water in office buildings of particular energy performance classes correlates with the final energy consumption. This means that the amount of energy used for hot water in office buildings has been reduced mainly by technical means. Primary renewable energy is still not used much, especially energy produced in the building or its surroundings from renewable sources. Office buildings have the advantage of efficiently using solar energy for hot water production compared to residential buildings, because their activities take place during the day when energy is produced, so it can be used directly, avoiding accumulation to increase the efficiency of solar energy utilization. This is a promising direction for increasing the efficiency of hot water production equipment in office buildings.
4.6. Changes in the Distribution of Energy Consumption in Office Buildings
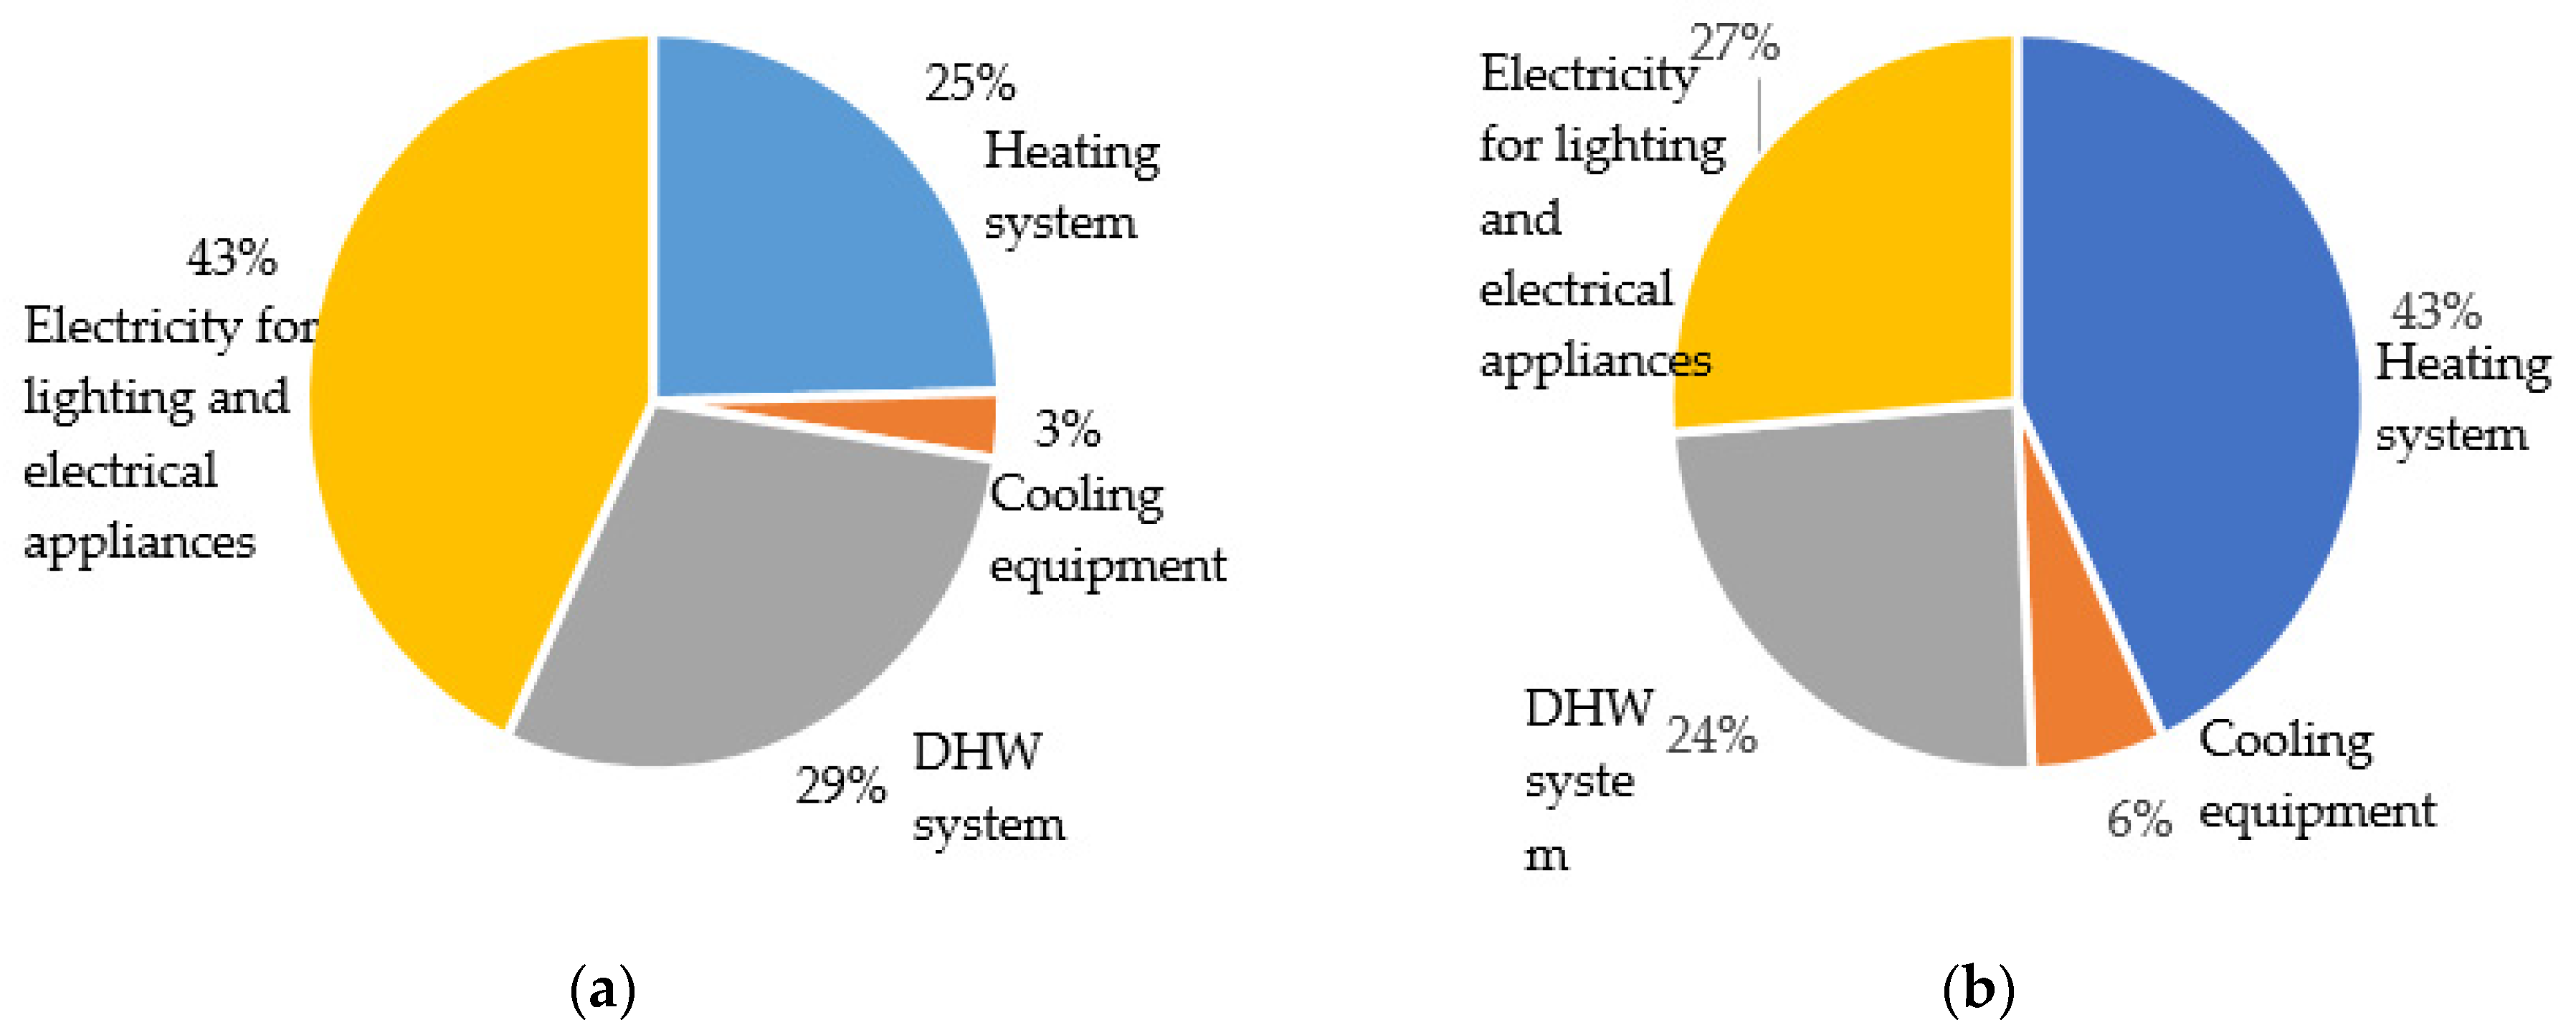
Although the total primary energy consumption in office buildings has decreased, it is valuable to analyze how the distribution of primary energy consumption in buildings has changed. Figure 8 shows the share of primary energy consumption depending on the purpose of use in buildings of classes C and A++.

Figure 8.
Share of primary energy consumption in buildings of A++ (a) and C (b) energy performance classes.
This energy demand distribution analysis shows which energy use should be prioritized in order to further increase the energy efficiency of office buildings. It could be observed that energy consumption for heating in the overall energy balance has decreased from 43% in class C buildings to 25% in class A++ buildings. This is not to say that there are no opportunities to increase efficiency in this energy application, but achieving significant reduction of energy consumption will be difficult. The part of primary energy for domestic hot water has even increased in A++ class buildings, so it is necessary to find ways to reduce the use of primary energy in this area by choosing heating devices that use less non-renewable energy and more efficient systems. The obvious task for short-term improvements should be the reduction of primary energy for electrical appliances: energy use for this purpose has decreased slightly, so its part in the overall energy balance of class A++ buildings has increased significantly.
5. Discussion
The newly revised Energy Performance of Buildings Directive (EU/2024/1275) requires each member state to create a national database of energy performance indicators of individual buildings and of the overall energy performance of the national building stock [7]. The most relevant source of this database should be energy performance certificates. They should incorporate trends for the cost-effective increase of energy performance and the reduction of CO2 emissions from buildings. To achieve these goals, it is very important to analyse the information in EPCs already issued and determine the level of energy efficiency indicators of the above-mentioned buildings of different groups, and also to predict directions for further efficiency improvement in energy performance of buildings. The study carried out is an initial step in the implementation of these statements of the revised Directive.
The results of the study conducted show that the implementation of the EPBD significantly increased the energy efficiency of office buildings. The final heating energy consumption decreased mainly due to significantly greater thermal insulation of the building envelopes and ensuring the airtightness and the design and construction of office buildings with a larger area also contributed. The increase in the area of glazed partitions and the design of buildings with shapes that increase the compactness ratio, which correspond to the priorities of the users of these buildings, did not allow further reduction of these energy demands. Koźniewski et al. [27] note that the geometric form of a building, expressed by the building compactness indicators presented in his publication, has an essential impact on energy demand. The district heating network, which is perhaps the most common source of heat supply for office buildings, by increasing efficiency and the amount of primary renewable energy in the heat produced by it, contributed to a significant primary heating energy reduction.
Cooling energy consumption of office buildings mainly depends on the area of glazing. The reduction of final energy for cooling is clearly determined only in A++ class buildings. Increasing the thermal insulation of walls and roofs will not affect energy for cooling, while glazing with lower heat transfer would only increase this energy demand. In order to further reduce energy for cooling, it is necessary to use more solar protection measures in office buildings, especially adaptive screens that are used only when the need for cooling arises, which are more in line with the specifics of the activities in office buildings, since visibility must be ensured during the working day. Huh et al. [28] concluded that cooling has become a significant energy user and poses challenges, so more attention should be paid to passive design, natural ventilation and flexible shading systems, public awareness of energy-efficient cooling equipment and green lifestyles.
The use of advanced cooling systems with heat pumps for cooling will also contribute to the reduction of both final and primary energy. For the cooling of office buildings, it is usually not efficient to use the energy produced in the building from renewable sources, because tall buildings with a large floor area are currently being built, and the area of the roof for installing photovoltaic power plant is small compared to the building area used, so it is more rational to use the energy produced by the installed solar power plants for purposes other than cooling of the building.
As the results of the analysis show, energy for hot water constitutes a significant part of the energy consumption of buildings of high energy efficiency classes. Implementing the requirements of the Directive, the amount of energy for hot water production has been reduced by improving the efficiency of water boilers, insulating hot water pipelines and optimising hot water supply from boiler to consumption point. The potential of these measures to further reduce the energy for hot water production has been exhausted. Therefore, perhaps the only way to further increase the energy efficiency of hot water production in administrative buildings is to decrease the primary non-renewable energy part in the energy used for hot water preparation by choosing appropriate types of energy and fuel. If it is technically possible, the use of water-heating solar collectors would significantly reduce the consumption of primary non-renewable energy for domestic hot water, but, as in the case of using renewable energy for cooling, it is more efficient to use the roof area for a solar photovoltaic power plant and use the electricity produced by it for electrical appliances in the building. The authors of the publication [29] have analyzed in detail many technical measures aimed to reduce the energy demand of hot water production. Some of them reduce the comfort of using hot water, others are expensive and are not paid off for a long time. Researchers indicate additional opportunities to reduce energy for hot water by computerizing the circulation system and using heat pumps for hot water production, but due to the wide diversity of buildings and their engineering systems and hot water use patterns, there are no detailed studies confirming the effectiveness of these measures yet. When certifying buildings, the amount of electricity used for lighting and electrical appliances is calculated according to normative values; the real electricity consumption may be even higher, and therefore the impact of the use of electricity produced from renewable sources on the overall energy efficiency of an actual office building can be reduced by optimizing the lighting of the building and the use of electrical appliances through organizational measures. Since the requirements of the EPBD are implemented in all member states, changes in the energy efficiency of Lithuanian office buildings were compared with Latvia’s achievements in this field. In the EPBD implementation period, Latvia’s energy efficiency in office buildings has shown progress but still lags behind leading EU countries [30,31]. Energy consumption in administrative and office buildings in Latvia typically ranges between 110 and 150 kWh/(m2·year), with larger buildings showing greater energy efficiency. This suggests that larger office buildings have better implementation of energy-saving measures and technologies compared to smaller ones. Average heating energy consumption of office buildings is 142 kWh/(m2·year), and this corresponds to the energy efficiency level of an E class building [32]. This low average energy performance level shows that there are not many new buildings in the office building sector (there are no certified buildings of class A and only a few percent of B class buildings; about 70 percent of office buildings belong to the lowest E and F classes), indicating a need for targeted efficiency improvements. The integration of advanced building management systems and renewable energy sources is crucial to enhancing energy efficiency, while more stringent policy interventions and technological advancements are essential to close the gap and meet EU energy efficiency benchmarks [30,31].
An improved energy performance evaluation for office buildings was performed by Sun and Yu [33]. In the conclusions of their study, the authors indicate that the results can help policy makers and regulators to develop effective energy efficiency improvement policies and regulations, institute a building energy efficiency program, and put in place suitable energy-saving strategies. The results of this study and the comparison of the energy efficiency indicators of Lithuanian and Latvian office buildings will also contribute to the more targeted improvement of the energy efficiency policy of buildings, not only in these countries but also in the entire European Union.
6. Conclusions
The results of the analysis of the data presented in the building energy performance certificates issued to office buildings demonstrated the significant impact of implementing the requirements of the Building Energy Performance Directive in the normative base of the Lithuanian construction sector in the period from 2006 to 2021 on the energy efficiency of office buildings. A comparison of the energy consumption of C and A++ energy efficiency buildings showed that the average need for thermal energy for heating became about 10 times lower, for cooling about 35 percent, and for hot water about 2 times lower. Accordingly, primary energy consumption also decreased.
The energy performance improvement measures and their impact were defined; also, obstacles to achieving a more efficient energy performance of buildings were pointed out as technical problems.
Solving these problems is a task in the further implementation of EPBD requirements in Lithuanian office buildings. The obtained results can be used to improve the national strategy for increasing the energy efficiency of buildings, as well as at the European Union level for recasting the EPBD. This shows that EPC information is a suitable source for improving building energy performance policies. The results of the study also show that even more useful information can be obtained from EPCs for the assessment of buildings and the entire building stock. For this reason, the presentation of certification results in the EPC register, must be improved by publication in the register of more data related to building structure and energy systems. The study also show that it is necessary to improve the building energy performance certification program NRG7 to calculate and present more data to the certificate register, especially about the types of fuel used and CO2 emissions. It would also be useful to improve the entire building certification system by linking building data with their geolocation, so that achievements can be assessed by region, which are currently different. This type of analysis would be a task for future research.
It should be noted that by using the weighted average method for calculating energy efficiency values for the analysis a general picture of the achievements in improving the energy efficiency of office buildings was created. In order to demonstrate the best energy efficiency achievements of office buildings or to identify the worst buildings requiring urgent renovation, selective data should be collected and processing algorithms applied.
Author Contributions
Conceptualization, E.M. and R.N.; methodology, E.M. and R.B.; validation, R.B. and D.A.; formal analysis, A.P. and A.B.; investigation, E.M. and R.N.; resources, K.B. and E.M.; data curation, E.M.; writing—original draft preparation, R.N.; writing—review and editing, R.B.; visualization, R.N.; supervision, R.B. All authors have read and agreed to the published version of the manuscript.
Funding
This research received no external funding.
Data Availability Statement
The primary data presented in the study are publicly available on the official website of the Public Enterprise “Construction Sector Development Agency” at https://www.ssva.lt/registrai/pensreg/pensert_list.php. Other data must be extracted from the files of the certification documents using a special program and having access to the certification files that can be provided by the Public Institution “Building Sector Development Agency” by contacting agentura@ssva.lt.
Conflicts of Interest
The authors declare no conflicts of interest.
References
- Directive 2002/91/EC of the European Parliament and of the Council of 16 December 2002 on the Energy Performance of Buildings. Available online: https://eur-lex.europa.eu/LexUriServ/LexUriServ.do?uri=OJ:L:2003:001:0065:0071:en:PDF (accessed on 18 July 2024).
- Directive 2010/31/EU of the European Parliament and of the Council of 19 May 2010 on the Energy Performance of Buildings (recast). Available online: https://eur-lex.europa.eu/eli/dir/2010/31/oj (accessed on 18 July 2024).
- Directive Directive 2018/844/EU of the European Parliament and of the Council of 30 May 2018 Amending Directive 2010/31/EU on the Energy Performance of Buildings and Directive 2012/27/EU on Energy Efficiency. Available online: https://eur-lex.europa.eu/eli/dir/2018/844/oj (accessed on 18 July 2024).
- Communication from the Commission to the European Parliament, the European Council, the Council, the European Economic and Social Committee and the Committee of the Regions. The European Green Deal. Available online: https://eur-lex.europa.eu/legal-content/EN/TXT/?uri=COM%3A2019%3A640%3AFIN (accessed on 18 July 2024).
- National Energy Independence Strategy. Available online: https://enmin.lrv.lt/uploads/enmin/documents/files/National_energy_independence_strategy_2018.pdf (accessed on 18 July 2024).
- STR 2.01.02:2016 ‘Pastatų Energinio Naudingumo Projektavimas ir Sertifikavimas. Esavadai.lt. Available online: https://www.esavadai.lt/dokumentai/5323-str-201022016-pastatu-energinio-naudingumoprojektavimas-ir-sertifikavimas-pakeitimai-nuo-2019-02-01/ (accessed on 18 July 2024).
- Directive (EU) 2024/1275 of the European Parliament and of the Council of 24 April 2024 on the Energy Performance of Buildings (recast). Available online: https://eur-lex.europa.eu/legal-content/EN/TXT/?uri=CELEX%3A32024L1275 (accessed on 18 July 2024).
- Platten, J.; Holmberg, C.; Mangold, M.; Johansson, T.; Mjörnell, K. The renewing of Energy Performance Certificates—Reaching comparability between decade-apart energy records. Appl. Energy 2019, 255, 113902. [Google Scholar] [CrossRef]
- Pasichnyi, O.; Wallin, J.; Levihn, F.; Shahrokni, H.; Kordas, O. Energy performance certificates—New opportunities for data enabled urban energy policy instruments? Energy Policy 2019, 127, 486–499. [Google Scholar] [CrossRef]
- Bull, R.; Chang, N.; Fleming, P. The use of building energy certificates to reduce energy consumption in European public buildings. Energy Build. 2012, 50, 103–110. [Google Scholar] [CrossRef]
- Gangolells, M.; Casals, M.; Ferré-Bigorra, J.; Forcada, N.; Macarulla, M.; Gaspar, K.; Tejedor, B. Energy Benchmarking of Existing Office Stock in Spain: Trends and Drivers. Sustainability 2019, 11, 6356. [Google Scholar] [CrossRef]
- Gangolells, M.; Casals, M.; Bigorra, J.F.; Forcada, N.; Macarulla, M.; Gaspar, K.; Tejedor, B. Office representatives for cost-optimal energy retrofitting analysis: A novel approach using cluster analysis of energy performance certificate databases. Energy Build. 2020, 206, 109557. [Google Scholar] [CrossRef]
- Amecke, H. The impact of energy performance certificates: A survey of German home owners. Energy Policy 2012, 46, 4–14. [Google Scholar] [CrossRef]
- Hjortling, C.; Björk, F.; Berg, M.; Klintberg, T. Energy mapping of existing building stock in Sweden–Analysis of data from Energy Performance Certificates. Energy Build. 2017, 153, 341–355. [Google Scholar] [CrossRef]
- Pagliaro, F.; Hugony, F.; Zanghirella, F.; Basili, R.; Misceo, M.; Colasuonno, L.; Del Fatto, V. Assessing building energy performance and energy policy impact through the combined analysis of EPC data–The Italian case study of SIAPE. Energy Policy 2021, 159, 112609. [Google Scholar] [CrossRef]
- de Rubeis, T.; Giacchetti, L.; Paoletti, D.; Ambrosini, D. Building energy performance analysis at urban scale: A supporting tool for energy strategies and urban building energy rating identification. Sustain. Cities Soc. 2021, 74, 103220. [Google Scholar] [CrossRef]
- Martínez-de-Alegría, I.; Río, R.-M.; Zarrabeitia, E.; Álvarez, I. Heating demand as an energy performance indicator: A case study of buildings built under the passive house standard in Spain. Energy Policy 2021, 159, 112604. [Google Scholar] [CrossRef]
- Li, X.; Liu, S.; Zhao, L.; Meng, X.; Fang, Y. An integrated building energy performance evaluation method: From parametric modelling to GA-NN based energy consumption prediction modelling. J. Build. Eng. 2022, 45, 103571. [Google Scholar] [CrossRef]
- Khakian, R.; Karimimoshaver, M.; Aram, F.; Zoroufchi Benis, S.; Mosavi, A.; Varkonyi-Koczy, A.R. Modeling Nearly Zero Energy Buildings for Sustainable Development in Rural Areas. Energies 2020, 13, 2593. [Google Scholar] [CrossRef]
- Monstvilas, E.; Borg, S.P.; Norvaišienė, R.; Banionis, K.; Ramanauskas, J. Impact of the EPBD on Changes in the Energy Performance of Multi-Apartment Buildings in Lithuania. Sustainability 2023, 15, 2032. [Google Scholar] [CrossRef]
- Zhang, Y.; Bai, X.; Mills, F.P.; John, C.V.; Pezzey, J. Rethinking the role of occupant behaviour in building energy performance: A review. Energy Build. 2018, 172, 279–294. [Google Scholar] [CrossRef]
- Lietuvos Ilgalaikė Renovacijos Strategija. Available online: https://energy.ec.europa.eu/document/download/73c46aa7-03bf-40ca-aeed-4831890a3ecd_en?filename=lt_2020_ltrs.pdf (accessed on 18 July 2024).
- Pastatų Energinio Naudingumo Sertifikatų Registras (Register of Certificates of Energy Performance of Buildings). Construction Sector Development Agency. Available online: https://www.ssva.lt/registrai/pensreg/pensert_list.php (accessed on 5 February 2024).
- The Koeppen-Geiger Climate Classification. Available online: https://www.mindat.org/climate.php (accessed on 8 July 2024).
- Passivhaus Primer: Designer’s Guide. A Guide for the Design Team and Local Authorities. Available online: https://passivehouse-international.org/upload/BRE_Passivhaus_Designers_Guide.pdf (accessed on 30 August 2024).
- Ferrara, M.; Monetti, V.; Fabrizio, E. Cost-Optimal Analysis for Nearly Zero Energy Buildings Design and Optimization: A Critical Review. Energies 2018, 11, 1478. [Google Scholar] [CrossRef]
- Koźniewski, E.; Sadowska, B.; Banaszak, K. Geometric Aspects of Assessing the Anticipated Energy Demand of a Designed Single-Family House. Energies 2022, 15, 3308. [Google Scholar] [CrossRef]
- Hu, S.; Yan, D.; Qian, M. Using bottom-up model to analyze cooling energy consumption in China’s urban residential building. Energy Build. 2019, 202, 109352. [Google Scholar] [CrossRef]
- Klimczak, M.; Bartnicki, G.; Ziembicki, P. Energy Consumption by DHW System with a Circulation Loop as an Energy Efficiency Component, Based on an Example of a Residential Building. Energies 2022, 15, 3952. [Google Scholar] [CrossRef]
- Krūmiņš, A.; Lebedeva, K.; Tamane, A.; Millers, R. Possibilities of Balancing Buildings Energy Demand for Increasing Energy Efficiency in Latvia. Environ. Clim. Technol. 2022, 26, 98–114. [Google Scholar] [CrossRef]
- How Energy Efficient Are Buildings in Latvia? Institute of Numerical Modeling. Available online: https://modinst.lu.lv/en/how-energy-efficient-are-buildings-in-latvia/ (accessed on 25 July 2024).
- Kundziņa, A.; Geipele, I.; Lapuke, S.; Auders, M. Energy Performance Aspects of Non-Residential Buildings in Latvia. Latv. J. Phys. Tech. Sci. 2023, 59, 30–42. [Google Scholar] [CrossRef]
- Sun, F.; Yu, J. Improved energy performance evaluating and ranking approach for office buildings using Simple-normalization, Entropy-based TOPSIS and K-means method. Energy Rep. 2021, 7, 1560–1570. [Google Scholar] [CrossRef]

Disclaimer/Publisher’s Note: The statements, opinions and data contained in all publications are solely those of the individual author(s) and contributor(s) and not of MDPI and/or the editor(s). MDPI and/or the editor(s) disclaim responsibility for any injury to people or property resulting from any ideas, methods, instructions or products referred to in the content. |
© 2024 by the authors. Licensee MDPI, Basel, Switzerland. This article is an open access article distributed under the terms and conditions of the Creative Commons Attribution (CC BY) license (https://creativecommons.org/licenses/by/4.0/).