Article

A Study on the Relationship between Campus Environment and College Students’ Emotional Perception: A Case Study of Yuelu Mountain National University Science and Technology City

School of Architecture and Planning, Hunan University, Changsha 430071, China
*
Author to whom correspondence should be addressed.
Buildings 2024, 14(9), 2849; https://doi.org/10.3390/buildings14092849
Submission received: 5 August 2024 / Revised: 4 September 2024 / Accepted: 7 September 2024 / Published: 10 September 2024

Abstract

:
The campus environment directly impacts college students’ psychological and emotional well-being, influencing their behavioral performance and the development of their personalities. Investigating the complex relationship between the campus spatial environment and students’ emotions is crucial for designing urban environments that support mental health. Using Yuelu Mountain National University Science and Technology City as a case study, this research developed a framework to analyze campus environment characteristics and emotional perception. The study quantitatively assessed emotional perceptions, examined the specific contributions of different campus environment elements to individual emotions, and created an emotion prediction map to explore these relationships in depth. The results indicate that “campus greenery” and “diversity” negatively affect “disappointment” and “depression”, while “sky views” positively impact “happiness” and “sense of security”. Additionally, “diversity” positively affects “relaxation”, and “campus greenery” and “diversity” have negative effects on “disappointment” and “depression”, with “diversity” having a particularly strong positive effect on “relaxation”. The pronounced spatial clustering of emotional perceptions on campus further underscores the significant influence of the campus environment on individual emotional experiences. As the first study to explore the mechanisms underlying the emotional perceptions of Chinese college students in relation to the campus environment, this research overcomes the limitations of traditional environmental assessment indicators by identifying campus environmental elements and psychological factors that better align with the psychological needs of college students. This provides a scientific basis for optimizing campus environments based on the emotional perceptions of students, thereby supporting mental health promotion and guiding campus environment construction. Moreover, the research methodology is broadly applicable. The integration of campus environment image data and deep learning offers a significant tool for assessing campus space and environmental perception, thereby enhancing human-centered environmental assessment and prediction while more accurately reflecting architectural space perception.

1. Introduction

1.1. Background

Rapid urbanization has had a considerable impact on occupants’ mental health [1,2,3]. In recent years, numerous studies have shown that physical characteristics of the urban environment, including green coverage, air quality, and spatial layout, can significantly affect residents’ emotional state and mental health levels [4,5,6,7,8]. However, due to high population density, severe air pollution, inadequate public facilities and other challenges arising from urbanization, maintaining the health of residents has become a significant challenge for future cities [9,10]. Particularly for college students, whose mental health status is directly related to personal growth, academic achievement, and social adaptability, this issue is critical. Therefore, this research focuses on this urgent matter with the aim of exploring the intricate connections between campus environments and college students’ emotional perceptions, thereby providing a scientific basis for constructing a campus environment that better supports students’ mental health.
In the Blue Book on Mental Health, China’s National Mental Health Report 2022, published by the Chinese Academy of Sciences, the mental health status of nearly 80,000 Chinese university students was investigated, and it was found that the detection rates of depression and anxiety risks were approximately 21.48% and 45.28%, respectively. These data highlight the severity of college students’ mental health problems and the urgency of intervention [11].
As they are not yet fully mature and stable inside, they are most strongly disturbed by the environment. As an important part of the city and the main place for college students to live, study, and perform activities [12], the university campus affects their material and spiritual needs [13]. Campus street space plays an important role in traffic, aesthetics, and community interaction [14], and has a positive impact on enhancing neighborhood activity [15] and reducing personal stress [16] while promoting urban development [17]. Elements of the campus environment, such as “campus greenery”, “diversity”, and “sky views”, may have a direct or indirect impact on students’ emotions through various sensory channels, including vision, hearing, and smell. Therefore, exploring the complex association between campus spatial environments and human emotions is important for building urban environments consistent with mental health.
However, although existing studies have recognized the importance of the campus environment to students’ mental health, the mechanisms by which specific elements of the campus environment influence students’ emotional perception remain underexplored. This study uses Yuelu Mountain National University Science and Technology City as a case study. By constructing an analysis framework that links campus environment with emotional perception and employing street view images and deep learning, it aims to extract and analyze campus environment features and quantitatively evaluate emotional perception. The study seeks to fill the research gap regarding the impact of the campus environment on students’ emotional perception. By revealing the underlying connections between campus environment elements and students’ emotional perception, the research will provide a scientific basis for optimizing and improving campus environments, thereby promoting students’ holistic development and healthy growth.

1.2. Literature Review

According to Stress Reduction Theory (SRT) [18] and Attention Restoration Theory (ART) [19], people’s perception of the environment may directly affect their mood. A favorable urban environment has a positive effect on mood [20,21]. Meanwhile, the street environment plays an important role in residents’ emotions [22,23,24], but most of the studies on the effect of street space on emotions have focused on vegetation [25], and the relationship between the role of other street view elements and emotions has yet to be investigated. Due to the limitations of science and technology, most of the previous measurements on the effect of environment on mood have been conducted by questionnaires, interviews, and on-site observation research methods [26,27,28], through participant ratings or GIS-derived measures [29]. With the advancement of technological development, some sensing devices that capture signals of physiological responses induced by the environment have been used in many studies to measure human emotions and preferences [30,31]. Most of the above studies are conducted in real or simulated environments, which are mostly limited and require significant human, material, and time costs [32,33]. Therefore, there is a need for more in-depth and specific studies on the emotional impact of street environments using more advanced research techniques and tools.
From the perspective of emotional perception, we identified six major emotional perception indicators. Based on the biophilia hypothesis, savanna preference, attention restoration theory, stress reduction theory, and other theories and mechanisms related to nature and human health, the effects of the urban environment on emotions can be categorized into three categories: emotions, attention, and stress [34]. People’s perception of the built environment refers to their feelings about the environment in which they are located; for example, safety scores measure how safe people feel in their environment; therefore, when assessing feelings of safety based on street view images, participants will first hypothesize how safe they would feel if they were located in such an environment [35]. “Feeling safe”, as the most important indicator of perceived urban architecture, reflects important factors of survival. Studies have shown that environmental factors are crucial in shaping individuals’ sense of security in public spaces, including campuses [18], with certain environmental factors being positively correlated with urban crime and the fear of crime [36]. Feelings of depression and stress are closely related to students’ mental health. An analysis by Gascon et al. (2015) [19,37] found that exposure to green spaces was associated with lower levels of depression. Their findings suggest that the presence of green environmental elements can provide users with a refuge from stress, offer restorative experiences, and improve mood and cognitive function. This indicates that the characteristics of different environmental factors can lead to varying levels of health-related behaviors [38]. “Depression” is directly related to mental state, and prolonged exposure to depressive environments can increase psychological stress, leading to depression and anxiety [39,40]. Beautiful and healthy campus spaces can be seen as a restorative environment, reducing stress and restoring focus, and when exposed to such spaces, people also appear to recover from stress and show improved positive mood. In addition, “disappointment”, “happiness”, “focus”, and “relaxation” are important indicators. When environmental factors fail to meet expectations or needs, disappointment manifests as a negative emotional reaction, thereby reducing overall emotional satisfaction and emotional well-being [41]. Concentration is a cognitive state that is highly sensitive to environmental factors. The design and layout of environmental elements can significantly impact the ability to focus attention, with noisy and visually distracting environments notably diminishing attention and learning capacity [42]. The concept of happiness helps to evaluate the success of physical space in contributing to positive and healthy emotions [43]. Urban space design elements can significantly enhance relaxation by providing opportunities for rest and rejuvenation [18]. Therefore, on this basis, this study adopted six indicators extracted from the psychological scales of the above three dimensions: “depression”, “disappointment”, “concentration”, “relaxation”, “happiness”, and “relaxation”. These six indicators represent people’s perception of the urban environment, including both positive and negative aspects [44,45].
Existing research has confirmed the correlation between the campus environment and emotional perception, showing that learning spaces are strongly connected to psychological well-being [46]. Campus greenery [47,48], sky landscape [49,50,51], daylight and vision [52], and building facades [53] have positive or negative impacts on emotions, inducing various emotional experiences. The objective of emotional perception studies is to uncover students’ positive and negative attitudes towards specific environmental elements within the built environment. Analyzing emotional perception within environmental contexts has always been considered both challenging and important, with artificial intelligence playing a crucial role in enabling machines to understand, infer, and respond to human emotions within the built environment [54,55,56,57,58]. While existing literature on the connection between environment and emotional perception has laid a foundational basis [59,60,61], there remains a gap in understanding how specific elements of the campus environment influence students’ emotional perception. Traditional research, which often relies on broad environmental assessment indicators, fails to capture the nuanced ways in which particular campus environmental factors influence students’ emotional well-being. This lack of spatial specificity can lead to a general understanding of environmental impacts that is insufficient for informing targeted interventions in campus design. Therefore, this research focuses on how specific elements of the campus environment affect the emotional perception of college students. It explores methods to enhance students’ emotional perception and mental health from their personal perspectives, utilizing Attention Restoration Theory (ART) and Stress Recovery Theory (SRT). The findings aim to provide robust support for constructing a healthy campus environment that meets the psychological needs of students.
The elements of the campus environment used in the study were determined through a combination of architectural design principles and image analysis techniques. The following three main issues were focused on: firstly, the definition and categorization of campus environment elements by existing studies; secondly, the ease with which specific elements of the environment can be extracted and described; thirdly, the operability of existing image semantic segmentation techniques. In this study, the campus environment elements are encapsulated into six categories: campus greenery, sky views, building frontage, motorization, motility, and diversity. Campus environment elements are defined by terrain and greenery, sky, building, sidewalk and rider, road, and other diverse design elements, including traffic lights and cars, which cover most of the key urban design elements defined by Ewing and Handy (2009, p. 72) [62]. These six elements describe most variables related to the campus environment’s mood, as Zheng and Amemiya (2023) [63] describe how street greening positively affects landscape perception, and Gen and Pendola (2008) [64] highlight the relationship between building facades and perception. Elements such as transparency and image ability, which have a weak relative presence, are not accounted for in this study because they do not produce overly biased results.
Overall, current academic research on multi-source big data of street view images provides a solid foundation for this study [65,66,67], but fewer studies assess the relationship between the urban environment and mental health through street view image data, and the scope of existing studies is limited. This study aims to examine the impact of university campus space on students’ emotions from the perspective of the campus space environment, offering the possibility of building a mentally healthy campus based on students’ emotional perceptions. As mentioned previously, existing research on street view images and human emotional perception mainly focuses on assessing street spatial quality using street view images, with insufficient research on the relationship between the urban environment and mental health. Additionally, there is a gap in research discussing the relationship between the campus environment and students’ emotional perception in depth. This study aims to use campus environment images to assess students’ emotional perceptions of the campus environment and examine the impact of campus environment elements on students’ emotions. Specifically, it addresses the following two issues: 1. Constructing a framework for environmental emotional perception using YLMNUSTTC (Yuelu Mountain National University Science and Technology City) as an example, quantifying the impact of university campus space on students’ emotions, and providing a predictive mapping of students’ emotions across the entire YLMNUSTTC campus. 2. Using virtual simulation experiments to realistically experience the campus environment panoramic image, obtain a more realistic scene perception, and ensure the research process aligns with humanistic research concepts.
By combining deep learning technology with campus environment image data, this research develops a more human-centered approach to assessing environmental emotions. This method more accurately captures architectural spatial perception, identifies campus emotional hotspots, and facilitates personalized design interventions. Focusing on Chinese college students, this study fills a significant gap in the research on the relationship between campus environments and students’ emotional perceptions in China. It offers a new perspective on the intersection of environment and emotion and holds practical significance for improving the urban environment to support mental health.

2. Materials and Methods

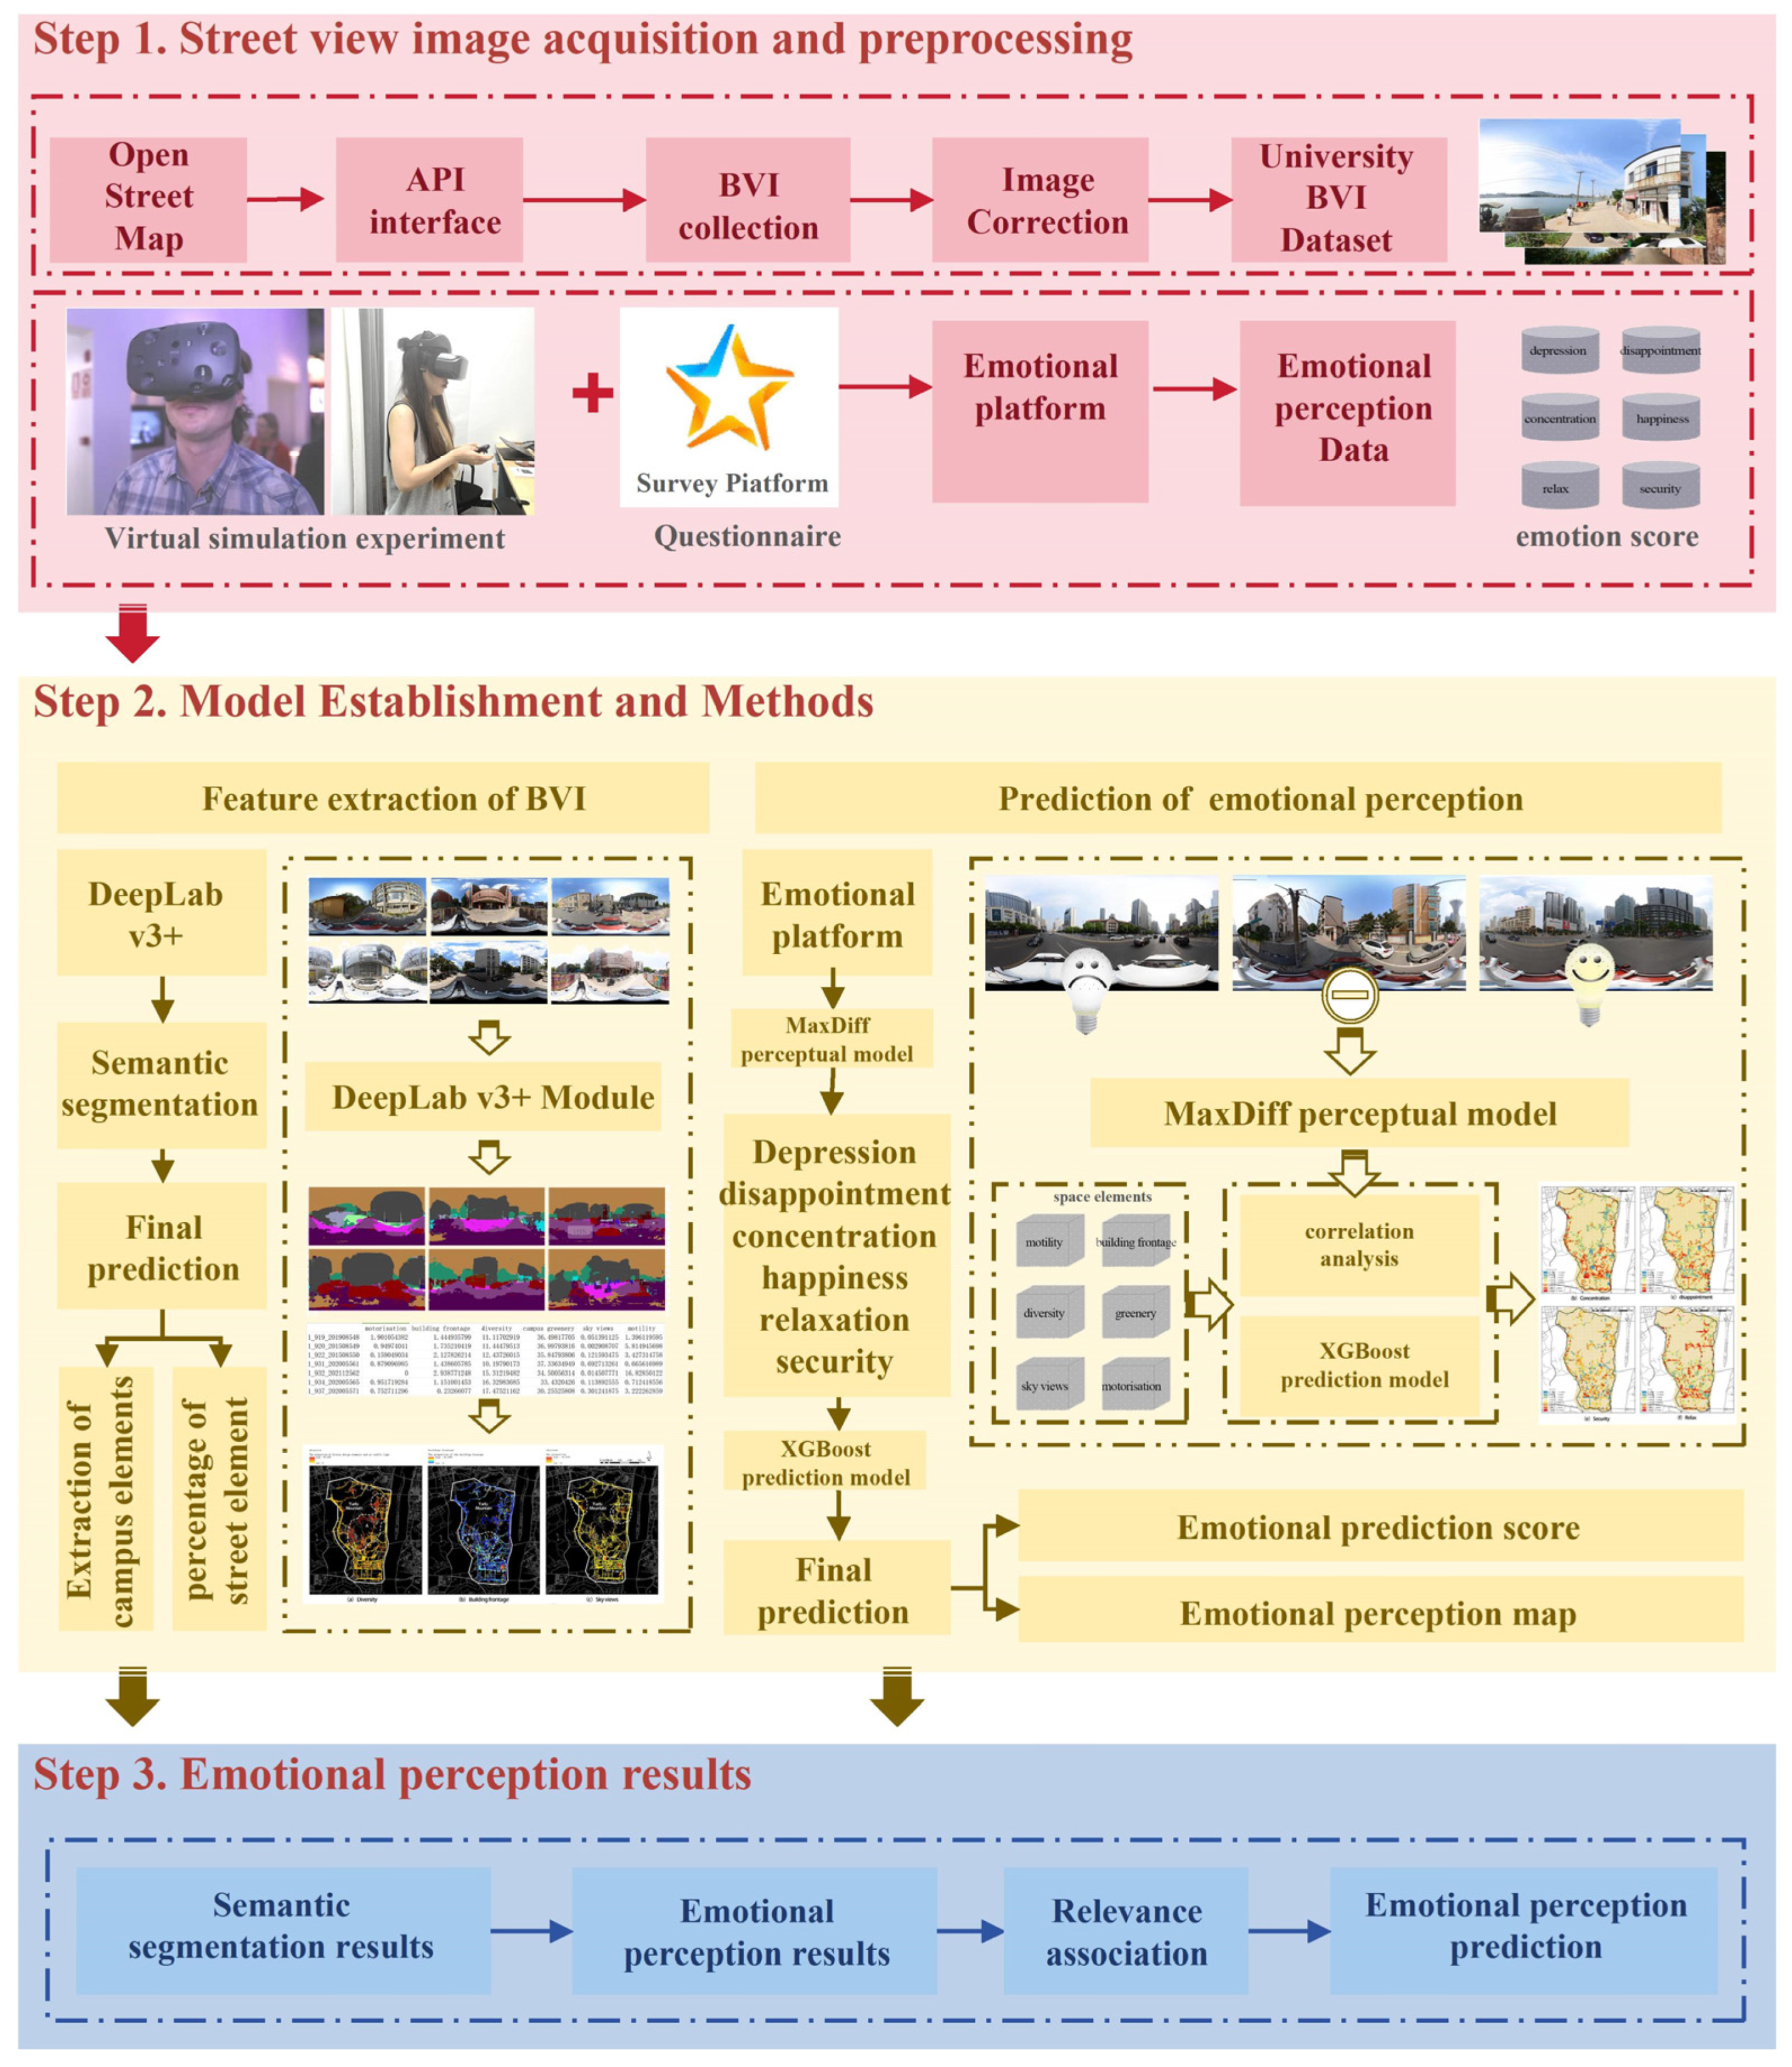
2.1. Research Framework

In this paper, we constructed a university campus environment emotional perception framework (Figure 1) to investigate the relationship between the campus environment and college students’ emotional perception. This framework comprises the following three main parts: (1) Campus environment image acquisition and preprocessing, including campus environment images and emotional perception data. Campus environment image database: We used Open Street Map (OSM) to acquire road network data and called the API port of the free and open Baidu map platform (https://map.baidu.com) (accessed on 20 February 2023) to achieve batch acquisition of campus environment images. We performed color calibration and distortion correction to constitute the campus environment image database of YLMNUSTTC. Emotional perception data: We collected emotional indicator data of specific campus environment elements through virtual simulation experiments and the Questionnaire Star online platform. (2) The research methodology, comprising campus environment elements extraction and the emotional perception prediction model. Campus environment image element extraction: We performed semantic segmentation and element extraction based on the DeepLab v3+ model. Emotional perception prediction model: We analyzed the correlation between campus environment and emotional perception, constructed a MaxDiff emotional perception quantitative index, and carried out emotional perception prediction of the campus environment using the XGBoost model. (3) Results presentation, including semantic segmentation results, emotional perception results, relevance association results, and emotional perception prediction results.

2.2. Research Data

2.2.1. Study Area

Changsha, located in Hunan Province, China, between longitudes 111.54°–114.15° East and latitudes 27.51°–28.40° North, consists of six main districts: Furong, Tianxin, Yuelu, Kaifu, Yuhua, and Wangcheng (Figure 2). Changsha City has 57 higher education institutions, positioning it as the leader in science and technology education in Hunan Province. Among these, YLMNUSTTC hosts more than 20 colleges and universities, including Central South University, Hunan University, and Hunan Normal University. It also houses 57 key laboratories at both the national and provincial levels, over 40 academicians, more than 300,000 university students, and over 100,000 innovation and entrepreneurship teams and researchers, with a core area encompassing approximately 24.65 square kilometers. This area is not only a major base for higher education in Changsha, but also a significant education hub with considerable influence across China. The Third Plenary Session of the 20th Central Committee of the Communist Party of China (CPC) emphasized that “education, science and technology, and human resources constitute the foundational and strategic support for Chinese modernization”, underscoring the importance of the university environment for contemporary university students. This study selects YLMNUSTTC as a representative study area to comprehensively understand the role and value of the university campus environment in promoting students’ mental health. The sample selection incorporates a variety of campus forms, including open and closed campuses, to reflect the problems and characteristics associated with different campus configurations.

2.2.2. Research Data

(1) Campus image data
In this study, sampling points of the road network were obtained using Open Street Map (OSM). The Baidu Map API was then utilized to acquire images of the YLMNUSTTC campus environment, followed by data preprocessing, including color calibration and distortion adjustment. DeepLab v3+ was employed for semantic segmentation and element extraction of the campus environment images. There are three main steps:
Firstly, images of the campus environment in YLMNUSTTC, which includes six colleges and universities (Hunan University, Hunan Normal University, Central South University, Shuda College of Hunan Normal University, Hunan Administrative College, and Hunan College of Art and Vocational College) were crawled using Python. Based on OSM data, 13,344 sampling points were established, and the map vector data were imported to filter the road network data for Changsha YLMNUSTTC, covering 11 roads in total. Sampling point was generated at 20-m intervals, and the road network was processed to increase the density hierarchically based on node importance, with 10-m intervals for important nodes and 15-m intervals for secondary nodes.
Secondly, the WGS-84 coordinate system of the sampling points was converted to the Baidu coordinate system, and the Baidu Map API was used to obtain the campus environment (https://map.baidu.com). The images were saved in JPG format in a local folder. To maximize resolution, 32 images of 512 × 512 pixels were generated for each sampling point, resulting in a total of 1,105,856 images. High-definition panoramic images were formed by stitching together 34,558 individual images (Figure 3). To ensure the accuracy of spatial sentiment measurement and the comprehensiveness of information acquisition, campus environment images from June 2014 to June 2022 were collected. Strict screening was performed after acquiring the large-scale campus environment images, and the most current and representative images corresponding to each point were selected to make the results more accurate and valuable.
Finally, the campus environment images were subjected to data preprocessing and element extraction, including color calibration and distortion adjustment. White balance and brightness adjustments were applied using OpenCV, geometric adjustments were made using Adobe Lightroom to eliminate lens aberrations, and image enhancement was performed to improve resolution. These steps primarily aimed to eliminate color differences, reduce aberrations, and ensure accurate image segmentation of the campus environment images. Additionally, semantic segmentation and element extraction of the campus images were conducted using DeepLab v3+.
(2) Campus Environment Emotional Platform
In this paper, an online platform “Campus Emotional Perception Questionnaire” was established in YLMNUSTTC, China, from September 2023 to January 2024, to obtain the ratings of university students’ emotional perception of the campus environment. Firstly, 563 panoramic images of the campus were manually screened for online and offline evaluation, which was conducted in the form of questionnaires online and virtual simulation experiments offline. The evaluation method used a comparative choice, each time three panoramic images were randomly selected for VR experience, and college students chose the scenes that best met the emotional indicators and the scenes that least met the emotional indicators, such as “Which of these three scenes makes you feel the most secure?” “Which of these three scenes makes you feel the most insecure?” (Figure 3). The final results were “depression”, “disappointment”, “concentration”, “happiness”, “relaxation”, and “security”.
Since, the individual’s own attribute factors will affect the perception of the environment, different people have personal opinions about different scenes, and the public review method is complicated, has a large workload and is unrepresentative; 139 college students with architectural and urban and rural planning education background who have lived in YLMNUSTTC for two years or more and relevant experts were selected to participate in this research: 30 experts in the field of architecture and planning, and 109 university students and postgraduate scholars with educational background. Of these, 78.42 per cent were in the 18–25 age group and 12.23 per cent in the 26–40 age group, and a total of 24,480 pairs of comparative data were collected. Depending on individuals’ familiarity with the environment, the same environment may receive different evaluations. The students and field experts selected for the survey are affiliated with Central South University, Hunan University, Hunan Normal University, and other institutions within Yuelu Mountain National University Science and Technology City.

2.3. Research Methodology
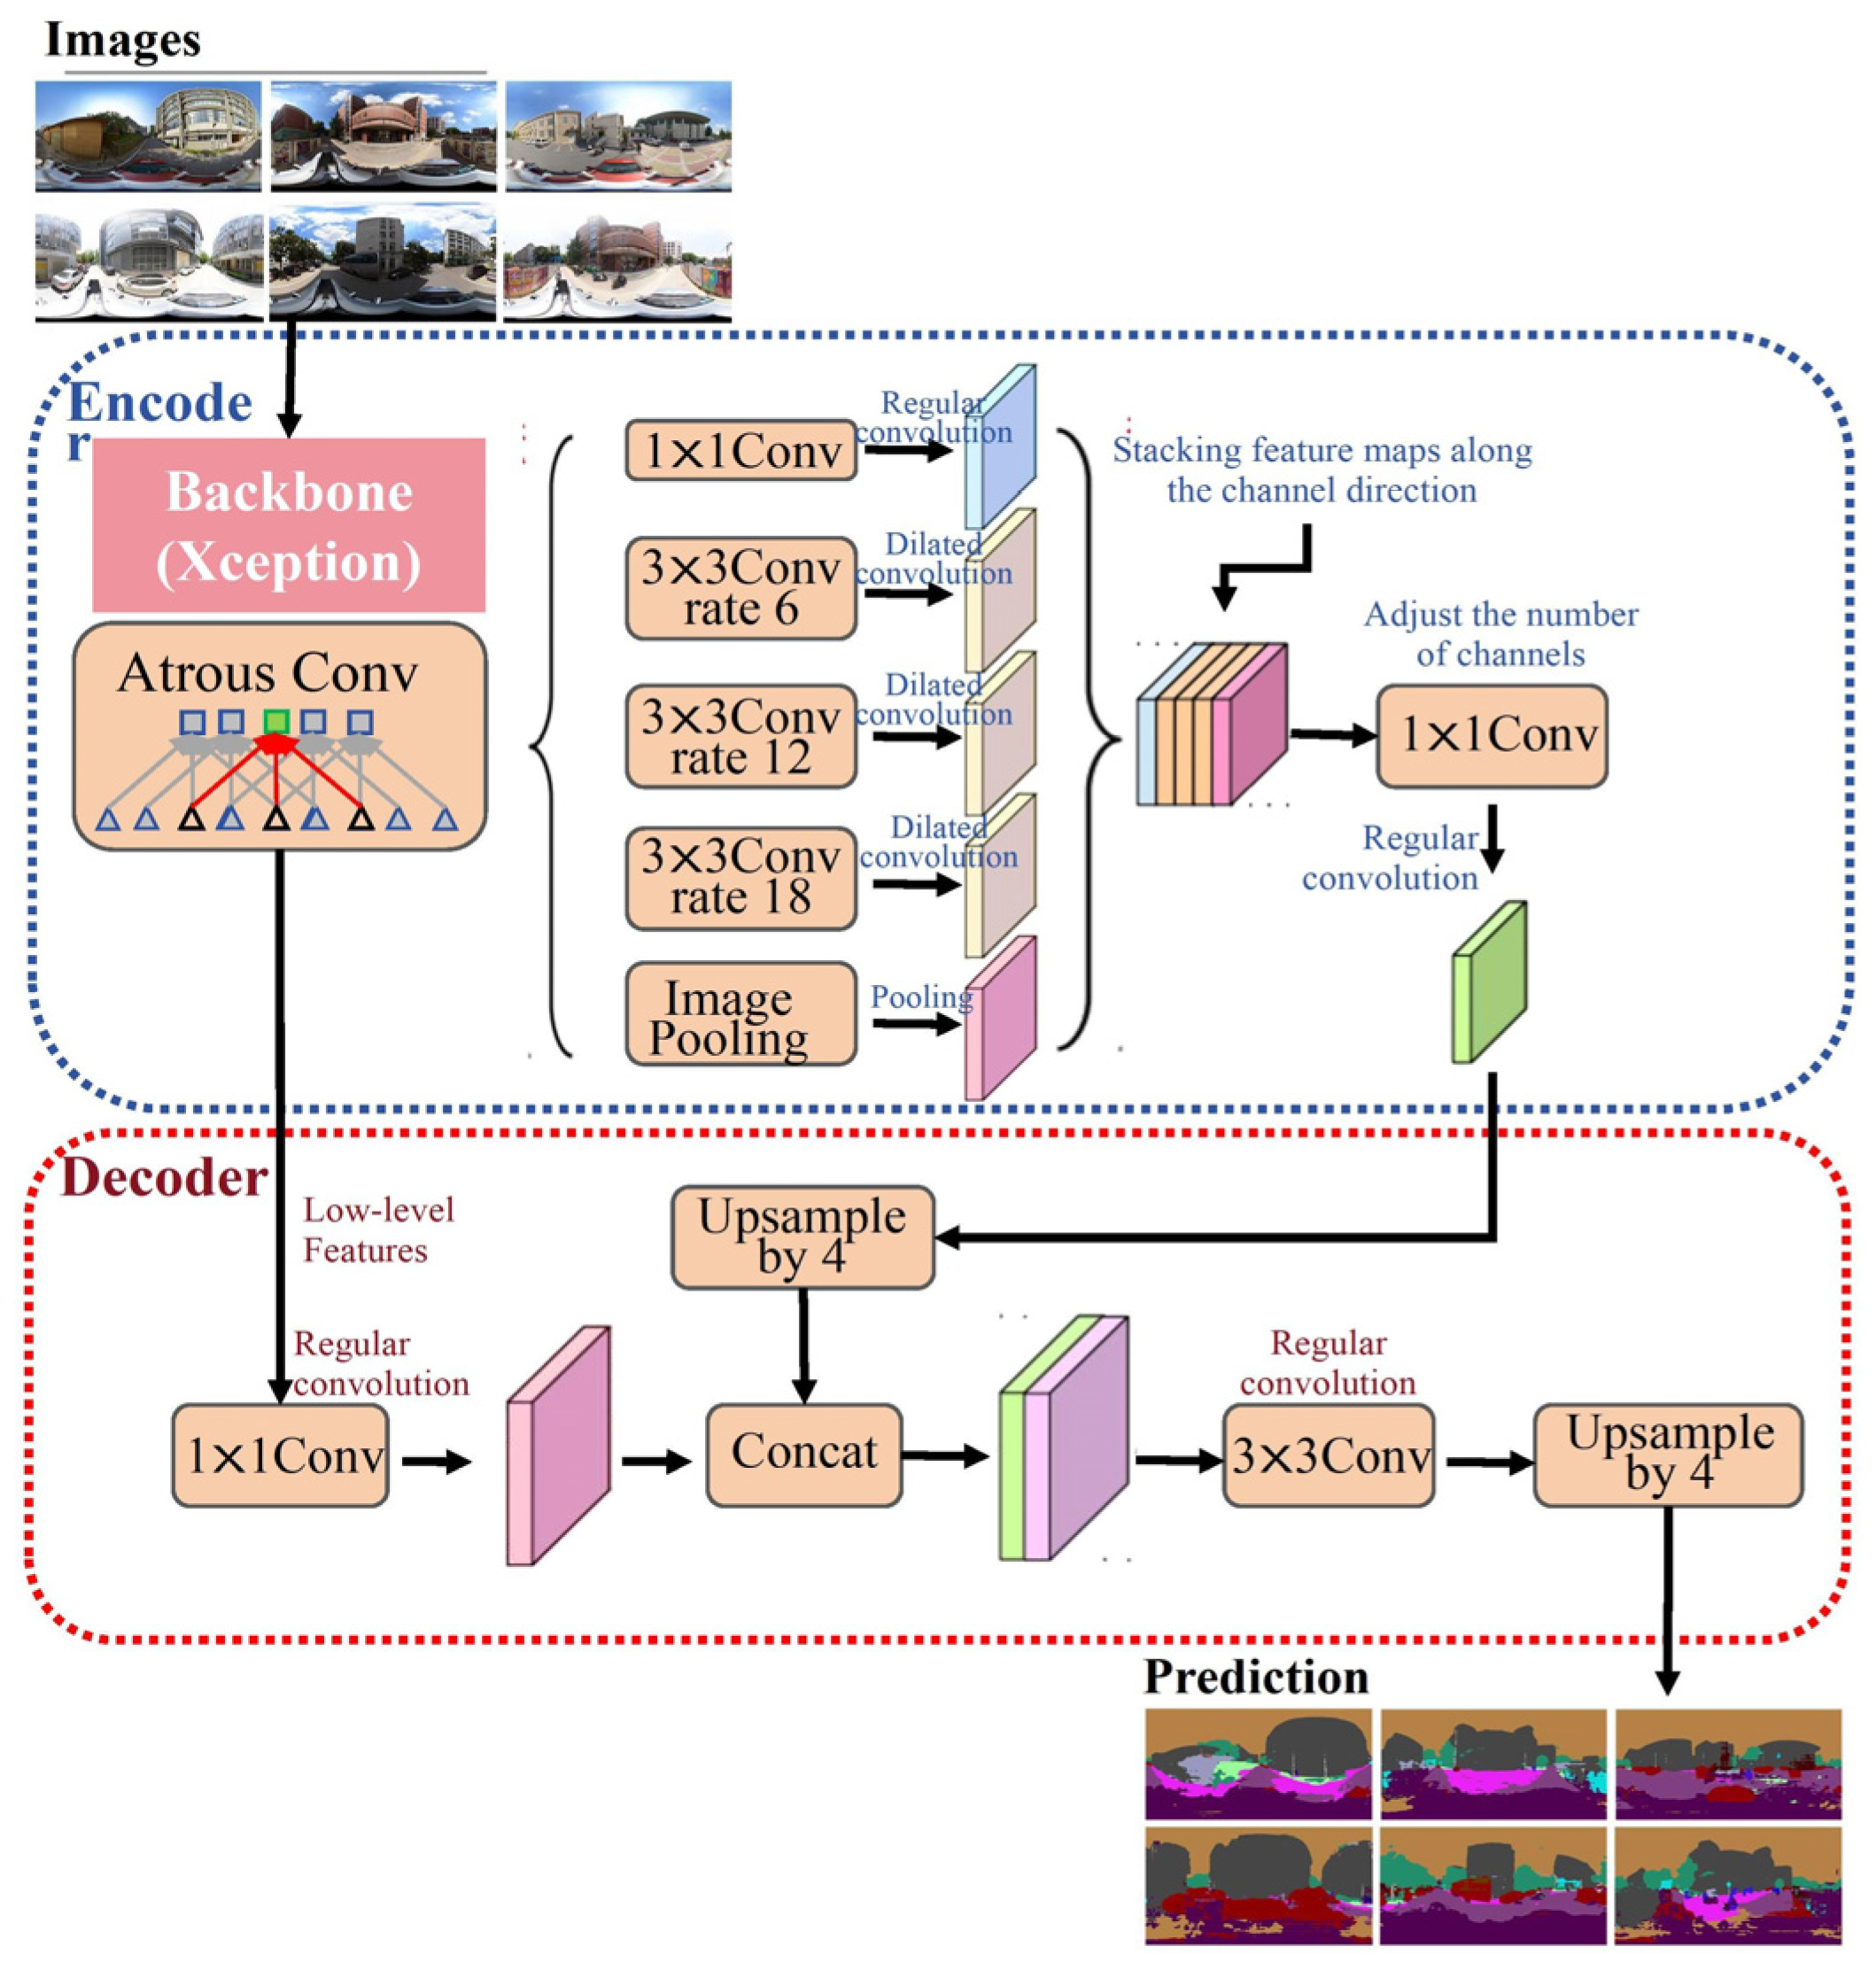
2.3.1. DeepLab v3+

DeepLab v3+ is one of the most advanced image segmentation models, which is based on the Deep Convolutional Neural Network (DCNN) architecture, and achieves efficient and accurate pixel-level classification of images through the Encoder-Decoder (ED) architecture, combined with the Avoidance Space Pyramid Pooling (ASPP) module (Figure 4) [68]. DeepLab v3+ has improved in terms of architecture, module improvements and features over previous versions, making it perform better on semantic segmentation tasks [69]. Compared with the FCN [70] and SegNet [71] models, DeepLab v3+ is distinguished by the introduction of dilated convolution and significant improvements in model architecture. Compared with its predecessor, the DeepLab v3, DeepLab v3+ further optimizes segmentation results by incorporating a simple and effective decoder module. Particularly for target boundary information, it ensures that each convolutional output contains a broader context of boundary information without losing essential details, while integrating multi-scale information to achieve higher accuracy.
The study used DeepLab v3+ model for semantic segmentation and element extraction of environmental images of university campuses in Yuelu District. DeepLab v3 uses Xception family as the backbone feature extraction network, providing two backbone networks, Xception and MobileNet v2 [68]. The Mean IoU (mIoU) = 72.31%, mPA (mean Pixel Accuracy) = 82.52%, mPrecision (mean Precision) = 84.28%, and mRecall (mean Recall) = 82.52% for the model.

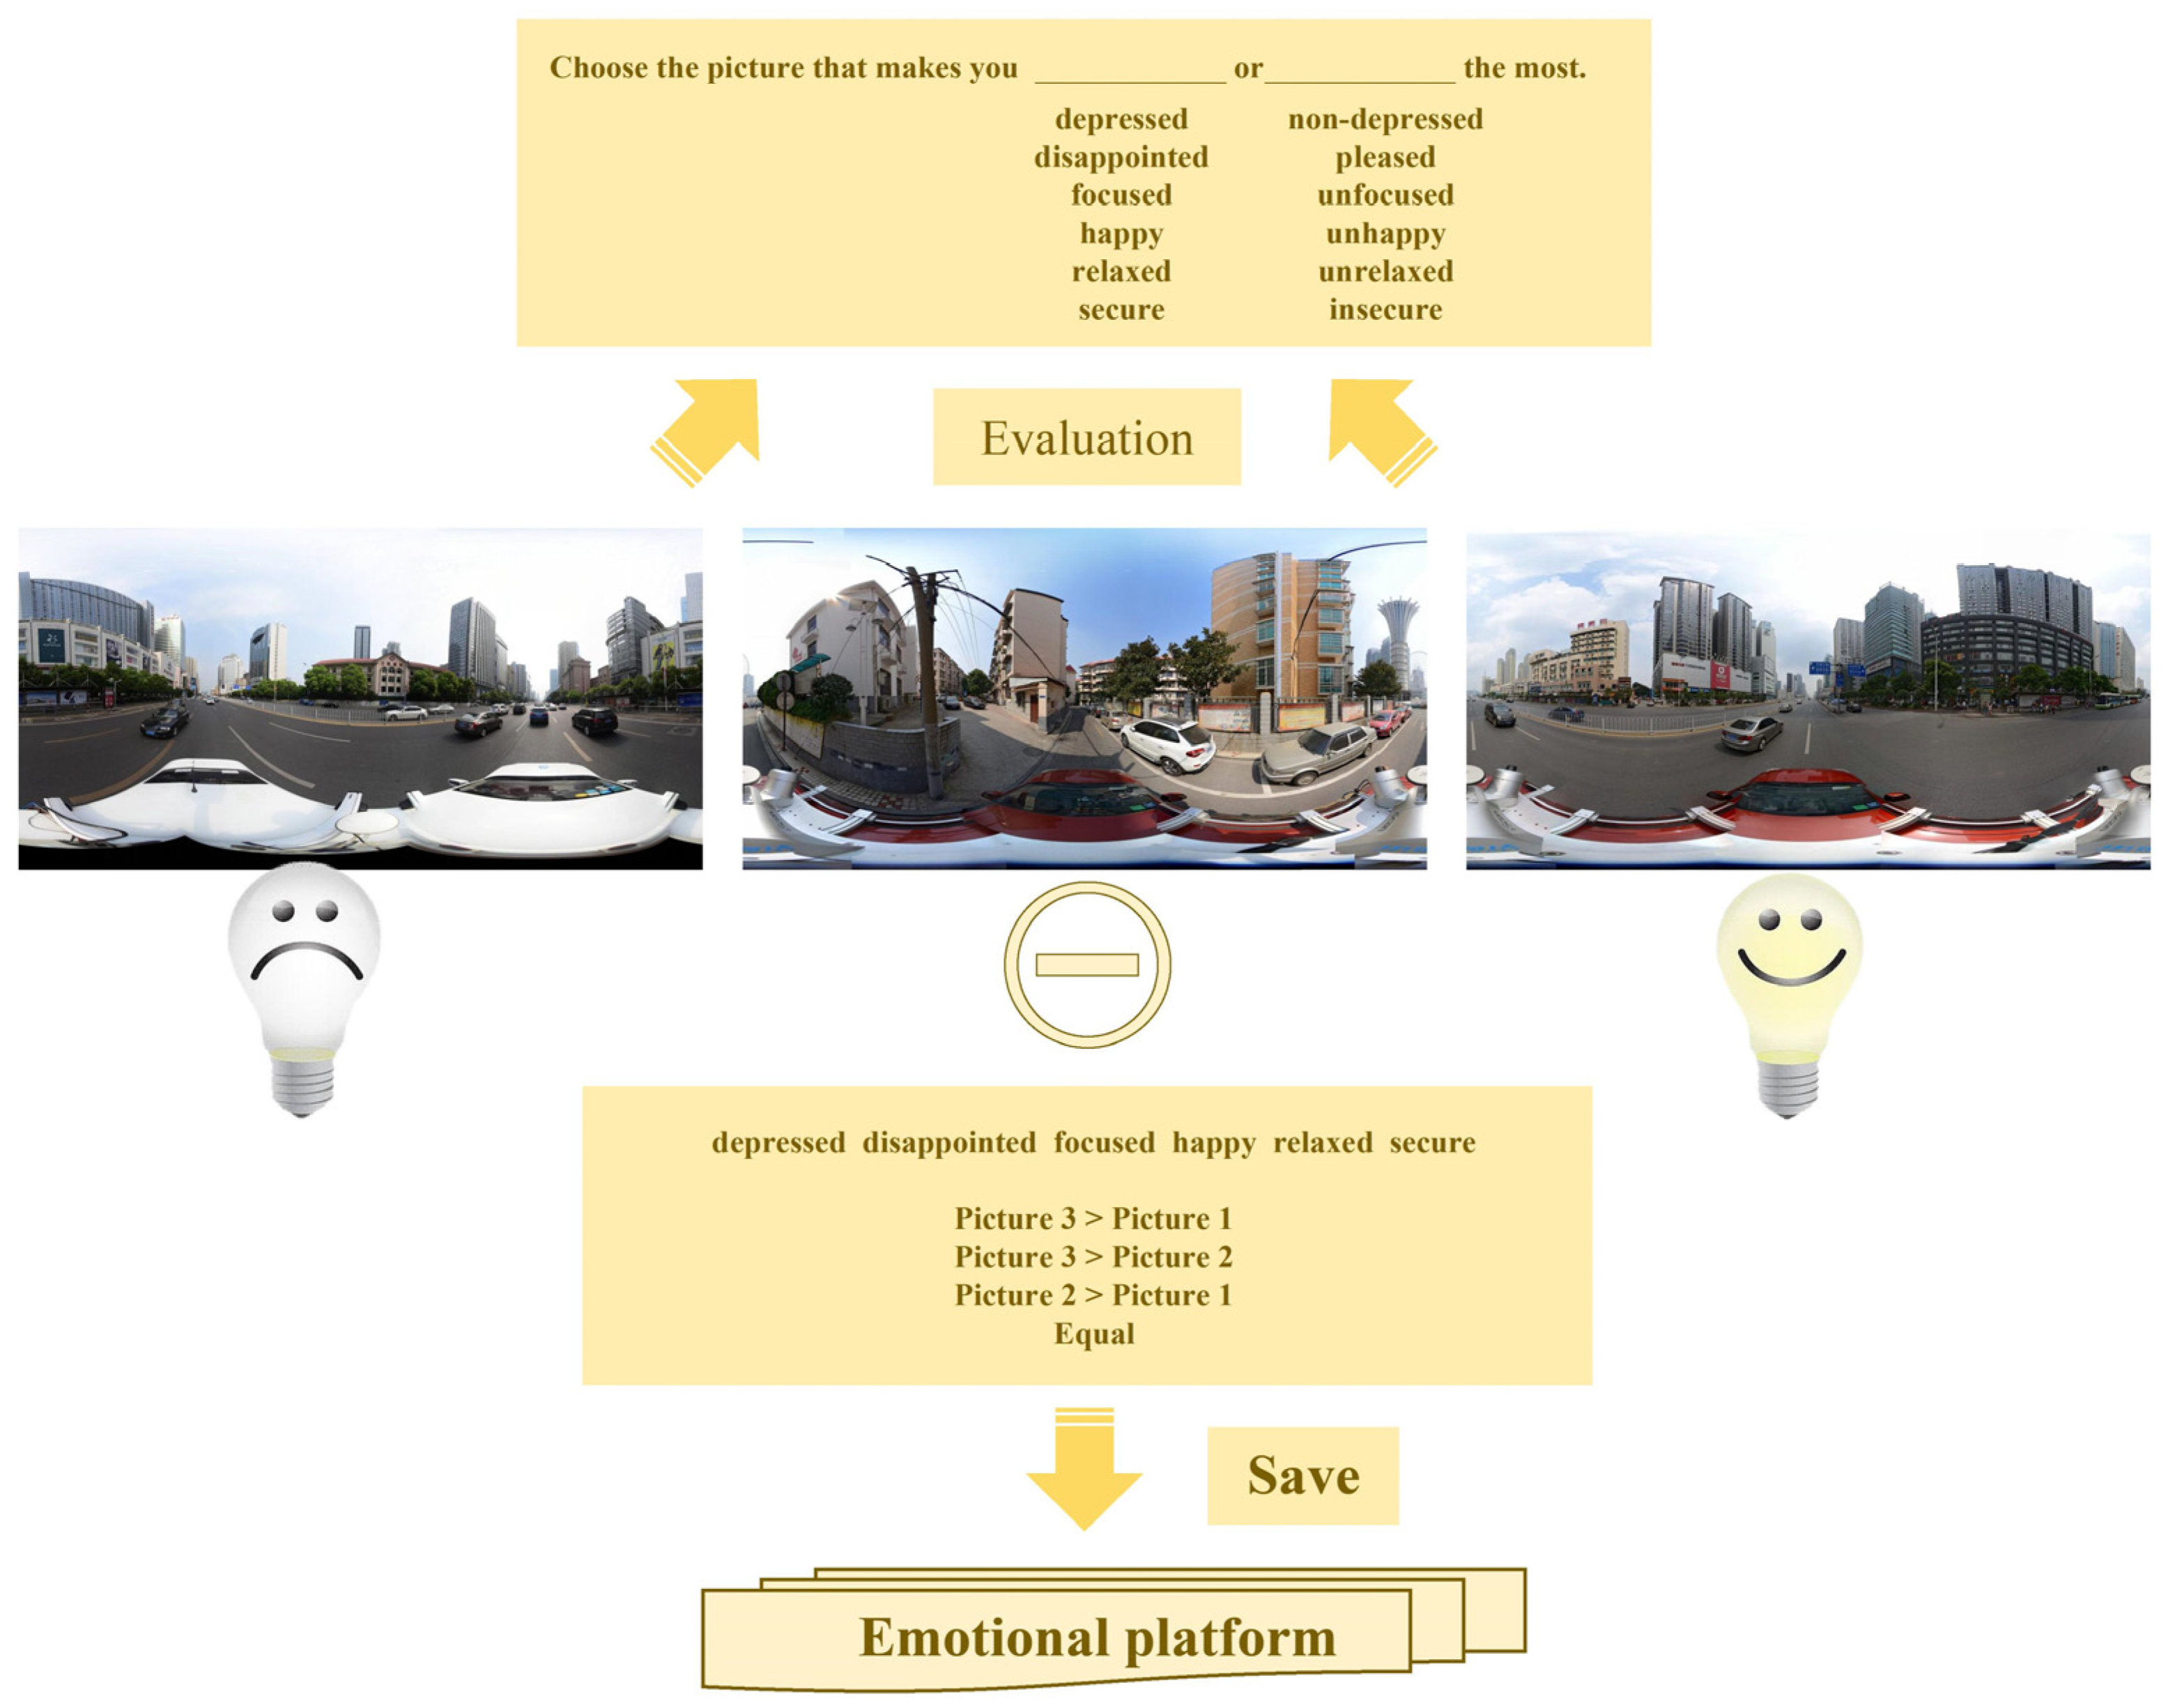
2.3.2. MaxDiff Perceptual Quantization and the XGBoost Prediction Model

The study collected comparison results through offline experimental data collection and online procedural surveys, and transformed the results of the maximum differentiation comparisons into scores through the MaxDiff model. MaxDiff greatly improves the efficiency of the pairwise comparison method and compensates for the disadvantage of too many comparisons caused by the pairwise comparison method. Scores correspond to the six sentiment indicators through the following MaxDiff formula:
H i = P i N i S i
Among them, P i , N i , and S i refer to the image with the most number of times, the least number of times, the attribute appearing in the image, the number of times the i d e p r e s s i o n , d i s a p p o i n t m e n t , c o n c e n t r a t i o n , h a p p i n e s s , r e l a x a t i o n , s e c u r i t y ;   H i 1,1 . Compared to men, women had a higher motivation to participate, and 65.47% of the target participants were women. This paper categorized the emotion levels of college students when they saw images of the campus environment, with scores ranging from −1 to 1. A score of 1 represents extremely high emotional perception, and a score of −1 represents extremely reverse emotional perception. Each volunteer scored the emotions of 180 campus environment images, and the scores were recorded by the emotional platform. Based on the final scores, the six emotion indicators were categorized into high emotion values H h and low emotion values H l with two categories: H m 0.2 , 0.2 . The values in this region will be ignored because the values in region P i are approximately the same as in region N i , representing great instability and ambivalence.
The XGBoost model will be used to predict spatial emotional perception maps. Through the comparison of several prediction models, the XGBoost model demonstrated superior performance and high accuracy on six emotional state indicators (Table 1). It is a synthetic algorithm that combines basis functions and weights to form a good fit to the data. The core idea is to correct the prediction error of all previous trees by iteratively adding new decision trees. Each of the six sentiment scores is used as the dependent variable, while the spatial element segmentation results are used as the independent variables. Seventy percent of the data are used for training and thirty percent for testing and cross-validation. Particle swarm algorithm optimization was performed on XGBoost parameters such as learning rate, number of estimators, maximum depth, minimum sub-node weights, and Gamma to find the best parameter values for training and model prediction. The average accuracy of the XGBoost model prediction (Table 2) demonstrates its stability.

2.3.3. Spatial Autocorrelation Analysis of Emotional Perception

In this study, Global Moran’s I and Anselin Local Moran’s I were used to calculate the autocorrelation of students’ emotional perceptions in the university campus environment in Yuelu District. The significance of this index was assessed by calculating Global Moran’s I, Z-score and p-value [72], as shown in the following equations:
I = n S 0 = i = 1 n j = 1 n W i , j Z i Z j i = 1 n Z i 2
S 0 = i = 1 n j = 1 n W i , j
The Zi score for statistics is calculated in the following form:
Z i = I E [ I ] V [ I ]
Among them, I is Global Moran’s I and Z i is the element of the attribute with its mean value X i X ¯ deviation of the element’s attributes from its mean value; W i , j is the deviation of the elements and the spatial weight between them, which is equal to the total number of elements; S 0 is the aggregation of all spatial weights between E [ I ] and V I , which denotes the expectation and variance of Global Moran’s I, respectively.
If Global Moran’s I > 0 (p < 0.05), it indicates a positive spatial correlation, i.e., emotional perceptions are significantly clustered spatially; if I is equal to or close to 0, it indicates that there is no spatial autocorrelation in the neighboring regions, and the relationship between the specific Z scores, p-values, and significance is as follows (Table 3). The analysis was conducted using two main software programs: ArcGIS 10.8 and GeoDA 1.22.

3. Results

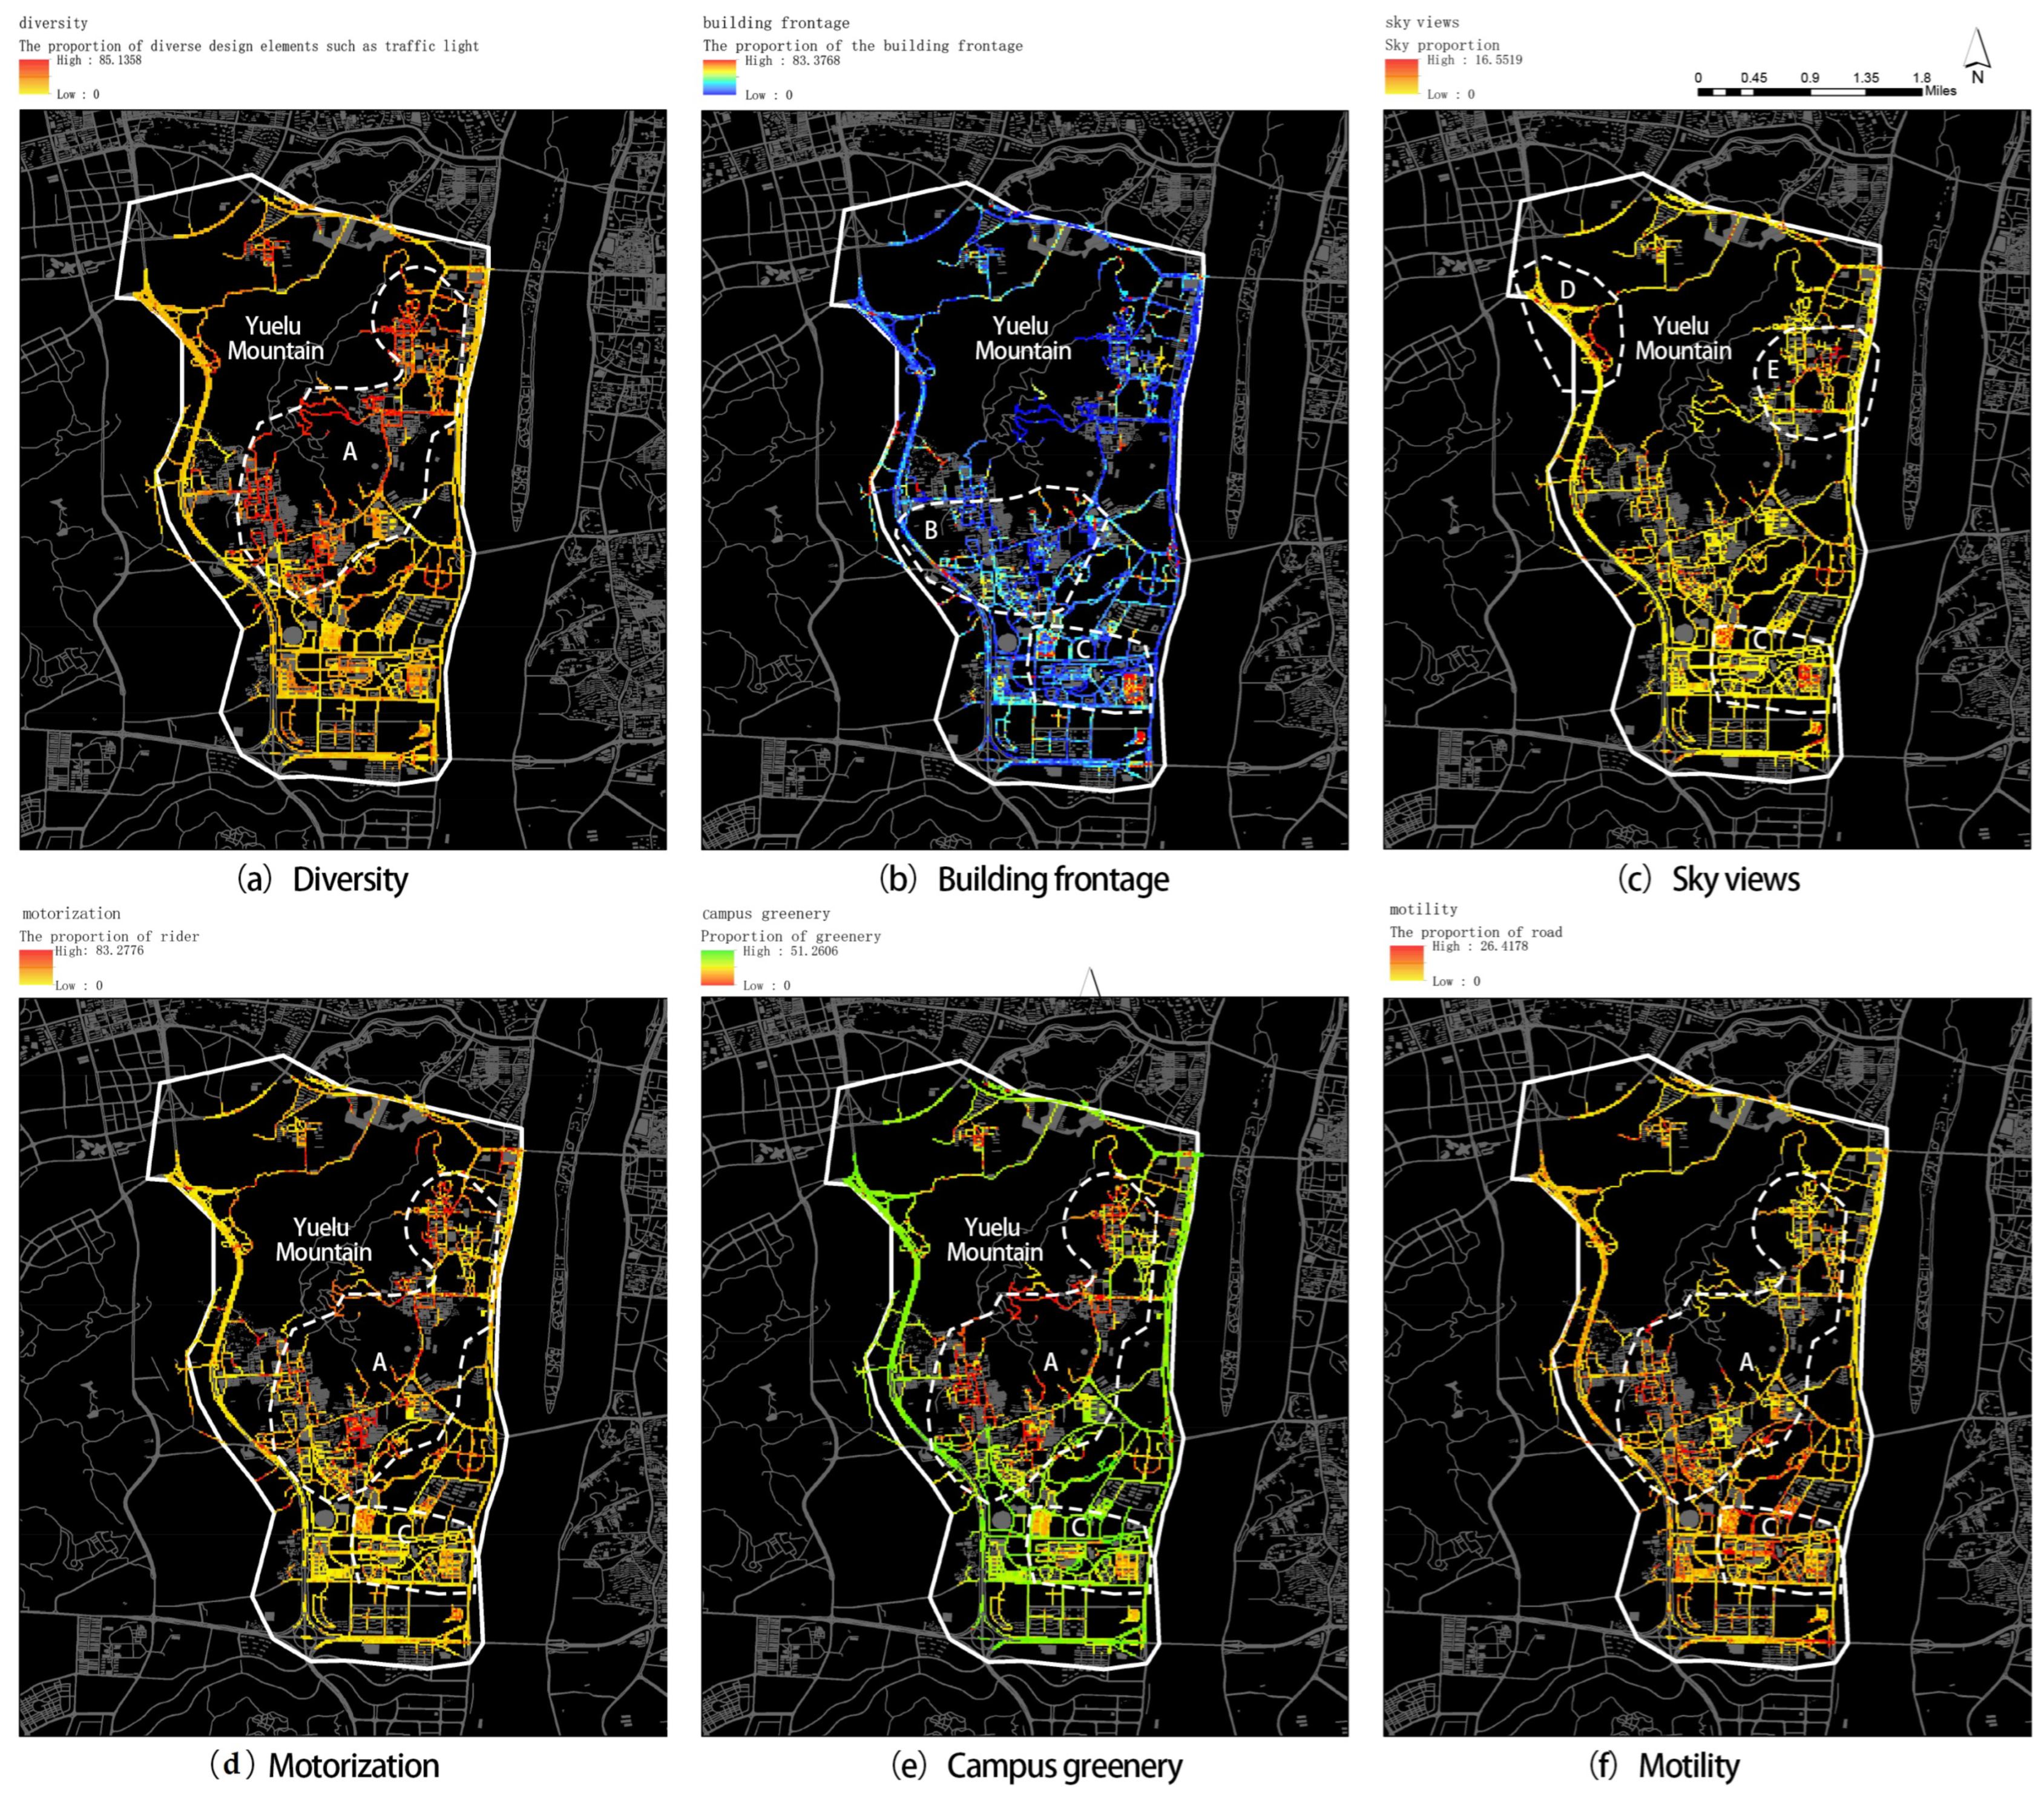
3.1. Campus Environment Image Semantic Segmentation Results

The spatial element segmentation in YLMNUSTTC reveals both distinct patterns and unique characteristics (Figure 5). Zone A demonstrates rich diversity (Figure 5a) due to its location at the base of Yuelu Mountain and the presence of cultural landmarks like Yuelu Mountain and Aiwan Pavilion, which contribute to its high-quality design elements. Serving as the primary educational area for Hunan University, Central South University, and Hunan Normal University, Zone A shows a medium-high proportion of pedestrian space (Figure 5d) but features low-quality campus greenery (Figure 5e). Within Zone A, the southern CSU campus demonstrates higher motility (Figure 5f), whereas the northern Hunan Normal University area and the central Hunan University area exhibit lower motility. This variation is attributable to campus types; Hunan University and Hunan Normal University, as open universities, engage in activities that extend into surrounding areas, thereby reducing and dispersing motility. In contrast, Central South University, Hunan Arts Vocational College, and Shuda College of Hunan Normal University are closed campuses with concentrated and gathered crowds, resulting in higher motility.
Zone B, which includes a closed university campus and an adjacent commercial plaza, shows low to medium building facade visibility (Figure 5b). The commercial plaza, due to its functional design and open environment, exhibits higher building facade visibility. The closed university area, constrained by its functional requirements and greenery, shows lower sky views visibility (Figure 5c). Due to the high building density in Zone C, which supports the university and provides reserve housing resources, it exhibits low-quality motorization, medium-high quality campus greenery, and medium-high motility. From the perspective of sky views, Zones D and E, characterized by higher topography and more open surfaces near the university campus, exhibit high-quality sky views and campus greenery.

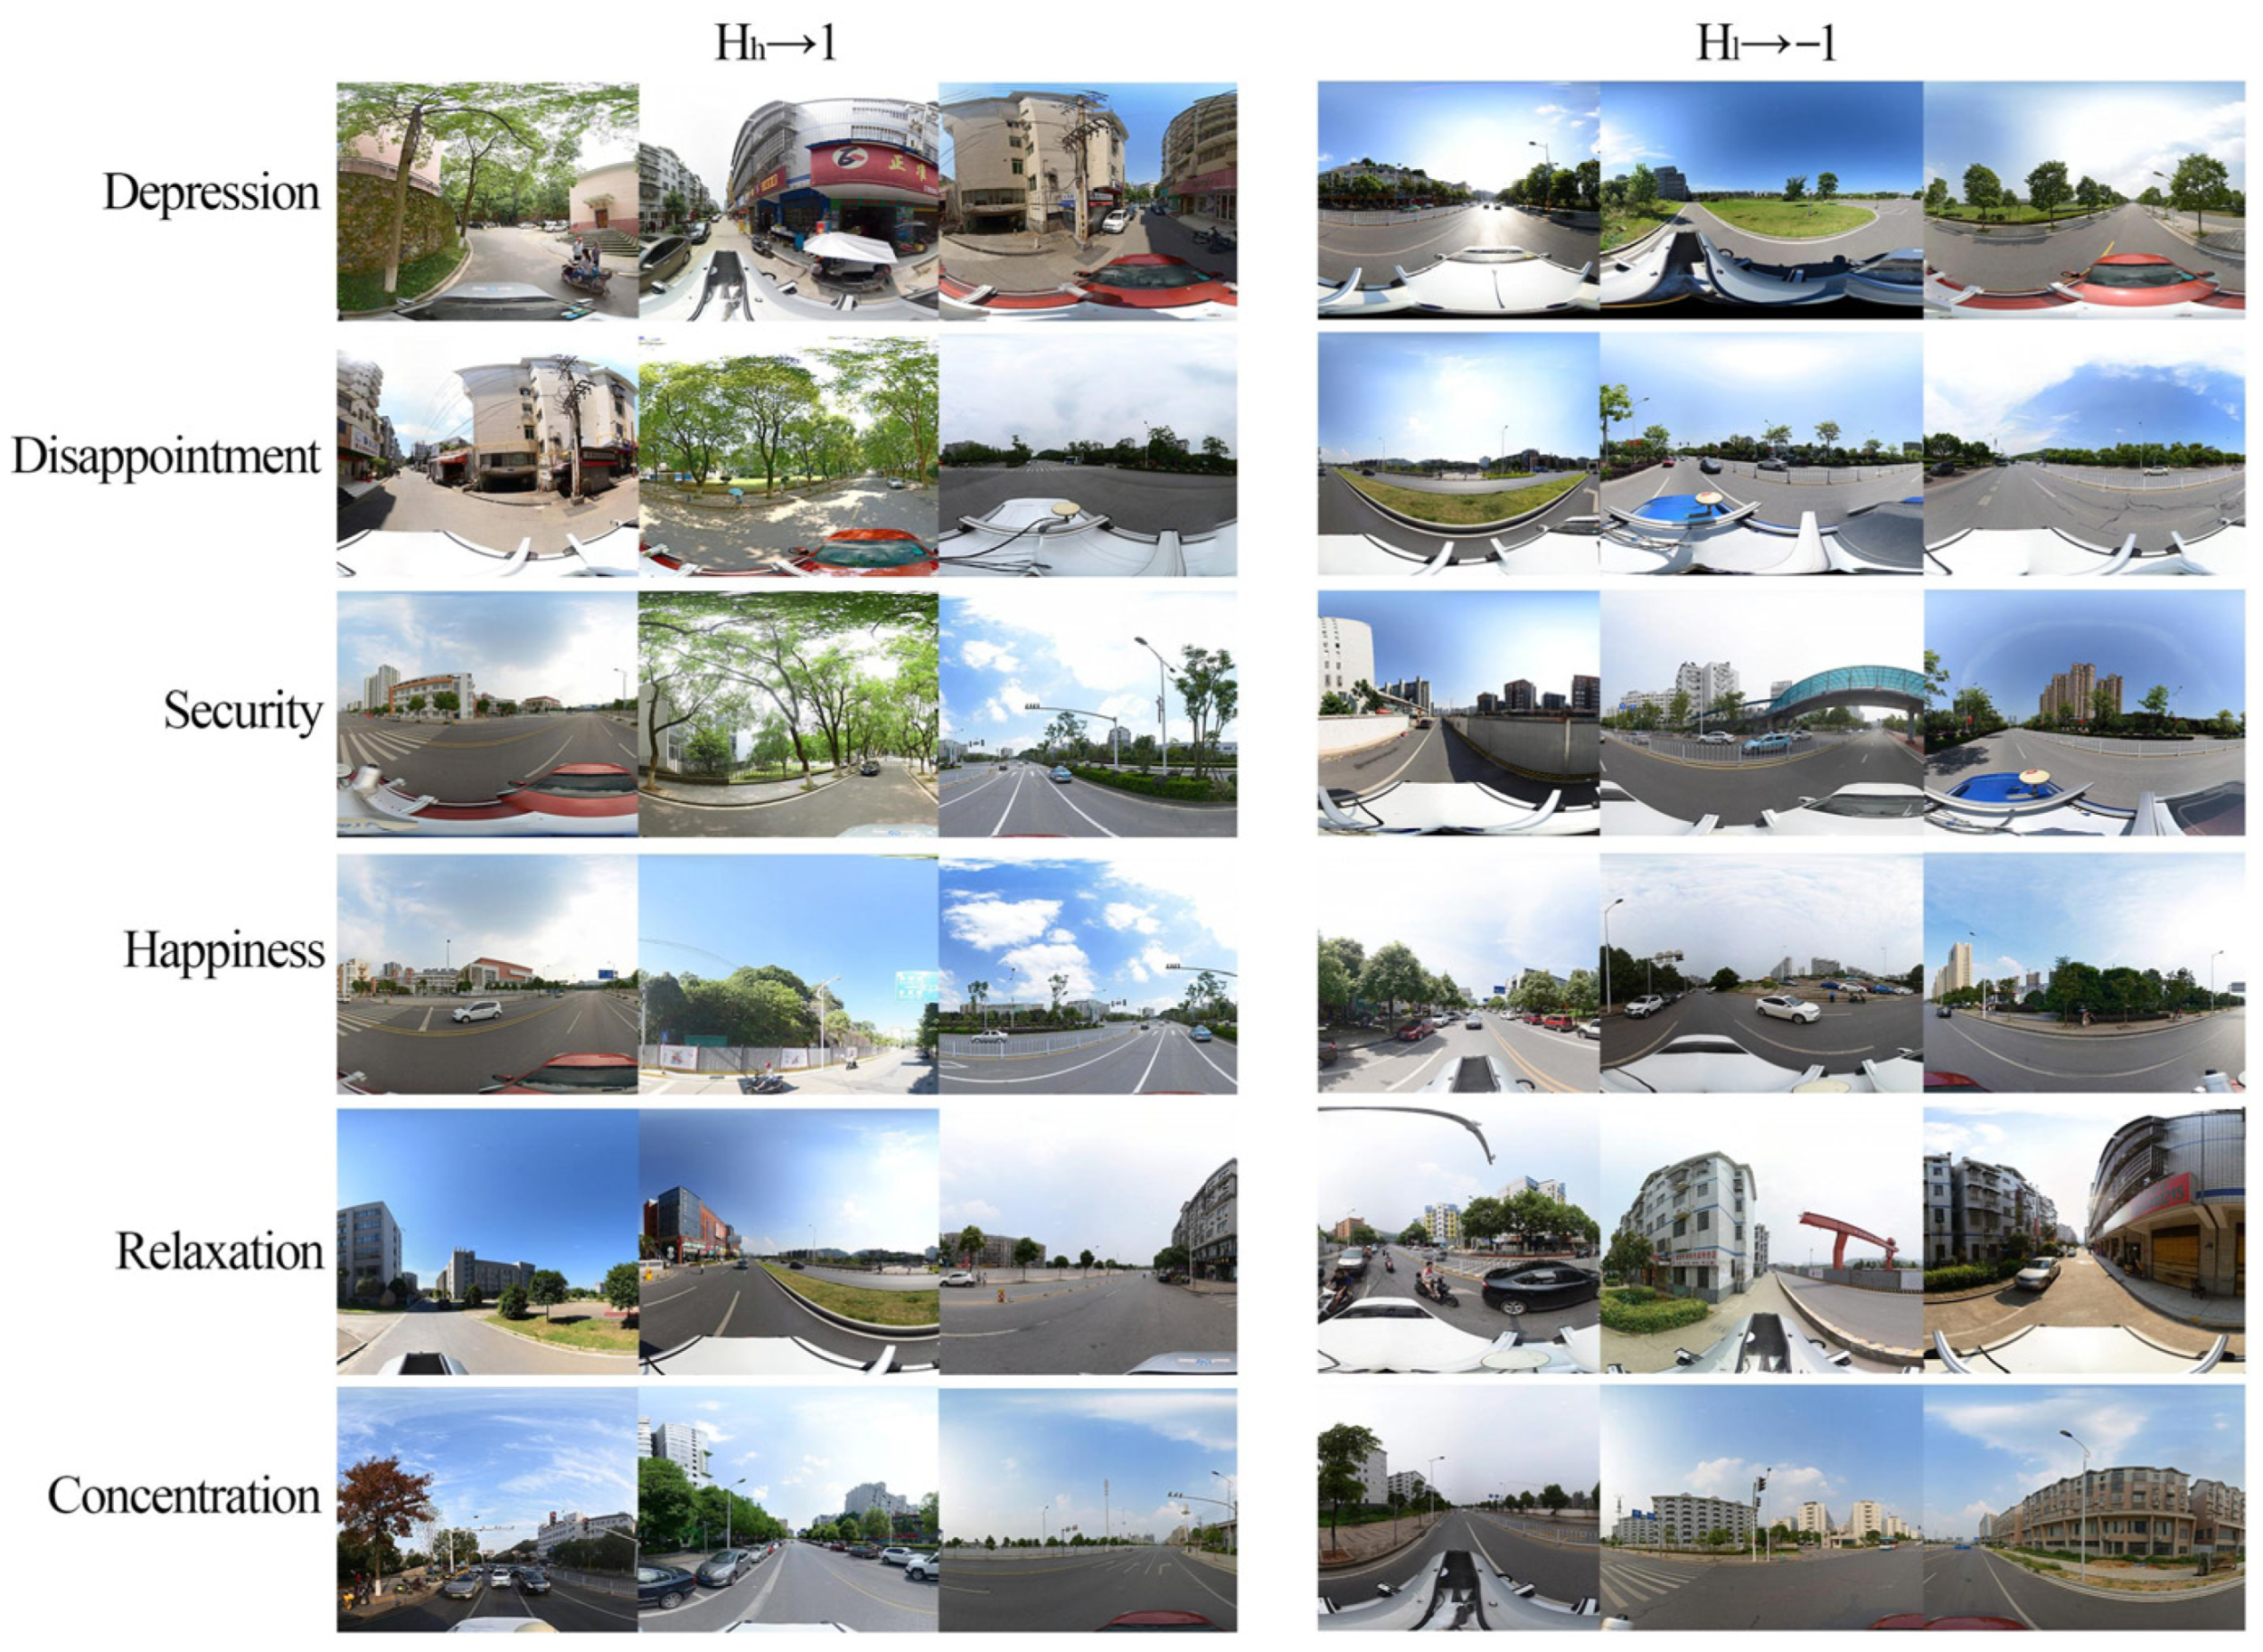
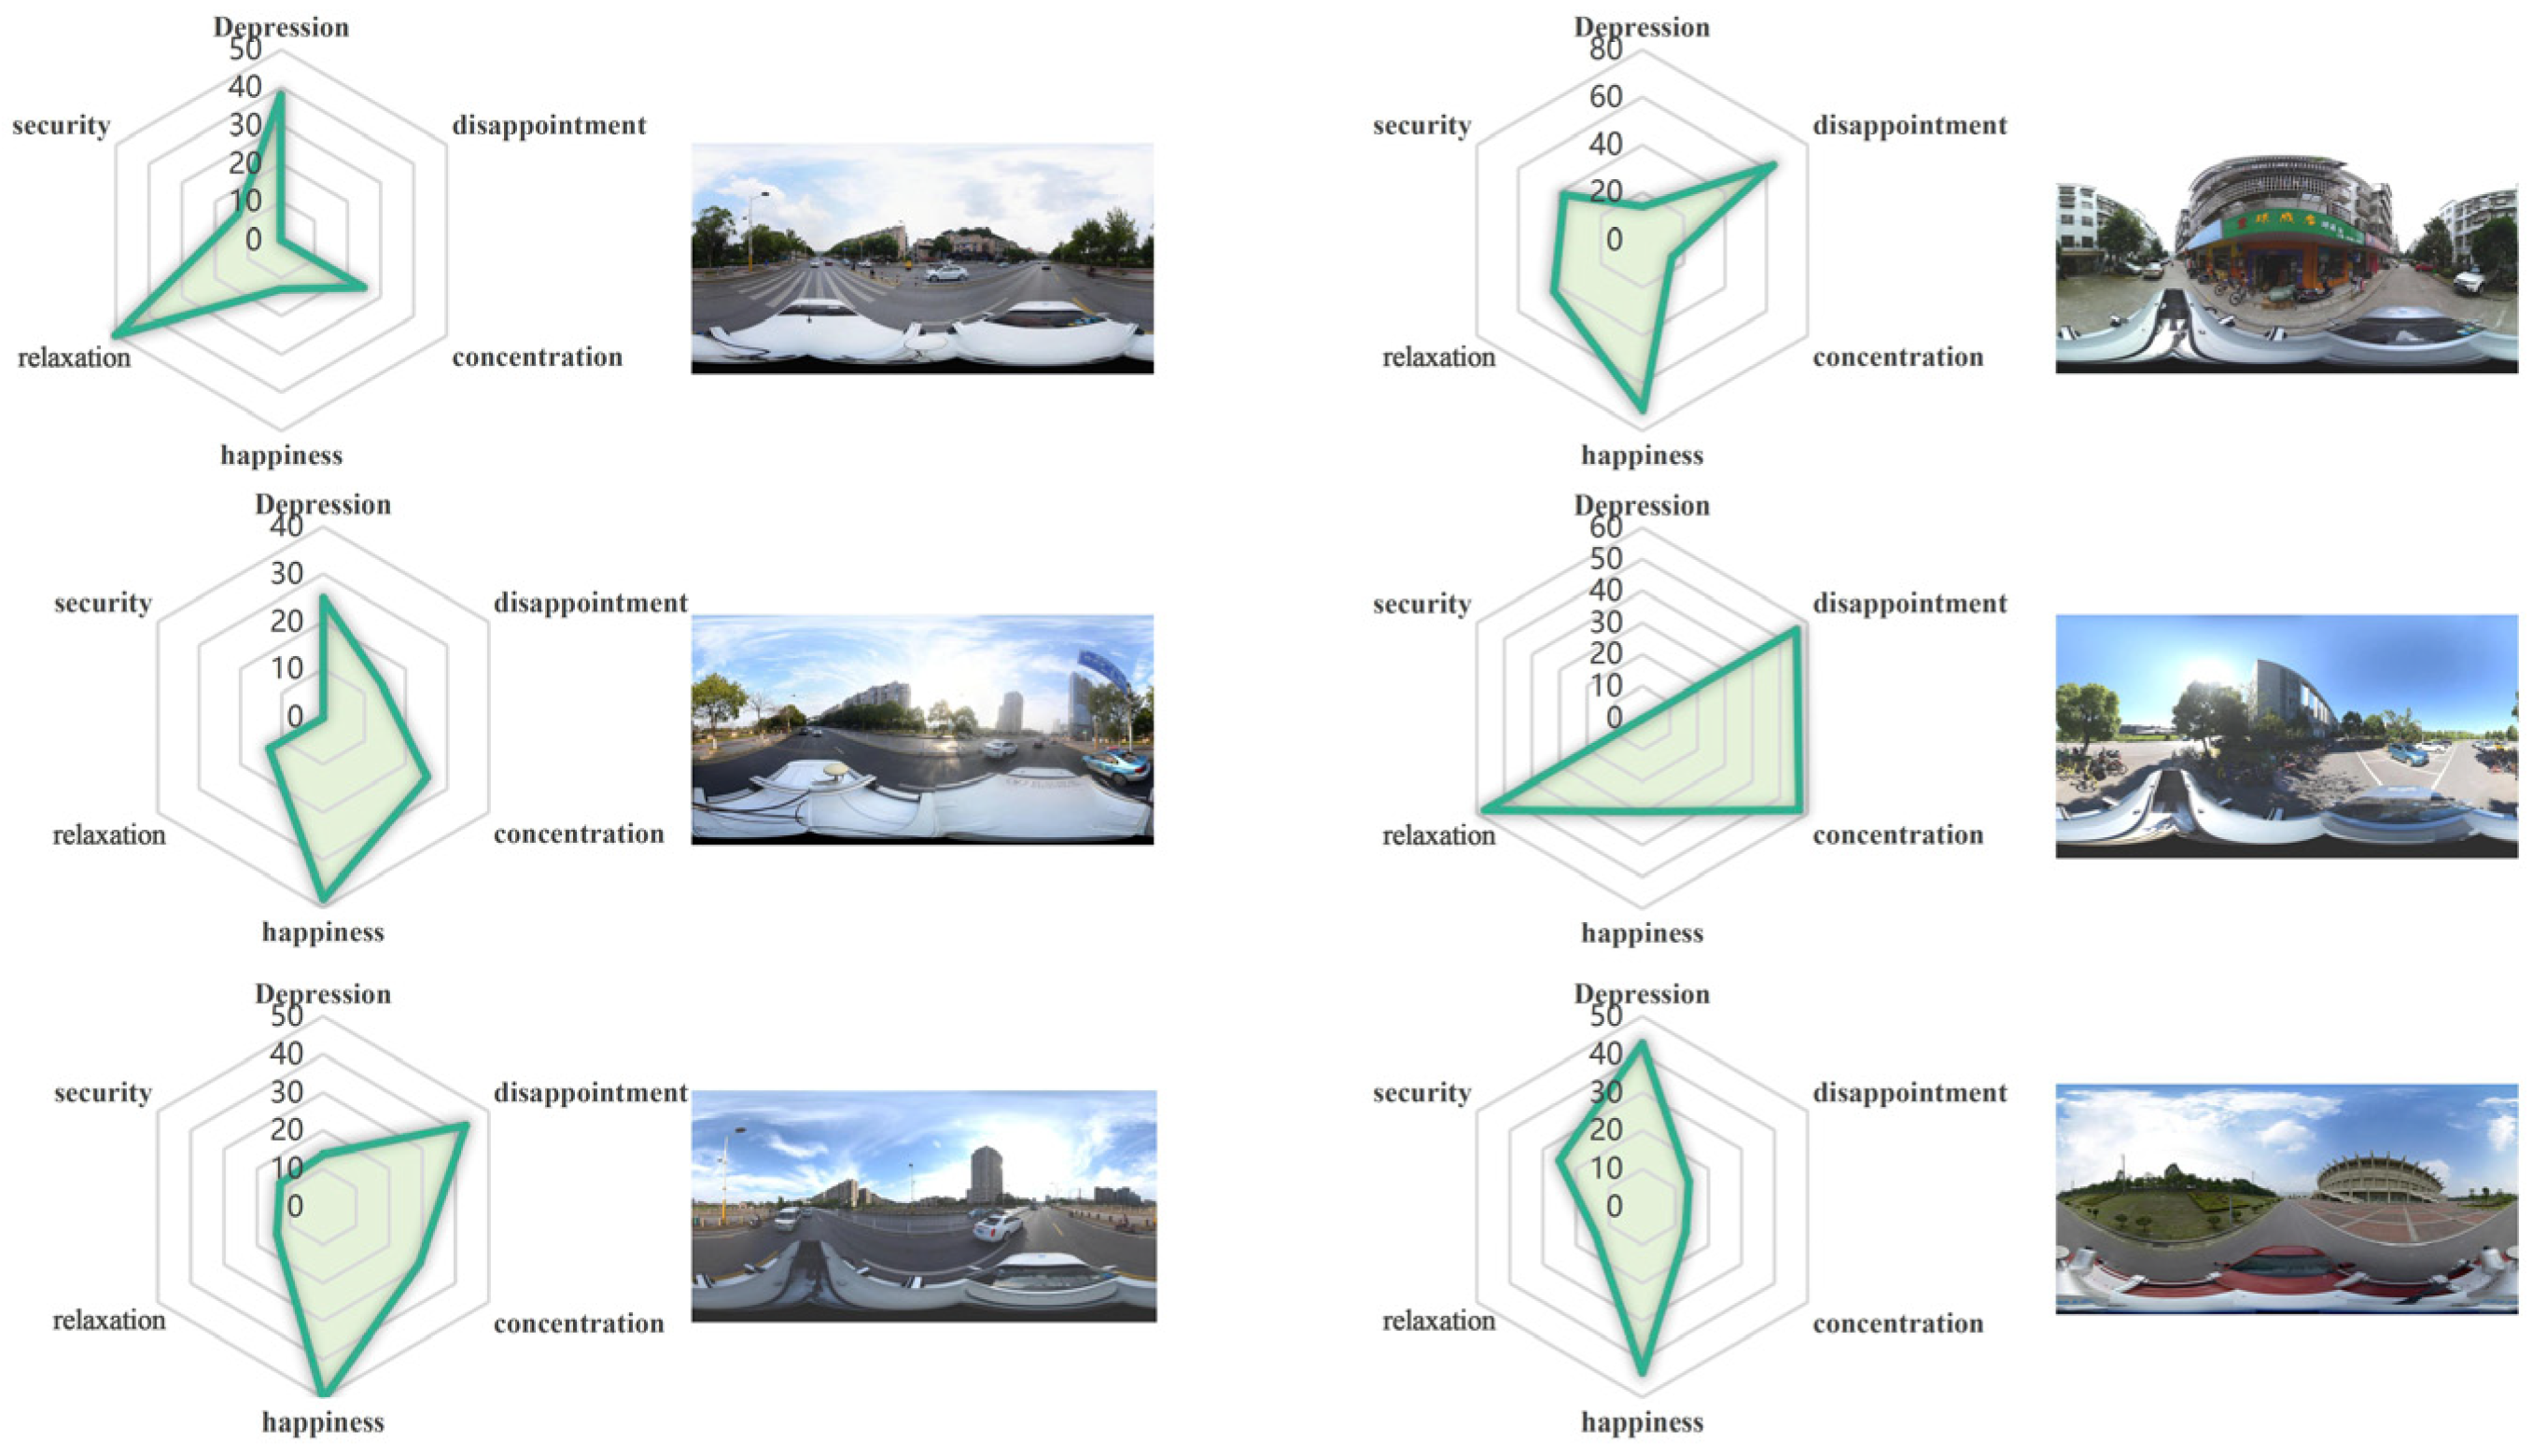
3.2. Predictive Maps for Emotional Perception

Using the ArcGIS 10.8 fishing net tool, the study area was divided into uniform grid cells measuring 85 m × 85 m, and predictions for six sentiment indicators were performed within each grid cell. The prediction results for each grid cell were aggregated to generate the final predictive maps for the six sentiments, illustrating their distribution and variations within the geospatial space. Positive values represent favorable effects, negative numbers represent adverse effects, and the absolute values indicate the magnitude of these effects. Figure 6 presents the quantitative mood predictions for the six different indicators across the study area, with warmer colors indicating positive effects and more intense colors representing stronger positive effects, and vice versa.
Overall, various spatial elements affect students’ emotions, with some emotional predictive distributions exhibiting similar spatial patterns to these elements. Region A shows a strong low preoccupation emotion, which is unexpected, while the Open University area of Region A shows a distinct positive mood perception of anticipation, and a medium to high degree of positive happiness and relaxation. This area also shows localized negative emotions of disappointment above 5 and loss of security less than −4. Compared to the scenic areas within the university city, the high building density and less greenery in the campus teaching area were more likely to produce depressed and unfocused moods. In contrast, more focused, secure, and non-depressed moods were concentrated around the Houhu and Tianma neighborhoods due to high-quality greenery and relatively low building densities.
It is evident that landscape greenery can effectively reduce students’ depression index and enhance the spatial interest, thereby improving concentration and security. In Area C, moods are characterized by medium-high levels of pleasantness and concentration, low levels of depressive feelings, high rates of disappointment, and lower relaxed mood. Conversely, in the mixed university and tourism area close to Yuelu Mountain, the building facade elements are less prominent, and the low motorization level, high motorization, and high diversity and skyscape levels form positive emotions such as high relaxation, high pleasure, and concentration, creating a relatively harmonious atmosphere. In the traffic area of the campus landscape, pedestrian space occupies more space, and the sky views and diversity are at a high level, resulting in a lower level of concentration and feelings of pleasure and safety. The influence of spatial elements on mood is complex and multifaceted, further affected by factors such as socio-economic status geographical location, and cultural background. This study focuses solely on the influence of existing campus spatial environments on mood. Future research can further explore how to create a more positive and healthy mood atmosphere by optimizing spatial design and environmental planning.

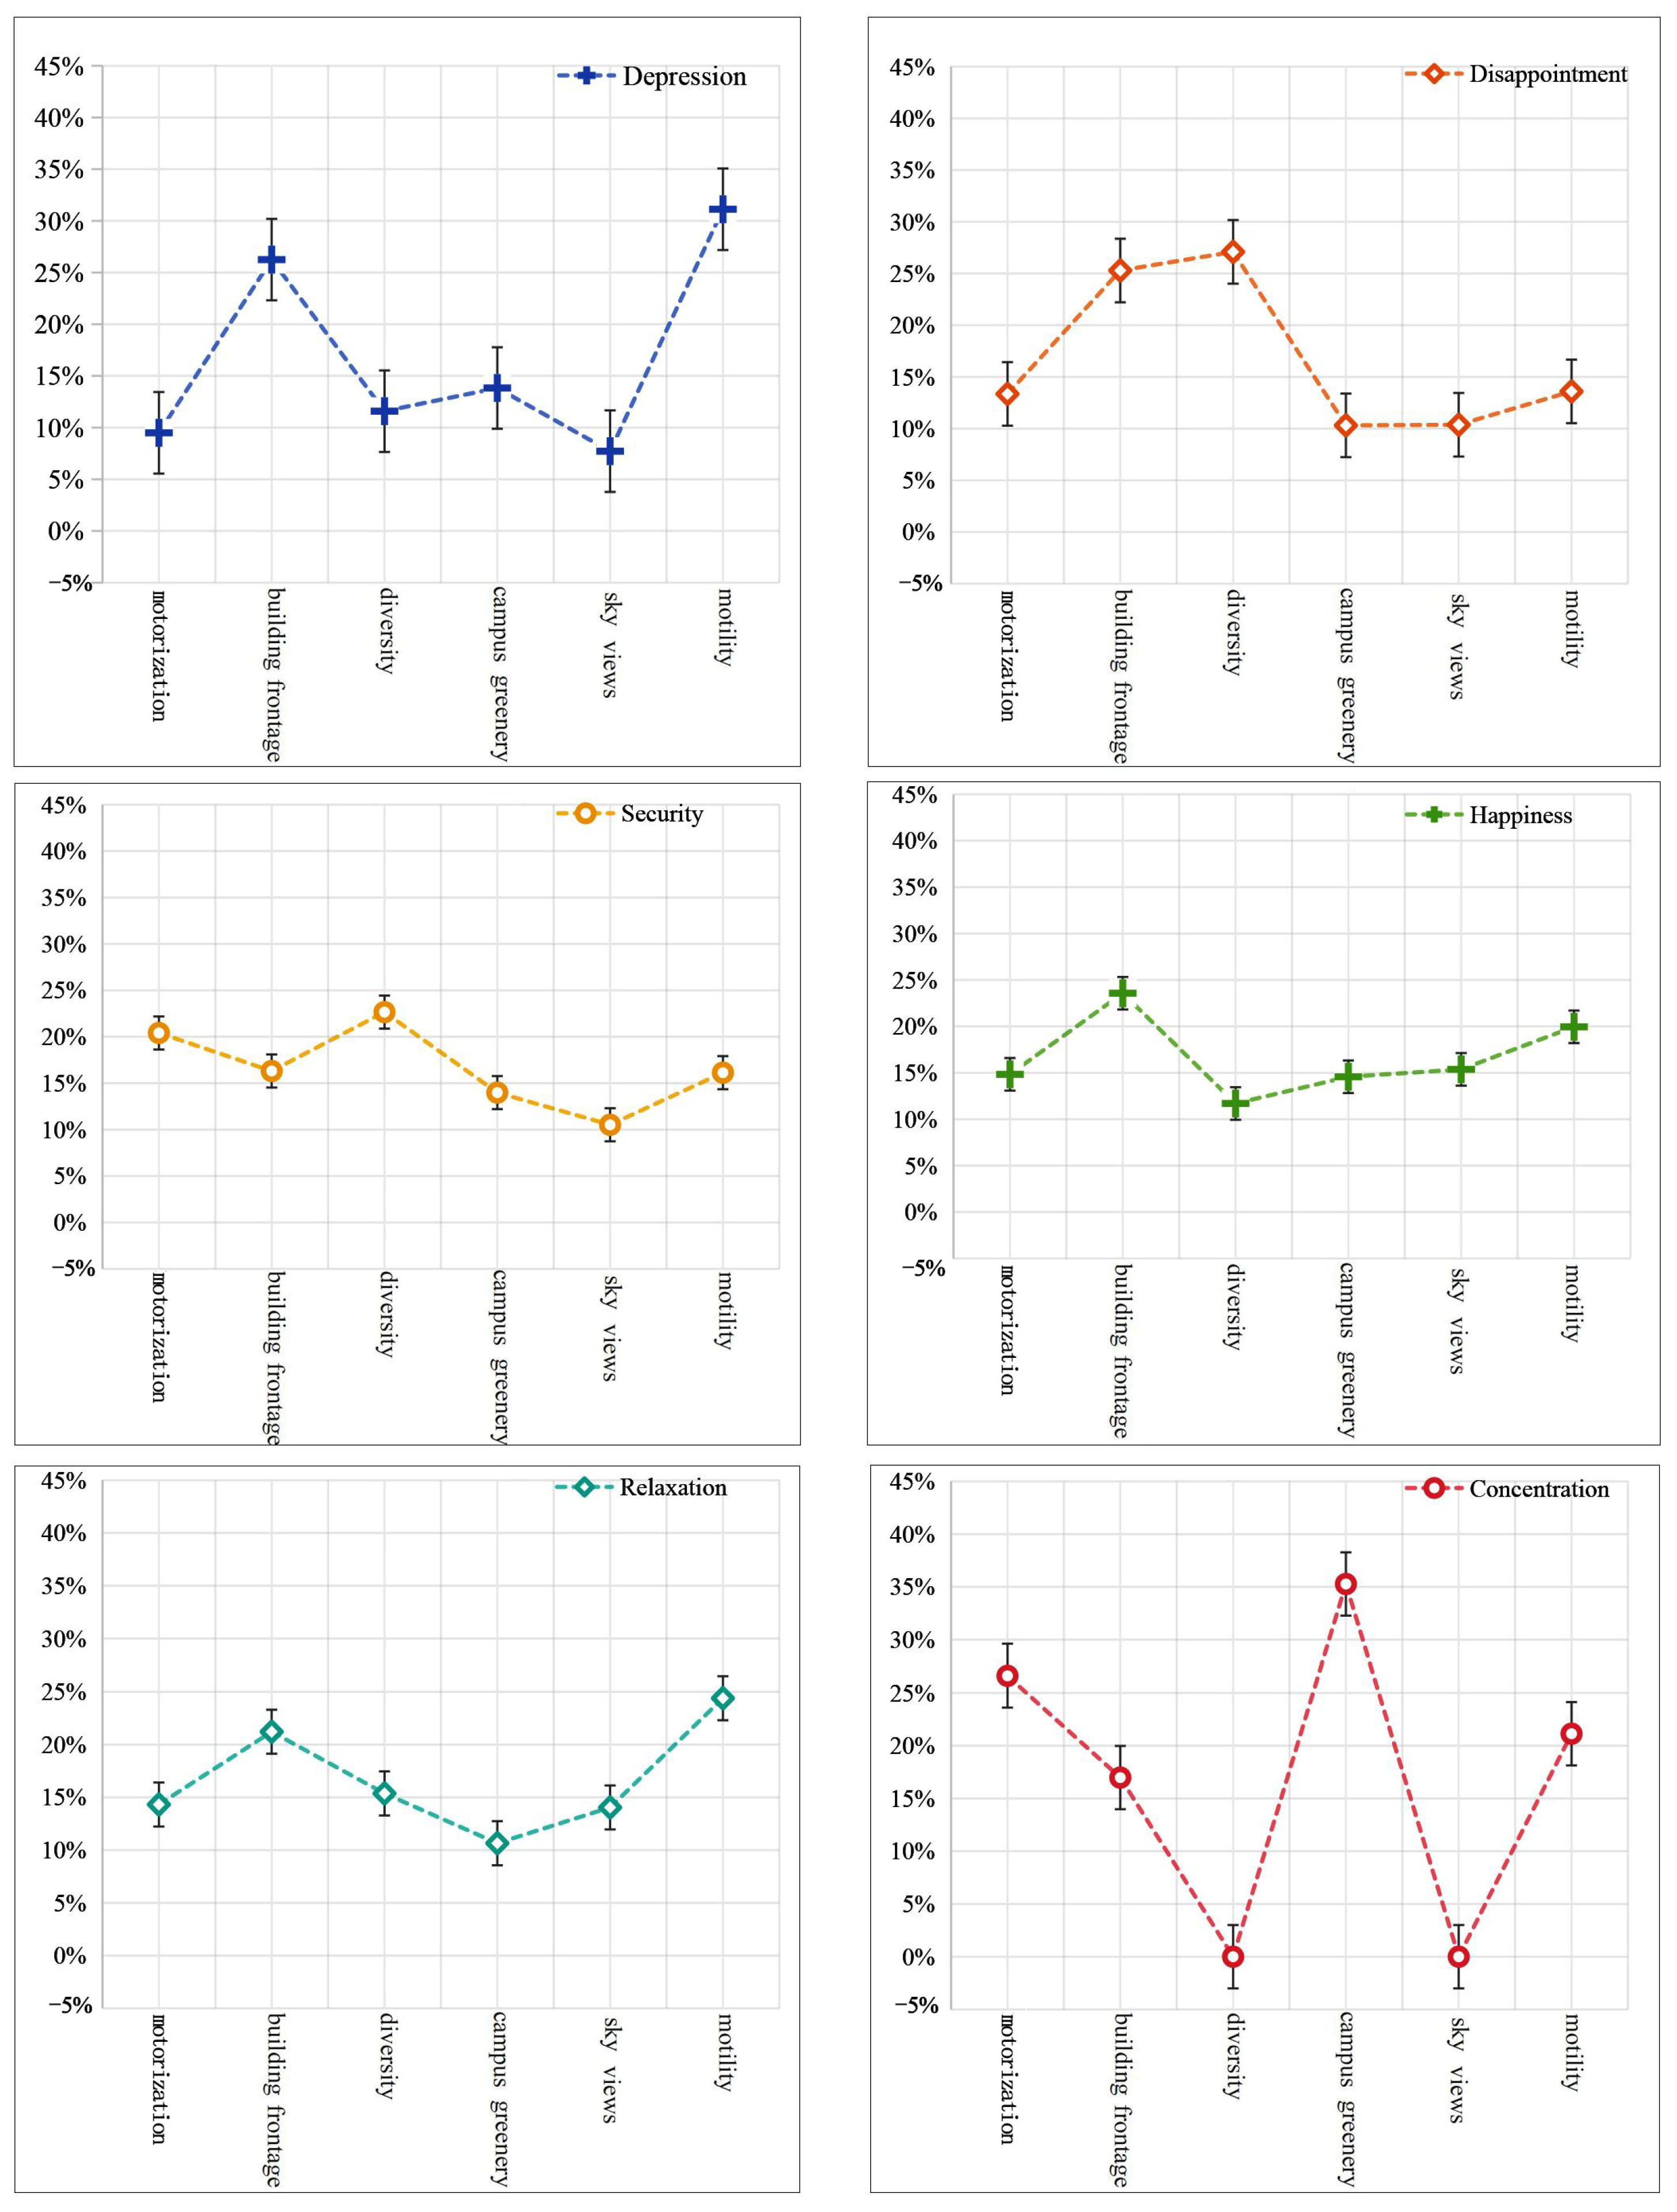
3.3. Results of Correlation Analysis

This section discusses both Global Moran’s I and Anselin Local Moran’s I. Global Moran’s I indicates the presence of spatial clusters or outliers, while Anselin Local Moran’s I reveals the spatial distribution.
A global spatial autocorrelation analysis was conducted using the spatial autocorrelation function in ArcGIS. Table 4 presents the results of Global Moran’s I calculations for the study area. Global Moran’s I indicates a positive spatial autocorrelation of emotional perceptions across the campus, meaning areas with high or low values tend to cluster spatially. The p-value is typically less than 0.05, and the Z-score usually exceeds 1.65, which meets the 99% confidence level, thereby rejecting the null hypothesis.
Spatial local autocorrelation analysis classified points with spatial clustering relationships into four types: high-high clustering (HH), high-low clustering (HL), low-low clustering (LL), and low-high clustering (LH) (Figure 7). High-high clusters of pleasure and relaxation are distinctly distributed in the southern region at the foot of Yuelu Mountain, primarily the main gathering area of open universities. This may be attributed to the open campus design, which enhances the perception of relaxation and pleasure. Similarly, the region exhibits low-low clustering of disappointment and preoccupation, suggesting that open university environments foster positive emotions, characterized by higher diversity and lower motility. However, two areas within the region also exhibit significant high-high clusters of depression. The closed university campus in the southern part of the plot also exhibits significant high-high clusters of depression, while the secondary teaching campus in the western part of Yuelu Mountain and the non-teaching area in the southernmost part of the plot exhibit low-low clusters. This may be attributed to the more relaxed building facades, open spatial layout, and adequate campus greening in these areas. The western part of Yuelu Mountain features a more relaxed teaching atmosphere, while the southernmost area of the secondary commercial support zone has a more relaxed academic environment.
Cold spot analysis was conducted using the Getis-Ord Gi* statistic of ArcGIS 10.8 (Figure 8). By exploring the spatial heterogeneity of emotional perception within the university campus environment, we gained insights into how this environment influences students’ emotions. We identified areas with strong positive emotional perception, including open university zones and supporting commercial areas, and areas with strong negative emotions, such as closed campuses and the interiors of high-rise residential areas. Additionally, the area with moderate emotional perception was the central part of the study area. The results indicate that emotional perception levels in the central area of Yuelu Mountain are significantly higher than in the surrounding areas. Similarly, areas with lower emotional perception were concentrated in the southern region, exhibiting a point-like distribution.
Characteristic importance analyses of the relative importance of the six types of spatial elements (Figure 9) provide valuable insights into spatial design. For the mood of “depression”, “motorization” has the highest relative importance (0.31), followed by “building facade” (0.26). Motility is closely linked to depression as it encompasses factors that trigger stress and attentional depletion—constant cognitive load, lack of opportunities for stress recovery, increased stress, sensory overload, social isolation, and physical exhaustion. These factors collectively highlight the significant role of motility in contributing to depression. Particularly in the context of Yuelu Mountain National University Science and Technology City, high-motility environments are characterized by constant movement, traffic flow, and rapid decision-making. The absence of environmental factors that alleviate learning pressure forces college students to maintain a high degree of attention to directional traffic, which continuously strains their cognitive resources and diminishes the cognitive recovery described by ART. Additionally, noise and visual stimuli in high-motility environments decrease emotional resilience, while social deprivation and isolation contribute to higher levels of depression.
For the mood of “disappointment”, “diversity” (0.27) and “building facade” (0.25) had the highest relative importance. “Diversity” has the strongest impact on “disappointment” and is negatively correlated. Diverse design elements and inclusive cultural experiences offer unique and enriching opportunities for students to engage in various activities, social interactions, and educational pursuits, thereby significantly reducing feelings of disappointment.
For the emotion of “security”, all six factors had similar importance, with diversity (0.22) being the highest. The diversity of university campus environments reflects a wide range of cultural, social, and functional characteristics, ensuring that diverse student groups can find spaces that resonate with them. Diversity also offers various options for interactive activities such as sports gatherings, which enhances their sense of security through redundancy and choice. Therefore, diversity is strongly correlated with a heightened sense of safety.
For “pleasure”, “building facade” (0.25) and “motorization” (0.20) had the highest relative importance. Building facades are crucial in shaping the character and identity of a university, particularly at Yuelu Mountain National University Science and Technology City. The facades of university towns frequently feature traditional classical Chinese architectural elements such as sloping roofs, upturned eaves, and ornate details. Tiled roofs, decorative wood beams, and red brick foster a deep sense of cultural continuity and identity. These architectural features evoke a sense of cultural pride among students and strengthen their emotional attachment to the campus environment. At the same time, the excessive display of building facades can also lead to psychological pressure and reduced attention recovery among college students, potentially resulting in depression and other negative emotions. Therefore, for “happiness”, the feature of “building frontage” plays a pivotal role. In contrast, while “campus greenery” and “sky views” are generally associated with positive emotions, their influence on happiness is more subtle and indirect, rendering them less critical. In the campus environment of Yuelu Mountain National University Science and Technology City, where architectural features are highly valued, greenery and sky views are typically regarded as complementary elements rather than primary contributors to happiness.
When it comes to relaxation, “motility” is the most significant factor (0.24) and exhibits a negative correlation, while “campus greenery” holds the lowest importance and is positively correlated. Motility induces stress and attentional depletion, which detracts from the overall experience of relaxation. Although greenery may not be the primary contributor to relaxation, it still exerts a beneficial, subtle effect. In environments characterized by high motility and functional priorities, the role of greening is perceived as secondary and nuanced.
For “concentration”, “greenery” (0.35) had the highest relative importance, while “sky views” and “diversity” had almost no importance. These findings indicate that different environmental factors affect the distributional characteristics of emotions. At the same time, we find that “building frontage” is the most significant factor contributing to happiness and ranks as the second most important factor for depression, relaxation, and disappointment. This suggests that the primary source of happiness at YLMNUSTTC is derived from the sense of identity and pride associated with traditional culture, with building facades effectively connecting college students to the cultural heritage of the Huxiang region. However, the prominence of building facades also highlights the challenges of high-density urban environments, where increased building density can exacerbate psychological stress and hinder attentional recovery. By understanding and optimizing these impacts, university campuses can enhance student well-being by ensuring that campus environments simultaneously preserve cultural heritage, foster positive emotional perceptions, and address the modernizing needs of the academic community.
This aligns with previous research [73], which found that “greenery”, “terrain”, and “rider” positively impact street comfort, while “building”, “motorbike”, and “bicycle” negatively affect it. However, the specific factors and psychological effects were not clearly defined. Another study [74] concluded that an increase in tree canopy reduces stress, and different individuals experience varied moods related to green landscapes.
“Diversity” was positively correlated with the four positive mood indicators and negatively correlated with “depression” and “disappointment”, suggesting that diversity promotes positive moods in campus spaces. “Motility”, “building facades”, “motorization”, and “sky views” were positively correlated with positive mood indicators. “Depression” and “disappointment” are positively correlated with negative mood indicators, as complex road traffic and dense buildings increase negative emotions. Conversely, a larger proportion of the sky and a more spacious visual space on campus can generate positive emotions. “Campus greenery” is positively correlated with “concentration” and “relaxation”, indicating that green spaces enhance environmental quality and improve spatial perception.
A challenge in validating the results is that the sentiment values predicted by the XGBoost model are based on empirical judgments from experts, such as architects and planners, and there are no reference standards to ensure complete accuracy. To validate the study results, we compared the XGBoost predictions with manually scored images. The validation was performed using manually scored images of high-high (HH) and high-low (HL) clusters (Figure 10 and Figure 11). The label H h 1 in Figure 10 indicates that the score of high emotional values H h tends to 1, which refers to the high range of emotional perception scores. H l 1 indicates that the low emotional worthiness score H l tends to −1, which refers to the low range of emotional perception scores. It was observed that images with high indicators of “security”, “relaxation”, “happiness”, and “concentration” displayed a high degree of greenery, greater diversity, and superior quality skyscapes. Conversely, images with high indicators of “depression” and “disappointment” exhibited a higher proportion of building facades, with pedestrian spaces being narrower and more complex. These findings are consistent with the predictions of the XGBoost model.

4. Discussion

4.1. Natural Environment and Emotional Perception

Compared to the built environment, the natural environment exerts a more positive influence on emotional perception and health. Experimental results indicate that campus greenery significantly enhances students’ concentration and relaxation. This finding suggests that the natural landscape on university campuses supports students focus and stress relief. Factors such as high accessibility to greenspaces, the presence of water, visibility of trees or shrubs, and well-designed landscaping contribute to increased restorative ability. An expanded tree canopy enhances resilience by invoking a sense of “away”, as described in ART, while physical activity in green spaces fosters restorative emotional experiences. However, the study found that beyond a certain threshold, increased campus greenness does not enhance restoration. Optimal restorative perceptions were observed with moderate green visibility (24–34%), whereas excessive greenery resulted in negative emotional responses due to obstructed or overly complex views.
Additionally, experimental results reveal that expansive sky views enhance feelings of pleasure and reduce stress, thereby promoting attentional restoration. The degree of spatial openness and the proportion of natural elements influence the restorative benefits of natural spaces, resulting in varying emotional perceptions.
The experiments also demonstrated that areas with high-quality motility contribute to pleasure and relaxation. However, such areas are often associated with noise and pollution, which can induce negative emotions, distract students, and thereby reduce learning efficiency. Implementing passive segregation units to distance from traffic can mitigate these issues, thereby enabling public natural spaces to better fulfill their primary function of providing a knowledge-sharing environment.

4.2. Built Environment and Emotional Perception

One reason the built environment is generally less restorative than the natural environment is that the latter contains more comprehensible information, allowing individuals to process emotional perceptions without extensive directed attention. Dense building facades contribute to feelings of depression and tension, amplifying negative emotions such as depression and disappointment, as reflected in the experimental results. Modern university campuses often present excessive information, creating significant sensory overload and operational strain, leading to prolonged stress among students. Due to prolonged engagement in high-intensity cognitive tasks, students often experience attention depletion. They navigate environments with limited variety and repetitive pathways, encountering monotonous architectural spaces that impede recovery. The primary condition for recovery involves diverting attention from exhausting tasks, yet the built environment often fails to support this, even in the absence of additional stressors.
Therefore, well-designed architectural spaces that incorporate humanistic elements and enhance diversity can offer meaningful restorative experiences for university students. Spaces imbued with cultural or historical significance notably increase interest and appeal, providing an additional mode of restoration beyond natural environments. To achieve this, strategies involving the utilization, adaptation, and transformation of historical sites, protected buildings, and educational exhibition gardens should be implemented. Integrating historical and cultural elements into environmental design through extraction, abstraction, and translation can reduce stress and restore attention. This approach enables students to perceive their environment from a broader regional perspective, promoting mental rejuvenation through expanded thinking.

4.3. Disciplinary Environment and Emotional Perception

The degree of recovery for an individual depends not only on the spatial environment’s structure and characteristics but also on how the individual interacts with it. Both open and closed disciplinary environments significantly influence emotional perception. Campus diversity can significantly enhance positive emotions among students while reducing feelings of depression and disappointment. Open campuses, such as Hunan University and Hunan Normal University, achieve this effectively. However, these open campuses, integrated with high mobile, diverse, and motorized urban environments, require careful management of negative emotional impacts resulting from excessive directed attention consumption. Excessive external stimuli hinder the recovery of undirected attention. Despite reporting high levels of pleasure and relaxation in these areas, students are more susceptible to external distractions due to the surrounding environment’s complexity, which leads to decreased concentration and an unstable sense of security, particularly in heavily trafficked and densely built locations.
In contrast, closed campuses, such as Central South University and Hunan Arts Vocational College, typically feature higher levels of campus greenery and lower motility, facilitating a quieter, more private learning environment. According to stress reduction and attention recovery theories, such environments are conducive to reducing stress and promoting attention recovery among students. Experimental results support this conclusion, indicating that positive emotions, such as pleasure, relaxation, and concentration, are more prevalent in closed campuses, particularly in areas with abundant greenery and well-designed building facades. However, the homogeneous and relatively closed composition of environmental elements may also lead to elevated levels of depressive emotions. Enhancing campus landscape elements and functional facilities, introducing non-campus elements, and adding diverse functional areas could be beneficial. Additionally, incorporating a wider variety of plants into campus greening can create a richly layered ecological landscape that diverts student needs and encourages active engagement.

4.4. Campus Planning and Emotional Perception

Differences in campus planning between old and new campuses result in varying emotional perceptions. The teaching secondary campus in the west of Yuelu Mountain (the old campus) shows a low-low cluster of depression perceptions, while the Open University Area in the center of Zone A (the new campus) exhibits significantly positive mood perceptions, particularly in terms of disappointment. Additionally, this area demonstrates medium to high levels of happiness and relaxation. The design of the new campus closely aligns with the core principles of ART, which emphasizes that a natural environment is crucial for restoring attentional resources depleted by prolonged cognitive activity. The new campus is more modern and functional, offering increased green and open spaces, which contribute to higher quality sky views and enhanced campus greenery. This design not only enhances environmental diversity and interest, but also provides an ideal setting for students to recover from intensive learning tasks and regain their attention, thereby facilitating positive emotions such as happiness and concentration. New campuses are often planned with more spacious and comfortable transportation environments, minimizing distractions from motorized vehicles and offering a greater sense of safety and relaxation, further contributing to concentration restoration and the experience of positive emotions.
In contrast, the old campus exemplifies the negative impact of environmental constraints on students’ emotional perceptions. Due to historical factors, the old campus is characterized by high building density and relatively few green and open spaces, resulting in low-quality campus greenery and insufficient environmental diversity. According to Attention Restoration Theory, such an environment hampers the restoration of students’ attention, as it lacks sufficient natural elements to alleviate cognitive fatigue. Additionally, from the perspective of Stress Reduction Theory, the environmental characteristics of the old campus may aggravate students’ psychological stress. The low quality and diversity of greenery increase the likelihood of experiencing negative emotions such as depression and disappointment. Furthermore, while the low level of motorization in older campuses may bring a certain tranquility, it also suggests problems such as poor accessibility or aging facilities, which contribute to negative emotional perceptions such as “depression” and “disappointment”.

5. Conclusions

5.1. Environmental Perception and Quantification of Emotions

We quantify the influence of campus environment elements on students’ emotional perceptions by analyzing the correlation between spatial attributes and emotions, investigating the relationships between emotion indicators and campus environment elements, and conducting quantitative modeling to predict emotional states and distribution characteristics across campus spaces. Additionally, these correlations are explored through the frameworks of ART and SRT. This study adopts a student-centric perspective, aiming to enhance emotional perception and mental health, thereby providing robust support for the development of a campus that addresses students’ psychological needs.
The study is the first to systematically correlate the university campus environment with students’ emotions. It extends beyond traditional environmental evaluation metrics by incorporating campus environment elements and psychological indicators that more closely align with the psychological needs of college students. This approach addresses gaps in research on educational environments and student psychology, thereby laying a theoretical foundation for future studies. The research method employed is broadly applicable, and the use of campus environment image data represents a significant advancement in the assessment of campus space and environmental perception. This method more accurately captures architectural space perception and provides a superior alternative to traditional data collection methods by enabling large-scale analysis of spatial element distributions and the visualization of spatial emotion predictions. By focusing on users’ emotions and psychology, this approach enables more effective assessment and prediction of human-centered campus environments, offering valuable insights for the construction of educational spaces that meet users’ psychological needs.
Compared to previous studies, this research offers a more advanced approach. Earlier studies primarily utilized fragmented image evaluations from limited perspectives, whereas our study employs panoramic image collection to extract spatial elements and gather emotional indicators. This method, which includes virtual simulation experiments, allows for a more intuitive and comprehensive experience of spatial emotions, providing a clearer and more accurate representation of campus spaces. Additionally, this study optimizes emotional perception indicators, aligning them more closely with the psychological needs of campus spaces.

5.2. Limitations

The research has several limitations. First, as the campus environment images are two-dimensional, they do not fully capture the spatial area and content, nor can they represent the space comprehensively in three dimensions. Future research is expected to address this limitation. Temporally, although updated campus environment images were manually selected and batch color correction was performed, factors such as weather, sunlight, season, and year were not examined in detail. Additionally, some sampling points lacked corresponding images. Future research should aim to address these limitations through technological advancements and societal development.

Author Contributions

Conceptualization, Z.P., R.Z., Z.L. and Y.D.; methodology, Z.P.; software, Z.P.; validation, Z.P., R.Z. and Y.D.; formal analysis, R.Z.; investigation, Z.P.; resources, Z.P.; data curation, Z.L.; writing—original draft preparation, Z.P.; writing—review and editing, R.Z. and Y.D.; visualization, R.Z.; supervision, R.Z.; project administration, R.Z.; funding acquisition, Z.P. All authors have read and agreed to the published version of the manuscript.

Funding

This research was funded by the Natural Science Foundation of Hunan Province of China, grant number 2024JJ3010, and by the Hunan Office of Philosophy and Social Science, grant number 23WTC03.

Data Availability Statement

The data presented in this study are available on request from the corresponding author due to the complexity of the data.

Conflicts of Interest

The authors declare no conflict of interest.

References

  1. Chen, J.; Chen, S.; Landry, P.F.; Davis, D.S. How Dynamics of Urbanization Affect Physical and Mental Health in Urban China. China Q. 2014, 220, 988–1011. [Google Scholar] [CrossRef]
  2. Chen, J.; Chen, S. Mental health effects of perceived living environment and neighborhood safety in urbanizing China. Habitat Int. 2015, 46, 101–110. [Google Scholar] [CrossRef]
  3. Li, J.; Liu, Z.L. Housing stress and mental health of migrant populations in urban China. Cities 2018, 81, 172–179. [Google Scholar] [CrossRef]
  4. Dong, G.P.; Wolf, L.; Alexiou, A.; Arribas-Bel, D. Inferring neighbourhood quality with property transaction records by using a locally adaptive spatial multi-level model. Comput. Environ. Urban Syst. 2019, 73, 118–125. [Google Scholar] [CrossRef]
  5. Zhang, H.; Chen, B.; Sun, Z.; Bao, Z.Y. Landscape perception and recreation needs in urban green space in Fuyang, Hangzhou, China. Urban For. Urban Green. 2013, 12, 44–52. [Google Scholar] [CrossRef]
  6. Özgüner, H.; Eraslan, S.; Yilmaz, S. Public perception of landscape restoration along a degraded urban streamside. Land Degrad. Dev. 2012, 23, 24–33. [Google Scholar] [CrossRef]
  7. Rollero, C.; De Piccoli, N. Place attachment, identification and environment perception: An empirical study. J. Environ. Psychol. 2010, 30, 198–205. [Google Scholar] [CrossRef]
  8. Mehrabian, A.; Russell, J.A. An Approach to Environmental Psychology; The MIT Press: Cambridge, MA, USA, 1974; ISBN 978-026-213-090-5. [Google Scholar]
  9. Zhu, Y.G.; Jones, K.C. Urbanisation and health in China. Lancet 2010, 376, 232–233. [Google Scholar] [CrossRef]
  10. Grekousis, G.; Liu, Y. Where will the next emergency event occur? Predicting ambulance demand in emergency medical services using artificial intelligence. Comput. Environ. Urban Syst. 2019, 76, 110–122. [Google Scholar] [CrossRef]
  11. Chen, C.X.; Li, H.W.; Luo, W.J.; Xie, J.H.; Yao, J.; Wu, L.F.; Xia, Y. Predicting the effect of street environment on residents’ mood states in large urban areas using machine learning and street view images. Sci. Total Environ. 2022, 816, 151605. [Google Scholar] [CrossRef]
  12. Meng, Y.M.; Li, Q.Y.; Ji, X.; Yu, Y.Q.; Yue, D.; Gan, M.Q.; Wang, S.Y.; Niu, J.N.; Fukuda, H. Research on Campus Space Features and Visual Quality Based on Street View Images: A Case Study on the Chongshan Campus of Liaoning University. Buildings 2023, 13, 1332. [Google Scholar] [CrossRef]
  13. Rui, Q.Q.; Cheng, H.S. Quantifying the spatial quality of urban streets with open street view images: A case study of the main urban area of Fuzhou. Ecol. Indic. 2023, 156, 111204. [Google Scholar] [CrossRef]
  14. Tang, J.X.; Long, Y. Measuring visual quality of street space and its temporal variation: Methodology and its application in the Hutong area in Beijing. Landsc. Urban Plan. 2019, 191, 103436. [Google Scholar] [CrossRef]
  15. Hickman, C. ‘To brighten the aspect of our streets and increase the health and enjoyment of our city’: The National Health Society and urban green space in late-nineteenth century London. Landsc. Urban Plan. 2013, 118, 112–119. [Google Scholar] [CrossRef]
  16. Carmona, M.; Gabrieli, T.; Hickman, R.; Laopoulou, T.; Livingstone, N. Street appeal: The value of street improvements. Prog. Plan. 2018, 126, 1–51. [Google Scholar] [CrossRef]
  17. Wang, L.; Han, X.; He, J.; Jung, T. Measuring residents’ perceptions of city streets to inform better street planning through deep learning and space syntax. Isprs J. Photogramm. Remote Sens. 2022, 190, 215–230. [Google Scholar] [CrossRef]
  18. Ulrich, R.S.; Simons, R.F.; Losito, B.D.; Fiorito, E.; Miles, M.A.; Zelson, M. Stress recovery during exposure to natural and urban environments. J. Environ. Psychol. 1991, 11, 201–230. [Google Scholar] [CrossRef]
  19. Kaplan, S. The restorative benefits of nature: Toward an integrative framework. J. Environ. Psychol. 1995, 15, 169–182. [Google Scholar] [CrossRef]
  20. Dong, H.W.; Qin, B. Exploring the link between neighborhood environment and mental wellbeing: A case study in Beijing, China. Landsc. Urban Plan. 2017, 164, 71–80. [Google Scholar] [CrossRef]
  21. Helbich, M. Toward dynamic urban environmental exposure assessments in mental health research. Environ. Res. 2018, 161, 129–135. [Google Scholar] [CrossRef]
  22. Hidalgo, A.K. Mental health in winter cities: The effect of vegetation on streets. Urban For. Urban Green. 2021, 63, 127226. [Google Scholar] [CrossRef]
  23. Marselle, M.R.; Bowler, D.E.; Watzema, J.; Eichenberg, D.; Kirsten, T.; Bonn, A. Urban street tree biodiversity and antidepressant prescriptions. Sci. Rep. 2020, 10, 22445. [Google Scholar] [CrossRef] [PubMed]
  24. Taylor, M.S.; Wheeler, B.W.; White, M.P.; Economou, T.; Osborne, N.J. Research note: Urban street tree density and antidepressant prescription rates A cross-sectional study in London, UK. Landsc. Urban Plan. 2015, 136, 174–179. [Google Scholar] [CrossRef]
  25. Zhao, J.W.; Wu, J.X.; Wang, H.D. Characteristics of urban streets in relation to perceived restorativeness. J. Expo. Sci. Environ. Epidemiol. 2020, 30, 309–319. [Google Scholar] [CrossRef]
  26. Ma, J.; Li, C.; Kwan, M.-P.; Kou, L.; Chai, Y. Assessing personal noise exposure and its relationship with mental health in Beijing based on individuals’ space-time behavior. Environ. Int. 2020, 139, 105737. [Google Scholar] [CrossRef]
  27. Van den Berg, A.E.; Jorgensen, A.; Wilson, E.R. Evaluating restoration in urban green spaces: Does setting type make a difference? Landsc. Urban Plan. 2014, 127, 173–181. [Google Scholar] [CrossRef]
  28. Wang, X.X.; Rodiek, S.; Wu, C.Z.; Chen, Y.; Li, Y.X. Stress recovery and restorative effects of viewing different urban park scenes in Shanghai, China. Urban For. Urban Green. 2016, 15, 112–122. [Google Scholar] [CrossRef]
  29. Nordbo, E.C.A.; Nordh, H.; Raanaas, R.K.; Aamodt, G. GIS-derived measures of the built environment determinants of mental health and activity participation in childhood and adolescence: A systematic review. Landsc. Urban Plan. 2018, 177, 19–37. [Google Scholar] [CrossRef]
  30. Li, J.J.; Jin, Y.C.; Lu, S.; Wu, W.; Wang, P.F. Building environment information and human perceptual feedback collected through a combined virtual reality (VR) and electroencephalogram (EEG) method. Energy Build. 2020, 224, 110259. [Google Scholar] [CrossRef]
  31. Ojha, V.K.; Griego, D.; Kuliga, S.; Bielik, M.; Bus, P.; Schaeben, C.; Treyer, L.; Standfest, M.; Schneider, S.; König, R.; et al. Machine learning approaches to understand the influence of urban environments on human’s physiological response. Inf. Sci. 2019, 474, 154–169. [Google Scholar] [CrossRef]
  32. Zhang, F.; Zhou, B.L.; Liu, L.; Liu, Y.; Fung, H.H.; Lin, H.; Ratti, C. Measuring human perceptions of a large-scale urban region using machine learning. Landsc. Urban Plan. 2018, 180, 148–160. [Google Scholar] [CrossRef]
  33. Salesses, P.; Schechtner, K.; Hidalgo, C.A. The Collaborative Image of The City: Mapping the Inequality of Urban Perception. PLoS ONE 2013, 8, e68400, Erratum in PLoS ONE 2015, 10, e0119352. [Google Scholar] [CrossRef] [PubMed]
  34. Jiang, B.; Xu, W.Y.; Ji, W.Q.; Kim, G.; Pryor, M.; Sullivan, W.C. Impacts of nature and built acoustic-visual environments on human’s multidimensional mood states: A cross-continent experiment. J. Environ. Psychol. 2021, 77, 101659. [Google Scholar] [CrossRef]
  35. Wang, R.Y.; Liu, Y.; Lu, Y.; Zhang, J.B.; Liu, P.H.; Yao, Y.; Grekousis, G. Perceptions of built environment and health outcomes for older Chinese in Beijing: A big data approach with street view images and deep learning technique. Comput. Environ. Urban Syst. 2019, 78, 101386. [Google Scholar] [CrossRef]
  36. Kuo, F.E.; Sullivan, W.C. Environment and Crime in the Inner City: Does Vegetation Reduce Crime? Environ. Behav. 2001, 33, 343–367. [Google Scholar] [CrossRef]
  37. Gascon, M.; Triguero-Mas, M.; Martínez, D.; Dadvand, P.; Forns, J.; Plasència, A.; Nieuwenhuijsen, M.J. Mental Health Benefits of Long-Term Exposure to Residential Green and Blue Spaces: A Systematic Review. Int. J. Environ. Res. Public Health 2015, 12, 4354–4379. [Google Scholar] [CrossRef]
  38. Rundle, A.G.; Bader, M.D.M.; Richards, C.A.; Neckerman, K.M.; Teitler, J.O. Using Google Street View to Audit Neighborhood Environments. Am. J. Prev. Med. 2011, 40, 94–100. [Google Scholar] [CrossRef]
  39. Mahmoud, J.S.R.; Staten, R.; Hall, L.A.; Lennie, T.A. The relationship among young adult college students’ depression, anxiety, stress, demographics, life satisfaction, and coping styles. Issues Ment. Health Nurs. 2012, 33, 149–156. [Google Scholar] [CrossRef]
  40. Shamsuddin, K.; Fadzil, F.; Ismail, W.S.W.; Shah, S.A.; Omar, K.; Muhammad, N.A.; Jaffar, A.; Ismail, A.; Mahadevan, R. Correlates of depression, anxiety and stress among Malaysian university students. Asian J. Psychiatry 2013, 6, 318–323. [Google Scholar] [CrossRef]
  41. Zeisel, J. Inquiry by Design: Tools for Environment-Behavior Research; W.W. Norton & Company: New York, NY, USA, 2006. [Google Scholar]
  42. Evans, G.W.; Johnson, D. Stress and Open-Office Noise. J. Appl. Psychol. 2000, 85, 779–783. [Google Scholar] [CrossRef]
  43. Montgomery, C. Happy City: Transforming Our Lives Through Urban Design; Farrar, Straus and Giroux: New York, NY, USA, 2013. [Google Scholar]
  44. Dubey, A.; Naik, N.; Parikh, D.; Raskar, R.; Hidalgo, C.A. Deep Learning the City: Quantifying Urban Perception at a Global Scale. In Proceedings of the 14th European Conference on Computer Vision (ECCV), Amsterdam, The Netherlands, 8–16 October 2016; pp. 196–212. [Google Scholar]
  45. Roberts, H.; van Lissa, C.; Hagedoorn, P.; Kellar, I.; Helbich, M. The effect of short-term exposure to the natural environment on depressive mood: A systematic review and meta-analysis. Environ. Res. 2019, 177, 108606. [Google Scholar] [CrossRef] [PubMed]
  46. Carroll, J.M. Human-computer interaction: Psychology as a science of design. Annu. Rev. Psychol. 1997, 48, 61–83. [Google Scholar] [CrossRef] [PubMed]
  47. Zhang, J.; Yang, Z.; Chen, Z.; Guo, M.; Guo, P. Optimizing Urban Forest Landscape for Better Perceptions of Positive Emotions. Forests 2021, 12, 1691. [Google Scholar] [CrossRef]
  48. Gross, J.J.; Muñoz, R.F. Emotion regulation and mental health. Clin. Psychol. Sci. Pract. 1995, 2, 151–164. [Google Scholar] [CrossRef]
  49. World Health Organization. Green and Blue Spaces and Mental Health: New Evidence and Perspectives for Action; WHO Regional Office for Europe: Copenhagen, Denmark, 2021. [Google Scholar]
  50. Yao, T.; Lin, W.; Bao, Z.; Zeng, C. Natural or balanced? The physiological and psychological benefits of window views with different proportions of sky, green space, and buildings. Sustain. Cities Soc. 2024, 104, 105293. [Google Scholar] [CrossRef]
  51. Kaparias, I.; Hirani, J.; Bell, M.G.H.; Mount, B. Pedestrian Gap Acceptance Behavior in Street Designs with Elements of Shared Space. Transp. Res. Rec. 2016, 2586, 17–27. [Google Scholar] [CrossRef]
  52. Zhao, W.; Tan, L.; Niu, S.; Qing, L. Assessing the Impact of Street Visual Environment on the Emotional Well-Being of Young Adults through Physiological Feedback and Deep Learning Technologies. Buildings 2024, 14, 1730. [Google Scholar] [CrossRef]
  53. Amleh, D.; Halawani, A.; Haj Hussein, M. Simulation-Based Study for Healing Environment in Intensive Care Units: Enhancing Daylight and Access to View, Optimizing an ICU Room in Temperate Climate, the Case Study of Palestine. Ain Shams Eng. J. 2023, 14, 101868. [Google Scholar] [CrossRef]
  54. Akalin, A.; Yildirim, K.; Wilson, C.; Kilicoglu, O. Architecture and engineering students’ evaluations of house façades: Preference, complexity and impressiveness. J. Environ. Psychol. 2009, 29, 124–132. [Google Scholar] [CrossRef]
  55. Hovy, E.H. What Are Sentiment, Affect, and Emotion? Applying the Methodology of Michael Zock to Sentiment Analysis. In Language Production, Cognition, and the Lexicon; Springer: Cham, Switzerland, 2015; pp. 13–24. [Google Scholar] [CrossRef]
  56. Cambria, E. Affective Computing and Sentiment Analysis. IEEE Intell. Syst. 2016, 31, 102–107. [Google Scholar] [CrossRef]
  57. Yadollahi, A.; Shahraki, A.G.; Zaiane, O.R. Current State of Text Sentiment Analysis from Opinion to Emotion Mining. ACM Comput. Surv. 2017, 50, 1–33. [Google Scholar] [CrossRef]
  58. Cambria, E.; Das, D.; Bandyopadhyay, S.; Feraco, A. Affective Computing and Sentiment Analysis. In A Practical Guide to Sentiment Analysis; Springer: Cham, Switzerland, 2017; pp. 1–10. [Google Scholar] [CrossRef]
  59. Hu, G.; Lu, G.; Zhao, Y. FSS-GCN: A Graph Convolutional Networks with Fusion of Semantic and Structure for Emotion Cause Analysis. Knowl.-Based Syst. 2021, 212, 106584. [Google Scholar] [CrossRef]
  60. Ye, Y.; Zhang, Z.; Zhang, X.; Zeng, W. Human-Scale Quality on Streets: A Large-Scale and Efficient Analytical Approach Based on Street View Images and New Urban Analytical Tools. Urban Plan. Int. 2019, 34, 18–27. [Google Scholar] [CrossRef]
  61. Nagata, S.; Nakaya, T.; Hanibuchi, T.; Amagasa, S.; Kikuchi, H.; Inoue, S. Objective scoring of streetscape walkability related to leisure walking: Statistical modeling approach with semantic segmentation of Google Street View images. Health Place 2020, 66, 102428. [Google Scholar] [CrossRef] [PubMed]
  62. Ewing, R.; Handy, S. Measuring the Unmeasurable: Urban Design Qualities Related to Walkability. J. Urban Des. 2009, 14, 65–84. [Google Scholar] [CrossRef]
  63. Zheng, X.; Amemiya, M. Method for Applying Crowdsourced Street-Level Imagery Data to Evaluate Street-Level Greenness. Isprs Int. J. Geo-Inf. 2023, 12, 108. [Google Scholar] [CrossRef]
  64. Pendola, R.; Gen, S. Does “Main Street” Promote Sense of Community? A Comparison of San Francisco Neighborhoods. Environ. Behav. 2008, 40, 545–574. [Google Scholar] [CrossRef]
  65. Harvey, C.; Aultman-Hall, L.; Hurley, S.E.; Troy, A. Effects of skeletal streetscape design on perceived safety. Landsc. Urban Plan. 2015, 142, 18–28. [Google Scholar] [CrossRef]
  66. Ramirez, T.; Hurtubia, R.; Lobel, H.; Rossetti, T. Measuring heterogeneous perception of urban space with massive data and machine learning: An application to safety. Landsc. Urban Plan. 2021, 208, 104002. [Google Scholar] [CrossRef]
  67. Gonzalez, D.; Rueda-Plata, D.; Acevedo, A.B.; Duque, J.C.; Ramos-Pollán, R.; Betancourt, A.; García, S.J.B. Environment, Automatic detection of building typology using deep learning methods on street level images. Build. Environ. 2020, 177, 106805. [Google Scholar] [CrossRef]
  68. Chen, L.-C.; Papandreou, G.; Kokkinos, I.; Murphy, K.; Yuille, A.L. DeepLab: Semantic Image Segmentation with Deep Convolutional Nets, Atrous Convolution, and Fully Connected CRFs. IEEE Trans. Pattern Anal. Mach. Intell. 2018, 40, 834–848. [Google Scholar] [CrossRef] [PubMed]
  69. Chen, L.-C.; Zhu, Y.; Papandreou, G.; Schroff, F.; Adam, H. Encoder-decoder with atrous separable convolution for semantic image segmentation. In Proceedings of the European Conference on Computer Vision (ECCV), Munich, Germany, 8–14 September 2018; pp. 801–818. [Google Scholar]
  70. Moran, P.A.P. The Interpretation of Statistical Maps. J. R. Stat. Soc. Ser. B 1948, 10, 243–251. [Google Scholar] [CrossRef]
  71. Lu, Y. Using Google Street View to Investigate the Association between Street Greenery and Physical Activity. Landsc. Urban Plan. 2019, 191, 103435. [Google Scholar] [CrossRef]
  72. Badrinarayanan, V.; Kendall, A.; Cipolla, R. SegNet: A Deep Convolutional Encoder-Decoder Architecture for Image Segmentation. IEEE Trans. Pattern Anal. Mach. Intell. 2017, 39, 2481–2495. [Google Scholar] [CrossRef] [PubMed]
  73. Shao, Y.; Yin, Y.; Xue, Z.; Ma, D. Assessing and Comparing the Visual Comfort of Streets across Four Chinese Megacities Using AI-Based Image Analysis and the Perceptive Evaluation Method. Land 2023, 12, 834. [Google Scholar] [CrossRef]
  74. Jiang, X.; Larsen, L.; Sullivan, W. Connections Between Daily Greenness Exposure and Health Outcomes. Int. J. Environ. Res. Public Health 2020, 17, 3965. [Google Scholar] [CrossRef]
Figure 1. Research framework.
Buildings 14 02849 g001
Figure 2. Campus environment image collection area of YLMNUSTTC, Changsha.
Buildings 14 02849 g002
Figure 3. Flowchart for building the emotional platform.
Buildings 14 02849 g003
Figure 4. DeepLab v3+ model.
Buildings 14 02849 g004
Figure 5. Extracted presentation of six types of spatial elements.
Buildings 14 02849 g005
Figure 6. Map of mood prediction on university campuses.
Buildings 14 02849 g006
Figure 7. Local autocorrelation cluster analysis.
Buildings 14 02849 g007
Figure 8. Result of Getis-Ord Gi* statistic that shows the hot and cold spot for each mood indicator.
Buildings 14 02849 g008
Figure 9. Characteristic importance of perceived emotional impact of environmental elements on university campuses.
Buildings 14 02849 g009
Figure 10. Randomly selected images for result validation.
Buildings 14 02849 g010
Figure 11. Campus environment and mood score results.
Buildings 14 02849 g011
Table 1. Comparison of the average accuracy of prediction models.
XGBoostRandom ForestKNNBP Neural Network
Accuracy (%)70.6160.4060.7562.07
Table 2. XGBoost model predictions for mean accuracy, precision, recall, F1.
SecurityDepressionDisappointmentRelaxationHappinessConcentration
Accuracy (%)70.4575.7969.8977.4268.7561.36
Precision (%)67.3978.5765.9076.6071.4260.42
Recall (%)73.8070.2169.0478.2668.6365.91
F1 (%)70.4574.1567.4477.4270.0063.04
Table 3. Relationship between Z-score, p-value, and significance.
Z-Score p-Value Confidence Level
<−1.65 or >+1.65<0.1090 percent
<−1.96 or >+1.96<0.0595 percent
<−2.58 or >+2.58<0.0199 percent
Table 4. Global Moran’s I.
Global Moran’s I Indexp-ValueZ-ScoreConfidence CoefficientPattern
Happiness0.1736870.00000044.97291699 per centClustered
Concentration0.2877640.00000074.49348399 per centClustered
Disappointment0.3292390.00000085.22657999 per centClustered
Depression0.3790170.00000098.10798699 per centClustered
Security0.1648290.00000042.68049799 per centClustered
Relaxation0.2282210.00000059.08510899 per centClustered
Disclaimer/Publisher’s Note: The statements, opinions and data contained in all publications are solely those of the individual author(s) and contributor(s) and not of MDPI and/or the editor(s). MDPI and/or the editor(s) disclaim responsibility for any injury to people or property resulting from any ideas, methods, instructions or products referred to in the content.

