Article

Efficiency Comparison between Simplified and Advanced Evacuation Analysis Models: A Case Study of Guryong Station, Republic of Korea

1
i CAPTAIN Co., Ltd., Incheon 22146, Republic of Korea
2
Department of Naval Architecture and Ocean Engineering, Chonnam National University, Yeosu 59626, Republic of Korea
*
Author to whom correspondence should be addressed.
Buildings 2024, 14(9), 2859; https://doi.org/10.3390/buildings14092859
Submission received: 24 July 2024 / Revised: 26 August 2024 / Accepted: 9 September 2024 / Published: 10 September 2024
(This article belongs to the Section Architectural Design, Urban Science, and Real Estate)

Abstract

:
Modern subway systems have increased in size and complexity, and this growth presents significant challenges for planners of emergency evacuations. In this study, the effectiveness of the simplified and advanced evacuation analysis methods recommended by the International Maritime Organization (IMO) are evaluated for Guryong Station in Seoul, South Korea. The simplified evacuation analysis method facilitates rapid assessments by using general parameters, while the advanced evacuation analysis entails performing detailed simulations of human behavior and physical interactions. Our findings indicate that the results of the simplified evacuation analysis method are reasonably close to those of the more time-consuming advanced evacuation analysis method, thereby demonstrating the practical applicability of the former method for conducting initial evacuation safety assessments. Specifically, both the simplified and advanced methods showed a 20% reduction in Total Evacuation Time when tunnel evacuation routes were utilized. This finding demonstrates that the simplified method can produce results comparable to the advanced method, making it a reliable tool for initial assessments and for evaluating alternative strategies to reduce evacuation time. By demonstrating that the simplified evacuation analysis method can yield reliable results, we provide valuable insights for developing smart, resilient cities with efficient emergency-response capabilities.

1. Introduction

Subways are convenient, punctual, and relatively safe compared to cars, buses, and other means of transportation. However, by nature, subways operate in underground tunnels, which poses significant risks during emergencies such as fires and can potentially lead to large-scale casualties. Modern subways have increased in size and depth to accommodate growing urban populations, which makes evacuation and rescue operations more challenging. Crowded trains and platforms can cause congestion and confusion, which may reduce the speed of evacuation and elevate the associated risks [1,2,3].
Historical incidents have highlighted the severity of subway disasters. In 1995, a fire caused by an electrical short circuit in Baku, Azerbaijan, resulted in 289 deaths and 270 injuries because subway compartment doors failed to open. Similarly, the 2003 subway arson incident in Daegu, South Korea, led to 192 deaths and 148 injuries, making it the second deadliest subway accident after Baku [4]. The factors common to both incidents were fire and malfunctioning compartment doors [5,6]. In 1903, a fire in the Paris subway killed 84 people owing to inadequate disaster prevention and response systems. In 1987, a fire in the London subway caused by a discarded match resulted in 31 deaths. While the accident rates of subways are lower than those of other transportation modes, these examples illustrate that the potential for significant casualties necessitates thorough analyses of safety and evacuation measures.
In general, buildings incorporate evacuation and fire protection designs to ensure safe and rapid evacuation during disasters such as fires. However, these designs alone are not sufficient to guarantee enough evacuation time for protecting lives. Therefore, it is essential to predict and analyze evacuation times by setting various scenarios during the design phase. This process helps determine an appropriate evacuation structure tailored to the building’s purpose and scale. Through this evacuation analysis, the optimal evacuation routes can be designed, minimizing casualties in real disaster situations.
While previous studies have explored subway evacuation dynamics using advanced simulations, there remains a gap in understanding whether simplified evacuation methods can produce similarly reliable results, especially in complex environments like deep, multi-level subway stations. This study aims to fill that gap by comparing the effectiveness of simplified and advanced evacuation methods in a subway setting. Specifically, the focus is on determining whether the simplified method can be used to assess evacuation safety and alternative evacuation strategies without the need for complex simulations.
In this study, the evacuation methods available at Guryong Station in Seoul, Korea, are evaluated using the simplified and advanced evacuation analysis methods proposed by the International Maritime Organization [7]. Guryong Station is a 40 m deep subway station with six underground levels and a double-track platform structure. Owing to the sharp curve of this station, a large gap is formed between the platform and the train. In 2023, the average daily user count of this station was 4737. Figure 1 illustrates external and internal views of Guryong Station. Guryong Station was selected for this study due to its complex structure, with six underground levels and a double-track platform, which reflects typical challenges in modern subway systems. The station’s long corridors, multiple stairways, and potential bottlenecks make it an ideal candidate for testing both simplified and advanced evacuation models. With over 4700 daily passengers and significant peak-hour congestion, the station provides a relevant setting to evaluate the effectiveness of evacuation strategies, offering insights that could apply to similar urban subway systems.
Although the IMO-recommended evacuation analysis methods have been developed for passenger ships, their application to subways is expected to yield valid results owing to the common focus on occupant safety. This study aims to contribute to the literature on subway evacuation safety by analyzing and comparing these two methods, thereby emphasizing the importance of rigorous evacuation safety planning in subway systems.

2. Related Research

Recent studies on the evacuation analysis of subway stations have focused on the use of complex simulation techniques to predict evacuation dynamics under various emergency scenarios [8]. These studies have covered diverse factors, including the architecture of subway stations [9], unpredictability of human behavior during emergencies [10,11,12], and technical aspects of emergency response measures [13]. Detailed simulations, while providing valuable insights into evacuation processes, can be complex and require substantial resources. Their reliance on domain expertise and high computational power significantly increases the time and cost involved.
In response to these challenges, a pivotal question arises: Could a simplified approach to estimating Total Evacuation Times serve as a more feasible alternative? By reducing data granularity and computational demands, the simplified evacuation analysis method could significantly enhance the practicality and implementation speed of evacuation measures across more diverse types of subway stations. This method aims to optimize the trade-off between detail and accessibility, thereby serving as a scientifically sound method that is more readily deployable. The simplified evacuation analysis method, inspired by the maritime evacuation planning techniques developed by the IMO, is an appealing framework for adaptation [7]. This method approximates evacuation times through straightforward calculations while using minimal inputs, thereby bypassing the need for time-consuming computational simulations [14].
The greatest advantage of the simplified evacuation analysis method is its ability to quickly provide reasonably accurate estimates for initial planning and rapid assessments without delving into every detail. If the Total Evacuation Times predicted through computer simulations and those calculated using the simplified evacuation analysis method are reasonably similar, the simplified approach could be used actively in the initial planning phase of subway evacuations.
Therefore, this study compares the Total Evacuation Times calculated using both the simplified and advanced evacuation analysis methods in the case of Guryong Station, South Korea, which, to the author’s best knowledge, has not yet been attempted in subway evacuation research. Section 3.1 describes the simplified evacuation analysis method based on IMO MSC.1/Circ.1533 and its application to calculate the Total Evacuation Time at Guryong Station. Section 3.2 explains the advanced evacuation analysis method based on IMO MSC.1/Circ.1533 and its application to calculate the Total Evacuation Time; subsequently, the results obtained using the two methods are compared. The comparison indicates that although the assumptions underlying the simplified evacuation analysis method lead to some discrepancies relative to the times calculated using the advanced evacuation analysis method, the errors are within a reasonable range. Therefore, the simplified evacuation analysis method is deemed suitable for use in the initial planning stages.

3. International Maritime Organization Method for Analyzing Crowd Evacuation

In September 1994, the roll-on/roll-off passenger ship Estonia sank in Northern Europe, resulting in the deaths of 852 people. This incident prompted the IMO to develop guidelines for passenger evacuation analysis in 1999. Currently, all passenger ships must comply with SOLAS and IMO regulations, including means-of-escape analysis and evacuation analysis. The primary goals of these regulations are to calculate the time required for passengers to escape along designated routes during an emergency and to identify and eliminate bottlenecks.
The IMO regulations account for both the simplified and advanced evacuation analysis methods. The simplified evacuation analysis facilitates quick assessments but does not consider the characteristics of individual passengers, which makes it less realistic. To address these limitations, the advanced evacuation analysis method uses computer simulations to account for the characteristics and behaviors of individual passengers. While advanced evacuation analysis is not mandatory, it is recommended for complex ships [15,16]. This study applies both the simplified and advanced evacuation analysis methods to Guryong Station in Seoul, South Korea. The evacuation analyses are performed for two scenarios. In the general scenario, all occupants evacuate to the evacuation point on the top floor. In the other scenario, the occupants on the lowest floor, where the train is located, evacuate through the tunnel evacuation route.

3.1. Simplified Evacuation Analysis

The IMO framework [17,18,19] for passenger evacuation analysis includes a “simplified method” designed for computing evacuation durations and identifying potential congestion points in passenger ships. Although this method was developed for maritime applications, it can be adapted for subway station analysis.
The justification for adapting the simplified method in subway stations lies in the “fluid-dynamic similarity” principle [7], which treats the movement of people in confined spaces as fluid-like flow through corridors and stairways. This principle applies not only to the movement of passengers on ships but also to passengers in subway stations, where dense groups of people must navigate narrow, structured pathways during emergencies. Both environments require the analysis of how individuals behave in constrained spaces, where their movement patterns can be predicted based on the available space, density, and flow characteristics. Additionally, the behavior of large groups of people under emergency conditions is comparable in both ships and subways, making the method transferable between these two contexts.
Subway stations, much like passenger ships, involve clearly defined escape routes, such as stairways and corridors, which makes the fluid-dynamic similarity principle particularly relevant. Furthermore, both types of environments require the evacuation of large numbers of people through limited exit routes. This similarity makes the simplified method well suited to providing rapid estimates of evacuation times, even in subway environments. This approach simplifies the calculation of Total Evacuation Time by breaking it down into three key components:
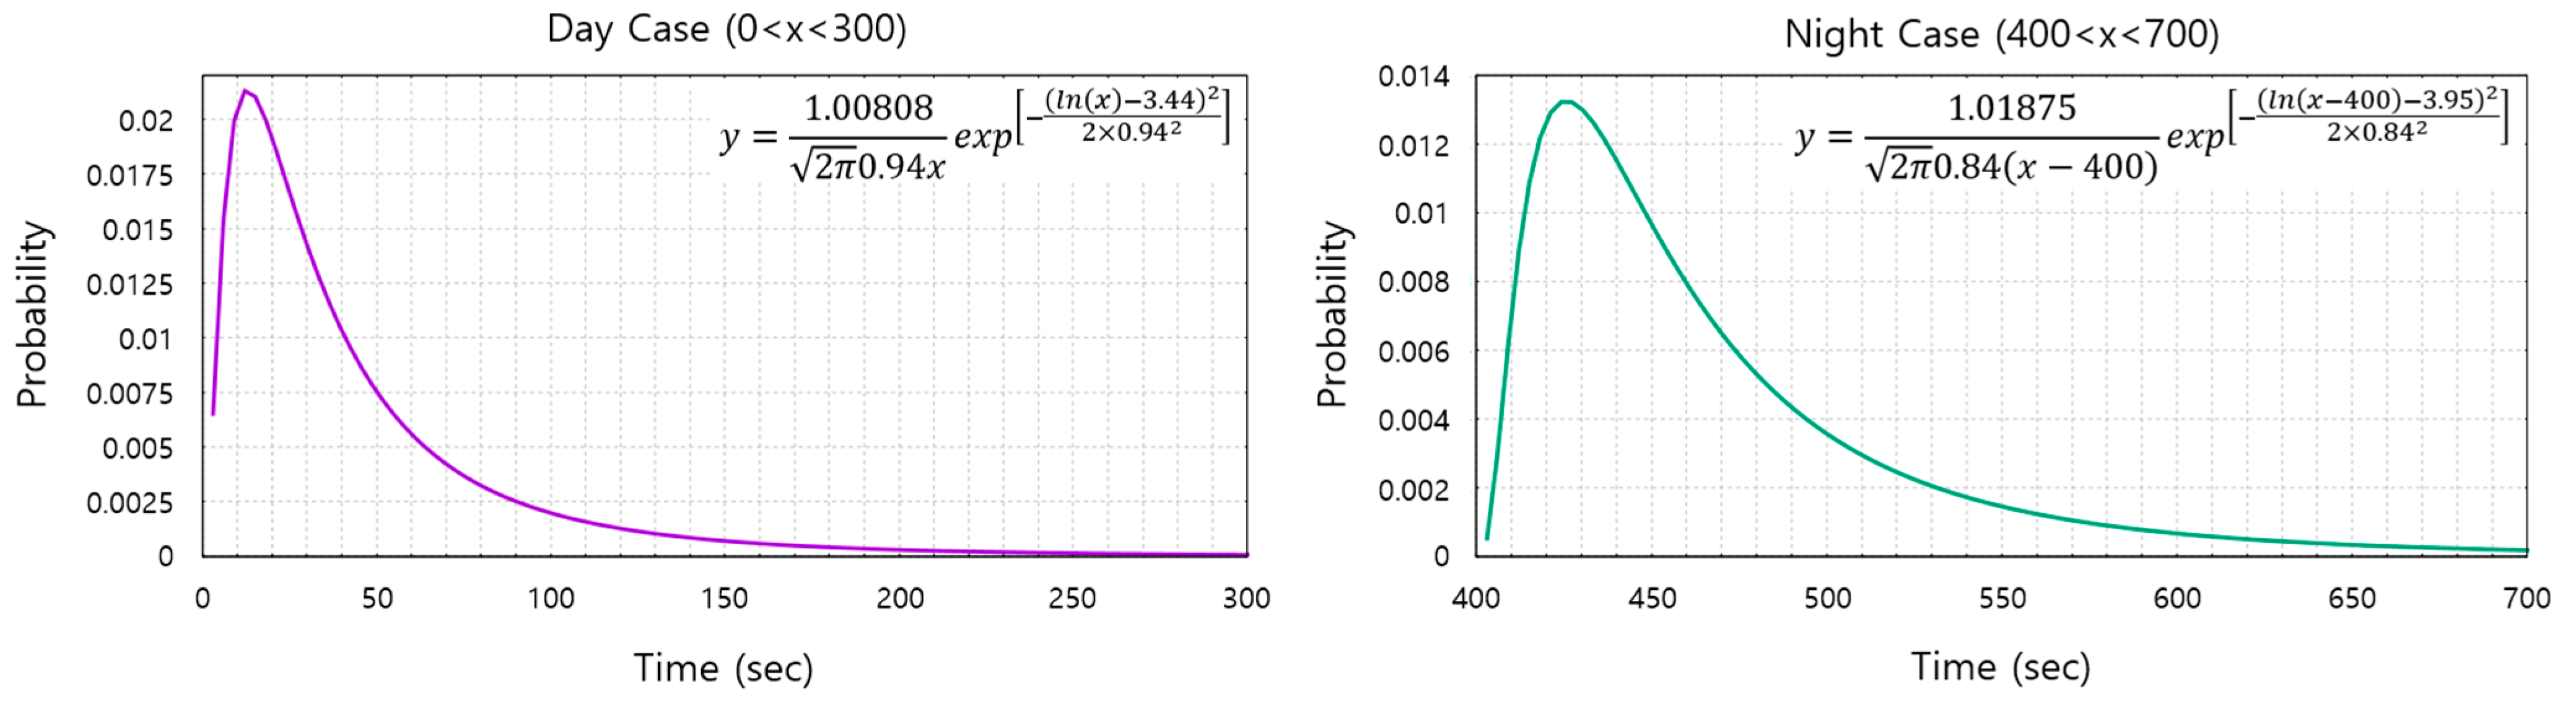
Response Duration (R): The time between the initial emergency alert and passenger movement toward exits;
Total Travel Duration (T): Movement time from passengers’ initial locations to safety exits;
Embarkation and Launching Duration (E + L): Time required for passengers to exit the station premises safely.
Embarkation and Launching Duration refer to the final stage of the evacuation process. It covers the time required for passengers to fully exit the station premises after completing their movement toward the exits. In the context of a subway evacuation, this includes any time needed for passengers to leave the building or platform area after reaching the designated exit point. In a maritime context, this would refer to passengers boarding lifeboats or other escape vessels and launching them from the ship. This phase is critical as it represents the final step of the evacuation, ensuring all occupants have successfully left the hazardous area.
It is important to differentiate Total Travel Duration (TTD) from Total Evacuation Time (TET). While TTD focuses solely on the actual travel time between a passenger’s starting point and the exit, TET covers the entire evacuation process, from the moment the emergency signal is given until the last person exits the station. Thus, TET encompasses the Response Duration (R), Total Travel Duration (TTD), and Embarkation and Launching Duration (E + L), offering a comprehensive measure of the entire evacuation process.
For subway stations, these components are adapted to focus on passenger flows through platforms, corridors, and exits. The Total Travel Duration (T) is governed by several parameters:
Clear Width (Wc): Accessible space for movement in corridors, stairways, and doorways;
Initial Density of Persons (D): Concentration of individuals within a given area;
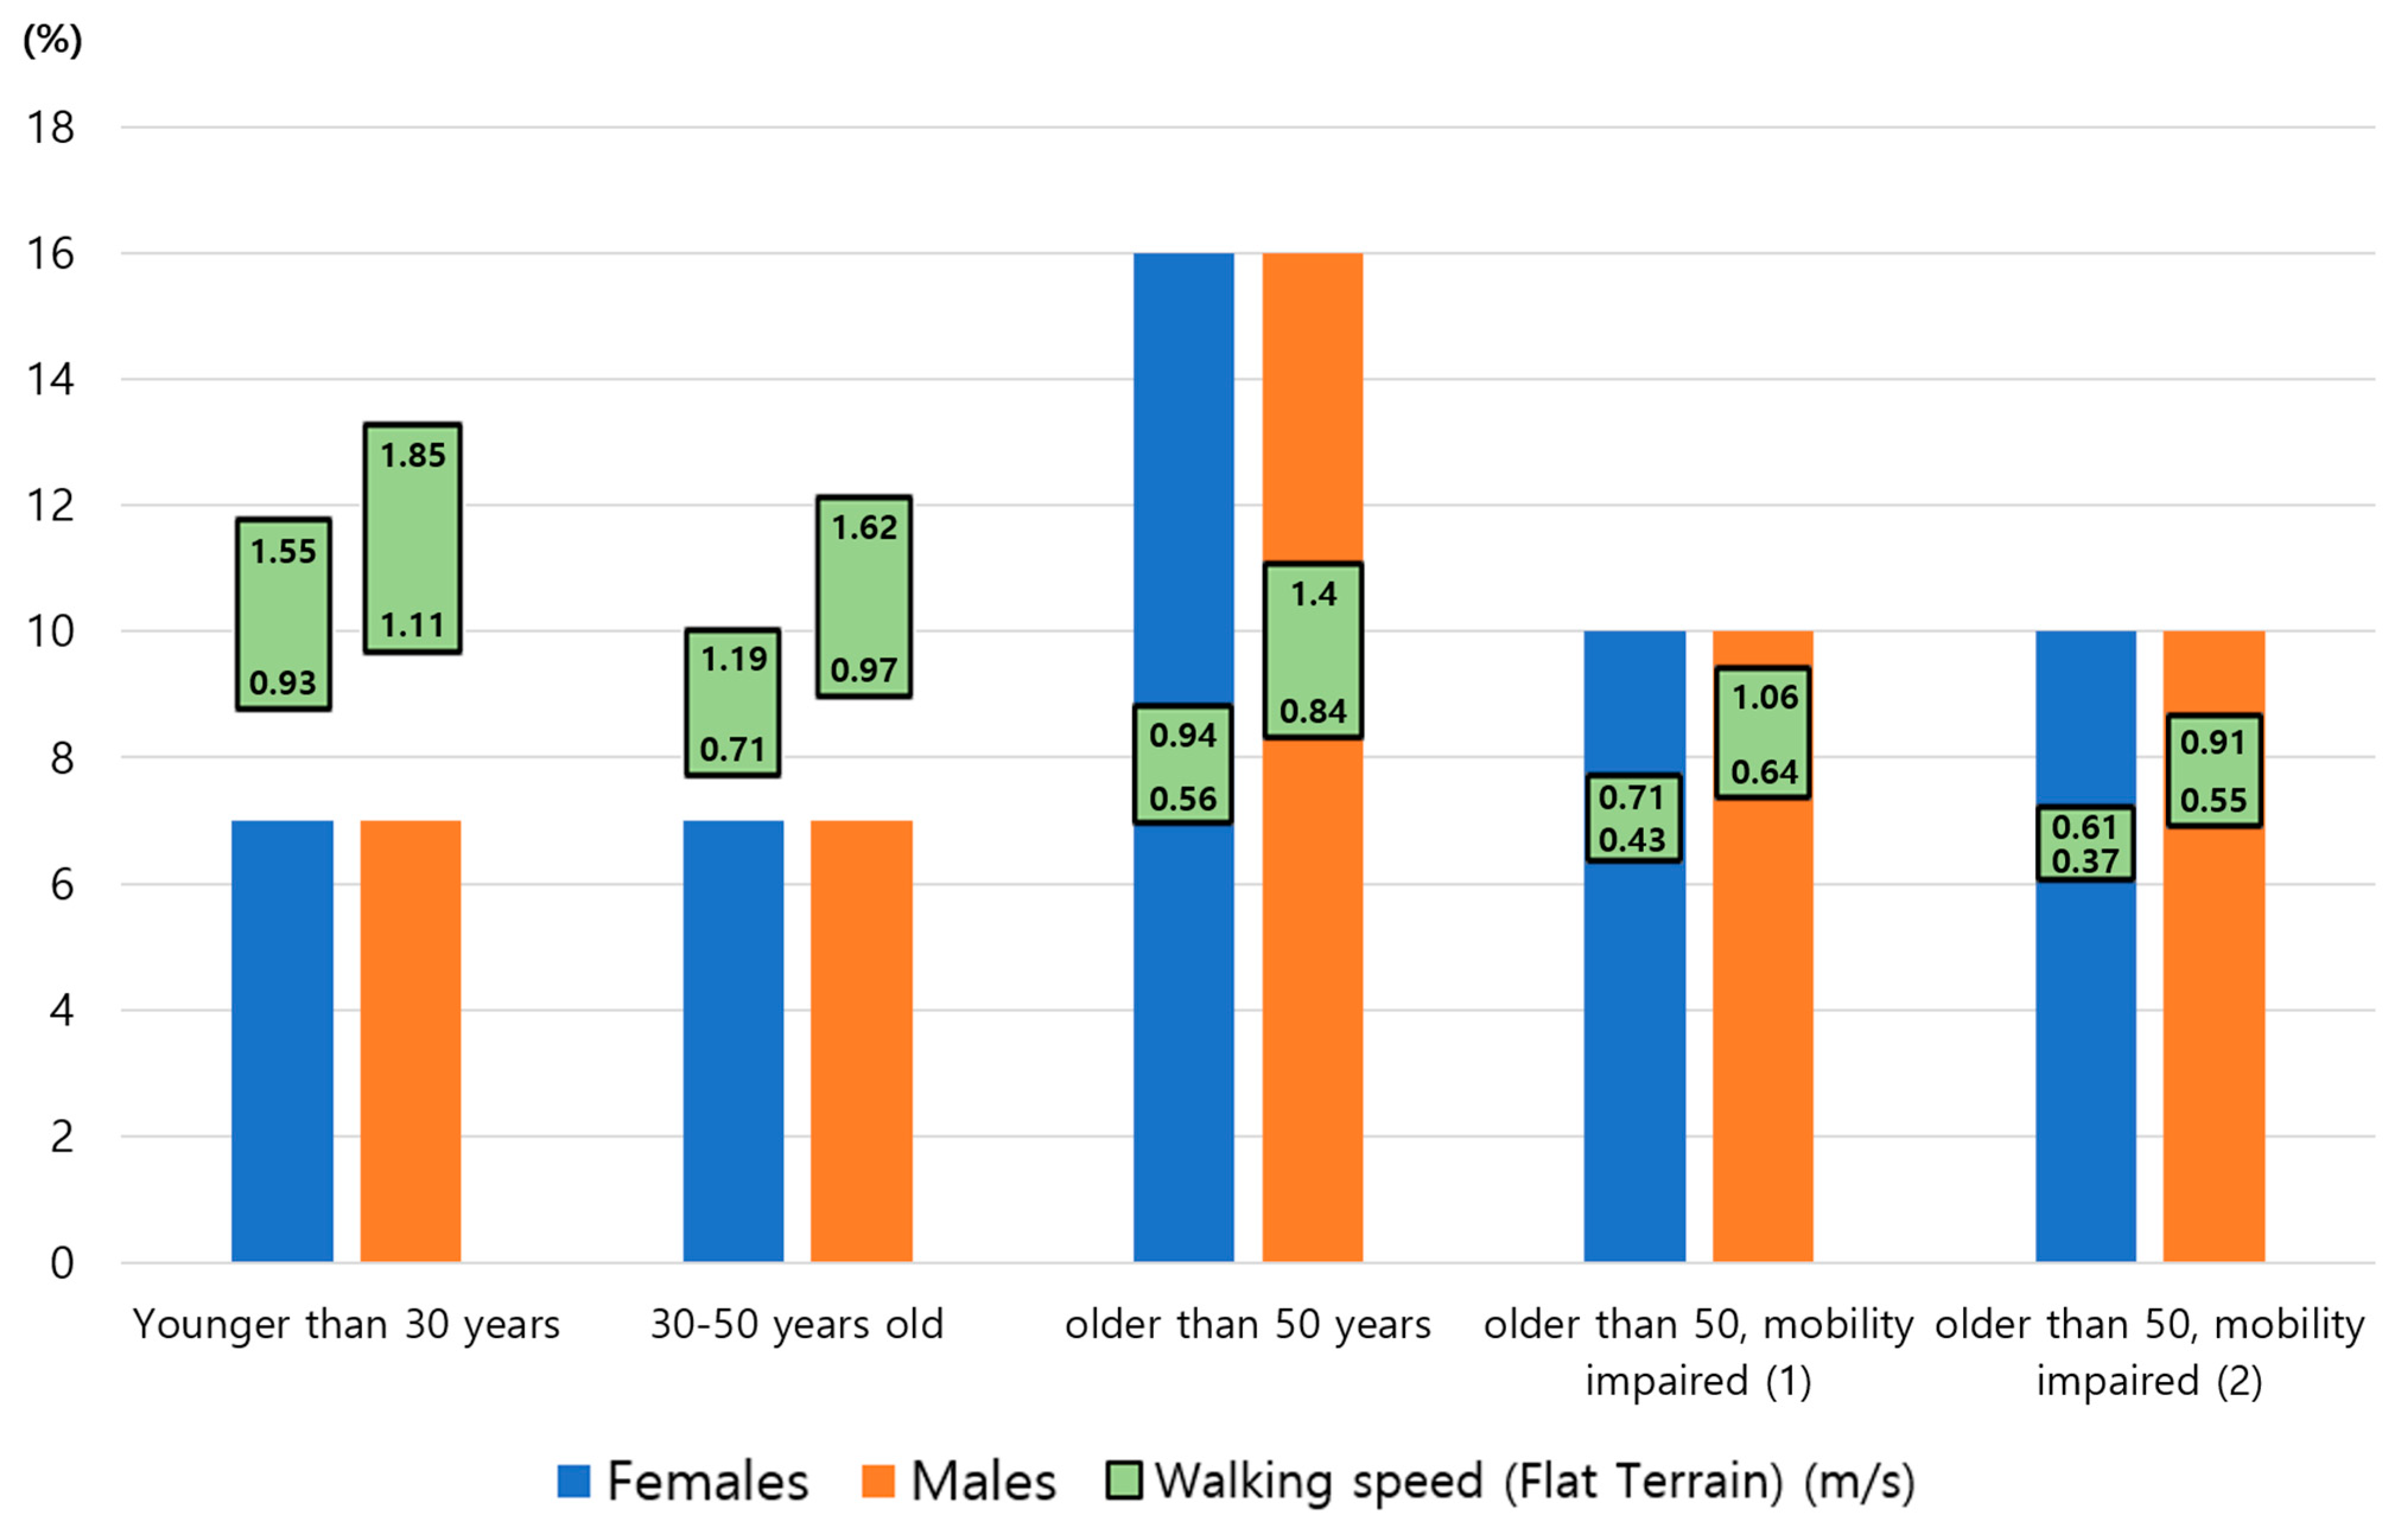
Speed of Persons (S): Movement speed of people based on escape route characteristics and crowd density;
Specific Flow of Persons (Fs): Rate of individuals passing a specific point; this parameter is influenced by Wc and the type of escape route.
The Total Travel Duration is calculated by aggregating the times required to pass through different segments of the evacuation path:
Flow Duration (tF): The time needed for passengers to pass through a specific point in the evacuation route;
Deck Travel Duration (tdeck): Time needed for passengers to move from the farthest point on the deck to the nearest stairway;
Stairway Travel Duration (tstair): Time needed for passengers to climb down or up stairways;
Assembly Travel Duration (tassembly): Time needed for passengers to move from the end of the stairway to the assigned assembly station or final exit.
While the simplified method includes correction factors γ (gamma) and δ (delta) to account for real-world conditions like counterflow and uncertainties in passenger behavior, we intentionally omitted these factors in certain scenarios to focus on ideal travel times (tI). The decision to omit these correction factors was driven by the following considerations:
γ (general uncertainties): This factor adjusts for variability in passenger movement. However, we excluded it to allow for a cleaner comparison between the simplified and advanced methods, focusing solely on key variables such as corridor width and distance traveled.
δ (counterflow correction): This factor accounts for delays caused by opposing flows of people. In scenarios where movement was expected to be unidirectional, such as the use of tunnel evacuation routes, this factor was not applied to highlight the effects of simplified evacuation paths without added complexity.
Therefore, the Total Travel Duration T for any given evacuation scenario is calculated as follows:
T = tI = tF + tdeck + tstair + tassembly
where tI is the ideal travel time calculated as the sum of tF, tdeck, tstair, and tassembly.
The procedure schematically represents escape routes akin to a hydraulic network to facilitate precise calculations of person flows and transition management through the following steps:
A. Estimation of initial and maximum specific flow rates (Fs) by using predefined tables based on the density and type of facility.
B. Calculation of Flow of Persons (Fc), which reflects the anticipated volume of individuals navigating through each segment of the escape route per unit time.
C. Evaluation of Flow Duration (tF), which represents the total time required for all individuals to pass a specific point; this is essential for identifying potential delays.
D. Quantification of Travel Duration; aggregation of Flow Durations, movement through decks, stairways, and assembly areas; and subsequent application of correction factors to accommodate for practical challenges such as counterflows.
This structured approach to travel duration calculation provides a practical and adaptable method for subway station evacuation analysis. By applying this method, it is possible to systematically estimate evacuation times, identify potential congestion points, and design evacuation strategies that ensure the safety and efficiency of passenger flows during emergencies. The simplified model is particularly sensitive to the width of escape routes, such as stairs and corridors, and the population occupying these areas, as these factors significantly impact route density. Route density, in turn, governs the flow rate and evacuation time, making it a critical determinant in simplified evacuation models.
Moving forward, we explore the application of the simplified evacuation analysis method to the evacuation analysis of Guryong Station. We intentionally omit the correction factors γ and δ to focus on tI (travel time under ideal conditions). Guryong Station spans six underground floors. The subway platform is located on the sixth floor, which is the lowest floor, and the primary evacuation area is on the first floor, which is the highest floor. Our analysis covers two distinct emergency scenarios:
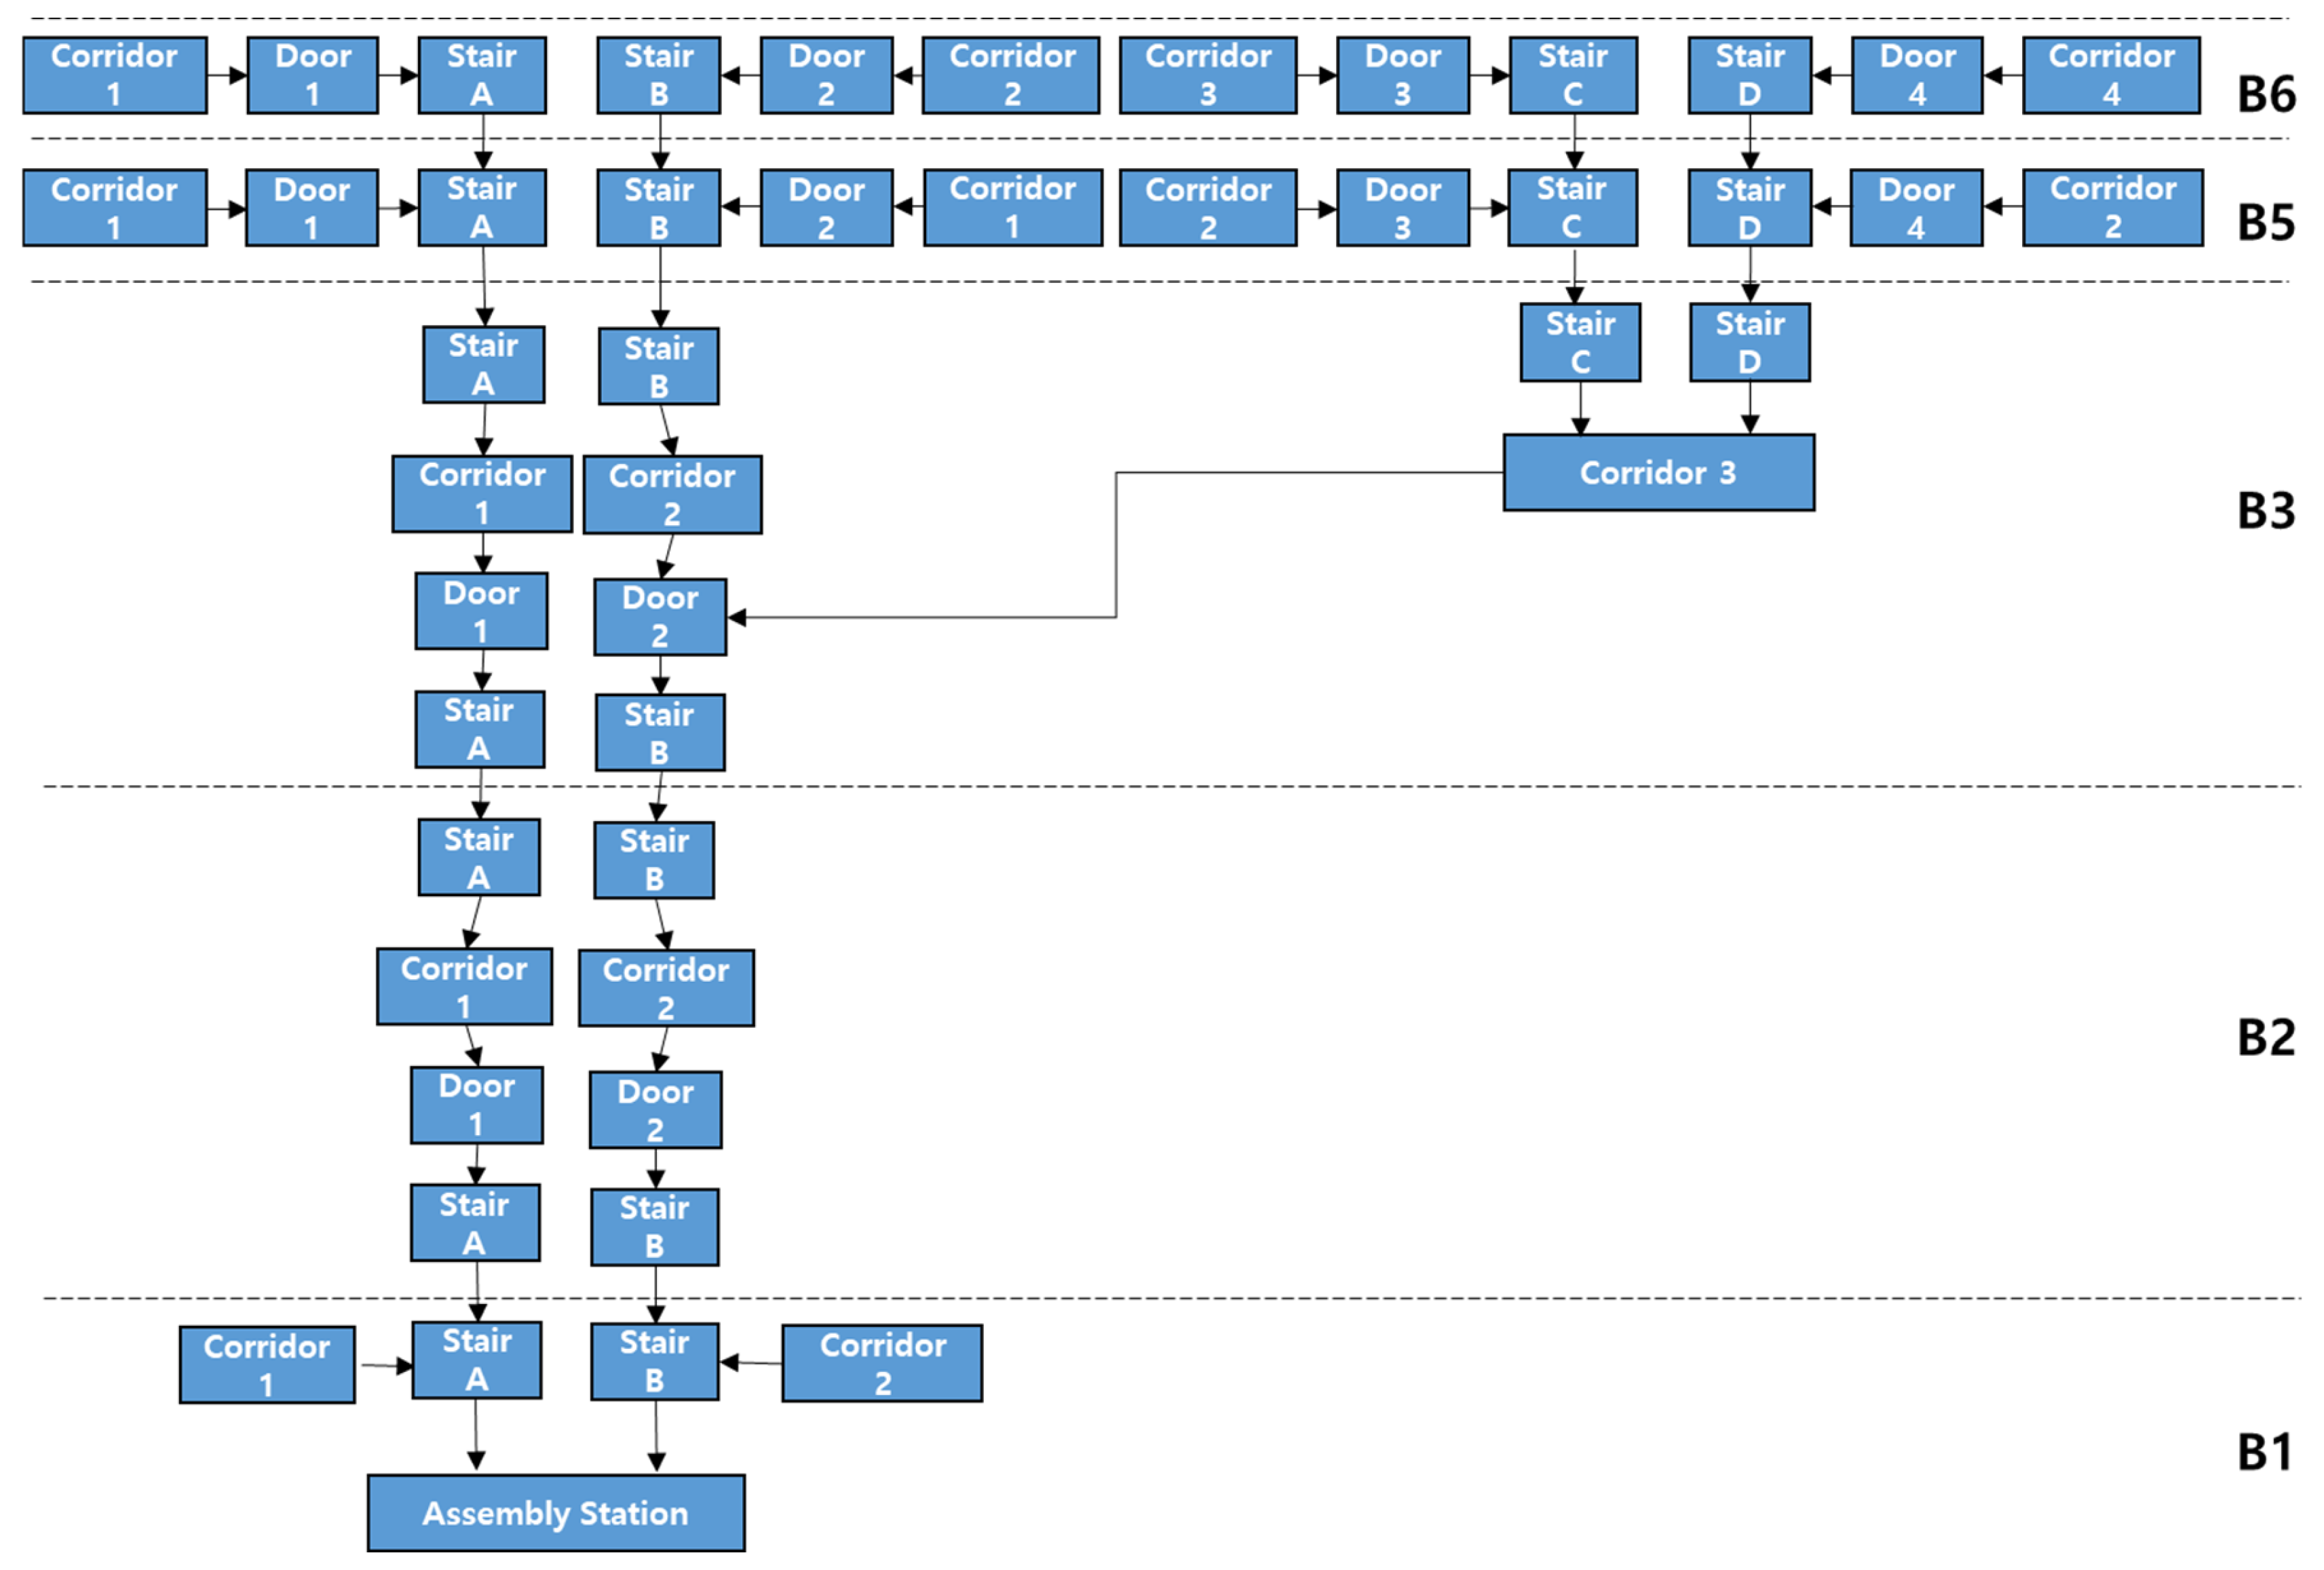
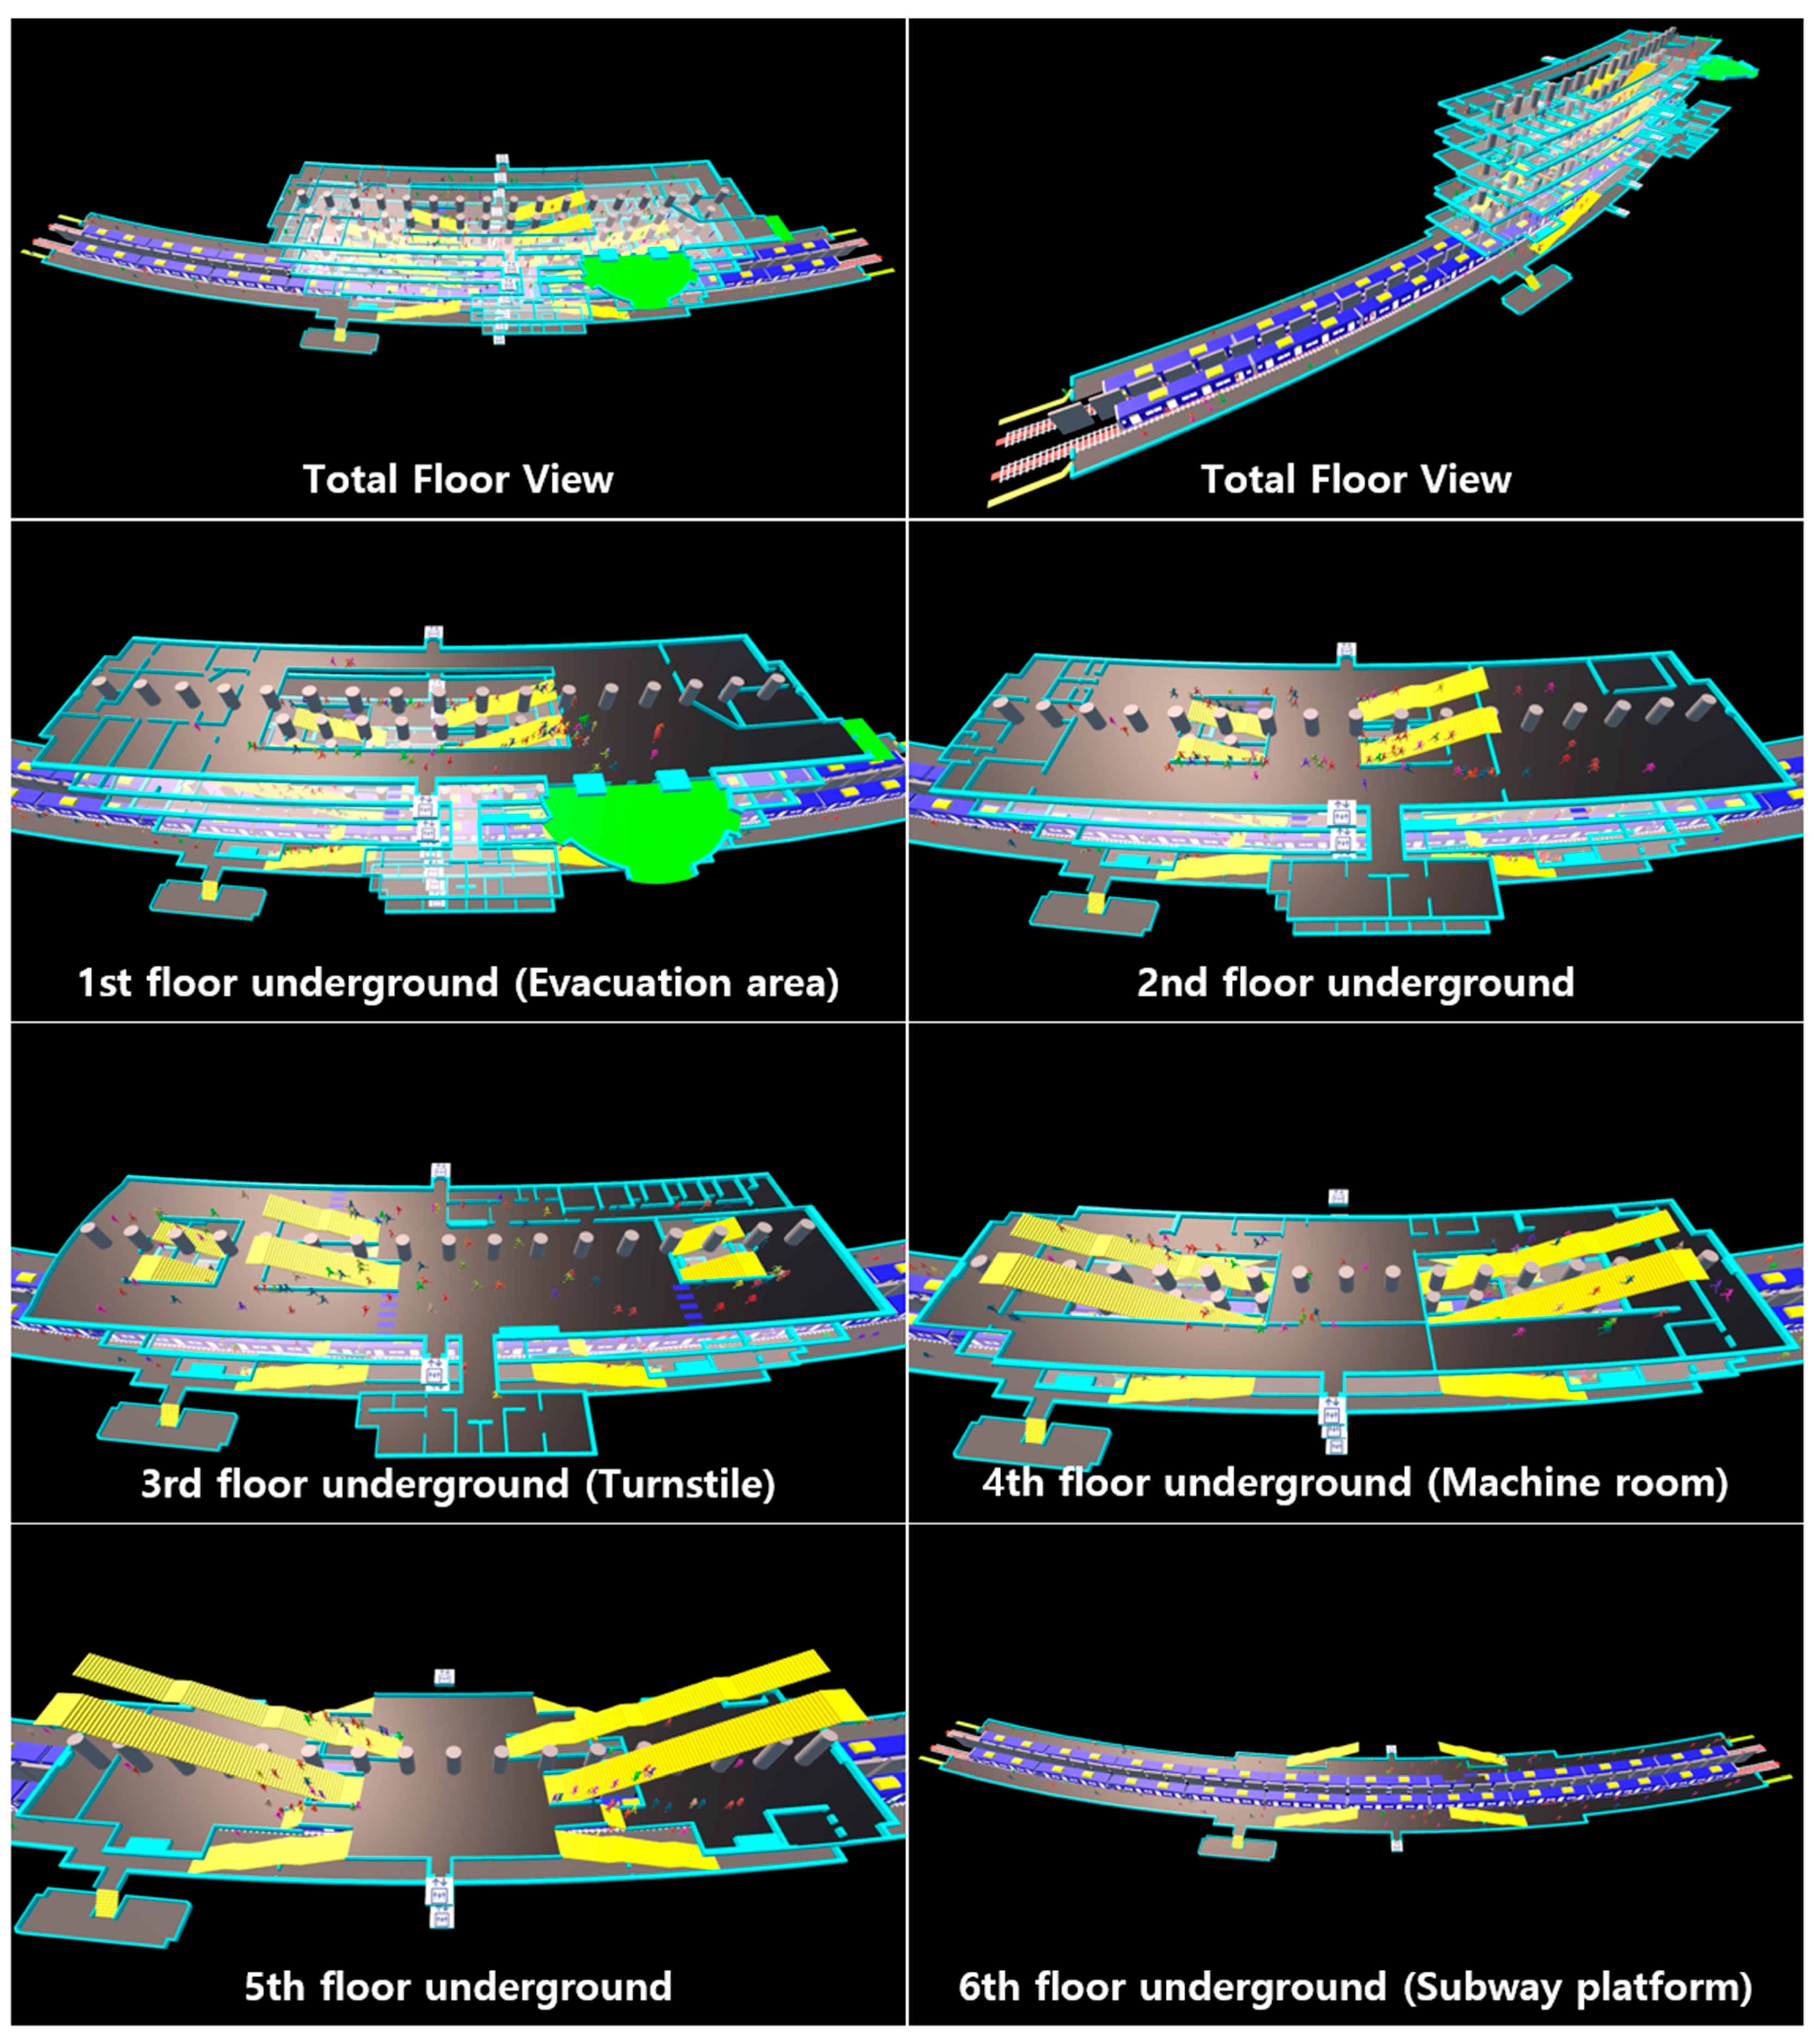
CASE1: All individuals move toward the primary evacuation area on the first floor.
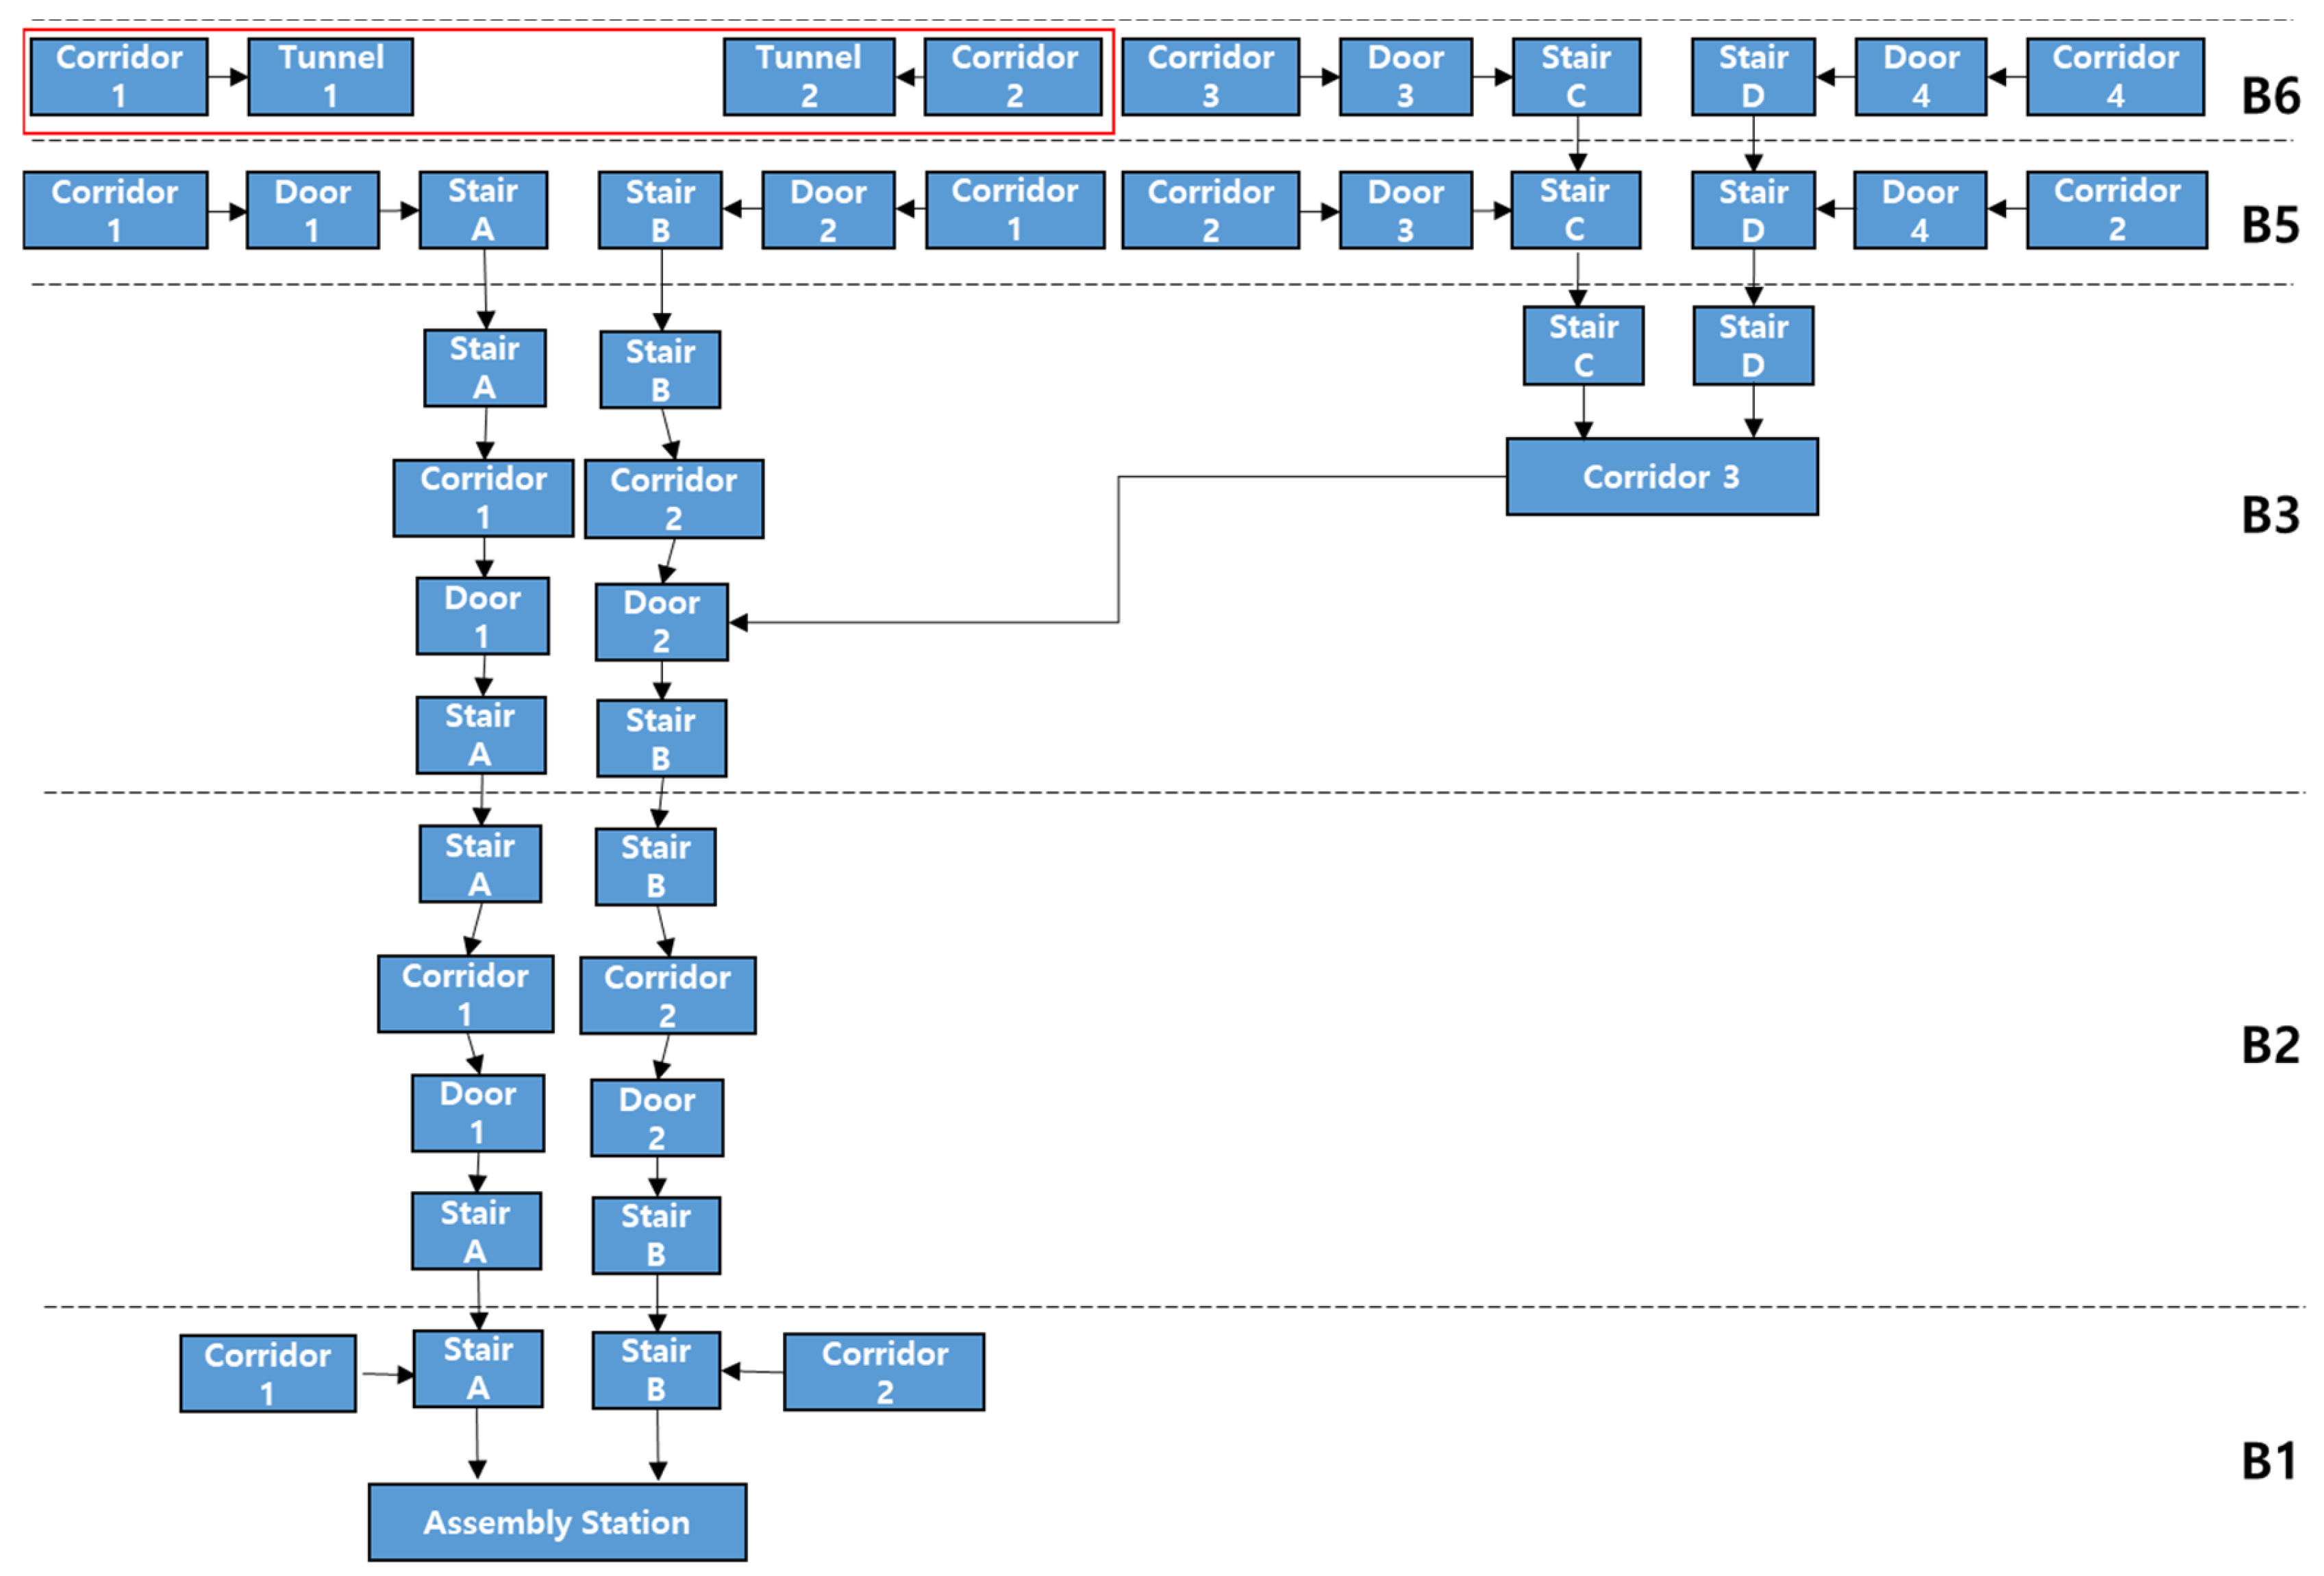
CASE2: Two additional evacuation paths (tunnels) on the sixth floor offer near-corridor occupants an alternative route, while the other people proceed to the first floor via stairs.
The comparative approach used herein aims to determine whether the evacuation times computed using the simplified evacuation analysis method are close to those projected using the simulation-based advanced evacuation analysis and to evaluate the effects of strategic alterations, such as tunnel additions, on evacuation efficiency. In Guryong Station, the fourth floor houses the machine room, which is not accessible to passengers, and the third and fifth floors are connected directly through a stairway. Considering this layout, we distribute a hypothetical population of 500 people evenly across floors 1, 2, 3, 5, and 6. Owing to the unique configuration of the sixth floor, it is challenging to distinguish specific corridor areas. To obtain conservative travel length estimates, we consider the farthest points from stair access and use the Clear Width in our calculations. Schematizations of the evacuation scenarios corresponding to CASE1 and CASE2, simplified considering the escape routes in the station, are illustrated in Figure 2 and Figure 3, respectively. By examining these scenarios, we aim to assess the practicality of applying the simplified evacuation analysis method to urban transit environments and explore its capacity to enhance evacuation planning through systematic analysis and meaningful infrastructure modifications.
The calculation process is as follows. First, based on the layout analysis, the widths and lengths of the corridors are used to calculate the population density in the identified escape routes. The initial specific flow and initial Speed of Persons applicable to this population density are determined from Table 1. The initial specific flow at a doorway or stairway entrance is calculated using the sum of paths and effective width (Wc) of the current path; the maximum applicable values of specific flow for corridors, doorways, and stairway entrances are listed in Table 2. If the calculated initial specific flow exceeds this maximum value, the maximum specific flow value set in Table 2 is adhered to, and the speed of person according to the specific flow is calculated as shown in Table 3.
For example, in CASE1, 100 people are evenly distributed across four corridors on floor B6, with each corridor having 25 people, and the width (Wc) and length of each corridor are 4 m and 110 m, respectively. The calculated initial density is 0.06 person/m2, and the initial specific flow and initial speed of person for this population density are 0.07 p/m/s and 1.2 m/s, respectively. This calculates the travel time (tdeck) through the corridor as 91.7 s, derived by dividing the travel distance (110 m) by the travel speed (1.2 m/s). As the estimated specific flow is less than the maximum specific flow, it is assumed there will be no bottleneck due to population density concentration; hence, the Flow Duration is zero. Applying this method iteratively to each escape route such as corridors, doors, and stairs allows for the calculation of the Total Evacuation Time. As illustrated in Figure 1, passengers starting from B6 travel through corridors in B6, B3, and B2, and in the case of stairs, they pass through B6, B5, B3, and B2. Thus, the travel times for each corridor and stairway are recorded as tdeck and tstair, respectively. The Flow Duration, tf, is the maximum Flow Duration noted along the entire escape route from the deck where evacuation started up to the assembly station. Additionally, the assembly time applies the calculated time it takes to reach the two evacuation areas on B1.
In CASE2, it is presumed that all individuals on floor B6 will evacuate via the additional evacuation path, the tunnel. Therefore, the evacuation calculation for the 100 people located on B6 considers only the Deck Travel Duration to the tunnel. For those located on floors B5, B3, B2, and B1, both travel duration and Flow Duration are factored into their evacuation time calculations. The estimated tI (Travel Time in Ideal Conditions) for CASE1 and CASE2 are shown in Table 4. The detailed calculation process for each case is displayed in the Appendix A. The results indicate that the Total Evacuation Time for CASE1 is calculated to be 398 s, and for CASE2, it is 275 s. In CASE1, the escape route on B6 was determined to have the longest evacuation time, while in CASE2, the escape route on B5 was found to require the most time. When comparing identical escape routes (starting from B5) between CASE1 and CASE2, a reduction of approximately 30 s was observed in CASE2. This reduction is attributed to decreased population density along the evacuation routes, which led to increased movement speeds and decreased Flow Durations in various segments. Such findings confirm that by applying the simplified method, it is feasible to systematically estimate evacuation times, pinpoint potential congestion points, and develop evacuation strategies that enhance both the safety and efficiency of passenger flow during emergencies. This reinforces the value of the simplified method as a practical tool in evacuation planning.

3.2. Advanced Evacuation Analysis

In the case of simplified evacuation analysis, it has the advantage of providing a relatively quick estimation of evacuation time during the initial design phase, thus enhancing usability. However, as the size and complexity of the building increase, it becomes highly limited as it fails to reflect the individual characteristics of occupants and detailed aspects of the structure. To obtain more realistic and reliable results, advanced evacuation analysis using computer simulations must be performed. In this section, we applied the advanced evacuation analysis proposed by the International Maritime Organization to Guryong subway station. Figure 4 illustrates the overall simulation system architecture for conducting advanced evacuation analysis. The advanced evacuation simulations were conducted using an in-house evacuation simulation tool developed by i CAPTAIN Co., Ltd. (Incheon, Republic of Korea). This specialized software is designed to model detailed evacuation dynamics in complex environments, such as subway stations, allowing for accurate scenario-based analysis.
The execution of advanced evacuation analysis can be divided into several stages. Firstly, 3D modeling for crowd simulation needs to be performed. In the 3D CAD Modeling phase, based on the blueprints, the floor, walls, and obstacles are modeled, and once the stairs, subway, and railroad are completed, areas where the crowd can evacuate are designated. In the case of Guryong Station, the top floor is composed of two evacuation areas connected to the outside. Once the modeling of each component is completed, each part is grouped and assembled, and the assembled model is ultimately exported in a CAD file format that can be used for crowd simulation. In the 3D CAD Model Pre-Processing phase, the definition of each area of the modeled CAD files is carried out. Characteristics must be given to each area so that the crowd in the simulation can recognize areas where the crowd can move and areas where it cannot move. Since the movement speed is different on flat ground and stairs, and the ascending and descending speeds are different even for the same stairs, information must be provided on the CAD file so that the crowd can recognize their current location and status. Furthermore, in order to prevent the phenomenon of the crowd passing through walls or moving too closely to walls, information regarding radius and height should also be provided. Once the information provision stage for these area characteristics is completed, the Navigation Mesh Field needs to be generated to enable the crowd in the simulation to perform pathfinding. In the crowd simulation stage, the information provided from the CAD file is reflected in the crowd, and the number of crowds generated for each area is defined. One of the greatest advantages of advanced evacuation analysis is considering individual characteristics to calculate evacuation time. Therefore, instead of applying the same characteristics to all generated crowds, Response Time, gender, age group, and their respective movement speeds are assigned differently for flat ground and ascending or descending stairs according to the regulations. Detailed information on this can be found in Appendix A, Method to determine the travel duration (T) by simulation tools for advanced evacuation analysis, as specified in IMO MSC.1/Circ.1533. The population’s composition (age and gender) and walking speed on flat terrain (e.g., corridors) provided in IMO MSC.1/Circ.1533 are illustrated in Figure 5.
Response Time refers to the time taken from when an evacuation order is issued to when the actual evacuation begins. The reasons why crowds do not respond immediately to evacuation orders may be due to a variety of factors, including complexity of situational awareness and decision-making processes, communication problems, errors in information transfer, and delays in recognition and understanding. In order to further improve the accuracy and validity of simulation results by applying these phenomena that occur in the real world, IMO MSC.1/Circ.1533 provides Response Time Distribution in the form of a lognormal distribution. Figure 6 schematizes the Response Time Distribution for night and day, respectively [20].
Due to the assumption that most people sleep at night, the Response Time Distribution is distributed differently during the day and night. For day and night, the Response Time Distribution is distributed between 0 s and 300 s and 400 s and 700 s, respectively. In the case of the subway, there is no space for occupants to sleep, and due to the nature of traffic operation, it is reasonable to assume that all occupants are awake. Therefore, in this study, the simulation was performed by applying only the Response Time distribution for the daytime. Once the application of the starting position, Response Time, gender and age was completed, each crowd was given a movement speed according to age and gender group. In the Global Navigation stage, route navigation to the destination was performed based on the starting location of the crowd.
Figure 7 shows the crowd simulation for advanced evacuation analysis at subway Guryong Station by applying the Evacuation Simulation System Architecture. In this study, path search was implemented using the A star algorithm. The A star algorithm is one of the graph search algorithms and is used to find the shortest path from the start node to the goal node. The A star algorithm is a heuristic-based algorithm that determines the path by considering the actual and estimated costs of the node, and the shortest path is guaranteed if the heuristic function does not overestimate the actual cost to the target location [21]. In the simulation stage, local navigation is performed at every time step. In the local navigation stage, crowd control and steering are performed, and collision avoidance is performed to prevent or minimize collisions between crowds. Preventing collisions between crowds is one of the characteristics of human behavior in the real world that seeks to maintain a certain distance between people in a group. Also, the Reciprocal Velocity Obstacles (RVOs) algorithm was applied as an algorithm for collision avoidance. The Reciprocal Velocity Obstacles algorithm is an algorithm for avoiding collisions between crowds in crowd simulation. It was developed to avoid collisions and implement natural movement by adjusting the speed and direction of objects in situations where multiple objects are moving simultaneously. The Reciprocal Velocity Obstacles algorithm is performed by calculating the interaction graph, interaction area, avoidance speed, and speed adjustment [22]. The crowd density stage is intended to reflect the actual phenomenon that the higher the crowd density, the lower the movement speed. It is one of the very important elements of crowd simulation because a large difference occurs in the overall simulation result depending on the reflection of movement speed changes according to crowd density. Moreover, an algorithm was applied to calculate the movement speed reduction coefficient by calculating the number of crowds included in the viewing angle of each moving crowd [23,24]. Depending on the change in crowd density and whether the current location is flat or stairs, the movement speed changes at each time step, and the simulation is performed until the destination is reached.
For the advanced simulation, simulations were performed for two cases: when all occupants of a subway station use the evacuation route on the top floor and when occupants located on the subway platform floor evacuate using the tunnel evacuation route. In the event of a train or platform fire at a deep station located more than 30 m underground, the tunnel evacuation method to evacuate passengers was analyzed to be more effective in saving lives. Unlike escaping outside by climbing the stairs, the tunnel evacuation method involves passengers using emergency ladders at both ends of the platform to get down to the tracks and then evacuating along the tracks to the nearest nearby station. If there is a vent inside the tunnel, there is a high risk of suffocation as smoke is drawn into the tunnel, and if the electricity is not turned off, there is a risk of electric shock and collision with a vehicle. Thus, it is crucial to prioritize the analysis of whether evacuation through the tunnel is feasible when designing subway station infrastructure.

4. Comparison and Analysis of Simplified and Advanced Evacuation Analysis

In this study, a population size of 500 people was used for both the simplified and advanced evacuation analyses based on realistic assumptions. Although detailed data on the highest number of passengers at Guryong Station during specific peak times were not available, this population size provides a practical basis for comparison. Both evacuation models, however, include essential factors such as walking speed reduction and specific flow adjustments based on crowd density. These factors account for the increased congestion expected during peak times and ensure that both models can scale to handle larger passenger volumes, should more data or higher population assumptions be used in future simulations. A key input for both models is the width of escape routes, which directly affects specific flow and the density of the crowd. As crowd density increases, the moving speed decreases, which can lead to bottlenecks, particularly in narrow sections like doorways and stairways. The simplified method estimates these delays using average crowd dynamics, while the advanced method provides a more granular view by simulating individual movement patterns and the interactions between people in dense areas. This means that both models are sensitive to the configuration of the infrastructure and the size of the population being evacuated.
The number of evacuees over time for both the simplified evacuation analysis and advanced evacuation analysis was compared for CASE1 and CASE2 using regular exits and tunnel evacuation routes, as shown in Figure 8. The analysis indicates that the simplified evacuation analysis results in faster evacuation compared to the advanced evacuation analysis.
This difference is primarily due to the simplified model’s use of average travel speeds and ideal conditions, which underestimates the impact of bottlenecks and individual occupant characteristics, such as varying Response Times and mobility. In both cases, the use of tunnel evacuation routes allowed occupants to evacuate more quickly than using regular exits, reducing overall evacuation time by approximately 20%. The simplified model captures this effect, demonstrating that even with generalized assumptions, it can reliably indicate trends in evacuation efficiency when alternative routes, such as tunnels, are introduced. This supports the practicality of the simplified method for initial evacuation planning.
However, the advanced evacuation analysis provides a more detailed representation of real-world scenarios, accounting for individual behaviors, crowd interactions, and bottlenecks. This makes it better suited for complex environments where congestion and counterflow are significant factors. While the simplified method offers a faster, more resource-efficient estimation, the advanced method offers more precise insights, particularly in high-density, multi-level scenarios. Both methods underscore the importance of tunnel evacuation routes in deep subway stations. The introduction of these routes distributes congestion, allowing passengers to access less crowded exits, thus improving overall evacuation efficiency. In CASE2, where tunnel routes were used, the simplified and advanced methods showed alignment in predicting faster evacuation times, further validating the simplified method for straightforward scenarios.
In summary, the simplified evacuation analysis provides a quick, accessible tool for initial planning, while the advanced method is necessary for detailed, accurate evacuation assessments. Together, these methods provide complementary insights that can guide the development of effective subway evacuation strategies.

5. Conclusions

In this study, we analyzed evacuation procedures using two methods proposed by the International Maritime Organization: simplified evacuation analysis and advanced evacuation analysis. These analyses were conducted for scenarios using both regular exits and tunnel evacuation routes at Guryong Station in Seoul, Korea. A key finding of this study is the successful application of these two distinct evacuation analysis models to a novel context—subway evacuation. This demonstrates the versatility and adaptability of both simplified and advanced evacuation analyses in predicting evacuation dynamics in subway systems, which is a significant extension beyond their original maritime focus.
This study also highlights the significant potential of tunnel evacuation routes. Despite their introduction in South Korea since 2005, the public remains largely unaware of these routes and their benefits. Our results demonstrate that using tunnel evacuation routes can reduce overall evacuation time by approximately 20%, with particularly rapid evacuation for individuals on the lowest level. While the simplified evacuation analysis resulted in faster evacuation times compared to the advanced evacuation analysis, this discrepancy is due to the simplified model’s underestimation of bottleneck effects and its use of average movement speeds without accounting for individual characteristics.
This underscores one of the key limitations of the simplified evacuation analysis: its inability to fully account for the complex interactions between individuals in crowded environments, particularly in scenarios involving high congestion or counterflow. In such situations, the advanced evacuation analysis, which models individual behaviors and their interactions more accurately, would provide more realistic predictions of evacuation times. However, despite these limitations, the simplified evacuation analysis remains an effective tool for initial assessments and rapid evaluations, particularly in environments where evacuation routes are clear and movement is predictable. Its cost-effectiveness and ease of implementation make it a valuable resource for emergency planners who may not have access to the computational power required for advanced simulations. Nonetheless, emergency planners should be aware of its limitations and consider supplementing simplified models with more detailed analyses in complex or high-risk environments. Additionally, this study confirms that the simplified evacuation analysis can be effectively applied to meaningfully predict Total Evacuation Times without the need for time-consuming computational simulations. This finding emphasizes the practicality and accessibility of the simplified method for initial planning stages, especially for emergency planners and subway station operators with limited resources.
Practical applications for emergency planners include using the simplified evacuation analysis during the initial design phase to identify potential bottlenecks and develop evacuation strategies in typical subway environments. Future research directions could involve testing the applicability of the simplified evacuation analysis in different subway station layouts, such as multi-platform or multi-exit stations, and evaluating its performance under varying passenger densities. Further exploration into how the simplified method can be adapted to incorporate more dynamic factors, such as partial crowd behaviors or evacuation drills, could enhance its accuracy without sacrificing efficiency. Additionally, there is potential to expand the scope of this research to assess evacuation procedures in other types of transit infrastructure, such as train or bus terminals, using simplified methods.
These findings underscore the importance of incorporating tunnel evacuation routes into emergency planning and public education. By developing and implementing strategies and training for the use of tunnel evacuation routes, subway systems can enhance passenger safety and ensure more efficient evacuations within the critical golden time during emergencies. This study contributes to the body of knowledge on subway evacuation safety and underscores the need for continued research and education in this vital area.

Author Contributions

Conceptualization, J.L. and H.K.; methodology, S.L.; investigation, J.L.; resources, H.K.; data curation, J.L.; writing—original draft preparation, H.K.; writing—review and editing, J.L. and S.L.; visualization, J.L.; supervision, H.K. All authors have read and agreed to the published version of the manuscript.

Funding

This research was funded by the Korea Agency for Infrastructure Technology Advancement (KAIA) grant funded by the Ministry of Land, Infrastructure and Transport (Grant RS-2023-00238018).

Data Availability Statement

Data are contained within the article.

Conflicts of Interest

Authors Hyuncheol Kim and Seunghyun Lee were employed by the company i CAPTAIN Co., Ltd. The remaining authors declare that the research was conducted in the absence of any commercial or financial relationships that could be construed as a potential conflict of interest.

Appendix A

This appendix provides the detailed calculation process for CASE1 and CASE2 using the simplified method.
Table A1. Calculation of tF, tdeck, and tstair for CASE1. (N.A. denotes Not Applicable).
ItemTotalFrom
Current
Route
Wc
(m)
Length
(m)
Area
(m2)
NotesInitial
Density
D
(p/m2)
Initial
Specific
Flow
Fs (p/m/s)
Specific
Flow
Fs (p/m/s)
Calculated
Flow
Fc (p/s)
Initial
Speed of
Person
S (m/s)
Flow
Duration
tF (s)
Deck/Stair
Travel
Duration
tdeck, tstair (s)
Queue
B6—Corridor125254.0110440To B6—Door10.06 0.07 0.07 0.30 1.20 0.00 91.7 NO
B6—Corridor225254.0110440To B6—Door20.06 0.07 0.07 0.30 1.20 0.00 91.7 NO
B6—Corridor325254.0110440To B6—Door30.06 0.07 0.07 0.30 1.20 0.00 91.7 NO
B6—Corridor425254.0110440To B6—Door40.06 0.07 0.07 0.30 1.20 0.00 91.7 NO
B6—Door125253.0N.A.N.A.To B6—stair AN.A.0.07 0.07 0.22 N.A.0.00 N.A.NO
B6—Door225253.0N.A.N.A.To B6—stair BN.A.0.07 0.07 0.22 N.A.0.00 N.A.NO
B6—Door325253.0N.A.N.A.To B6—stair CN.A.0.07 0.07 0.22 N.A.0.00 N.A.NO
B6—Door425253.0N.A.N.A.To B6—stair DN.A.0.07 0.07 0.22 N.A.0.00 N.A.NO
B6—stair A25253.019.458.2To B5—Door10.43 0.07 0.07 0.22 0.80 0.00 24.3 NO
B6—stair B25253.019.458.2To B5—Door20.43 0.07 0.07 0.22 0.80 0.00 24.3 NO
B6—stair C25253.019.458.2To B5—Door30.43 0.07 0.07 0.22 0.80 0.00 24.3 NO
B6—stair D25253.019.458.2To B5—Door40.43 0.07 0.07 0.22 0.80 0.00 24.3 NO
B5—Corridor125255.030150To B5—Door10.17 0.22 0.22 1.08 1.20 0.00 25.0 NO
B5—Corridor225255.030150To B5—Door20.17 0.22 0.22 1.08 1.20 0.00 25.0 NO
B5—Corridor325255.030150To B5—Door30.17 0.22 0.22 1.08 1.20 0.00 25.0 NO
B5—Corridor425255.030150To B5—Door40.17 0.22 0.22 1.08 1.20 0.00 25.0 NO
B5—door 150253.0N.A.N.A.To B5—Stair1N.A.0.43 0.43 1.30 N.A.0.00 N.A.NO
B5—door 250253.0N.A.N.A.To B5—Stair2N.A.0.43 0.43 1.30 N.A.0.00 N.A.NO
B5—door 350253.0N.A.N.A.To B5—Stair3N.A.0.43 0.43 1.30 N.A.0.00 N.A.NO
B5—door 450253.0N.A.N.A.To B5—Stair4N.A.0.43 0.43 1.30 N.A.0.00 N.A.NO
B5—stair A50503.025.476.2To B3—Corridor1/2/30.66 0.43 0.43 1.30 0.80 0.00 31.9 NO
B5—stair B50503.025.476.2To B3—Corridor1/2/30.66 0.43 0.43 1.30 0.80 0.00 31.9 NO
B5—stair C50503.025.476.2To B3—Corridor1/2/30.66 0.43 0.43 1.30 0.80 0.00 31.9 NO
B5—stair D50503.025.476.2To B3—Corridor1/2/30.66 0.43 0.43 1.30 0.80 0.00 31.9 NO
B3—Corridor175255.035.00 175.00 To B3—Door10.43 0.56 0.56 2.79 1.20 0.00 29.2 NO
B3—Corridor275255.035.00 175.00 To B3—Door10.43 0.56 0.56 2.79 1.20 0.00 29.2 NO
B3—Corridor3150505.040.00 200.00 To B3—Door1/20.75 0.77 0.77 3.83 1.11 0.00 36.2 NO
B3—Door11501503.0N.A.N.A.To B3—Stair AN.A.4.70 1.30 3.90 N.A.38.46 N.A.YES
B3—Door21501503.0N.A.N.A.To B3—Stair BN.A.4.70 1.30 3.90 N.A.38.46 N.A.YES
B3—Stair A1501503.014.543.5To B2—Corridor1/23.45 4.70 0.88 2.64 0.44 56.82 33.0 YES
B3—Stair B1501503.014.543.5To B2—Corridor1/23.45 4.70 0.88 2.64 0.44 56.82 33.0 YES
B2—Corridor12001505.030.00 150.00 To B2—Door1/21.33 1.04 1.04 5.18 0.88 0.00 33.9 NO
B2—Corridor22001505.030.00 150.00 To B2—Door1/21.33 1.04 1.04 5.18 0.88 0.00 33.9 NO
B2—Door12002003.0N.A.N.A.To B2—Stair AN.A.1.73 1.30 3.90 N.A.51.28 N.A.YES
B2—Door22002003.0N.A.N.A.To B2—Stair BN.A.1.73 1.30 3.90 N.A.51.28 N.A.YES
B2—Stair A2002003.01442To B1—Assembly4.76 1.73 0.88 2.64 0.44 75.76 31.8 YES
B2—Stair B2002003.01442To B1—Assembly4.76 1.73 0.88 2.64 0.44 75.76 31.8 YES
B1—Corridor150505.035175.00 To B1—Assembly0.29 0.37 0.37 1.86 1.20 0.00 29.2 NO
B1—Corridor250505.035175.00 To B1—Assembly0.29 0.37 0.37 1.86 1.20 0.00 29.2 NO
B1—PATH125025020.010200To B1—Assembly1.25 1.0 1.0 20.0 0.92 0.00 10.9 NO
B1—PATH22502505.030150To B1—Assembly1.67 1.2 1.2 6.0 0.76 0.00 39.6 NO
Table A2. Calculation of tF, tdeck, and tstair for CASE2. (N.A. denotes Not Applicable).
ItemTotalFrom
Current
Route
Wc
(m)
Length
(m)
Area
(m2)
NotesInitial
Density
D
(p/m2)
Initial
Specific
Flow
Fs (p/m/s)
Specific
Flow
Fs (p/m/s)
Calculated
Flow
Fc (p/s)
Initial
Speed of
Person
S (m/s)
Flow
Duration
tF (s)
Deck/Stair
Travel
Duration
tdeck, tstair (s)
Queue
B6—Corridor125254.0110440To B6—Door10.060.070.070.301.200.0091.7NO
B6—Corridor225254.0110440To B6—Tunnel10.060.070.070.301.200.0091.7NO
B6—Corridor325254.0110440To B6—Tunnel20.060.070.070.301.200.0091.7NO
B6—Corridor425254.0220880To B6—Tunnel10.030.040.040.151.200.00183.3NO
B6—Door125254.0220880To B6—Tunnel20.030.040.040.151.200.00183.3NO
B6—Door2003.0N.A.N.A.To B6—stair AN.A.0.000.000.00N.A.0.00N.A.NO
B6—Door3003.0N.A.N.A.To B6—stair BN.A.0.000.000.00N.A.0.00N.A.NO
B6—Door4003.0N.A.N.A.To B6—stair CN.A.0.000.000.00N.A.0.00N.A.NO
B6—stair A003.0N.A.N.A.To B6—stair DN.A.0.000.000.00N.A.0.00N.A.NO
B6—stair B003.019.458.2To B5—Door10.000.000.000.000.800.0024.3NO
B6—stair C003.019.458.2To B5—Door20.000.000.000.000.800.0024.3NO
B6—stair D003.019.458.2To B5—Door30.000.000.000.000.800.0024.3NO
B5—Corridor1003.019.458.2To B5—Door40.000.000.000.000.800.0024.3NO
B5—Corridor225255.030150To B5—Door10.170.220.221.081.200.0025.0NO
B5—Corridor325255.030150To B5—Door20.170.220.221.081.200.0025.0NO
B5—Corridor425255.030150To B5—Door30.170.220.221.081.200.0025.0NO
B5—door 125255.030150To B5—Door40.170.220.221.081.200.0025.0NO
B5—door 225253.0N.A.N.A.To B5—Stair1N.A.0.360.361.08N.A.0.00N.A.NO
B5—door 325253.0N.A.N.A.To B5—Stair2N.A.0.360.361.08N.A.0.00N.A.NO
B5—door 425253.0N.A.N.A.To B5—Stair3N.A.0.360.361.08N.A.0.00N.A.NO
B5—stair A25253.0N.A.N.A.To B5—Stair4N.A.0.360.361.08N.A.0.00N.A.NO
B5—stair B25253.025.476.2To B3—Corridor1/2/30.330.360.361.080.800.0031.8NO
B5—stair C25253.025.476.2To B3—Corridor1/2/30.330.360.361.080.800.0031.8NO
B5—stair D25253.025.476.2To B3—Corridor1/2/30.330.360.361.080.800.0031.8NO
B3—Corridor125253.025.476.2To B3—Corridor1/2/30.330.360.361.080.800.0031.8NO
B3—Corridor250255.035.00175.00To B3—Door10.290.370.371.861.200.0029.2NO
B3—Corridor350255.035.00175.00To B3—Door10.290.370.371.861.200.0029.2NO
B3—Door1100505.040.00200.00To B3—Door1/20.500.650.653.251.200.0033.3NO
B3—Door21001003.0N.A.N.A.To B3—Stair AN.A.3.481.303.90N.A.25.64N.A.YES
B3—Stair A1001003.0N.A.N.A.To B3—Stair BN.A.3.481.303.90N.A.25.64N.A.YES
B3—Stair B1001003.014.543.5To B2—Corridor1/22.303.480.882.640.4437.8833.0YES
B2—Corridor11001003.014.543.5To B2—Corridor1/22.303.480.882.640.4437.8833.0YES
B2—Corridor21501005.030.00150.00To B2—Door1/21.000.880.884.411.010.0029.7NO
B2—Door11501005.030.00150.00To B2—Door1/21.000.880.884.411.010.0029.7NO
B2—Door21501503.0N.A.N.A.To B2—Stair AN.A.1.471.303.90N.A.38.46N.A.YES
B2—Stair A1501503.0N.A.N.A.To B2—Stair BN.A.1.471.303.90N.A.38.46N.A.YES
B2—Stair B1501503.01442To B1—Assembly3.571.470.882.640.4456.8231.8YES
B1—Corridor11501503.01442To B1—Assembly3.571.470.882.640.4456.8231.8YES
B1—Corridor250505.035175.00To B1—Assembly0.290.370.371.861.200.0029.2NO
B1—PATH150505.035175.00To B1—Assembly0.290.370.371.861.200.0029.2NO
B1—PATH220020020.010200To B1—Assembly1.000.90.917.61.010.009.9NO
B1—PATH22002005.030150To B1—Assembly1.331.01.05.20.880.0033.9NO

References

  1. Choe, W.; Min, S. A study on the redefine of the evacuation time of the subway station with a deep depth. J. Korean Soc. Hazard Mitig. 2017, 17, 165–171. [Google Scholar] [CrossRef]
  2. Fridolf, K.; Nilsson, D.; Frantzich, H. Evacuation of a metro train in an underground rail transportation system: Flow rate capacity of train exits, tunnel walking speeds and exit choice. Fire Technol. 2016, 52, 1481–1518. [Google Scholar] [CrossRef]
  3. He, L.; Liang, Q.; Fang, S. Challenges and innovative solutions in urban rail transit network operations and management: China’s Guangzhou Metro experience. Urban Rail Transit 2016, 2, 33–45. [Google Scholar] [CrossRef]
  4. Yu, H.; Wang, Y.; Qiu, P.; Chen, J. Analysis of natural and man-made accidents happened in subway stations and trains: Based on statistics of accident cases. MATEC Web Conf. 2019, 272, 01031. [Google Scholar] [CrossRef]
  5. Hong, W.H.; Jeon, G.Y. A study on safe egress countermeasure in underground space through the analyzing survivors’ exit patterns of Daegu City subway arson. J. Archit. Inst. Korea Plan. Des. 2005, 21, 235–242. [Google Scholar]
  6. Kim, M.J.; Min, S.H. Study on the evacuation time analysis by platform screen door opening rate. Fire Sci. Eng. 2016, 30, 59–64. [Google Scholar] [CrossRef]
  7. International Maritime Organization. Revised Guidelines on Evacuation Analysis for New and Existing Passenger Ships (IMO MSC.1/Circ.1533); International Maritime Organization: London, UK, 2016. [Google Scholar]
  8. Mandal, T.; Rao, K.R.; Tiwari, G. Evacuation of metro stations: A review. Tunn. Undergr. Space Technol. 2023, 140, 105304. [Google Scholar] [CrossRef]
  9. Chen, Y.; Wang, C.; Yap, J.B.H.; Li, H.; Zhang, S. Emergency evacuation simulation at starting connection of cross-sea bridge: Case study on Haicang Avenue Subway Station in Xiamen Rail Transit Line. J. Build. Eng. 2020, 29, 101163. [Google Scholar] [CrossRef]
  10. Sun, J.L.; Wang, S.; Chen, W.Y. A simulation study of metro emergency evacuation based on crowd panic. Safety 2017, 38, 8–11. [Google Scholar]
  11. Haghani, M.; Yazdani, M. How simple behavioural modifications can influence evacuation efficiency of crowds: Part 1. Decision making of individuals. Transp. Res. Part C Emerg. Technol. 2024, 166, 104763. [Google Scholar] [CrossRef]
  12. Haghani, M.; Yazdani, M. How simple behavioural modifications can influence evacuation efficiency of crowds: Part 2. Physical movement of individuals. Transp. Res. Part C Emerg. Technol. 2024, 166, 104762. [Google Scholar] [CrossRef]
  13. Chen, J.; Liu, C.; Meng, Y.; Zhong, M. Multi-dimensional evacuation risk evaluation in standard subway station. Saf. Sci. 2021, 142, 105392. [Google Scholar] [CrossRef]
  14. Nasso, C.; Bertagna, S.; Mauro, F.; Marinò, A.; Bucci, V. Simplified and advanced approaches for evacuation analysis of pas-senger ships in the early stage of design. Brodogradnja 2019, 70, 43–59. [Google Scholar] [CrossRef]
  15. Park, K.P.; Ham, S.H.; Ha, S. Validation of advanced evacuation analysis on passenger ships using experimental scenario and data of full-scale evacuation. Comput. Ind. 2015, 71, 103–115. [Google Scholar] [CrossRef]
  16. Wang, W.L.; Liu, S.B.; Lo, S.M.; Gao, L.J. Passenger ship evacuation simulation and validation by experimental data sets. Procedia Eng. 2014, 71, 427–432. [Google Scholar] [CrossRef]
  17. International Maritime Organization. Interim Guidelines for a Simplified Evacuation Analysis on Ro-Ro Passenger Ships; MSC/Circ. 909; International Maritime Organization: London, UK, 1999. [Google Scholar]
  18. International Maritime Organization. Guidelines for a Simplified Evacuation Analysis for New and Existing Passenger Ships; MSC/Circ. 1033; International Maritime Organization: London, UK, 2003. [Google Scholar]
  19. International Maritime Organization. Guidelines for Evacuation Analysis for New and Existing Passenger Ships; MSC/Circ. 1238; International Maritime Organization: London, UK, 2007. [Google Scholar]
  20. Galea, E.R.; Deere, S.; Sharp, G.; Filippidis, L.; Lawrence, P. Recommendations on the nature of the passenger response time distribution to be used in the MSC 1033 assembly time analysis based on data derived from sea trials. Int. J. Marit. Eng. 2007, 149, 15–29. [Google Scholar] [CrossRef]
  21. Liu, X.; Gong, D. A comparative study of A-star algorithms for search and rescue in perfect maze. In Proceedings of the 2011 International Conference on Electric Information and Control Engineering, Wuhan, China, 15–17 April 2011; pp. 24–27. [Google Scholar] [CrossRef]
  22. Van den Berg, J.; Patil, S.; Sewall, J.; Manocha, D.; Lin, M. Interactive Navigation of Multiple Agents in Crowded Environments. University of North Carolina at Chapel Hill. Available online: http://gamma.cs.unc.edu/RVO/NAVIGATE/ (accessed on 4 May 2024).
  23. Kim, H.; Roh, M.I.; Han, S. Passenger evacuation simulation considering the heeling angle change during sinking. Int. J. Nav. Archit. Ocean Eng. 2019, 11, 329–343. [Google Scholar] [CrossRef]
  24. Lee, J.; Kim, H.; Kwon, S. Evacuation analysis of a passenger ship with an inclined passage considering the coupled effect of trim and heel. Int. J. Nav. Archit. Ocean Eng. 2022, 14, 100450. [Google Scholar] [CrossRef]
Figure 1. Images of the interior and exterior of Guryong Station.
Buildings 14 02859 g001
Figure 2. CASE1—Escape route schematization.
Buildings 14 02859 g002
Figure 3. CASE2—Escape route schematization. The red box indicates the modified evacuation path compared to CASE1.
Buildings 14 02859 g003
Figure 4. Advance Evacuation Simulation System Architecture.
Buildings 14 02859 g004
Figure 5. Population’s composition (age and gender) and walking speed range.
Buildings 14 02859 g005
Figure 6. Response Time Distribution for day and night.
Buildings 14 02859 g006
Figure 7. Crowd evacuation simulation for Guryong Station.
Buildings 14 02859 g007
Figure 8. Comparison of simplified and advanced evacuation analysis.
Buildings 14 02859 g008
Table 1. Initial specific flow and initial speed as a function of density. Data from International Maritime Organization [7]. Adapted from Revised guidelines on evacuation analysis for new and existing passenger ships (IMO MSC.1/Circ.1533), 2016.
Type of FacilityInitial Density
D (p/m2)
Initial Specific Flow
Fs (p/m/s)
Initial Speed of
Person S (m/s)
Corridor001.2
0.50.651.2
1.91.30.67
3.20.650.20
≥3.50.320.10
Table 2. Maximum specific flow. Data from International Maritime Organization [7]. Adapted from Revised guidelines on evacuation analysis for new and existing passenger ships (IMO MSC.1/Circ.1533), 2016.
Type of FacilityMaximum Specific Flow Fs (p/m/s)
Stairs (down)1.101.2
Stairs (up)0.880.651.2
Corridors1.31.30.67
Doorways1.30.650.20
Table 3. Values of specific flow and speed. Data from International Maritime Organization [7]. Adapted from Revised guidelines on evacuation analysis for new and existing passenger ships (IMO MSC.1/Circ.1533), 2016.
Type of FacilitySpecific Flow Fs (p/m/s)Speed of Persons S (m/s)
Stairs (down)01.0
0.541.0
1.10.55
Stairs (up)00.8
0.430.8
0.880.44
Corridors01.2
0.651.2
1.30.67
Table 4. Estimated tI (Travel Time in Ideal Conditions) for CASE1 and CASE2.
ScenarioEscape Route ontdecktFtstairtassemblytI
CASE1B6161.875.8120.939.6398.0
B595.175.896.739.6307.1
B370.175.864.839.6250.2
B233.975.831.839.6181.1
B129.242.00.039.6110.7
CASE2B6183.30.00.00.0183.3
B588.056.896.533.9275.3
B363.056.864.833.9218.5
B229.756.831.833.9152.2
B129.238.60.033.9101.7
Disclaimer/Publisher’s Note: The statements, opinions and data contained in all publications are solely those of the individual author(s) and contributor(s) and not of MDPI and/or the editor(s). MDPI and/or the editor(s) disclaim responsibility for any injury to people or property resulting from any ideas, methods, instructions or products referred to in the content.

