Article

Enhancements in the Virtual Support Force Method for Tunnel Excavation Problems

1
State Key Laboratory of Water Resources Engineering and Management, Wuhan University, Wuhan 430072, China
2
Key Laboratory of Rock Mechanics in Hydraulic Structural Engineering, Wuhan University, Wuhan 430072, China
3
Technological Innovation Center of Hybrid Renewable Energy of Tibet Autonomous Region, POWERCHINA Chengdu Engineering Corporation Limited, Chengdu 610072, China
*
Author to whom correspondence should be addressed.
Buildings 2024, 14(9), 2869; https://doi.org/10.3390/buildings14092869
Submission received: 8 August 2024 / Revised: 7 September 2024 / Accepted: 9 September 2024 / Published: 11 September 2024
(This article belongs to the Section Building Structures)

Abstract

:
In order to accurately quantify the spatial constraint effect of tunnel excavation face, a generalized and improved form of virtual support force method is proposed, and the implementation steps of the method are given in detail. This approach is capable of demonstrating the variations in load release within the excavation section as well as the evolution of load release along the tunnel axis direction under the spatial restrictions of the tunnel face. Simultaneously, the presented approach is examined from the perspective of tunnel deformation and stress, and ultimately, the impact of the enhanced approach on the support timing determination is deliberated. A numerical model of a circular tunnel is established for analysis; the results show that, in terms of deformation and stress path, the enhanced virtual support force method can more closely resemble the actual three-dimensional excavation process than the traditional method. The improved virtual support force method can reduce the volume loss rate error by up to 3.76% and the stress error by up to 15.64% compared to the conventional method. As a result, the tunnel face’s spatial limitation may be more accurately described by the enhanced virtual support force approach. The support point computed by the enhanced approach is further away from the tunnel face in the research of establishing the beginning support timing, which may more thoroughly mobilize the surrounding rock bearing and minimize support consumables.

1. Introduction

During tunnel construction, the stress release and deformation of the tunnel section near the face have obvious constraint effects in time and space. With increasing distance from the tunnel face, the constraint on the exposed surrounding rock gradually weakens, leading to continuous pressure release in the surrounding rock, and the convergence displacement increases until stabilization. The above phenomenon is known as the face space constraint effect, which can be regarded as the face virtually bearing part of the unreleased load of the surrounding rock. Under the influence of the face space effect, the direction of the principal stress of the tunnel-wall surrounding rock rotates and the stress is gradually released along the path from the excavation section close to the face to a section distant from the face along the axis of the tunnel [1]. The curve shape of the distance from the radial deformation of the tunnel wall to the face is semicircular [2]. At the same time, the surrounding rock plastic failure zone presents a “bullet head” shape within a certain range near the face, and the radius of the plastic zone continues to increase with the tunnel excavation [3].
Many scholars have conducted in-depth research on the definition, spatial evolution law, and application of the spatial constraint effect of the tunnel face. According to research method, previous researches can be divided into the following two types: (1) Parameter weakening method: Li et al. [4] defined the degree of reduction of the surrounding rock deformation modulus as the surrounding rock release coefficient. Lisjak et al. [5] adopted the softening excavation algorithm and used the softening ratio to describe the numerical excavation process. On this basis, Xu et al. [6] proposed a layer-based tunnel support algorithm to simulate the spatial effect of the excavation face and control the release of the excavation load by reducing the elastic modulus of the layer unit of the tunnel face. (2) Virtual support force method: Duncan and Dunlop [7] first proposed the concept of the “reversal stress method”, which is applicable to the special case where the initial stress field is a hydrostatic pressure field. Later, Kielbassa and Duddeck [8] studied the relationship between tunnel stress release and construction process under non-circular tunnel, non-hydrostatic pressure conditions. Sun et al. [9,10] considered the non-axisymmetric problem of tunnel section shape and initial ground stress field and explained how “generalized virtual support force” simulates the spatial effect of the excavation face. Zhang et al. [11] used finite difference software to control the stress release process to simulate tunnel excavation unloading, analyzed the difference between it and true three-dimensional excavation in the stress path of the tunnel wall, and conducted a sensitivity analysis of the lateral pressure coefficient. Galli et al. [12] found that the settlement value of the tunnel top was basically the same as the calculation result of the three-dimensional model by controlling the excavation load release process of the two-dimensional model. Yang et al. [13] used the cross-sectional volume loss to calibrate the stress release based on the spatial effect of the excavation surface to realize tunnel excavation simulation. Su et al. [14] selected the position where the maximum displacement of the tunnel occurred to establish the relationship between the displacement release coefficient and the excavation load release rate. Yang et al. [15] introduced the virtual support force method to transform the three-dimensional tunnel excavation problem into a two-dimensional problem to study the problem of initial support and support timing. Zhou et al. [16] constructed a virtual support force method to solve the optimal support timing based on the time–space effect of the excavation surface.
In the study of excavation face spatial effect, the virtual support force method is widely used due to its clear principle and quantifiability. Most of the above studies take the selected excavation section load release rate as a fixed value or only consider the difference in the horizontal and vertical directions. Zhao et al. [17] proved through experiments that there are large differences in the load release process at different positions of the same section in full-section excavation. Li et al. [18] considered the time and space effect of the excavation face and studied the tunnel-wall load of the step method construction and proposed the concept of the cross-section load release difference coefficient. Similarly, Liu et al. [19] used numerical simulation methods to perform qualitative analysis and found that the plastic zone calculated by the uneven release of the cross-section load is more in line with the actual situation, but did not conduct a quantitative analysis of the uneven release process of the load. The above analysis summarizes the following issues that need to be studied urgently: how to simulate the uneven load release when using the virtual support force method to study the spatial effect of the excavation section, whether or not it is better than the traditional method after considering the uneven characteristics of stress release, and what impact it has on the engineering application based on the stress release method.
Regarding the above problems, this paper considers the uneven release characteristics of excavation load in the excavation section based on the convergence-constraint method and proposes an improved virtual support force method on the basis of the generalized virtual support force method. The simulation steps of the improved virtual support force method are introduced in detail, revealing the differences in load release in the excavation section during tunnel excavation under the action of spatial constraints on the heading face and the changing laws in the direction of the tunnel axis. At the same time, based on the true three-dimensional scheme, the errors of the virtual support force method before and after the improvement are compared and analyzed regarding the tunnel deformation and stress. Finally, the engineering problem “calculation of the initial support timing of the tunnel”, where the virtual support force method is often used, is selected to discuss the influence of the improved method on the determination of the support timing.

2. Virtual Support Force Method

2.1. Theoretical Background

There are two core steps in using the virtual support force method to describe the spatial constraint effect of the tunnel face: obtaining the support force of the excavation body on the tunnel excavation boundary under the original rock state and defining and controlling the release of the support force.
Mana and Clough [20] proposed a theoretical method for obtaining the boundary support force in finite elements. As shown in Formula (1), in the kth step, m units are dug out. The release load node force generated by this unit at the excavation boundary is as follows:
{ F } k = j = 1 m Ω [ B ] j { σ } j k d Ω
where { F } k is the equivalent released load column vector caused by the k-th step of excavation, [ B ] j is the geometric matrix of the j-th excavation unit, { σ } j k is the stress level of the rock and soil mass before the k-th step of excavation, and Ω is the excavation boundary collection.
For the FLAC 6.0 finite difference method software, the stress components are stored at the centroid of the unit. The unit nodes only have unbalanced forces, and the unit node forces are approximately 0 in the equilibrium state. Therefore, the theoretical level of obtaining the boundary support force is quite different from that of the finite element method [11]. In the first step of calculation after excavation, the strain increment and stress increment are zero. The node unbalanced force is shown in Formula (2). The direction of the unbalanced force is perpendicular to the excavation surface. The reaction force of the unbalanced force is the support force of the excavation body on the excavation surface:
F n < l > = [ [ p n ] ] < l > + P n < l >
where the subscript n is the direction of the node vector, the superscript < l > is the node number; P n < l > is the contribution value of the load or concentrated force to the node, and [ [ p n ] ] < l > is the contribution value of all tetrahedrons owning the node < l > to the node force. For the expression p i l , the formula is as follows:
p i l = 1 3 σ i j n j ( l ) S ( l ) + 1 4 ρ b i V
where σ i j is the node stress, n j ( l ) is the normal vector of the ( l ) plane in the tetrahedron, S ( l ) is the area of the ( l ) plane in the tetrahedron, ρ is the density, b i is the unit volume force, and V is the volume of the tetrahedron.
The virtual support force method assumes that the spatial constraint of the tunnel face (Figure 1) is a radial support load acting on the excavation boundary and is gradually released during the excavation process. Sun et al. [21] gave the expression of the virtual support force as follows:
P virtual - force ( y ) = [ 1 i ( y ) ] σ 0
where σ 0 is the initial ground stress, i ( y ) is the load release rate at the tunnel wall at a distance y from the tunnel face, i ( ) = 0 for the unexcavated section far from the tunnel face, and i ( ) = 100 % for the excavated section far from the tunnel face.
The generalized virtual support force method [9,10] introduces two directional stress release coefficients, i x and i z , on the basis of the virtual support assumption, which can consider the non-axial symmetry of the tunnel cross-section shape and the initial in situ stress field. The expression of the generalized virtual support force is as follows:
{ P virtual - force , x ( y ) = [ 1 i x ( y ) ] σ x 0 P virtual - force , z ( y ) = [ 1 i z ( y ) ] σ z 0
where σ x 0 and σ z 0 are the initial in situ stress parameters in the x and z directions.
Experts and scholars have proposed various value standards for stress release coefficient i ( y ) , as shown in Table 1.
For deep buried tunnel projects, the load release rate is the same as the tunnel-wall deformation or volume loss rate only when the surrounding rock is in the elastic stage from beginning to end. When plastic damage occurs in the surrounding rock, the load release rate and the tunnel-wall deformation or volume loss rate show a nonlinear relationship. Therefore, the stress release coefficient, i ( y ) , in this paper is determined by the coupling relationship between the LDP curve and the GRC curve in the convergence-constraint method.

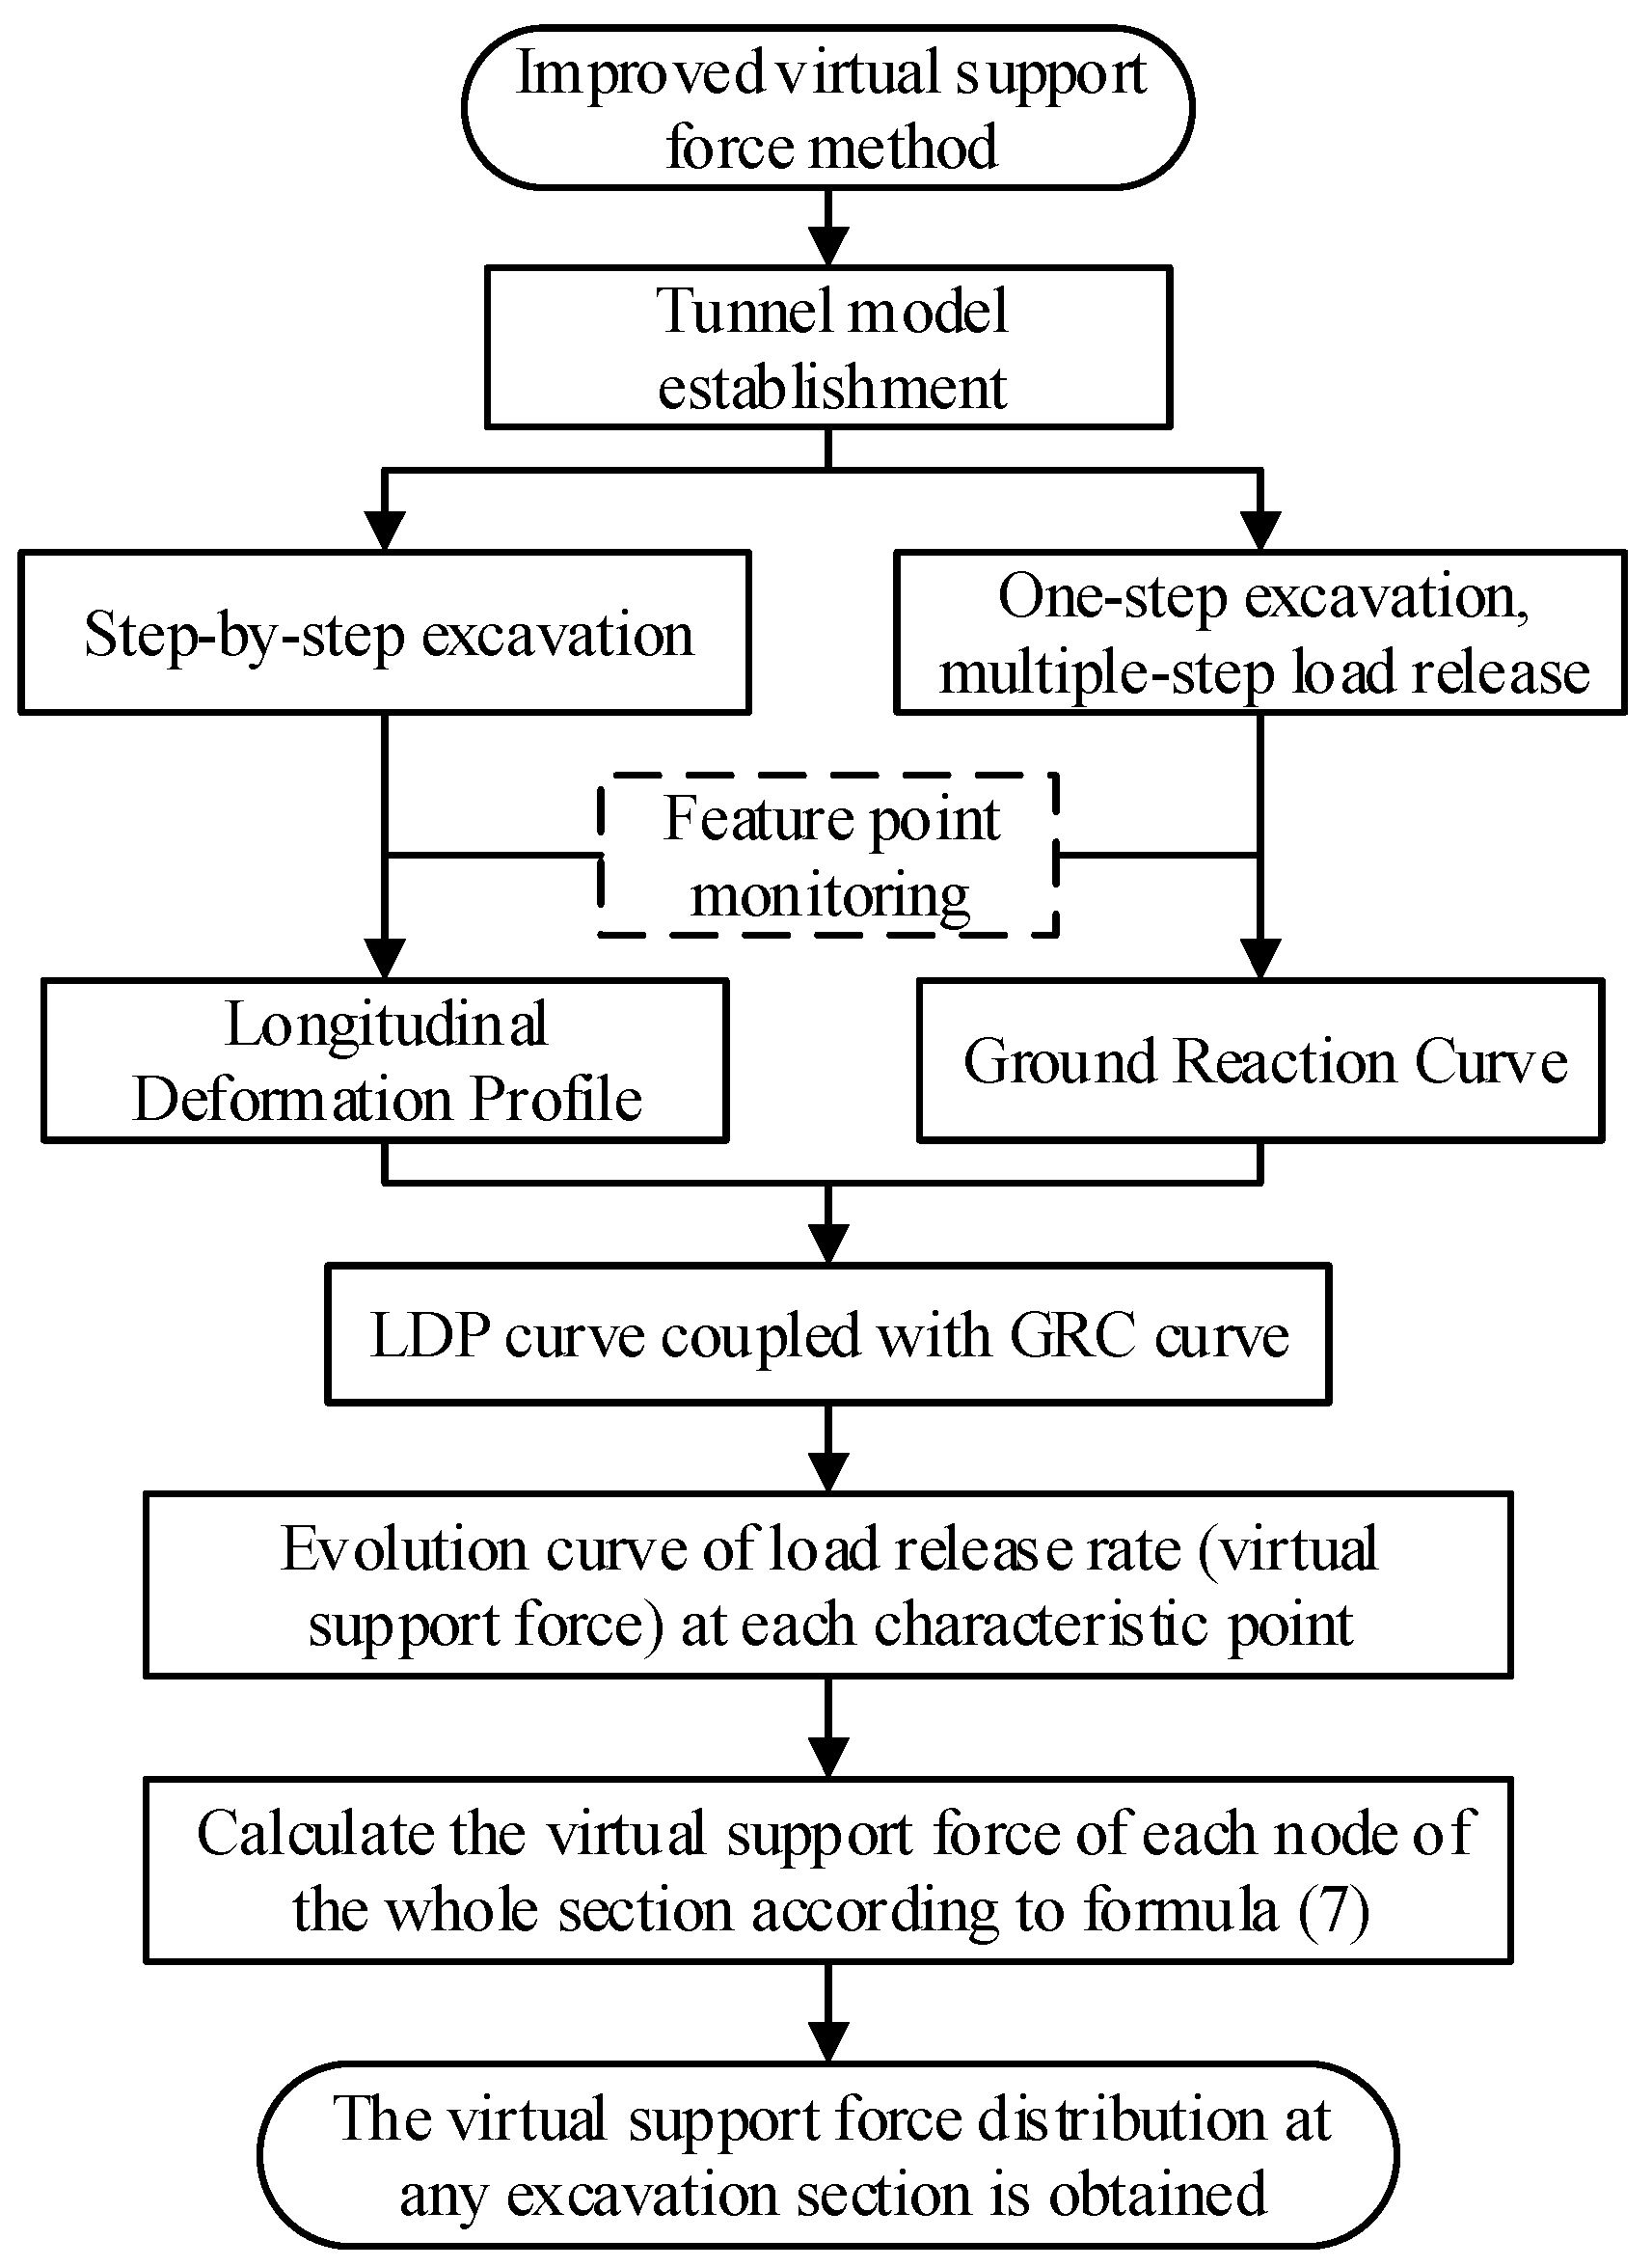
2.2. Improved Virtual Support Force Method

For tunnels with circular excavation sections, improved optimization of the stress release coefficient is based on the generalized virtual support force. First, the expression of the improved virtual support force of multiple reference points is calculated as Formula (6). It is assumed that the load release rate of the nodes of the entire section is uniformly distributed. Then, the load release rate of the nodes between each reference point is determined by the angle between the nodes and their adjacent reference points, as shown in Formula (7), then the load release rate distribution and virtual support force distribution of each node are obtained, as shown in Figure 2.
{ LDP d ( y , u ) ~ GRC d ( u , i ) i d ( y ) P virtual - force , d ( y ) = [ 1 i d ( y ) ] σ d 0
where i d ( y ) is the load release rate at point d on the tunnel wall at a distance y from the tunnel face, σ d 0 is the initial ground stress at point d, and LDP d and GRC d are the tunnel longitudinal deformation curve and surrounding rock response curve at point d, respectively.
{ i d ( θ ) ( y ) = i d ( α ) ( y ) + ( θ α ) ( i d ( β ) ( y ) i d ( α ) ( y ) ) β α P virtual - force , d ( θ ) ( y ) = [ 1 i d ( θ ) ( y ) ] σ d ( θ ) 0
where i d ( θ ) ( y ) is the load release rate of the node at the central angle θ on the tunnel wall at a distance y from the tunnel face, α and β are the central angles of its adjacent reference points, and i d ( α ) ( y ) and i d ( β ) ( y ) are the load release rates of the adjacent reference points.
The specific operation steps are as follows: (1) Establish a tunnel calculation model, select multiple monitoring points in the model, gradually excavate the entire section of the tunnel to monitor the deformation values of the monitoring points, and obtain the longitudinal deformation curve LDP of each point; (2) Extract the support load of the excavation contour surface under the initial stress state before tunnel excavation, release the support load step by step after one excavation, and obtain the surrounding rock characteristic curve GRC by the correlation between the deformation of the monitoring points and the load release rate (the difference in load release rate of the same section is not considered at this time); (3) Establish a coupling relationship between the LDP curve and the GRC curve, as shown in Figure 3, and obtain the corresponding relationship between the load release rate of each monitoring point and the position of the tunnel face by equal displacement; (4) For any section of the tunnel, the load release rate of the nodes between the monitoring points is determined by Formula (7), and then the virtual support force distribution of any excavation section is obtained. The calculation process is shown in Figure 4.

3. Improvement of the Implementation Process of Virtual Support Force Method

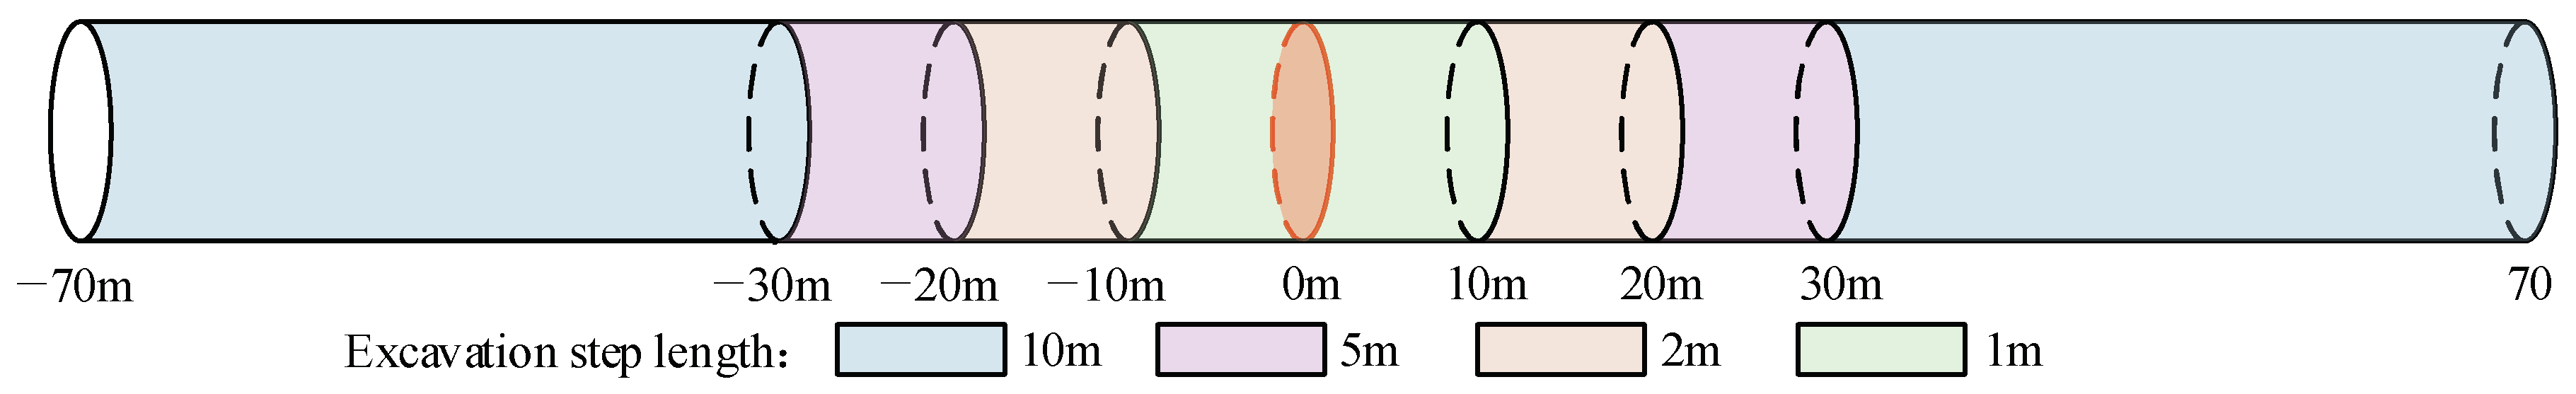
3.1. Model Introduction and Monitoring Settings

In this paper, FLAC3D is used to establish the numerical calculation model shown in Figure 5. The tunnel is buried 700 m deep, and the inner diameter of the excavation is 8 m. In order to minimize the error caused by the boundary effect of the model in the calculation analysis [26,27], the distance between the center of the tunnel and the upper and lower and left and right boundaries of the model is 70 m. The longitudinal length of the tunnel is 140 m, as shown in Figure 5a. The number of model nodes is 289,132 and the number of zones is 281,400. The rock mass around the tunnel adopts the Mohr–Coulomb constitutive model. Its bulk density is 26 kN/m3, Poisson’s ratio is 0.22, deformation modulus is 10 GPa, internal friction angle is 50°, and cohesion is 1 MPa. The surrounding rock type is Class III. The bottom boundary of the model is fully constrained, the side boundary adopts normal constraints, and the surface force is applied on the top to simulate the upper cover. Seven monitoring points and monitoring objects are evenly set within 180° on the right side of the monitoring section in the middle of the model, as shown in Figure 5b.
During the excavation of the tunnel, the position of the tunnel face has a significant influence on the deformation of the tunnel wall and the intensity of the excavation load release. When the tunnel face is near the monitoring section, the deformation rate of the tunnel wall is large and the excavation load releases rapidly. On the contrary, the deformation of the tunnel wall is basically unchanged and the excavation load release process is slow [28]. Therefore, four excavation step distances of 1 m, 2 m, 5 m, and 10 m are designed. The excavation process has a total of 42 steps, as shown in Figure 6. The value marked below indicates the distance between the excavation face and the monitoring section, with the excavation direction as the positive direction.

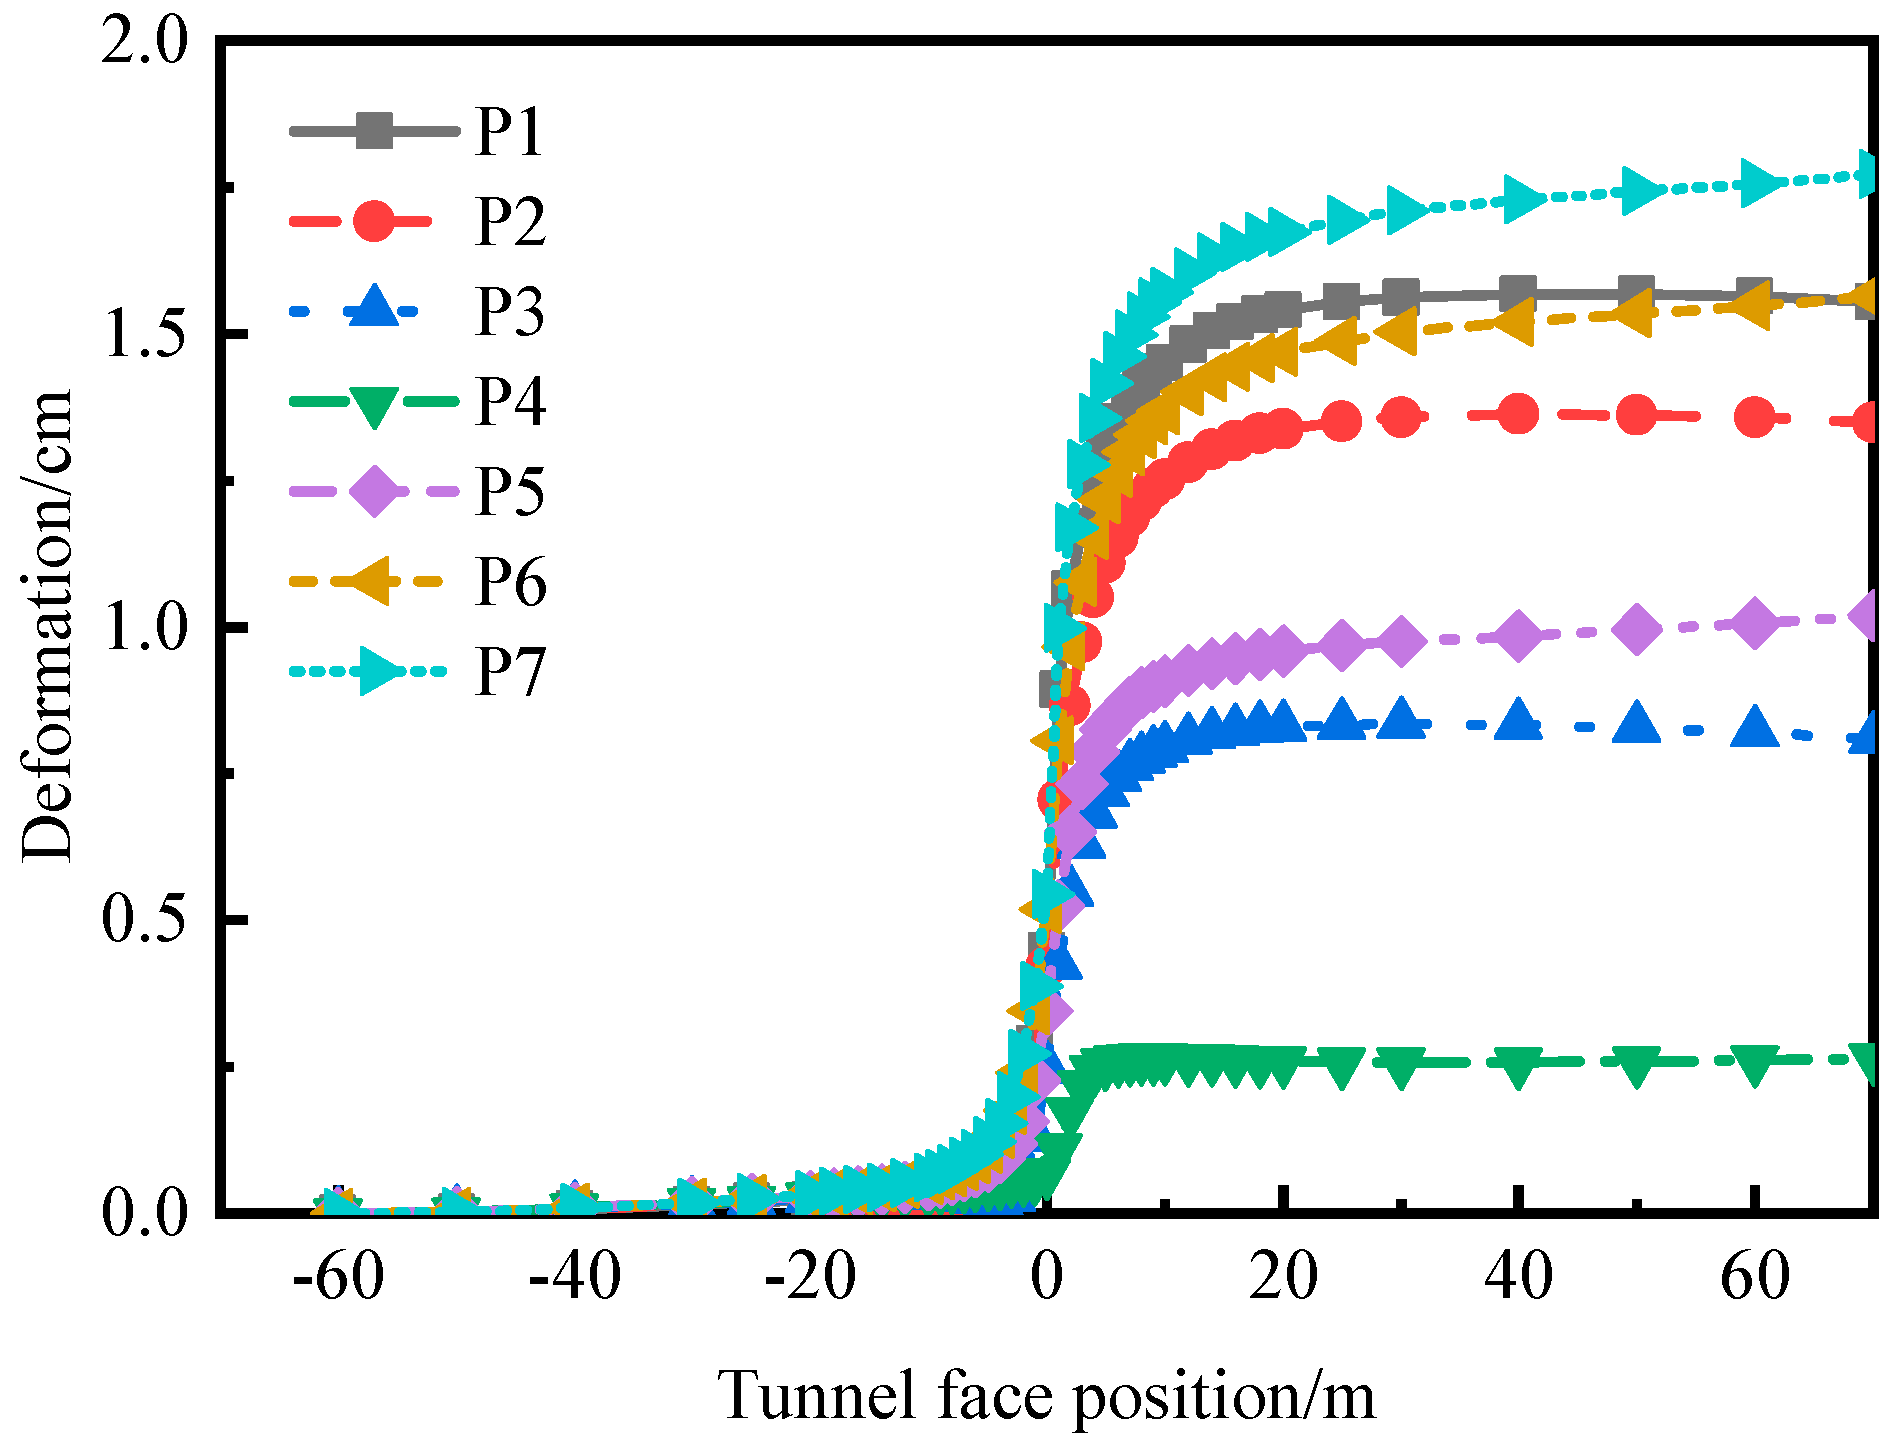
3.2. The Longitudinal Deformation Profile of Surrounding Rock

The longitudinal deformation curve of the tunnel is obtained by gradually excavating the entire section of the tunnel and monitoring the displacement of characteristic points, as shown in Figure 7. The displacement values of each point gradually increase with the advancement of the tunnel face. The deformation of the monitoring section from exposure to the far stage (y = 0 m~70 m) is significantly greater than that of the monitoring section not exposed (y = −70 m~0 m). In the same excavation section, the displacement of the top measuring point, P7, is the largest, followed by the bottom measuring point, P1, and the waist measuring point, P4, has the smallest deformation. Affected by the spatial effect of the tunnel face, the change rate of the displacement value of each monitoring point is negatively correlated with the distance between the tunnel face and the monitoring section, that is, it reaches the maximum when the excavation tunnel face passes through the monitoring section, and the displacement reaches the maximum value at approximately three times the tunnel diameter of the monitoring section.

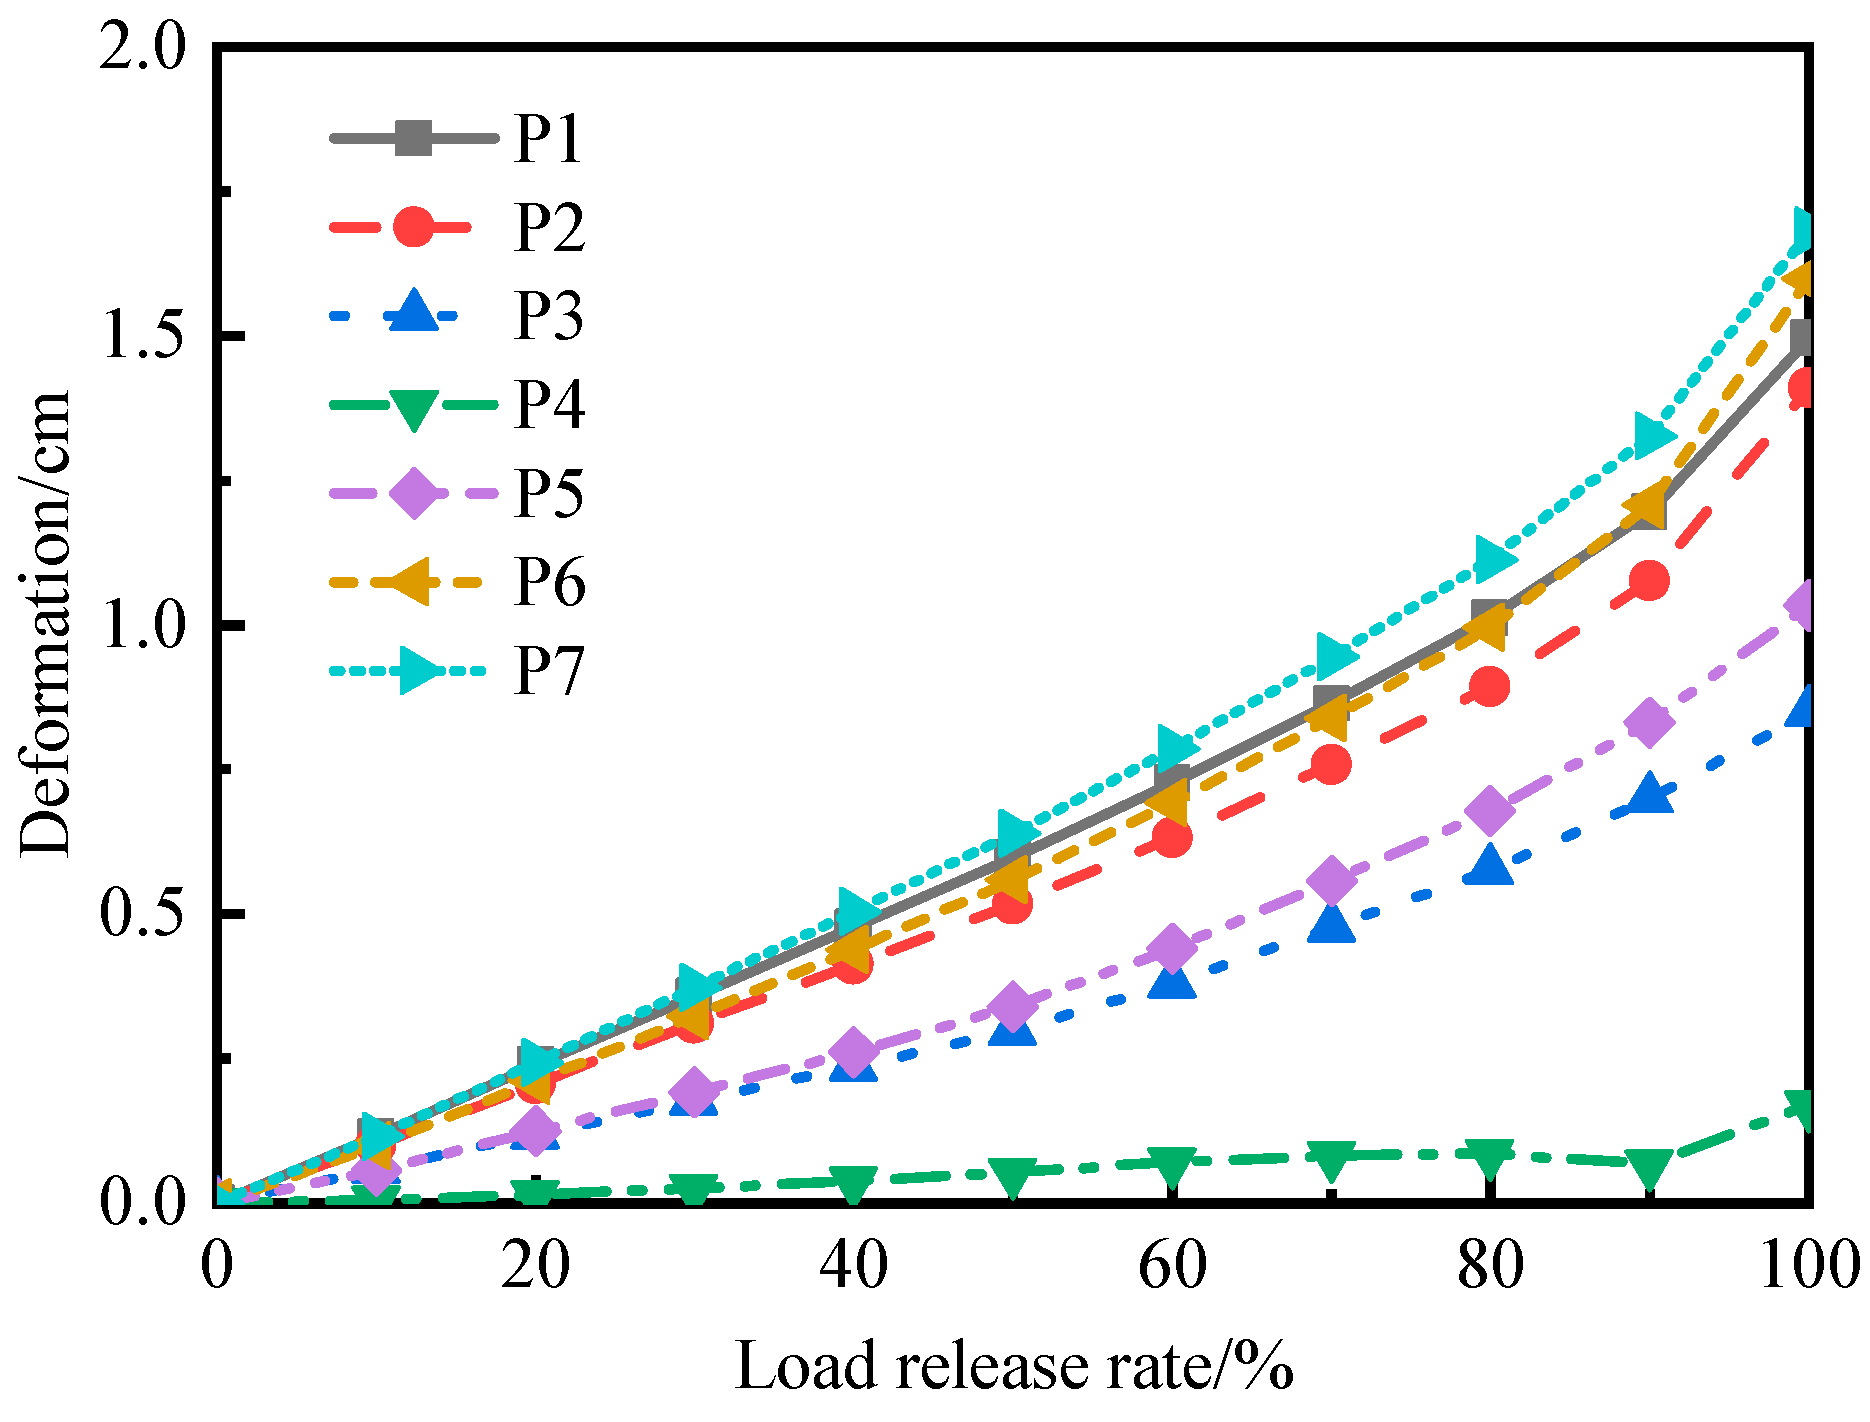
3.3. The Ground Reaction Curve of Surrounding Rock

After the initial geostress of the tunnel model is balanced, the load acting on the excavation contour surface by the rock plug is extracted. The tunnel is excavated once, and the extracted excavation load is applied to the excavation surface. It is assumed that the excavation load is released evenly in 10 steps. Since the initial excavation load at each elevation is different under the influence of gravity, in order to unify the form of the excavation load and facilitate the subsequent description of the load release process, the excavation load is converted into the load release rate by Formula (6). The relationship between the load release rate and the displacement of the monitoring characteristic point can be obtained. The surrounding rock characteristic curve is shown in Figure 8. Except for the monitoring point at the waist of the tunnel, the deformation value of each point increases with the increase of the load release rate in the early stage of load release (i = 0~70%), and the two are approximately linearly related. In the later stage of load release (i = 70~100%), the deformation rate of each point increases significantly with the obvious expansion of the plastic zone of the surrounding rock [29]. The deformation of the monitoring point at the waist of the tunnel is small during the load release process, and there is a local decrease in the later stage of load release.

3.4. LDP~GRC Coupling Analysis

The LDP curves of each monitoring point are coupled with the GRC curves, as shown in Figure 3. The relationship curve between the tunnel face position and the load release rate is deduced, with displacement as the intermediate quantity, as shown in Figure 9. After verification, it is found that the load release rate of the tunnel waist monitoring point P4 is quite different from that of other measuring points, which is inconsistent with the actual situation [17]. The main reason for this is that the load release difference of each point on the cross section is not considered when the GRC curve is deduced. Therefore, this paper takes the average of the relationship curves between the tunnel face position and the load release rate of the adjacent monitoring points, P3 and P5, for substitution and correction.
The spatial constraint effect of the tunnel face is negatively correlated with the load release rate, as shown in Formula (6). Analysis of the modified Figure 9 shows that, when the tunnel face has not reached the monitoring surface, the spatial constraint effect of the monitoring points above the tunnel waist continues to decrease. The spatial constraint effect of the monitoring points below the tunnel waist during the tunnel face advancement process has gone through three stages: decrease, increase, and then decrease. This shows that when the monitoring section is not exposed, the influence of gravity on the distribution of spatial effect is obvious. When the tunnel face passes through and moves away from the monitoring section, the load release rate of each point continues to increase, that is, the spatial effect of the tunnel face continues to decrease. At this stage, the spatial constraint effect of the tunnel face above the tunnel waist dissipates more slowly than that below the tunnel waist.

4. Error Evaluation of Tunnel Face Spatial Effect

From the above results, it can be seen that the traditional virtual support force method and the improved method can simulate the working conditions of any excavation section by controlling the distribution of the load release of the excavation section. In contrast, the improved method can quantify the difference between the load release of the excavation section and the spatial constraint effect of the tunnel face. However, the ability of the improved method to show the spatial effects of true three-dimensional models remains to be discussed. Therefore, this section designs the three schemes shown in Table 2. They are the true three-dimensional, full-section, step-by-step excavation scheme FA0; the traditional virtual support force method FA1 with equal excavation section load rate; and the improved virtual support force method FA2 considering the uneven release of load in the excavation section. The FA0 calculation results are used as a benchmark to evaluate the errors of the traditional and improved virtual support force methods in reproducing tunnel deformation, stress, and plastic zone.

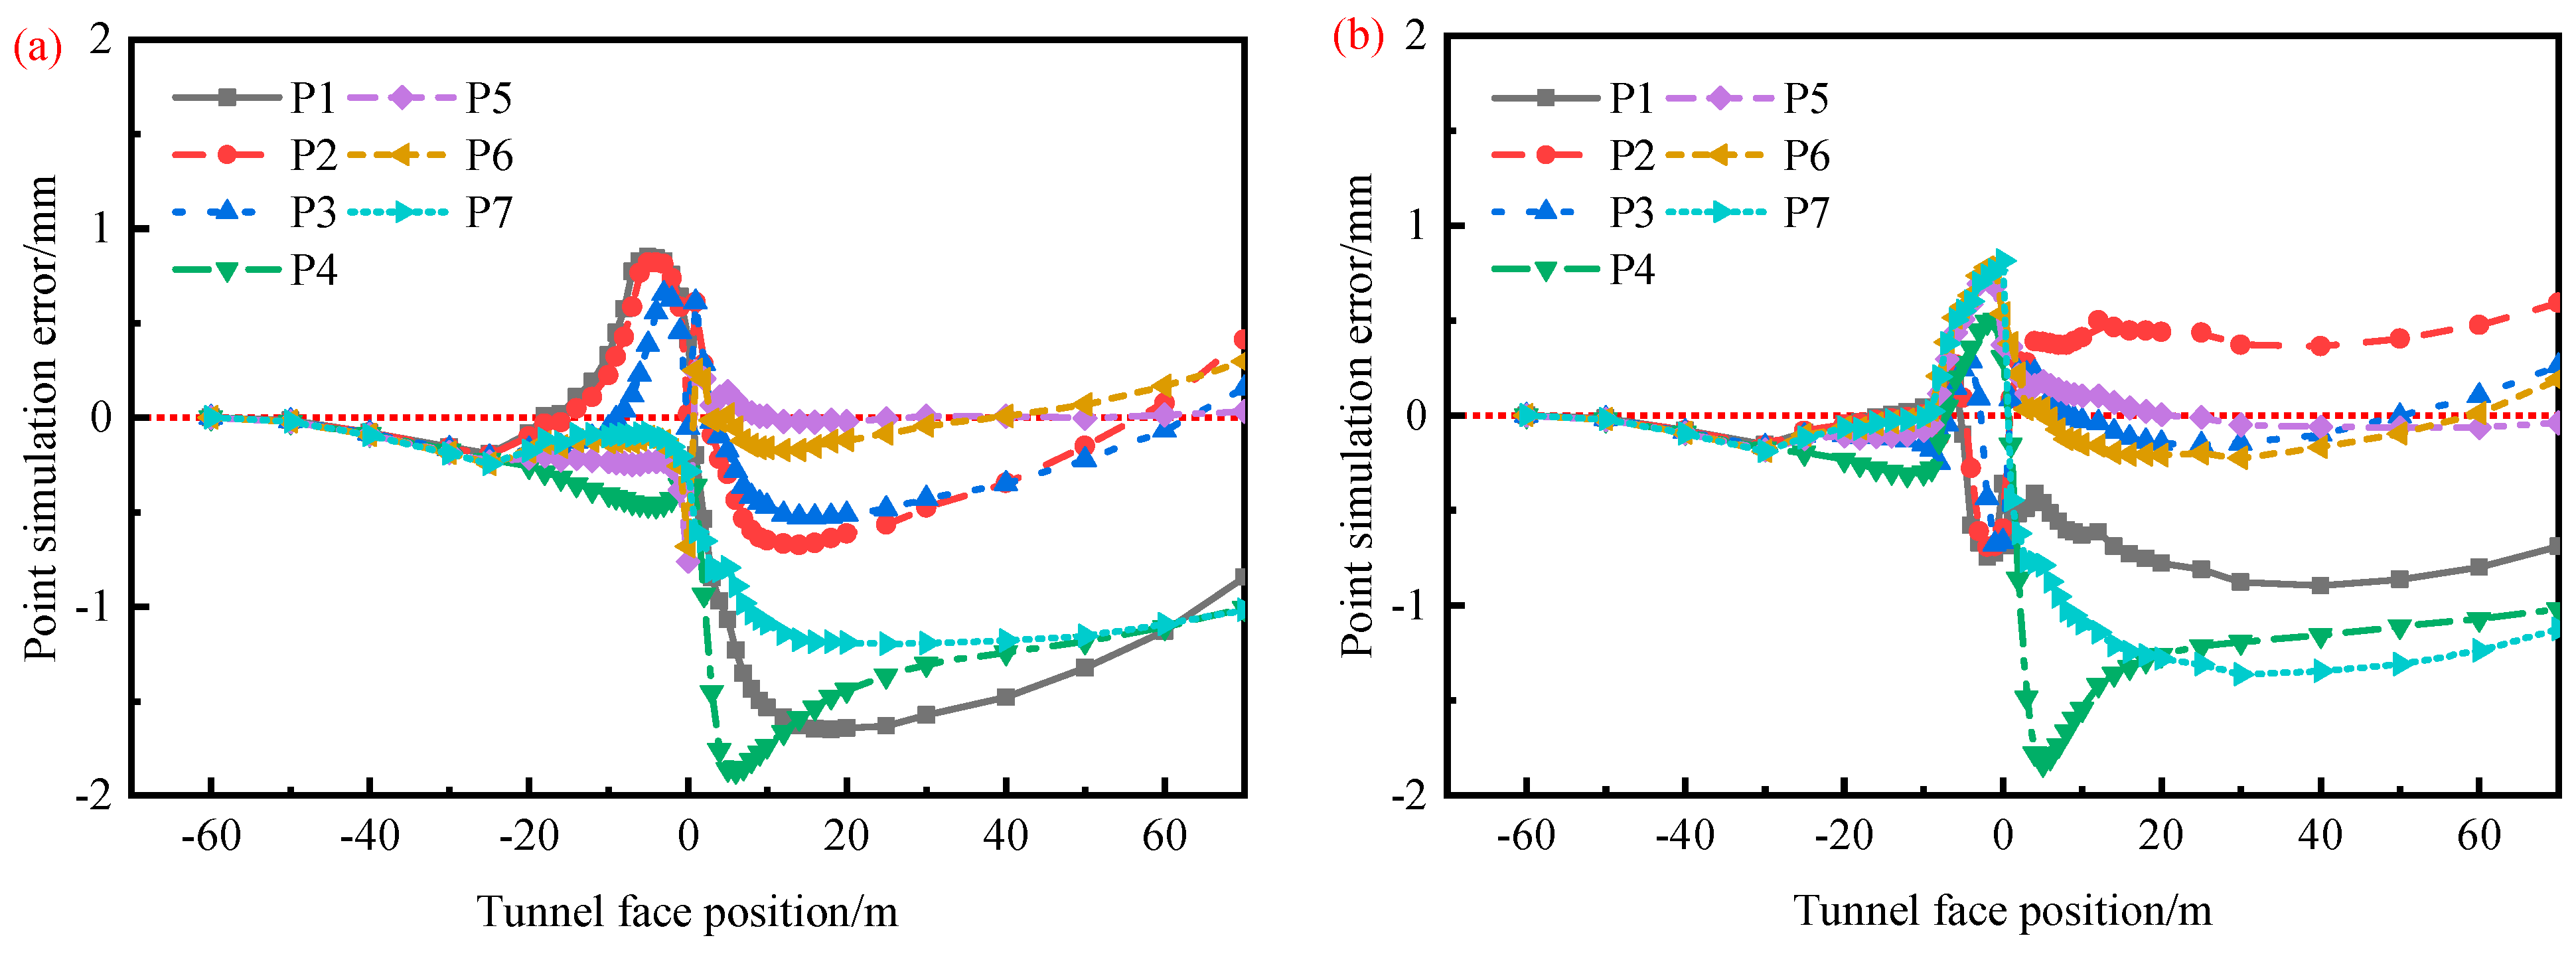
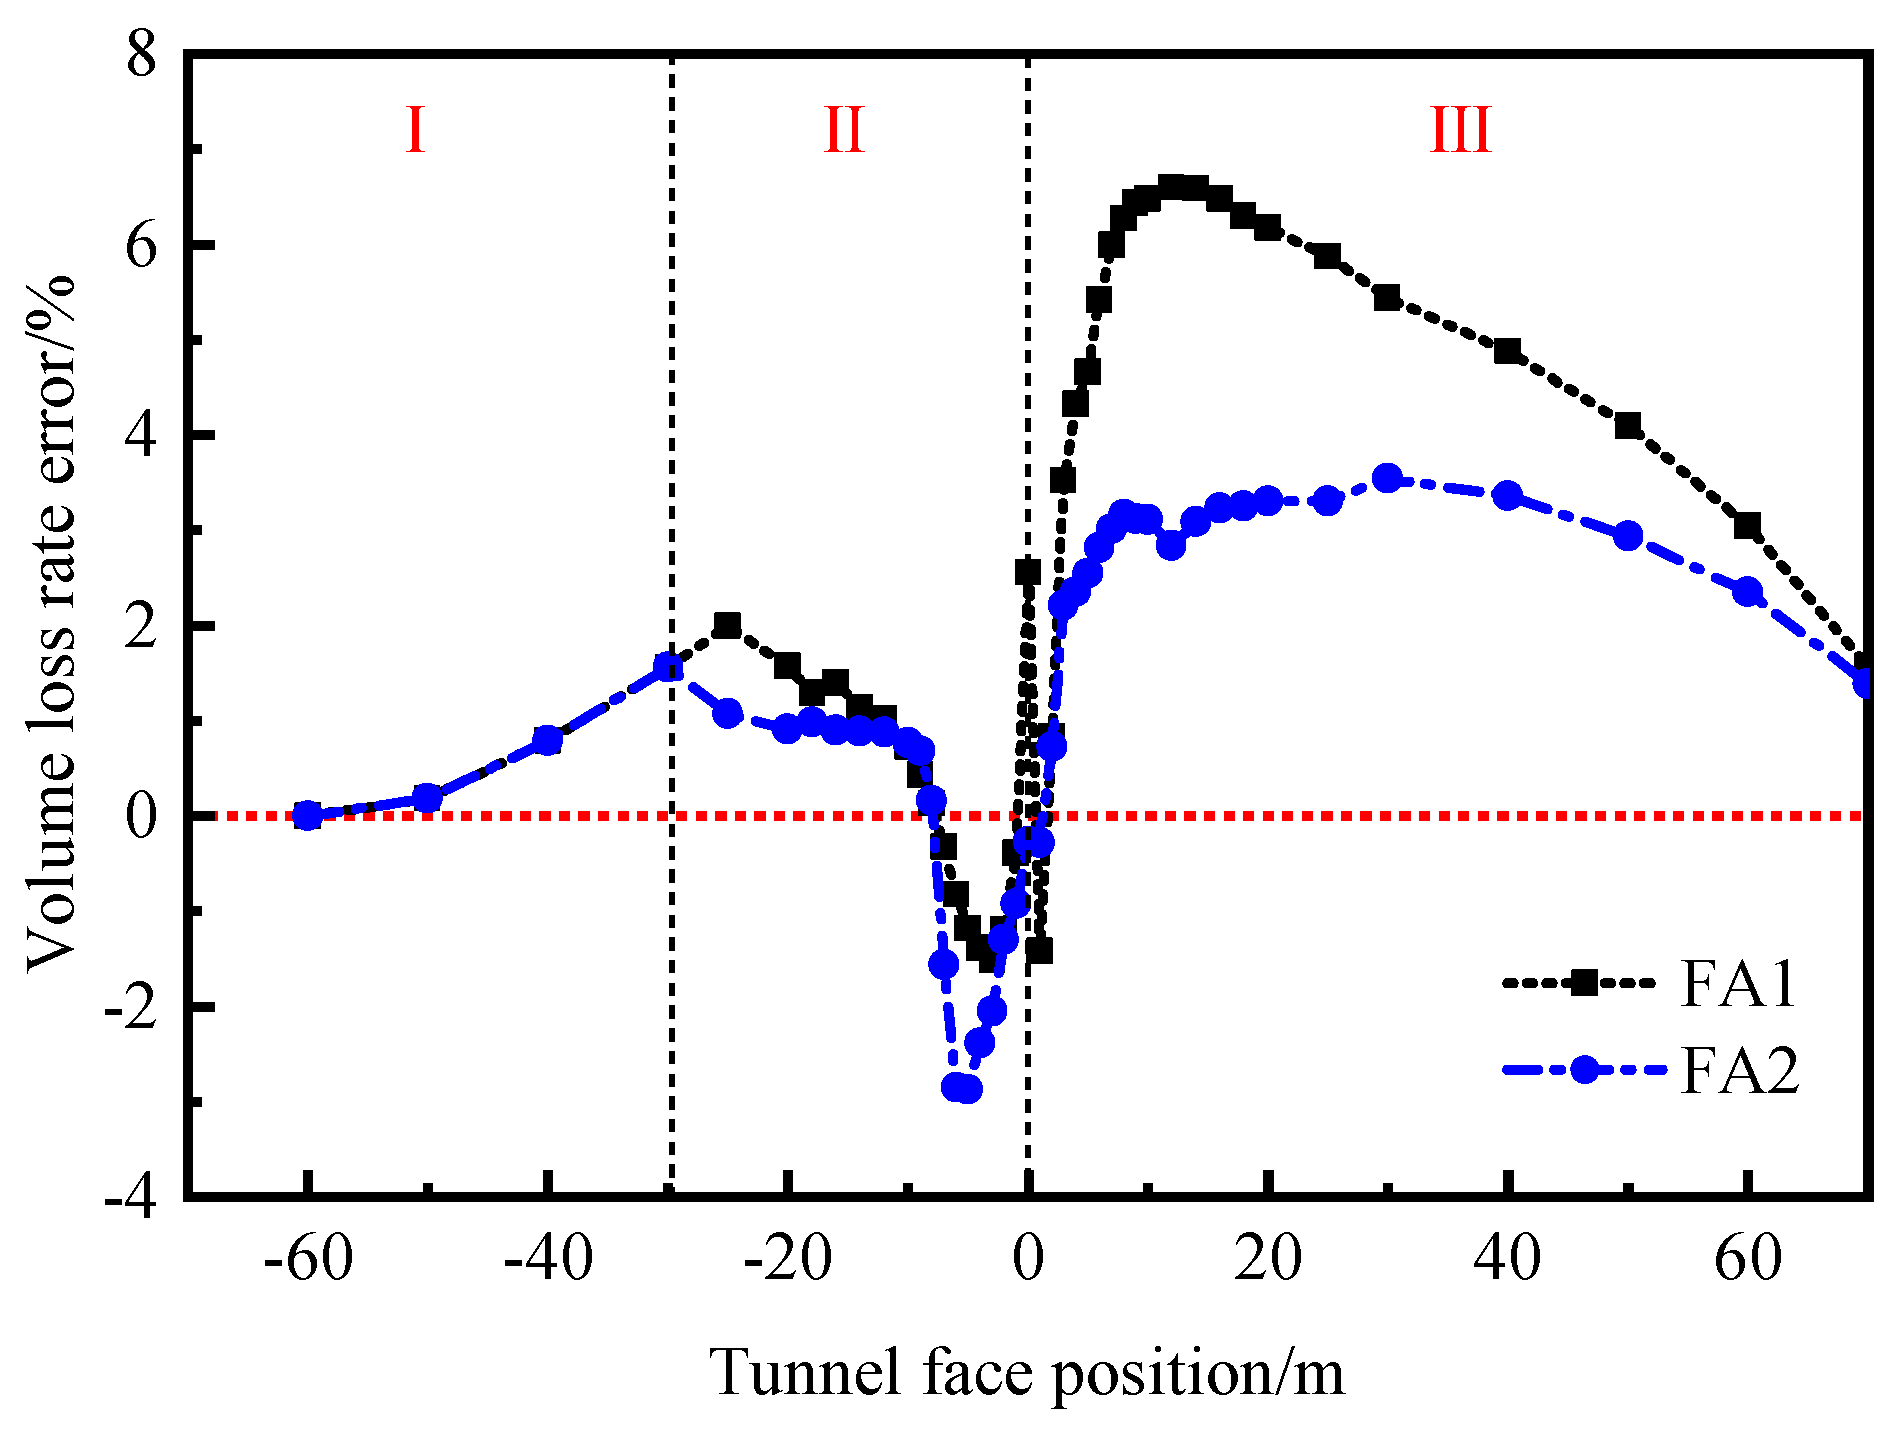
4.1. Section Deformation Error Analysis

Firstly, the deformation error of the monitoring points around the tunnel is analyzed, and the point simulation error, ω i y , k , is proposed, as shown in Formula (8):
ω i y , k = u i y , k u 0 y , k         ( i = 1 , 2 )
where y is the position of the tunnel face, k is the number of the monitoring points, i is the scheme number, and u 0 y , k is the displacement value of the monitoring point k at the tunnel face at position y in the FA0 scheme.
In order to describe the comprehensive error of excavation section deformation, the volume loss rate error δ i y is defined as:
δ i y = V i y V 0 y V 0 max × 100 %         ( i = 1 , 2 )
where V 0 y , V 1 y , and V 2 y are the volume losses [6] of each scheme when the face position is y, and V 0 max is the maximum volume loss of the FA0 scheme.
The evolution curve of the simulated error of the monitoring points of each scheme is plotted by Formula (8), as shown in Figure 10. When the tunnel face is far away from the monitoring section (y = −70 m~−30 m), the errors of each point are small in each scheme. As the tunnel face advances, the point error increases significantly. When the tunnel face is located in the area near the monitoring section (y = −30 m~0 m), the simulated errors of the monitoring points P1~P3 in FA1 are greater than 0 and reach the extreme value when y = −5 m. The simulated errors of the other monitoring points are all less than 0. FA2 is opposite to FA1. The simulated errors of the measuring points P1~P3 are less than 0, and the other measuring points are greater than 0. Overall, the point errors of each scheme fluctuate significantly, but the maximum value does not exceed 1 cm. In the process of the tunnel face passing through and away from the monitoring section (y = 0 m~70 m), the simulated errors of each point of FA1 and FA2 start from a small value, and then they develop in a trend of increasing first and then decreasing. In comparison, the point error of FA1 is basically less than 0, and the point error of FA2 is more evenly distributed above and below the 0 error line.
The volume loss error evolution curve drawn by Formula (9) is shown in Figure 11. The error evolution process in the figure can be divided into three stages: in stage I, the tunnel face is far away from the monitoring section (y = −70 m~−30 m), the volume loss errors of the two schemes are the same, the volume loss error value is small, and the error gradually increases with the advancement of excavation; in stage II, the volume loss error fluctuates greatly, the excavation position is close to the monitoring section (y = −30 m~0 m), the errors of the two schemes first increase and then decrease to 0, and then increase in the opposite direction and then decrease to 0. The error of the early scheme FA2 is small, and the simulation effect of the later scheme FA1 is better; in stage III, the monitoring section is exposed (y = 0~70 m), the error change trend of each scheme is that it increases first and then decreases, and the error value of scheme FA2 is always smaller than that of scheme FA1.
Comprehensive point simulation and volume loss error analysis show that the point simulation error distribution of scheme FA2 is more uniform, and the volume loss error is smaller in most excavation section positions, especially when y = 12 m; the volume loss rate error of scheme FA2 is reduced by 3.76% compared with scheme FA1, so scheme FA2 can better simulate the effect of true three-dimensional, full-section progressive excavation. This shows that, when tunnel deformation is used as an indicator to judge, the improved method can better describe the spatial constraint effect of the face within a certain range.

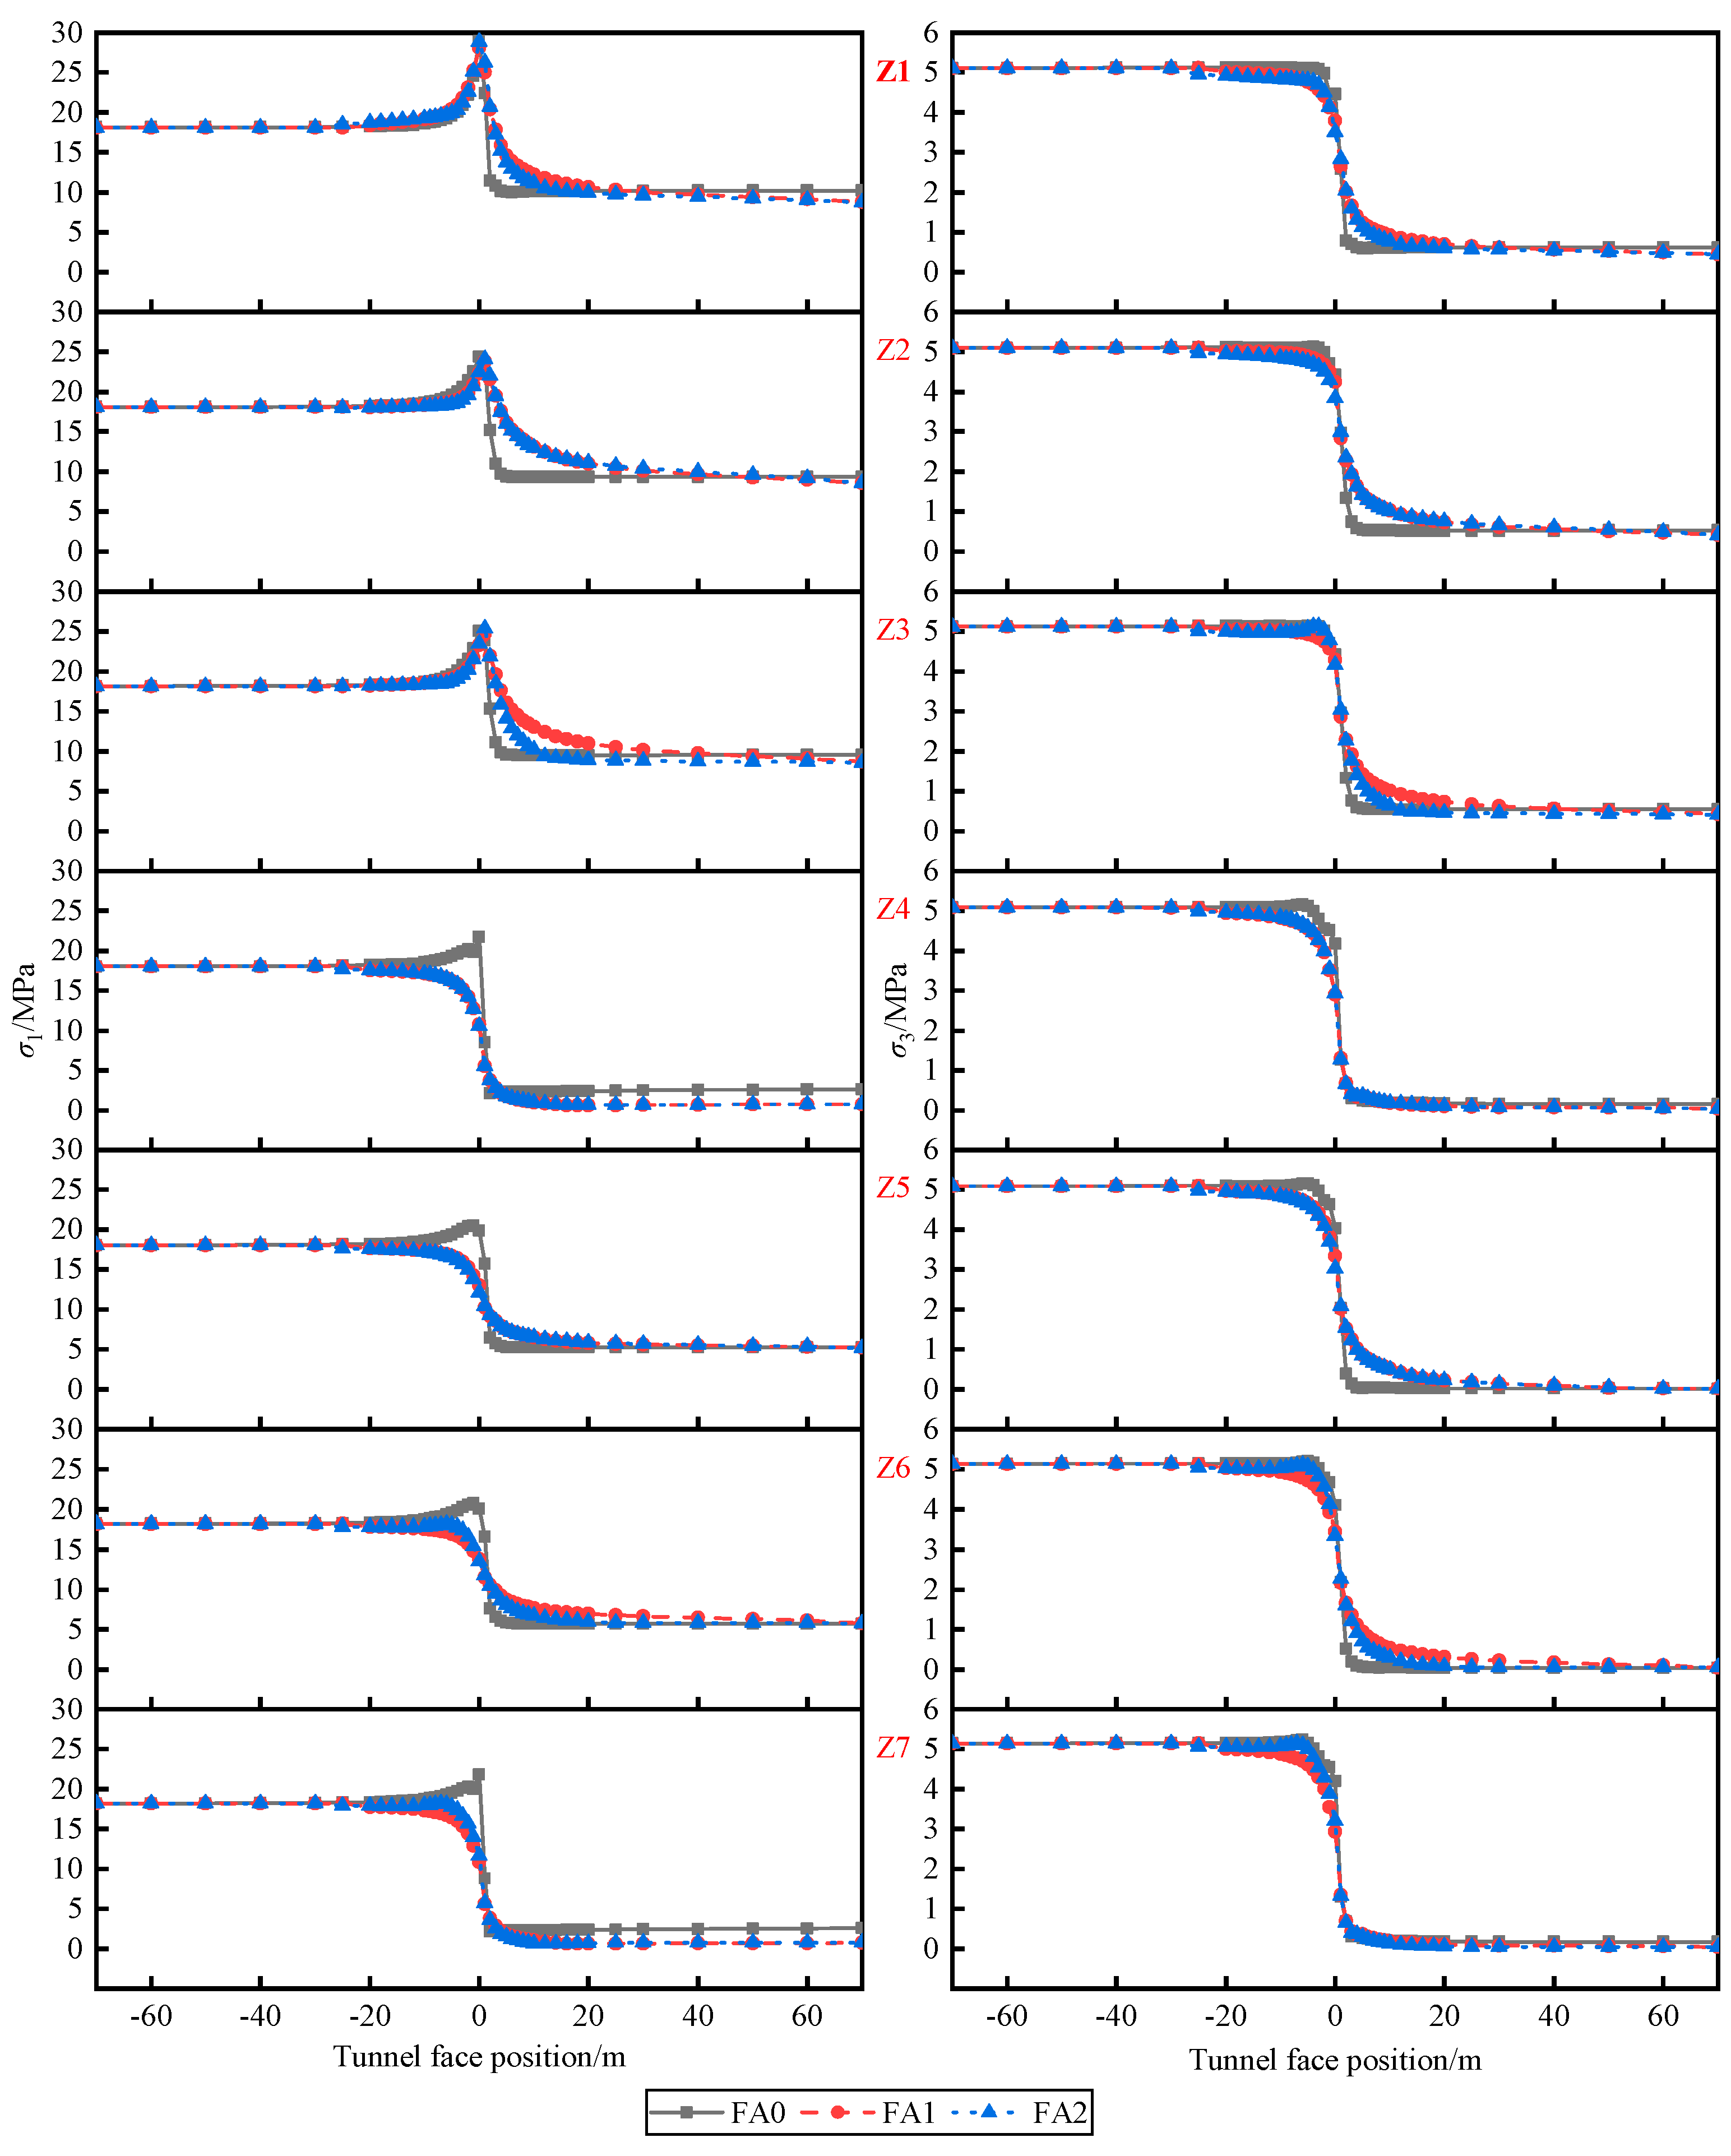
4.2. Stress Path Comparison Analysis

The study on the stress evolution process around the tunnel is shown in Figure 12. In this paper, it is agreed that the principal stress is positive with pressure, and the maximum principal stress and the minimum principal stress are σ 1 and σ 3 , respectively.
The stress evolution trend of each monitoring object in scheme FA0 is the same. σ 1 first experiences a long stable section as the tunnel face advances, and then gradually increases to the maximum value when the tunnel face approaches the monitoring section. After the monitoring section is exposed, it quickly decreases to the final stable value. σ 3 also experiences a stable section when the tunnel face is far away from the monitoring section. It continues to decrease before and after the monitoring section is exposed. The maximum value of the reduction rate appears at the overlap of the tunnel face and the monitoring section, and then reaches the final stable value. The final stable values of stresses σ 1 and σ 3 of each monitoring object are ranked as Z4 > Z3 > Z5 > Z2 > Z6 > Z1 > Z7. The stress of the unit at the waist of the tunnel is more concentrated and less likely to dissipate than that of the unit at the top and bottom of the tunnel.
The stress evolution curves of each scheme were analyzed and evaluated based on scheme FA0. The stable values a and b of the stress evolution curves of each scheme are basically the same when they are far away from the monitoring section. The area with obvious differences is near the monitoring section. In this area, the stress evolution curves of the three schemes are obviously separated. scheme FA2 is often between scheme FA0 and scheme FA1, indicating that the stress evolution of the cave wall unit in scheme FA2 is closer to that of scheme FA0.
It can be seen from Figure 12 that scheme FA2 is better than FA1 in most cases. In order to describe the improvement effect of the simulation effect at different positions, the expression of the stress error optimization amount, ς m y , k , is defined as follows:
ς m y , k = ( | σ 1 , m y , k σ 0 , m y , k σ 0 , m max | | σ 2 , m y , k σ 0 , m y , k σ 0 , m max | ) × 100 %         ( m = 1 , 3 )
where y is the position of the tunnel face, k is the monitoring position number, m is the principal stress number, and σ 0 , m max , k is the maximum value of the principal stress m at position k of scheme FA0, that is, the original rock stress.
Based on Formula (10), the maximum optimization amount of stress error of the maximum principal stress, σ 1 , and the minimum principal stress, σ 3 , at each position during the excavation process is summarized as shown in Table 3; the result shows that the greatest amount of stress error optimization is 15.64%.

5. Application of Improved Virtual Support Force Method in Determining Tunnel Support Timing

Many research works are based on the virtual support force method and are often combined with the convergence-constraint method to predict the initial support timing of the tunnel [15,23]. The above research results show that the tunnel deformation and stress evolution process of the improved virtual support force method are different from those of the traditional method. Tunnel deformation [14,23] and stress [30] can both be used as the criterion for determining the initial support timing. Therefore, the influence of the improved method considering the unevenness of the cross-section load release on the calculation of the support timing is studied for these two indicators. In the load release related calculation, in order to ensure the comparability of the calculation results, the corresponding relationship between the load release rate of other characteristic points with the top, P7, as the reference is first drawn from Figure 9, as shown in Figure 13. Both methods release the excavation load of point P7 uniformly at a ratio of 10%. The difference is that the cross-section load release distribution of the improved method is determined by Figure 13.
Refs. [14,23] determine the recommended support timing based on the deformation around the tunnel. First, the deformation value, u 0 y , 7 , of the vertex P7 during tunnel excavation is obtained, and then u 0 y , 7 is normalized to obtain the displacement completion coefficient, λ y , as shown in Formula (11):
λ y = u 0 y , 7 u 0 60 , 7
where y is the position of the tunnel face and a is the deformation value of the monitoring point P7 at 70 m of the tunnel face (i.e., when excavation is completed).
The LDP curve expression is obtained by fitting the scattered points (y, λ y ) using Formula (12):
λ y = { ( 1 λ 0 ) ( 1 e ( 1 λ 0 ) y X ) + λ 0 ,   ( y 0 ) λ 0 e ( 1 λ 0 ) y X ,                                                     ( y < 0 )
where y is the position of the tunnel face and λ 0 and X are unknown coefficients.
The deformation relationship curve of point P7 and load release is drawn based on the virtual support force method, and the turning point where the displacement increment and plastic area increment of the monitoring point change from a gentle increase to a significant increase is determined, and it is used as the recommended support timing. The corresponding displacement completion coefficient is found according to the load release rate at the turning point, and finally the displacement completion coefficient is substituted into the LDP curve formula to obtain the relative position of the recommended initial support application point and the heading face during tunnel construction. The specific process is as follows:
(1)
According to the relationship curve between the displacement release coefficient and the position of the tunnel face obtained by numerical calculation, the numerical fitting and parameter determination are performed using Formula (12), and λ 0 = 0.321 and X = 2.714 are obtained. From the calculation results, the fitting variance, SSE = 0.0535, and the correlation coefficient, R 2 = 0.9950, are obtained. Substituting the parameters into Formula (12) and converting it into the formula of the y coordinate with respect to the displacement completion coefficient, λ y , is shown in Formula (13):
y = { 2.714 1 0.321 ln ( 1 0.321 1 λ y ) ,   ( λ y 0.321 ) 2.714 1 0.321 ln ( λ y 0.302 ) ,           ( λ y < 0.321 )
(2)
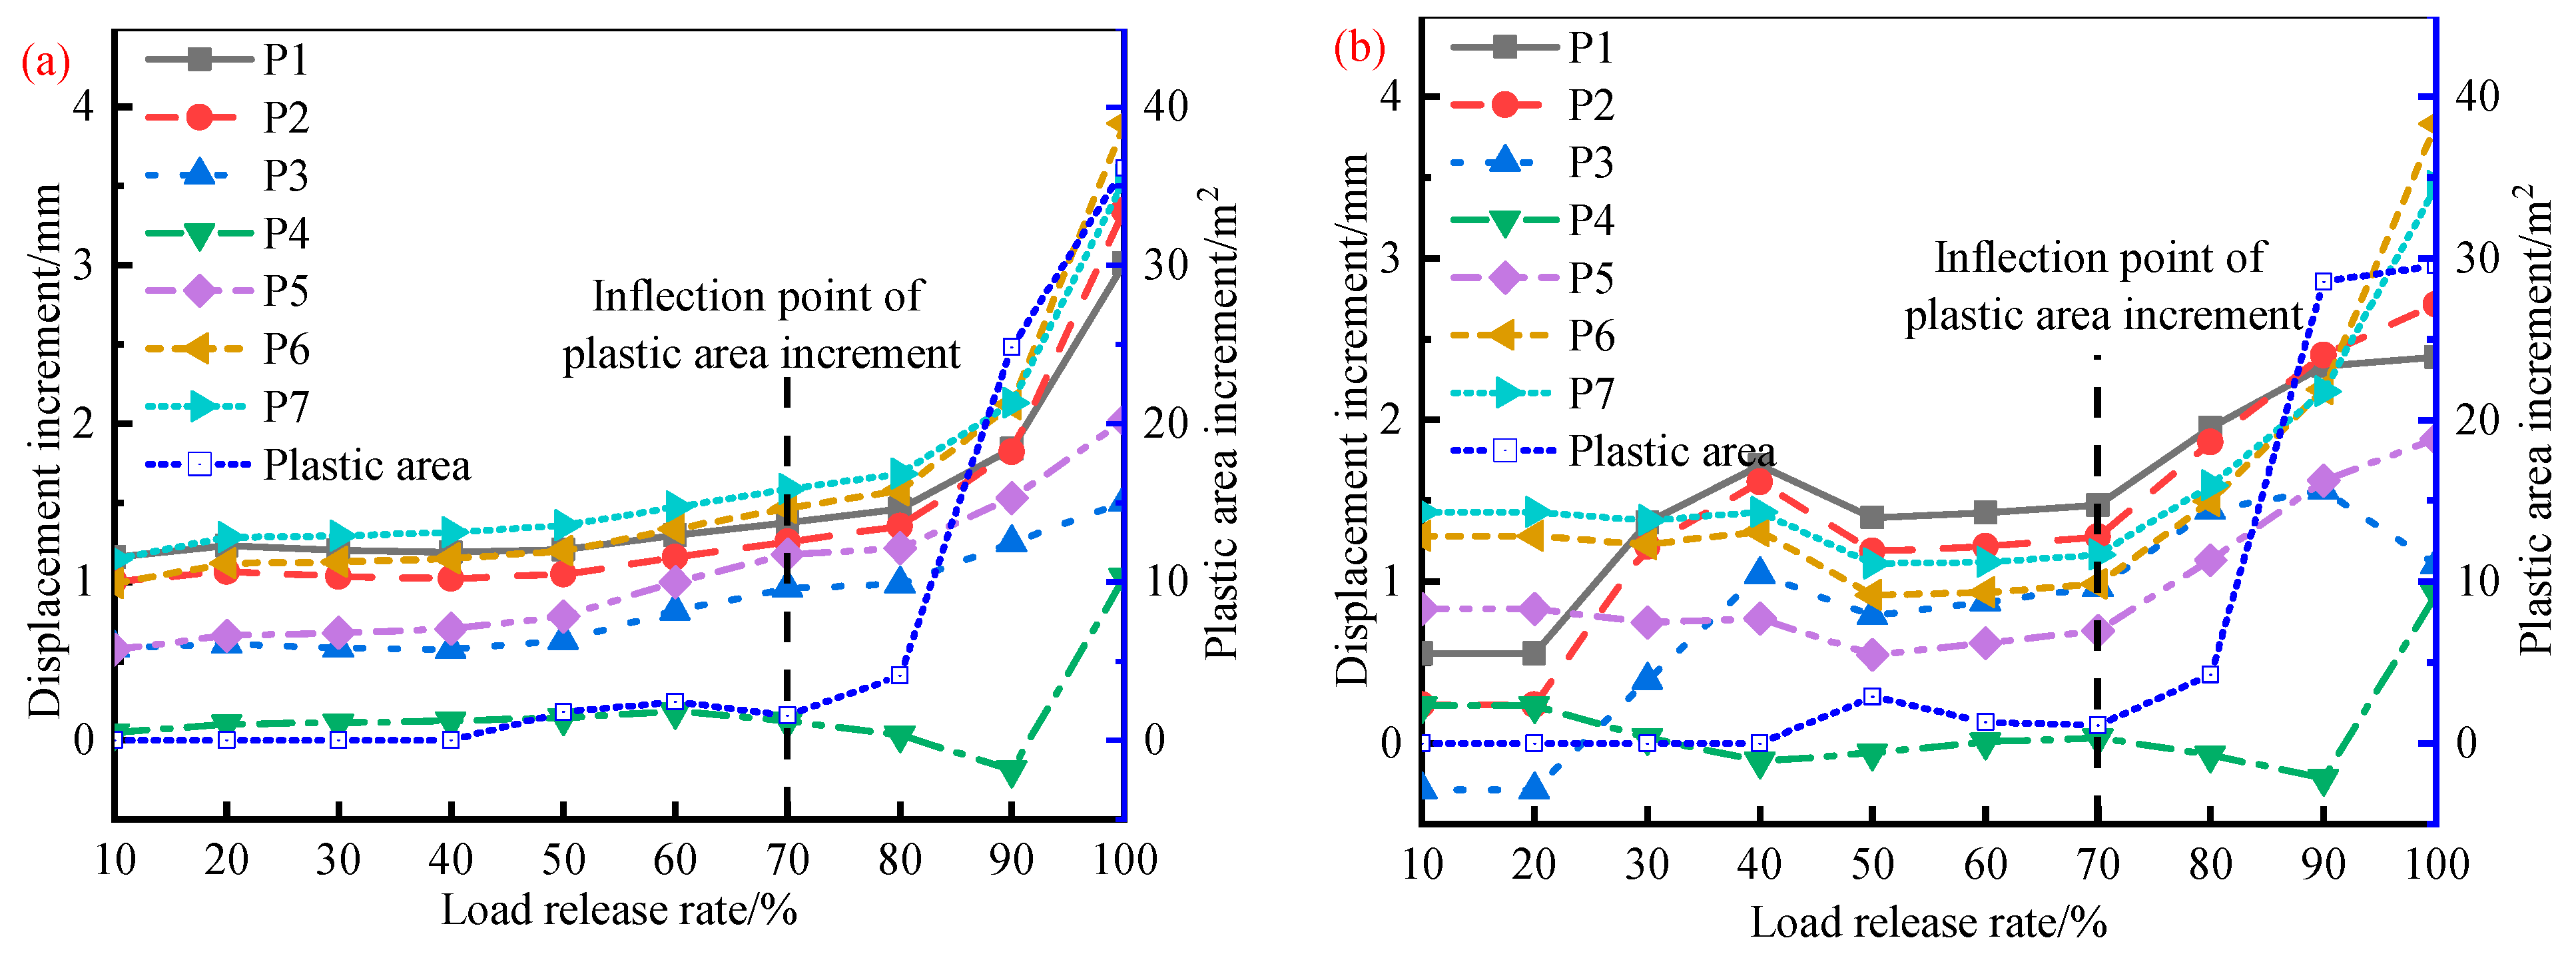
Based on the two virtual support force methods, the displacement and plastic zone increment evolution curves during the load release process are plotted, as shown in Figure 14. The turning point where the displacement and plastic zone increments change from a gentle to an obvious increase is found as the recommended support time. It can be seen from the figure that the recommended support points obtained by the two methods are both at a load release rate of 70%.
(3)
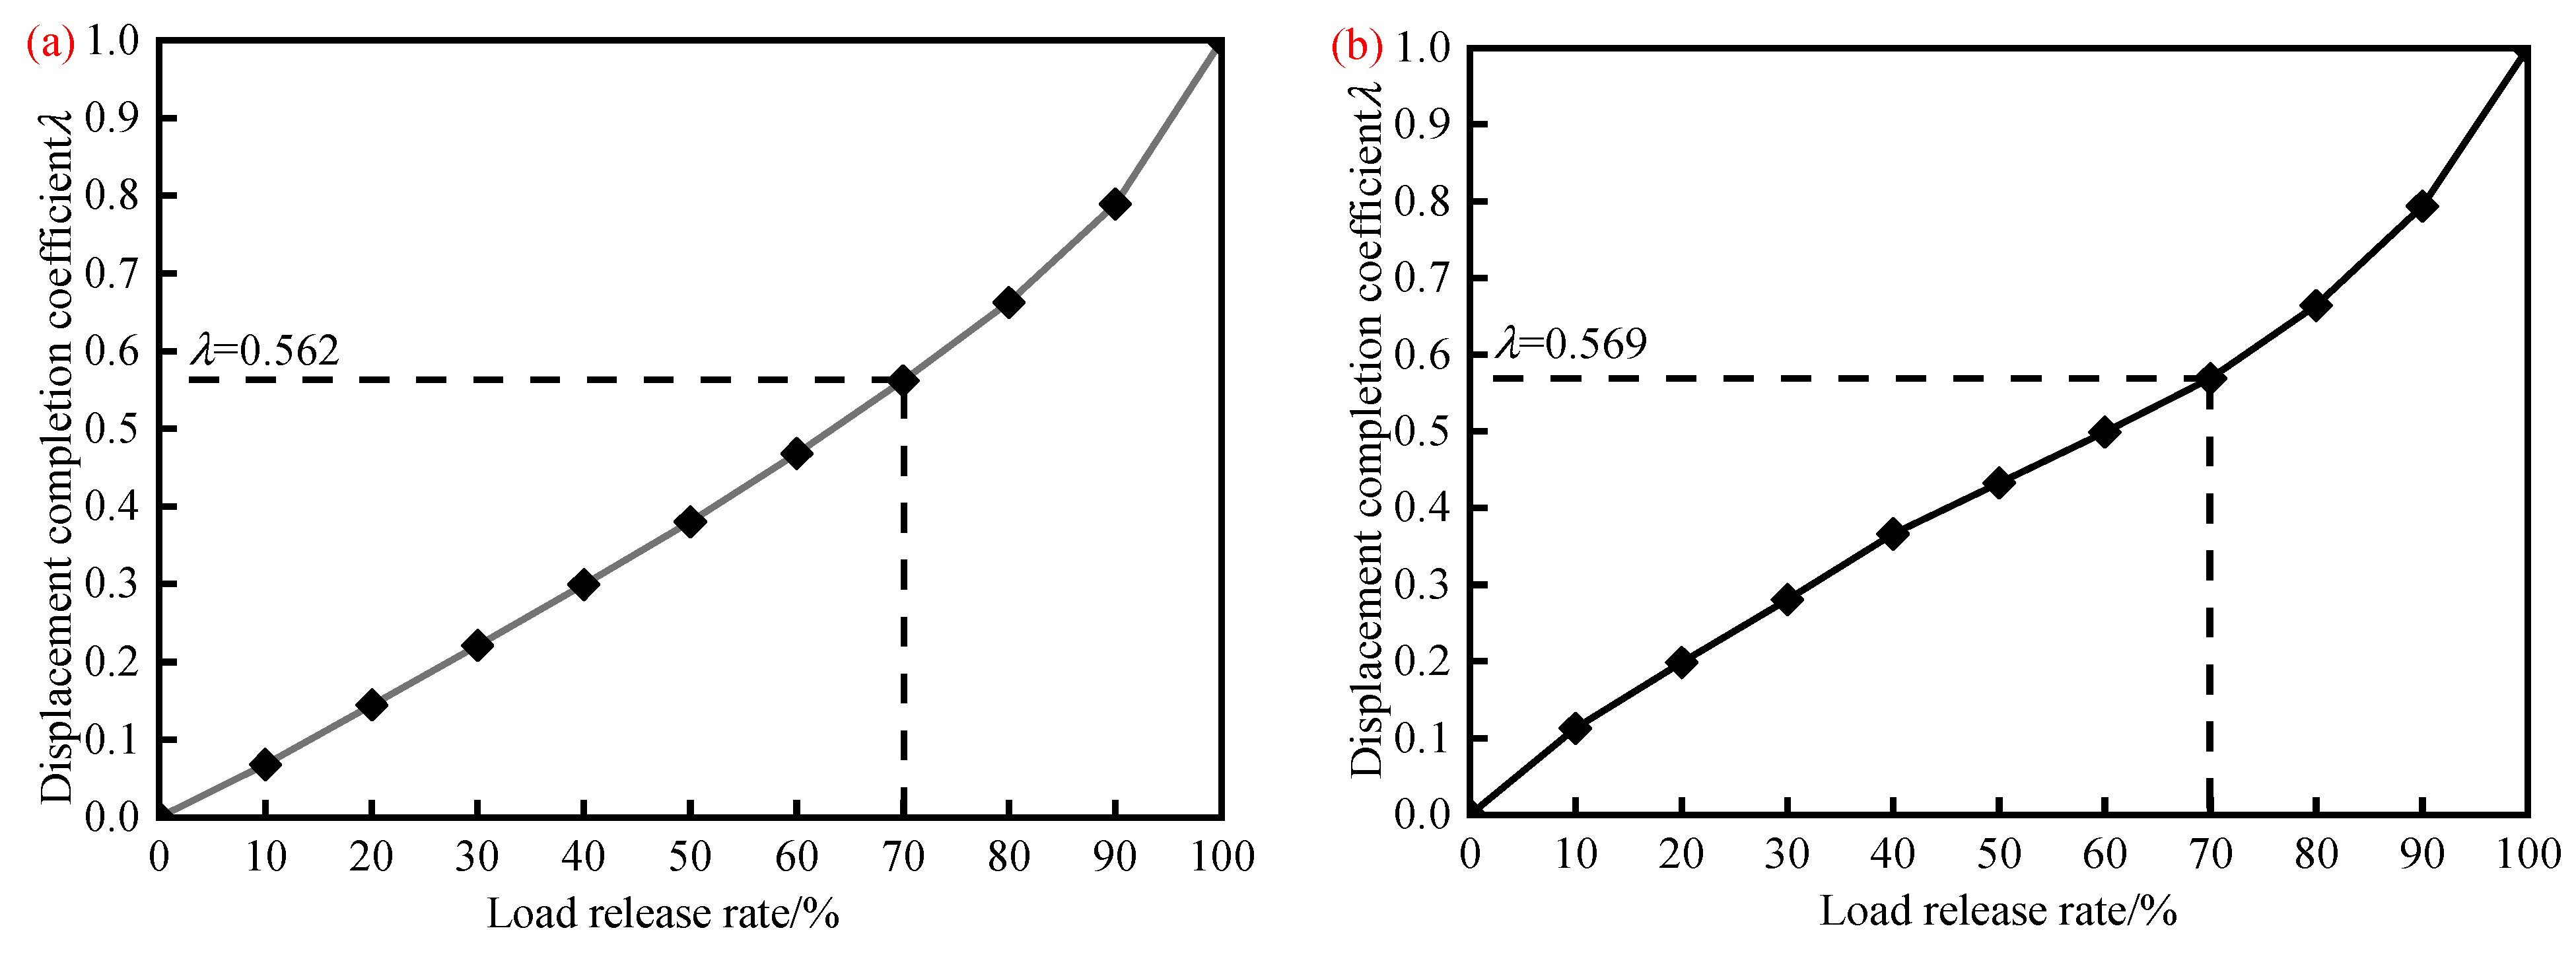
According to the displacement release coefficient and load release rate relationship curve (Figure 15), the displacement release coefficients corresponding to the recommended support points under uniform load release and non-uniform load release are 0.562 and 0.569, respectively. Finally, substituting them into Formula (13), the corresponding recommended support application points are 1.752 m and 1.817 m behind the tunnel face, respectively.
Ref. [30] determined the optimal support timing based on the stress around the tunnel. First, the point safety factor [31] based on the Mohr–Coulomb yield criterion was introduced, as shown in Formula (14), and the geometric mean of the safety factors of all unit points on the open surface of the monitoring section was taken as the overall safety factor of the monitoring section. The relationship curve between the overall safety factor of the section and the load release rate, and the relationship curve between the displacement completion coefficient and the load release rate, were drawn based on the virtual support force method; second, as the excavation load is gradually released, it is assumed that when the overall safety factor of the surrounding rock is reduced to a certain allowable value, the surrounding rock is in a critical instability state. The load release rate corresponding to this state is defined as the recommended support timing. Finally, the recommended support position is obtained based on the corresponding relationship between the face position, the face advancement distance, and the load release rate.
F = c cos φ + σ 1 + σ 3 2 sin φ σ 1 σ 3 2
where c and φ are the cohesion and internal friction angle of the tunnel, respectively, σ 1 is the maximum principal stress, and σ 3 is the minimum principal stress.
The specific process is shown in Figure 16. Based on the virtual support force method, the relationship curve between the overall safety factor of the surrounding rock and the load release rate is obtained. When the overall safety factor of the surrounding rock is set to 1.2, the surrounding rock is in a critical instability state. Through the coupling relationship between the GRC curve and the LDP curve in curves ②~③, it is concluded that the recommended support timing when the excavation load is uniformly released is 0.467 m behind the face, while the recommended support timing when the excavation load is non-uniformly released is 0.580 m. Further, the recommended support timing corresponding to the overall safety factor of various sections is statistically shown in Table 4.
Based on the above analysis, when the recommended support timing is determined by the virtual support force method based on deformation or stress standards, the non-uniform release of the cross-section excavation load will affect the determination of the support timing. In general, when the non-uniform release of the excavation load is considered, the recommended support point is farther behind the tunnel face, which can further make full use of the self-bearing capacity of the surrounding rock while reducing support consumables. The recommended support timing of the uniform release of the excavation load is more conservative, and the deformation of the surrounding rock is restricted too early, which may lead to excessive stress in the support structure. At the same time, the calculation results show that the difference between the support timings obtained by the two methods is not large. Under the premise of low accuracy requirements and the need to fully ensure the self-stability of the surrounding rock, the uniform release of the excavation load can also meet the requirements of calculating the recommended support timing.

6. Results and Discussion

In order to accurately describe the spatial constraint of the tunnel face, this paper proposes an improved virtual support force method that can take into account the uneven and uniform release of the cross-section excavation load. It is compared and analyzed with the traditional load release method from many aspects, such as calculation principle, simulation accuracy, and difference reasons. Finally, the application of the improved method in the prediction of support timing is discussed, and the following results are obtained:
(1)
In the deep-buried Class III rock mass environment, during the tunnel excavation process, the surrounding rock above the tunnel waist on the excavation profile ahead of the tunnel face experiences a continuous reduction in spatial constraint due to the influence of the tunnel face. In contrast, the surrounding rock below the tunnel waist undergoes three stages: an initial reduction in spatial constraint, a slight increase, and then a further reduction. After the tunnel section is exposed and as the tunnel face moves away, the spatial constraint across the entire section continues to dissipate, with the dissipation occurring more slowly above the tunnel waist compared to below it.
(2)
From the perspective of deformation, we evaluate the simulation error of point-based and full-section simulations to assess the effectiveness of the virtual support method in replicating tunnel deformation. The improved virtual support method demonstrates smaller errors compared to traditional methods, with the maximum optimized error in volume loss reaching 3.76%.
(3)
In terms of stress, the improved virtual support method exhibits a higher degree of consistency with the true three-dimensional excavation results. To quantify the improvement, a stress error optimization metric is proposed, showing that the improved method can reduce the stress simulation error of the virtual support method by up to 15.64%. Therefore, the improved virtual support method provides a more accurate representation of the spatial confinement effects at the tunnel face.
(4)
In the study of determining the initial support timing, the support point calculated by the improved method is farther away from the tunnel face. The improved method can more fully mobilize the surrounding rock bearing and reduce support consumables. At the same time, since the difference between the support points obtained by the two methods is not large, under the premise of low accuracy requirements or the need to fully ensure the self-stability of the surrounding rock, the uniform release scheme of excavation load can also meet the requirements of the calculation of the recommended support construction timing.
The application of the virtual support method is based on its ability to achieve a true three-dimensional excavation effect by controlling the release process of excavation loads. When using the virtual support method to guide construction design, its rationality and accuracy become even more critical. The improved method proposed in this paper outperforms the conventional method in reproducing both deformation and stress in three-dimensional models, making it more reliable for engineering design. However, in this study, the surrounding rock is modeled as an isotropic medium in the numerical simulations, which is generally not the case in natural conditions. Joints and faults often cause the surrounding rock to exhibit anisotropic characteristics. The longitudinal deformation curve used in the improved method is derived from numerical simulations, and in actual engineering projects, if the surrounding rock is isotropic or suitable monitoring points are identified, the improved method proposed in this paper would be highly meaningful.

Author Contributions

Conceptualization, K.S. and Z.X.; methodology, K.S.; software, Z.X.; validation, Z.X., J.T. and H.Z.; formal analysis, Z.X.; investigation, Z.X., J.T. and H.Z.; data curation, Z.X.; writing—original draft preparation, Z.X. and J.T.; visualization, K.S. and Z.X.; supervision, K.S. All authors have read and agreed to the published version of the manuscript.

Funding

This research was supported by the Science and Technology Major Project of Xizang Autonomous Region of China (Grant No. XZ202201ZD0003G), the National Natural Science Foundation of China (Grant No. 51879207), and the National Key Research and Development Program of China (Grant No. 2016YFC0401803).

Data Availability Statement

All data, models, or codes that support the findings of this study are available from the corresponding author upon reasonable request.

Conflicts of Interest

Author Kai Su was employed by the company POWERCHINA Chengdu Engineering Corporation Limited. The remaining authors declare that the research was conducted in the absence of any commercial or financial relationships that could be construed as a potential conflict of interest.

References

  1. Eberhardt, E. Numerical Modelling of Three-Dimension Stress Rotation Ahead of an Advancing Tunnel Face. Int. J. Rock Mech. Min. Sci. 2001, 38, 499–518. [Google Scholar] [CrossRef]
  2. Alejano, L.R.; Alonso, E.; Rodríguez-Dono, A.; Fernández-Manín, G. Application of the Convergence-Confinement Method to Tunnels in Rock Masses Exhibiting Hoek–Brown Strain-Softening Behaviour. Int. J. Rock Mech. Min. Sci. 2010, 47, 150–160. [Google Scholar] [CrossRef]
  3. Vlachopoulos, N.; Diederichs, M.S. Improved Longitudinal Displacement Profiles for Convergence Confinement Analysis of Deep Tunnels. Rock Mech. Rock Eng. 2009, 42, 131–146. [Google Scholar] [CrossRef]
  4. Li, J.P.; Duan, X.Q.; Yan, X.X. Numerical Study on Rules of Stress Release in Tunnel During Excavation. J. Water Res. Arch. Eng. 2007, 5, 59–62. [Google Scholar]
  5. Lisjak, A.; Grasselli, G.; Vietor, T. Continuum–Discontinuum Analysis of Failure Mechanisms around Unsupported Circular Excavations in Anisotropic Clay Shales. Int. J. Rock Mech. Min. Sci. 2014, 65, 96–115. [Google Scholar] [CrossRef]
  6. Xu, X.; Wu, Z.; Liu, Q. An Improved Numerical Manifold Method for Investigating the Mechanism of Tunnel Supports to Prevent Large Squeezing Deformation Hazards in Deep Tunnels. Comput. Geotech. 2022, 151, 104941. [Google Scholar] [CrossRef]
  7. Duncan, J.M.; Dunlop, P. Slopes in Stiff-Fissured Clays and Shales. J. Soil Mech. Found. Div. 1968, 95, 467–492. [Google Scholar] [CrossRef]
  8. Kielbassa, S.; Duddeck, H. Stress-Strain Fields at the Tunnelling Face? Three-Dimensional Analysis for Two-Dimensional Technical Approach. Rock Mech. Rock Eng. 1991, 24, 115–132. [Google Scholar] [CrossRef]
  9. Sun, J.; Zhu, H.H. Mechanical simulation and analysis of construction behavior of tunnel in soft surrounding rock. Rock Soil Mech. 1994, 20–33. [Google Scholar] [CrossRef]
  10. Zhu, H.H.; Yang, L.D. Theoretical basis of “generalized virtual support force method”. In Rock Mechanics Problems in Hydropower and Mining Engineering—Collection of the Academic Conference on Rock Mechanics and Engineering Applications in Northern China; China Science Publishing & Media Ltd.: Zhengzhou, China, 1991; pp. 184–188. [Google Scholar]
  11. Zhang, C.Q.; Feng, X.T.; Zhou, H.; Huang, S.L. Study of some problems about application of stress release method to tunnel excavation simulation. Rock Soil Mech. 2008, 29, 1174–1180. [Google Scholar] [CrossRef]
  12. Galli, G.; Grimaldi, A.; Leonardi, A. Three-Dimensional Modelling of Tunnel Excavation and Lining. Comput. Geotech. 2004, 31, 171–183. [Google Scholar] [CrossRef]
  13. Yang, Y.B.; Zheng, J.J.; Lai, H.J.; Wu, X.G. A Revised Method for Calculation Stress Release Ratio in Tunnel Excation. Chin. J. Rock Mech. Eng. 2015, 34, 2251–2257. [Google Scholar] [CrossRef]
  14. Su, K.; Zhang, Y.J.; Cui, J.P.; Li, C.A. Installation Time of Ground Support during Tunnel Excavation: A Novel Graph Methodology. KSCE J. Civ. Eng. 2020, 24, 3866–3874. [Google Scholar] [CrossRef]
  15. Yang, L.; Han, L.J.; Wei, L.Y. Analysis on reasonable tunnel support timing based on virtual support force. Mod. Tunn. Technol. 2012, 49, 66–71. [Google Scholar] [CrossRef]
  16. Zhou, Z.H.; He, C.; Chen, Z.Q.; Ma, W.B.; Wang, B.; Zhou, W.H. Virtual Supporting Force Method for Tunnel Support Timing Based on the Concept of Active Deformation Control of Surrounding Rock. Chin. Railw. Sci. 2022, 43, 76–88. [Google Scholar]
  17. Zhao, Y.; Li, S.C.; Zhao, Y.; Li, L.P. Model test study of surrounding rock load release during super-large section tunnel excavation. Chin. J. Rock Mech. Eng. 2012, 31, 3821–3830. [Google Scholar]
  18. Li, S.C.; Zhao, Y.; Li, L.P.; Zhou, Y.; Liu, Q. Study of construction section comprehensive load releasing process of ultra-large section railway tunnel. Rock Soil Mech. 2011, 32, 2845–2851. [Google Scholar] [CrossRef]
  19. Liu, Z.Q.; Lian, Z.B.; Zhang, Q. Comparative Analysis of Excavation Unloading Simulation Methods for the Diversion Tunnel. Chin. J. Undergr. Space Eng. 2014, 10, 415–422. [Google Scholar]
  20. Mana, A.I.; Clough, G.W. Prediction of Movements for Braced Cuts in Clay. Geotech. Spec. Publ. 2002, 107, 1840–1858. [Google Scholar] [CrossRef]
  21. Sun, J. Mechanical Simulation of Construction Behavior of Caverns in Soft and Broken Surrounding Rock. In Underground Engineering Design Theory and Practice; Shanghai Science and Technology Press: Shanghai, China, 1996; pp. 119–153. [Google Scholar]
  22. Chu, Z.; Wu, Z.; Liu, B.; Liu, Q. Coupled Analytical Solutions for Deep-Buried Circular Lined Tunnels Considering Tunnel Face Advancement and Soft Rock Rheology Effects. Tunn. Undergr. Space Technol. 2019, 94, 103111. [Google Scholar] [CrossRef]
  23. Zhang, Y.-J.; Su, K.; Qian, Z.-D.; Wu, H.-G. Improved Longitudinal Displacement Profile and Initial Support for Tunnel Excavation. KSCE J. Civ. Eng. 2019, 23, 2746–2755. [Google Scholar] [CrossRef]
  24. Carranza-Torres, C.; Fairhurst, C. Application of the Convergence-Confinement Method of Tunnel Design to Rock Masses That Satisfy the Hoek-Brown Failure Criterion. Tunn. Undergr. Space Technol. 2000, 15, 187–213. [Google Scholar] [CrossRef]
  25. Cui, L.; Zheng, J.J.; Miao, C.X.; Dong, Y.K. Coupling analysis of longitudinal deformation profile and ground reaction curve. Chin. J. Geotech. Eng. 2014, 36, 707–715. [Google Scholar]
  26. Su, K.; Zhang, Y.J.; Chang, Z.H.; Wu, H.G.; Wang, T.; Zhou, W. Transverse Extent of Numerical Model for Deep Buried Tunnel Excavation. Tunn. Undergr. Space Technol. 2019, 84, 373–380. [Google Scholar] [CrossRef]
  27. Su, K.; Chang, Z.H.; Cui, J.P.; Wu, H.G. Study of model longitudinal range in numerical simulation of deep tunnel excavations. Rock Soil Mech. 2016, 37 (Suppl. S2), 706–714. [Google Scholar] [CrossRef]
  28. Sun, Z.Y.; Zhang, D.L.; Hou, Y.J.; Li, A. Whole-process deformation laws and determination of stability criterion of surrounding rock of tunnels based on statistics of field measured data. Chin. J. Geotech. Eng. 2021, 43, 1261–1270, 1376–1377. [Google Scholar]
  29. Zhang, Y.J.; Su, K.; Zhou, L.; Wu, H.G. Estimation of ground support installation time based on the tunnel longitudinal displacement of convergence-confinement method. Rock Soil Mech. 2017, 38 (Suppl. S1), 471–478. [Google Scholar] [CrossRef]
  30. Zhang, Y.J.; Su, K.; Zhu, H.Z.; Qian, Z.D.; Wu, H.G. Installation Time of an Initial Support for Tunnel Excavation upon the Safety Factors of Surrounding Rock. Appl. Sci. 2020, 10, 5653. [Google Scholar] [CrossRef]
  31. Zheng, W.T. Contrast on Strength Reduction Method and Point Safety Factor Method with FLAC 3D. J. Water Res. Archit. Eng. 2010, 8, 54–57. [Google Scholar]
Figure 1. Spatial constraints on the tunnel face: (a) Longitudinal restraint (semi-dome); (b) Lateral restraint (ring shape).
Buildings 14 02869 g001
Figure 2. Partial schematic diagram of virtual support force.
Buildings 14 02869 g002
Figure 3. Coupling effect between LDP and GRC.
Buildings 14 02869 g003
Figure 4. Improved flow chart of virtual support force method.
Buildings 14 02869 g004
Figure 5. Numerical calculation model and monitoring schematic diagram: (a) Three-dimensional computational model; (b) Schematic diagram of monitoring points and monitoring zones.
Buildings 14 02869 g005
Figure 6. Schematic diagram of excavation steps.
Buildings 14 02869 g006
Figure 7. Longitudinal deformation curve.
Buildings 14 02869 g007
Figure 8. Ground reaction curve.
Buildings 14 02869 g008
Figure 9. Relationship curve between tunnel face position and load release rate.
Buildings 14 02869 g009
Figure 10. Point simulation error evolution curve: (a) FA1; (b) FA2.
Buildings 14 02869 g010
Figure 11. Volume loss error evolution curve.
Buildings 14 02869 g011
Figure 12. Monitoring object stress evolution curve.
Buildings 14 02869 g012
Figure 13. Corresponding relationship of characteristic point load release rate.
Buildings 14 02869 g013
Figure 14. Displacement increment and plastic zone increment evolution curve: (a) Uniform release of cross-section excavation load; (b) Uneven release of cross-section excavation load.
Buildings 14 02869 g014
Figure 15. Relationship curve between displacement completion coefficient and load release rate: (a) Uniform release of cross-section excavation load; (b) Uneven release of cross-section excavation load.
Buildings 14 02869 g015
Figure 16. The process of deducing the recommended support timing based on surrounding rock safety factor method: (a) Uniform release of cross-section excavation load; (b) Uneven release of cross-section excavation load.
Buildings 14 02869 g016
Table 1. The standard for the stress release coefficient.
Stress Release Coefficient
Expression
Detailed Description
(1) i ( y ) = u ( y ) / u ( ) [9,10]Where u ( y ) is the deformation of the tunnel wall at a distance y from the tunnel face, and u ( ) is the stable displacement.
(2) i ( y ) = V ( y ) V ( ) × 100 % [13]Where V ( y ) is the volume loss of the tunnel section at a distance y from the tunnel face, and V ( ) is the maximum volume loss.
(3) i ( y ) = 1 α e m y [22]Where 1 α is the instantaneous stress release rate of the tunnel, m = 3.15 / 2 r 1 .
(4) LDP ( y , u ) ~ GRC ( u , i ) : i ( y ) [23,24,25]Where LDP ( y , u ) is the longitudinal deformation curve of the surrounding rock, and GRC ( u , i ) is the response curve of the surrounding rock.
Table 2. Scheme design table.
Scheme NameMethod of CalculationThe Reference Point of Load Release Process
FA0Full section excavation step by step-
FA1Virtual support force method1(P7)
FA2Improved virtual support force method7(P1~P7)
Table 3. Maximum optimization value of stress error at each position (%).
Monitoring ObjectZ1Z2Z3Z4Z5Z6Z7
σ 1 6.751.1815.640.170.965.947.56
σ 3 3.332.167.400.670.816.737.68
Table 4. Recommended support timing determination process.
Scheme Name F ¯ i /% λ y /m
Uniform release of cross-section excavation load1.172.5130.5881.259
1.255.2550.4260.467
1.337.5460.280−0.304
1.418.4650.133−2.503
Uneven release of cross-section excavation load1.173.5750.6031.419
1.253.4390.4550.580
1.335.5120.3280.080
1.420.5340.203−1.242
Disclaimer/Publisher’s Note: The statements, opinions and data contained in all publications are solely those of the individual author(s) and contributor(s) and not of MDPI and/or the editor(s). MDPI and/or the editor(s) disclaim responsibility for any injury to people or property resulting from any ideas, methods, instructions or products referred to in the content.

