Article

Field Study on Winter Thermal Comfort of Occupants of Nursing Homes in Shandong Province, China

by
Ninghan Sun
1,
Xin Ding
2,
Jialin Bi
3,4,* and
Yanqiu Cui
2,*
1
School of Art, Shandong Jianzhu University, Jinan 250101, China
2
School of Architecture and Urban Planning, Shandong Jianzhu University, Jinan 250101, China
3
China Mobile Group Shandong Co., Ltd., Jinan 250001, China
4
School of Mathematics, Shandong University, Jinan 250100, China
*
Authors to whom correspondence should be addressed.
Buildings 2024, 14(9), 2881; https://doi.org/10.3390/buildings14092881
Submission received: 12 August 2024 / Revised: 3 September 2024 / Accepted: 9 September 2024 / Published: 12 September 2024
(This article belongs to the Special Issue Thermal Fluid Flow and Heat Transfer in Buildings)

Abstract

:
The increasing population aging in China has led to a growing demand for nursing homes. The indoor thermal comfort of nursing homes affects the occupants’ quality of life, building energy consumption, and carbon emissions. This study used thermal comfort questionnaires, environment tests, and physiological parameter tests to conduct a field survey of 954 occupants (including the elderly and the adult staff) in nursing homes in Shandong Province, China, and analyzed the thermal comfort of occupants. Results showed that in Shandong Province, there was a significant difference in thermal sensation between the elderly and adults under the same conditions. The neutral temperatures for the elderly and adults were 21.7 and 20.5 °C, the comfort temperature ranges were 19.4–24.0 °C and 18.6–22.5 °C, and the preferred temperatures were 23.8 and 23.1 °C, respectively. The elderly prefer higher temperatures than adults. Personal clothing insulation was significantly negatively correlated with operative temperature. Occupants’ average skin temperature was significantly positively correlated with operative temperature and mean thermal sensation votes. Based on the simulation results of building energy consumption and carbon emissions, this paper proposes design strategies for nursing homes that balance thermal comfort and energy savings.

1. Introduction

With the advancement of medical technology and the improvement of living standards, the aging of the population has gradually become a global issue [1]. In 2020, the number of people aged 60 years and older outnumbered children younger than 5 years. By 2030, 1 in 6 people in the world will be aged 60 years or over. It is estimated that by 2050, the population aged 80 years and older will reach 426 million [2]. In recent years, the proportion of the elderly population in China has been rapidly increasing [3,4]. The seventh national population census report released by the National Bureau of Statistics of China in May 2021 shows that the population of China is approximately 1.411 billion people. The population aged 60 and above is approximately 264 million, accounting for 18.7% of the total population. It is expected that by 2035, the number of people aged 60 and above will exceed 400 million, accounting for over 30% of the total population, and China will become a severely aging society [5]. Consequently, China’s demand for various elderly care buildings is constantly increasing. In 2022, China proposed to vigorously support the construction and development of specialized elderly care buildings to improve the living environment of the elderly. Through these measures, the elderly can obtain better elderly care services and a comfortable living environment [6].
The indoor thermal environment of nursing homes is crucial to physical and mental health. For the elderly, as age increases, their body functions will continue to decline, such as through muscle atrophy, reduced blood circulation, reduced metabolic rate, etc. [7,8,9]. These issues result in a decreased ability of the elderly to regulate their body temperature, making them less tolerant of high and low temperatures [10]. In China, surveys reveal that the elderly in nursing homes spend an average of about 21 h per day indoors [11]. If nursing homes cannot provide comfortable indoor hot environments for the elderly, it will expose them to cold or hot environments for a long time, which will bring significant health risks to the elderly, including colds, cardiovascular diseases, and a series of complications [12,13]. Nursing homes need to maintain a comfortable thermal environment.
The thermal environment of buildings is closely related to energy consumption and carbon emissions. Currently, countries around the world are advocating for energy conservation and emission reduction [14,15]. China has a large land area with varied climatic conditions across different regions. According to China’s architectural thermal engineering design standards, the country is classified into five climate zones: severe cold; cold; hot summer and cold winter; hot summer and warm winter; and mild areas [16]. In severe-cold and cold regions, where winter temperatures are low, heating is required to achieve a comfortable thermal environment in buildings. In China, buildings are typically heated by burning fossil fuels to ensure indoor thermal comfort, which is one of the primary causes of building energy consumption and carbon dioxide emissions [17,18]. This implies that studying the indoor thermal environment and thermal comfort of nursing homes is of great significance for both the physical and mental health of the elderly and for energy conservation and emissions reduction in buildings.
The most commonly used international standards for thermal comfort design are ASHRAE 55, ISO 7730, and EN 16798 [19,20,21], which are primarily applicable to residents in European and American countries [22]. Studies have found variations in thermal perception among residents in different climatic environments. For instance, Sheikh conducted research on the thermal comfort temperatures in classrooms for Malaysian and Japanese students during summer, finding differences in the comfortable temperatures of these two regions and the adaptive behaviors of the students [23]. Zheng’s research found that climate zones affect residents’ thermal comfort, with different neutral temperatures for residents in various climatic zones [24]. This means that these European and American standards may not necessarily apply to Chinese residents.
The thermal comfort standard in China is GB50736 [25]. Studies have shown that the actual thermal comfort parameters of residents differ from those obtained using the predicted mean vote model specified in this standard. Jiao analyzed the thermal comfort and adaptive behaviors of the elderly in Shanghai, finding that the actual neutral temperatures in winter were lower than those predicted by the PMV model, with no significant differences in summer [26]. Wu’s research found that the actual mean thermal sensation votes of the elderly in Chongqing are lower than those estimated by the PMV model [27]. Zhang’s research indicated that the actual neutral temperatures of residents in the rural areas of Guizhou during winter are lower than the predicted neutral temperatures, showing discrepancies between the PMV model and actual thermal comfort [28]. Therefore, it is necessary to research actual thermal comfort parameters.
Additionally, the standards above are primarily targeted at relatively younger populations and may not be suitable for the elderly [29,30]. Physiological, psychological, and behavioral factors influence the perception of thermal environments, but these factors differ between young and elderly individuals, leading to variations in thermal perception between these age groups [31,32]. Currently, some scholars have conducted field surveys specifically focusing on the thermal comfort of the elderly. Hughes studied the thermal comfort of elderly individuals in the UK during winter, revealing that the ISO7730 predicts their actual thermal comfort with some inaccuracies, which could lead to excessive increases in heating energy consumption [33]. Sudarsanam researched the thermal comfort range of elderly residents in India and identified common adaptive behaviors they use to achieve thermal comfort [34]. Baquero studied the summer thermal comfort temperatures of elderly residents in five care homes in Spain’s Mediterranean climate, finding that the elderly feel colder than younger people under the same environmental conditions [22]. Forcada analyzed the winter thermal comfort of elderly residents in nursing homes in Spain’s Mediterranean climate and found that the elderly were less sensitive to temperature increases compared to the adult nursing staff. Further analysis of summer thermal comfort showed that the elderly have a higher comfort temperature and greater tolerance for high temperatures than the adult nursing staff [30,35]. Hwang’s research in Korea showed that the elderly perceive the environment to be colder [36]. Tartarini studied the summer thermal perceptions of residents in five Australian nursing homes, finding that the elderly can tolerate temperature changes better than adult staff and have a higher neutral temperature than adult staff or visitors [37].
Existing studies have shown that various factors such as different climatic conditions and age affect residents’ actual thermal comfort perception. The PMV model in the current thermal comfort standards does not apply to all populations, necessitating the establishment of specific thermal comfort standards for different climatic zones and age groups. Current studies on indoor thermal comfort in Shandong Province, China, mainly focus on public buildings with complex personnel compositions [38,39]. Few studies specifically investigate the actual thermal comfort of occupants in nursing homes in Shandong. To design comfortable nursing homes and enhance the health and well-being of the elderly, it is necessary to study the thermal comfort parameters of the elderly in nursing homes in Shandong. The thermal comfort parameters of adult staff within nursing homes may differ from those of the elderly. Since the indoor thermal environment directly impacts building energy consumption, researching the differences in thermal comfort parameters between the elderly and the adult staff can help managers control the thermal environment for targeted groups, which is beneficial for energy conservation and emission reduction in buildings.
This study focuses on the thermal comfort of the occupants in nursing homes in Shandong during winter (including the elderly and the adult staff). The research aims to achieve the following: (a) Develop a thermal comfort model suitable for the occupants of nursing homes in Shandong, compare the thermal comfort between the elderly and the adult staff through neutral temperature and comfortable temperature ranges, and verify the applicability of the PMV model. (b) Investigate the thermal preferences of nursing home occupants, calculating and comparing the preferred temperatures of the elderly and of the adult staff. (c) Study the adaptive behaviors that affect the thermal comfort of nursing home occupants, exploring the relationship between human physiological parameters and thermal comfort. (d) Study the impact of thermal comfort temperatures on building energy consumption and carbon dioxide emissions, and establish suitable heating set temperatures for nursing home occupants.

2. Method

To analyze the thermal comfort of nursing home occupants in Shandong during the winter heating period, data were collected from six nursing homes in the region from December 2022 to January 2023. All participants signed an informed consent form during the experiment.

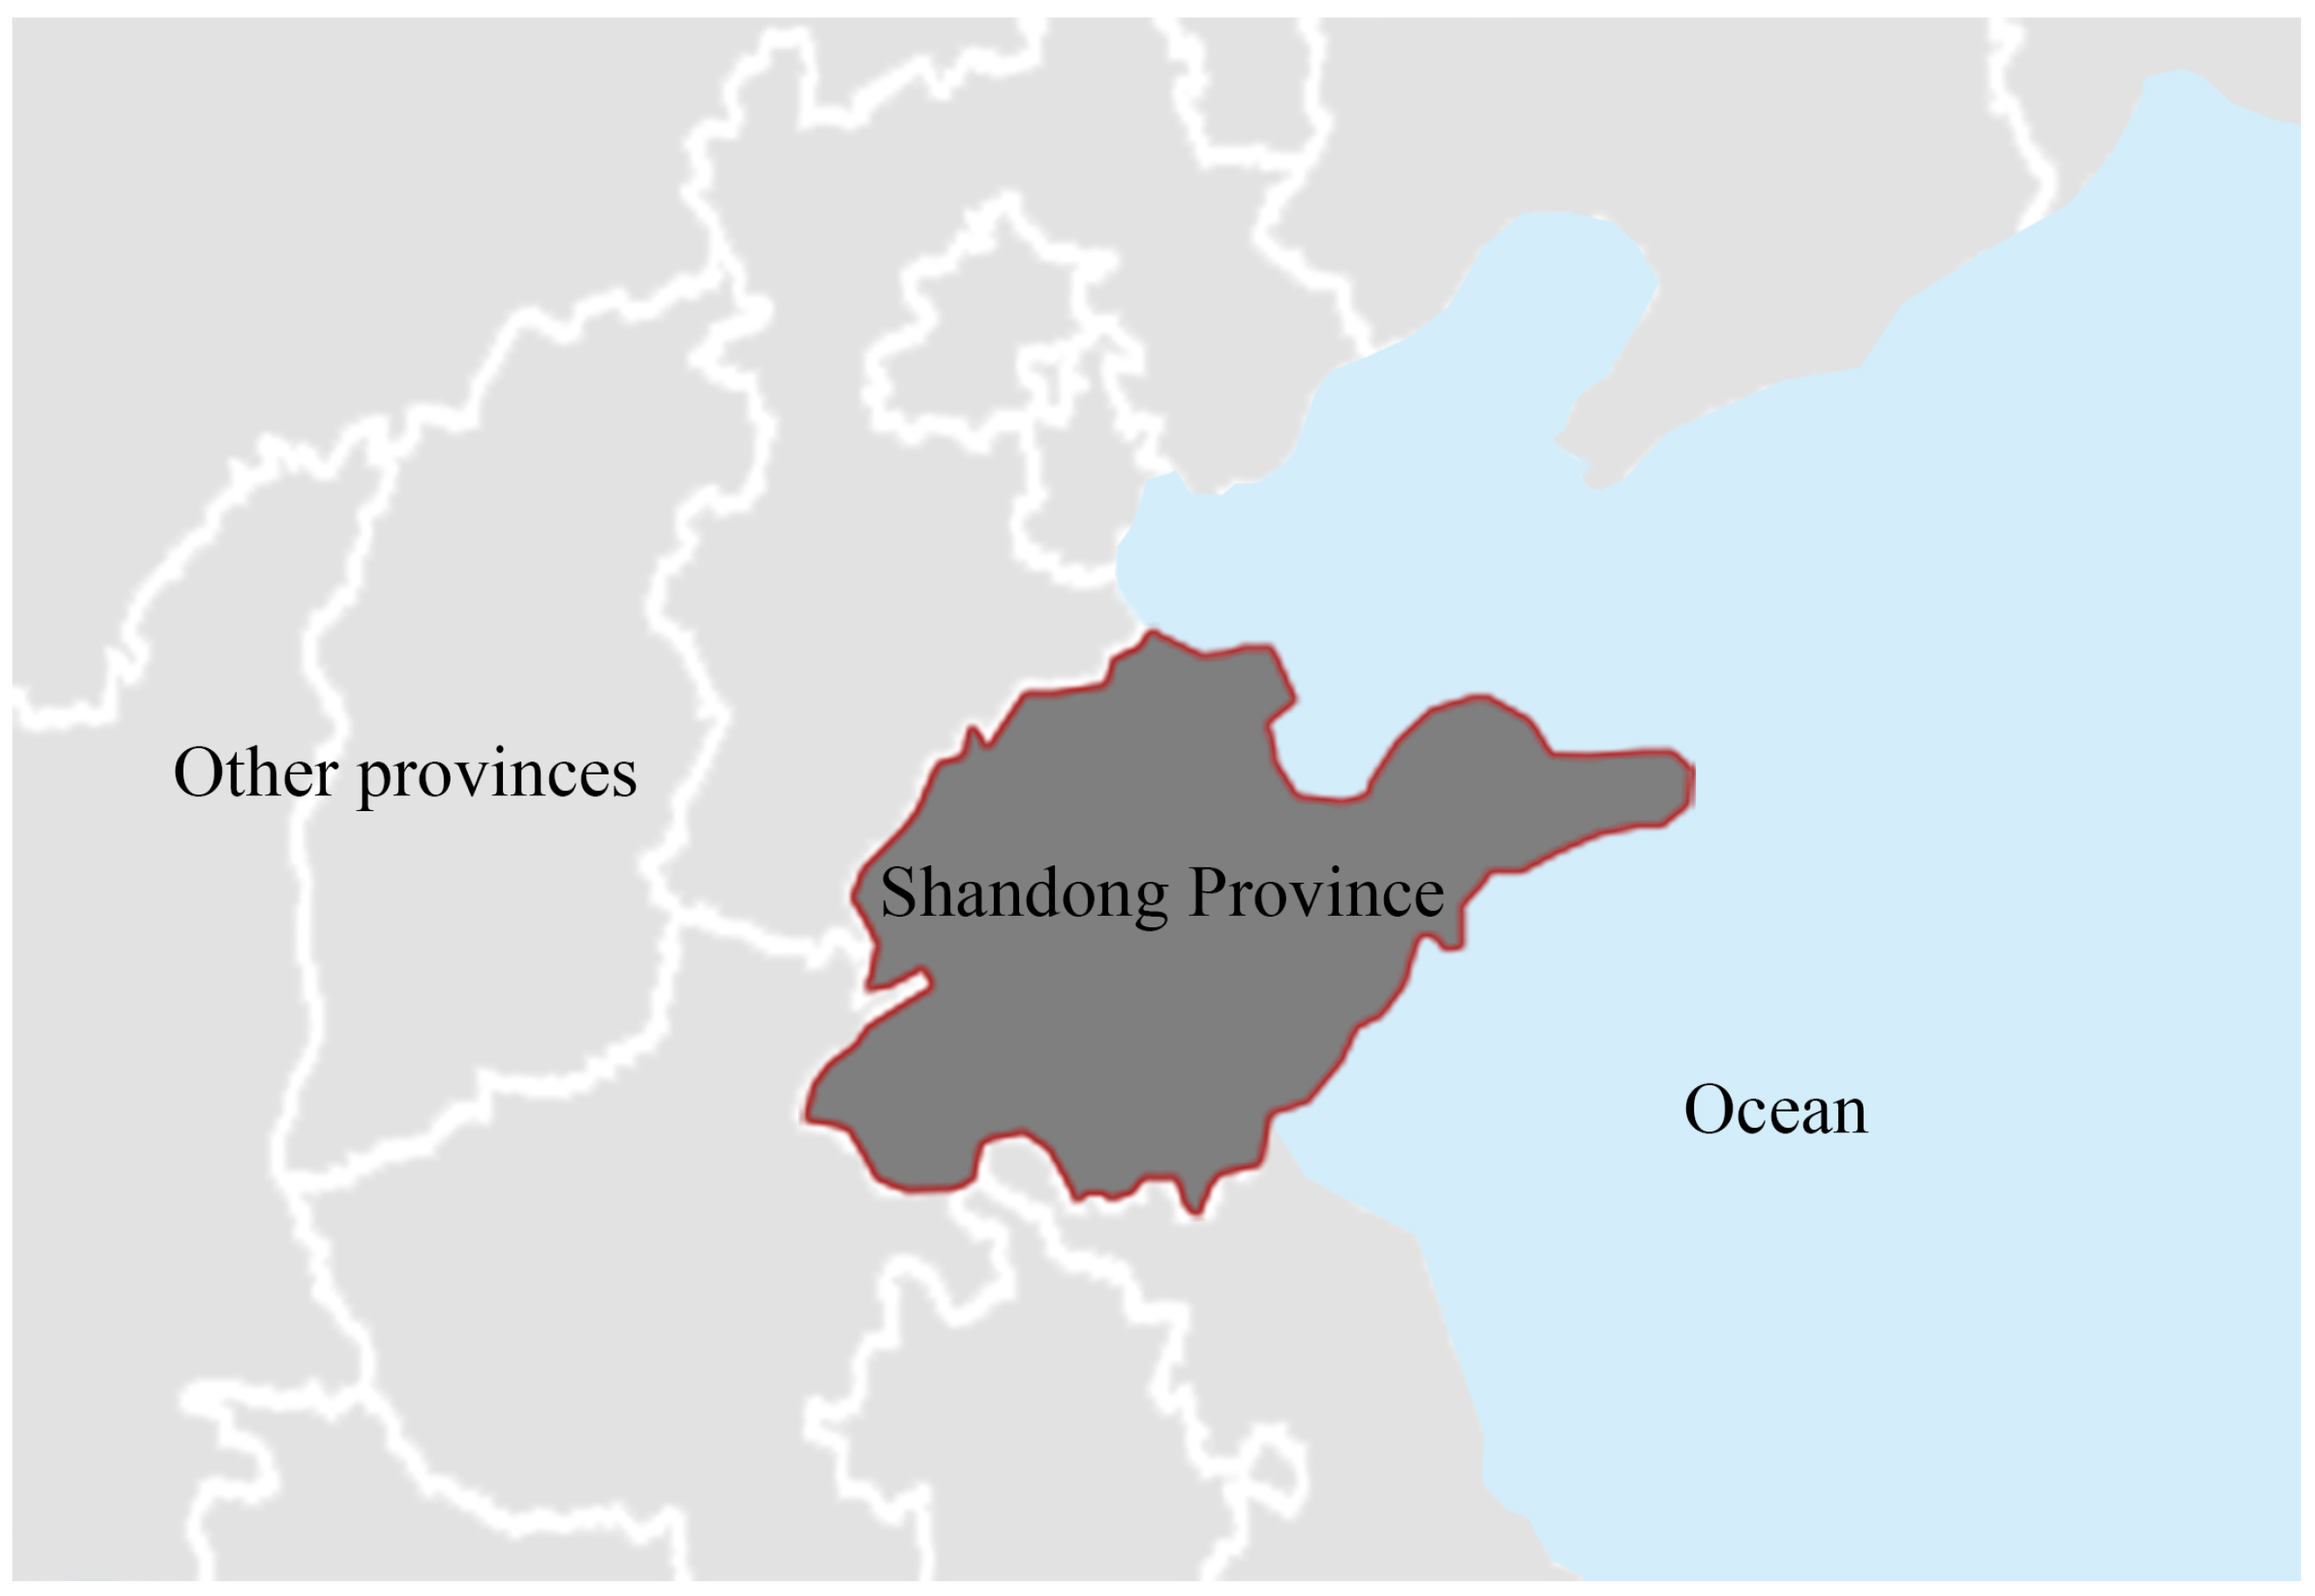
2.1. Description of the Climatology

Shandong Province is located in the eastern part of China (Figure 1) and is categorized as a cold region in China’s building thermal design zones. The overall climate characteristics of the region are cold and dry in winter with a long duration, hot and rainy in summer, relatively short in spring and autumn, significant annual temperature range, and abundant sunshine conditions. According to meteorological data, winter outdoor temperatures range from −9 to 8 °C, with an average temperature of about −0.2 to 0.6 °C; summer outdoor temperatures range from 24 to 37 °C, with an average temperature of about 26.8 to 27.6 °C. The annual temperature variation can reach approximately 26 to 28 °C, and the daily variation ranges from about 4 to 12 °C. The annual average relative humidity is about 55–68%, with annual sunshine hours ranging from 2300 to 3000 h.

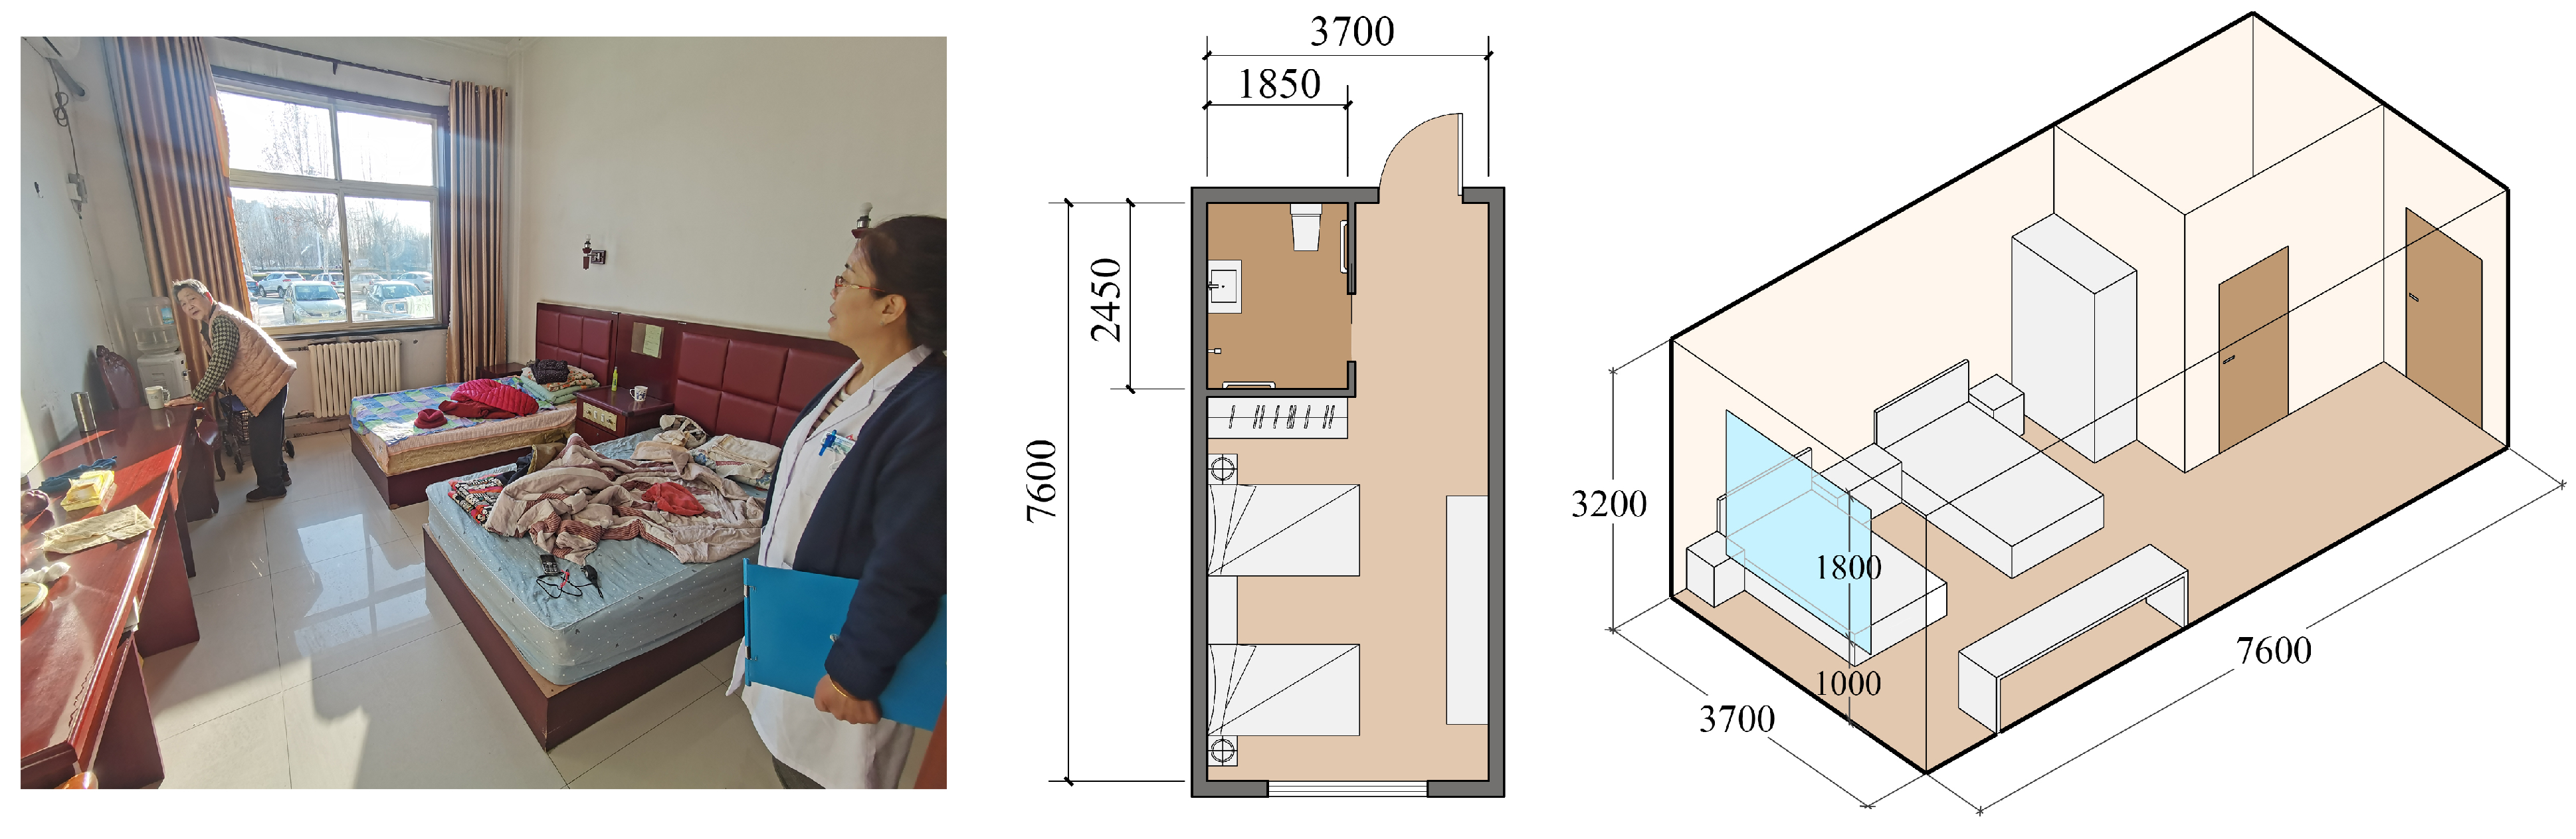
2.2. Nursing Homes’ Information

The experimental data for this study were collected from six nursing homes in Shandong (Figure 2). During the trial period, all six nursing homes were in the winter heating phase. The reasons for choosing these nursing homes were the similar residential capacity, similar indoor functional spaces, and the use of a unified municipal heating system in winter.
The No. 1 nursing home houses 229 elderly people and has 61 adult staff members. This nursing home has three floors: the first floor consists of activity rooms, a dining hall, offices, and elderly bedrooms; the second floor has medical rooms, workspaces, and elderly bedrooms; and the third floor is entirely elderly bedrooms.
The No. 2 nursing home houses 126 elderly people and has 28 adult staff members. This nursing home has a decentralized layout with four two-story buildings on the campus. One building functions as a dining hall, activity rooms, and medical rooms, while the other three buildings are used as bedrooms for the elderly and workspaces for caregivers.
The No. 3 nursing home houses 195 elderly people and has 38 adult staff members. This nursing home has three floors: the first floor consists of activity rooms, a dining hall, medical rooms, and elderly bedrooms; the second floor has elderly bedrooms and workspaces; and the third floor contains offices and storage rooms.
The No. 4 nursing home houses 190 elderly people and has 32 adult staff members. This nursing home has six floors and was converted from an office building. The first floor includes offices, medical rooms, and a dining hall, while the second to sixth floors are elderly bedrooms, with each floor featuring activity rooms and workspaces for caregivers.
The No. 5 nursing home houses 151 elderly people and has 49 adult staff members. This nursing home has five floors: the first floor contains a reception room, offices, and medical rooms; the second to fifth floors are elderly bedrooms, with each floor featuring activity rooms, dining halls, and workspaces.
The No. 6 nursing home houses 209 elderly people and has 50 adult staff members. This nursing home has five floors: the first floor contains a reception room, offices, an elderly dining hall, and a community health center; the second to fifth floors are elderly bedrooms, with each floor featuring activity rooms and workspaces.

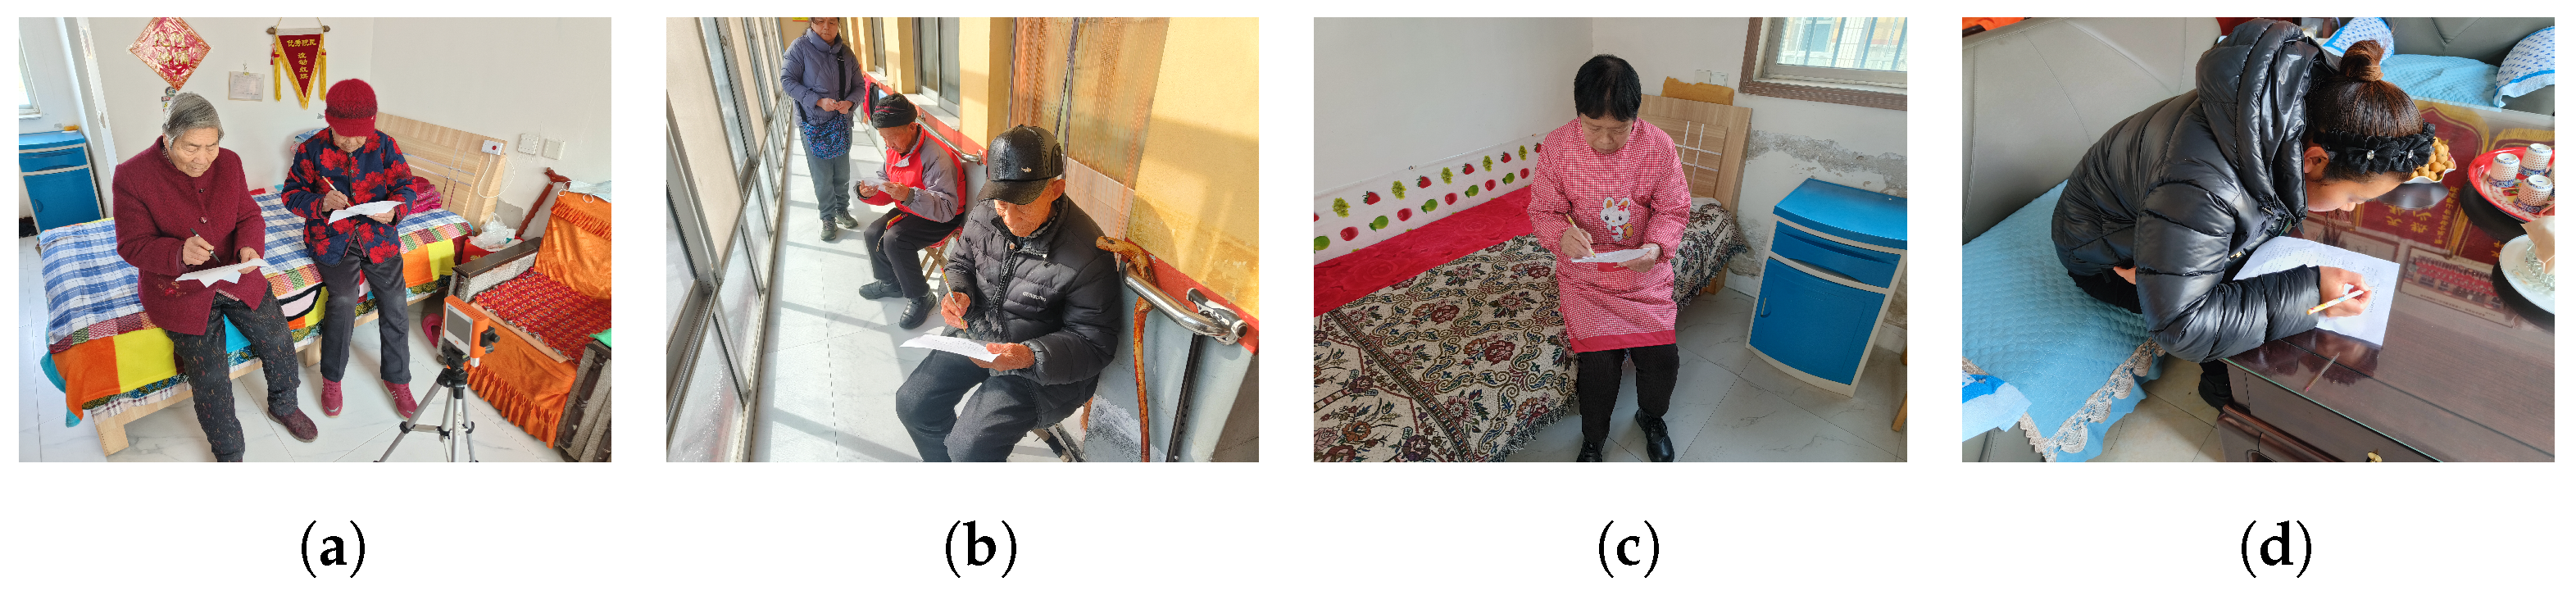
2.3. Questionnaire Survey

This study conducted a survey of elderly people and adult staff in nursing homes using questionnaires. The survey was conducted from 9:00 AM to 6:00 PM. The elderly participants in the experiment were relatively healthy. In other words, elderly individuals with severe physical or mental illnesses, such as those who were bedridden and unable to take care of themselves or those with cognitive disorders, did not participate in the experiment. This is because these elderly individuals had significant issues with physical strength or cognitive abilities, making it difficult to ensure that they could complete the entire experiment. Most elderly participants in the experiment could fill out the questionnaire themselves, while those who were illiterate or had visual impairments were assisted by staff, who read out the questions and recorded their answers. All adult staff participating in the experiment were healthy and filled out the questionnaires themselves. In order to reduce other sources of interference and the psychological effects of the research method on the results, the questionnaires were completed while the respondents were engaged in their daily activities [40]; while filling out the questionnaire, the investigators tested and recorded the indoor environmental parameters (Figure 3).
In order to enable participants to answer more easily and quickly, and to enhance the analyzability of the data, a closed questionnaire approach was adopted. The main structure of the questionnaire is as follows:
(1)
Basic information, such as the time and place of filling out the form, gender, age, and room heating method.
(2)
Thermal comfort conditions, including thermal sensation vote (TSV), thermal preference (P), and thermal acceptability (A). The thermal sensation vote was assessed using the 7-point thermal sensation scale from the ASHRAE 55, thermal preference was assessed using a 3-point scale, and thermal acceptability was assessed using a 2-point scale. Table 1 shows detailed indicators.
(3)
Clothing and activity conditions.
The clothing insulation ( I cl ) and metabolic rate (M) of the human body can be calculated based on clothing and activity conditions. The standards [19,20,41] provided the insulation of individual clothing items. By summing the clothing insulation of each item worn, the total clothing insulation for each participant was obtained. When participants were seated in a chair, the chair’s insulation (0.1 clo) needed to be added. The metabolic rate is related to the activity status. The questionnaire recorded the participants’ activity status within 15 min before the experiment. The metabolic rate for typical behaviors was determined based on the standards (Table 2).
A total of 954 questionnaires were collected from the nursing homes in this experiment, of which 728 were filled out by the elderly and 226 were filled out by adults working in the nursing homes (including administrators, caregivers, therapists, etc.). Before the experiment, all respondents were engaged in their daily activities. The elderly were mainly in their bedrooms, while the adults were mainly in offices or workspaces where they prepared medication and meals for the elderly (Table 3). Among the 728 elderly participants, there were 387 males and 341 females aged between 67 and 87 years, with an average age of 78 years. Among the 226 adult staff members participating in the experiment, there were 77 males and 149 females aged between 25 and 46 years, with an average age of 38 years. To verify the scientific validity and reliability of the survey data, reliability and validity tests were conducted on the collected questionnaire data. After reliability testing, the Cronbach’s α = 0.911, indicating good reliability of the survey data. After validity testing, KMO = 0.805 and p < 0.05 were obtained, indicating good validity of the survey data. Therefore, the survey data can be used for further experimental analysis.

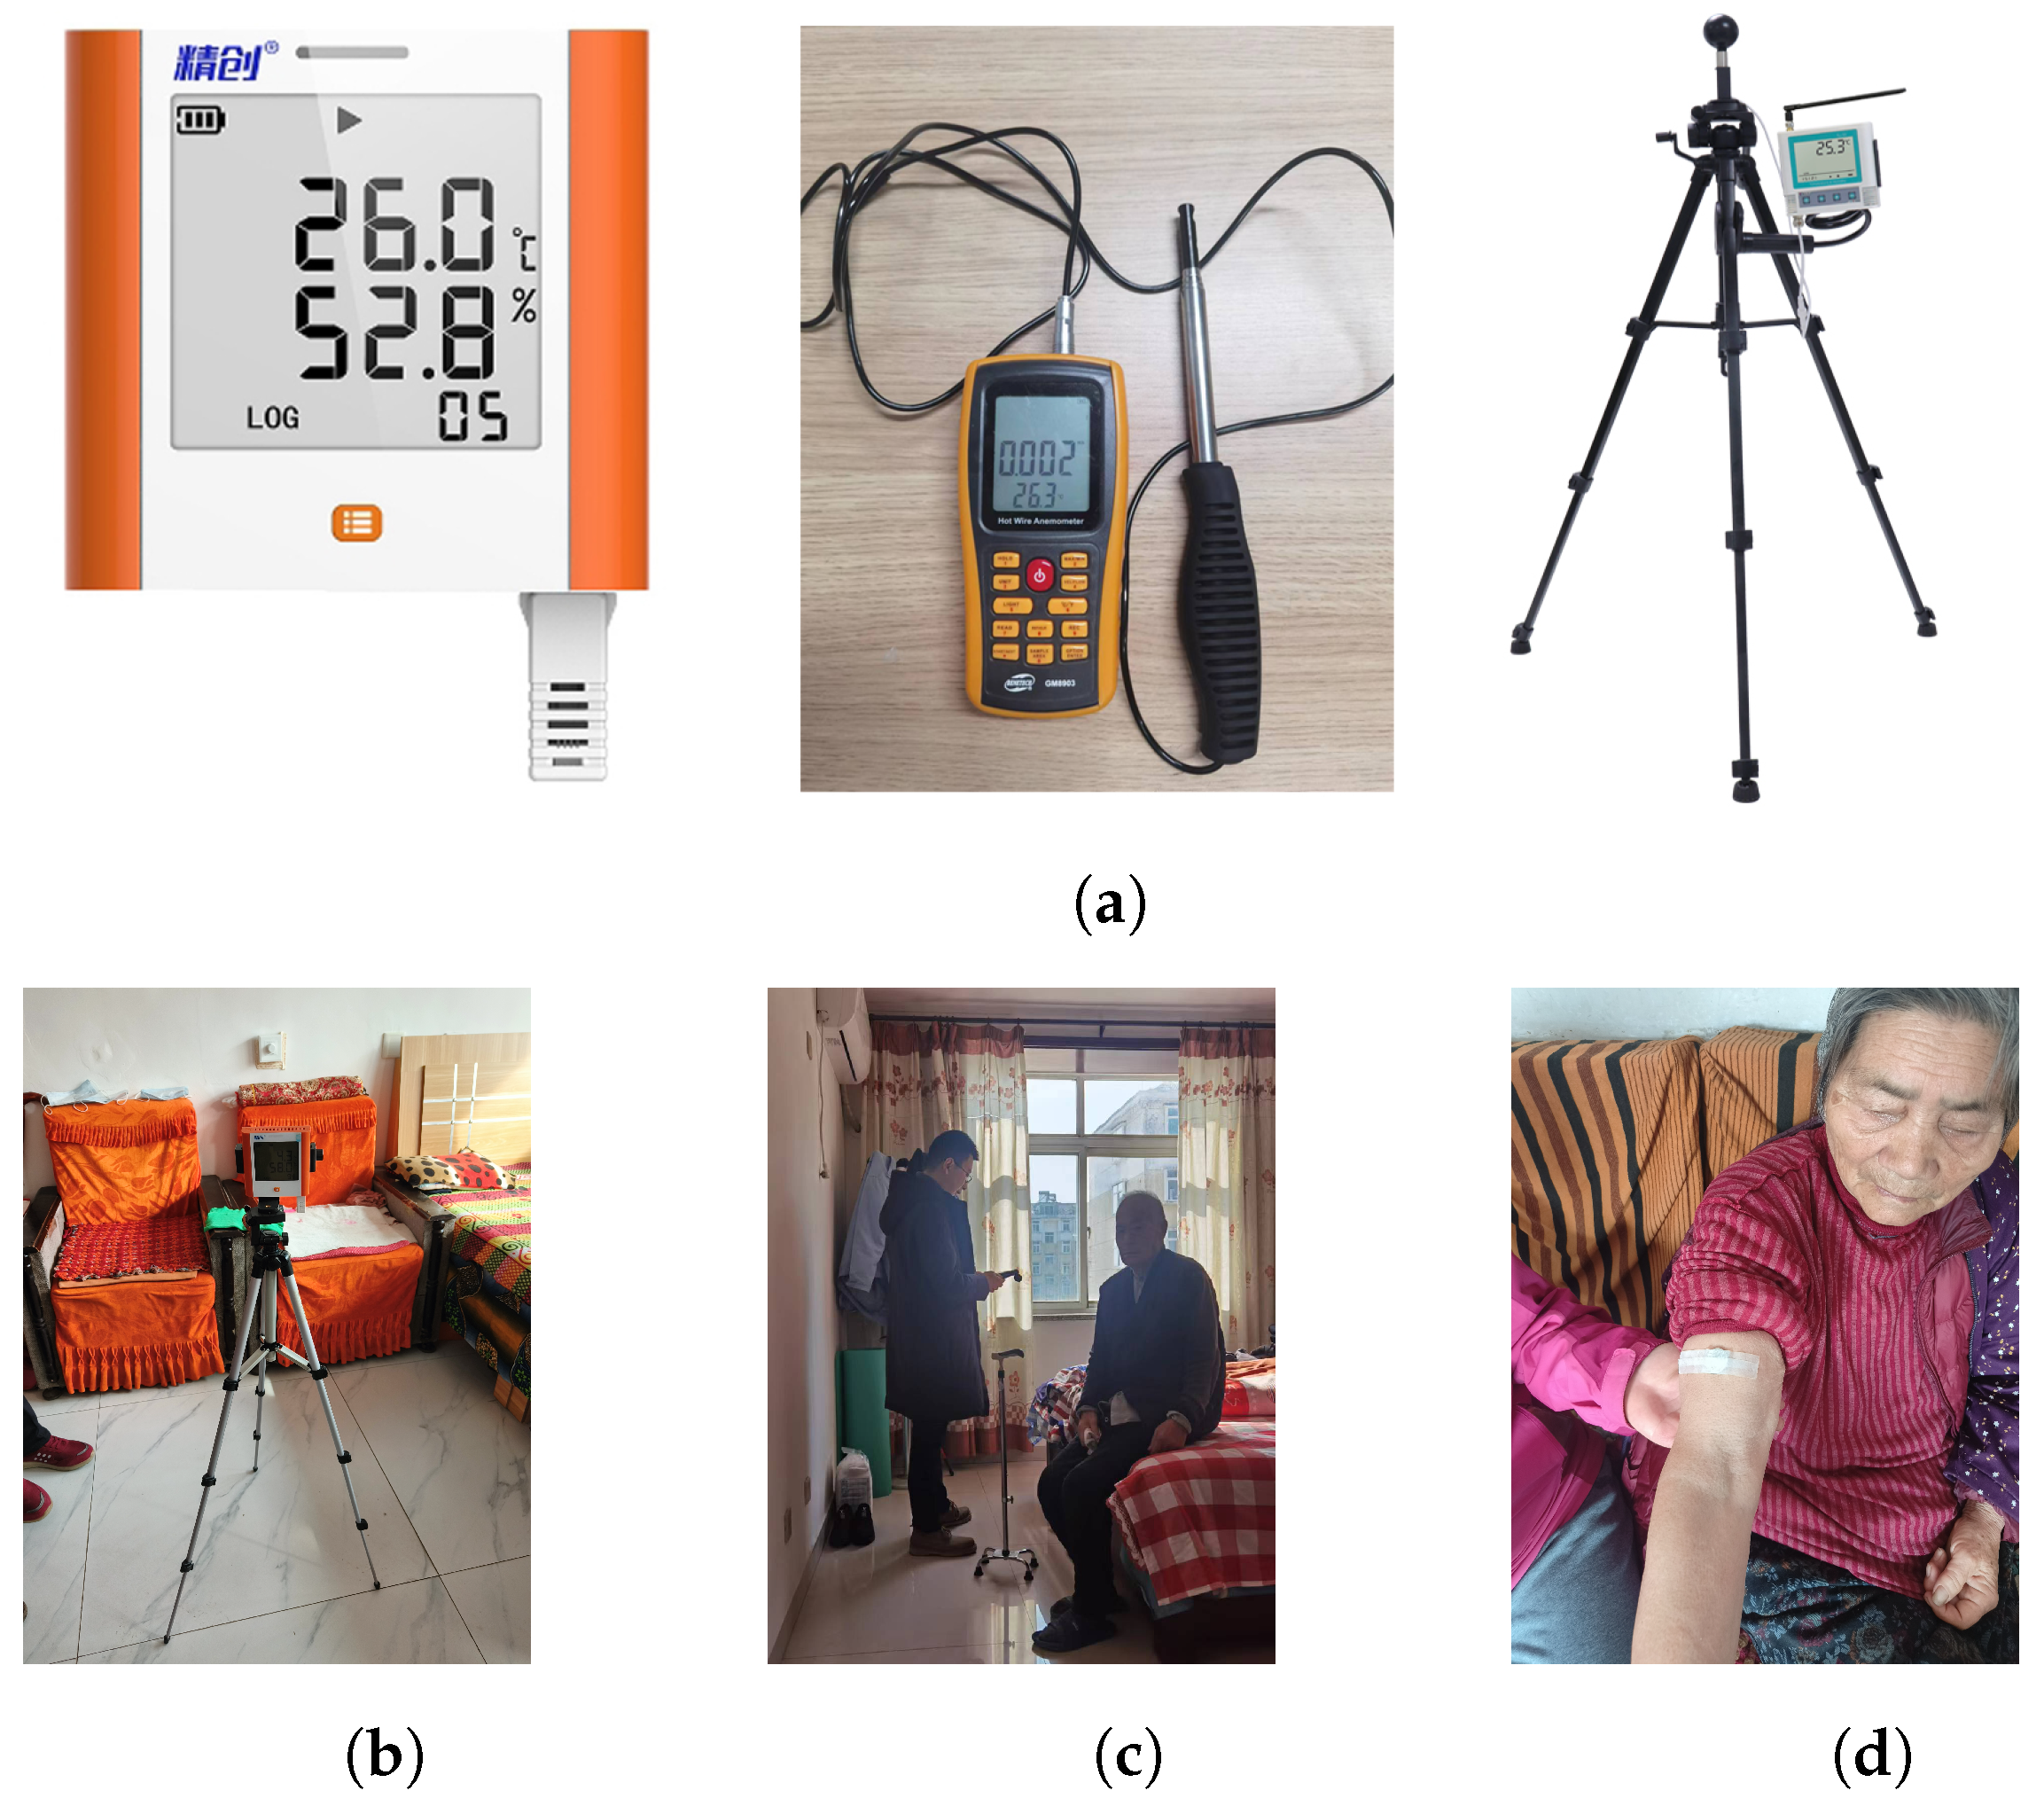
2.4. Parameter Testing and Calculation

The physical parameters tested in the outdoor environment mainly include outdoor air temperature ( T o u t ) and outdoor relative humidity ( R H o u t ). The physical parameters tested in the indoor environment mainly include air temperature ( T a ), relative humidity ( R H ), air velocity ( V a ), and globe temperature ( T g ). The air temperature and relative humidity were measured using an Elitech GSP-8A self-recording thermometer–hygrometer, the air velocity was measured using a Benetech thermal anemometer, and the globe temperature was measured using an RS-HQ globe temperature self-recorder. Detailed parameter information of the instruments used is shown in Table 4. During measurement, the recorder was placed as close as possible to the horizontal geometric center of the room without affecting the daily life of the elderly, away from windows and other indoor heat sources, and at a height of 1.1 m above the ground [41]. The instrument can display real-time temperature and humidity data, and it automatically records a set of data every 15 min (Figure 4).
Operative temperature ( T o ) is an indicator of thermal comfort for the human body. It has a high correlation with thermal sensation, is easy to measure, is simple to calculate, and has a low margin of error, making it widely used in indoor thermal comfort research [34]. Accordingly, the operative temperature was selected in the present study as the thermal comfort evaluation index. Due to the cold winter climate in the testing area, the elderly generally do not open windows to prevent indoor temperatures from getting too low. After testing, the indoor air velocity was found to be less than 0.2 m/s. According to the ASHRAE 55, when air velocity is not greater than 0.2 m/s, the calculation of operative temperature is shown in Equation (1):
T o = T a + T r 2
T r = [ ( T g + 273 ) 4 + 1.10 × 10 8 V a 0.6 ε D 0.4 ( T g T a ) ] 1 4 273
where T r is the mean radiant temperature, D is the diameter of the black globe (D = 0.05 m), and ε is the surface emissivity ( ε = 0.95).
This study also explored the relationship between average skin temperature and thermal comfort, with the skin temperature measured using an Ibutton temperature recorder. Detailed parameters of the instrument are shown in Table 4. Average skin temperature was measured and calculated using the four-point method. Specifically, the temperature recorder measured the local temperatures of the chest ( T c h e s t ), upper arm ( T u p p e r a r m ), thigh ( T t h i g h ), and calf ( T c a l f ) of nursing home occupants. The average skin temperature ( T s k i n ) is calculated using Equation (2) [27,42]:
T s k i n = 0.3 T c h e s t + 0.3 T u p p e r a r m + 0.2 T t h i g h + 0.2 T c a l f

2.5. Simulation of Energy Consumption and Carbon Dioxide Emissions

To study the impact of thermal comfort environments in nursing homes on building energy consumption and carbon emissions, this study used Ladybug & Honeybee software (version number: 0.0.67, creator: Mostapha and Chris, location: Fairfax, VA, USA) on the Rhino & Grasshopper platform for building energy and carbon emission simulations. The simulation engine used by this program is EnergyPlus. Currently, Ladybug & Honeybee software has been widely used for building performance simulation, and existing studies have shown that its simulation results are highly accurate [43,44].

2.6. Data Statistics and Analysis Modeling

This study utilized various data analysis methods to statistically analyze and mathematical modeling of the data collected from field tests, including Spearman’s correlation analysis to determine the correlation between thermal environmental parameters and thermal sensation votes. The Chi-square test was used to determine if there were significant differences between the thermal sensation votes of elderly people and adult staff. Student’s t-test and Mann–Whitney U test were used to determine if there were significant differences in clothing insulation and metabolic rates between elderly people and adult staff. Linear regression was used to establish a regression model between the data, including measured thermal sensation votes and operative temperature, PMV and operative temperature, and skin temperature and operative temperature, etc. The data analysis software used was IBM SPSS Statistics 26.

3. Results

3.1. Outdoor and Indoor Environmental Conditions

During the experiment (December 2022 to January 2023), the outdoor and indoor environmental parameters of six nursing homes were systematically measured, as detailed in Table 5. The tests showed that the outdoor minimum air temperature ranged from −6.9 to −2.9 °C, the maximum from 5.6 to 7.6 °C, and the average from 0 to 2.9 °C. The outdoor minimum relative humidity ranged from 37.8 to 49.6%, the maximum from 65.8 to 70.1%, and the average from 48.2 to 57.2%. During the testing period, all six nursing homes had municipal central heating. The indoor maximum air temperature ranged from 19.3 to 26.5 °C, the minimum from 16.1 to 20.7 °C, and the average from 17.9 to 22.3 °C. The indoor maximum globe temperature ranged from 19.9 to 25.9 °C, the minimum from 16.1 to 20.8 °C, and the average from 18.2 to 22.0 °C. It can be observed that due to factors such as enclosure structures and building spatial forms, there is a significant difference in indoor temperatures among the different nursing homes. The indoor maximum relative humidity ranged from 32.0 to 42.3%, the minimum from 18.4 to 26.6%, and the average from 25.0 to 29.8%. Due to heating, the overall indoor relative humidity was relatively low. Because of the low outdoor temperatures in winter, the elderly rarely open windows, resulting in low indoor air velocities. The maximum air velocity ranged from 0.11 to 0.14 m/s, the minimum from 0 to 0.02 m/s, and the average from 0.02 to 0.04 m/s.

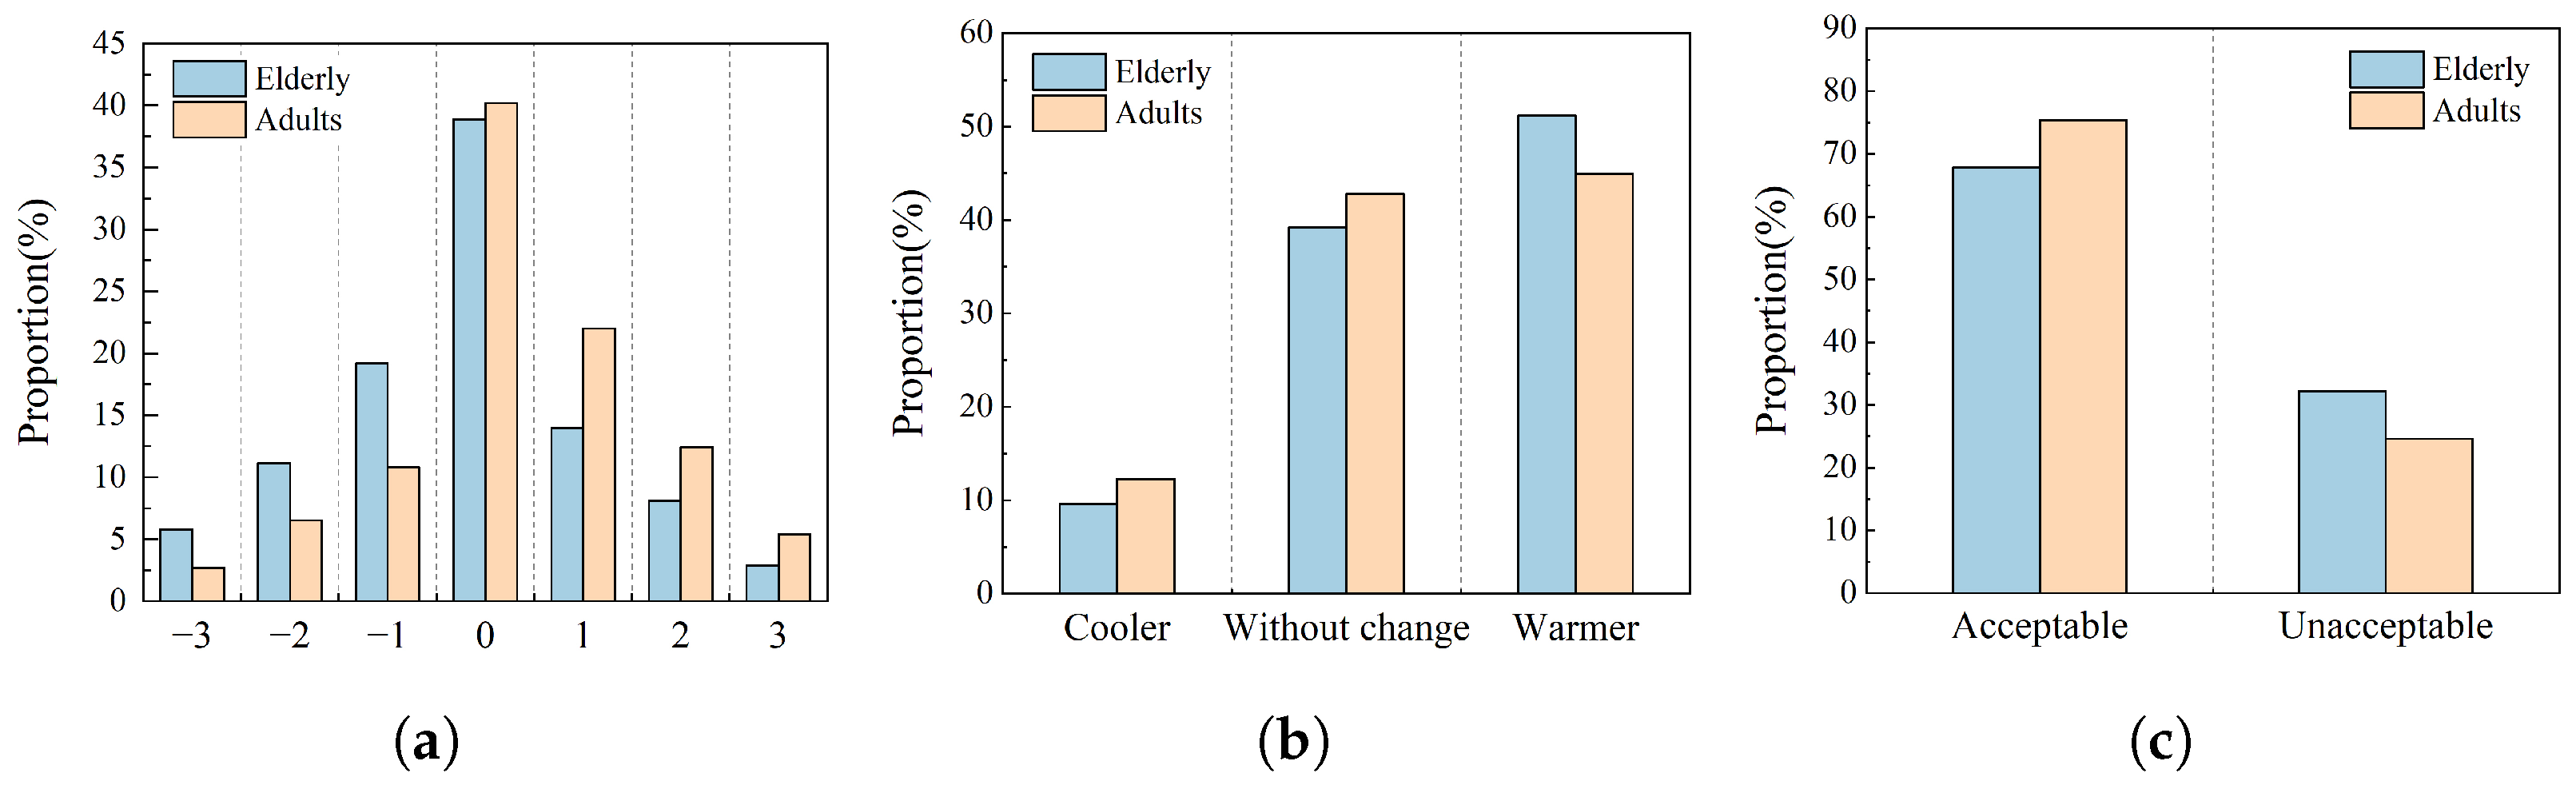
3.2. Thermal Comfort Voting for Different Types of Occupants

The thermal sensation votes of elderly people and adult staff in nursing homes were obtained through the experiment. As shown in Figure 5, among the elderly people, 38.9% of the respondents perceived the environment as neutral (TSV = 0), 5.8% as cold (TSV = −3), 11.1% as cool (TSV = −2), and 19.2% as slightly cool (TSV = −1). A total of 14% of the elderly people perceived the environment as slightly warm (TSV = 1), 8.1% as warm (TSV = 2), and 2.9% as hot (TSV = 3). For the adult staff in the nursing home, 40.2% of the sample perceived the environment as neutral (TSV = 0), 2.7% as cold (TSV = −3), 6.5% as cool (TSV = −2), and 10.8% as slightly cool (TSV = −1). A total of 22% felt it was slightly warm (TSV = 1), 12.4% as warm (TSV = 2), and 5.4% as hot (TSV = 3).
The Spearman correlation test was used to analyze the correlation between thermal sensation votes and operative temperature for the elderly and the adult staff separately. The results showed a significant positive correlation between thermal sensation votes and operative temperature for both the elderly and the adult staff (p < 0.001). The chi-square test was conducted on the thermal sensation votes of the elderly and the adult staff in the nursing homes, revealing a significant difference (p < 0.05) between the groups (Table 6). The calculated chi-square value is 25.417, and with a df value of 6, the chi-square critical value is 12.595, which is less than the chi-square value. Therefore, there is a significant difference between the thermal sensation votes of elderly and adult participants in the nursing home. According to the experimental results, 36.1% of the elderly had thermal sensation votes less than 0 compared to 20.0% of the adult staff. Similarly, 25.0% of the elderly had thermal sensation votes greater than 0 compared to 39.8% of the adult staff. This indicates that compared to the adult staff, the elderly tend to perceive the environment as colder.
The experiment provided data on the thermal preference and thermal acceptability of nursing home occupants. As shown in Figure 5, 9.6% of the elderly wished to be cooler, while 51.2% wished to be warmer. Among the adult staff, 12.3% wished to be cooler, while 44.9% wished to be warmer. Comparing the data reveals that the elderly prefer a warmer environment more than the adult staff. 67.8% of the elderly found the current thermal environment acceptable, while this proportion was 75.4% for the adult staff, indicating that the elderly have higher requirements for the thermal environment.

3.3. Neutral Temperature and Comfort Zone for Different Types of Occupants

To determine the neutral temperature and comfort temperature range for the elderly and the adult staff in the nursing home, a regression equation was established through linear regression between the occupants’ mean thermal sensation vote (MTS) and operative temperature ( T o ). Using the BIN method [22,34], the operative temperature was divided into intervals of 0.5 °C. The MTS and average operative temperature within each interval were calculated and subjected to regression analysis.
For the elderly and the adult staff, the regression equations are
M T S ( E l d e r l y ) = 0.22 T o 4.77 ( R 2 = 0.97 p < 0.001 )
M T S ( A d u l t s ) = 0.26 T o 5.34 ( R 2 = 0.96 p < 0.001 )
Figure 6 shows that the MTS of nursing home occupants and operative temperature exhibit a positive linear relationship. According to Equations (3) and (4), the slope of the MTS model for the elderly is smaller than that for the adult staff. When the operative temperature increases by 1 °C, the MTS of the elderly increases by 0.22 units, while that of the adult staff increases by 0.26 units, indicating that the elderly are less sensitive to changes in the thermal environment than the adult staff. When MTS = 0 , the regression equations determined that the neutral temperature for the elderly is 21.7 °C, and for the adult staff, it is 20.5 °C, which is approximately 1.2 °C lower than that of the elderly. According to the ASHRAE 55, the thermal comfort temperature range is defined as 0.5 MTS 0.5 [34]. Calculations show that the comfort temperature range for the elderly is 19.4 to 24.0 °C, and for the adult staff, it is 18.6 to 22.5 °C. It can be observed that compared to the adult staff, the elderly prefer a warmer environment in winter. The neutral temperature and the upper and lower limits of the acceptable comfort temperature range for the elderly are higher than those for the adult staff, and the elderly have a broader acceptable comfort temperature range. The reason may be that with aging, the physiological characteristics of the elderly change, including decreased metabolic rate, slower blood circulation, reduced vasoconstriction ability, and thinner subcutaneous fat. These issues lead to decreased heat production and retention capabilities, making the elderly feel colder. Some common diseases in the elderly, such as hypothyroidism and osteoarthritis, can also exacerbate the sensation of cold.

3.4. Applicability of the PMV Model to Occupants

To verify whether the predicted mean vote (PMV) model applies to the occupants of nursing homes in Shandong, regression equations between PMV and operative temperature were established separately for the elderly and the adult staff. The PMV model is an ideal thermal balance model derived from experimental research. According to ASHRAE 55, PMV is related to air temperature, relative humidity, air velocity, mean radiant temperature, metabolic rate, and clothing insulation. PMV is the most commonly used thermal comfort index in international standards [19,20], but it is primarily applicable to younger populations and overlooks factors such as climate, physiological, psychological, and behavioral adaptations.
The measured environmental data and personal characteristic data were input into the calculation program provided by ASHRAE 55 to obtain occupants’ PMV. The operative temperature was divided into intervals of 0.5 °C. The average PMV and average operative temperature within each interval were calculated and subjected to regression analysis.
For the elderly and the adult staff, the regression equations are
P M V ( E l d e r l y ) = 0.33 T o 7.50 ( R 2 = 0.98 p < 0.001 )
P M V ( A d u l t s ) = 0.38 T o 8.34 ( R 2 = 0.96 p < 0.001 )
Figure 7 shows that the PMV and operative temperature of nursing home occupants exhibit a positive linear relationship. According to Equations (5) and (6), the slope of the PMV model for the elderly is lower than that for adults. When the operative temperature increases by 1 °C, the PMV for the elderly increases by 0.33 units, while for adults, it increases by 0.38 units, but both are greater than the increases in the MTS model. According to the PMV model, the neutral temperature for the elderly is 22.7 °C, with a comfort temperature range of 21.2 to 24.2 °C. For the adult staff, the neutral temperature is 21.9 °C, with a comfort temperature range of 20.6 to 23.2 °C. Comparing the data shows that the neutral temperatures obtained from the PMV model are higher than those from the MTS model by 1 °C for the elderly and 1.4 °C for the adult staff. This indicates that in practice, the environmental temperature does not need to reach the neutral temperature predicted by the PMV model, and occupants of nursing homes can achieve thermal neutrality. The slope of the PMV model is greater than that of the MTS model, which means that the comfort temperature range obtained by the PMV model is narrower than that obtained by the MTS model. This suggests that in practice, changes in operative temperature have a smaller impact on the thermal sensation of nursing home occupants than predicted by the PMV model. Nursing home occupants can feel comfortable over a wider temperature range.
The results indicate that due to the PMV model’s neglect of factors such as climate conditions and physiological, psychological, and behavioral adaptations [37,45], the thermal comfort parameters obtained do not apply to nursing home occupants in Shandong.

3.5. Preferred Temperatures for Different Types of Occupants

This study also calculated the preferred temperature of nursing home occupants. In the questionnaire, the scale for thermal preference is cooler, without change, and warmer. The operative temperature was divided into intervals of 0.5 °C, and the proportion of people preferring warmer (W) and cooler (C) temperatures within each interval was calculated. Regression equations for the proportion of people and average operative temperature were established, respectively.
For the elderly, the regression equations are
W = 10.20 T o + 262.18 ( R 2 = 0.96 p < 0.001 )
C = 3.04 T o 52.81 ( R 2 = 0.95 p < 0.001 )
For the adult staff, the regression equations are
W = 10.58 T o + 264.81 ( R 2 = 0.97 p < 0.001 )
C = 3.60 T o 62.54 ( R 2 = 0.93 p < 0.001 )
As shown in Figure 8, when the values of Equations (7) and (8) are equal, the preferred temperature for the elderly is calculated to be 23.8 °C, which is 2.1 °C higher than their winter neutral temperature of 21.7 °C. This indicates that in fact, the elderly prefer a temperature environment higher than the neutral temperature in winter and are more satisfied with a warmer indoor environment. When the values of Equations (9) and (10) are equal, the preferred temperature for the adult staff is 23.1 °C, which is 2.6 °C higher than the neutral temperature of 20.5 °C. This indicates that in winter, the adult staff also prefer a higher-temperature environment than the neutral temperature. However, the preferred temperature for the adult staff is still 0.7 °C lower than that for the elderly, which further confirms that the elderly prefer a warmer environment compared to the adult staff.

3.6. Influence of Personal Factors on Thermal Comfort

For nursing home occupants, clothing insulation and metabolic rate are the main personal factors affecting thermal comfort [46]. The data distribution of clothing insulation and metabolic rate is shown in Figure 9. A t-test on the clothing insulation for the elderly and the adult staff revealed a significant difference (p < 0.001). A Mann–Whitney U test on the metabolic rates of the elderly and the adult staff showed a significant difference (p< 0.001). Table 7 shows the statistical data of clothing insulation and metabolic rate. It can be observed that the mean clothing insulation for the elderly is higher than that for the adult staff, while the mean metabolic rate for the elderly is lower than that for the adult staff. This is because the elderly have reduced activity levels due to physical and health factors, leading to a lower metabolic rate and requiring more clothing to maintain thermal comfort. The adult staff generally perform various caregiving tasks in the nursing home, resulting in higher activity levels and metabolic rates, and they need less clothing to maintain thermal comfort compared to the elderly.
Since individuals cannot control the municipal central heating temperature in the nursing home, the primary adaptive behavior affecting occupants’ thermal comfort is adjusting their clothing. The operative temperature was divided into intervals of 0.5 °C. The average clothing insulation and average operative temperature within each interval were calculated and subjected to regression analysis.
For the elderly and the adult staff, the regression equations are
I c l ( E l d e r l y ) = 0.046 T o + 2.22 ( R 2 = 0.77 p < 0.001 )
I c l ( A d u l t s ) = 0.053 T o + 2.22 ( R 2 = 0.84 p < 0.001 )
As shown in Figure 10, according to Equations (11) and (12), the clothing insulation of nursing home occupants has a negative linear relationship with operative temperature, and the slope of the model for the elderly is smaller than that for the adult staff. When the operative temperature is the same, clothing insulation of the elderly is higher than that of adults. For every 1 °C increase in operative temperature, the clothing insulation of the elderly decreases by 0.046 clo, while that of the adult staff decreases by 0.053 clo. The reduction in clothing insulation is greater for the adult staff. The main reason is that the elderly are less sensitive to temperature changes compared to the adults, and they feel colder in the same thermal environment, preferring warmer conditions. Additionally, some elderly people have mobility impairments, which may make it difficult for them to dress or undress freely.

3.7. Influence of Physiological Factors on Thermal Comfort

The physiological parameters of the human body are affected by the thermal environment. Existing studies indicate a strong correlation between skin temperature and thermal sensation [47,48]. This study discusses the relationship between the skin temperature of nursing home occupants and their thermal comfort. The temperature was divided into intervals of 0.5 °C. The average skin temperature ( T s k i n ) and average operative temperature within each interval were calculated and subjected to regression analysis.
For the elderly and the adult staff, the regression equations are
T s k i n ( E l d e r l y ) = 0.39 T o + 23.77 ( R 2 = 0.86 p < 0.001 )
T s k i n ( A d u l t s ) = 0.34 T o + 25.28 ( R 2 = 0.81 p < 0.001 )
Figure 11a shows that the average skin temperature of nursing home occupants has a positive linear relationship with indoor operative temperature. When the operative temperature is the same, the average skin temperature of the elderly is lower than that of the adult staff. According to Equations (13) and (14), when the indoor operative temperature decreases by 1 °C, the average skin temperature of the elderly in nursing homes decreases by 0.39 °C, while that of the adult staff decreases by 0.34 °C. The decrease in skin temperature of the elderly is slightly greater than that of adults. The cause of this phenomenon may be that when the surrounding environment becomes colder, the body maintains thermal balance by increasing heat production through skeletal muscle shivering and increased secretion of thyroid hormones and by reducing heat loss through blood vessel constriction and decreased sweat secretion. Due to the aging of bodily functions, the corresponding body regulation ability in the elderly declines. Compared to adults, their physiological thermal regulation slows down when the temperature drops, resulting in a faster decrease in the average skin temperature of the elderly.
To understand the relationship between skin temperature and thermal sensation votes, the occupants’ average skin temperature was divided into temperature intervals of 0.5 °C. The average skin temperature and MTS within each interval were calculated and subjected to regression analysis.
For the elderly and the adult staff, the regression equations are
M T S ( E l d e r l y ) = 0.39 T s k i n 12.61 ( R 2 = 0.88 p < 0.001 )
M T S ( A d u l t s ) = 0.43 T s k i n 13.69 ( R 2 = 0.93 p < 0.001 )
Figure 11b shows that the MTS of nursing home occupants has a positive linear relationship with average skin temperature. When the average skin temperature is the same, the MTS value of the elderly is lower than that of adults. According to Equations (15) and (16), when the average skin temperature increases by 1 °C, the MTS of the elderly in nursing homes increases by 0.39 units, while that of the adult staff increases by 0.43 units. This indicates that compared to the adult staff, the elderly have a reduced physiological ability to perceive thermal changes.

4. Discussion

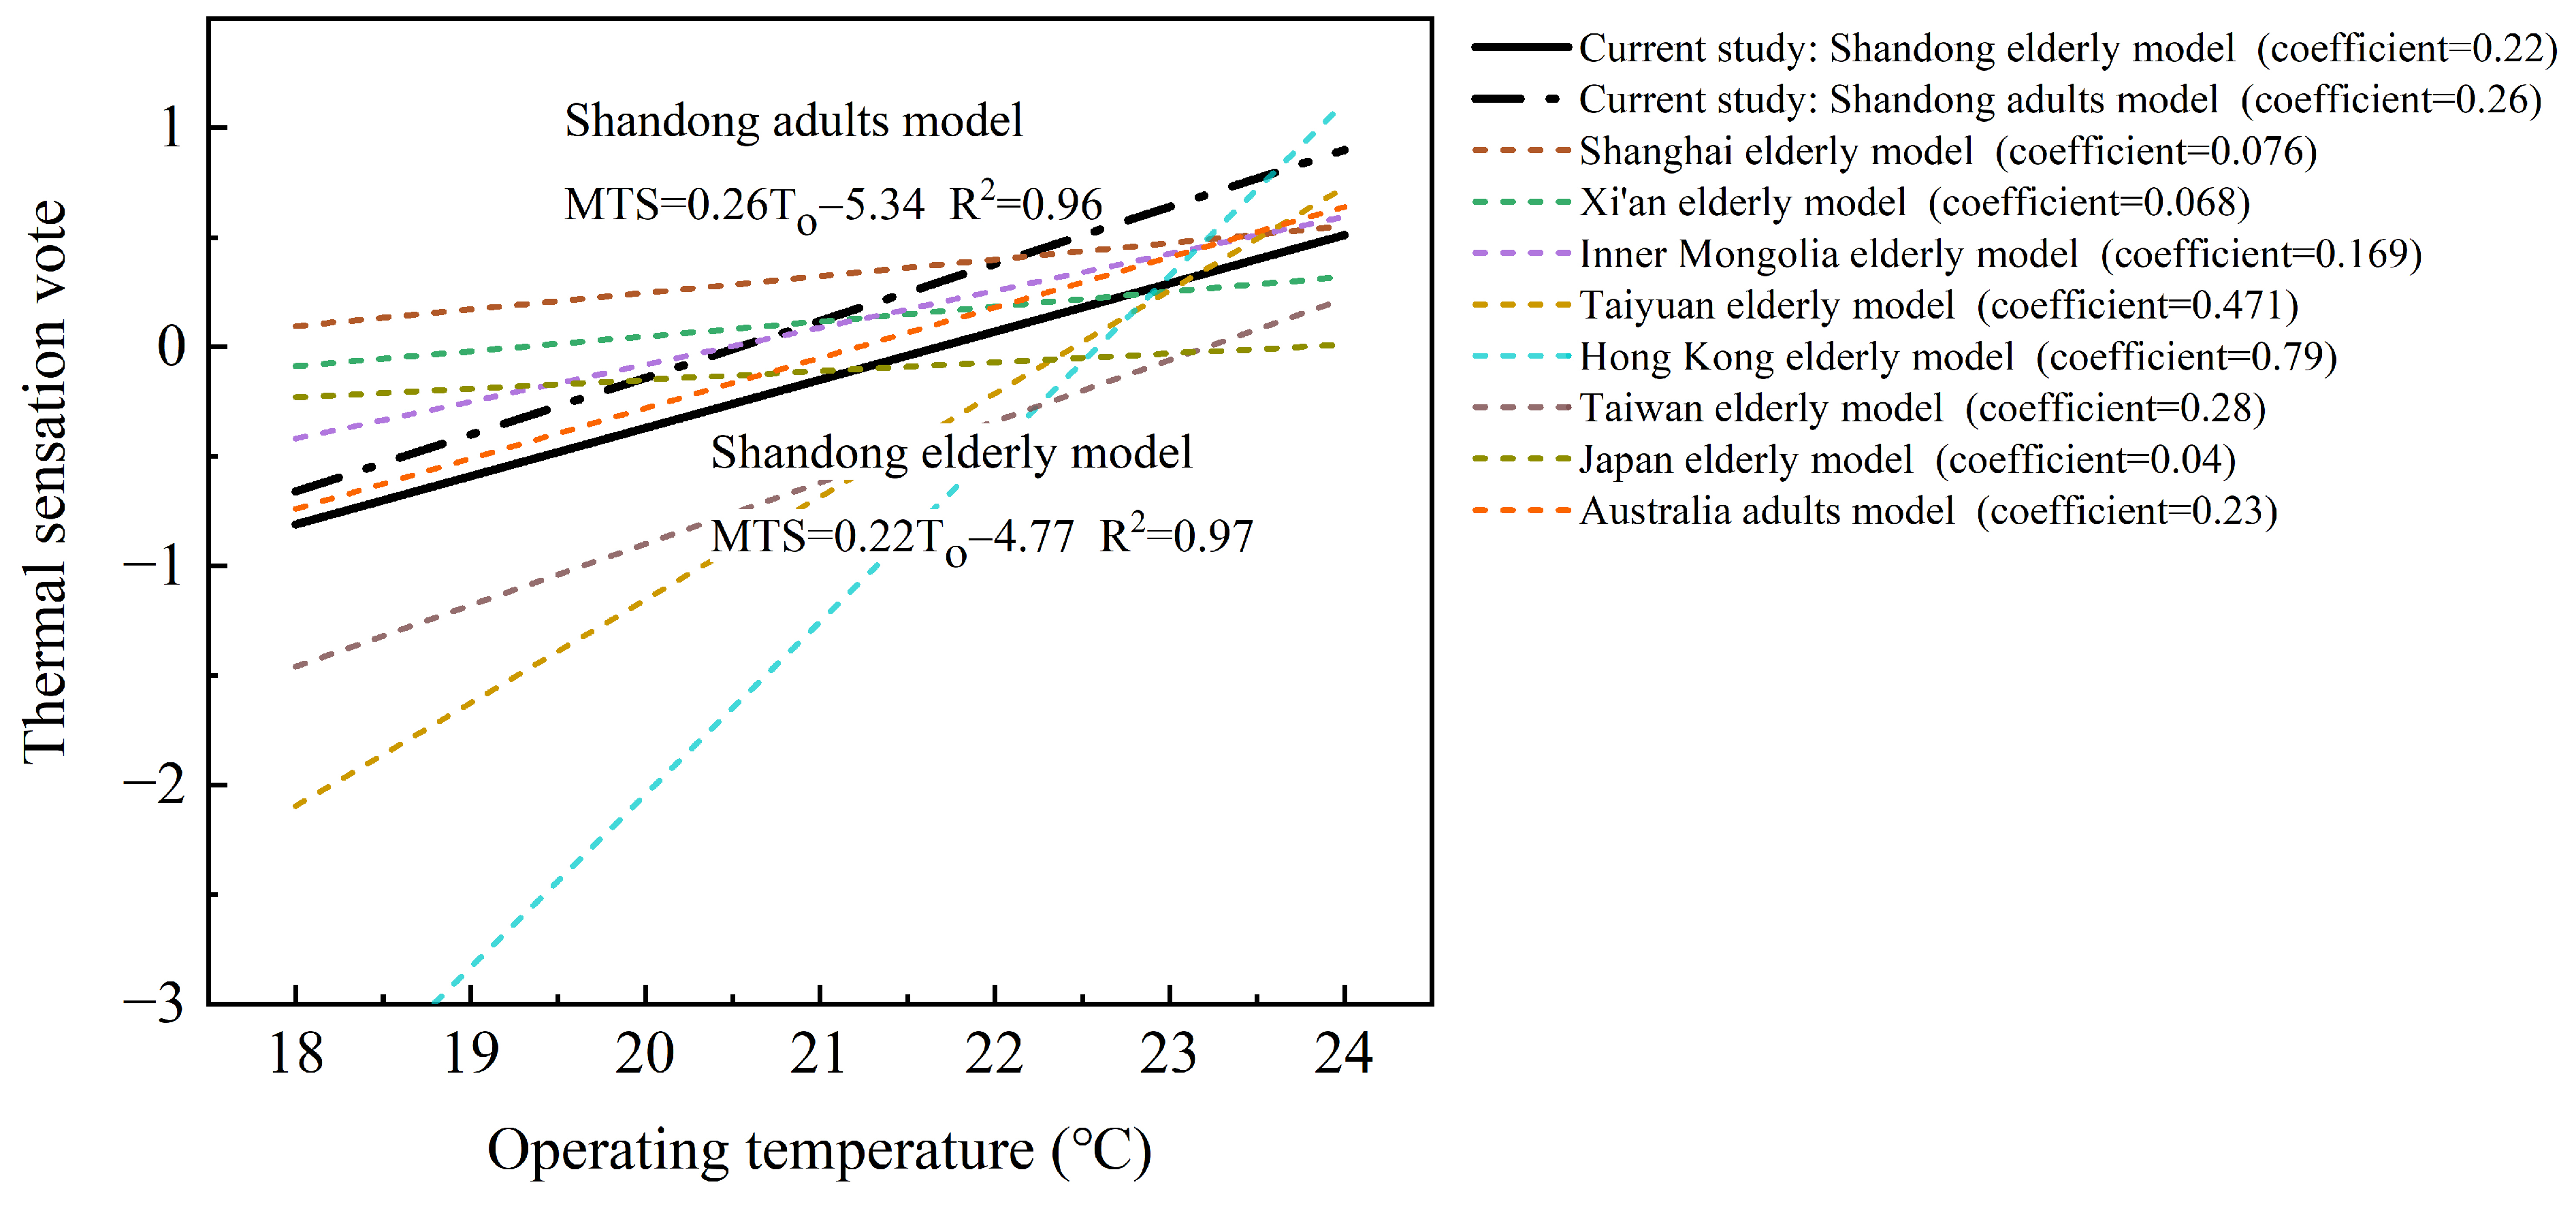
4.1. Comparison with Previous Research Results

Table 8 compares the measured thermal comfort models and neutral temperatures obtained in this study with those from other thermal comfort research, demonstrating that there are differences in thermal comfort among people in different regions [49]. Regression analysis revealed that the neutral temperature for the elderly in nursing homes in Shandong is 21.7 °C. However, as shown in Table 8, the neutral temperature for the elderly in Shanghai [50] is 16.8 °C, in Xi’an [51] is 19.4 °C, and in Inner Mongolia [40] is 20.52 °C, which is 1.2–4.9 °C lower than that for the elderly in Shandong. This indicates that the elderly in Shandong have a lower tolerance for cold environments compared to those in these regions. The neutral temperature for the elderly in Taiyuan [52] is 22.4 °C, in Hong Kong [53] is 22.6 °C, in Taiwan [36] is 23.2 °C, and in Japan [45] is 23.8 °C, which is 0.7–2.1 °C higher than that of the elderly in Shandong. The neutral temperature for adult staff in nursing homes in Shandong is 20.5 °C, which also differs from that of adults in other regions, such as 21.8 °C for adults in Spanish nursing homes [35] and 21.2 °C for adults in Australian nursing homes [37,54]. This is 0.7–1.3 °C higher than the neutral temperature for adults in Shandong. Figure 12 is plotted based on the thermal comfort regression models in Table 8. The regression coefficients of the models can assess the thermal sensitivity of the subjects, meaning the change in thermal sensation with a 1 °C change in operative temperature. The larger the regression coefficient, the higher the thermal sensitivity, and the smaller the acceptable comfort temperature range [45]. The regression coefficient of the thermal comfort model for the elderly in Shandong obtained in this study is 0.22, higher than in Shanghai (0.076), Xi’an (0.068), Inner Mongolia (0.169), and Japan (0.04). This indicates that the thermal sensitivity of the elderly in Shandong is higher than in these regions but lower than in Taiyuan (0.471), Hong Kong (0.79), and Taiwan (0.28). Similarly, the thermal sensitivity of adults in Shandong (0.26) also differs from that of adults in Australia (0.23). The differences in thermal comfort between nursing home occupants in Shandong and those in other regions are due to variations in the climatic environments of the study areas and the long-standing differences in occupants’ living habits. For example, Shanghai is located in the hot summer and cold winter zone of China’s building climate division. Summers are hot and humid, and winters are cold and damp. Buildings in Shanghai do not have municipal central heating in winter. For a long time, local residents have adapted to the cold and damp environment through behavioral adjustments. Their psychological expectations for warmth in winter are relatively low, which makes them have a higher tolerance for cold environments, thus leading to a lower winter neutral temperature [50].
This study found that the neutral temperature for the elderly in Shandong is 1.2 °C higher than that for adults, and the preferred temperature for the elderly is 0.7 °C higher than that for adults, indicating that the elderly prefer warmer environments compared to adults. The primary reason for this phenomenon is the deterioration of physical functions in the elderly, which leads to a decrease in their body’s heat production and storage capacity. At the same time, certain diseases common among the elderly can also make them feel colder. Additionally, from a psychological perspective, elderly people show a clear preference for warmer environments [51]. To further confirm the accuracy of this conclusion, this study also investigated the thermal adaptive behavior of occupants and the relationship between physiological parameters and thermal comfort. Regression analysis of clothing insulation and operative temperature in nursing home occupants revealed that at the same operative temperature, the clothing insulation of the elderly is higher than that of adults. When the operative temperature increases by 1 °C, the clothing insulation of the elderly decreases by 0.046 clo, while that of adults decreases by 0.053 clo, showing a greater reduction for adults. Regression analysis of average skin temperature and operative temperature revealed that at the same operative temperature, adults have a higher average skin temperature than the elderly. When the operative temperature decreases by 1 °C, the average skin temperature of the elderly drops by about 0.39 °C, while that of adults drops by 0.34 °C, with the elderly showing a slightly greater decrease. Through regression analysis of MTS and average skin temperature, it was found that when the average skin temperature is the same, the MTS value of adults is higher than that of the elderly. When the average skin temperature increases by 1 °C, the MTS of the elderly increases by 0.39 units, while the MTS of adults increases by 0.43 units. Research on adaptive behaviors and physiological parameters in the elderly also demonstrated that compared to adults, the elderly tend to perceive thermal environments as cooler, are better adapted to higher temperatures, and require stronger thermal stimulation to produce the same behavioral feedback as adults. Furthermore, due to the aging of bodily functions, the physiological heat regulation speed in the elderly slows down, making them less sensitive to physiological heat changes.

4.2. Influence of Thermal Comfort on Energy Consumption and Carbon Emissions

To create a comfortable thermal environment for occupants in nursing homes in Shandong, a significant amount of fossil fuel is consumed for building heating during winter. Since the rooms for the elderly in nursing homes are highly similar in function and space, a typical room was selected from the six surveyed nursing homes for energy consumption simulation, and the corresponding carbon emissions were calculated to explore the impact of thermal comfort on energy consumption and carbon emissions. An elderly room in nursing home No. 1 was selected as the simulation object (Figure 13). A performance simulation model was established in Rhino using Grasshopper, utilizing meteorological data from the China Standard Weather Database (CSWD) provided by EnergyPlus. The parameters of the building envelope were set according to the Chinese national standard GB 55015 [56]. Parameters such as personnel schedules, lighting power, and room equipment power were set according to actual conditions. The main simulation parameter settings are shown in Table 9. After setting the parameters, simulations were conducted using Ladybug & Honeybee software.
To ensure thermal comfort for nursing home occupants, the winter heating set temperature should be maintained within the comfort temperature range identified in this study (elderly: 19.4–24.0 °C, adults: 18.6–22.5 °C). The upper and lower limits of the comfort temperature range, as well as the neutral temperature, are used as the heating set temperatures to simulate building energy consumption and carbon emissions during the heating season. The results are shown in Table 10. The data show that each 1 °C reduction in the heating set temperature results in a decrease in heating energy consumption and carbon emissions by 2.3 kWh / m 2 and 0.8 kgCO 2 / m 2 , respectively, with reduction rates of 11.1% and 11.9%. For rooms frequently used by the elderly, using the lower limit of the comfort temperature range as the heating set temperature, instead of the neutral temperature for the elderly, can reduce energy consumption and carbon emissions by 5.2 kWh / m 2 and 1.7 kgCO 2 / m 2 , respectively, with reductions of 25% and 25.4%. For the heating set temperature of rooms frequently used by adult staff, using the lower limit of the comfort temperature range for adults instead of the neutral temperature can save 4.2 kWh / m 2 of energy and 1.4 kgCO 2 / m 2 in carbon emissions, with savings of 23.2% and 24.1%, respectively. It can be observed that lowering the winter heating set temperature effectively reduces energy consumption and carbon emissions (Figure 14). Therefore, in the future heating process of nursing homes, the lower limit of the comfort temperature range can be used as the heating set temperature, and different temperatures can be provided according to the primary users. Specifically (Table 11), in rooms frequently used by the elderly, such as elderly rooms and activity rooms, the lower limit of the elderly comfort temperature range, 19.4 °C, should be used as the heating set temperature. Similarly, in rooms frequently used by adult staff, such as offices and workrooms, the lower limit of the adult comfort temperature range, 18.6 °C, should be used as the heating set temperature. This approach can not only meet the thermal comfort needs of different user groups but also achieve energy-saving and emission-reduction goals.
Additionally, passive building techniques should be used to improve the insulation performance of nursing homes. On the basis of reducing the heating set temperature to save energy, when the building has good insulation performance, it can further reduce the building energy consumption and carbon emissions required to maintain a comfortable thermal environment. Specific measures include the following: (a) Adding high-performance insulation layers with low thermal conductivity to the building’s roof and exterior walls to reduce heat loss. For example, adding insulation materials such as graphite extruded polystyrene board, extruded polystyrene board, rigid polyurethane foam board, and stone wool board can enhance the insulation performance of roofs and exterior walls. (b) Replacing high-performance insulated windows with lower heat transfer coefficients can effectively improve the insulation performance of buildings. Three-layer insulating glass filled with argon gas or with low-E film can be used, and the glass frame material can be selected from insulating aluminum alloy, plastic, aluminum wood composite materials, etc. (c) Reasonably controlling the window-to-wall ratio for each orientation is important. The window area on the north facade should be appropriately reduced to prevent cold-air infiltration, while the window areas on the east and west facades should not be too large. The window area on the south facade should be appropriately increased to receive more solar radiation. (d) If conditions allow, a sunroom can be added on the south side to passively utilize solar energy. It stores excess solar heat during the day and releases it at night, addressing the issue of large indoor temperature differences between day and night. A sunroom can also serve as a buffer space to prevent cold winter air from directly entering commonly used indoor areas through doors and windows, thereby reducing the building’s heating energy consumption while ensuring thermal comfort.

5. Conclusions

In the context of the population aging and energy conservation and emission reduction, this paper focuses on nursing homes in Shandong, China, as the research subject. Through field tests and surveys, it explores the winter thermal environment of nursing homes and the thermal comfort of elderly people and adult staff. The main conclusions of this study are as follows:
(1)
The chi-square test shows a significant difference in thermal sensation between the elderly and adults in nursing homes. Under the same environmental conditions, elderly people perceive the thermal environment as cooler than adults. Regression analysis revealed that the measured neutral temperatures for elderly and adult occupants in nursing homes are 21.7 and 20.5 °C, respectively. Their comfortable temperature ranges are 19.4–24.0 °C and 18.6–22.5 °C, respectively. The measured neutral temperature and the limits of the comfortable temperature range for elderly people are both higher than those for adults. The comfortable temperature range for elderly people is broader. This indicates that the elderly have higher demands for thermal environments compared to adults and prefer a warmer environment. Designers can use these parameters to create nursing home spaces with comfortable thermal environments, while managers can assess whether existing facilities meet thermal comfort requirements. Applying the results of this study will enhance the quality of life for nursing home occupants, increase their well-being and productivity, and offer substantial social benefits.
(2)
Through regression analysis, the differences in thermal preferences between the elderly and adults were further identified. The preferred temperature for the elderly is 23.8 °C, while the adults’ preferred temperature is lower, at 23.1 °C. However, for both the elderly and adults, the preferred temperature is higher than their respective neutral temperatures by 2.1 and 2.6 °C. This indicates that nursing home occupants in winter prefer a warmer environment than the neutral temperature, reflecting a higher psychological expectation for the thermal environment. Excessively high temperatures can lead to energy waste, so nursing home managers should encourage the elderly to actively adapt to the indoor thermal environment through thermal adaptive behaviors while also enhancing the facility’s insulation performance using passive building technologies to improve sustainability.
(3)
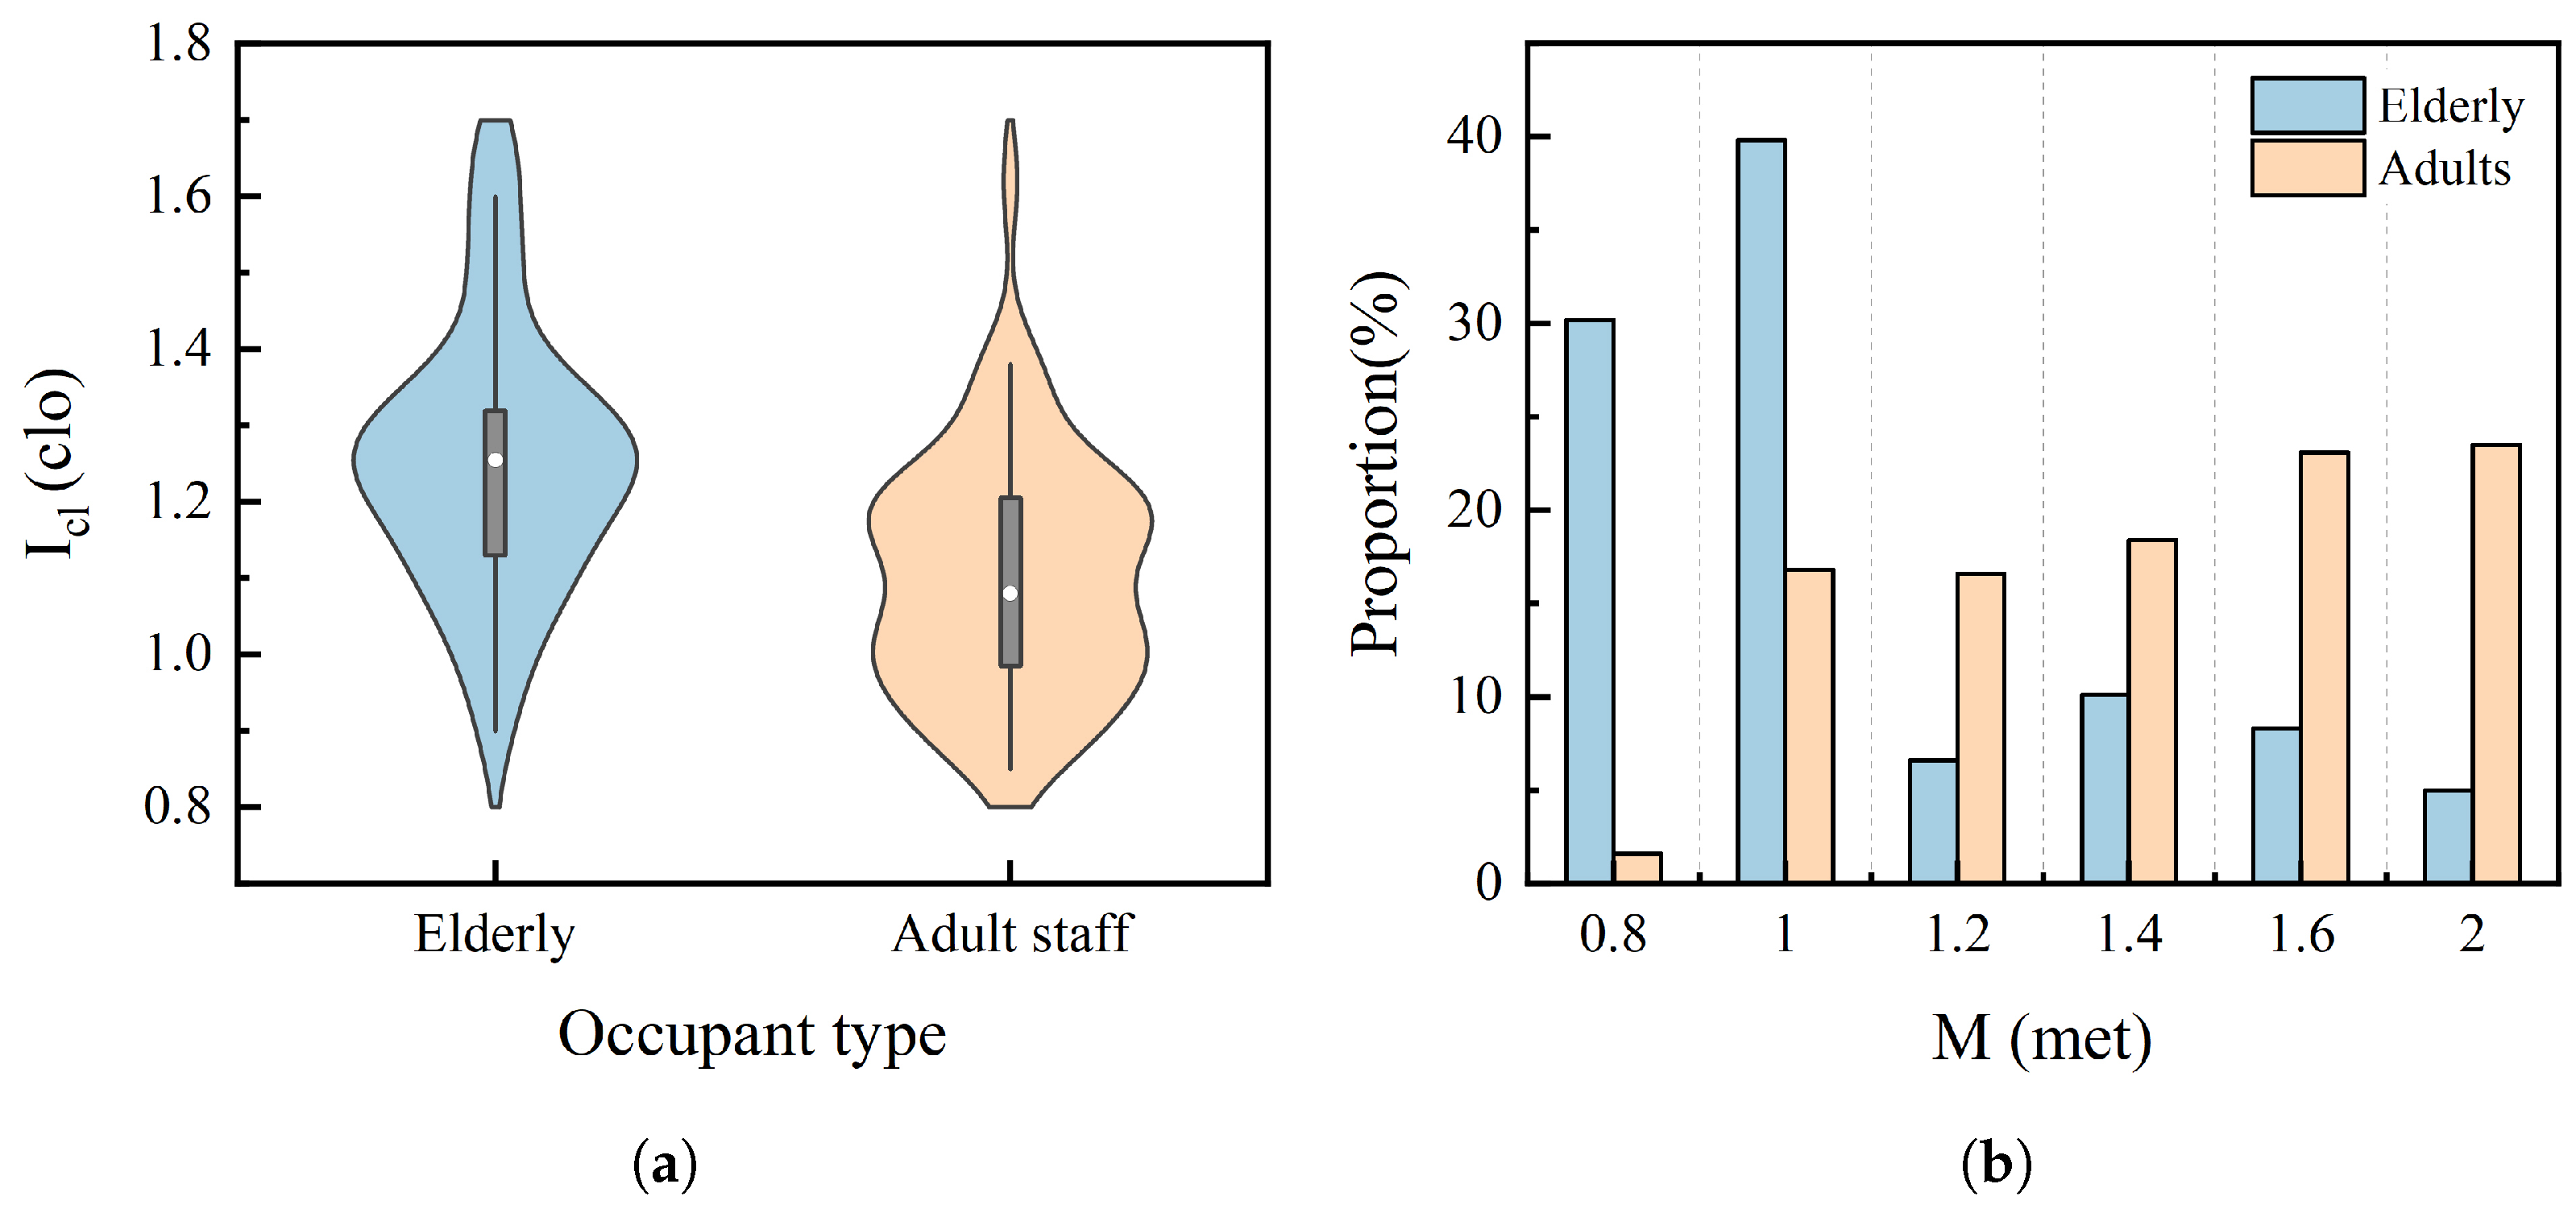
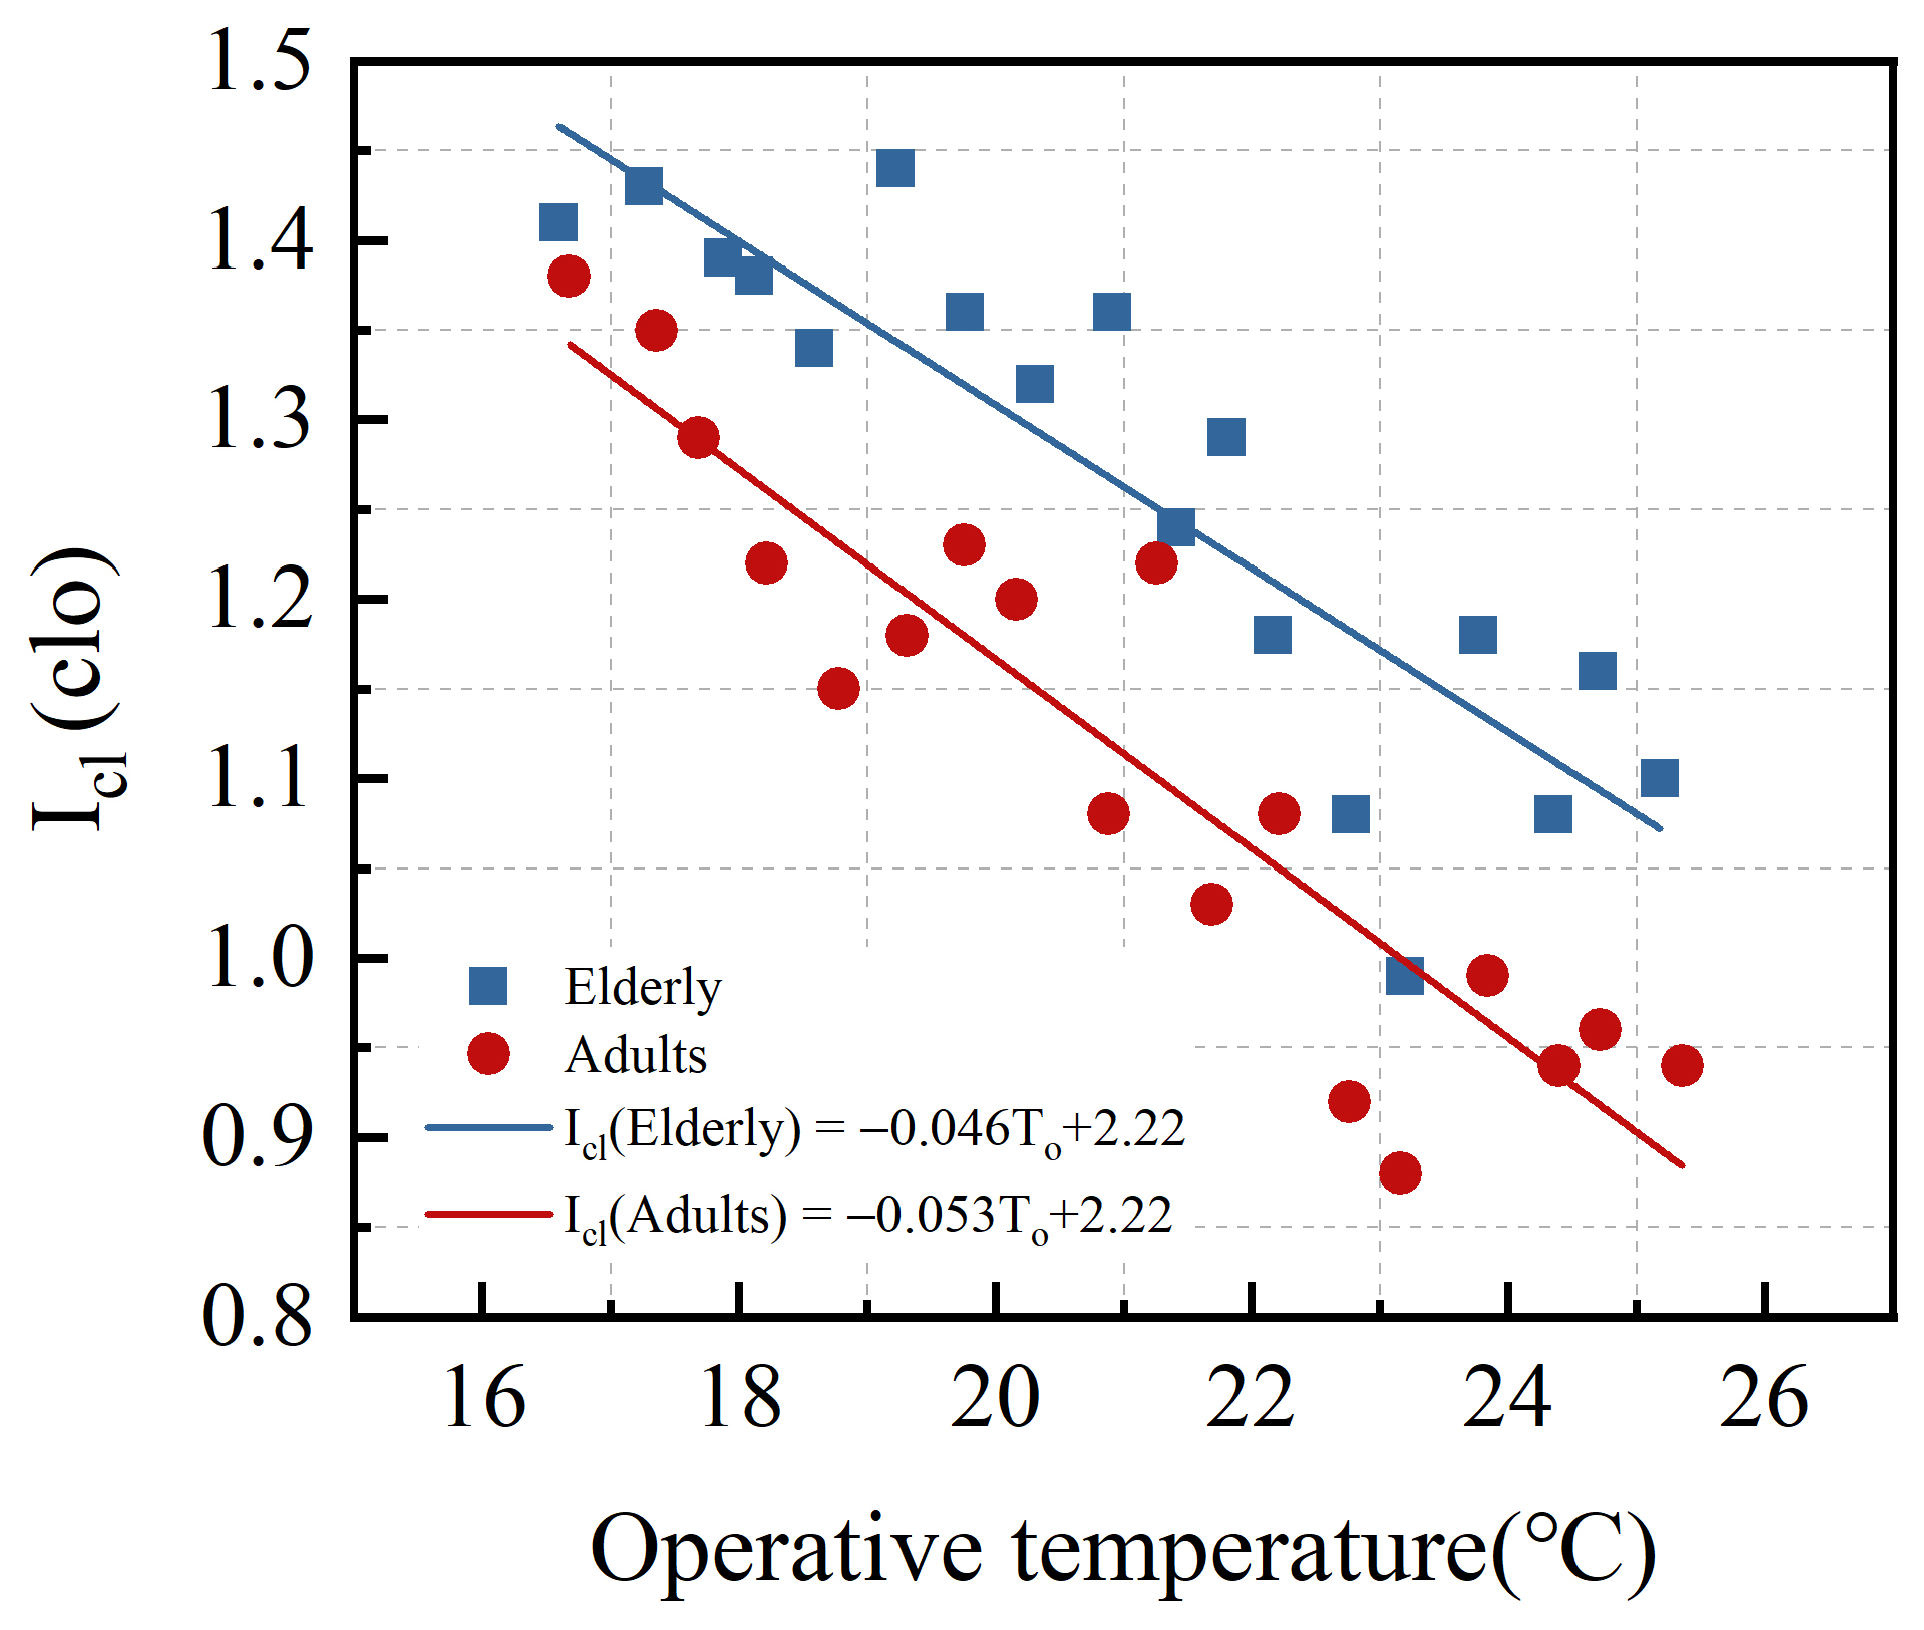
The adaptive behavior of nursing home occupants to the thermal environment mainly involves adjusting their clothing. By modeling the relationship between clothing insulation and operative temperature, it was found that at the same operative temperature, the clothing insulation of the elderly is higher than that of adults. For each 1 °C increase in operative temperature, the clothing insulation decreases by approximately 0.046 clo for the elderly and 0.053 clo for adults. This proves that the elderly have a higher tolerance for high temperatures than adults and require more clothing to maintain thermal comfort in the same thermal environment. The conclusions of this study can help nursing home staff provide scientific guidance on the daily dressing behavior of the elderly, aiding them in better adapting to the thermal environment and preventing some elderly individuals from being exposed to cold environments for long periods due to inappropriate clothing, thereby reducing health risks.
(4)
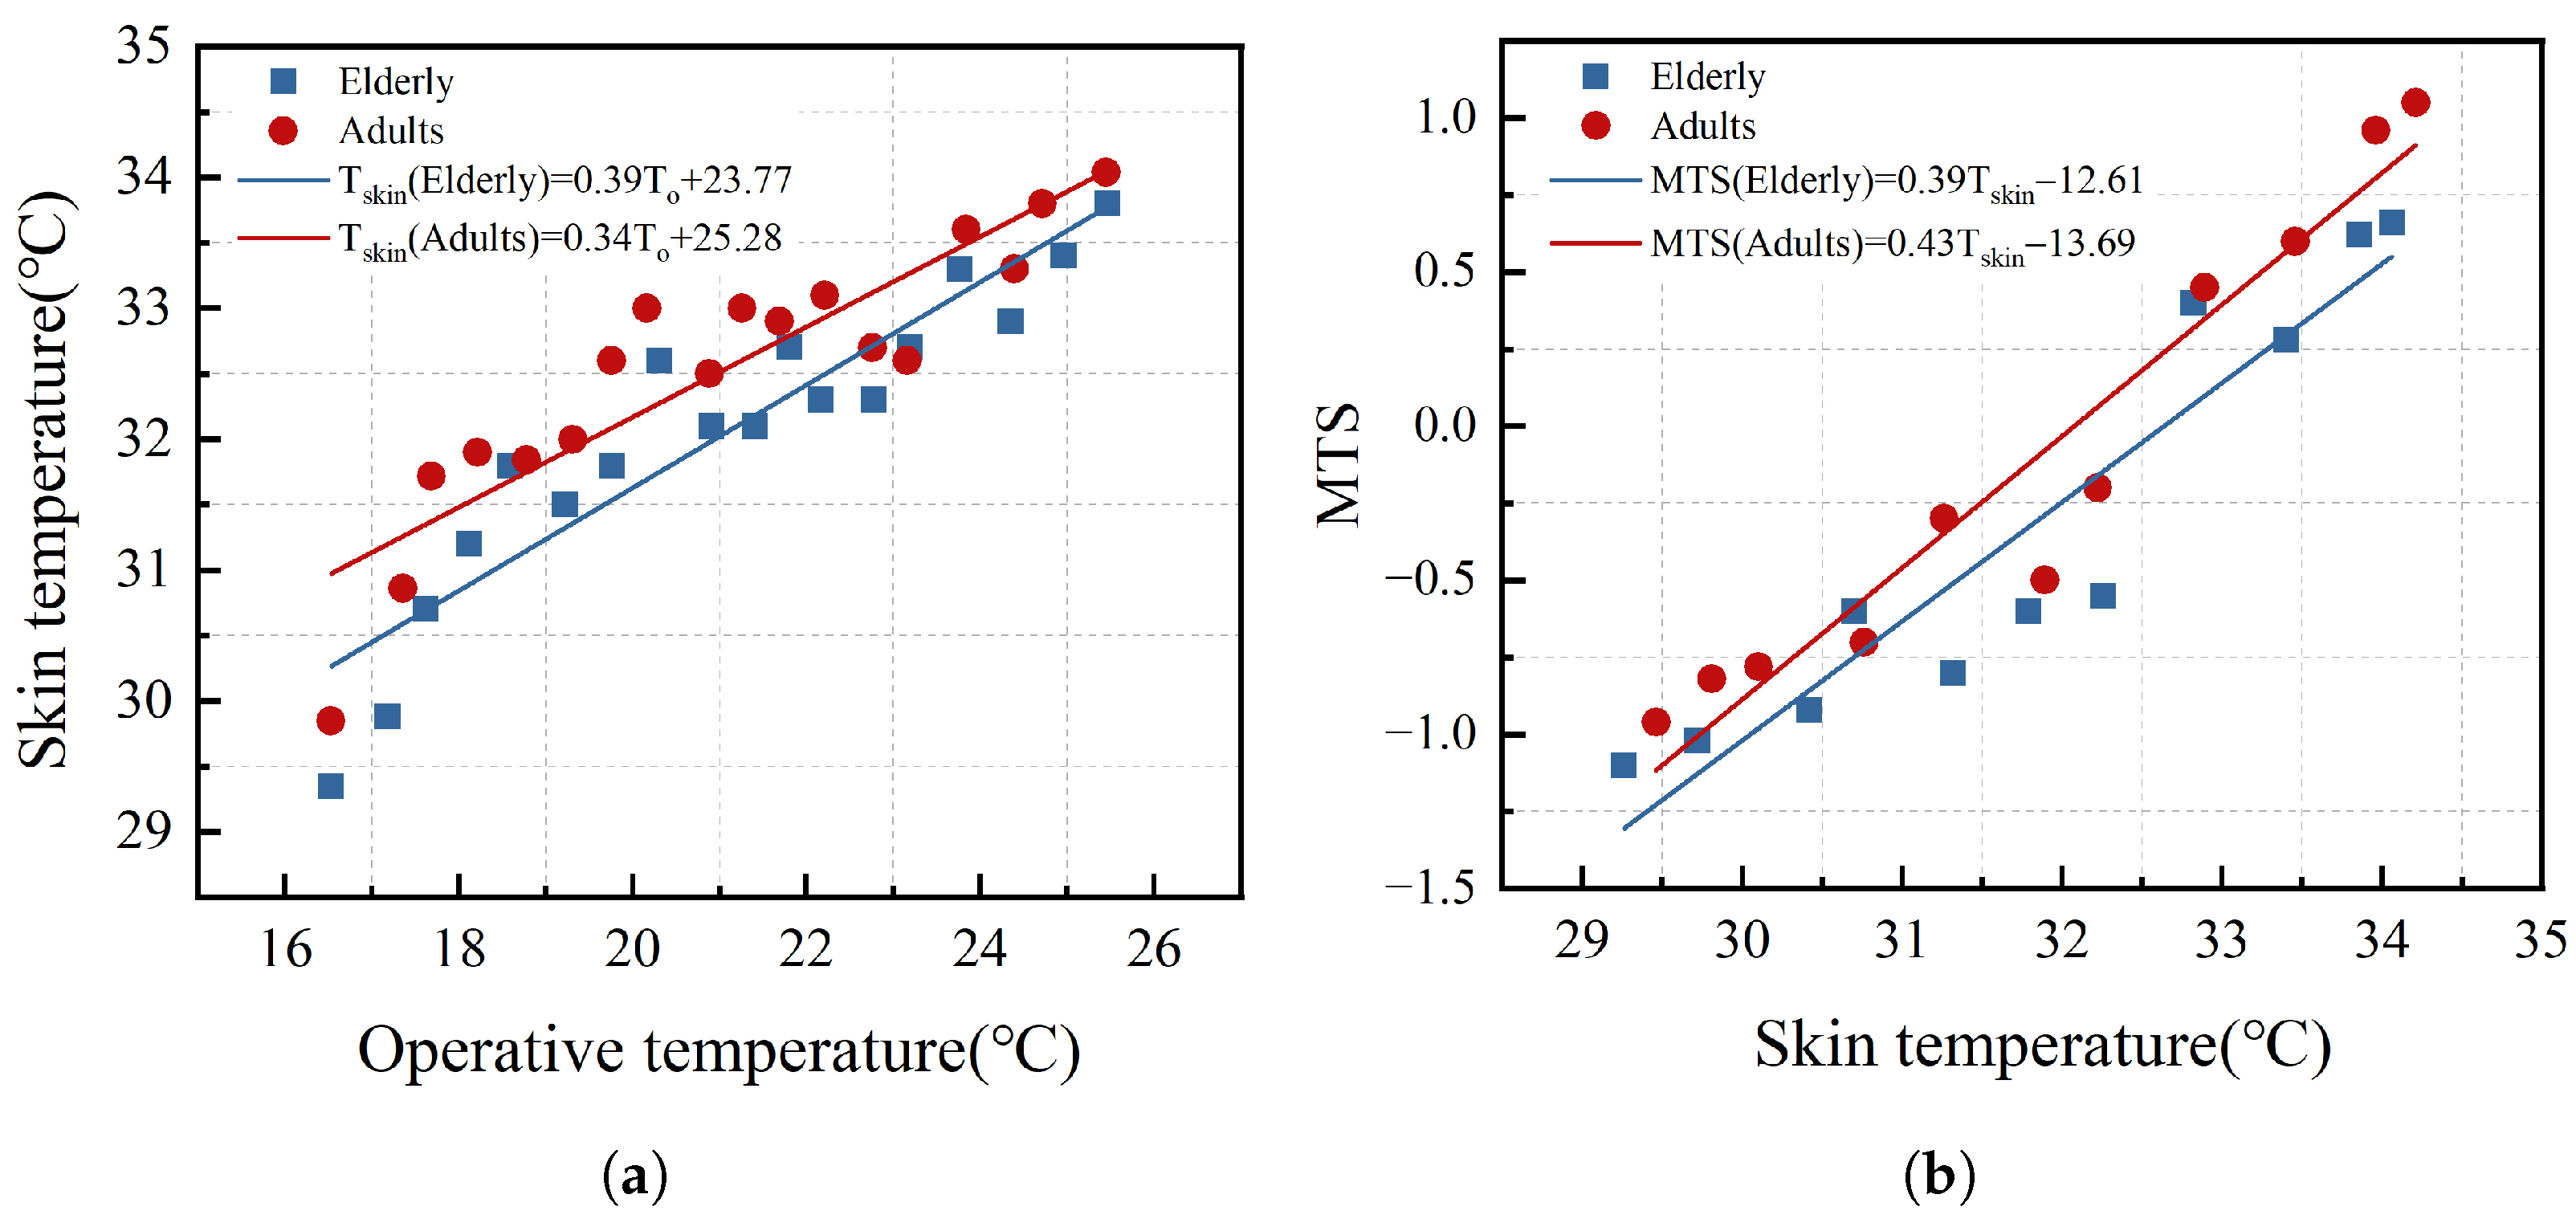
Regression analysis found that there is a correlation between skin temperature and thermal comfort parameters. When the operative temperature is the same, the average skin temperature of the elderly is lower than that of adults. For each 1 °C decrease in operative temperature, the average skin temperature of the elderly and adults decreases by 0.39 and 0.34 °C, respectively. With the same average skin temperature, the MTS value of the elderly is lower than that of adults. For every 1 °C increase in average skin temperature, the MTS increases by 0.39 units for the elderly and 0.43 units for adults. This indicates that the physiological thermal regulation of the elderly slows down, making them less sensitive to changes in skin temperature and feeling colder in the same thermal environment. Therefore, it is recommended that nursing home staff regularly monitor the skin temperature of the elderly during daily care to prevent skin hypothermia caused by inappropriate behavior, reduced thermoregulatory capacity, or illness, which could negatively impact thermal comfort.
(5)
The heating set temperature in nursing homes can be controlled within the comfort temperature range. However, energy consumption simulations show that lowering the heating set temperature can reduce energy consumption and carbon emissions. For each 1 °C reduction, the heating energy consumption and carbon emissions in the typical room decrease by 2.3 kWh/°C and 0.8 kgCO 2 / m 2 , respectively, with cuts of 11.1 and 11.9%. Therefore, it is recommended that nursing homes use the lower limit of the comfort temperature range as the actual heating set temperature and adjust the heating temperature according to the primary user groups. The heating set temperature for rooms like bedrooms and activity rooms, which are used primarily by the elderly, can be set to the lower limit of the elderly’s comfort temperature range at 19.4 °C. For rooms such as offices and workspaces used primarily by adult staff, the heating set temperature can be set to the lower limit of the adult comfort temperature range at 18.6 °C. Additionally, on the basis of lowering the heating set temperature, improving the insulation performance of nursing homes through passive building techniques can further reduce energy consumption. Measures that can be taken include adding high-performance insulation layers to roofs and exterior walls, replacing doors and windows with lower heat transfer coefficient, reasonably controlling the window-to-wall area ratio on each facade, and adding sunrooms. Lowering the heating set temperature and improving the building’s insulation performance can effectively reduce energy consumption, offering significant economic and environmental benefits.
This paper explores and analyzes the winter thermal comfort of nursing home occupants in the Shandong region, providing data and strategic support for the design, evaluation, and operation management of the thermal environment in nursing homes. It is significant for improving the winter thermal comfort of occupants, reducing energy consumption, and decreasing carbon dioxide emissions. The research is planned to be extended to the summer season in the future, focusing on the thermal comfort of nursing home occupants in the Shandong region during summer. Furthermore, based on measured data, we will explore how to use artificial intelligence technologies, such as machine learning, for thermal comfort prediction.

Author Contributions

Conceptualization, N.S. and Y.C.; methodology, N.S. and J.B.; software, X.D.; validation, X.D.; formal analysis, N.S. and J.B.; investigation, X.D.; resources, N.S. and X.D.; data curation, X.D. and J.B.; writing—original draft preparation, N.S. and Y.C.; writing—review and editing, N.S. and J.B.; visualization, X.D. and Y.C.; supervision, J.B. and Y.C.; project administration, J.B. and Y.C.; funding acquisition, Y.C. All authors have read and agreed to the published version of the manuscript.

Funding

This research was funded by the Research and Development Project of the Ministry of Housing and Urban-Rural Development of the People’s Republic of China (2022-K-148).

Institutional Review Board Statement

The study was conducted in accordance with the Declaration of Helsinki, and approved by the Institutional Review Board (or Ethics Committee) of School of Art, Shandong Jianzhu University (protocol code 2022-068 and date of approval on 9 October 2022) for studies involving humans.

Informed Consent Statement

Informed consent was obtained from all subjects involved in the study.

Data Availability Statement

The original contributions of this study are included in the article. Further enquiries can be directed to the corresponding authors.

Conflicts of Interest

Author Jialin Bi was employed by the company China Mobile Group Shandong Co., Ltd. The remaining authors declare that the research was conducted in the absence of any commercial or financial relationships that could be construed as a potential conflict of interest.

References

  1. Rudnicka, E.; Napierała, P.; Podfigurna, A.; Mȩczekalski, B.; Smolarczyk, R.; Grymowicz, M. The World Health Organization (WHO) approach to healthy ageing. Maturitas 2020, 139, 6–11. [Google Scholar] [CrossRef] [PubMed]
  2. World Health Organization. Ageing and Health. 2022. Available online: https://www.who.int/news-room/fact-sheets/detail/ageing-and-health (accessed on 20 June 2023).
  3. Department of Economic and Social Affairsn. World Population Ageing 2017 Highlights. 2017. Available online: https://www.un.org/en/development/desa/population/publications/pdf/ageing/WPA2017_Highlights.pdf (accessed on 12 December 2023).
  4. National Institute on Aging. Census Bureau Releases Report on Aging in Asia. 2022. Available online: https://www.nia.nih.gov/news/census-bureau-releases-report-aging-asia (accessed on 6 December 2023).
  5. National Bureau of Statistics of China Office of the Leading Group of the State Council for the Seventh National Population Census. Communiqué of the Seventh National Population Census. 2021. Available online: https://www.stats.gov.cn/english/PressRelease/202105/t20210510_1817190.html (accessed on 6 January 2024).
  6. National Development and Reform Commission. Plan for the Development of National Elderly Care and the Elderly Care Service System during the 14th Five Year Plan Period. 2021. Available online: https://www.ndrc.gov.cn/fggz/fzzlgh/gjjzxgh/202203/t20220325_1320220_ext.html?eqid=822461d80000b67000000006647d59dd. (accessed on 8 January 2024).
  7. Yang, J.; Nam, I.; Sohn, J.R. The influence of seasonal characteristics in elderly thermal comfort in Korea. Energy Build. 2016, 128, 583–591. [Google Scholar] [CrossRef]
  8. Salata, F.; Golasi, I.; Petitti, D.; de Lieto Vollaro, E.; Coppi, M.; de Lieto Vollaro, A. Relating microclimate, human thermal comfort and health during heat waves: An analysis of heat island mitigation strategies through a case study in an urban outdoor environment. Sustain. Cities Soc. 2017, 30, 79–96. [Google Scholar] [CrossRef]
  9. Shchukina, I.; Youm, Y.H.; Ryu, S.; Young, K.; Camell, C.; Dlugos, T.; Artyomov, M.; Dixit, V.; Goldberg, E.; Tsusaka, T. IL-33 causes thermogenic failure in aging by expanding dysfunctional adipose ILC2. Cell Metab. 2021, 33, 2277–2287.e5. [Google Scholar] [CrossRef]
  10. Xiong, J.; Ma, T.; Lian, Z.; de Dear, R. Perceptual and physiological responses of elderly subjects to moderate temperatures. Build. Environ. 2019, 156, 117–122. [Google Scholar] [CrossRef]
  11. Jiao, Y.; Yu, Y.; Hu, Y.; Zhang, Q.; Yu, H. Evidence-based Study on the Effects of Indoor Thermal Environment on Physiological Parameters and Health of the Older People in Shanghai Aged Home. Archit. Tech. 2020, 26, 45–49. [Google Scholar]
  12. Gomez-Acebo, I.; Llorca, J.; Dierssen, T. Cold-related mortality due to cardiovascular diseases, respiratory diseases and cancer: A case-crossover study. Public Health 2013, 127, 252–258. [Google Scholar] [CrossRef]
  13. Chen, T.H.; Li, X.; Zhao, J.; Zhang, K. Impacts of cold weather on all-cause and cause-specific mortality in Texas, 1990–2011. Environ. Pollut. 2017, 225, 244–251. [Google Scholar] [CrossRef]
  14. Savaresi, A. The Paris Agreement: A new beginning? J. Energy Nat. Resour. Law 2016, 34, 16–26. [Google Scholar] [CrossRef]
  15. Wang, Y.; Guo, C.H.; Chen, X.J.; Jia, L.Q.; Guo, X.N.; Chen, R.S.; Zhang, M.S.; Chen, Z.Y.; Wang, H.D. Carbon peak and carbon neutrality in China: Goals, implementation path and prospects. China Geol. 2021, 4, 720–746. [Google Scholar] [CrossRef]
  16. GBT50176; Thermal Design Code for Civil Building. Ministry of Housing and Urban-Rural Development of the People’s Republic of China, China Architecture and Building Press: Beijing, China, 2016.
  17. Yang, L.; Yan, H.; Lam, J.C. Thermal comfort and building energy consumption implications—A review. Appl. Energy 2014, 115, 164–173. [Google Scholar] [CrossRef]
  18. Bienvenido-Huertas, D.; Rubio-Bellido, C.; Farinha, F.; Oliveira, M.J.; Pérez-Ordóñez, J.L. Evaluating the potential of adaptive comfort approach using historic data to reduce energy consumption in buildings in southern Spain. Build. Environ. 2020, 185, 107313. [Google Scholar] [CrossRef] [PubMed]
  19. ANSI/ASHRAE Standard 55; Thermal Environmental Conditions for Human Occupancy. American Society of Heating, Refrigerating and Air-Conditioning Engineers, Inc.: Peachtree Corners, GA, USA, 2017.
  20. ISO 7730; Ergonomics of the Thermal Environment—Analytical Determination and Interpretation of Thermal Comfort Using Calculation of the PMV and PPD Indices and Local Thermal Comfort Criteria. International Organization for Standardization: Geneva, Switzerland, 2005.
  21. EN 16798-1:2019; Energy Performance of Buildings—Ventilation for Buildings—Part 1: Indoor Environmental Input Parameters for Design and Assessment of Energy Performance of Buildings Addressing Indoor Air Quality, Thermal Environment, Lighting and Acoustics. European Committee for Standardization: Brussels, Belgium, 2019.
  22. Baquero, M.T.; Forcada, N. Thermal comfort of older people during summer in the continental Mediterranean climate. J. Build. Eng. 2022, 54, 104680. [Google Scholar] [CrossRef]
  23. Zaki, S.A.; Damiati, S.A.; Rijal, H.B.; Hagishima, A.; Abd Razak, A. Adaptive thermal comfort in university classrooms in Malaysia and Japan. Build. Environ. 2017, 122, 294–306. [Google Scholar] [CrossRef]
  24. Zheng, P.; Wu, H.; Liu, Y.; Ding, Y.; Yang, L. Thermal comfort in temporary buildings: A review. Build. Environ. 2022, 221, 109262. [Google Scholar] [CrossRef]
  25. GB 50736; Design Code for Heating Ventilation and Air Conditioning of Civil Buildings. Ministry of Housing and Urban-Rural Development of the People’s Republic of China, China Architecture and Building Press: Beijing, China, 2012.
  26. Jiao, Y.; Yu, H.; Wang, T.; An, Y.; Yu, Y. Thermal comfort and adaptation of the elderly in free-running environments in Shanghai, China. Build. Environ. 2017, 118, 259–272. [Google Scholar] [CrossRef]
  27. Wu, Y.; Liu, H.; Li, B.; Kosonen, R.; Kong, D.; Zhou, S.; Yao, R. Thermal adaptation of the elderly during summer in a hot humid area: Psychological, behavioral, and physiological responses. Energy Build. 2019, 203, 109450. [Google Scholar] [CrossRef]
  28. Zhang, Z.; Xiao, Y.; Ren, Z. Study on Heating Status and Thermal Comfort in Rural Areas of Southwest Mountainous Area in Winter: Take Northwest Guizhou as An Example. J. Hum. Settlements West China 2023, 38, 80–86. [Google Scholar]
  29. Larriva, M.T.B.; Higueras, E. Health risk for older adults in Madrid, by outdoor thermal and acoustic comfort. Urban Clim. 2020, 34, 100724. [Google Scholar] [CrossRef]
  30. Forcada, N.; Gangolells, M.; Casals, M.; Tejedor, B.; Macarulla, M.; Gaspar, K. Summer thermal comfort in nursing homes in the Mediterranean climate. Energy Build. 2020, 229, 110442. [Google Scholar] [CrossRef]
  31. Jin, Y.; Wang, F.; Payne, S.R.; Weller, R.B. A comparison of the effect of indoor thermal and humidity condition on young and older adults’ comfort and skin condition in winter. Indoor Built Environ. 2022, 31, 759–776. [Google Scholar] [CrossRef]
  32. Larriva, M.T.B.; García, E.H. Thermal comfort for the elderly: A systematic review of the scientific literature. Rev. Esp. Geriatr. Gerontol. 2019, 54, 280–295. [Google Scholar] [CrossRef]
  33. Hughes, C.; Natarajan, S.; Liu, C.; Chung, W.J.; Herrera, M. Winter thermal comfort and health in the elderly. Energy Policy 2019, 134, 110954. [Google Scholar] [CrossRef]
  34. Sudarsanam, N.; Kannamma, D. Investigation of summertime thermal comfort at the residences of elderly people in the warm and humid climate of India. Energy Build. 2023, 291, 113151. [Google Scholar] [CrossRef]
  35. Forcada, N.; Gangolells, M.; Casals, M.; Tejedor, B.; Macarulla, M.; Gaspar, K. Field study on thermal comfort in nursing homes in heated environments. Energy Build. 2021, 244, 111032. [Google Scholar] [CrossRef]
  36. Hwang, R.L.; Chen, C.P. Field study on behaviors and adaptation of elderly people and their thermal comfort requirements in residential environments. Indoor Air 2010, 20, 235–245. [Google Scholar] [CrossRef]
  37. Tartarini, F.; Cooper, P.; Fleming, R. Thermal perceptions, preferences and adaptive behaviours of occupants of nursing homes. Build. Environ. 2018, 132, 57–69. [Google Scholar] [CrossRef]
  38. Liu, G.; Cen, C.; Zhang, Q.; Liu, K.; Dang, R. Field study on thermal comfort of passenger at high-speed railway station in transition season. Build. Environ. 2016, 108, 220–229. [Google Scholar] [CrossRef]
  39. Jia, C.; Zhang, Z.; Wang, M.; Han, S.; Cao, J.; Rong, Y.; Du, C. Investigation on indoor thermal environment of industrial heritage during the cooling season and its impacts on thermal comfort. Case Stud. Therm. Eng. 2023, 52, 103769. [Google Scholar] [CrossRef]
  40. Li, H.; Xu, G.; Chen, J.; Duan, J. Investigating the adaptive thermal comfort of the elderly in rural mutual aid homes in central inner mongolia. Sustainability 2022, 14, 6802. [Google Scholar] [CrossRef]
  41. GB/T 50785; Evaluation Standard for Indoor Thermal Environment in Civil Buildings. Ministry of Housing and Urban-Rural Development of the People’s Republic of China, China Architecture and Building Press: Beijing, China, 2012.
  42. Liang, S.; Xie, Y.; Chen, Y.; Cheng, Y.; Zhang, H. Field study on inpatient’s thermal comfort in general ward in winter. Build. Sci. 2022, 38, 144–152. [Google Scholar]
  43. Kharvari, F. An empirical validation of daylighting tools: Assessing radiance parameters and simulation settings in Ladybug and Honeybee against field measurements. Sol. Energy 2020, 207, 1021–1036. [Google Scholar] [CrossRef]
  44. Yan, H.; Yan, K.; Ji, G. Optimization and prediction in the early design stage of office buildings using genetic and XGBoost algorithms. Build. Environ. 2022, 218, 109081. [Google Scholar] [CrossRef]
  45. Kainaga, T.; Sagisaka, K.; Yamada, R.; Nakaya, T. A case study of a nursing home in nagano, Japan: Field survey on thermal comfort and building energy simulation for future climate change. Energies 2022, 15, 936. [Google Scholar] [CrossRef]
  46. Fanger, P.O. Assessment of man’s thermal comfort in practice. Occup. Environ. Med. 1973, 30, 313–324. [Google Scholar] [CrossRef]
  47. Lai, D.; Zhou, X.; Chen, Q. Measurements and predictions of the skin temperature of human subjects on outdoor environment. Energy Build. 2017, 151, 476–486. [Google Scholar] [CrossRef]
  48. Tian, X.; Shi, L.; Wang, Z.; Liu, W. A thermal comfort evaluation model based on facial skin temperature. Build. Environ. 2023, 235, 110244. [Google Scholar] [CrossRef]
  49. Zhou, S.; Li, B.; Du, C.; Liu, H.; Wu, Y.; Hodder, S.; Chen, M.; Kosonen, R.; Ming, R.; Ouyang, L.; et al. Opportunities and challenges of using thermal comfort models for building design and operation for the elderly: A literature review. Renew. Sustain. Energy Rev. 2023, 183, 113504. [Google Scholar] [CrossRef]
  50. Jiao, Y.; Yu, H.; Yu, Y.; Wang, Z.; Wei, Q. Adaptive thermal comfort models for homes for older people in Shanghai, China. Energy Build. 2020, 215, 109918. [Google Scholar] [CrossRef]
  51. Zheng, W.; Shao, T.; Lin, Y.; Wang, Y.; Dong, C.; Liu, J. A field study on seasonal adaptive thermal comfort of the elderly in nursing homes in Xi’an, China. Build. Environ. 2022, 208, 108623. [Google Scholar] [CrossRef]
  52. Liu, X.; Yue, P. Investigation and study on winter indoor thermal environment of reconstructed nursing homes for the elderly in Taiyuan. Heat. Vent. Air Cond. 2019, 49, 120–127. [Google Scholar]
  53. Tao, Y.; Gou, Z.; Yu, Z.; Fu, J.; Chen, X. The challenge of creating age-friendly indoor environments in a high-density city: Case study of Hong Kong’s care and attention homes. J. Build. Eng. 2020, 30, 101280. [Google Scholar] [CrossRef]
  54. Tartarini, F.; Cooper, P.; Fleming, R. Thermal environment and thermal sensations of occupants of nursing homes: A field study. Procedia Eng. 2017, 180, 373–382. [Google Scholar] [CrossRef]
  55. Forcada, N.; Gangolells, M.; Casals, M.; Tejedor, B.; Macarulla, M.; Gaspar, K. Field study on adaptive thermal comfort models for nursing homes in the Mediterranean climate. Energy Build. 2021, 252, 111475. [Google Scholar] [CrossRef]
  56. GB 55015; General Code for Energy Efficiency and Renewable Energy Application in Buildings. Ministry of Housing and Urban-Rural Development of the People’s Republic of China, China Architecture and Building Press: Beijing, China, 2021.
Figure 1. The location of Shandong Province.
Buildings 14 02881 g001
Figure 2. Six nursing homes investigated in Shandong: (a) Nursing home 1. (b) Nursing home 2. (c) Nursing home 3. (d) Nursing home 4. (e) Nursing home 5. (f) Nursing home 6.
Buildings 14 02881 g002
Figure 3. Thermal comfort survey: (a) Elderly people in a bedroom. (b) Elderly people in a public space. (c) Adult caregivers in a bedroom. (d) Adult caregivers in an office.
Buildings 14 02881 g003
Figure 4. Parameter testing: (a) Instruments used for measurement (b) Air temperature and relative humidity. (c) Air velocity. (d) Skin temperature.
Buildings 14 02881 g004
Figure 5. Thermal comfort voting for the elderly and adults: (a) Thermal sensation. (b) Thermal preference. (c) Thermal acceptability.
Buildings 14 02881 g005
Figure 6. Regression analysis of MTS and operative temperature for the elderly and adults.
Buildings 14 02881 g006
Figure 7. Regression analysis of PMV and operative temperature for the elderly and adults.
Buildings 14 02881 g007
Figure 8. Regression analysis of the people proportion and operative temperature: (a) Elderly people. (b) Adults.
Buildings 14 02881 g008
Figure 9. Distribution of clothing insulation and metabolic rate for the elderly and adults: (a) Clothing insulation. (b) Metabolic rate.
Buildings 14 02881 g009
Figure 10. Regression analysis of clothing insulation and operative temperature for the elderly and adults.
Buildings 14 02881 g010
Figure 11. Influence of skin temperature on thermal comfort: (a) Regression analysis of skin temperature and operative temperature. (b) Regression analysis of MTS and skin temperature.
Buildings 14 02881 g011
Figure 12. Regression model between thermal sensation vote and operative temperature in different studies.
Buildings 14 02881 g012
Figure 13. Floor plan and model of the elderly bedroom.
Buildings 14 02881 g013
Figure 14. Comparison of energy consumption and CO 2 emissions at different heating set temperatures.
Buildings 14 02881 g014
Table 1. Indicators of questionnaire survey.
IndexQuestionScale
TSVHow do you feel at this moment?−3 Cold, −2 Cool, −1 Slightly cool, 0 Neutral, +1 Slightly warm, +2 Warm, +3 Hot
PWhat would you prefer at this moment?−1 Cooler, 0 Without change, +1 Warmer
AIs the thermal environment acceptable at this moment?1 Acceptable, 0 Unacceptable
Table 2. Metabolic rates for typical behaviors.
ActivityRecliningSeated–TV/ChattingSeated–FilingStanding–RelaxStanding–Walking aboutStanding–House Cleaning
M (met)0.81.01.21.41.62.0
Table 3. The number of participants in different types of rooms during the investigation.
RoomBedroomActivity RoomMedical RoomOffice and WorkspacePublic Spaces
(Corridors, Foyers, etc.)
Number of elderly people52562320109
Number of adult staff41283010126
Table 4. Measurement instrument parameters.
Test ParametersTesting InstrumentsTesting Instruments
Air temperature ( T a )
Relative humidity ( R H )
Elitech GSP-8A temperature
and humidity recorder
Air temperature:
Range: −40–85 °C;
Precision: ±0.3 °C;
Resolution ratio: 0.1 °C
Relative humidity:
Range: 10–90%;
Precision: ±3%;
Resolution ratio: 0.1%
Air velocity ( V a )Benetech thermal anemometerRange: 0.001–30 m/s;
Precision: ±2%;
Resolution ratio: 0.001 m/s
Globe temperature ( T g )RS-HQ globe temperature recorderRange: −20–60 °C;
Precision: ±0.2 °C;
Resolution ratio: 0.1 °C
Skin temperature ( T s k i n )Ibutton temperature recorderRange: −40–85 °C;
Precision: ±0.5 °C;
Resolution ratio: 0.0625 °C
Table 5. Statistics of outdoor and indoor environmental data.
No.Parameter T a (°C) RH (%) V a (m/s) T g (°C) T out (°C) RH out (%)
No. 1 nursing homeMean20.625.50.0220.3057.2
Max2333.40.1122.95.667.7
Min18.319.5018.2−3.549.6
SD0.72.10.010.61.94.6
No. 2 nursing homeMean17.929.40.0318.20.855.4
Max19.338.70.1319.96.270.1
Min16.120.90.0116.1−4.541.8
SD0.62.90.020.82.16.8
No. 3 nursing homeMean21.328.50.04212.949.4
Max26.533.20.1425.97.667.5
Min19.721.30.0219.6−2.937.8
SD1.31.60.031.22.37.1
No. 4 nursing homeMean20.129.80.0320.11.253.4
Max24.242.30.1223.86.168.2
Min18.326.60.0118−6.942
SD1.22.80.011.12.45.9
No. 5 nursing homeMean22.3250.03220.948.2
Max24.9320.1424.66.765.8
Min20.718.40.0120.8−5.340.8
SD0.82.10.010.62.26.1
No. 6 nursing homeMean21.528.40.02211.155.3
Max22.935.60.1122.96.867.9
Min20.120.40.0119.8−4.642.6
SD0.52.20.010.62.25.1
Table 6. Chi-square test of thermal sensation votes for two types of occupants in nursing homes.
Chi-Square TestValuedfAsymptotic Significance (2-Sided)
Pearson chi-square25.417 a60
Likelihood ratio25.73560
Linear-by-linear association22.4910
No. of valid cases954--
a Zero cells (0.0%) have an expected count less than 5. The minimum expected count is 6.31.
Table 7. Clothing insulation and metabolic rate of nursing home occupants.
Type I cl ( clo ) M (met)
Mean SD Max Min Mean SD Max Min
Elderly1.250.171.660.91.090.3220.8
Adults1.10.151.620.851.480.3620.8
Table 8. Comparison of thermal comfort models in different studies.
ReferenceLocationNo. of Samples and Age RangeThermal Comfort Regression ModelNeutral Temperature
Jiao Y. et al. [50]Shanghai, China1040, 70–95MTS = 0.076 T o − 1.27316.8 °C
Zheng W. et al. [51]Xi’an, China834, 60–96TSV = 0.068 T o − 1.31219.4 °C
Li H. et al. [40]Inner Mongolia Province, China216, 60–93MTS = 0.169 T o − 3.46120.52 °C
Liu X. et al. [52]Taiyuan, China120, 60–90+MTS = 0.471 T o − 10.57522.4 °C
Tao Y. et al. [53]Hong Kong, China181, 65–85TSV = 0.79 T o − 17.84422.6 °C
Hwang et al. [36]Taiwan, China87, 60–82MTS = 0.28 T o − 6.523.2 °C
Tatsuki K. et al. [45]Japan66, 69–96TSV = 0.04 T o − 0.9523.8 °C
Forcada N. et al. [55]Spain1482 elderly and
439 non-elderly
-Elderly: 22.7 °C
Non-elderly: 21.8 °C
Tartarini F. et al. [37,54]Australia322 elderly (65+) and
187 non-elderly (<65)
Elderly: not obtained
Non-elderly:
TSV = 0.23 T o −4.88
Elderly: not obtained
Non-elderly: 21.2 °C
Table 9. Primary simulation parameter settings.
ParameterValueParameterValue
Area2 m 2 External wall heat transfer coefficient0.45 W/ m 2 ·K
Depth-to-width ratio2.1External window heat transfer coefficient2.0 W/ m 2 ·K
Height3.2 m Occupant density0.06 people/ m 2
Window-to-wall ratio0.32Lighting power3 W/ m 2
Window height1.8 m Equipment power7 W/ m 2
Table 10. Different heating set temperatures and their corresponding building energy consumption and carbon emissions.
Elderly Adults
Heating set temperatureLower limit of range: 19.4 °CNeutral temperature: 21.7 °CUpper limit of range: 24.0 °CLower limit of range: 18.6 °CNeutral temperature: 20.5°CUpper limit of range: 22.5 °C
Energy consumption (kWh/ m 2 )15.620.826.413.918.122.7
Carbon emissions (kg CO 2 / m 2 )56.78.44.45.87.3
Table 11. Heating strategies for nursing homes in different zones.
Heating Set TemperatureRoom
The lower limit of the elderly
comfort temperature range: 19.4 °C
Elderly rooms, activity rooms,
dining halls, etc.
The lower limit of the adult
comfort temperature range: 18.6 °C
Offices, workrooms,
medical rooms, etc.
Disclaimer/Publisher’s Note: The statements, opinions and data contained in all publications are solely those of the individual author(s) and contributor(s) and not of MDPI and/or the editor(s). MDPI and/or the editor(s) disclaim responsibility for any injury to people or property resulting from any ideas, methods, instructions or products referred to in the content.

