Article

Preliminary Study on Gender Differences in EEG-Based Emotional Responses in Virtual Architectural Environments

1
School of Architecture & Fine Art, Dalian University of Technology, Dalian 116024, China
2
China Southwest Architectural Design and Research Institute Co., Ltd., Qingdao 266000, China
*
Author to whom correspondence should be addressed.
Buildings 2024, 14(9), 2884; https://doi.org/10.3390/buildings14092884
Submission received: 11 July 2024 / Revised: 6 September 2024 / Accepted: 9 September 2024 / Published: 12 September 2024
(This article belongs to the Special Issue Optimizing Living Environments for Mental Health)

Abstract

:
In traditional cultural perceptions of gender, women are stereotyped as being more “emotional” than men. Although significant progress has been made in studying gender differences in emotional responses over the past few decades, there is still no consistent conclusion as to whether women are more emotional than men. In this study, we investigated gender differences in emotional responses between two groups of students (10 males and 10 females) in the same architectural environment, particularly in a digital cultural tourism scenario. Participants viewed the “Time Tunnel” of the ancient city of Qingzhou through VR simulation. Brainwave evoked potentials were recorded using wearable EEG devices. The results showed that females typically reported stronger emotional responses, as evidenced by higher arousal, lower potency, and stronger avoidance motivation. In contrast, males exhibited higher potency, lower arousal, and stronger comfort. The findings suggest that males have a more positive emotional response in virtual digital environments, whereas females are more sensitive and vulnerable to such environments, experiencing some discomfort. These findings can be used to guide the design and adaptation of virtual built environments.

1. Introduction

In the digital era, people’s expectations for cultural and tourism experiences have been continuously increasing; people are seeking richer, more interactive, and personalized experiences through digital technology. User engagement and experience are crucial when designing and implementing digital cultural tourism projects. Therefore, understanding and meeting users’ needs, preferences, and emotional experiences are top priorities for design teams. The emotional state of users is a major factor influencing architectural design feedback; there are differences in emotional responses to environmental stimuli between men and women. These differences can affect their impressions and perceptions of specific environments, determining the success of architectural design.
Yaling Deng et al. noted that men usually have stronger emotional experiences when watching videos that elicit emotional responses, while women have higher emotional expressiveness, especially for negative emotions [1]. Marta Bianchin et al. pointed out that women are more sensitive and vulnerable to the biological basis of adverse/stress events [2]. Garcia explored the differences in anxiety, depression, and other emotions between men and women during the COVID-19 pandemic in a study examining the relationship between these emotional states and various environmental variables, demonstrating that women experienced more severe anxiety-related emotions [3]. M.G. Gard tested the hypothesis of gender differences in the involvement of approach and avoidance motivation systems, concluding that women continue to engage in aversive motivation systems after offsetting negative images [4]. Megan M. Filkowski reported differences in activity clusters between men and women when engaging in emotion-evoking tasks in visual patterns [5]. Despite significant efforts in the academic community over the past few decades to study gender differences in emotional responses, there is no consensus on the emotional differences brought about by scenario experiences between different genders. One of the main problems is that, in most mood measurement experiments, the measurement process is cumbersome and the users are not cooperative enough, which in turn leads to inaccurate measurement data. Therefore, we adopted the method of recording 360° panoramic videos of the “Time Tunnel” on-site and recreating the simulation scene in the laboratory. This method not only improved user cooperation but also ensured the authenticity of the context. Although various psychological tools have been widely used to measure emotions, most are based on subjective self-assessment, which may be biased and interfere with the user’s emotional state. To overcome these limitations, this study employed continuous and quantitative emotional measurements through physiological responses, with a focus on using electroencephalograms (EEG) to monitor central nervous system activity. EEG offers more detailed insights into emotional states compared to other physiological measures. Wearable EEG sensors, equipped with multiple electrodes, are attached to various scalp locations to detect brain activity in different regions. For instance, electrodes placed on the frontal lobe (such as FP1, FP2, F3, and F4) can record brain activity linked to emotional shifts [6]. Thus, EEG provides extensive data on brain functions, such as perception, cognition, and emotion, by capturing various EEG rhythms from distinct brain areas.
Focusing on this potential, the authors applied wearable EEG sensors to laboratory EEG monitoring to collect high-quality EEG signals by eliminating signal artifacts [7]. This study will apply this EEG signal processing framework to collect EEG data from visitors in the “Time Tunnel” environment and quantify the emotional states of different gender groups using the bipolar dimensional emotional model [8]. By analyzing the emotional response differences of different genders in specific architectural environments, we aim to achieve positive emotional experiences for both gender groups in the environment.

2. Research Content

2.1. Research Object

The “Time Tunnel”, over 250 m long, is located east of Fucai Gate in Qingzhou Ancient City (Figure 1). It is an immersive digital cultural art experience hall that uses the city wall buildings of Qingzhou Ancient City as the display space, combining advanced computer graphics technology to showcase the natural, historical, and cultural features of Qingzhou (Figure 2). Here, visitors can experience historical changes in Qingzhou Ancient City; appreciate cultural symbols such as Buddha statues, ancient paintings, carp, and cranes; and interact with virtual scenes to enjoy the charm of digital cultural tourism. The experimental materials used in this experiment are actual built projects designed by transforming architectural spaces.
Participants were recruited from the student group at Dalian University of Technology. Twelve males (average age: 23 years, range = 18–26 years) and eleven females (average age: 24 years, range = 18–26 years) were informed and agreed to participate in the study. All participants had no history of neurological damage, head injury, drug addiction, alcoholism, stroke, or mental illness. Since individuals with depression and alexithymia often have difficulty accurately expressing emotions or completing emotional induction experiments [9], we used the Beck Depression Inventory (BDI) [10] and the Toronto Alexithymia Scale (TAS-20) [11] to screen participants. The criteria were as follows: a BDI score of no more than 4, indicating no significant depressive tendencies, and a TAS-20 score of no more than 66, indicating the ability to effectively express emotional feelings [2]. Ultimately, according to these criteria, 20 participants (10 males and 10 females) were successfully screened.

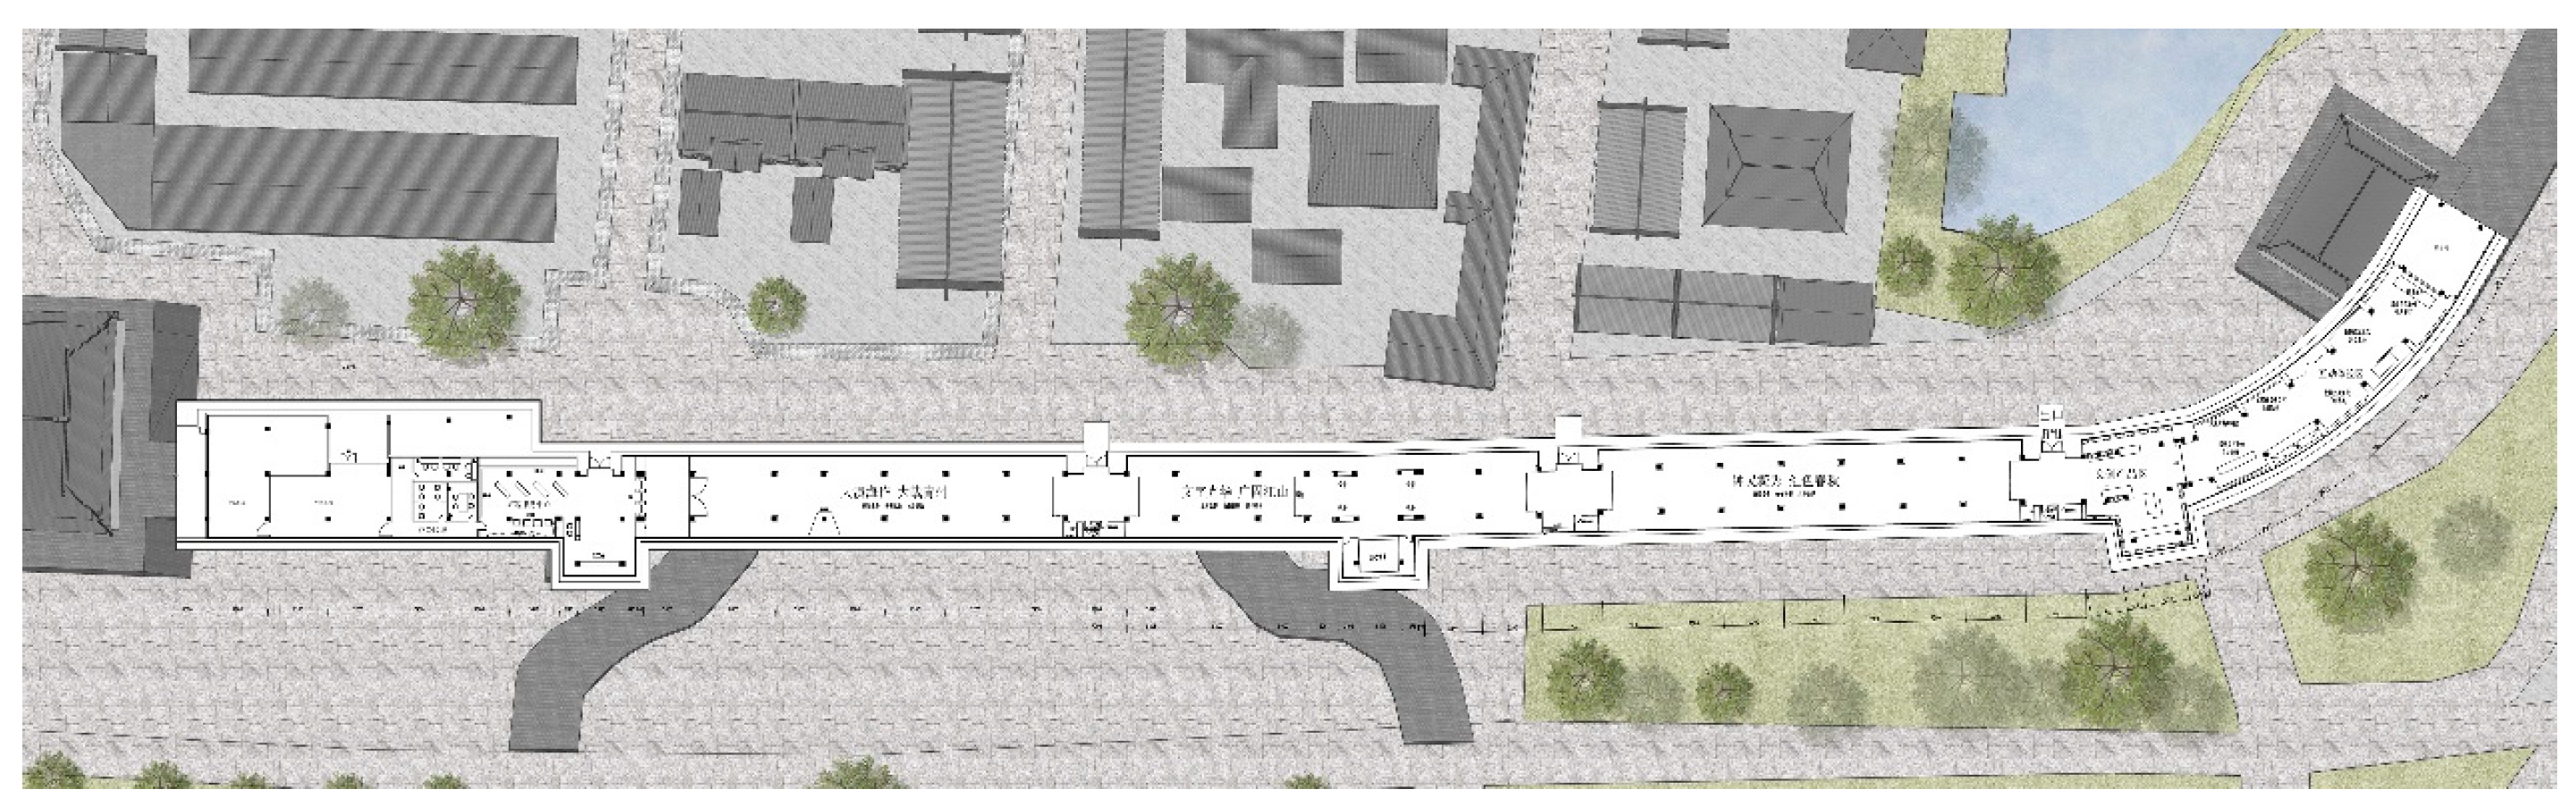
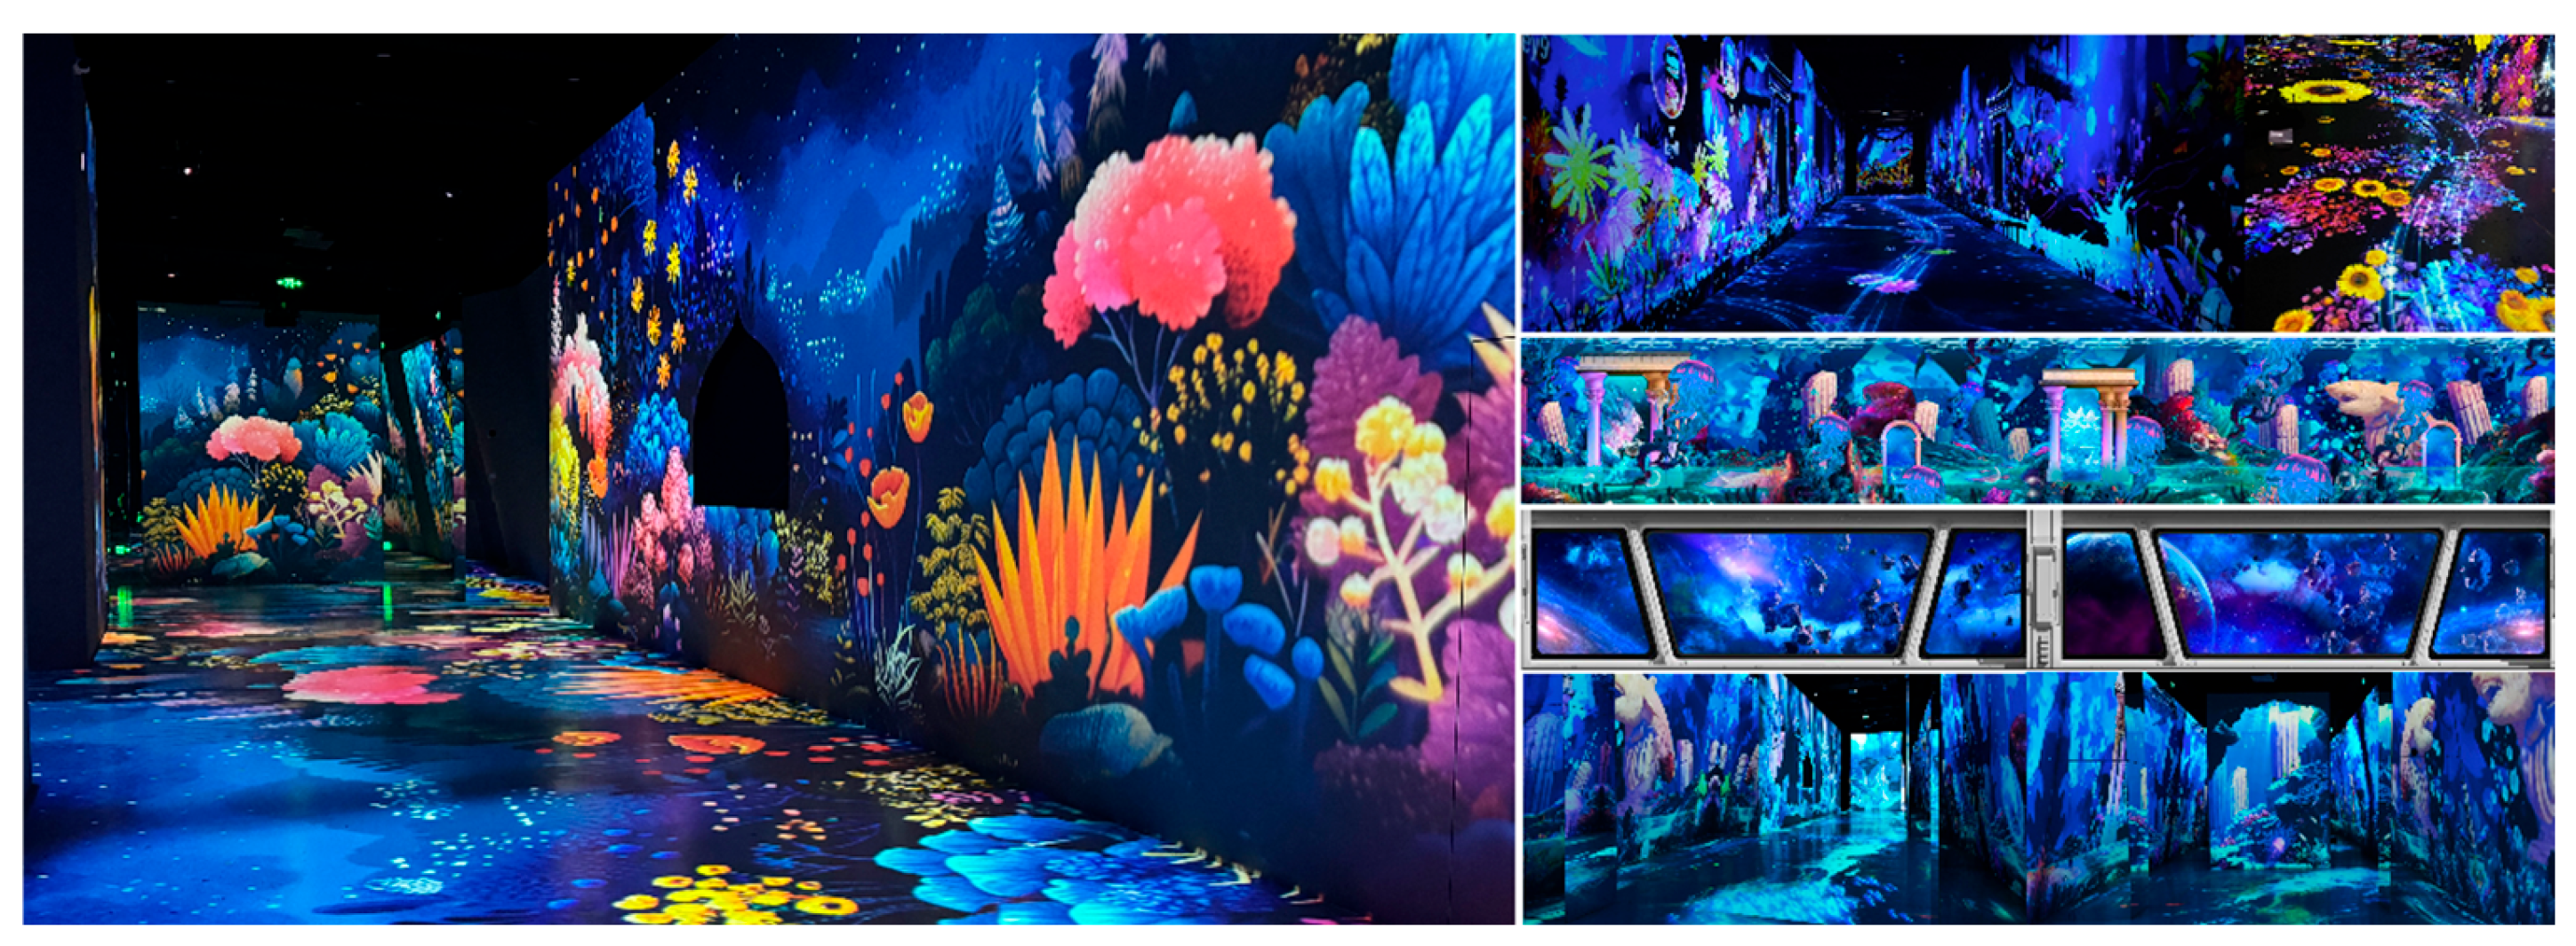
2.2. Experimental Materials

The author conducted field research and collected panoramic video data using Insta360 equipment. To effectively induce emotions and recreate the simulation scene in the laboratory, VR video files were edited for emotional induction. A 3 min 25 s video was selected for the entire one-way trip using Insta360 and Adobe Premiere Pro. Previous studies have found that this length provides enough time to record physiological responses [12]. The video was then processed for stabilization and noise reduction to ensure a high degree of accuracy in depicting the current situation.

2.3. Experimental Equipment

Traditional EEG equipment in clinical settings is limited by hardware and cannot collect data for extended periods in dynamic, non-invasive situations. Therefore, portable, wireless, inexpensive, and wearable EEG sensors provide new opportunities for the non-invasive collection of tourists’ brainwaves. To meet the experimental requirements and ensure the highest possible accuracy of the data, this study selected the Smart BCI device from EVERLOYAL, a company known for its advanced technology in this field (Figure 3a). One significant characteristic of EEG is its high temporal resolution and low spatial resolution, which were considered in this study. First, the high temporal resolution allowed us to monitor signals at the millisecond level, significantly increasing the data volume and making it redundant. Second, the data collected by a particular EEG electrode usually represents the sum of the voltages in the “nearby” area, meaning that a low spatial resolution makes it challenging to accurately locate the signal source [13]. Therefore, this study, while meeting the experimental requirements, selected the internationally recognized 32-channel EEG collection system (Figure 3b).
Considering these points, this study selected the Smart BCI portable EEG collection device as the EEG test equipment, with a sampling rate set at 500 Hz. The device has 32 metal electrodes corresponding to 32 standard points in the 10–20 system formulated by the International Society of Electroencephalography, with Cz as the reference electrode (Figure 3).

3. EEG-Based Emotion Measurement Process

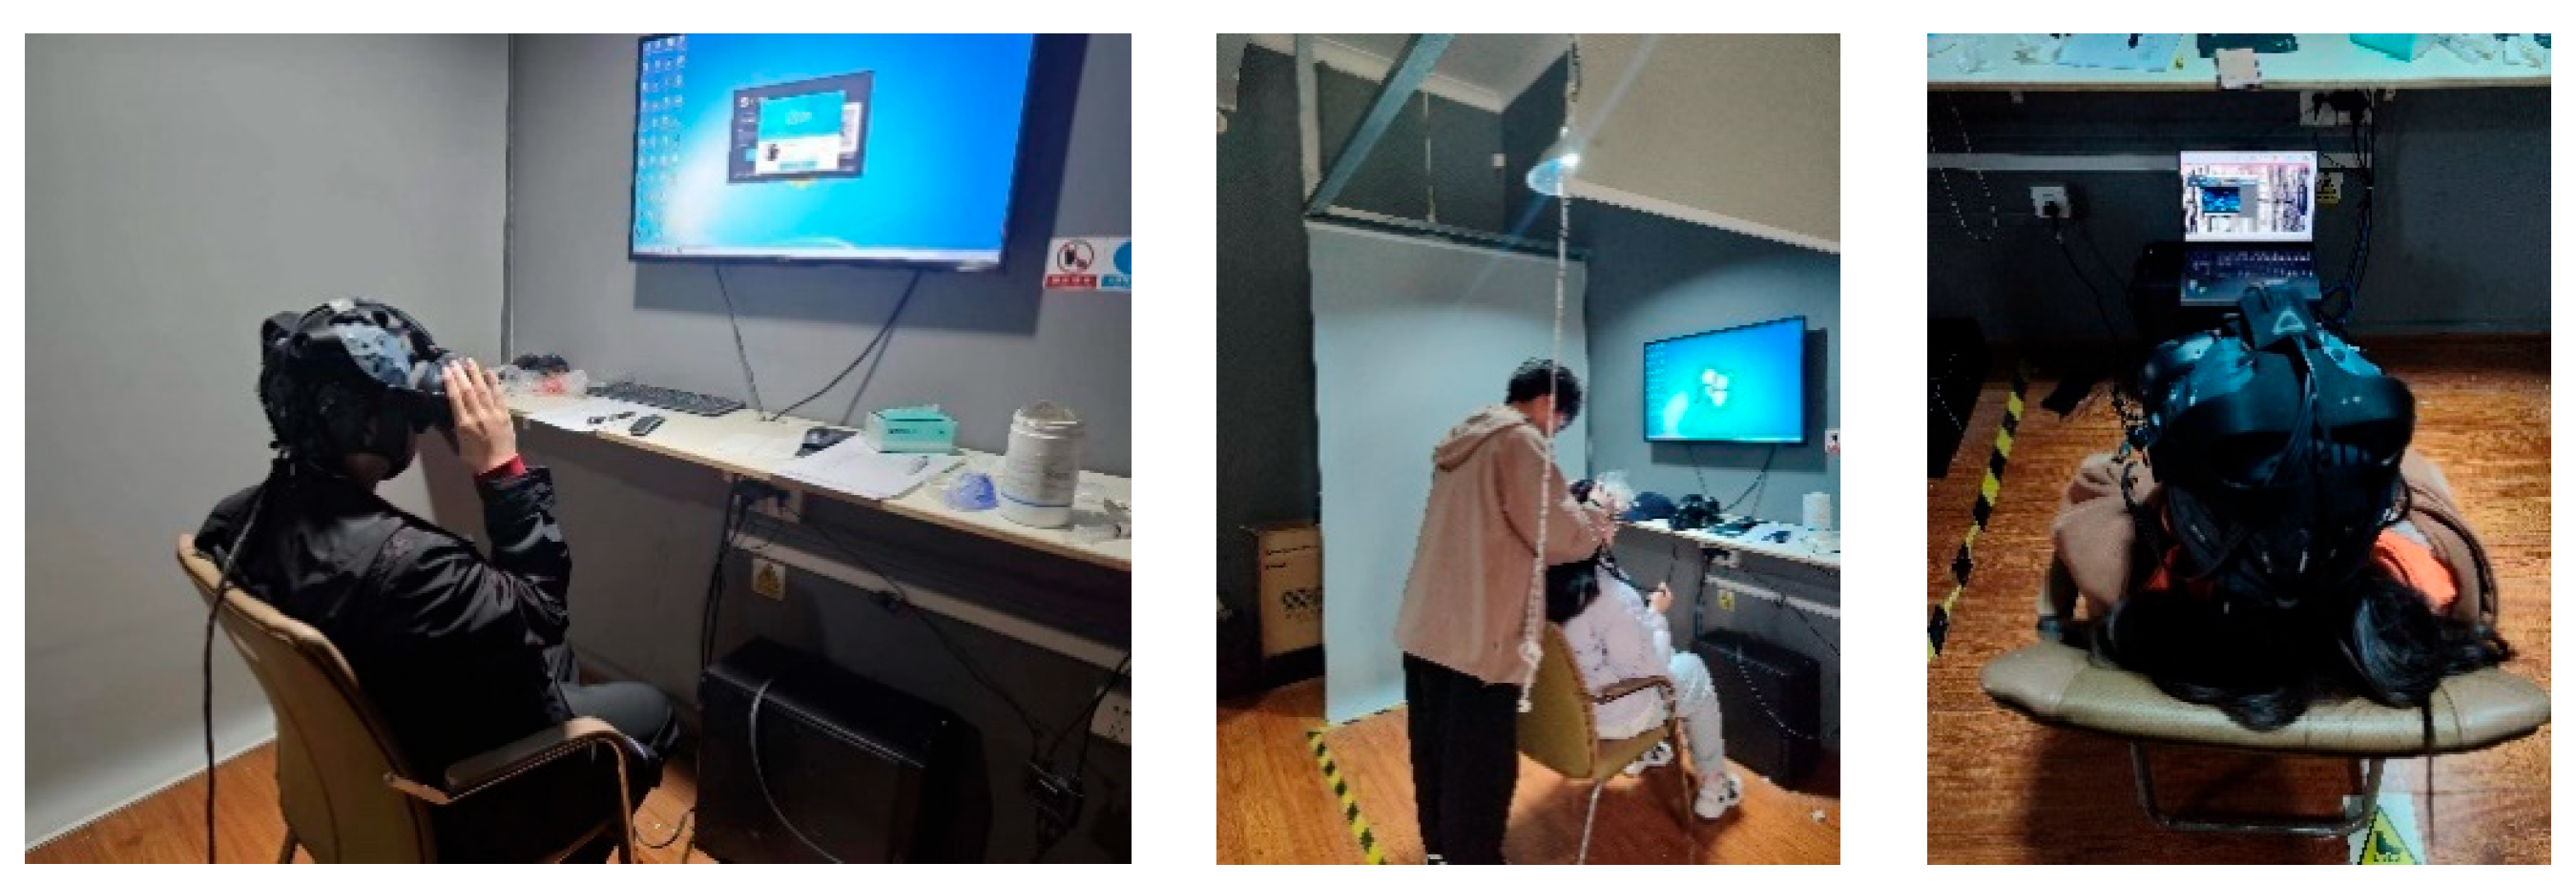
3.1. Experiment Overview

This experiment explores gender differences in emotional responses in specific architectural environments to optimize digital cultural tourism project designs. Based on the immersive experience of the “Time Tunnel” in Qingzhou Ancient City, Smart BCI portable EEG collection devices were used to record the EEG data. The EEG signal processing framework was employed to remove artifact EEG signals. The processed EEG signals were combined with the bipolar dimensional emotional model to quantify emotional states. Through baseline emotional surveys and EEG data measurements in VR environments, the emotional responses of different genders were studied. The specific experimental flow is shown in Figure 4.

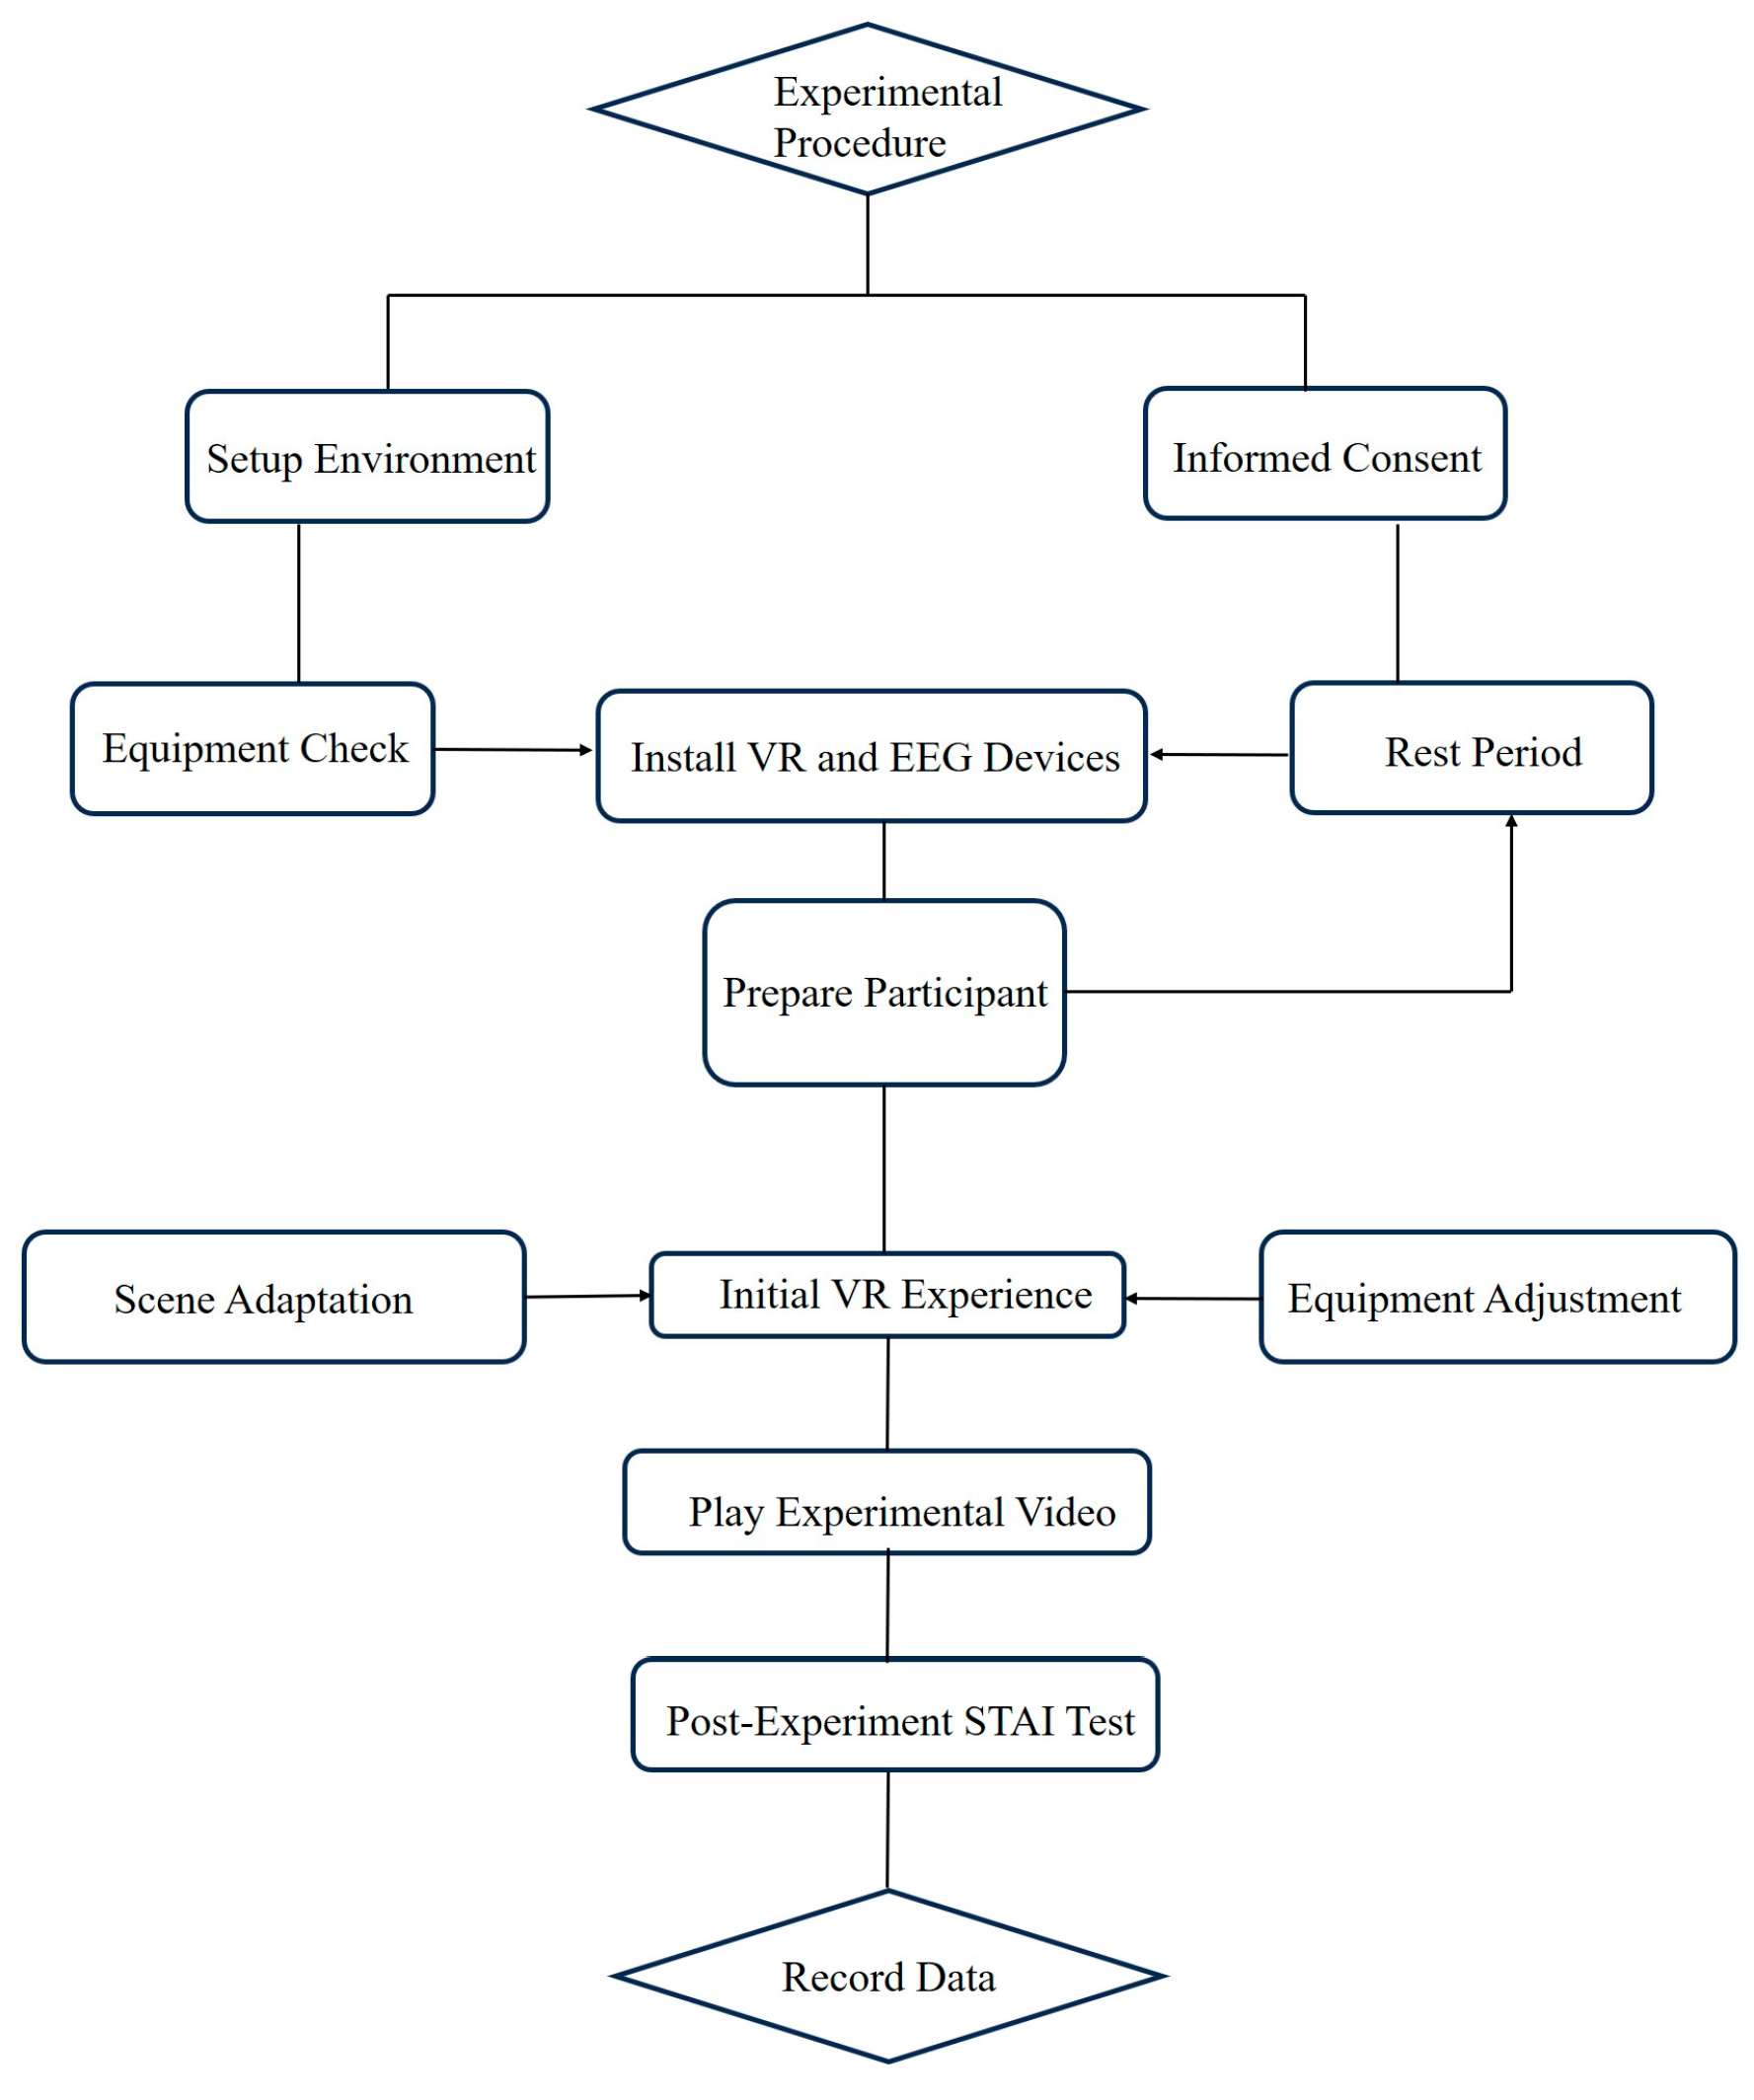
3.2. Experimental Procedure

The overall experimental flow was linearly structured (Figure 5), with participants performing the experiment under appropriate lighting conditions. Throughout the experiment, the stability and controllability of the environment were maintained through a constant temperature and humidity air-conditioning system, minimizing external interferences to ensure quiet and comfort. Participants then signed informed consent forms, and their information was collected. They were given approximately 5 min to sit quietly and rest to ensure they were in optimal condition for the experiment. During the experiment, it was necessary to ensure that the equipment had sufficient power to maintain measurement stability. Next, VR equipment and EEG devices were installed, worn, and calibrated. The process of wearing the EEG devices was explained to the participants to ensure their comfort. Conductive paste was applied thoroughly into the electrode holes to ensure contact with the scalp and increase conductivity; participants were instructed to wash and dry their hair to avoid the impact of oils and skin residues on the measurements. Finally, participants were required to sit quietly on a chair, minimizing unnecessary movements and avoiding eye and muscle activity to reduce interference artifacts, ensuring the accuracy and stability of the measurements. After the preparation process, participants from different gender groups first experienced the VR environment for a certain period. After calming down, their initial EEG data were recorded. Participants were then given 10 min to complete the STAI test to obtain a baseline of their psychological state, providing a subjective evaluation of their psychological state changes before and after the experiment.
After completing the equipment adjustments, participants closed their eyes for approximately 30 s to alleviate any discomfort caused by wearing the Smart BCI. They then engaged in approximately 5 min of scene adaptation, fully immersing themselves in the experimental environment to enhance the immersion of the environment simulation. After participants were fully immersed in the virtual experimental scene, the experimental video was played, and EEG signals were collected. After the video, participants completed the S-TAI test based on their real feelings. During this period, the EEG device recorded the participants’ brainwave activities in the virtual environment, including 32-channel EEG data and related indicators of emotional valence and arousal levels (Figure 6).

3.3. Experimental Methods

Among the various methods for measuring individual emotions, the frontal EEG asymmetry (FEA) method, based on power spectral features, has been widely adopted in academic research [14,15,16,17]. This method utilizes the activities of the left and right frontal lobes for emotional measurement, as the frontal lobes are known as the emotional control center. Positive emotions enhance left frontal lobe activity, whereas the right frontal lobe is typically associated with negative and avoidance emotions [14,15]. Therefore, this study calculated the power spectral density (PSD) in the α and β frequency ranges for the left and right frontal lobes using the FEA method, which displayed the activation levels of both frontal regions, thereby visualizing the individual’s emotional state (i.e., valence) [18]. Additionally, by calculating the power ratio in the α and β frequency ranges using the FEA method, the α frequency is more prominent in positive states, while the β frequency range is associated with individual arousal. Consequently, the power ratio visualizes the individual’s arousal state [6]. To accurately assess emotion and arousal in this study, the following four channels in the frontal region were selected: electrodes FP1 and F3 on the left frontal lobe; and FP2 and F4 on the right frontal lobe. After obtaining the initial EEG data from the frontal region, the relevant signal artifacts were processed, and the average PSD values in the α and β frequency ranges were calculated using the FEA method.
In this study, the related values calculated using the FEA method are expressed in logarithmic values, which can be either positive or negative. Furthermore, according to Formulas (1) and (2) [19,20], the valence and arousal values of emotions were calculated using the average PSD and FEA indices. Specifically, positive emotions amplify the activation level of the left frontal lobe, while negative emotions activate the right frontal lobe. Thus, the valence calculation in Formula (1) shows the relative difference in activation between the left and right frontal regions. Although the range of valence was not predetermined in this study, a more positive valence value indicates higher activation of the left frontal lobe and a more positive emotional range for the individual [6]. On the other hand, Formula (2) displays the individual’s arousal level by calculating the α/β ratio [14,20]. In terms of values, the larger the arousal value, the more excited the individual’s emotional state [6]:
Valence = α ( F 4 ) β ( F 4 ) α ( F 3 ) β ( F 3 )
Arousal = α ( F P 1 + F P 2 + F 3 + F 4 ) β ( F P 1 + F P 2 + F 3 + F 4 )
First, the relevant time series of electrical signals are collected using EEG equipment (Figure 7a). Then, to remove noise or artifacts caused by the environment and the subject’s own activities and improve the usability of the EEG signals, the signals must undergo specific preprocessing. Initially, a bandpass filter in the EEGStudio (Version 1.29) software was used for filtering, and external artifacts are manually denoised. Next, the EEGLAB (Version 2024.0) software was used to perform independent component analysis to remove internal artifacts, as well as eye movement and muscle artifacts, resulting in artifact-corrected EEG data (Figure 7b) [7]. The third step was to extract relevant features from the artifact-corrected EEG data, mapping the high-dimensional EEG signal data into a low-dimensional spatial representation to achieve better generalization ability and data accuracy, using various methods such as band-pass filtering, independent component analysis, and manual denoising. This process involves obtaining the frequency, mean, standard deviation, and voltage data of the relevant points, which are then input into the relevant computational models to derive the emotional evaluation results (Figure 8), and measure the average PSD in the frontal region (Figure 7c). Finally, emotional recognition and classification are performed by calculating valence and arousal levels using the average PSD in the frontal region (Figure 7d) [6]. It is now widely accepted that the bipolar dimensions of valence and arousal (i.e., the valence–arousal model) are sufficient to classify most emotional states [8]. Based on cognitive processes, the extracted EEG signal values are mapped to the two dimensions of valence and arousal. Valence ranges from very positive to very negative feelings, while arousal ranges from drowsy to excited states.

3.4. Experimental Results

Through the subjective S-TAI evaluations completed by participants before and after the experiment, their emotional changes were analyzed and cross-referenced with the physiological measurement data. The S-TAI emotion scale data before and after the experiment show that for the 10 female participants, both the S-AI (State Anxiety Inventory) and T-AI (Trait Anxiety Inventory) scores significantly increased (Figure 9a), indicating a certain level of tension and anxiety overall. In contrast, the changes in S-AI and T-AI scores for the 10 male participants were minimal (Figure 9b), suggesting that their emotions remained stable, demonstrating minor emotional fluctuations before and after the tour.
The summary of EEG data highlights the changes in average emotion and arousal levels for males and females. When average valence and arousal levels are situated at the bipolar dimensions of emotions, different emotional states under gender conditions can be inferred. During the tour, five male participants exhibited more positive emotions such as comfort, relaxation, and satisfaction, indicated by a valence greater than 0. The remaining five male participants’ valence values were closer to 0 compared to the female participants (Figure 10). On the other hand, all 10 female participants showed valence values below 0, with 8 females displaying arousal values greater than 0 (Figure 11), indicating a significant difference to the levels observed in the males, reflecting possible negative emotions such as tension, stress, and anxiety. Between the two dimensions of emotion, women’s emotional levels were more susceptible to external stimuli. Under the same stimulus, the average emotion value for women was positive, whereas for men it was negative (Figure 12).
In this study, we input the obtained average PSD values from the frontal lobe region into the valence–arousal model and observed significant differences in the emotional expressions before and after the tour. Specifically, during the “Time Tunnel” tour, we found that male participants generally exhibited lower arousal levels, indicating a more stable overall emotional state, while their emotional valence was more positive compared to that of the female participants. On the other hand, female participants displayed intense emotional fluctuations, with an overall lower emotional valence. Therefore, combining the S-TAI data and the objective EEG signals, we can conclude that male participants experienced more positive emotional valence, showing higher valence, lower arousal, and greater comfort, indicating a more positive response to digital cultural art. In contrast, female participants exhibited more negative emotional valence, reporting stronger emotional reactions with higher arousal, lower valence, and stronger avoidance motivation, possibly reflecting lower acceptance of the digital cultural experience in unfamiliar environments (Figure 13).

4. Discussion

This study utilized a wearable EEG device to measure and understand the emotional changes in college students of different genders when confronted with a digital cultural tourism exhibit. Although EEG holds great promise for in situ mood measurement, it remains challenging to clearly determine how gender and specific architectural environments affect arousal levels in tour participants. Previous studies have shown that slight body movements, unfamiliarity with the environment, or distraction during the experiment can cause more significant changes in arousal, similar to the effects of an unfamiliar environment [21,22,23]. Therefore, between the two dimensions of emotion, the ability of the EEG to measure the level of emotional potency is particularly important, as the level of emotional potency is one of the more critical dimensions that delineate positive emotions (such as excitement, happiness, contentment, or satisfaction) from negative emotions (such as fear, anger, frustration, or depression). As shown in the results of the study, the mood levels of visitors when viewing digital cultural and tourism exhibitions in the same touring environment were somewhat influenced by the gender factor, which suggests that any corrective measures to the building design and renovation, as well as user studies, have the potential to induce desirable levels of moods in the architectural place, thus contributing to the success of the building design and renovation.
As this study was a small sample experiment, the accuracy of the EEG data was further confirmed by the subjective evaluation scoring results of the S-TAI scale before and after the experiment. The subjective S-AI and T-AI scoring results of all female participants before and after the experiment were significantly higher compared to those of the males, indicating that they did have some degree of tension and anxiety overall. Women typically had a greater negative-oriented mood changes before and after the tour while giving stronger emotional responses [24]. Furthermore, Jieling Xiao’s research constructed an olfactory spatial emotion model, suggesting that designers should better convey the design concepts of smellscapes during the design process to enhance emotional experiences [25]. Mastinu’s study mentioned that there are individual differences in emotional responses to taste and smell stimuli that are influenced by various factors such as age and gender. The olfactory and gustatory elements highlighted in these two studies can complement the findings of this study under virtual laboratory conditions [26]. Additionally, Charlotter’s research showed that women consistently rated their empathy higher than men under all experimental conditions, with their objective advantage in emotion recognition being more evident under the term “social-analytic capacity” instead of “empathic capacity”, indicating that gender differences in emotions are influenced by specific conditions and environmental factors [27]. Huang Long’s research explored the emotional responses and coping strategies of nurses, comparing them with those of nursing students, finding that women exhibited higher levels of anxiety and fear than men. Moreover, participants from urban areas were more likely to experience anxiety and fear, while those from rural areas tended to feel sadness [28]. This also reflects how environmental and geographical factors influence the emotional feedback of different genders. Thus, this preliminary study focused on a college student sample to minimize factors affecting arousal levels and primarily examined the impacts of visual and auditory stimuli under laboratory conditions; however, it still has certain limitations that require supplementary evidence from the aforementioned studies.
As the study was conducted in laboratory conditions using VR experiential equipment to simulate the scene, it was nearly impossible to fully control all factors that could affect arousal levels. Even though the authors attempted to control these factors (e.g., conducting a pre-experiment in advance to minimize the interference of the environment and equipment on the subjects) and made an effort to recreate the scene of the “Time Tunnel”, they still could not fully replace the diversity of the real environment. Nevertheless, previous studies in the literature have described in detail the relationship between individual arousal levels and brain activity recorded by EEG [29]. Second, the subject types in the sample were relatively homogeneous and the sample size was limited, possessing a certain degree of chance. Therefore, although it is difficult to control for many factors related to emotions in a laboratory setting, attempting to measure the emotions and arousal levels of different genders in a specific environment in this study is a meaningful step towards better understanding the emotional state of users of different genders when faced with a digital literacy exhibition. The present study, which continuously measured the emotions of a group of college students under a VR experience in a laboratory, provides a valuable reference for revealing the emotional changes in users during the process of conducting a digital cultural tourism-type excursion. Specifically, future research directions can be extended to investigate, in depth, the effects of other individual factors (e.g., excursion duration control, age) on mood states. In addition, a large number of studies have shown that the various factors affecting human psychological states may not only be simple additive effects, but also synergistic (i.e., the effect is greater than the simple additive) or antagonistic (i.e., the effect is less than the simple additive) [30,31]. With the prevalence of numerous factors affecting mood during digital cultural tourism tours, the interactive effects of these factors on mood can be further investigated in the field.

5. Conclusions

Based on the two dimensions of emotion (emotional valence and arousal levels), this study validated the feasibility of measuring gender differences in emotions under laboratory conditions using wearable EEG devices. The results indicate significant emotional feedback differences among visitors to digital cultural tourism exhibitions, with gender being one of the main influencing factors, potentially related to differences in the amygdala/orbitofrontal cortex circuit between men and women. Additionally, gender differences show that males exhibit more positivity when facing such digital cultural tourism exhibitions, while females are more sensitive and anxious. Therefore, the main contribution of this study is to provide a method for reliable and continuous emotion measurement using wearable EEG sensors under laboratory conditions and to explore the emotional changes caused by gender differences. The study also employed subjective evaluations before and after the visits to corroborate the physiological measurements.
However, there are several limitations to this research that must be acknowledged. First, the study primarily focuses on visual and auditory stimuli, while the role of olfactory and gustatory senses in emotional assessment was not considered. These senses can play a crucial role in the overall emotional experience and may influence the results. Second, the geographical and cultural contexts of the participants were not fully explored. Differences in cultural backgrounds and geographical locations can significantly impact emotional responses, potentially affecting the generalizability of the findings across different populations. Additionally, the lack of a qualitative analysis is a limitation in this study. A more detailed description of participants’ subjective reactions (e.g., “I felt...”) could provide deeper insights into their emotional experiences. Using manual coding or tools like NVivo for automatic qualitative analysis would have enriched the findings and offered a more comprehensive understanding of emotional responses. As discussed in the section on the influence of olfactory and gustatory senses on emotions, future research should incorporate these factors to provide a more complete understanding of emotional responses across different sensory modalities and cultural contexts.
Using this measurement method helps us to better understand the relationship between different architectural environments and gender emotional differences and assists in establishing a systematic understanding of the emotional responses of different gender groups in specific architectural environments. Based on the emotional feedback from different gender groups towards architectural content, designers can more specifically create architectural environments, ensuring that all groups can achieve positive emotional experiences, thereby enhancing user perception and comfort. Furthermore, compared to the individualism emphasized in Western cultures, Eastern cultures, such as those in China, place greater importance on collectivism, where low-arousal emotions are valued more than high-arousal emotions [32]. Therefore, using physiological measurements to study individual emotional arousal levels in the context of Eastern cultures, represented by China, has significant potential for development.

Author Contributions

Conceptualization, Z.L.; methodology, K.W. and P.C.; software, K.W.; validation, K.W.; data curation, K.W. and Y.Z.; formal analysis, K.W. and M.H.; investigation, K.W., M.H. and Y.Z; writing—original draft, Z.L. and K.W.; writing—review and editing, K.W.; supervision, Z.L.; project administration, P.C.; validation, K.W.; resources, P.C.; funding acquisition, Z.L. and P.C. All authors have read and agreed to the published version of the manuscript.

Funding

This research was funded by the Fundamental Research Funds for the Central Universities, grant number DUT23RW403.

Institutional Review Board Statement

All subjects gave their informed consent for inclusion before they participated in the study. The study was conducted in accordance with the Declaration of Helsinki, and the protocol was approved by the Ethics Committee of Dalian University of Technology, Biology and Medicine (DUTSAFA240827–03).

Informed Consent Statement

Informed consent was obtained from all subjects involved in the study.

Data Availability Statement

Data are contained within the article.

Conflicts of Interest

Author Pengyu Cai was employed by the company Southwest Design and Research Institute of China Construction Co. The remaining authors declare that the research was conducted in the absence of any commercial or financial relationships that could be construed as a potential conflict of interest.

References

  1. Bianchin, M.; Angrilli, A. Gender differences in emotional responses: A psychophysiological study. Physiol. Behav. 2012, 105, 925–932. [Google Scholar] [CrossRef] [PubMed]
  2. Deng, Y.; Chang, L.; Yang, M.; Huo, M.; Zhou, R. Gender Differences in Emotional Response: Inconsistency between Experience and Expressivity. PLoS ONE 2016, 11, e0158666. [Google Scholar] [CrossRef] [PubMed]
  3. Garcia, F.L.; Romero, F.V.; Padilla, S.; David, L.R.P.; Monzo, G.M.; Rodriguez, J.R. Gender differences in emotional response to the COVID-19 outbreak in Spain. Brain Behav. 2021, 11, e01934. [Google Scholar] [CrossRef]
  4. Gard, M.G.; Kring, A.M. Sex differences in the time course of emotion. Emotion 2007, 7, 429–437. [Google Scholar] [CrossRef]
  5. Megan, M.F.; Rachel, M.O.; Duda, B.; Timothy, J.W.; Sabatinelli, D. Sex differences in emotional perception: Meta analysis of divergent activation. NeuroImage 2017, 147, 925–933. [Google Scholar]
  6. Hwang, S.; Jebelli, H.; Choi, B.; Cho, M.; Lee, S. Measuring Workers’ Emotional State during Construction Tasks Using Wearable EEG. J. Constr. Eng. Manag. 2018, 144, 04018050. [Google Scholar] [CrossRef]
  7. Jebelli, H.; Hwang, S.; Lee, S. An EEG signal processing framework to obtain high quality brain waves from an off-the-shelf wearable EEG device. J. Comput. Civ. Eng. 2018, 32, 04017070. [Google Scholar] [CrossRef]
  8. James, A.R.; Anna, W.; Mendelsohn, G.A. Affect grid: A single-item scale of pleasure and arousal. J. Personal. Soc. Psychol. 1989, 57, 493–502. [Google Scholar]
  9. Christie, I.C.; Friedman, B.H. Autonomic specificity of discrete emotion and dimensions of affective space: A multivariate approach. Int. J. Psychophysiol. 2004, 51, 143–153. [Google Scholar] [CrossRef]
  10. Zhang, Z. Behavioral medicine scale manual. Chin. J. Behav. Med. Sci. 2001, 10, 19–24. [Google Scholar]
  11. Yi, J.; Yao, S.; Zhu, X. The Chinese version of the TAS-20: Reliability and validity. Chin. Ment. Health J. 2003, 17, 763–767. [Google Scholar]
  12. Berntson, G.G.; Bigger, J.T.; Eckberg, D.L.; Grossman, P.; Kaufmann, P.G.; Malik, M.; Nagaraja, H.N.; Porges, S.W.; Saul, J.P.; Stone, P.H.; et al. Heart rate variability: Origins, methods, and interpretative caveats. Psychophysiology 1997, 34, 623–648. [Google Scholar] [CrossRef]
  13. Jiang, J.F.; Zeng, Y.; Lin, Z.M.; Tong, L.; Yan, B. Research Progress on Emotion Assessment Based on EEG Signals. J. Inf. Eng. Univ. 2016, 17, 686–693. [Google Scholar]
  14. Lewis, R.S.; Weekes, N.Y.; Wang, T.H. The effect of a naturalistic stressor on frontal EEG asymmetry, stress, and health. Biol. Psychol. 2007, 75, 239–247. [Google Scholar] [CrossRef] [PubMed]
  15. Winkler, I.; Jager, M.; Mihajlovic, V.; Tsoneva, T. Frontal EEG asymmetry based classification of emotional valence using common spatial patterns. World Acad. Sci. Eng. Technol. 2010, 45, 373–378. [Google Scholar]
  16. Goodman, R.N.; Rietschel, J.C.; Lo, L.C.; Costanzo, M.E.; Hatfield, B.D. Stress, emotion regulation and cognitive performance: The predictive contributions of trait and state relative frontal EEG alpha asymmetry. Int. J. Psychophysiol. 2013, 87, 115–123. [Google Scholar] [CrossRef]
  17. Allen, J.J.; Reznik, S.J. Frontal EEG asymmetry as a promising marker of depression vulnerability: Summary and methodological considerations. Curr. Opin. Psychol. 2015, 4, 93–97. [Google Scholar] [CrossRef]
  18. Coan, J.A.; Allen, J.J.; McKnight, P.E. A capability model of individual differences in frontal EEG asymmetry. Biol. Psychol. 2006, 72, 198–207. [Google Scholar] [CrossRef]
  19. Davidson, R.J.; Ekman, P.; Saron, C.D.; Senulis, J.A.; Friesen, W.V. Approach-withdrawal and cerebral asymmetry: Emotional expression and brain physiology: I. J. Personal. Soc. Psychol. 1990, 58, 330–341. [Google Scholar] [CrossRef]
  20. Blaiech, H.; Neji, M.; Wali, A.; Alimi, A.M. Emotion recognition by analysis of EEG signals. In Proceedings of the 13th International Conference on Hybrid Intelligent Systems, Gammarth, Tunisia, 4–6 December 2013; pp. 312–318. [Google Scholar]
  21. Mignonac, K.; Herrbach, O. Linking work events, affective states, and attitudes: An empirical study of managers ’ emotions. J. Bus. Psychol. 2004, 19, 221–240. [Google Scholar] [CrossRef]
  22. Poh, M.Z.; Swenson, N.C.; Picard, R.W. A wearable sensor for unobtrusive, long-term assessment of electrodermal activity. IEEE Trans. Biomed. Eng. 2010, 57, 1243–1252. [Google Scholar] [PubMed]
  23. Picard, R.W.; Fedor, S.; Ayzenberg, Y. Multiple arousal theory and daily-life electrodermal activity asymmetry. Emot. Rev. 2016, 8, 62–75. [Google Scholar] [CrossRef]
  24. Gross, J.J.; Levenson, R.W. Emotion elicitation using films. Cogn. Emot. 1995, 9, 87–108. [Google Scholar] [CrossRef]
  25. Xiao, J.; Malcolm, T.; Kang, J. Understanding smellscapes: Sense-making of smell-triggered emotions in place 2020. Emot. Space Soc. 2020, 37, 100710. [Google Scholar] [CrossRef]
  26. Mastinu, M.; Melis, M.; Yousaf, N.Y.; Barbarossa, I.T.; Tepper, B.J. Emotional responses to taste and smell stimuli: Self-reports, physiological measures, and a potential role for individual and genetic factors. J. Food Sci. 2023, 88, A65–A90. [Google Scholar] [CrossRef]
  27. Löffler, C.S.; Greitemeyer, T. Are women the more empathetic gender? The effects of gender role expectations. Curr. Psychol. 2023, 42, 220–231. [Google Scholar] [CrossRef]
  28. Huang, L.; Lei, W.; Xu, F.; Liu, H.; Yu, L. Emotional responses and coping strategies in nurses and nursing students during Covid-19 outbreak: A comparative study. PLoS ONE 2020, 15, e0237303. [Google Scholar] [CrossRef]
  29. Borghini, G.; Astolfi, L.; Vecchiato, G.; Mattia, D.; Babiloni, F. Measuring neurophysiological signals in aircraft pilots and car drivers for the assessment of mental workload, fatigue and drowsiness. Neurosci. Biobehav. Rev. 2014, 44, 58–75. [Google Scholar] [CrossRef]
  30. Evans, G.W.; English, K. The environment of poverty: Multiple stressor exposure, psychophysiological stress, and socioemotional adjustment. Child. Dev. 2002, 73, 1238–1248. [Google Scholar] [CrossRef]
  31. Sexton, K.; Hattis, D. Assessing cumulative health risks from exposure to environmental mixtures—Three fundamental questions. Environ. Health Perspect. 2007, 115, 825–832. [Google Scholar] [CrossRef]
  32. Lim, N. Cultural differences in emotion: Differences in emotional arousal level between the East and the West. Integr. Med. Res. 2016, 5, 105–109. [Google Scholar] [CrossRef] [PubMed]
Figure 1. “Time Tunnel” floor plan.
Buildings 14 02884 g001
Figure 2. Internal scene of the “Time Tunnel”. Source: China Southwest Architecture Design Institute.
Buildings 14 02884 g002
Figure 3. Experimental equipment and point map. Sources: (a) https://everloyal.com.cn/; and (b) adapted by the author from IFCN.
Buildings 14 02884 g003
Figure 4. Overview of EEG signal measurement process.
Buildings 14 02884 g004
Figure 5. Experimental flow chart.
Buildings 14 02884 g005
Figure 6. Experimental photographs.
Buildings 14 02884 g006
Figure 7. Data processing flow: (a) collecting time-series EEG data; (b) removing signal artifacts in EEG data; (c) measuring mean PSD at the frontal area; and (d) emotion identification by calculating valence and arousal levels using the frontal area mean PSD.
Buildings 14 02884 g007
Figure 8. Low-dimensional data.
Buildings 14 02884 g008
Figure 9. Changes in S-TAI by gender: (a) changes in S-TAI scale for women; and (b) changes in S-TAI scale for men.
Buildings 14 02884 g009
Figure 10. Gender differences in valence.
Buildings 14 02884 g010
Figure 11. Gender differences in arousal.
Buildings 14 02884 g011
Figure 12. Gender differences in valence–arousal.
Buildings 14 02884 g012
Figure 13. Gender differences in emotions.
Buildings 14 02884 g013
Disclaimer/Publisher’s Note: The statements, opinions and data contained in all publications are solely those of the individual author(s) and contributor(s) and not of MDPI and/or the editor(s). MDPI and/or the editor(s) disclaim responsibility for any injury to people or property resulting from any ideas, methods, instructions or products referred to in the content.

