Article

Study on Strength Model of Wastewater Concrete with Different Specimen Sizes under Freeze–Thaw Environment

1
School of Civil Engineering and Communication, North China University of Water Resources and Electric Power, Zhengzhou 450045, China
2
Xinyang Beihu Smart Education Park Project Department, Sinohydro Bureau 11 Co., Ltd., Zhengzhou 450045, China
3
School of Technology Department, North China University of Water Resources and Electric Power, Zhengzhou 450045, China
4
Henan Building Materials Research and Design Institute Co., Ltd., Zhengzhou 450018, China
*
Author to whom correspondence should be addressed.
Buildings 2024, 14(9), 2922; https://doi.org/10.3390/buildings14092922
Submission received: 14 August 2024 / Revised: 28 August 2024 / Accepted: 14 September 2024 / Published: 15 September 2024
(This article belongs to the Special Issue Advanced Green and Intelligent Building Materials)

Abstract

:
According to wastewater concrete (WWC) specimens of different sizes (L = 40 mm, L = 100 mm, L = 150 mm, L = 200 mm) and different freeze–thaw cycles (FTCs) (N = 0, N = 10, N = 20, N = 30, N = 40, N = 50), the compressive strength (CS) and splitting tensile strength (STS) of specimens with different sizes under different FTCs were tested. After 50 FTCs, the maximum and minimum loss rates of CS of cube specimens were 60.07% and 24.11%, respectively. The maximum and minimum loss rates of STS were 54.76% and 17.42%, respectively. The relationship between the number of FTCs and the size of the specimen on the CS of concrete was obtained, and the damage model of WWC based on damage mechanics theory with the number of FTCs for different specimen sizes was established. Using the fitting method, the strength model of CS and STS for different specimen sizes under FTCs was established. The R2 is 0.9709 and 0.9627, the fitting performance is good, and the freeze–thaw damage (FTD) models can accurately predict the freeze–thaw damage degree of concrete under the coupling effect of FTCs and specimen sizes.

1. Introduction and Research

With the rapid advancement of urbanization in our country, the concrete industry has experienced substantial growth [1]. The production of concrete generates wastewater and waste residue. Data show that more than 2.5 billion m3 of concrete is produced annually in our country [2], with a total annual wastewater volume exceeding 7.5 million m3. The direct discharge of this wastewater [3] can lead to soil alkalization and water resource pollution, making wastewater recycling and utilization urgent. Research indicates that concrete made with wastewater has better mechanical properties and durability [4,5,6]. The SE refers to the mechanical properties of concrete change with the change of the geometric size of the structure. The mechanical property parameters obtained from concrete tests are related to both the material properties and the dimensions of the specimens [7,8]. This is the inherent characteristic of brittle and quasi-brittle materials. As a quasi-brittle material, the SE of WWC will directly affect its mechanical properties and durability evaluation. Freeze–thaw damage in concrete occurs during FTCs when changes in the external environment cause lateral expansion forces within its pores, leading to the gradual development of micro-cracks and durability issues. This damage is influenced by the microstructure of the concrete [9], and after undergoing FTCs [10], the porosity of the concrete significantly increases [11]. In addition, in some cold and arid saline-alkali areas, such as Northwest China [12], coastal areas frozen in cold seasons, and polar areas with sea ice [13], concrete will not only be damaged by freeze–thaw process but also be damaged by corrosion. The corrosion reaction generates expansion crystals that disrupt the concrete’s pore structure, leading to a reduction in its strength [14,15]. Currently, the research on WWC under FTCs is mostly based on the FTD strength model of single-size WWC. Yang et al. [8] carried out an SE test of recycled concrete strength. The results reveal that the SE greatly impacts the durability of recycled concrete. As the size of the specimen gradually increases, its durability gradually decreases. However, there are few studies on the FTD strength model of WWC with different sizes. Chen et al. [16] investigated the CS of cylindrical specimens with varying strength grades and diameters. The research results indicate that as the specimen size increases, both the axial peak stress and the axial peak strain decrease with the enlargement of the specimen diameter. At the same time, there are various evaluation metrics for concrete FTD, and the selection of these indicators is crucial for describing the degree of concrete damage. However, existing FTD models have not sufficiently considered the effect of size changes on concrete FTD. Guan et al. [17] examined the influence of specimen size on the strength of WWC subjected to varying numbers of FTCs. Their findings reveal that as the number of FTCs increases, the SE becomes more pronounced, accompanied by a gradual decline in specimen brittleness and a concomitant enhancement in plasticity. Zhang et al. [18] studied the SEs on the STS of interface specimens and mortar specimens under FTCs; as the size of the specimens increases, their strength undergoes a notable decline, characterized by a diminishing rate of reduction. Therefore, the strength grade of C40 WWC was used to study the changes in appearance, CS, and STS of four cube sizes (L = 40 mm, L = 100 mm, L = 150 mm, L = 200 mm) under different FTCs. Based on the FTCs, the strength model of WWC with different sizes was established, and an FTD model based on damage mechanics theory, using compressive and STS as damage variables, was established to accurately predict the FTD degree of concrete under the combined effects of FTCs and specimen size. This model not only offers a scientific theoretical foundation for evaluating the durability of WWC but also offers theoretical support for its application in practical engineering structures. Additionally, it serves as a reference for the durability assessment of hydraulic concrete.

2. Raw Materials and Methods

2.1. Raw Material

The test used the P.O 42.5 ordinary Portland cement of Sanmenxia Tengyue Tongli Cement Co., Ltd. from China. The 3d and 28d CS of the cement are 20.2 MPa and 45.4 MPa, respectively, which meet the requirements of the ‘GB175-2007 Common Portland Cement’ specification [19]. The fine aggregate used is river sand from Zhengzhou, China, and its primary technical properties are detailed in Table 1. The coarse aggregate adopted is Xinzheng gravel from China, as detailed in Table 2. The fly ash used is grade I fly ash from Henan Longquan Jinheng Power Co., Ltd. from China, with a fineness of 12% (0.045 mm sieve), a water demand ratio of 93%, and a loss on ignition of 3.8%. The water-reducing agent used is the polycarboxylate high-performance water-reducing agent of Hunan Zhongyan Building Materials from China, with a water-reducing rate of 27%. The wastewater used was produced by Xingyang Wastewater Mixing Station from China, with a pH value of 12. The dry powder obtained by natural air drying was ground and passed through a 0.045 mm square sieve. The chemical composition of the wastewater powder is shown in Table 3.

2.2. Proportioning of Concrete

The mix of C40 WWC is shown in Table 4. The wastewater is mixed with drinking water as concrete mixing water, and the cement is replaced with fly ash at a ratio of 20%. The forming and curing of WWC specimens are based on ‘SL/T 352-2020 Test code for Hydraulic Concrete’ [20].

2.3. Test Method

2.3.1. Freeze–Thaw Cycle

The FTCs test is conducted in accordance with the ‘SL/T 352-2020 Test code for Hydraulic Concrete’ [20]. The test concrete specimen is placed on the quick. In the test box of the rapid freeze–thaw test machine, the freeze–thaw test parameters are set and the rapid freeze–thaw test machine is started to start the FTCs. The number of FTCs was 50 times, and the CS and STS of concrete were tested after every 10 FTCs.

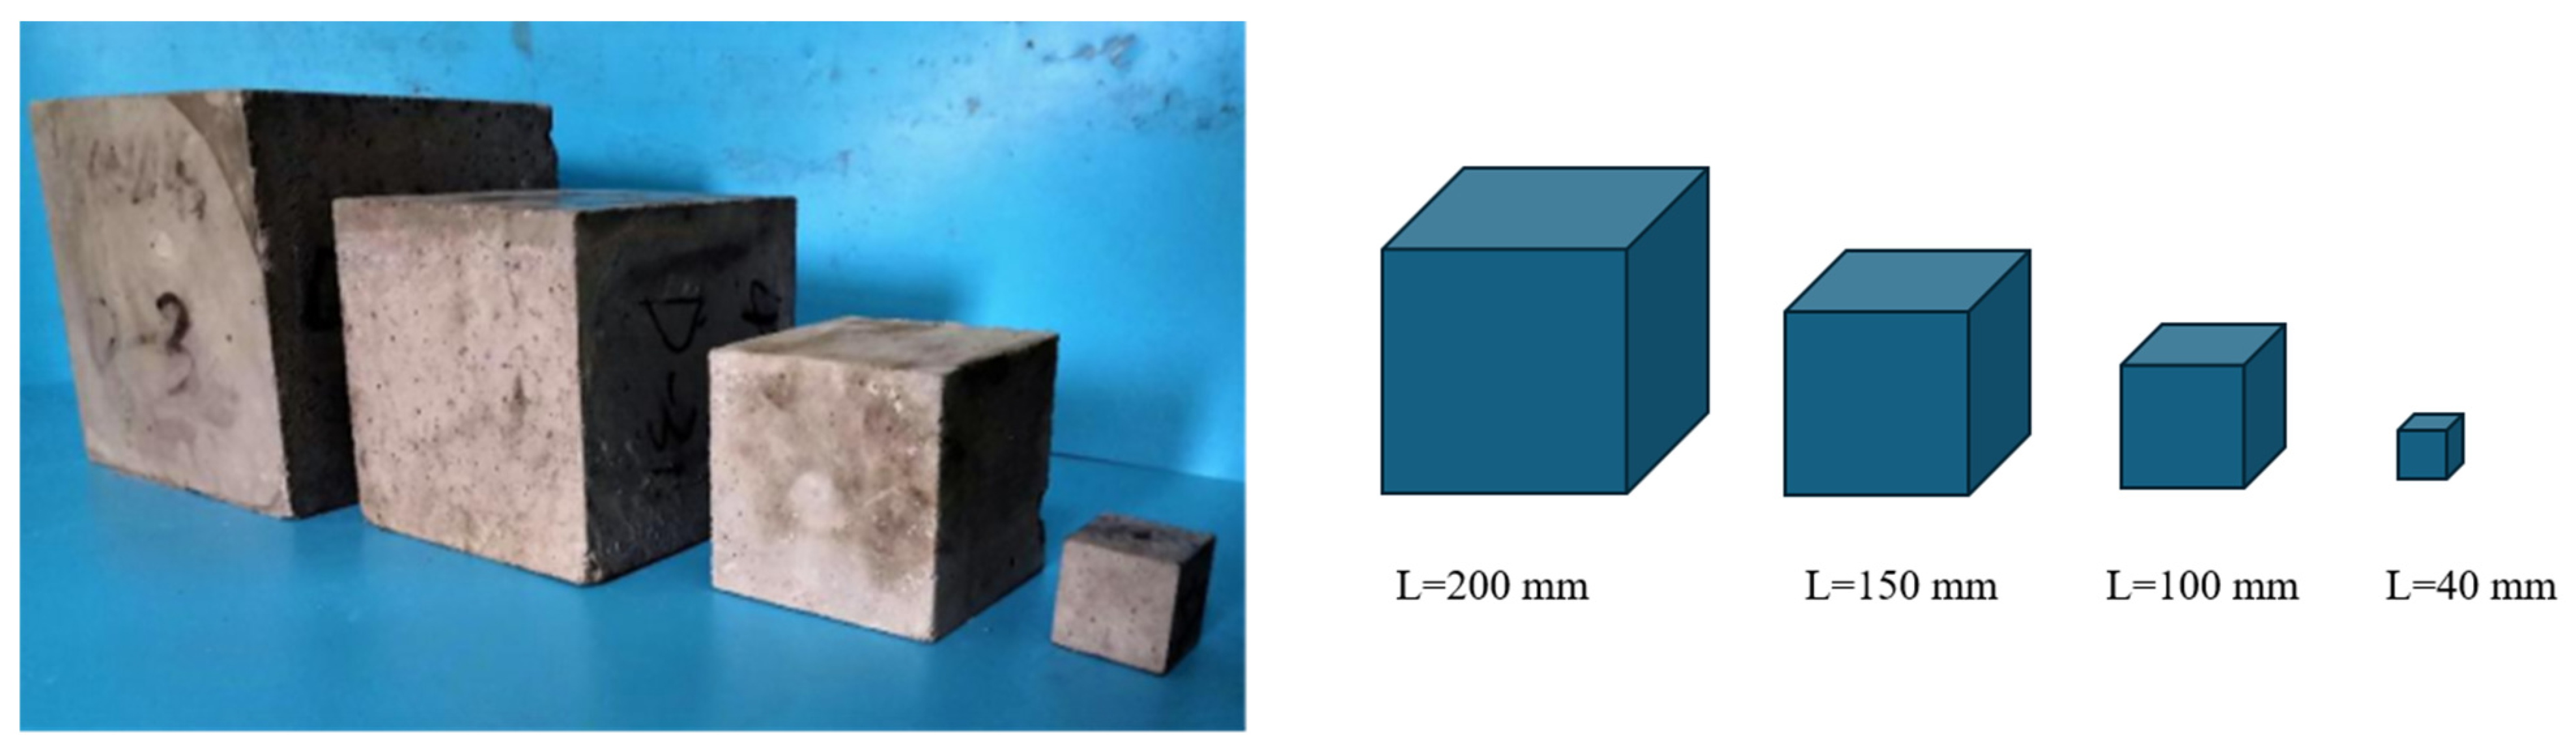
2.3.2. Test Methods of Cube CS and STS

The cube CS and STS test methods are based on the ‘SL/T 352-2020 Test code for Hydraulic Concrete’ [20]. The dimensions of the cubic specimens are L = 40 mm, L = 100 mm, L = 150 mm, and L = 200 mm, as shown in Figure 1. A total of 144 specimens were poured, and the CS and STS were tested by WAW-600 microcomputer-controlled electro-hydraulic servo universal testing machine. The change in concrete strength under freeze–thaw environment was assessed by measuring the loss rate of CS and the loss rate of STS.
The calculation method is shown in Formulas (1) and (2):
δ c = 1 F c N F c 0 × 100 %
In Equation (1): δc is the CS loss rate of WWC cube after N FTCs, %; Fc(N) is the cube CS of WWC after N FTCs, in MPa; Fc0 is the cube CS of WWC before freezing–thawing, in MPa.
δ t = 1 F t N F t 0 × 100 %
In Equation (2): δt is the STS loss rate of WWC cube after N FTCs, %; Ft(N) is the cube STS of WWC after N FTCs, in MPa; Ft0 is the cube STS of WWC before freezing–thawing, in MPa.

3. Test Results and Discussion

3.1. Appearance Changes

Based on Figure 2, as the number of FTCs increases, the surface of the cubic specimens becomes rougher, and the surface mortar gradually becomes loose. After 20 FTCs, part of the surface of the specimen began to have mortar spalling; after 50 FTCs, with the further deepening of internal damage, the exposed coarse aggregate appeared on the surface of the specimen. The experimental results indicate that during the initial stages of FTCs, the surface mortar of WWC gradually deteriorates, becoming rough, and then exhibits varying degrees of damage. As the number of FTCs increased, the internal pores of the concrete specimens gradually increased. After repeated FTCs, the internal structure of the WWC was destroyed, which eventually led to damage to the overall performance of the structure and greatly reduced the frost resistance. Under the same number of FTCs, the damage degree of mortar falling off on the surface of WWC specimen with side length L = 40 mm is more serious than that of test block with side length L = 200 mm, which indicates that there is a SE in WWC under a freeze–thaw environment. Moreover, the damage degree of specimens with a larger size after FTCs is more serious than that of specimens with a smaller size after FTCs. Due to the large volume of the large-sized concrete test block during the FTCs, the expansion pressure generated by the internal water during freezing is also greater. This expansion pressure generates stress inside the concrete. When the stress exceeds the STS of the concrete, it will lead to cracking and spalling of the surface mortar. The failure law of concrete specimen is similar to that outlined by Yao et al. [6].

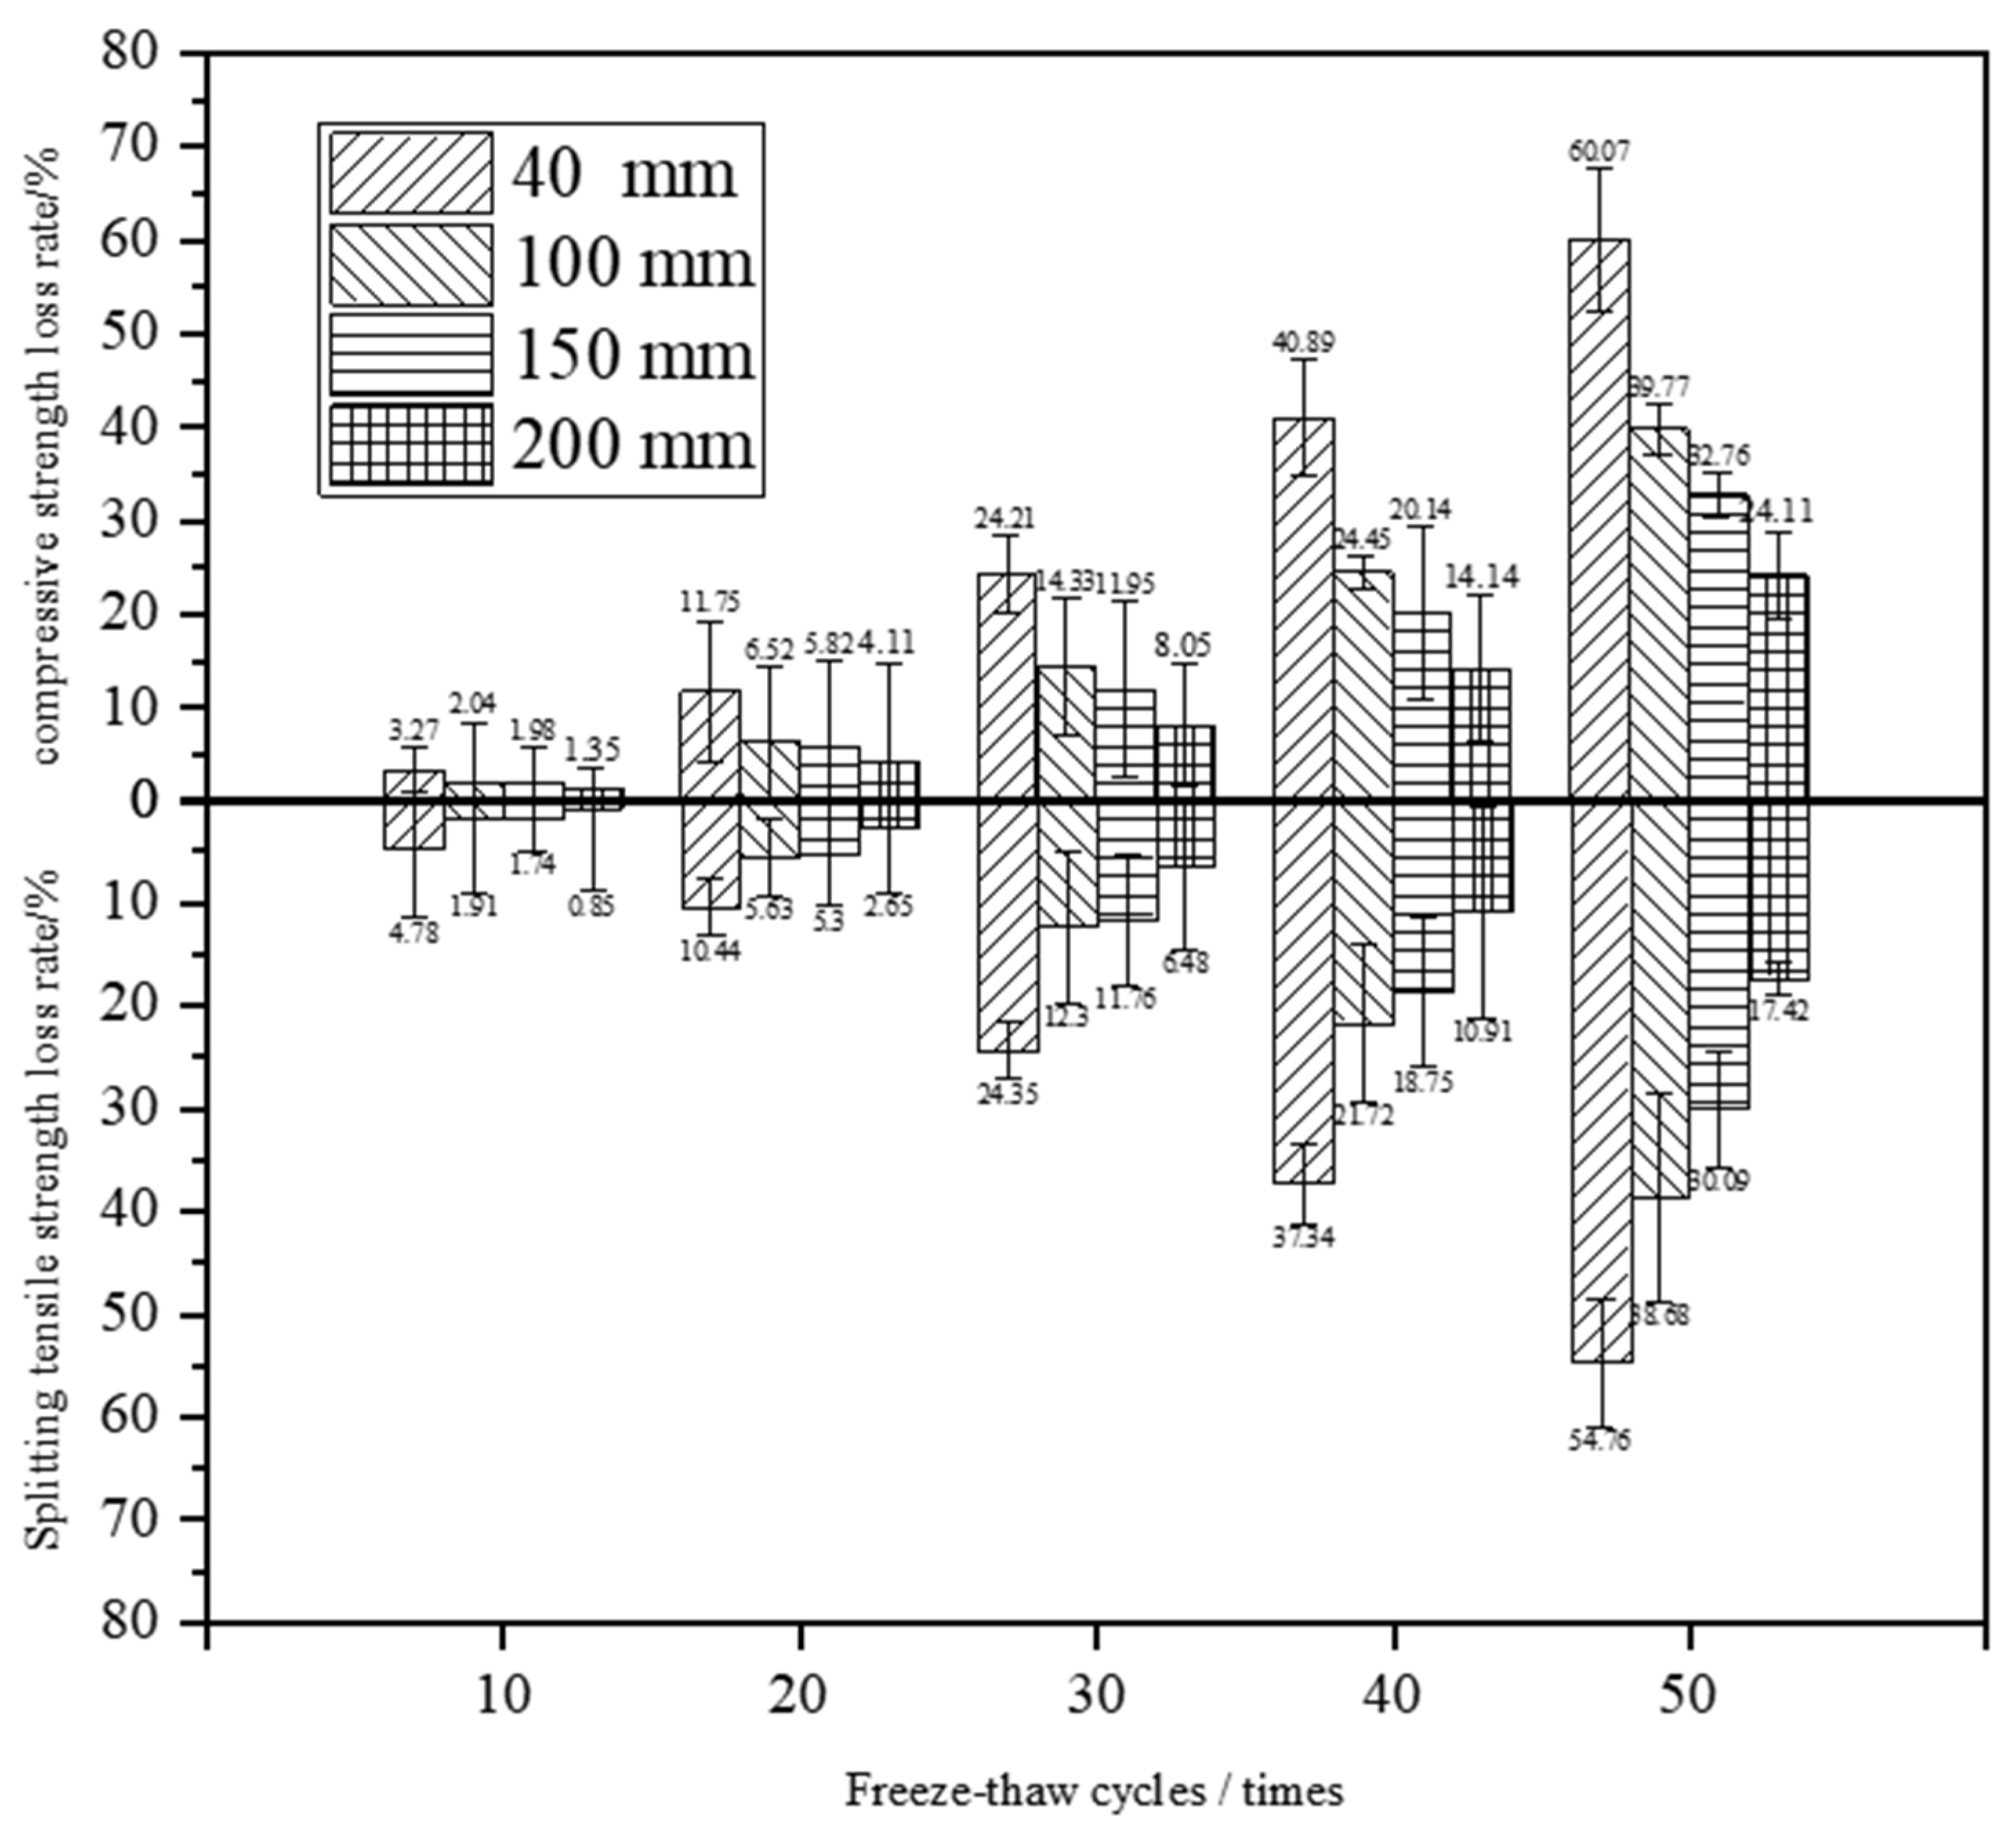
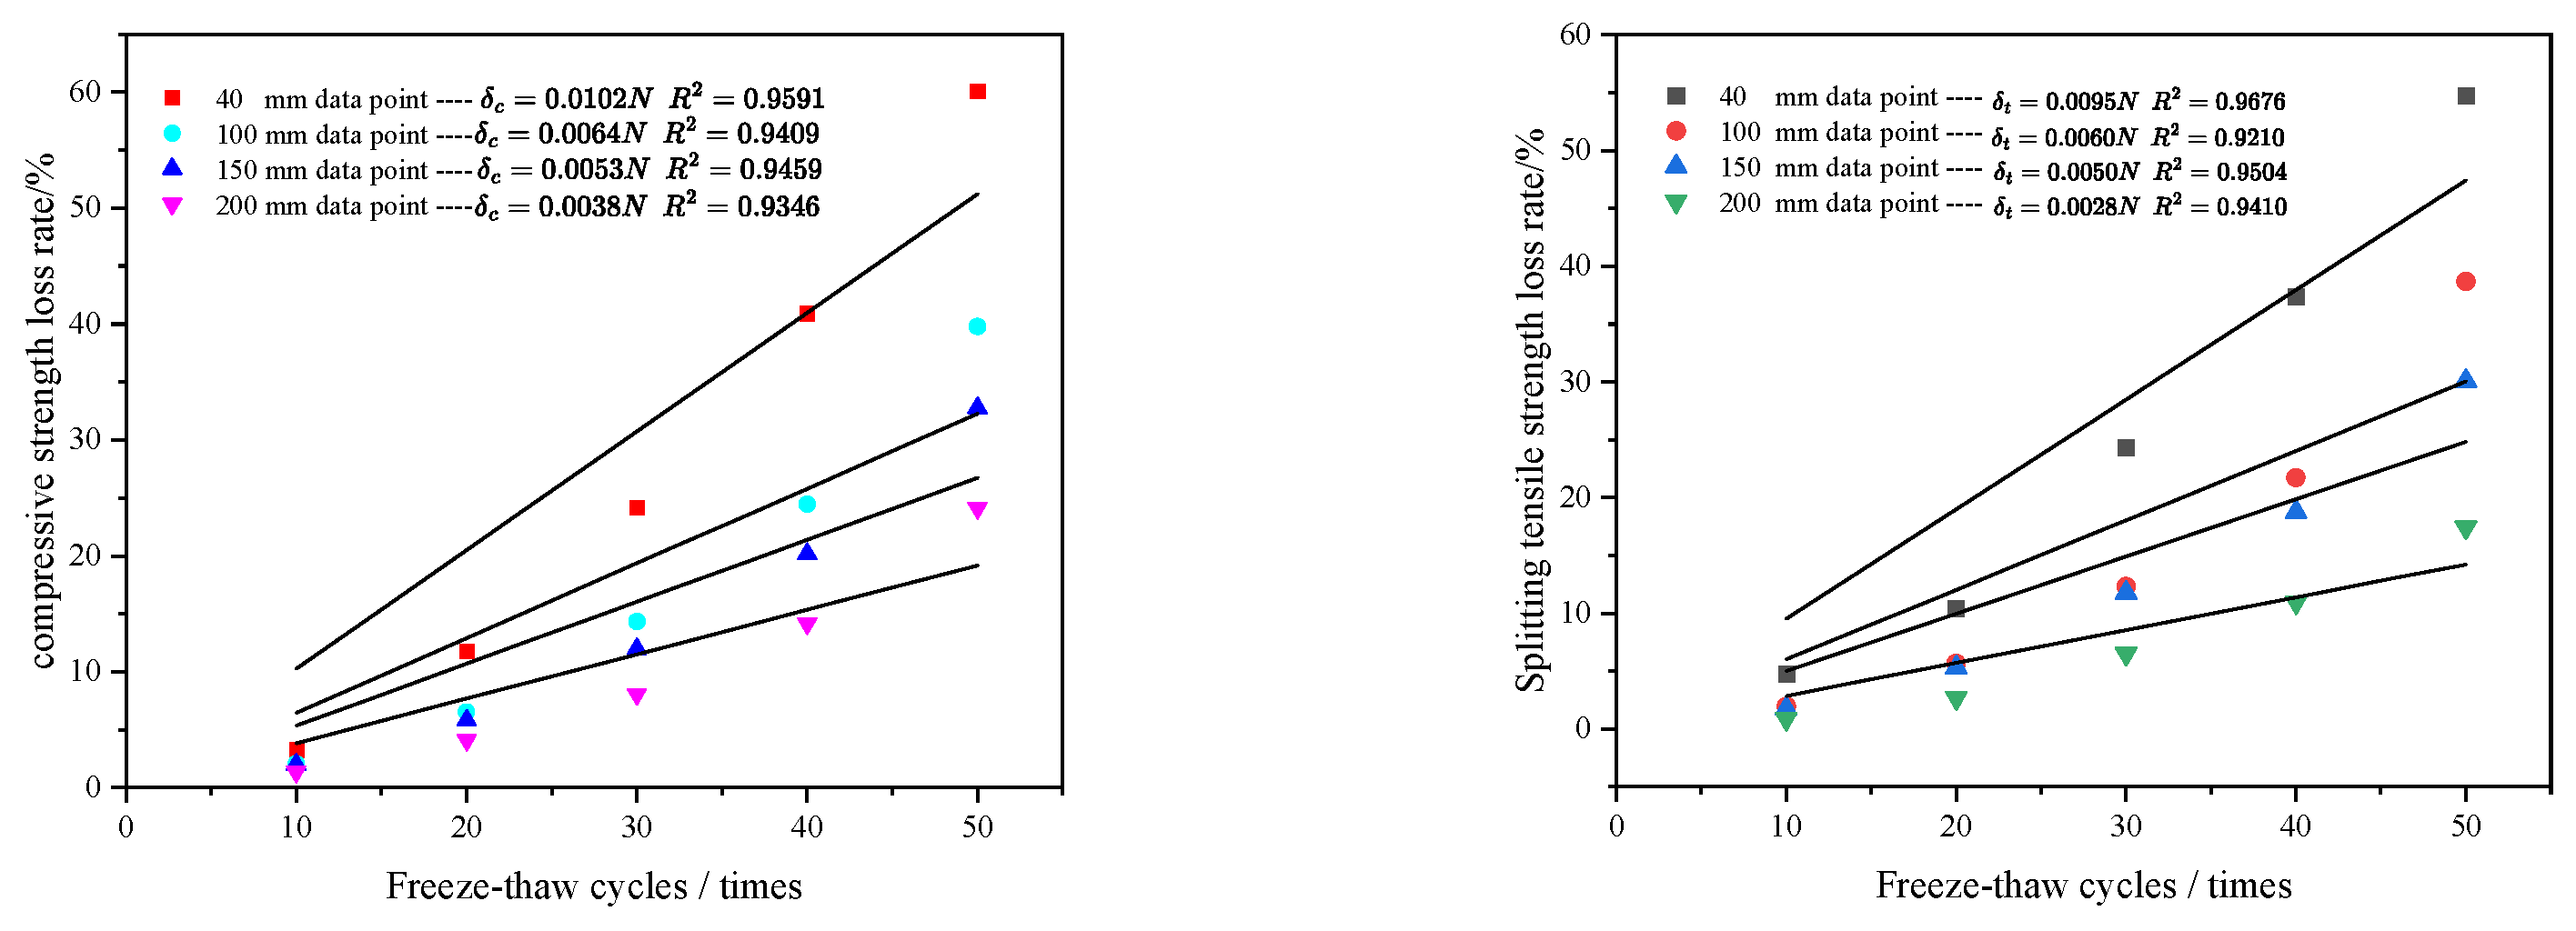
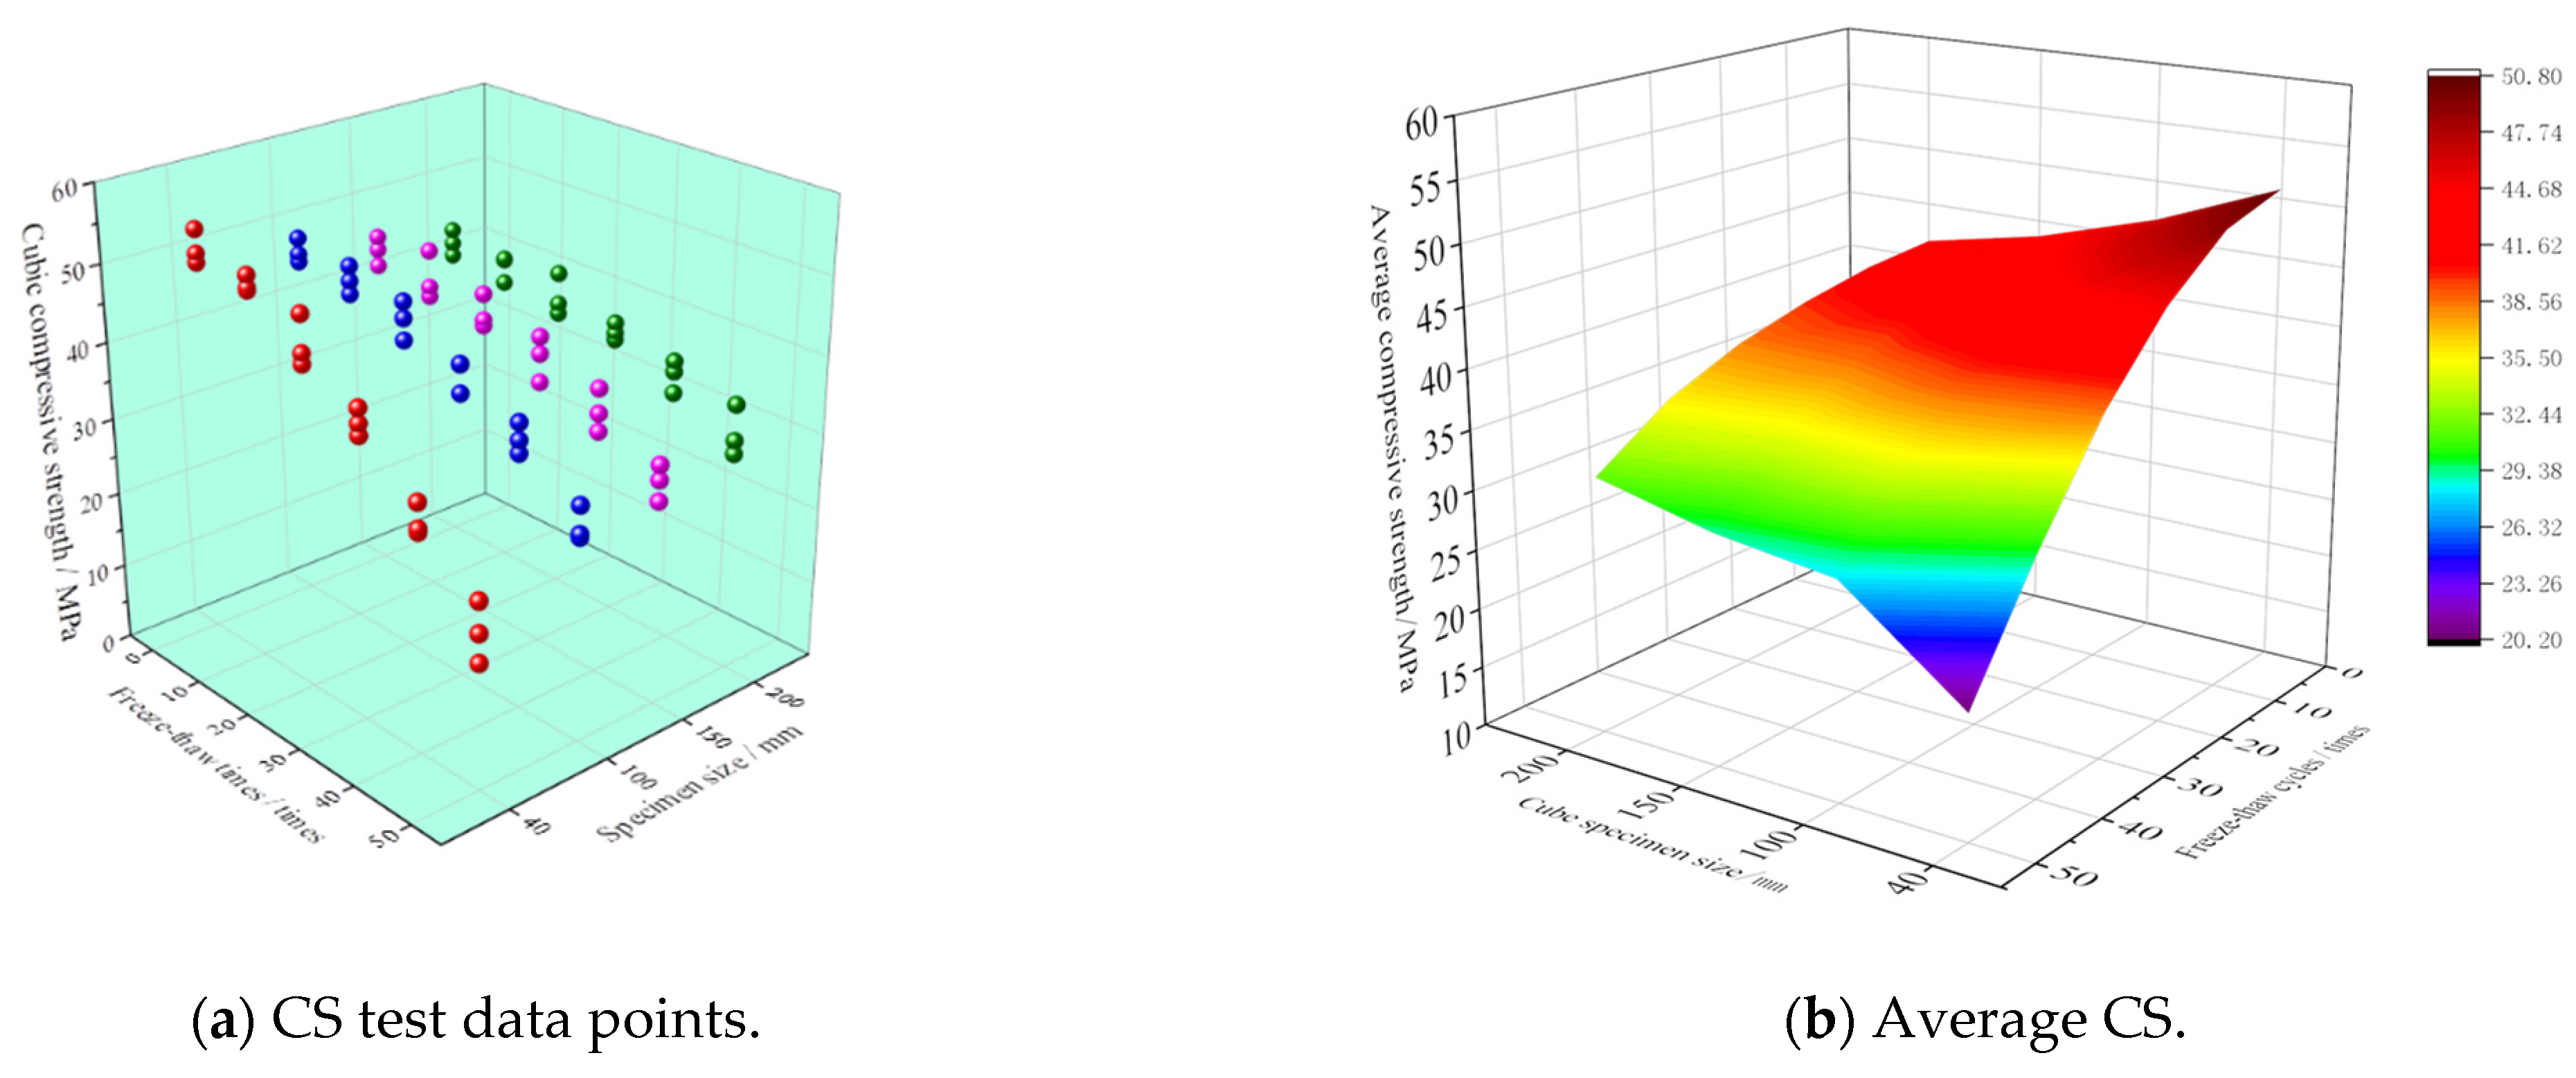
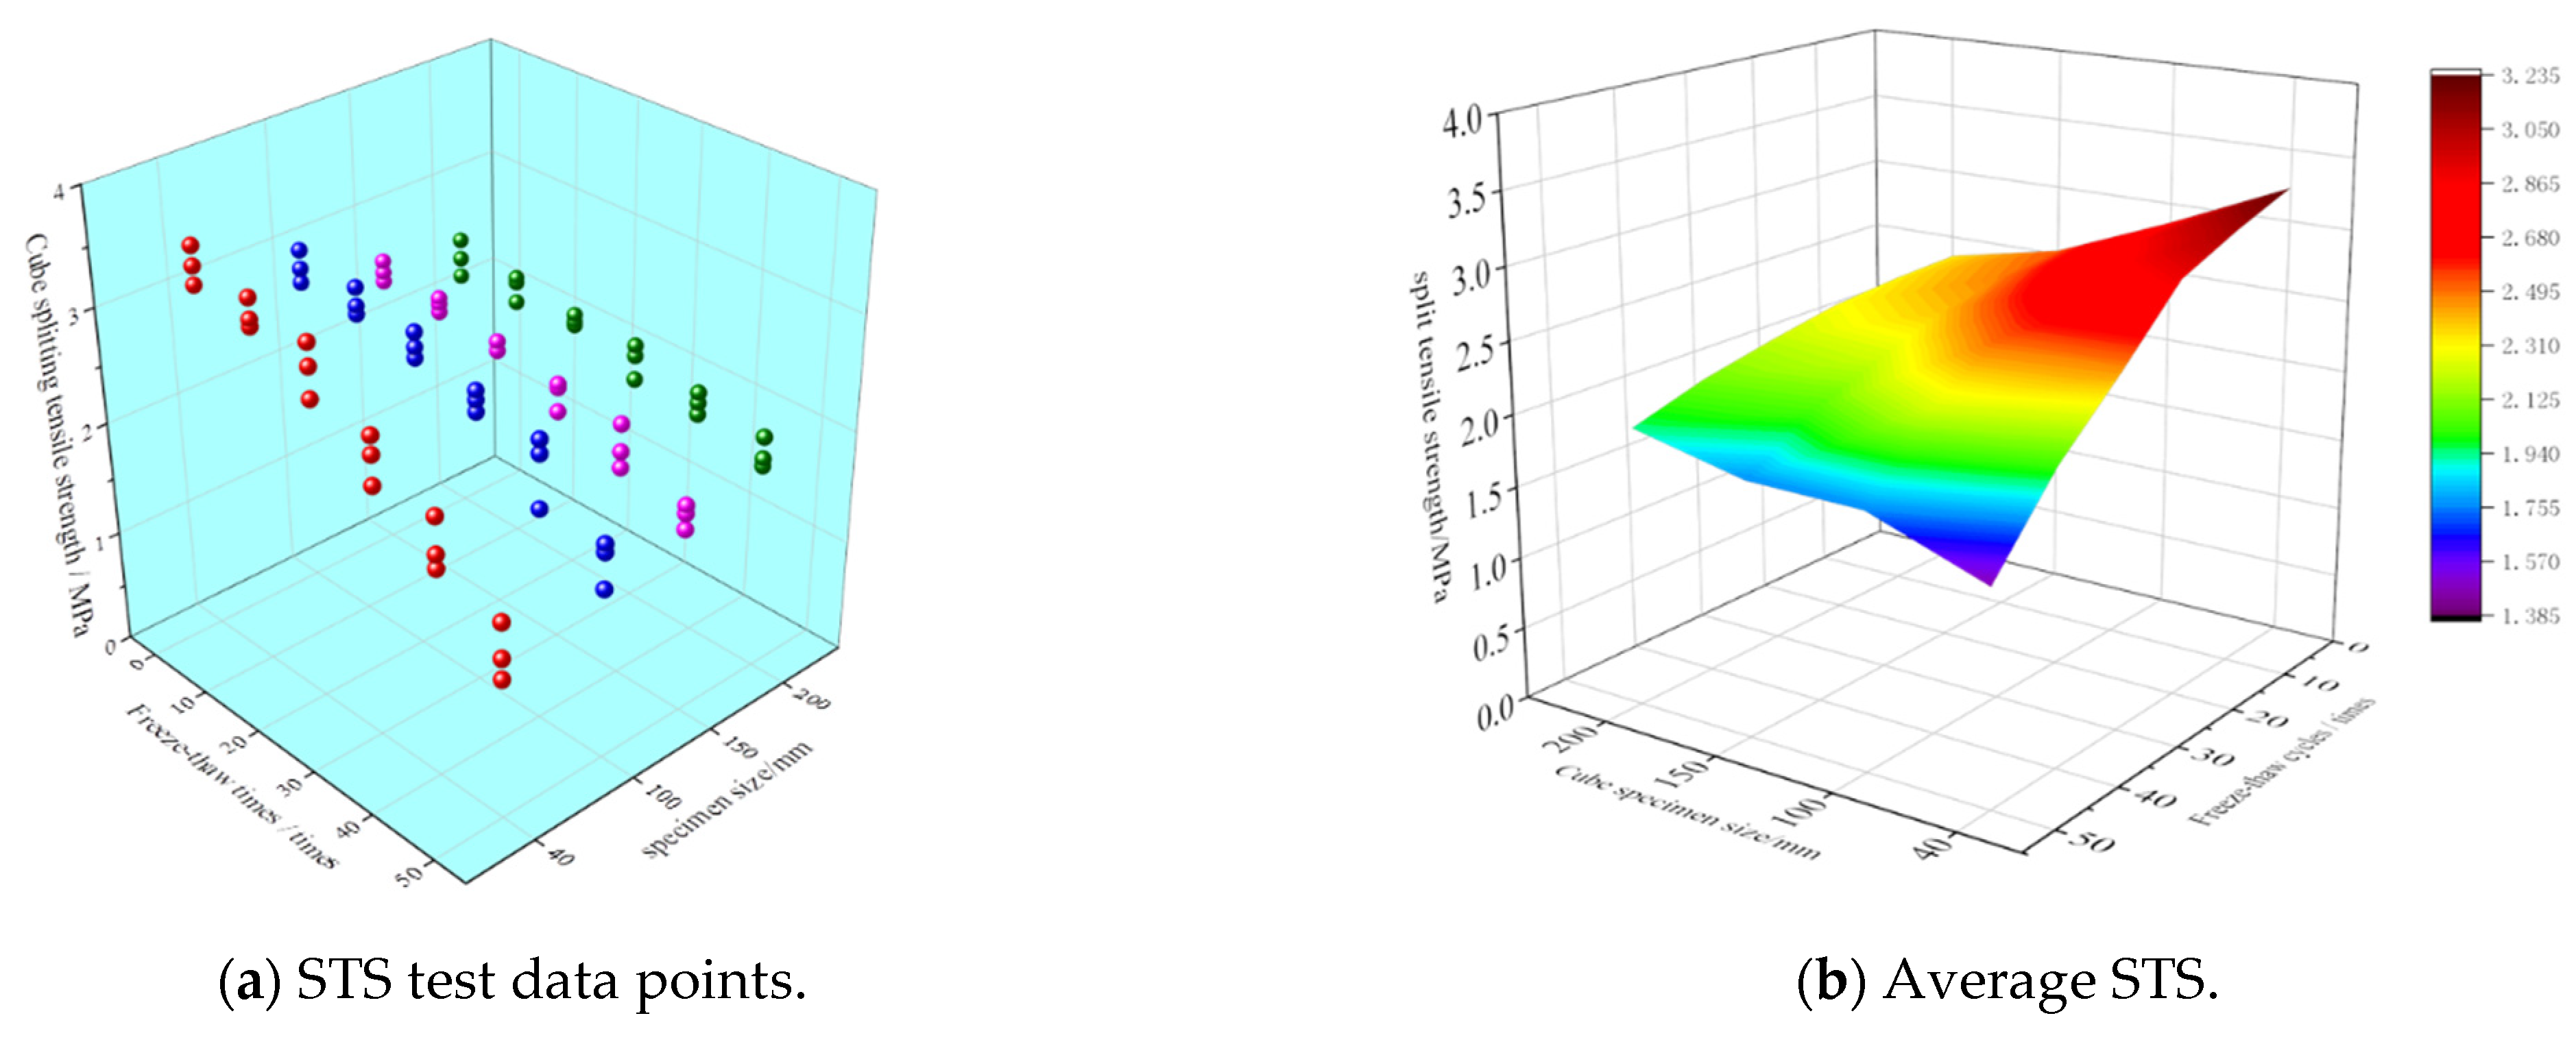
3.2. Cube CS and STS
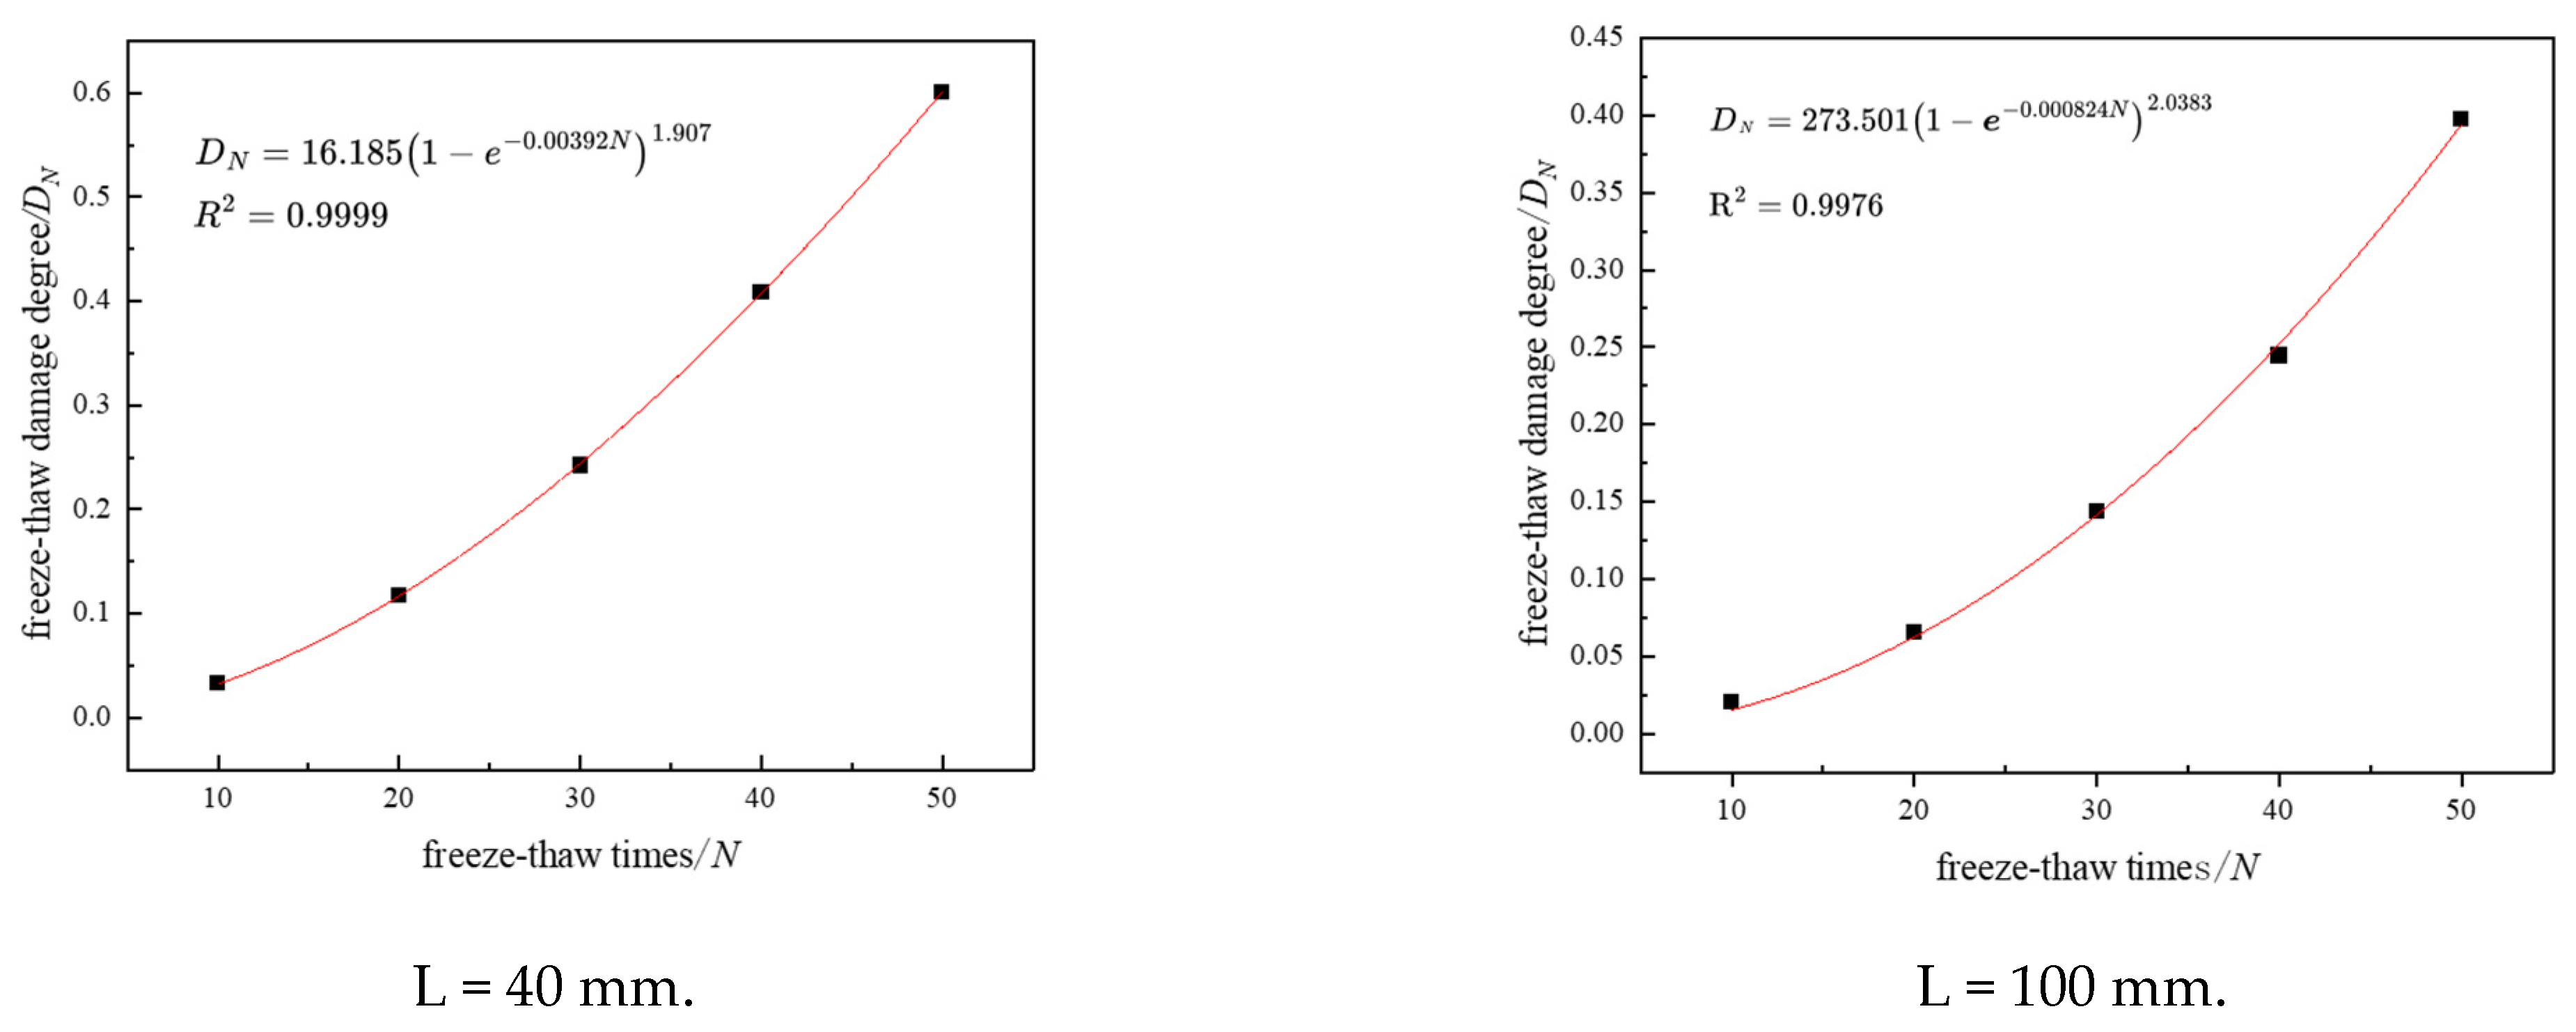
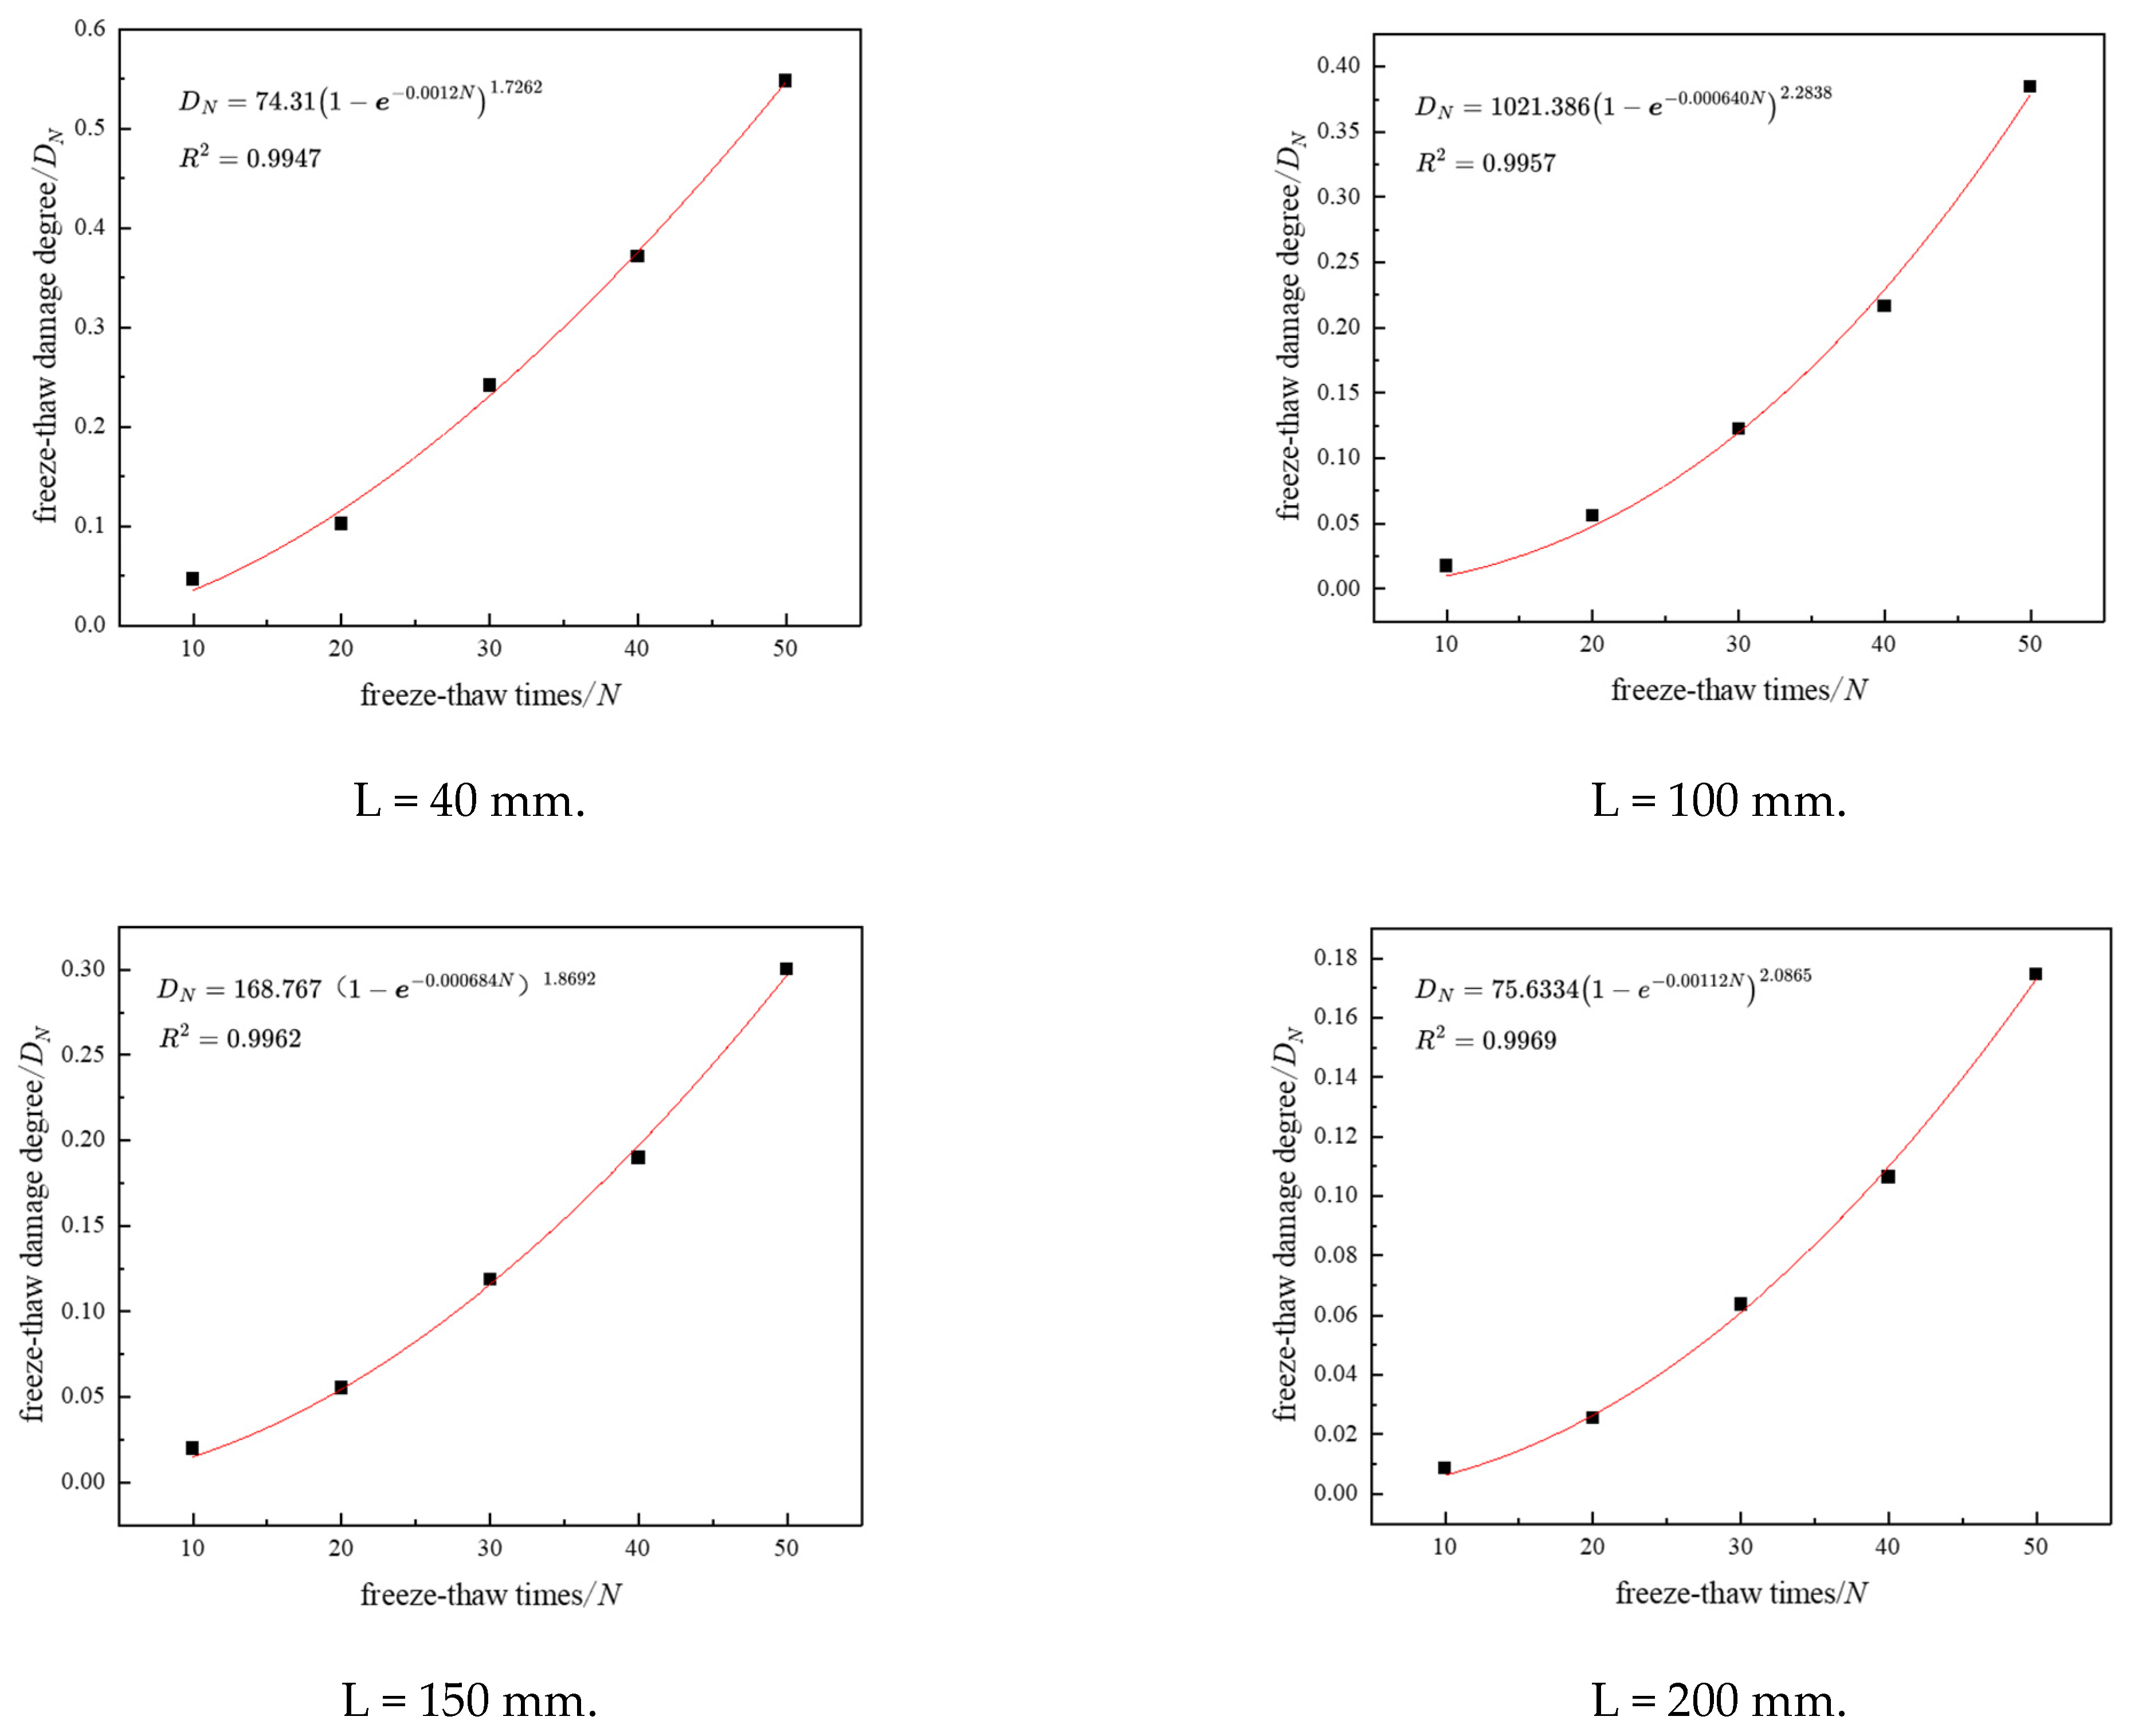
The changes of CS and STS under different FTCs were studied. The test results are presented in Table 5 and Table 6.
Table 5 and Table 6 reveal that the CS and STS of WWC decrease gradually with the increase in cycle times. The results of the calculations are shown in Table 7.
With the increase in FTCs, the CS and STS of WWC decreased gradually. The variation in the strength loss rate of specimens with different sizes relative to the number of FTCs is shown in Figure 3.
It can be seen in Figure 3 that after 50 FTCs, the CS loss rates for cubic specimens with L = 40 mm, L = 100 mm, L = 150 mm, and L = 200 mm are 60.07%, 39.77%, 32.76%, and 24.11%, respectively. As the number of FTCs increases, the CS loss rate of the WWC cubes rises. The CS loss rate of the cube specimen with L = 40 mm is the highest, followed by the specimen with L = 100 mm, the CS loss rate of the specimen with L = 150 mm is relatively low, and the CS loss rate of the specimen with L = 200 mm is the lowest. After 50 FTCs, the STS loss rates of cube specimens with L = 40 mm, L = 100 mm, L = 150 mm, and L = 200 mm were 54.76%, 38.68%, 30.09%, and 17.42%, respectively. After 50 FTCs, the change in the STS loss rate with the number of FTCs is less than that of CS loss rate with the number of FTCs. The strength loss rate between different sizes diminishes as the specimen size increases, suggesting that there is also a size effect in the variation of the strength loss rate. The strength loss rate was fitted with the number of FTCs, and the results are illustrated in Figure 4 and Table 8.
Table 6 shows that the strength loss rate is proportional to the number of FTCs—that is, the strength loss rate per unit cycle is a fixed value, and the fitting correlation coefficient is above 0.92. The slope varies with the different sizes of the specimens, which is smaller for the larger specimens, and the change of the strength loss rate per unit cycle of the specimens is smaller. The change rule of the CS loss rate with the increase in FTCs is verified by the research performed by Xi et al. [21].

4. FTD Degree Model

In order to quantitatively describe the FTD degree of WWC in freeze–thaw environment, based on the theory of damage mechanics and CS and STS as damage variables, the FTCs damage degree of concrete can be defined as follows [9]:
D N = 1 F N F 0 = a 1 0.023 N b
In Equation (3): DN is the FTD degree of concrete specimens, FN is the CS and STS after N FTCs, F0 is the initial CS and STS, and a and b are fitting parameters.
It can be found that Equation (3) is like an exponential function, and the fitting parameters can be obtained by linear fitting.
It can be found that Formula (3) is in the form of exponential function, and the values of characteristic parameters a and b can be obtained by fitting in mathematical statistics. The correlation between the fitting characteristic parameters of CS and STS is shown in Figure 5 and Figure 6. The estimation results of the functional characteristic parameters of the WWC of differently sized cube specimens are shown in Table 9 and Table 10. Table 9 and Table 10 indicate that the linear regression coefficient exceeds 0.99, indicating that the WWC conforms to the exponential function FTD model under the action of FTCs.
The FTD degrees of L = 40 mm, L = 100 mm, L = 150 mm, and L = 200 mm cube specimens were calculated by combining Table 9, Table 10, and Formula (3), as shown in Table 11 and Table 12. At the same time, the calculated values of the FTD degree of CS and STS are compared with the experimental values. The variances of the ratio of the experimental value to the calculated value are 0.0254, 0.0252, and 0.0216,0.0196. Therefore, the error between the calculated value and the experimental value is small. When the number of FTCs is 10, the error between the calculated and experimental values is large because the effect of FTCs on concrete strength is not linear and potentially more pronounced in the initial stages. Computational models may be difficult to use to accurately capture these nonlinear and early changes. However, with the increase in FTCs, microcracks and damage in concrete gradually accumulate. These damages change the performance of concrete, making it closer to the ‘damage accumulation’ assumption in the calculation model, and the performance change may be more stable and predictable. Therefore, as the number of FTCs increases, the difference between the experimental and calculated values diminishes.

5. Strength Degeneracy Model

The Effect of FTCs and Specimen Size Coupling on CS

Figure 7 shows the relationship between the CS of WWC and the number of FTCs and the size of the specimen. The relationship between the number of FTCs and the size of the specimen on the CS of concrete can be fitted by a quadratic surface function. The fitting results are shown in Equation (4).
The average CS of WWC is fitted with the specimen size and the number of FTCs. The results of the fitting are as follows:
fc = −0.0068N2 – 0.3273L2 – 0.1357NL + 0.3163N + 5.4561L + 34.43
R 2 = 0.9709
In Equation (4), fc is the CS of the cube test block with the side length of L after N FTCs, in MPa; L is the specimen size, in mm.
In Figure 7, it can be seen that when the number of FTCs is constant, the loss rate of CS of WWC gradually decreases with the increase in specimen size, indicating that there is a significant SE on its CS. As the size increases, the decline in the CS loss rate gradually slows, particularly after 40 FTCs, indicating that the SE is not significant. When the size of the specimen is constant, the CS loss rate of the WWC rises as the number of FTCs increases. However, compared with 40 mm specimens, the CS of 200 mm concrete specimens decreased by 16.45%, 10.98%, and 0.6%, respectively, when N = 10, 20 and 30 cycles. When N = 40 and 50 cycles, the CS increased by 18.99% and 55.67%, respectively, indicating that the SE of concrete was less and less obvious under FTCs. Specifically, the smaller the specimen, the greater the number of FTCs it experienced, leading to more severe internal damage and a more substantial reduction in CS. On the contrary, if the specimen size is larger and the number of FTCs is smaller, the internal damage will be lighter, and the rate of decrease in CS will be relatively slower. This is mainly because the smaller concrete test block has a larger specific surface area, and the penetration and freezing of water have a more significant effect on its internal structure. Therefore, after more FTCs, its internal damage is more serious. On the contrary, the larger concrete test block has a smaller specific surface area, and the infiltration and freezing of water have less influence on its internal structure, so the internal damage is lighter after less FTCs.
Figure 8 shows the relationship between the STS of WWC and the number of FTCs and the size of the specimen. The relationship between the number of FTCs and the size of the specimen on the STS of concrete can be fitted by the quadratic surface function, and the fitting results are shown in Equation (5).
The average STS of WWC is fitted with the specimen size and the number of FTCs. The fitting results are as follows:
ft = −0.00037N2 + 0.00097L2 – 0.0089NL + 0.0206N + 0.3369L + 1.8907
R 2 = 0.9627
In Equation (5), ft is the STS of the cube test block with the side length of L after N FTCs, in MPa; L is the specimen size, in mm.
Figure 8 shows that, with a constant number of FTCs, the loss rate of tensile strength (STS) in WWC gradually decreases as the specimen size increases, which indicates that the STS has SE. As the specimen size increases, the trend of the decrease in the STS loss rate gradually decreases. Especially after 40 FTCs, it shows that the SE becomes insignificant. When the size of the specimen is constant, the loss rate of the STS of the specimen increases gradually with the increase in the number of FTCs. When N = 10, 20, and 30 FTCs, the STS of 200 mm concrete specimens decreases by 24.35%, 21.03%, and 10.20%, respectively, compared with 40 mm specimens. When N = 40,50 FTCs, the STS increases by 3.44% and 32.58%, respectively, indicating that the SE becomes less and less obvious, and the reason is the same as above.

6. Conclusions and Prospect

In this paper, the macroscopic mechanical properties of four kinds of cube specimens after 50 FTCs are discussed. The changes of the appearance, CS, and STS of the specimens after FTCs are discussed. By fitting the strength loss rate and the number of FTCs, the strength-attenuation model of WWC with different sizes under a freeze–thaw environment is established. The following conclusions are drawn:
  • After 50 FTCs, the CS loss rates of cube specimens with side lengths of L = 40 mm, L = 100 mm, L = 150 mm, and L = 200 mm were 60.07%, 39.77%, 32.76%, and 24.11%, respectively. The loss rates of STS were 54.76%, 38.68%, 30.09%, and 17.42%, respectively.
  • Based on the damage mechanics theory and the FTD model with CS and STS as damage variables, the FTD degree of concrete under the coupling effect of FTCs and specimen size can be accurately predicted.
  • Based on the relationship between the CS and STS of concrete, the number of FTCs, and the size of the specimen, a concrete strength equation considering the coupling effect of the size change of the specimen and the number of FTCs was established.
  • This model not only provides a scientific theoretical basis for evaluating the durability of WWC but also offers theoretical support for its application in practical engineering structures.
  • In the study of mechanical properties and strength SEs of WWC in freeze–thaw environments, it is advisable to expand the range of specimen sizes to further validate and refine the results of this paper.

Author Contributions

Conceptualization, X.Y.; Validation, X.Y.; Formal analysis, S.L., J.M., L.S. and S.C.; Data curation, S.L.; Writing—original draft, S.L.; Writing—review and editing, X.Y.; Visualization, S.L.; Supervision, X.Y., J.M., L.S. and S.C. All authors have read and agreed to the published version of the manuscript.

Funding

This research was funded by the Joint Fund of Henan Province Science and Technology R&D Program (225200810056).

Data Availability Statement

All the relevant data and models used in the study have been provided in the form of figures and tables in the published article.

Conflicts of Interest

Author Shengqiang Chen was employed by the company Henan Building Materials Research and Design Institute Co., Ltd. The remaining authors declare that the research was conducted in the absence of any commercial or financial relationships that could be construed as a potential conflict of interest.

Nomenclature

FTCsFreeze–thaw cycles
WWCWastewater concrete
SESize effect
CSCompressive strength
STSSplitting tensile strength
FTDFreeze–thaw damage

References

  1. Chen, Z.; Wu, C.; Luo, X.; Xu, W.; Liang, W.; Tang, Y. Spatio-temporal autogenous shrinkage and cracking behavior of core concrete in full-scale CFST: Insights from the world’s largest span arch bridge. Thin-Walled Struct. 2024, 200, 111899. [Google Scholar] [CrossRef]
  2. Huang, H.; Yan, S.; Wu, Z.; Zhou, Y.; Ni, K. Influence of wastewater of mixing station on concrete performance and recycling. Concrete 2020, 11, 157–160. (In Chinese) [Google Scholar] [CrossRef]
  3. He, T.; Li, X.; Wang, F.; Zhu, W.; Bai, F. Influence of Wastewater in Concrete Plant on Compressive Strength of C80 Concrete with Different Mineral Admixtures. Bull. Chin. Ceram. Soc. 2011, 30, 384–388. (In Chinese) [Google Scholar] [CrossRef]
  4. Chen, X.; Wu, J.; Ning, Y.; Zhang, W. Experimental study on the effect of wastewater and waste slurry of mixing plant on mechanical properties and microstructure of concrete. J. Build. Eng. 2022, 52, 104307. [Google Scholar] [CrossRef]
  5. Aruntaş, H.Y.; Nallı, E.; Kaplan, G. Usage of ready-mixed concrete plant wastewater in concrete with superplasticizer: Effect on physico-mechanical properties. Constr. Build. Mater. 2022, 348, 128641. [Google Scholar] [CrossRef]
  6. Yao, X.; Xu, Z.; Guan, J.; Liu, L.; Shangguan, L.; Xi, J. Influence of Wastewater Content on Mechanical Properties, Microstructure, and Durability of Concrete. Buildings 2022, 12, 1343. [Google Scholar] [CrossRef]
  7. Ye, J.; Yu, J.; Cui, C.; Wang, Y. Flexural size effect of ultra-high ductile concrete under different damage and ductility levels. Cem. Concr. Compos. 2021, 115, 103852. [Google Scholar] [CrossRef]
  8. Yang, H.T.; Tian, S.Z. Influence of size effect on the performance of recycled concrete. J. Cent. S. Univ. (Sci. Technol.) 2016, 47, 3818–3823. (In Chinese) [Google Scholar] [CrossRef]
  9. Zhu, C.; Liu, X.; Li, W.; Wu, Y.; Liu, Q. Study of freeze-thaw durability and damage model of hybrid fiber concrete. Ind. Constr. 2015, 45, 10–14. (In Chinese) [Google Scholar] [CrossRef]
  10. Li, X.; Gu, X.; Xia, X.; Madenci, E.; Chen, A.; Zhang, Q. Peridynamic simulation of micro-internal damage and macro-mechanical properties of cement paste under freeze-thaw cycles. J. Build. Eng. 2024, 93, 109759. [Google Scholar] [CrossRef]
  11. Lu, J.; Liu, J.; Yang, H.; Wan, X.; Gao, J.; Zhang, J.; Li, P. Experimental investigation on the mechanical properties and pore structure deterioration of fiber-reinforced concrete in different freeze-thaw media. Constr. Build. Mater. 2022, 350, 128887. [Google Scholar] [CrossRef]
  12. Wan, X.; Hu, Q.; Liao, M. Salt crystallization in cold sulfate saline soil. Cold Reg. Sci. Technol. 2017, 137, 36–47. [Google Scholar] [CrossRef]
  13. Wang, X.; Wang, Z.; Deng, X.; Sun, B.; Zhao, Y.; Fu, W. Coupled thermal model of wellbore and permafrost in Arctic regions. Appl. Therm. Eng. 2017, 123, 1291–1299. [Google Scholar] [CrossRef]
  14. Huang, K.L.; Song, Y.; Sheng, Y.M. Rainstorm Resistance of Recycled Pervious Concrete under the Coupling of Fatigue and Freeze–Thaw Cycles. Buildings 2024, 14, 294. [Google Scholar] [CrossRef]
  15. Liu, Y.; Zhu, Q.; Teng, J.H.; Deng, P.; Sun, Y. Bond Performance of Anti-Corrosion Bar Embedded in Ceramsite Concrete in Freeze–Thaw Cycles and Corrosive Environments. Buildings 2023, 13, 884. [Google Scholar] [CrossRef]
  16. Chen, P.; Liu, C.; Wang, Y. Size effect on peak axial strain and stress-strain behavior of concrete subjected to axial compression. Constr. Build. Mater. 2018, 188, 645–655. [Google Scholar] [CrossRef]
  17. Guan, J.; Liu, L.; Yao, X.; Meng, J.; Han, L. Study on the strength size effect of wastewater concrete under freeze-thaw cycles. Constr. Build. Mater. 2024, 438, 137074. [Google Scholar] [CrossRef]
  18. Zhang, M.; Yu, H.; Gong, X.; Wu, C.; Ma, H. Size effect on tensile strength of interface between coarse aggregate and mortar under freeze-thaw cycle. J. Build. Eng. 2023, 75, 106939. [Google Scholar] [CrossRef]
  19. GB175-2007; Common Portland Cement. Standardization Administration of the People’s Republic of China: Beijing, China, 2007.
  20. SL/T 352-2020; Test Code for Hydraulic Concrete. Ministry of Water Resources of the People’s Republic of China: Beijing, China, 2020. (In Chinese)
  21. Xi, J.Y.; Li, X.; Yao, X.H.; Guan, J.F.; Shangguan, L.J.; Liu, L.J.; Xu, Z.W. Effect of Wastewater from Concrete Mixing Plant on Frost esistance of C60 Concrete. J. N. China Univ. Water Resour. Electr. Power (Nat. Sci. Ed.) 2023, 44, 69–75. (In Chinese) [Google Scholar] [CrossRef]
Figure 1. Specimens of different sizes.
Buildings 14 02922 g001
Figure 2. Appearance and morphology changes of specimens of different sizes after FTCs.
Buildings 14 02922 g002
Figure 3. The loss rates of CS and STS vary with the number of FTCs.
Buildings 14 02922 g003
Figure 4. Fitting results of strength loss rate and FTCs.
Buildings 14 02922 g004
Figure 5. Correlation of characteristic parameters of CS.
Buildings 14 02922 g005aBuildings 14 02922 g005b
Figure 6. Correlation of characteristic parameters of STS.
Buildings 14 02922 g006
Figure 7. Effect of FTCs and specimen size coupling on CS.
Buildings 14 02922 g007
Figure 8. Effect of FTCs and specimen size coupling on STS.
Buildings 14 02922 g008
Table 1. The main technical properties of fine aggregates.
Fineness ModulusSoil ContentBulk DensityApparent Density
2.60.8%1470 kg/m32650 kg/m3
Table 2. The main technical properties of coarse aggregate.
Grain SizeApparent DensityBulk DensitySoil ContentCrush Value
5–20 mm2710 kg/m31630 kg/m30.47%10.1%
Table 3. Main chemical components of wastewater powder and cement [17].
Chemical CompositionCaOSiO2Al2O3MgOFe2O3SO3K2ONa2O
Wt%41.9532.6413.243.73.631.741.240.524
Table 4. WWC mix ratio (kg/m3).
Strength
Grade
Concrete Mix Ratio
WastewaterPotable WaterCementSandCrushed Stone (5~20 mm)Fly AshWater-Reducing Admixture
C401354534480510958415
Table 5. CS of WWC specimens under different FTCs [17].
Specimen NumberCS Value of WWC under Different FTCs/MPa
01020304050
40—149.0048.6942.3136.8632.3516.45
40—253.2050.2843.6438.3428.6620.17
40—350.1548.3948.4940.2729.0524.22
Average value50.7849.1244.8138.4930.0220.28
100—145.3245.6443.8441.2433.4226.65
100—248.3843.9541.0537.5237.2930.64
100—346.3047.5645.9741.1735.0727.03
Average value46.6745.7243.6239.9835.2628.11
150—145.4646.3539.4835.2434.5531.54
150—241.6240.3643.5838.9237.7326.88
150—343.8041.5840.2041.1032.2429.59
Average value43.6342.7741.0938.4234.8429.34
200—143.3642.1637.7037.2433.4235.23
200—239.9038.9543.0039.4236.2028.89
200—341.5542.0138.9738.1037.5330.60
Average value41.6041.0439.8938.2535.7231.57
Table 6. STS of WWC specimens under different FTCs [17].
Specimen NumberSTS Value of WWC under Different FTCs/MPa
01020304050
40—13.402.983.122.642.281.73
40—23.233.222.922.481.961.24
40—33.073.042.652.221.841.42
Average value3.23 3.082.902.452.031.46
100—13.012.712.822.422.481.52
100—22.85 2.942.602.522.361.84
100—32.73 2.782.692.601.891.91
Average value2.86 2.812.702.512.241.76
150—12.522.422.422.082.261.65
150—22.442.492.422.321.881.86
150—32.622.542.342.292.021.79
Average value2.532.482.392.232.051.77
200—12.522.422.282.332.002.09
200—22.35 2.202.342.032.101.90
200—32.192.382.252.242.191.84
Average value2.35 2.332.292.202.101.94
Table 7. Strength loss rate of WWC specimen.
TypeSpecimen Size/mmStrength Loss Rate under Different FTCs/%
1020304050
CS403.2711.7524.2140.8960.07
1002.046.5214.3324.4539.77
1501.985.8211.9520.1432.76
2001.354.118.0514.1424.11
STS404.7810.4424.3537.3454.76
1001.915.6312.3021.7238.68
1501.745.3011.7618.7530.09
2000.852.656.4810.9117.42
Table 8. Fitting results of strength loss rate and FTCs.
Specimen SizeCS Loss Rate δcSTS Loss Rate δt
Relational ExpressionR2Relational ExpressionR2
40δc = 0.0102 N0.9591δt = 0.0095 N0.9676
100δc = 0.0064 N0.9409δt = 0.0060 N0.9210
150δc = 0.0053 N0.9459δt = 0.0050 N0.9504
200δc = 0.0038 N0.9346δt = 0.0028 N0.9410
Table 9. Characteristic parameters of CS.
Specimen Size/mmCharacteristic Parameter
abR2
4016.1851.9070.9999
100273.5012.0380.9976
150334.2181.9780.9955
200539.0452.1190.9914
Table 10. Characteristic parameters of STS.
Specimen Size/mmCharacteristic Parameter
abR2
4074.3111.7260.9947
1001021.3862.2840.9957
150168.7671.8690.9962
20075.6332.0870.9969
Table 11. Calculated and tested values of FTD of CS.
Specimen Size
/mm
FTCs/Times
1020304050
TCT/CTCT/CTCT/CTCT/CTCT/C
40 mm0.033 0.0321.03 0.118 0.1171.010.242 0.2440.990.409 0.4081.000.601 0.6021.00
100 mm0.020 0.0151.330.065 0.0621.050.143 0.1411.010.244 0.2520.970.398 0.3941.01
150 mm0.020 0.0141.430.039 0.0540.720.119 0.1200.990.201 0.2090.960.328 0.3231.02
200 mm0.013 0.0081.630.041 0.0351.170.081 0.0811.000.141 0.1490.950.241 0.2371.02
Note: T represents the test value, and C represents the calculated value.
Table 12. Calculated and tested values of FTD of STS.
Specimen Size
/mm
FTCs/Times
1020304050
TCT/CTCT/CTCT/CTCT/CTCT/C
40 mm0.046 0.0361.280.102 0.1160.880.241 0.2321.040.372 0.3770.990.548 0.5491.00
100 mm0.017 0.0101.700.056 0.0481.170.122 0.1201.020.217 0.2300.940.385 0.3801.01
150 mm0.020 0.0151.330.055 0.0551.000.119 0.1161.030.190 0.1970.960.300 0.2971.01
200 mm0.009 0.0061.500.026 0.0270.960.064 0.0611.050.106 0.1110.950.174 0.1741.00
Note: T represents the test value, and C represents the calculated value.
Disclaimer/Publisher’s Note: The statements, opinions and data contained in all publications are solely those of the individual author(s) and contributor(s) and not of MDPI and/or the editor(s). MDPI and/or the editor(s) disclaim responsibility for any injury to people or property resulting from any ideas, methods, instructions or products referred to in the content.

