
Bond-Slip Constitutive Relationship between Steel Rebar and Concrete Synthesized from Solid Waste Coal Gasification Slag

Abstract
1. Introduction
2. Materials and Methods
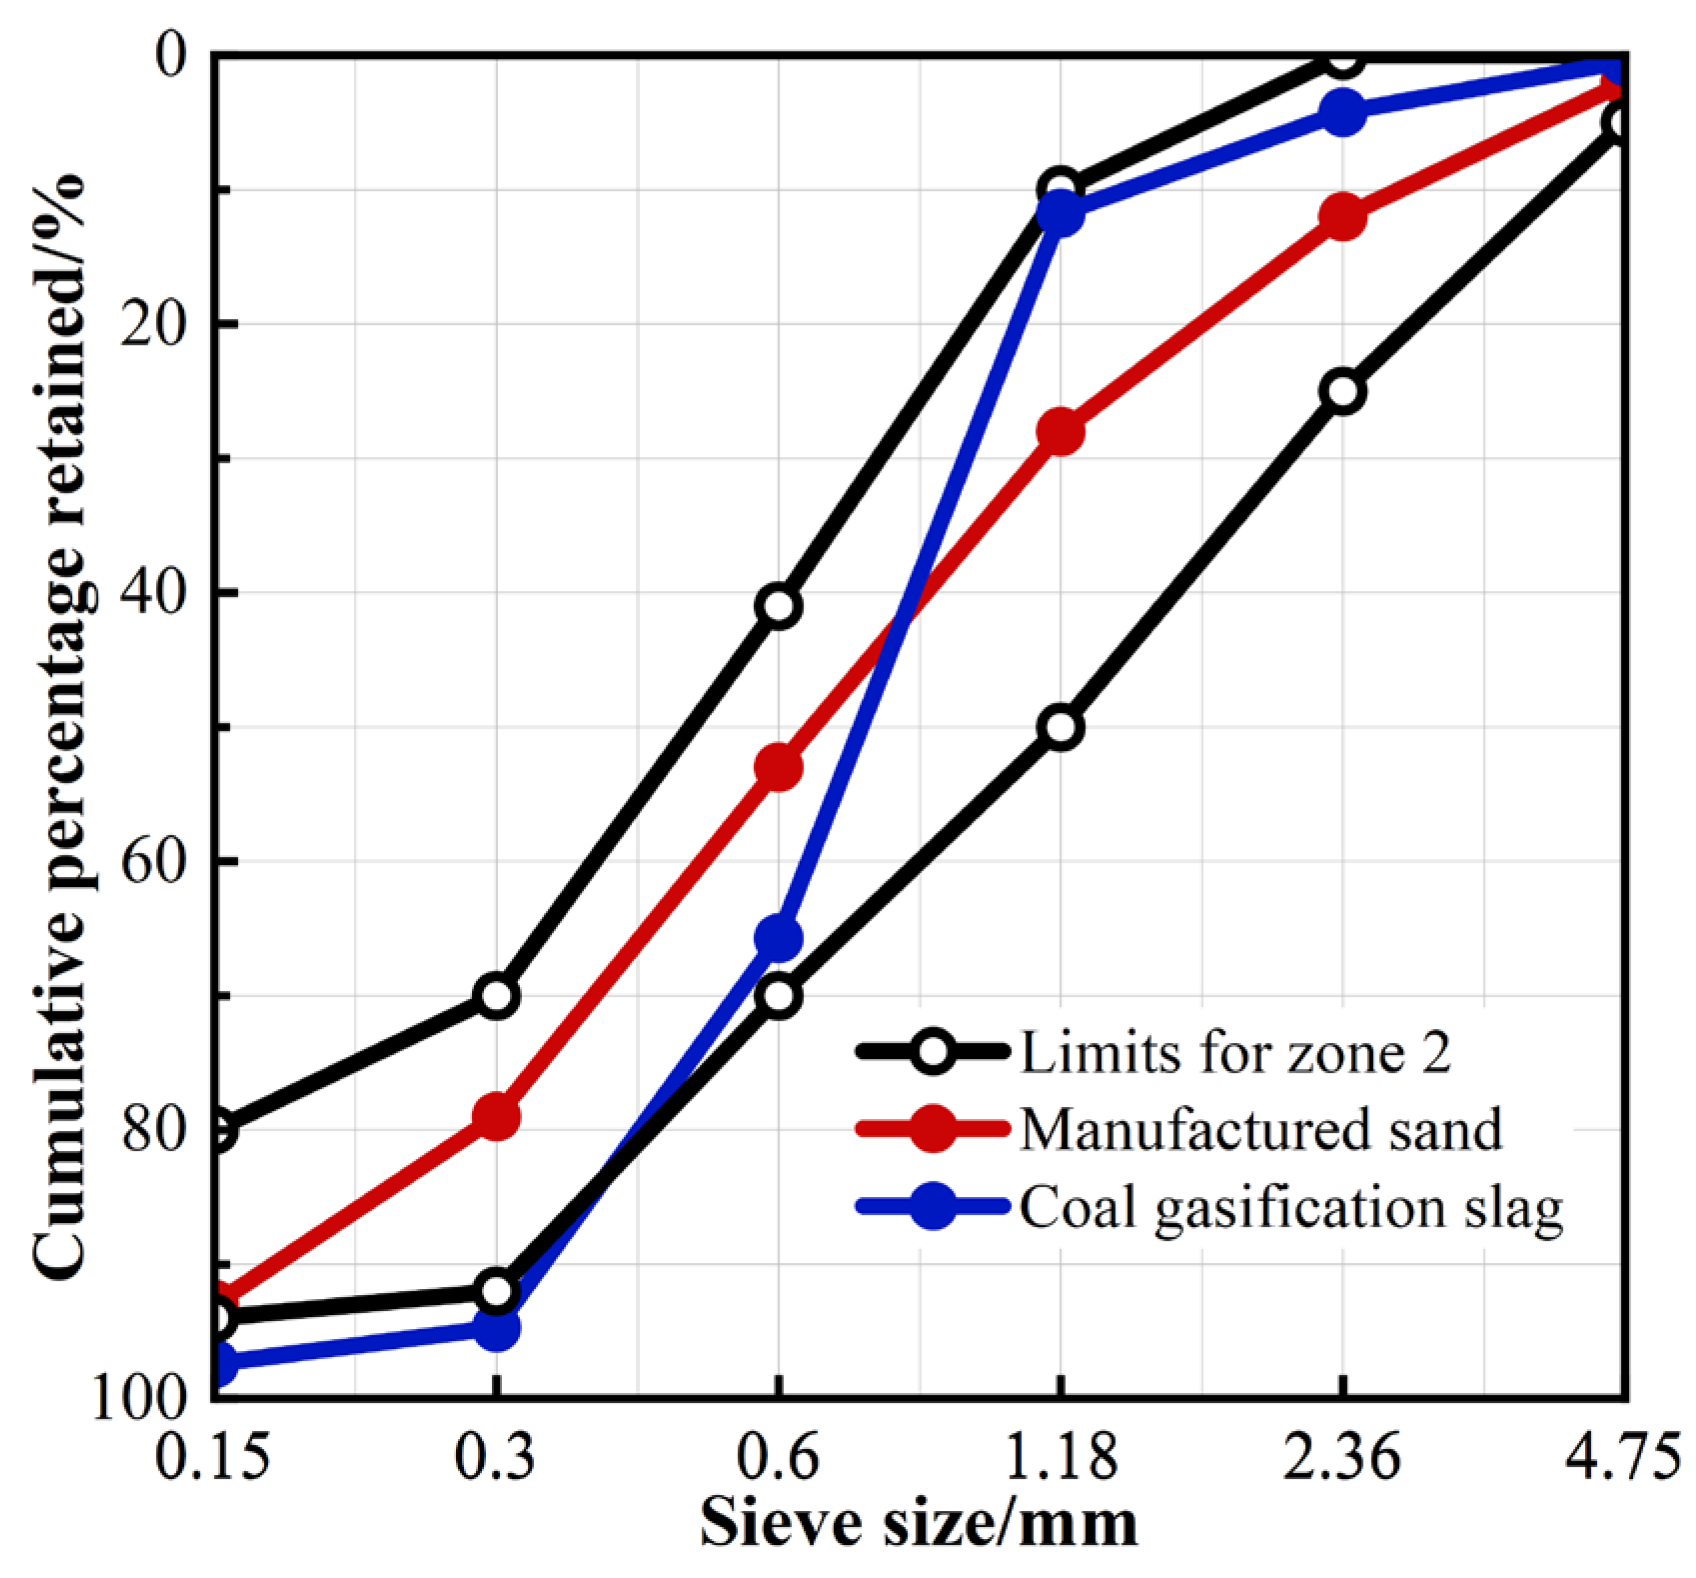
2.1. Raw Materials
2.2. Mix Ratio and Preparation
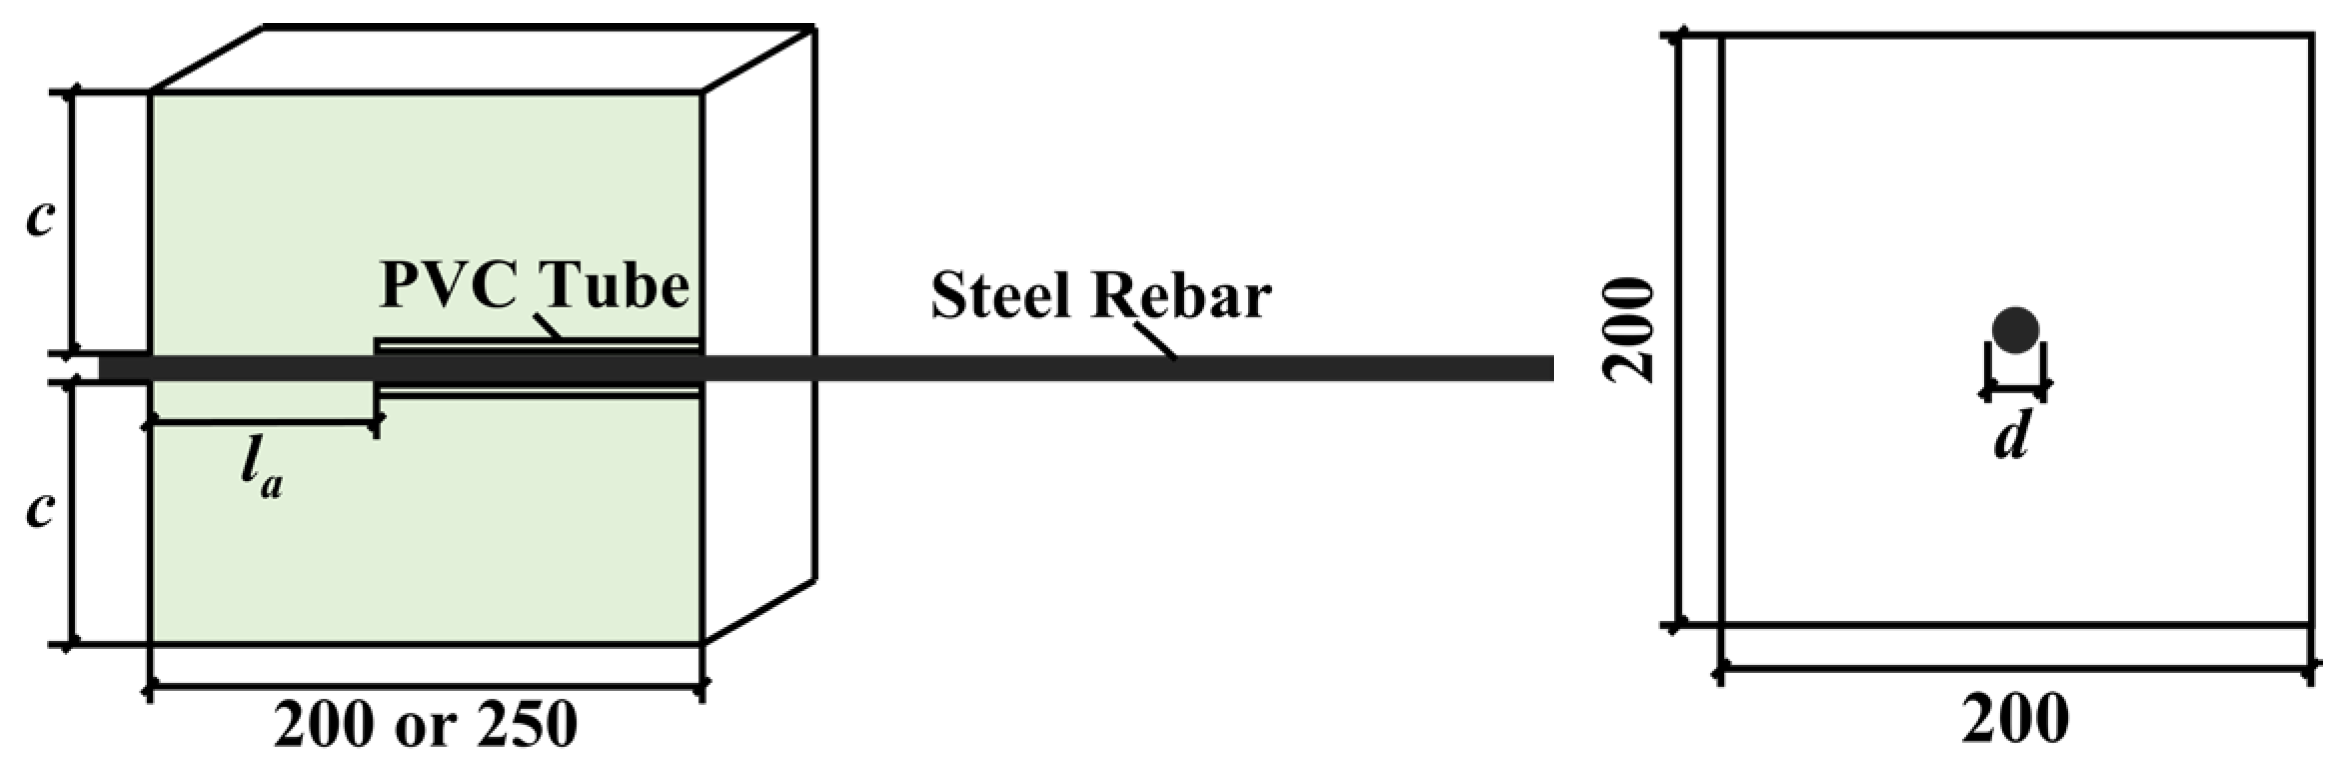
2.3. Test Methods
3. Results and Discussion
3.1. Destruction Process and Characteristics
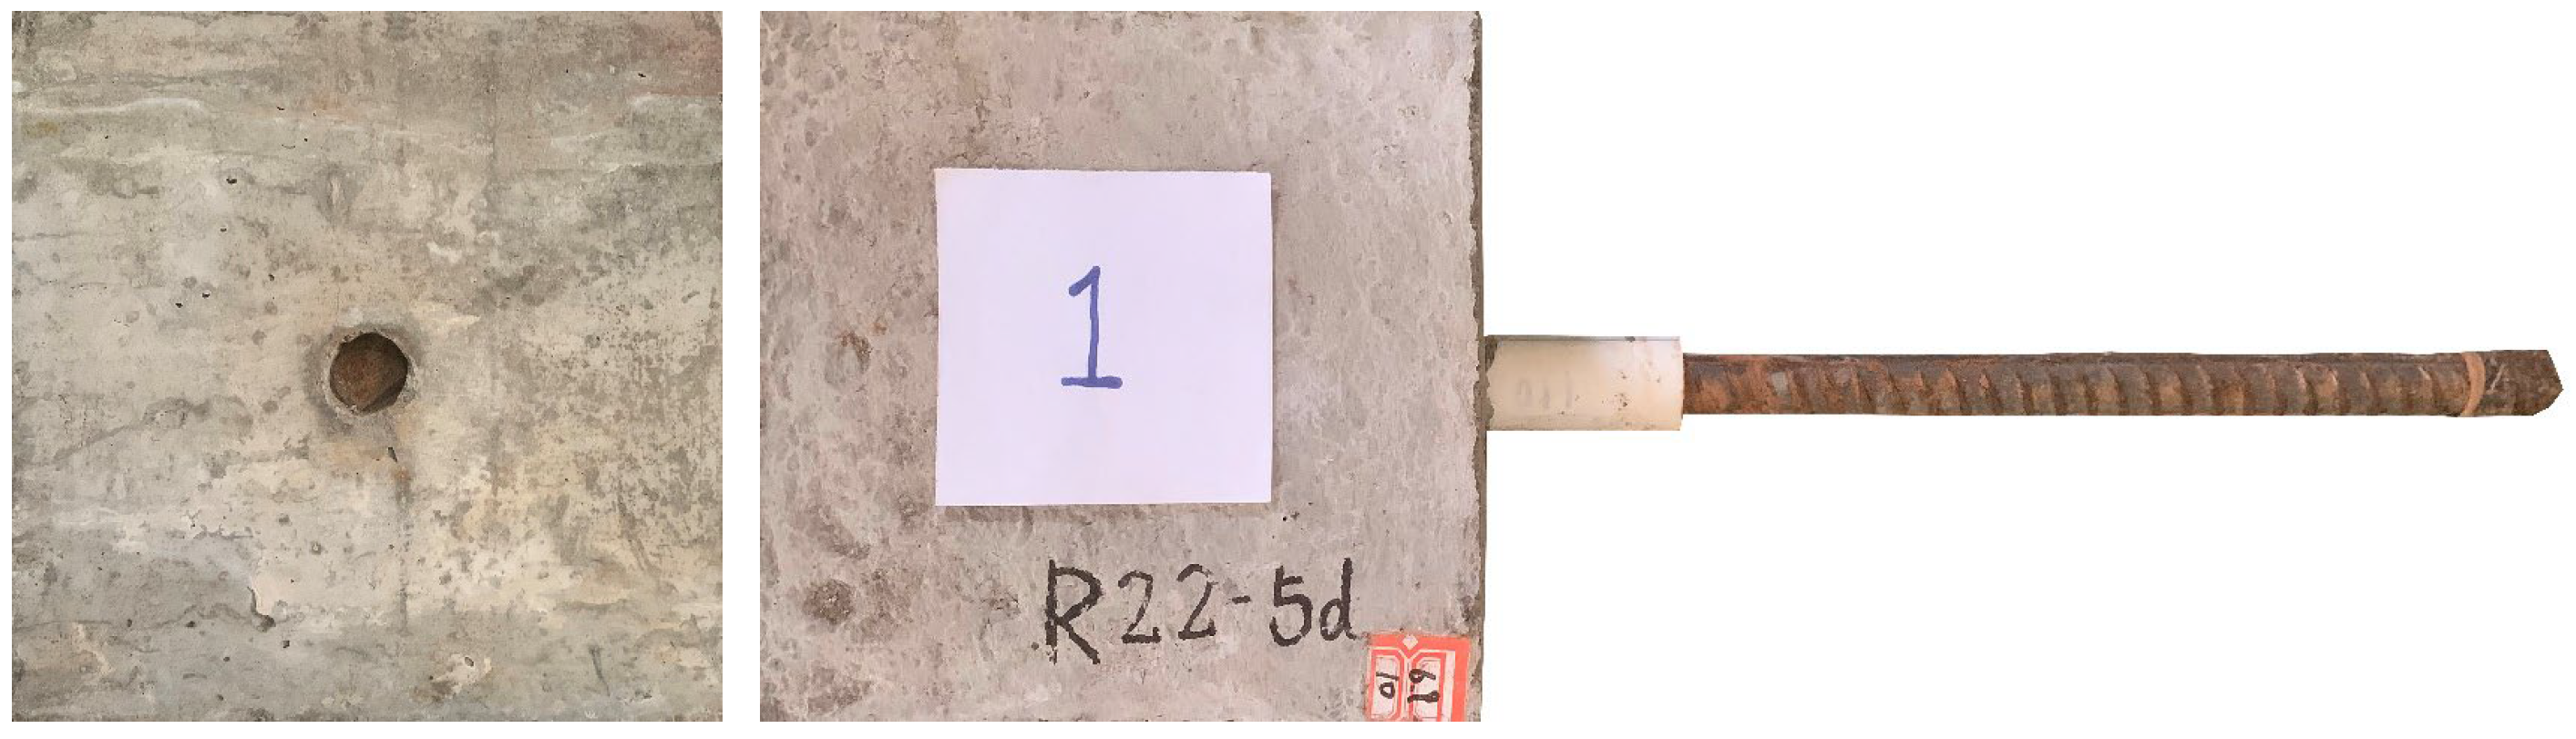
3.1.1. Steel Rebar Pull-Out
3.1.2. Concrete Splitting
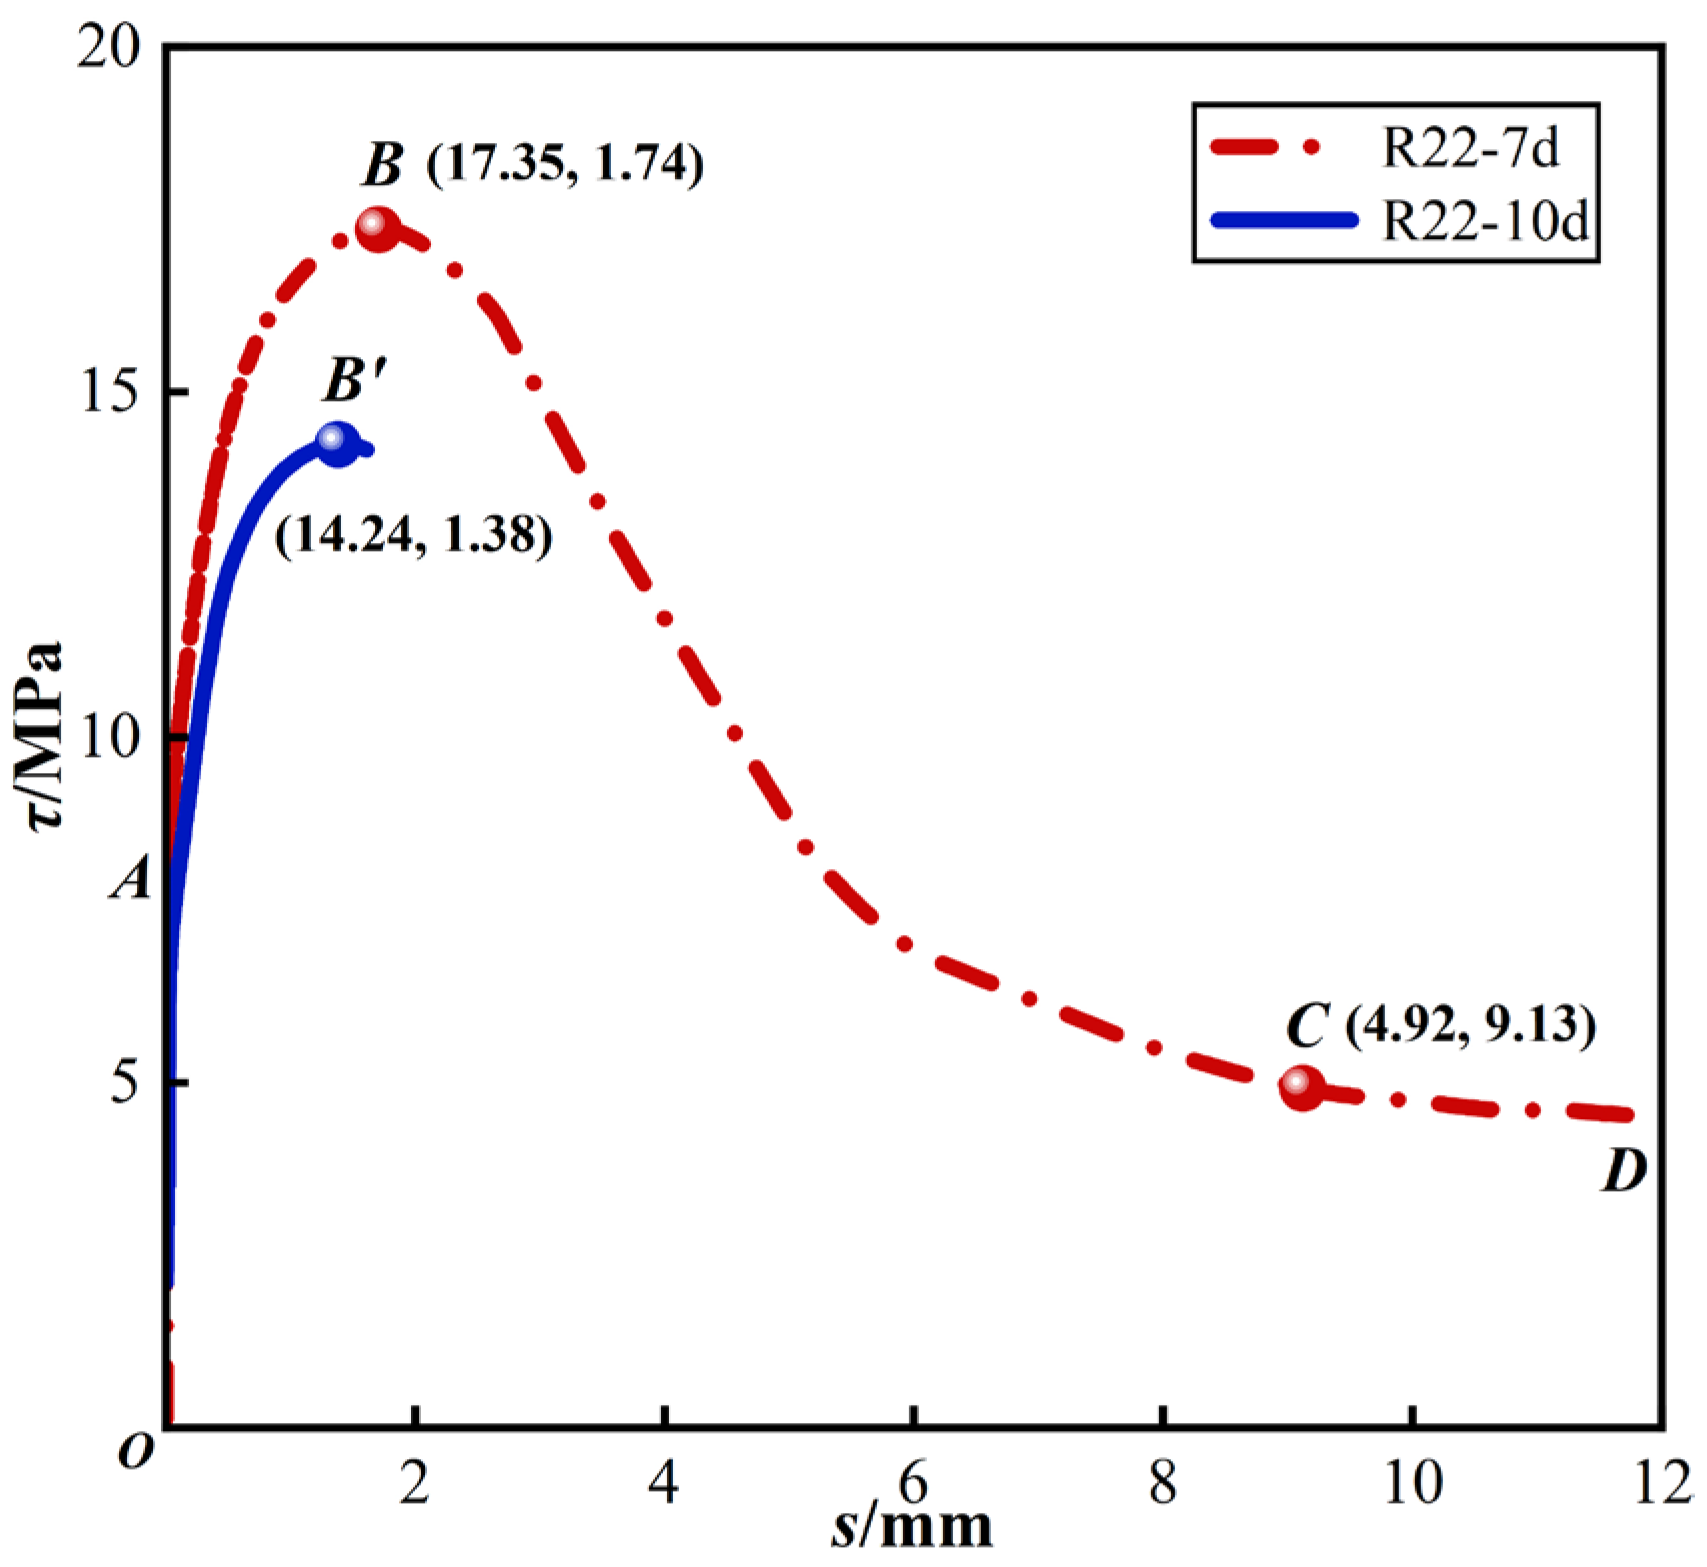
3.2. Typical τ-s Curve
- (1)
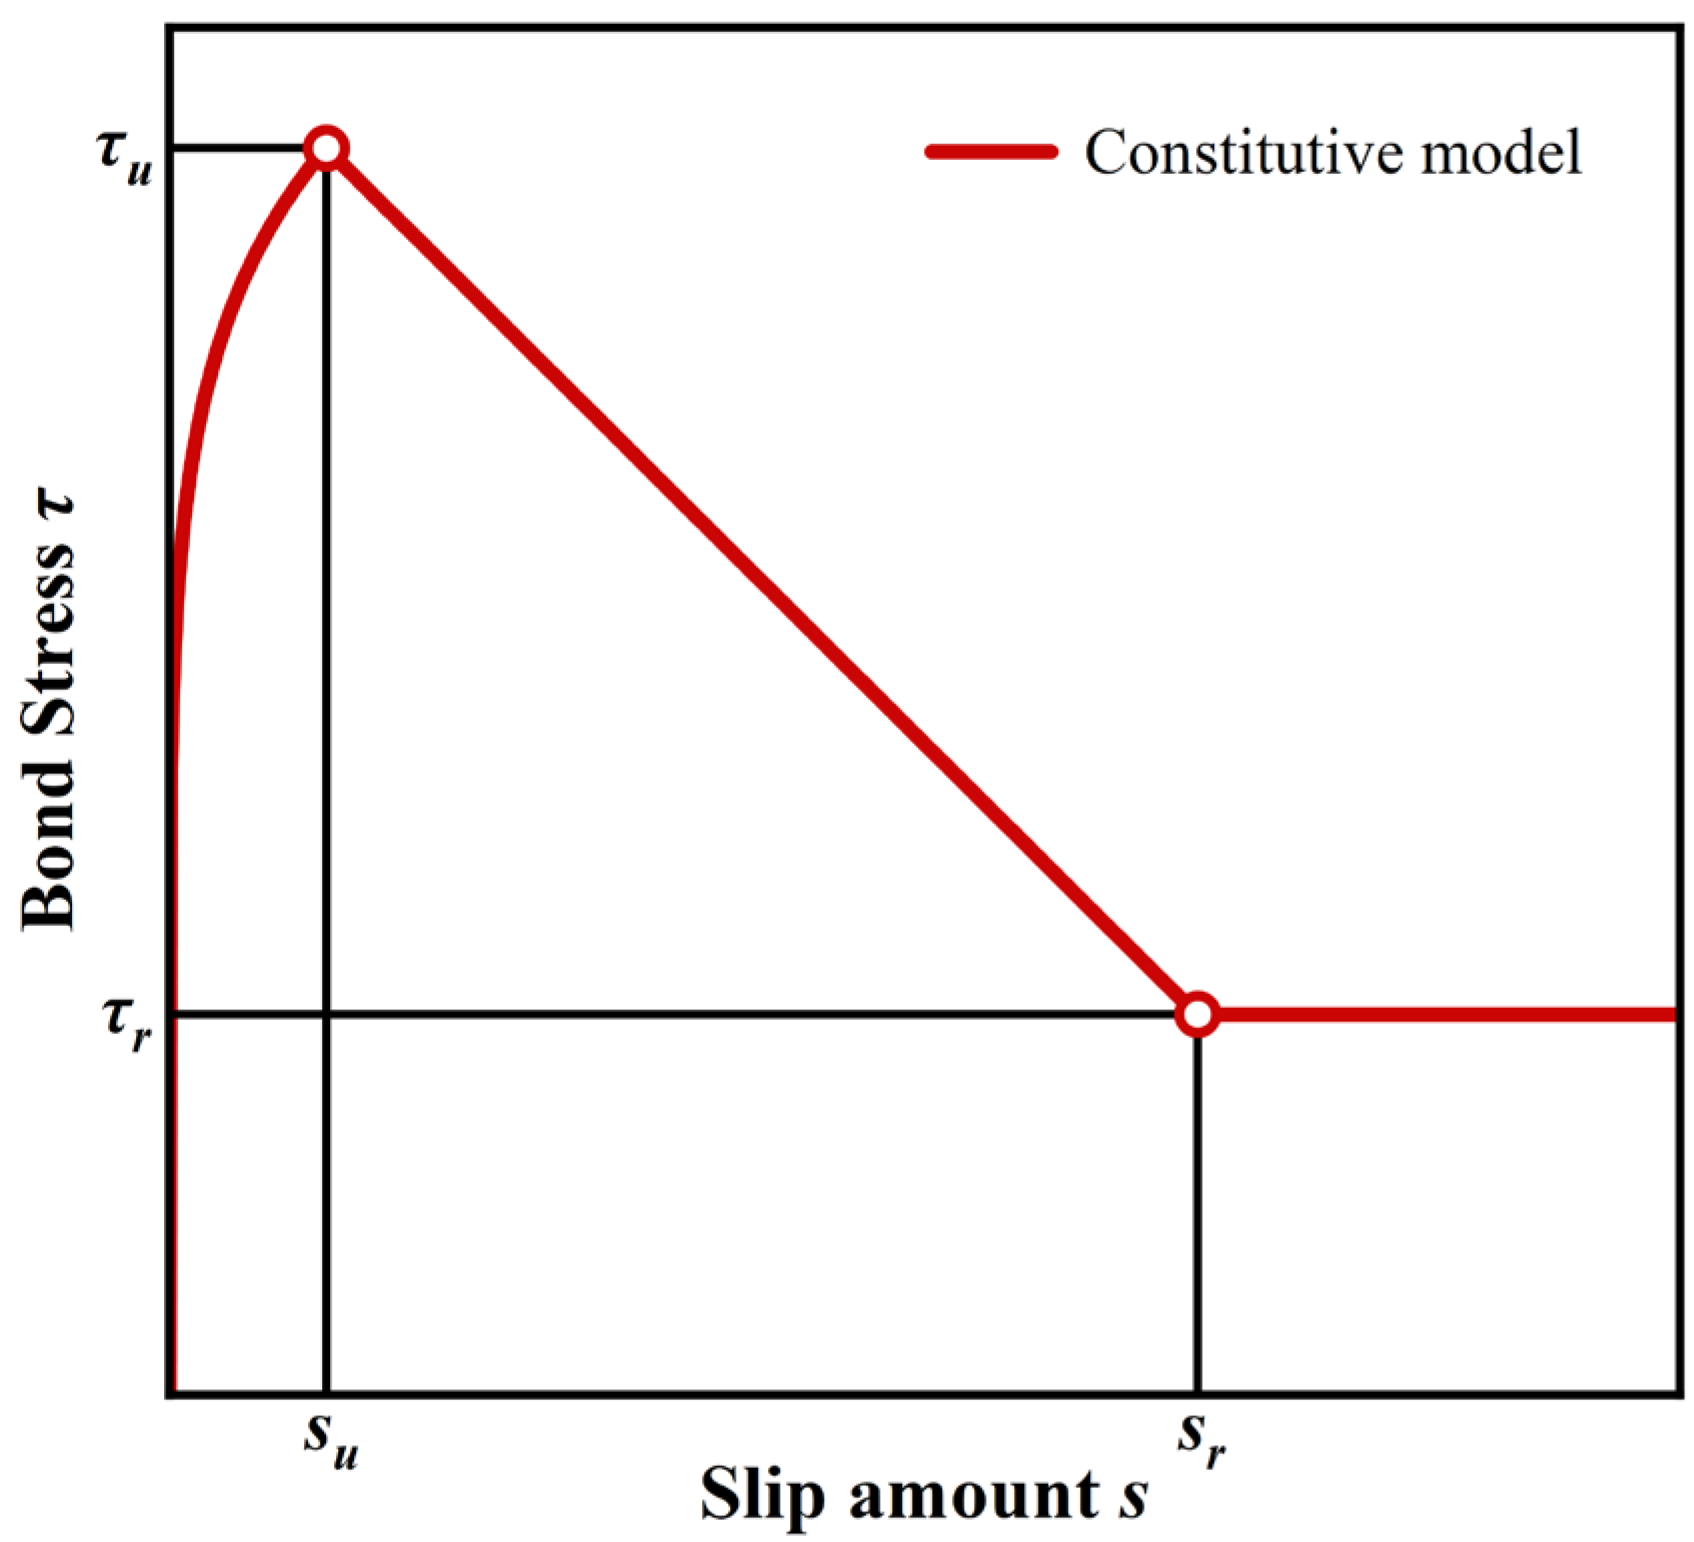
- Micro-slip stage (O–A): At the initial loading phase, the bond section at the free end experienced stress, resulting in a minor slip value. The slope of the τ-s curve was relatively steep and remained largely unchanged. During this phase, bond stresses were primarily provided by chemical bonding at the steel rebar-concrete interface;
- (2)
- Slip stage (A–B): Loading progressed, and as the bond stress approached approximately 8 MPa, the slip rate notably accelerated. The curve’s slope decreased, displaying nonlinear characteristics. When the bond stress reached 17.35 MPa, the slope of the curve was close to 0. The bond stress at this time was τu, and the corresponding su was 1.74 mm. During this stage, chemical bonding between steel rebar and concrete diminished, with bond stress mainly provided by mechanical occlusal and frictional forces. Concrete in front of the transverse rib experienced compression, accumulating damage and reducing bond stiffness, resulting in a nonlinear increase in the τ-s curve;
- (3)
- Decline stage (B–C): The post-peak load slip value continued to increase, causing progressive crushing of concrete around the steel rebar rib. This led to a decline in mechanical occlusion force, resulting in a steady decrease in bond stress;
- (4)
- Residual bond stress stage (C–D): Further loading led to a decrease in bond stress to 4.92 MPa, at which point concrete between the transverse ribs was sheared completely. The τ-s curve transitioned to the residual bond stress stage, where bond stress was solely provided by friction force. Bond stress stabilized at this point, with 4.92 MPa recorded as τr, corresponding to sr of 9.13 mm.
4. Analysis of Influencing Factors
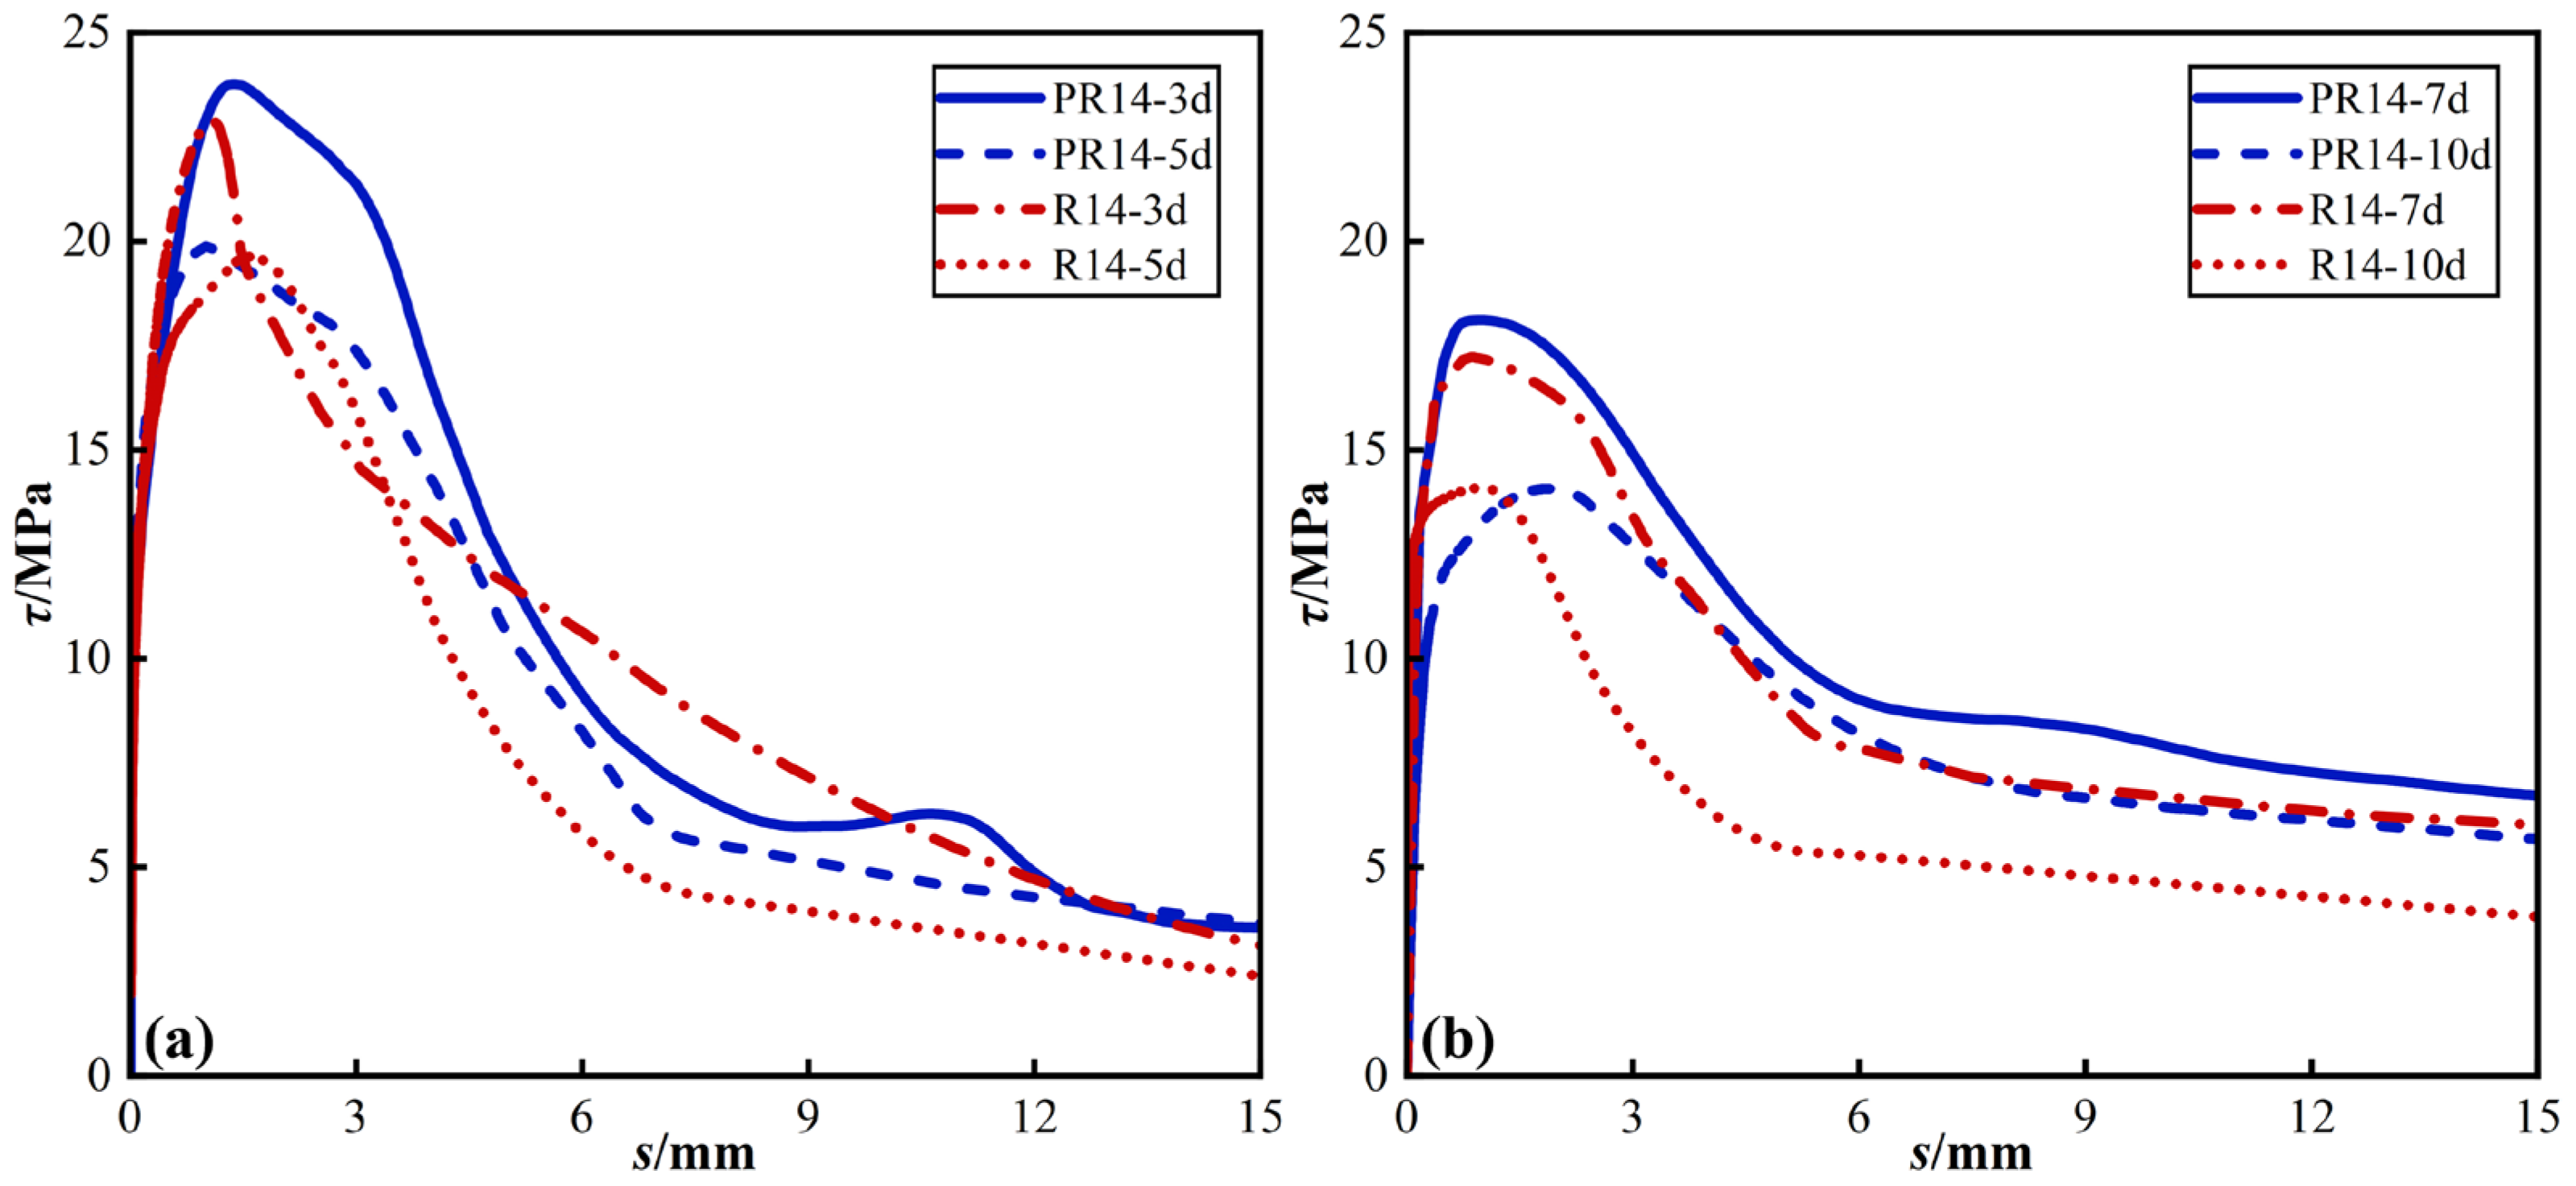
4.1. Effect of Fine Aggregate Type
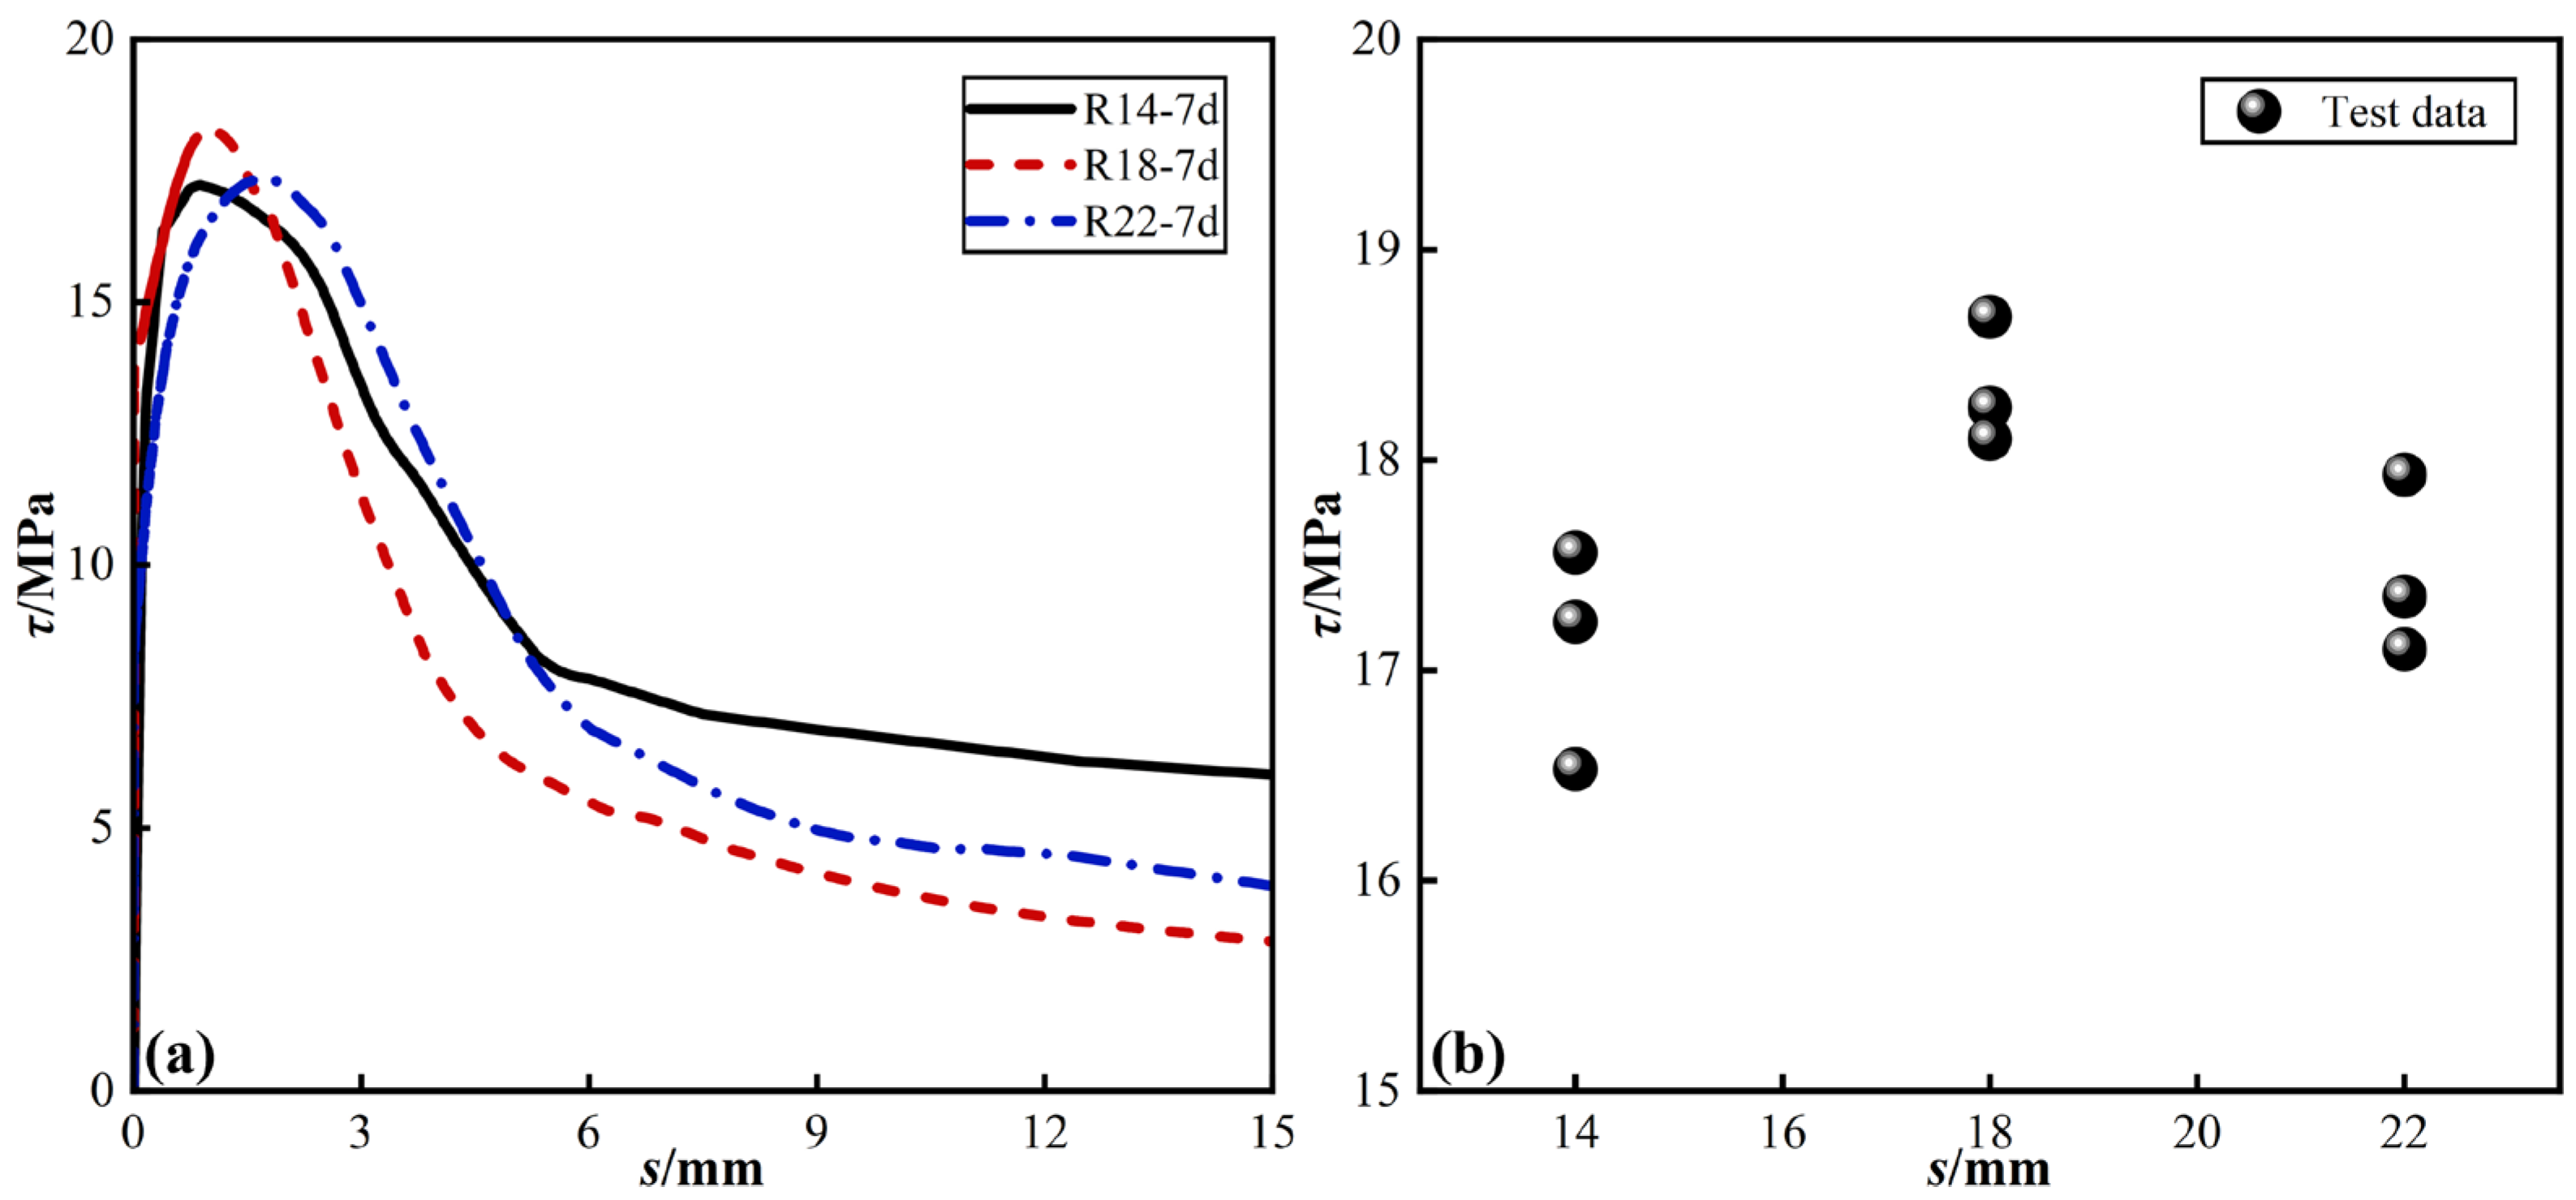
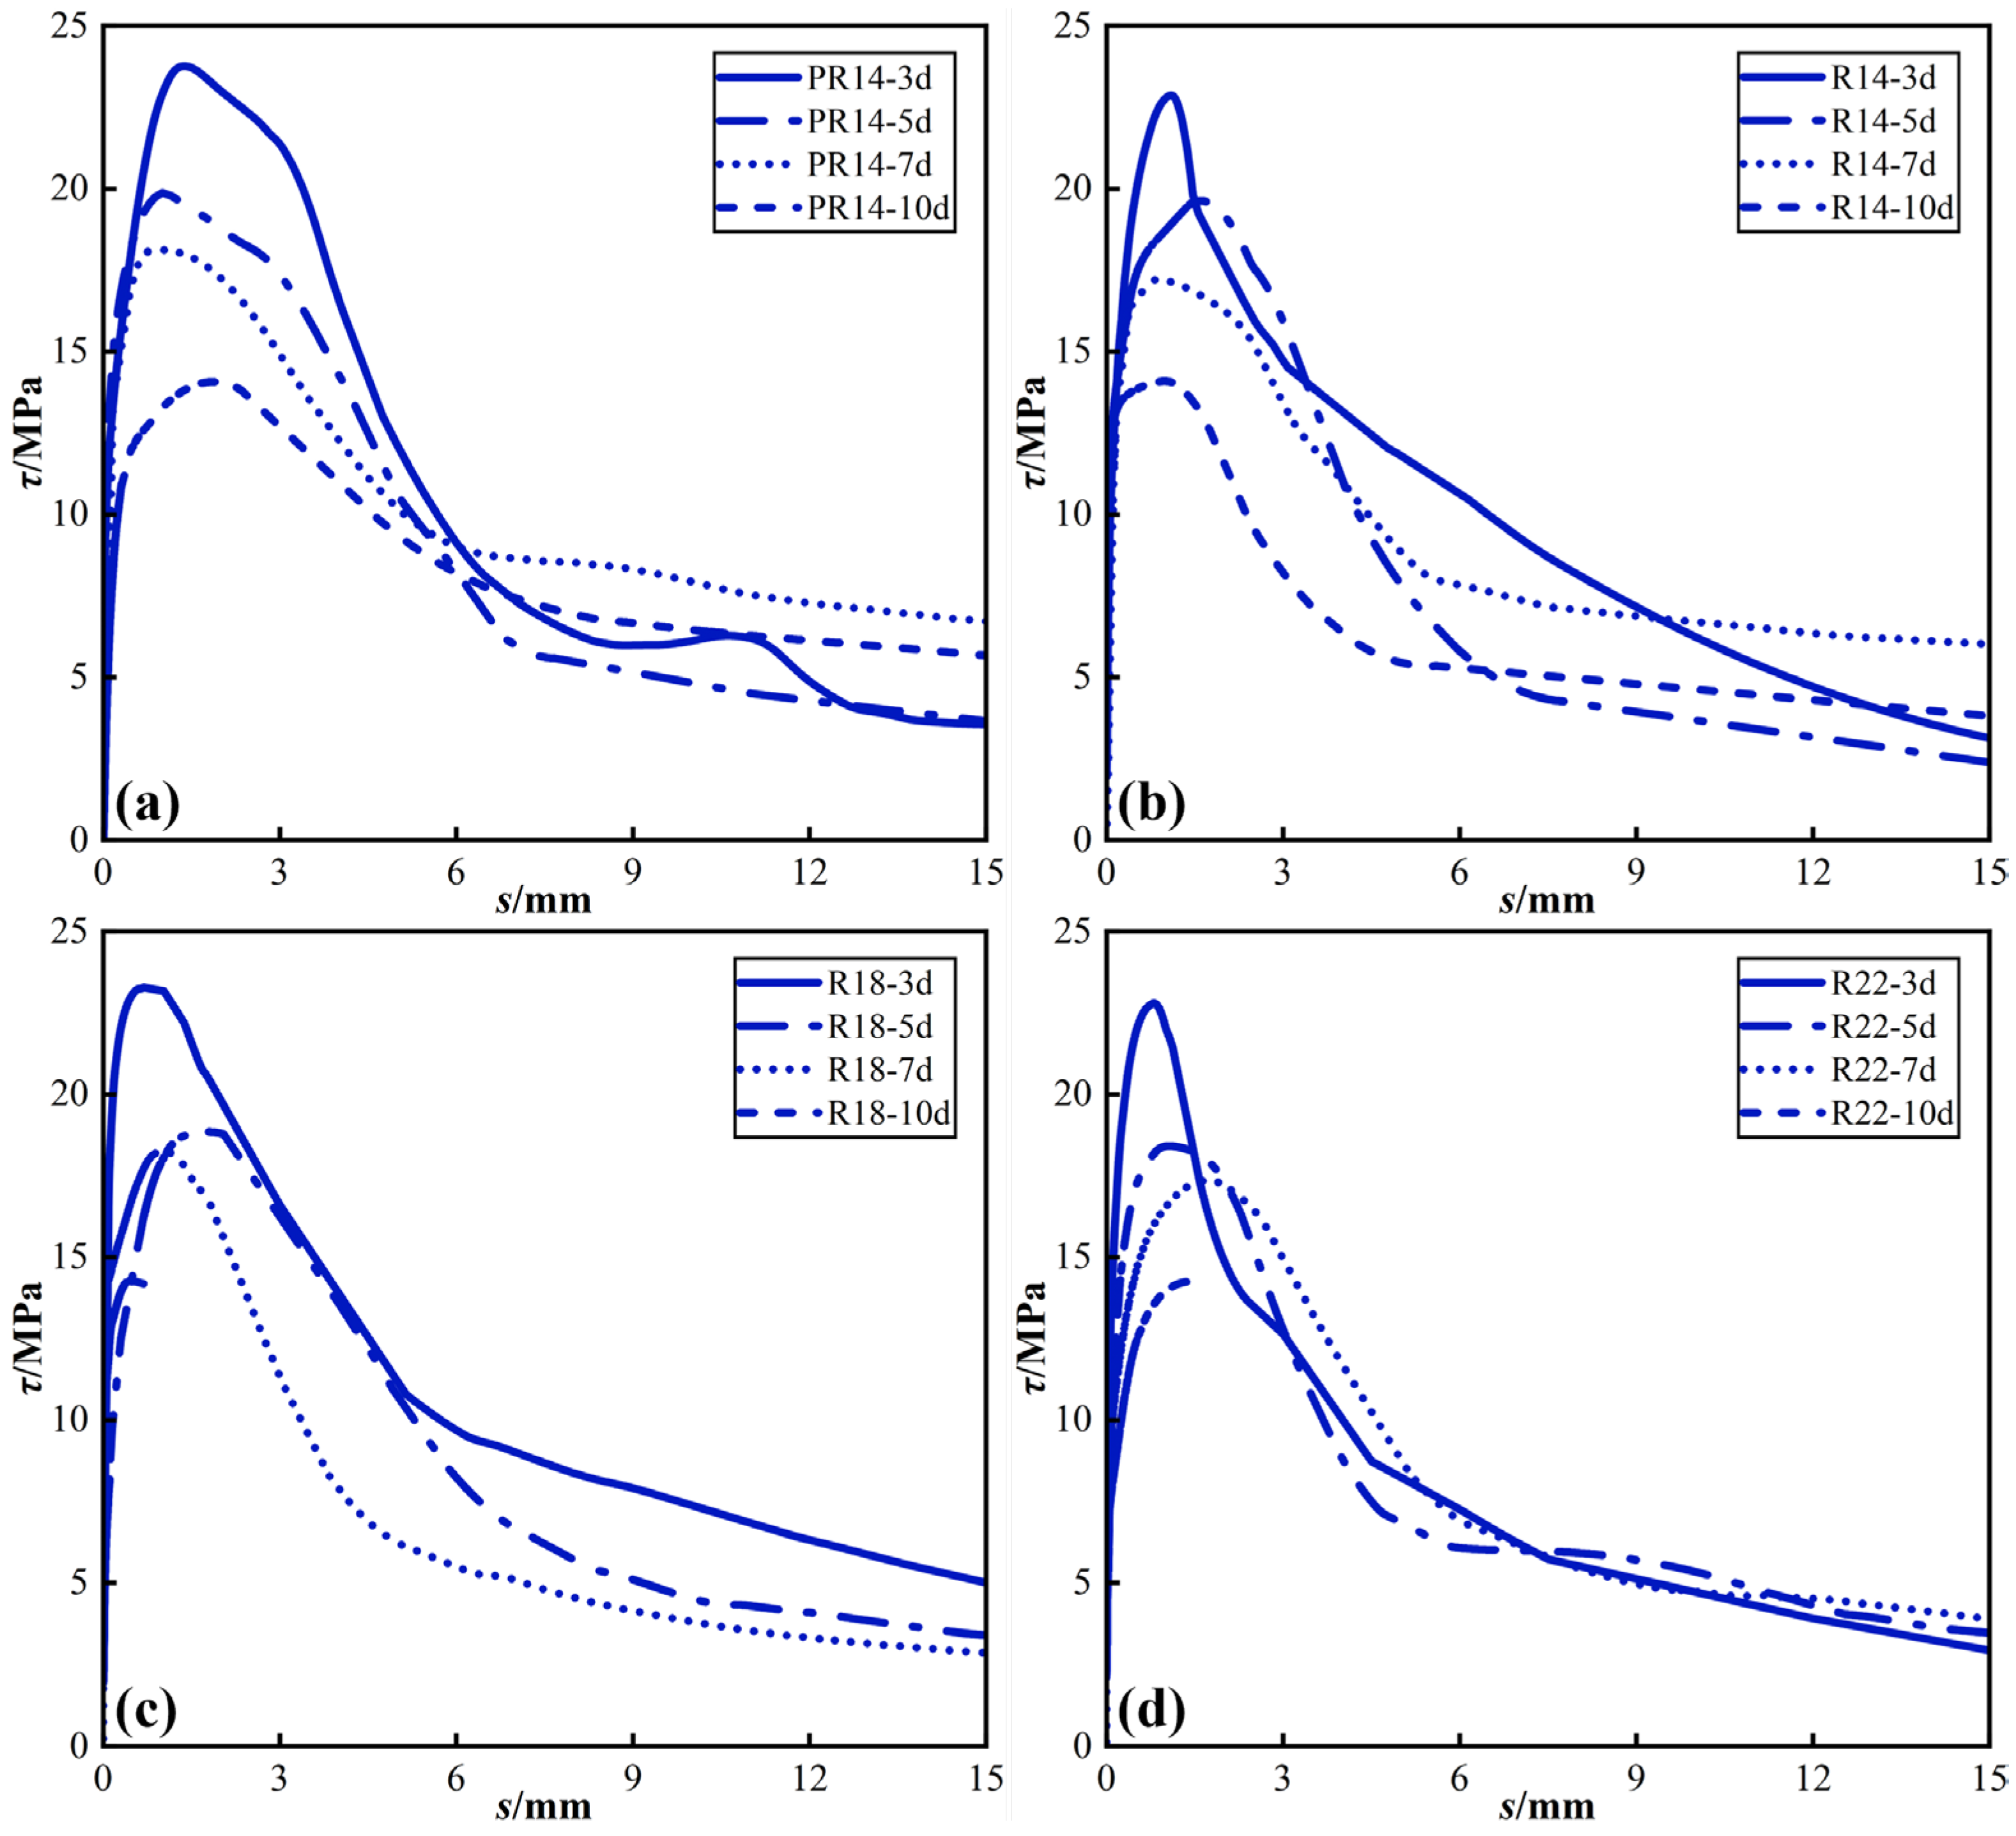
4.2. Effect of the Steel Rebar Diameter
- (1)
- There is no discernible pattern in the effect of d on τu;
- (2)
- The τu of R18-7d is the highest. Additionally, the τ-s curves of the R14-7d reach the stage of residual bond stress the earliest, implying that sr of R14-7d is the smallest. This can be attributed to the relatively small spacing of the transverse ribs of the C14 steel rebar, causing the concrete between the ribs to shear earlier. Zeng et al. [30], in their study on the shear performance of ultra-high performance concrete between transverse ribs of rebar, also reached this conclusion.
4.3. Effect of the Anchorage Length
- (1)
- The τu of R22-5d, R22-7d, and R22-10d amounts to 80.8%, 76.1%, and 62.5% of that of R22-3d, respectively, indicating a decreasing trend. This decrease can be attributed to the increase in anchorage length of the steel rebar, leading to non-uniform distribution of bond stress and subsequently reducing the average bond stress. S. Khaksefidi et al. [31] and A. Das et al. [32] also reported similar findings in their respective studies;
- (2)
- The τr of R22-3d, R22-5d, and R22-7d measures 4.01 MPa, 4.05 MPa, and 4.92 MPa, respectively, displaying an increasing trend. This trend stems from the fact that the τr of specimens with longer anchorage lengths is derived from a combination of residual occlusal force and friction, whereas the τr of specimens with shorter anchorage lengths is solely provided by friction.
5. τ-s Constitutive Model
5.1. BPE Model
5.2. Modeling Amendments
5.2.1. Ultimate Bonding Stress τu
5.2.2. Residual Bonding Stress τr
5.2.3. Characteristic Slip Value
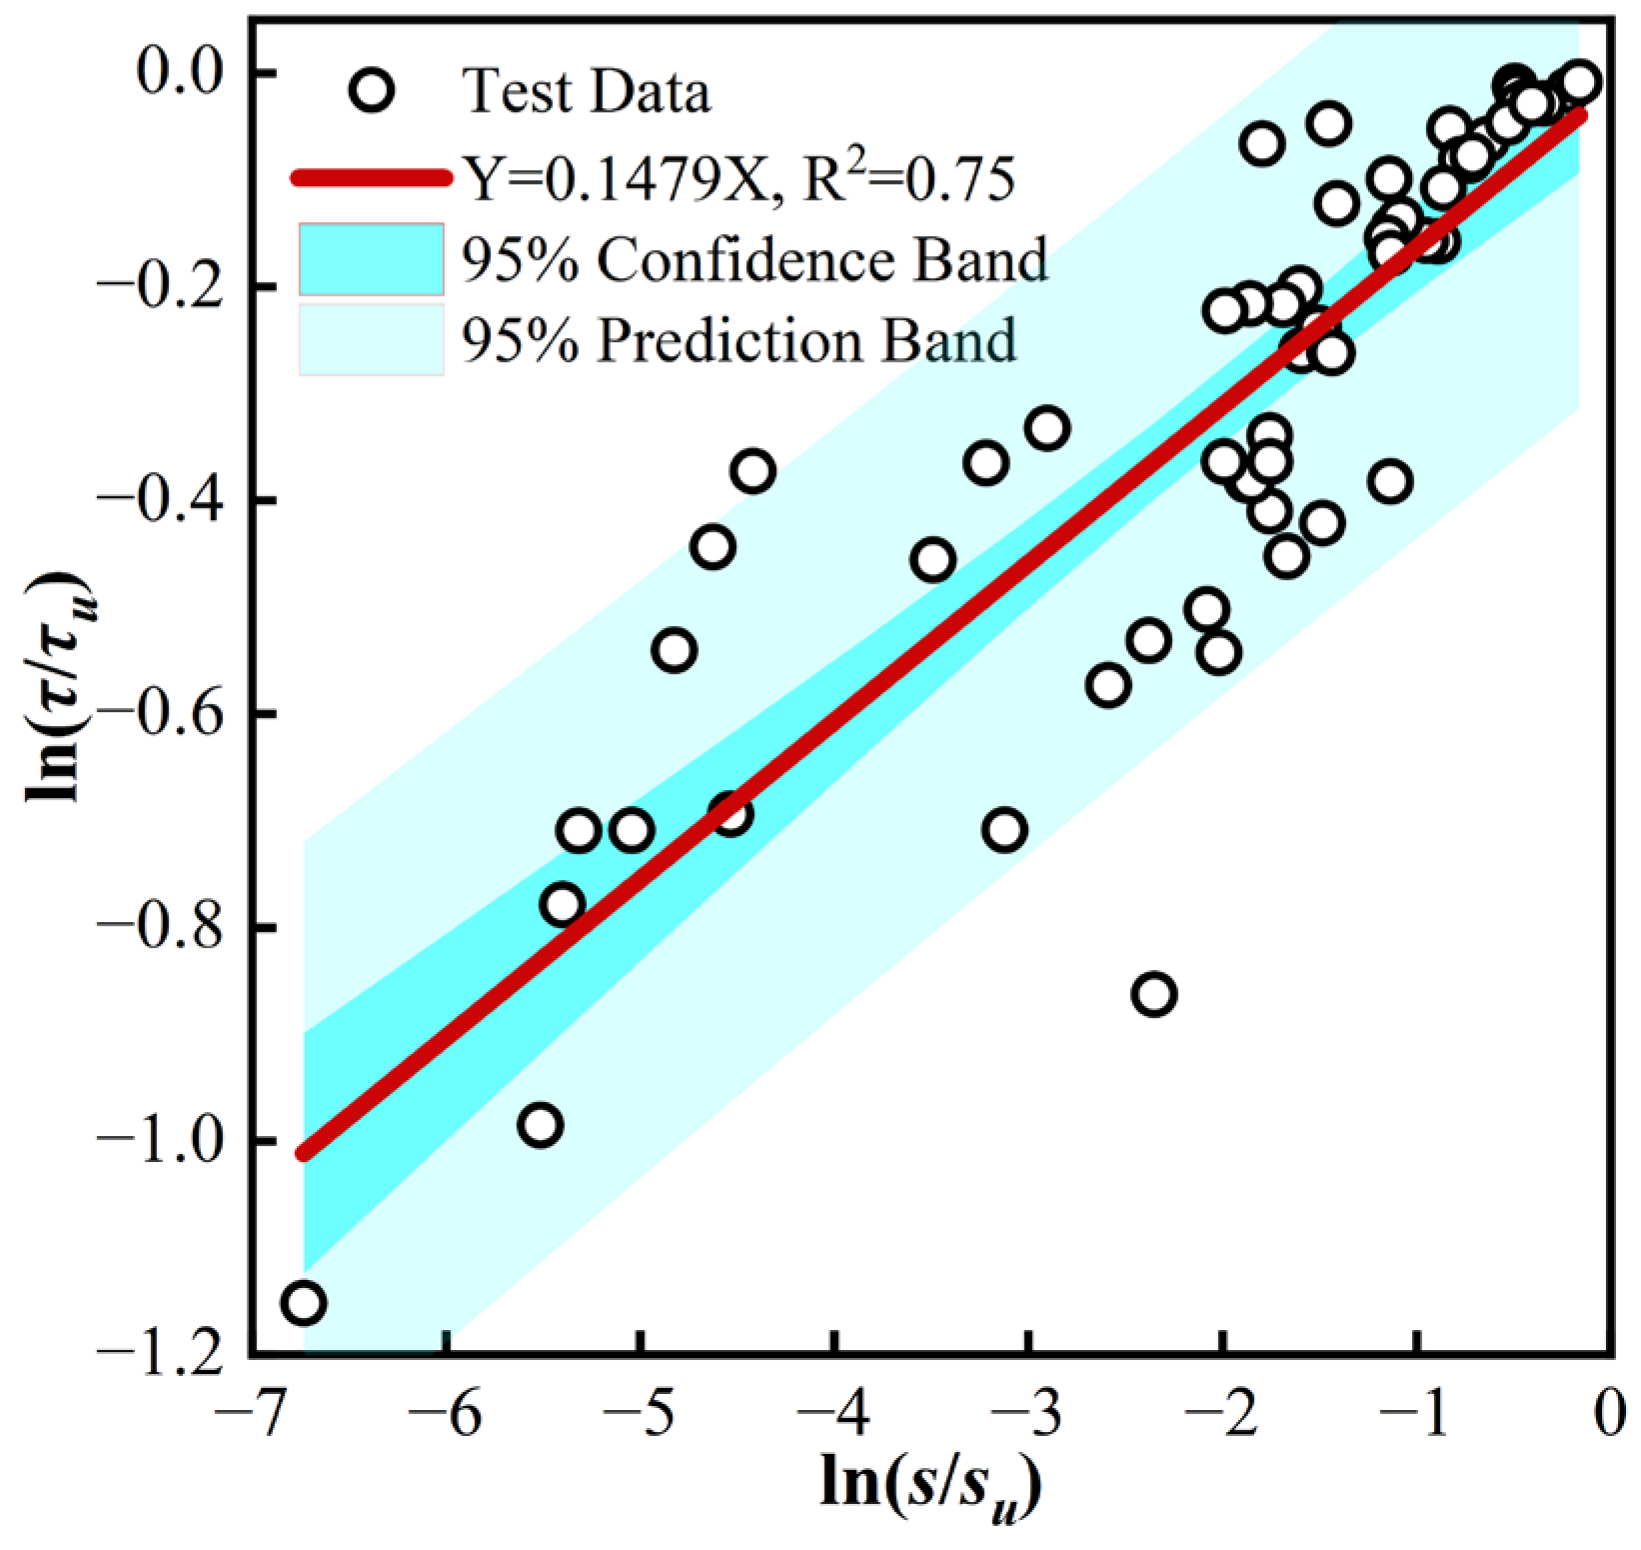
5.2.4. Shape Parameter α
5.2.5. Validation of the Constitutive Model
6. Conclusions
- (1)
- Two distinct damage modes were observed in the bond-slip tests: steel rebar pull-out and concrete splitting. Steel rebar pull-out predominantly occurred in specimens with smaller bond areas between the steel rebar and concrete, while concrete splitting typically manifested in specimens featuring larger steel rebar diameters and bond lengths;
- (2)
- The substitution of manufactured sand with CGS at a 25% replacement rate exhibited negligible impact on the concrete strength and did not significantly alter the bond stress between concrete and steel rebar;
- (3)
- An increase in the anchorage length of the steel rebar resulted in an uneven distribution of bond stress, consequently leading to a decrease in the ultimate bond stress (τu). Moreover, the effect of steel rebar diameter on τu was found to be insignificant;
- (4)
- This paper proposed a bond stress calculation formula for CGS concrete that incorporated a correction factor for relative protective layer thickness. The calculated values obtained using this formula align well with the experimental values;
- (5)
- Based on the bond-slip test results of specimens with different types of fine aggregates, steel rebar diameters, and anchorage lengths, the bond-slip curves were simplified into three segments: the rising section, the falling section, and the residual bond stress section. Based on the BPE constitutive model, the calculated values of ultimate bond stress, residual bond stress, characteristic slip values, and shape parameters were obtained. After comparing the modified constitutive model with the test curves, it was found that they aligned well. The establishment of this bond-slip constitutive model has advanced the resource utilization of solid waste CGS in reinforced concrete structures.
Author Contributions
Funding
Data Availability Statement
Conflicts of Interest
References
- Fayed, S.; Madenci, E.; Özkiliç, Y.O.; Mansour, W. Improving bond performance of ribbed steel bars embedded in recycled aggregate concrete using steel mesh fabric confinement. Constr. Build. Mater. 2023, 369, 130452. [Google Scholar] [CrossRef]
- Zhao, D.; Pan, J.; Zhou, Y.; Sui, L.; Ye, Z. New types of steel-FRP composite bar with round steel bar inner core: Mechanical properties and bonding performances in concrete. Constr. Build. Mater. 2020, 242, 118062. [Google Scholar] [CrossRef]
- Romanazzi, V.; Leone, M.; Aiello, M.; Pecce, M. Bond behavior of geopolymer concrete with steel and GFRP bars. Compos. Struct. 2022, 300, 116150. [Google Scholar] [CrossRef]
- de Melo, F.M.C.; Cruz, A.C.A.d.J.; Netto, L.D.d.S.; Simplício, M.A.d.S. Experimental study of bond between steel bars and hybrid fibers reinforced concrete. Constr. Build. Mater. 2021, 275, 122176. [Google Scholar] [CrossRef]
- Zheng, Y.; Zheng, S.-S.; Yang, L.; Dong, L.-G.; Zhang, Y.-B. Experimental study and analytical model of the bond behavior of corroded reinforcing steel bars in concrete. Constr. Build. Mater. 2022, 327, 126991. [Google Scholar] [CrossRef]
- Liang, R.; Huang, Y.; Xu, Z. Experimental and Analytical Investigation of Bond Behavior of Deformed Steel Bar and Ultra-High Performance Concrete. Buildings 2022, 12, 460. [Google Scholar] [CrossRef]
- CEB FIB MC90. Model Code for Concrete Structures; International Federation for Structural Concrete: Lausanne, Switzerland, 2010. [Google Scholar]
- Eligehausen, R.; Popov, E.P.; Berteor, V.V. Local Bond Stress-Slip Relationships of Deformed Bars under Generalized Excitations; University of California: Alexandria, VA, USA, 1983. [Google Scholar]
- Xu, Y. A simplified model for the constitutive relationship of reinforced concrete. Eng. Mech. 1997, 14, 34–38. [Google Scholar]
- Guo, F.; Chen, L.; Li, Y.; Zhu, Y.; Jia, W.; Guo, Y.; Guo, S.; Zhang, Y.; Wu, J. Review on the attribute cognition and carbon-ash-water separation of coal gasification fine slag. Sep. Purif. Technol. 2023, 320, 124121. [Google Scholar] [CrossRef]
- Dobiszewska, M.; Bagcal, O.; Beycioğlu, A.; Goulias, D.; Köksal, F.; Płomiński, B.; Ürünveren, H. Utilization of rock dust as cement replacement in cement composites: An alternative approach to sustainable mortar and concrete productions. J. Build. Eng. 2023, 69, 106180. [Google Scholar] [CrossRef]
- Wu, F.; Li, H.; Yang, K. Effects of Mechanical Activation on Physical and Chemical Characteristics of Coal-Gasification Slag. Coatings 2021, 11, 902. [Google Scholar] [CrossRef]
- Dai, G.; Zheng, S.; Wang, X.; Bai, Y.; Dong, Y.; Du, J.; Sun, X.; Tan, H. Combustibility analysis of high-carbon fine slags from an entrained flow gasifier. J. Environ. Manag. 2020, 271, 111009. [Google Scholar] [CrossRef] [PubMed]
- Ren, L.; Ding, L.; Guo, Q.; Gong, Y.; Yu, G.; Wang, F. Characterization, carbon-ash separation and resource utilization of coal gasification fine slag: A comprehensive review. J. Clean. Prod. 2023, 398, 136554. [Google Scholar] [CrossRef]
- Li, J.; Fan, S.; Zhang, X.; Chen, Z.; Qiao, Y.; Yuan, Z.; Li, Z. Investigation on co-combustion of coal gasification fine ash and raw coal blends: Thermal conversion, gas pollutant emission and kinetic analyses. Energy 2022, 246, 123368. [Google Scholar] [CrossRef]
- Fang, K.; Zhang, D.; Wang, D.; Liu, Z.; Zhang, M.; Zhang, S. The impact of coal gasification slag powder on fluidity, rheology and viscoelasticity properties of fresh cement paste. J. Build. Eng. 2023, 69, 106237. [Google Scholar] [CrossRef]
- Fu, B.; Cheng, Z.; Wang, D.; Li, N. Investigation on the utilization of coal gasification slag in Portland cement: Reaction kinetics and microstructure. Constr. Build. Mater. 2022, 323, 126587. [Google Scholar] [CrossRef]
- Guo, F.; Guo, Y.; Chen, L.; Jia, W.; Zhu, Y.; Li, Y.; Wang, H.; Yao, X.; Zhang, Y.; Wu, J. Multitudinous components recovery, heavy metals evolution and environmental impact of coal gasification slag: A review. Chemosphere 2023, 338, 139473. [Google Scholar] [CrossRef]
- Zhu, Z.; Lian, X.; Zhai, X.; Li, X.; Guan, M.; Wang, X. Mechanical Properties of Ultra-High Performance Concrete with Coal Gasi-fication Coarse Slag as River Sand Replacement. Materials 2022, 15, 7552. [Google Scholar] [CrossRef]
- Tian, Y.; Wang, Y.; Chai, H.; Zhao, L.; Sun, H.; Zhang, H. Study on the properties and interfacial transition zone of coal gasification slag aggregate and mineral powder geopolymer mortar. Constr. Build. Mater. 2024, 414, 134864. [Google Scholar] [CrossRef]
- Ganesan, H.; Sachdeva, A.; Petrounias, P.; Lampropoulou, P.; Sharma, P.K.; Kumar, A. Impact of Fine Slag Aggregates on the Final Durability of Coal Bottom Ash to Produce Sustainable Concrete. Sustainability 2023, 15, 6076. [Google Scholar] [CrossRef]
- Hamada, H.; Alattar, A.; Tayeh, B.; Yahaya, F.; Adesina, A. Sustainable application of coal bottom ash as fine aggregates in concrete: A comprehensive review. Case Stud. Constr. Mater. 2022, 16, e01109. [Google Scholar] [CrossRef]
- Li, H.; Nie, Q.; Wang, C.; Wang, G.; Zhang, L.; Yuan, L. Durability investigation of fractured coal-gasified ash slag concrete eroded by sulfate and chlorine salts. Case Stud. Constr. Mater. 2024, 20, e02745. [Google Scholar] [CrossRef]
- GB/T 228.1; Metallic Materials-Tensile Testing-Part 1: Method of Test at Room Temperature. Standards Press of China: Bejing, China, 2021.
- GB/T 50081; Standard for Test Methods of Concrete Physical and Mechanical Properties. Standards Press of China: Bejing, China, 2019.
- GB/T 50152; Standard for Test Method of Concrete Structures. Standards Press of China: Bejing, China, 2012.
- Jiradilok, P.; Wang, Y.; Nagai, K.; Matsumoto, K. Development of discrete meso-scale bond model for corrosion damage at steel-concrete interface based on tests with/without concrete damage. Constr. Build. Mater. 2020, 236, 117615. [Google Scholar] [CrossRef]
- Burdziński, M.; Niedostatkiewicz, M. Experimental-Numerical Analysis of the Effect of Bar Diameter on Bond in Pull-Out Test. Buildings 2022, 12, 1392. [Google Scholar] [CrossRef]
- Zhou, W.; Feng, P.; Lin, H.; Zhou, P. Bond behavior between GFRP bars and coral aggregate concrete. Compos. Struct. 2023, 306, 116567. [Google Scholar] [CrossRef]
- Zeng, X.; Wang, P.; You, X. Shear performance of interface between ultra-high performance concrete and normal concrete treated with ribs. Structures 2024, 60, 105867. [Google Scholar] [CrossRef]
- Khaksefidi, S.; Ghalehnovi, M.; de Brito, J. Bond behaviour of high-strength steel rebars in normal (NSC) and ultra-high per-formance concrete (UHPC). J. Build. Eng. 2021, 33, 101592. [Google Scholar] [CrossRef]
- Das, A.; Bošnjak, J.; Sharma, A. Post-fire bond behaviour of reinforcement in concrete considering different bonded lengths and position of rebars. Eng. Struct. 2023, 296, 116908. [Google Scholar] [CrossRef]
- Harajli, M. Bond stress–slip model for steel bars in unconfined or steel, FRC, or FRP confined concrete under cyclic loading. J. Struct. Eng. 2009, 135, 509–518. [Google Scholar] [CrossRef]
- Cosenza, E.; Manfredi, G.; Realfonzo, R. Behavior and Modeling of Bond of FRP Rebars to Concrete. J. Compos. Constr. 1997, 1, 40–51. [Google Scholar] [CrossRef]
- Yan, F.; Lin, Z. Bond behavior of GFRP bar-concrete interface: Damage evolution assessment and FE simulation imple-men-tations. Compos. Struct. 2016, 155, 63–76. [Google Scholar] [CrossRef]
- Bhanugoban, M.; Yapa, H.D.; Dirar, S. Efficient shear retrofitting of reinforced concrete beams using prestressed deep embedded bars. Eng. Struct. 2021, 246, 113053. [Google Scholar] [CrossRef]
- Shen, D.; Li, C.; Feng, Z.; Wen, C.; Ojha, B. Influence of strain rate on bond behavior of concrete members reinforced with basalt fiber-reinforced polymer rebars. Constr. Build. Mater. 2019, 228, 116755. [Google Scholar] [CrossRef]
- Xu, Y.; Shao, Z.; Shen, W. Bond strength berween steel rebars and concrete. Build. Sci. 1988, 4, 8–14. [Google Scholar]
- Zhang, H.; Pan, H.; Shi, Y.; Zhou, M.; Wang, D. Influence of fly ash slag substitution of fine aggregate on strength and frost re-sistance of mortar concrete. Bull. Chin. Ceram. Soc. 2022, 41, 433–449. [Google Scholar]
- GB/T 50010; Code for Design of Concrete Structures. Standards Press of China: Bejing, China, 2010.
- Liu, X.; Liu, Y.; Wu, T.; Wei, H. Bond-slip properties between lightweight aggregate concrete and rebar. Constr. Build. Mater. 2020, 255, 119355. [Google Scholar] [CrossRef]
- Lin, H.; Zhao, Y.; Ozbolt, J.; Feng, P.; Jiang, C.; Eligehausen, R. Analytical model for the bond stress-slip relationship of de-formed bars in normal strength concrete. Constr. Build. Mater. 2019, 198, 570–586. [Google Scholar] [CrossRef]
- Wang, B.; Zhu, E.; Zhang, Z.; Zhu, C. Bond-slip behaviour of lightweight aggregate concrete based on virtual crack model with exponential softening characteristics. Constr. Build. Mater. 2022, 345, 128349. [Google Scholar] [CrossRef]
- Chang, Y.; Qin, S.; Huang, M.; Hu, D.; Yang, H.; Li, S. Analytical model of the bond stress-slip relationship for reinforced concrete due to splitting failure. Constr. Build. Mater. 2021, 287, 123025. [Google Scholar] [CrossRef]


| Material | Specific Gravity | Setting Time/min | Compressive Strength/MPa | Flexural Strength/MPa | |||
|---|---|---|---|---|---|---|---|
| Initial | Final | 3 days | 28 days | 3 days | 28 days | ||
| Cement | 3.2 | 203 | 250 | 32.5 | 56.4 | 5.9 | 8.4 |
| Materials | Chemical Composition/Mass% | |||||||||||||
|---|---|---|---|---|---|---|---|---|---|---|---|---|---|---|
| CaO | SiO2 | Al2O3 | MgO | SO3 | Fe2O3 | K2O | TiO2 | Na2O | Cl- | SrO | MnO | P2O5 | LOI * | |
| Cement | 54.03 | 22.41 | 6.11 | 5.29 | 3.53 | 2.72 | 1.19 | 0.33 | 0.29 | 0.09 | 0.06 | 0.09 | 0.04 | 3.82 |
| CGS | 21.10 | 38.34 | 16.03 | 1.32 | 3.01 | 12.92 | 0.92 | 0.74 | 1.27 | 0.15 | 0.30 | 0.22 | 0.18 | 3.50 |
| Fine Aggregates | Apparent Density/kg·m−3 | Bulk Density/kg·m−3 | Clay Content/% | 24-h Water Absorption/% |
|---|---|---|---|---|
| manufactured sand | 2652 | 1796 | 1.1 | 2.3 |
| CGS | 2083 | 1135 | - | 4.2 |
| Coarse Aggregate | Crush Index/% | Apparent Density/kg·m−3 | Clay Content/% | 24-h Water Absorption/% |
|---|---|---|---|---|
| crushed stone | 8.3 | 2776 | 0.8 | 1.1 |
| Nominal Diameter/mm | Yield Strength/MPa | Ultimate Tensile Strength/MPa | Elastic Modulus/MPa |
|---|---|---|---|
| 14 | 461 | 575 | 1.95 × 10⁵ |
| 18 | 453 | 582 | 1.94 × 10⁵ |
| 22 | 479 | 631 | 1.95 × 10⁵ |
| Concrete Type | Raw Materials/kg·m−3 | ||||
|---|---|---|---|---|---|
| Cement | CGS | Manufactured Sand | Crushed Stone | Water | |
| PR * | 486.3 | 0 | 601.7 | 1024.9 | 243.2 |
| R | 486.3 | 150.6 | 451.4 | 1024.9 | 243.2 |
| Specimen NO. | d/mm | la/mm | Specimen Size |
|---|---|---|---|
| R14-3d * | 14 | 42 | a ** |
| R14-5d | 14 | 70 | a |
| R14-7d | 14 | 98 | a |
| R14-10d | 14 | 140 | a |
| R18-3d | 18 | 54 | a |
| R18-5d | 18 | 90 | a |
| R18-7d | 18 | 126 | a |
| R18-10d | 18 | 180 | a |
| R22-3d | 22 | 66 | a |
| R22-5d | 22 | 110 | a |
| R22-7d | 22 | 154 | a |
| R22-10d | 22 | 220 | b |
| PR14-3d | 14 | 42 | a |
| PR14-5d | 14 | 70 | a |
| PR14-7d | 14 | 98 | a |
| PR14-10d | 14 | 140 | a |
| Specimen NO. | fcu/MPa | Fu/kN | τu/MPa | su/mm | τr/MPa | sr/mm | Damage Mode * |
|---|---|---|---|---|---|---|---|
| R14-3d | 45.94 | 42.25 | 22.87 | 1.11 | 4.55 | 12.25 | P |
| R14-5d | 45.94 | 60.44 | 19.63 | 1.62 | 4.34 | 7.47 | P |
| R14-7d | 45.94 | 74.27 | 17.23 | 0.88 | 7.16 | 7.50 | P |
| R14-10d | 45.94 | 86.75 | 14.09 | 0.99 | 5.29 | 7.13 | P |
| R18-3d | 45.94 | 71.06 | 23.27 | 0.69 | 9.30 | 6.51 | P |
| R18-5d | 45.94 | 95.93 | 18.85 | 1.74 | 4.33 | 10.78 | P |
| R18-7d | 45.94 | 130.03 | 18.25 | 0.98 | 3.56 | 10.90 | P |
| R18-10d | 45.94 | 145.45 | 14.29 | 0.46 | - | - | S |
| R22-3d | 45.94 | 103.92 | 22.79 | 0.81 | 4.01 | 11.74 | P |
| R22-5d | 45.94 | 139.99 | 18.42 | 1.06 | 4.05 | 12.51 | P |
| R22-7d | 45.94 | 184.60 | 17.35 | 1.74 | 4.92 | 9.13 | P |
| R22-10d | 45.94 | 216.45 | 14.24 | 1.38 | - | - | S |
| PR14-3d | 46.30 | 43.91 | 23.77 | 1.38 | 6.03 | 8.58 | P |
| PR14-5d | 46.30 | 60.90 | 19.78 | 1.16 | 6.59 | 7.67 | P |
| PR14-7d | 46.30 | 78.06 | 18.11 | 0.96 | 8.72 | 6.63 | P |
| PR14-10d | 46.30 | 86.57 | 14.06 | 1.89 | 6.59 | 9.32 | P |
| Specimen NO. | fcu/MPa | c/mm | d/mm | la/mm | ft/MPa | τu,pred1*/MPa | τu,exp**/MPa | τu,pred1/τu,exp | τu,pred2***/MPa | τu,pred2/τu,exp |
|---|---|---|---|---|---|---|---|---|---|---|
| R14-3d | 45.94 | 93 | 14 | 42 | 3.46 | 24.22 | 22.87 | 1.06 | 20.20 | 0.88 |
| R14-5d | 45.94 | 93 | 14 | 70 | 3.46 | 21.63 | 19.63 | 1.10 | 18.04 | 0.92 |
| R14-7d | 45.94 | 93 | 14 | 98 | 3.46 | 20.51 | 17.23 | 1.19 | 17.11 | 0.99 |
| R14-10d | 45.94 | 93 | 14 | 140 | 3.46 | 19.68 | 14.09 | 1.40 | 16.42 | 1.17 |
| R18-3d | 45.94 | 91 | 18 | 54 | 3.46 | 19.91 | 23.27 | 0.86 | 19.91 | 0.86 |
| R18-5d | 45.94 | 91 | 18 | 90 | 3.46 | 17.78 | 18.85 | 0.94 | 17.78 | 0.94 |
| R18-7d | 45.94 | 91 | 18 | 126 | 3.46 | 16.87 | 18.25 | 0.92 | 16.87 | 0.92 |
| R18-10d | 45.94 | 91 | 18 | 180 | 3.46 | 16.18 | 14.29 | 1.13 | 16.18 | 1.13 |
| R22-3d | 45.94 | 89 | 22 | 66 | 3.46 | 17.17 | 22.79 | 0.75 | 19.62 | 0.86 |
| R22-5d | 45.94 | 89 | 22 | 110 | 3.46 | 15.33 | 18.42 | 0.83 | 17.52 | 0.95 |
| R22-7d | 45.94 | 89 | 22 | 154 | 3.46 | 14.55 | 17.35 | 0.84 | 16.62 | 0.96 |
| R22-10d | 45.94 | 89 | 22 | 220 | 3.46 | 13.95 | 14.24 | 0.98 | 15.94 | 1.12 |
| Average value | - | - | - | - | - | - | - | 1.001 | - | 0.975 |
| Variance | - | - | - | - | - | - | - | 0.034 | - | 0.010 |
| COV **** | - | - | - | - | - | - | - | 0.183 | - | 0.109 |
| Specimen NO. | fcu/MPa | fts/MPa | τu/MPa | su/mm | τr/MPa | sr/mm |
|---|---|---|---|---|---|---|
| R14-3d | 45.94 | 3.35 | 22.87 | 1.11 | 4.55 | 12.25 |
| R14-5d | 45.94 | 3.35 | 19.63 | 1.62 | 4.34 | 7.47 |
| R14-7d | 45.94 | 3.35 | 17.23 | 0.88 | 7.16 | 7.50 |
| R14-10d | 45.94 | 3.35 | 14.09 | 0.99 | 5.29 | 7.13 |
| R18-3d | 45.94 | 3.35 | 23.27 | 0.69 | 9.30 | 6.51 |
| R18-5d | 45.94 | 3.35 | 18.85 | 1.74 | 4.33 | 10.78 |
| R18-7d | 45.94 | 3.35 | 18.25 | 0.98 | 3.56 | 10.90 |
| R18-10d | 45.94 | 3.35 | 14.29 | 0.46 | - | - |
| R22-3d | 45.94 | 3.35 | 22.79 | 0.81 | 4.01 | 11.74 |
| R22-5d | 45.94 | 3.35 | 18.42 | 1.06 | 4.05 | 12.51 |
| R22-7d | 45.94 | 3.35 | 17.35 | 1.74 | 4.92 | 9.13 |
| R22-10d | 45.94 | 3.35 | 14.24 | 1.38 | - | - |
| PR14-3d | 46.30 | 3.37 | 23.77 | 1.38 | 6.03 | 8.58 |
| PR14-5d | 46.30 | 3.37 | 19.78 | 1.16 | 6.59 | 7.67 |
| PR14-7d | 46.30 | 3.37 | 18.11 | 0.96 | 8.72 | 6.63 |
| PR14-10d | 46.30 | 3.37 | 14.06 | 1.89 | 6.59 | 9.32 |
| la/d | Peak Displacement su | Residual Displacement sr | ||
|---|---|---|---|---|
| Average Value | Standard Deviation | Average Value | Standard Deviation | |
| 3 | 0.0515d | 0.0241d | 0.5901d | 0.2613d |
| 5 | 0.0869d | 0.0348d | 0.5670d | 0.0327d |
| 7 | 0.0655d | 0.0125d | 0.5188d | 0.0964d |
| 10 | 0.0530d | 0.0241d | 0.5093d | - |
| Specimen NO. | τ/MPa | τu/MPa | s/mm | su/mm | ln(τ/τu) | ln(s/su) | α |
|---|---|---|---|---|---|---|---|
| R14-3d | 7.23 | 22.87 | 0.00132 | 1.11 | −1.15159 | −6.73448 | 0.17100 |
| R14-3d | 11.43 | 22.87 | 0.01192 | 1.11 | −0.69359 | −4.53390 | 0.15298 |
| R14-3d | 14.55 | 22.87 | 0.20928 | 1.11 | −0.45224 | −1.66844 | 0.27105 |
| R14-3d | 19.54 | 22.87 | 0.45564 | 1.11 | −0.15736 | −0.89041 | 0.17673 |
| R14-3d | 22.51 | 22.87 | 0.89142 | 1.11 | −0.01587 | −0.21930 | 0.07235 |
| R14-5d | 9.66 | 19.63 | 0.00795 | 1.62 | −0.70907 | −5.31701 | 0.13336 |
| R14-5d | 12.60 | 19.63 | 0.01589 | 1.62 | −0.44336 | −4.62449 | 0.09587 |
| R14-5d | 16.05 | 19.63 | 0.32585 | 1.62 | −0.20135 | −1.60374 | 0.12555 |
| R14-5d | 18.45 | 19.63 | 0.85566 | 1.62 | −0.06200 | −0.63831 | 0.09712 |
| R14-5d | 19.47 | 19.63 | 1.37621 | 1.62 | −0.00818 | −0.16309 | 0.05018 |
| R14-7d | 7.91 | 17.23 | 0.00397 | 0.88 | −0.77852 | −5.40116 | 0.14414 |
| R14-7d | 10.43 | 17.23 | 0.10997 | 0.88 | −0.50197 | −2.07971 | 0.24136 |
| R14-7d | 11.77 | 17.23 | 0.13514 | 0.88 | −0.38110 | −1.87361 | 0.20340 |
| R14-7d | 13.29 | 17.23 | 0.17885 | 0.88 | −0.25964 | −1.59337 | 0.16295 |
| R14-7d | 16.36 | 17.23 | 0.38415 | 0.88 | −0.05181 | −0.82889 | 0.06251 |
| R14-10d | 8.21 | 14.09 | 0.00795 | 0.99 | −0.54011 | −4.82453 | 0.11195 |
| R14-10d | 9.71 | 14.09 | 0.01192 | 0.99 | −0.37231 | −4.41949 | 0.08424 |
| R14-10d | 13.19 | 14.09 | 0.16424 | 0.99 | −0.06601 | −1.79638 | 0.03674 |
| R14-10d | 13.44 | 14.09 | 0.23180 | 0.99 | −0.04723 | −1.45183 | 0.03253 |
| R14-10d | 13.92 | 14.09 | 0.60399 | 0.99 | −0.01214 | −0.49415 | 0.02456 |
| R18-3d | 13.12 | 23.27 | 0.05189 | 0.69 | −0.57303 | −2.58757 | 0.22145 |
| R18-3d | 15.88 | 23.27 | 0.22159 | 0.69 | −0.38211 | −1.13586 | 0.33640 |
| R18-3d | 18.74 | 23.27 | 0.12762 | 0.69 | −0.21651 | −1.68763 | 0.12829 |
| R18-3d | 21.08 | 23.27 | 0.22019 | 0.69 | −0.09884 | −1.14220 | 0.08653 |
| R18-3d | 22.84 | 23.27 | 0.42635 | 0.69 | −0.01865 | −0.48143 | 0.03874 |
| R18-5d | 7.04 | 18.85 | 0.00701 | 1.74 | −0.98491 | −5.51430 | 0.17861 |
| R18-5d | 9.28 | 18.85 | 0.01122 | 1.74 | −0.70865 | −5.04394 | 0.14050 |
| R18-5d | 12.51 | 18.85 | 0.30000 | 1.74 | −0.40999 | −1.75786 | 0.23323 |
| R18-5d | 16.12 | 18.85 | 0.67038 | 1.74 | −0.15645 | −0.95380 | 0.16403 |
| R18-5d | 18.36 | 18.85 | 1.12477 | 1.74 | −0.02634 | −0.43631 | 0.06037 |
| R18-7d | 12.67 | 18.25 | 0.03927 | 0.98 | −0.36493 | −3.21709 | 0.11343 |
| R18-7d | 14.71 | 18.25 | 0.15264 | 0.98 | −0.21564 | −1.85947 | 0.11597 |
| R18-7d | 15.79 | 18.25 | 0.31954 | 0.98 | −0.14479 | −1.12067 | 0.12920 |
| R18-7d | 16.82 | 18.25 | 0.47403 | 0.98 | −0.08160 | −0.72628 | 0.11235 |
| R18-7d | 17.74 | 18.25 | 0.69306 | 0.98 | −0.02834 | −0.34644 | 0.08181 |
| R18-10d | 9.06 | 14.29 | 0.01402 | 0.46 | −0.45569 | −3.49074 | 0.13054 |
| R18-10d | 10.25 | 14.29 | 0.02524 | 0.46 | −0.33228 | −2.90280 | 0.11447 |
| R18-10d | 11.44 | 14.29 | 0.06311 | 0.46 | −0.22244 | −1.98635 | 0.11199 |
| R18-10d | 12.65 | 14.29 | 0.11220 | 0.46 | −0.12190 | −1.41094 | 0.08640 |
| R18-10d | 13.87 | 14.29 | 0.28750 | 0.46 | −0.02983 | −0.47000 | 0.06347 |
| R22-3d | 9.62 | 22.79 | 0.07716 | 0.81 | −0.86248 | −2.35115 | 0.36683 |
| R22-3d | 13.40 | 22.79 | 0.07501 | 0.81 | −0.53107 | −2.37941 | 0.22319 |
| R22-3d | 15.56 | 22.79 | 0.12725 | 0.81 | −0.38162 | −1.85088 | 0.20618 |
| R22-3d | 17.56 | 22.79 | 0.19020 | 0.81 | −0.26070 | −1.44896 | 0.17992 |
| R22-3d | 21.77 | 22.79 | 0.47684 | 0.81 | −0.04579 | −0.52985 | 0.08642 |
| R22-5d | 9.07 | 18.42 | 0.04670 | 1.06 | −0.70847 | −3.12228 | 0.22691 |
| R22-5d | 10.71 | 18.42 | 0.14074 | 1.06 | −0.54226 | −2.01911 | 0.26856 |
| R22-5d | 12.09 | 18.42 | 0.24008 | 1.06 | −0.42106 | −1.48505 | 0.28353 |
| R22-5d | 13.12 | 18.42 | 0.18280 | 1.06 | −0.33930 | −1.75763 | 0.19304 |
| R22-5d | 16.07 | 18.42 | 0.35896 | 1.06 | −0.13648 | −1.08281 | 0.12604 |
| R22-7d | 12.06 | 17.35 | 0.23743 | 1.74 | −0.36370 | −1.99177 | 0.18260 |
| R22-7d | 13.67 | 17.35 | 0.38578 | 1.74 | −0.23839 | −1.50637 | 0.15825 |
| R22-7d | 14.87 | 17.35 | 0.55003 | 1.74 | −0.15425 | −1.15167 | 0.13393 |
| R22-7d | 16.01 | 17.35 | 0.80567 | 1.74 | −0.08038 | −0.76997 | 0.10439 |
| R22-7d | 16.86 | 17.35 | 1.15800 | 1.74 | −0.02865 | −0.40719 | 0.07036 |
| R22-10d | 9.90 | 14.24 | 0.23842 | 1.38 | −0.36352 | −1.75580 | 0.20704 |
| R22-10d | 10.96 | 14.24 | 0.32849 | 1.38 | −0.26180 | −1.43533 | 0.18240 |
| R22-10d | 12.03 | 14.24 | 0.44505 | 1.38 | −0.16865 | −1.13165 | 0.14903 |
| R22-10d | 12.79 | 14.24 | 0.58280 | 1.38 | −0.10739 | −0.86199 | 0.12458 |
| R22-10d | 13.18 | 14.24 | 0.67684 | 1.38 | −0.07735 | −0.71240 | 0.10858 |
| Specimen NO. | τu/MPa | τr/MPa | su/mm | sr/mm | α |
|---|---|---|---|---|---|
| R14-3d | 20.20 | 5.43 | 0.72 | 8.26 | 0.1479 |
| R14-5d | 18.04 | 5.43 | 1.21 | 7.94 | 0.1479 |
| R14-7d | 17.11 | 5.43 | 0.92 | 7.26 | 0.1479 |
| R14-10d | 16.42 | 5.43 | 0.74 | 7.13 | 0.1479 |
| R18-3d | 19.91 | 5.43 | 0.93 | 10.62 | 0.1479 |
| R18-5d | 17.78 | 5.43 | 1.56 | 10.21 | 0.1479 |
| R18-7d | 16.87 | 5.43 | 1.18 | 9.34 | 0.1479 |
| R18-10d | 16.18 | 5.43 | 0.95 | 9.17 | 0.1479 |
| R22-3d | 19.62 | 5.43 | 1.13 | 12.98 | 0.1479 |
| R22-5d | 17.52 | 5.43 | 1.92 | 12.47 | 0.1479 |
| R22-7d | 16.62 | 5.43 | 1.44 | 11.41 | 0.1479 |
| R22-10d | 15.94 | 5.43 | 1.17 | 11.20 | 0.1479 |
Disclaimer/Publisher’s Note: The statements, opinions and data contained in all publications are solely those of the individual author(s) and contributor(s) and not of MDPI and/or the editor(s). MDPI and/or the editor(s) disclaim responsibility for any injury to people or property resulting from any ideas, methods, instructions or products referred to in the content. |
© 2024 by the authors. Licensee MDPI, Basel, Switzerland. This article is an open access article distributed under the terms and conditions of the Creative Commons Attribution (CC BY) license (https://creativecommons.org/licenses/by/4.0/).
Share and Cite
Li, H.; Chen, H.; Nie, Q.; Yu, J.; Zhang, L.; Wang, Q. Bond-Slip Constitutive Relationship between Steel Rebar and Concrete Synthesized from Solid Waste Coal Gasification Slag. Buildings 2024, 14, 2931. https://doi.org/10.3390/buildings14092931
Li H, Chen H, Nie Q, Yu J, Zhang L, Wang Q. Bond-Slip Constitutive Relationship between Steel Rebar and Concrete Synthesized from Solid Waste Coal Gasification Slag. Buildings. 2024; 14(9):2931. https://doi.org/10.3390/buildings14092931
Chicago/Turabian StyleLi, Huawei, Haozhe Chen, Qingke Nie, Junchao Yu, Liang Zhang, and Qingjun Wang. 2024. "Bond-Slip Constitutive Relationship between Steel Rebar and Concrete Synthesized from Solid Waste Coal Gasification Slag" Buildings 14, no. 9: 2931. https://doi.org/10.3390/buildings14092931
APA StyleLi, H., Chen, H., Nie, Q., Yu, J., Zhang, L., & Wang, Q. (2024). Bond-Slip Constitutive Relationship between Steel Rebar and Concrete Synthesized from Solid Waste Coal Gasification Slag. Buildings, 14(9), 2931. https://doi.org/10.3390/buildings14092931