
A Comparative Study of Machine Learning and Conventional Techniques in Predicting Compressive Strength of Concrete with Eggshell and Glass Powder Additives

Abstract
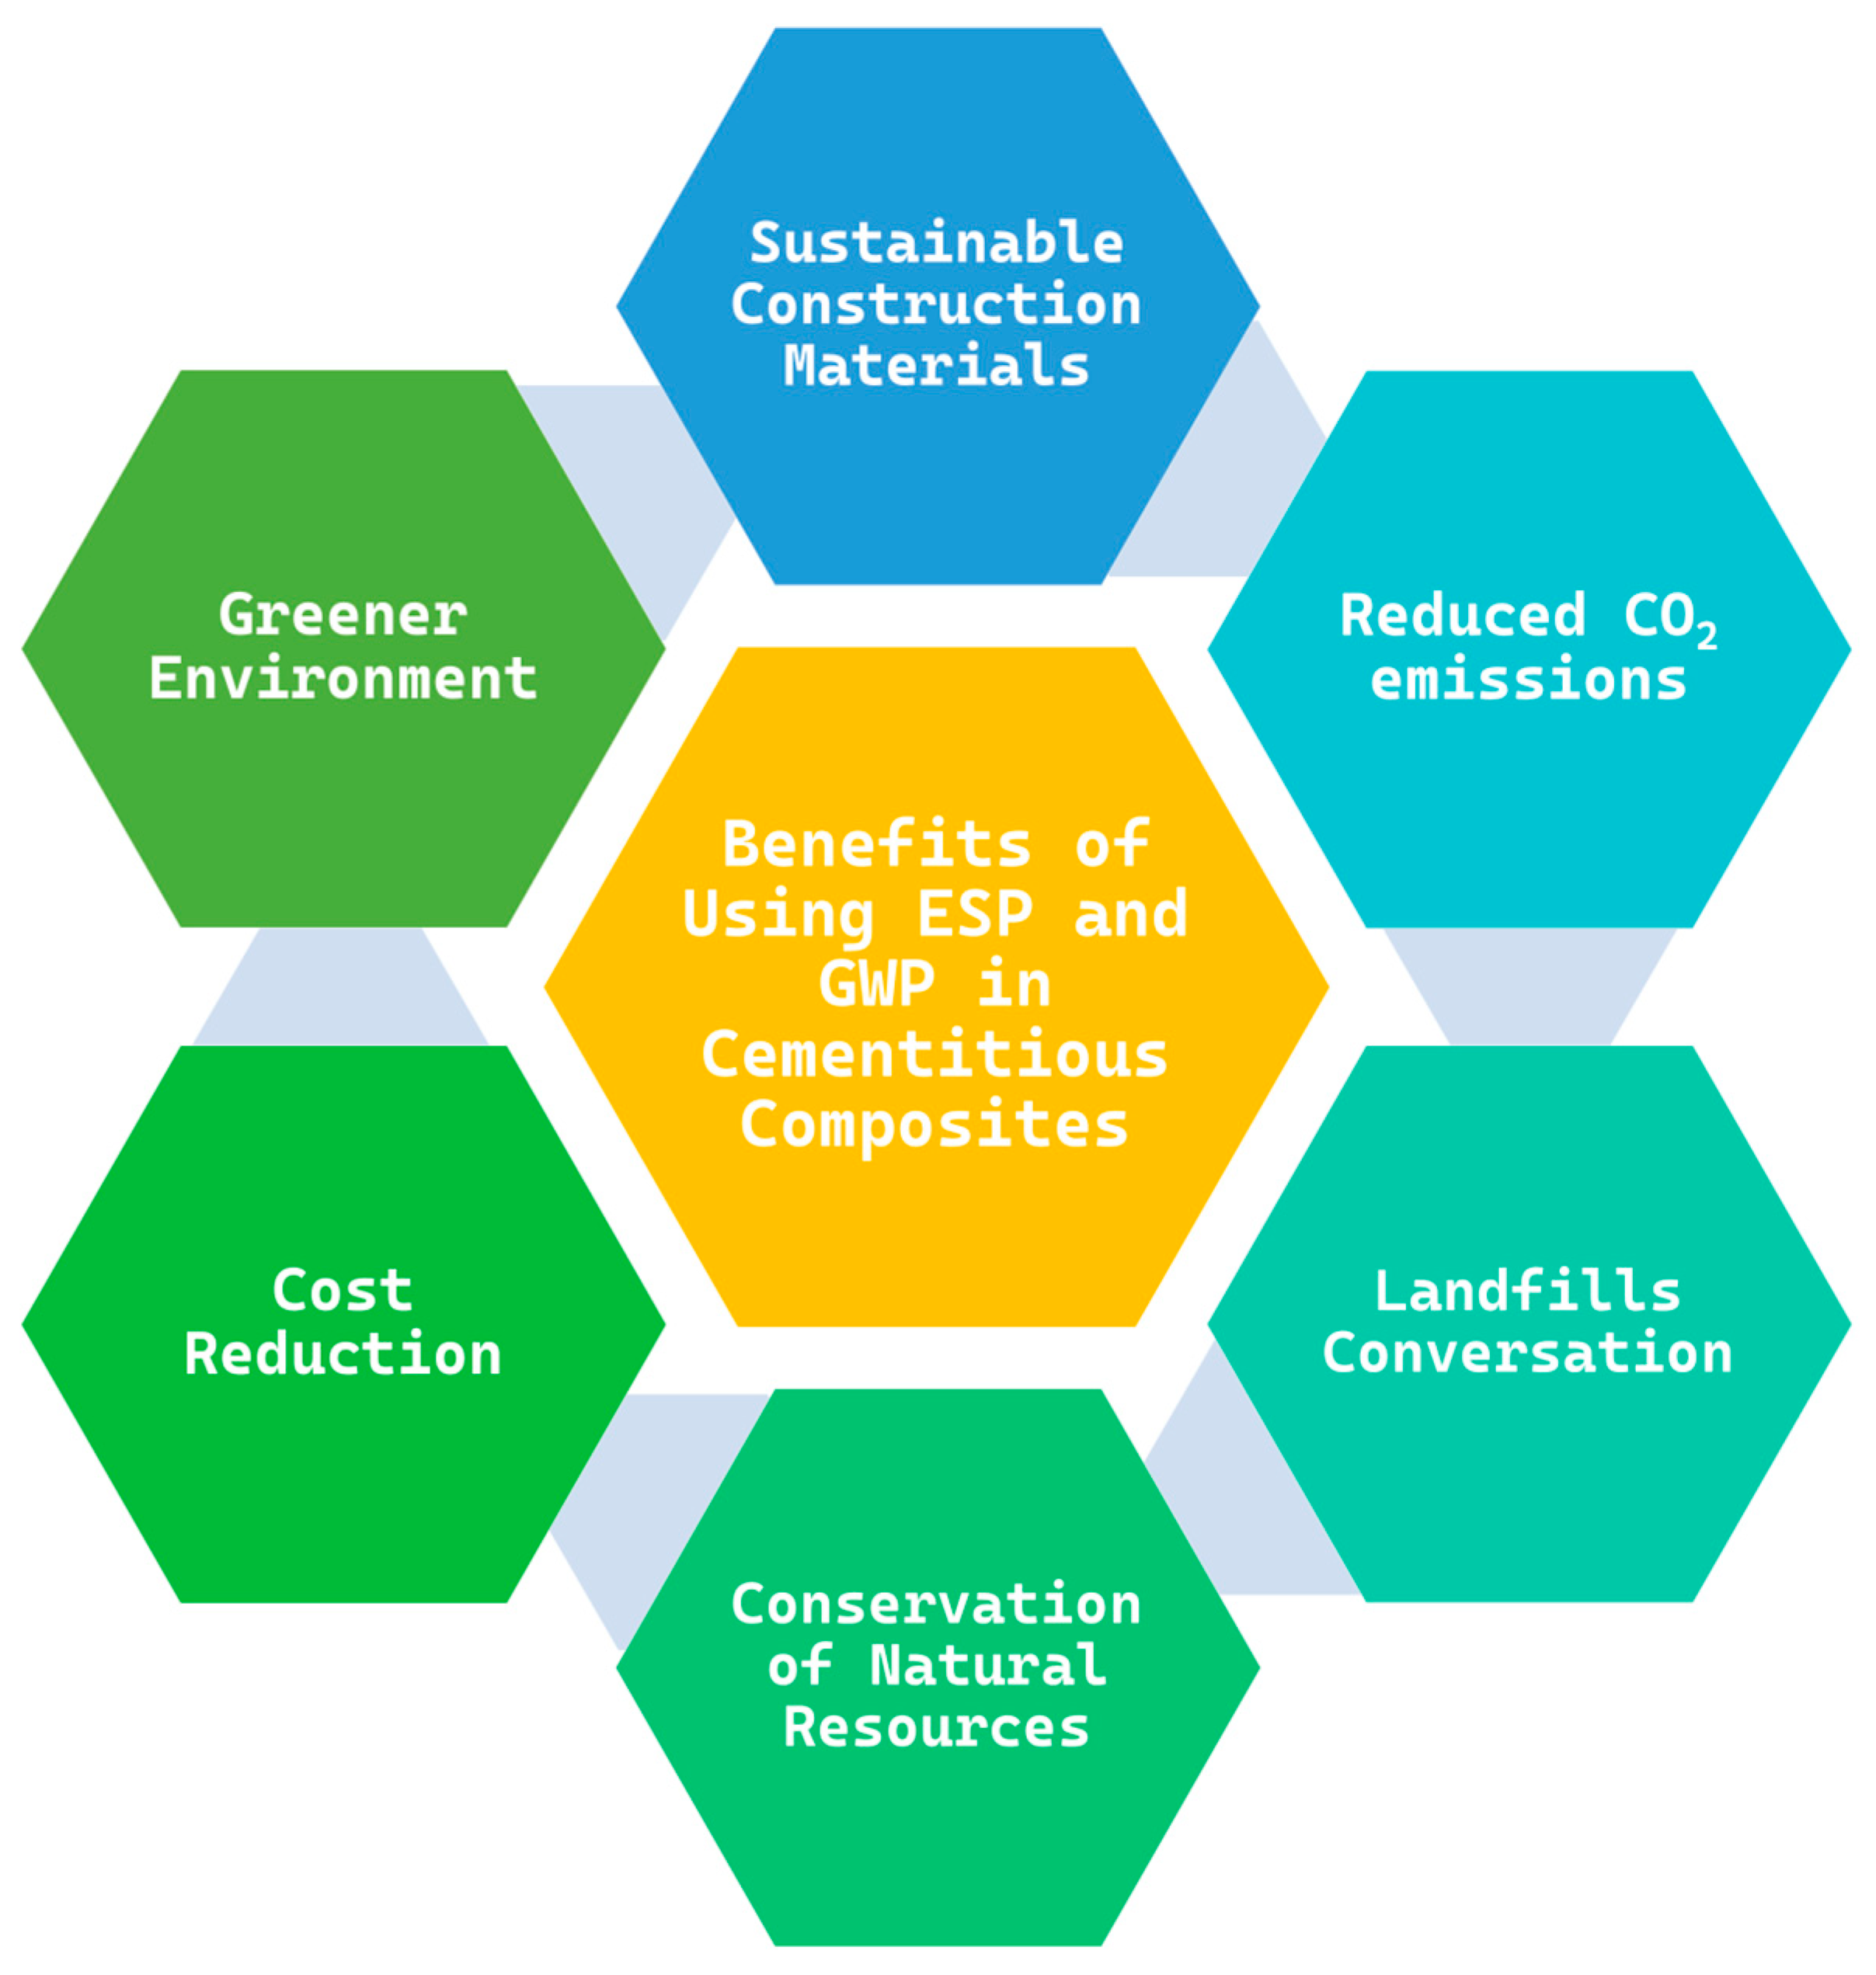
1. Introduction
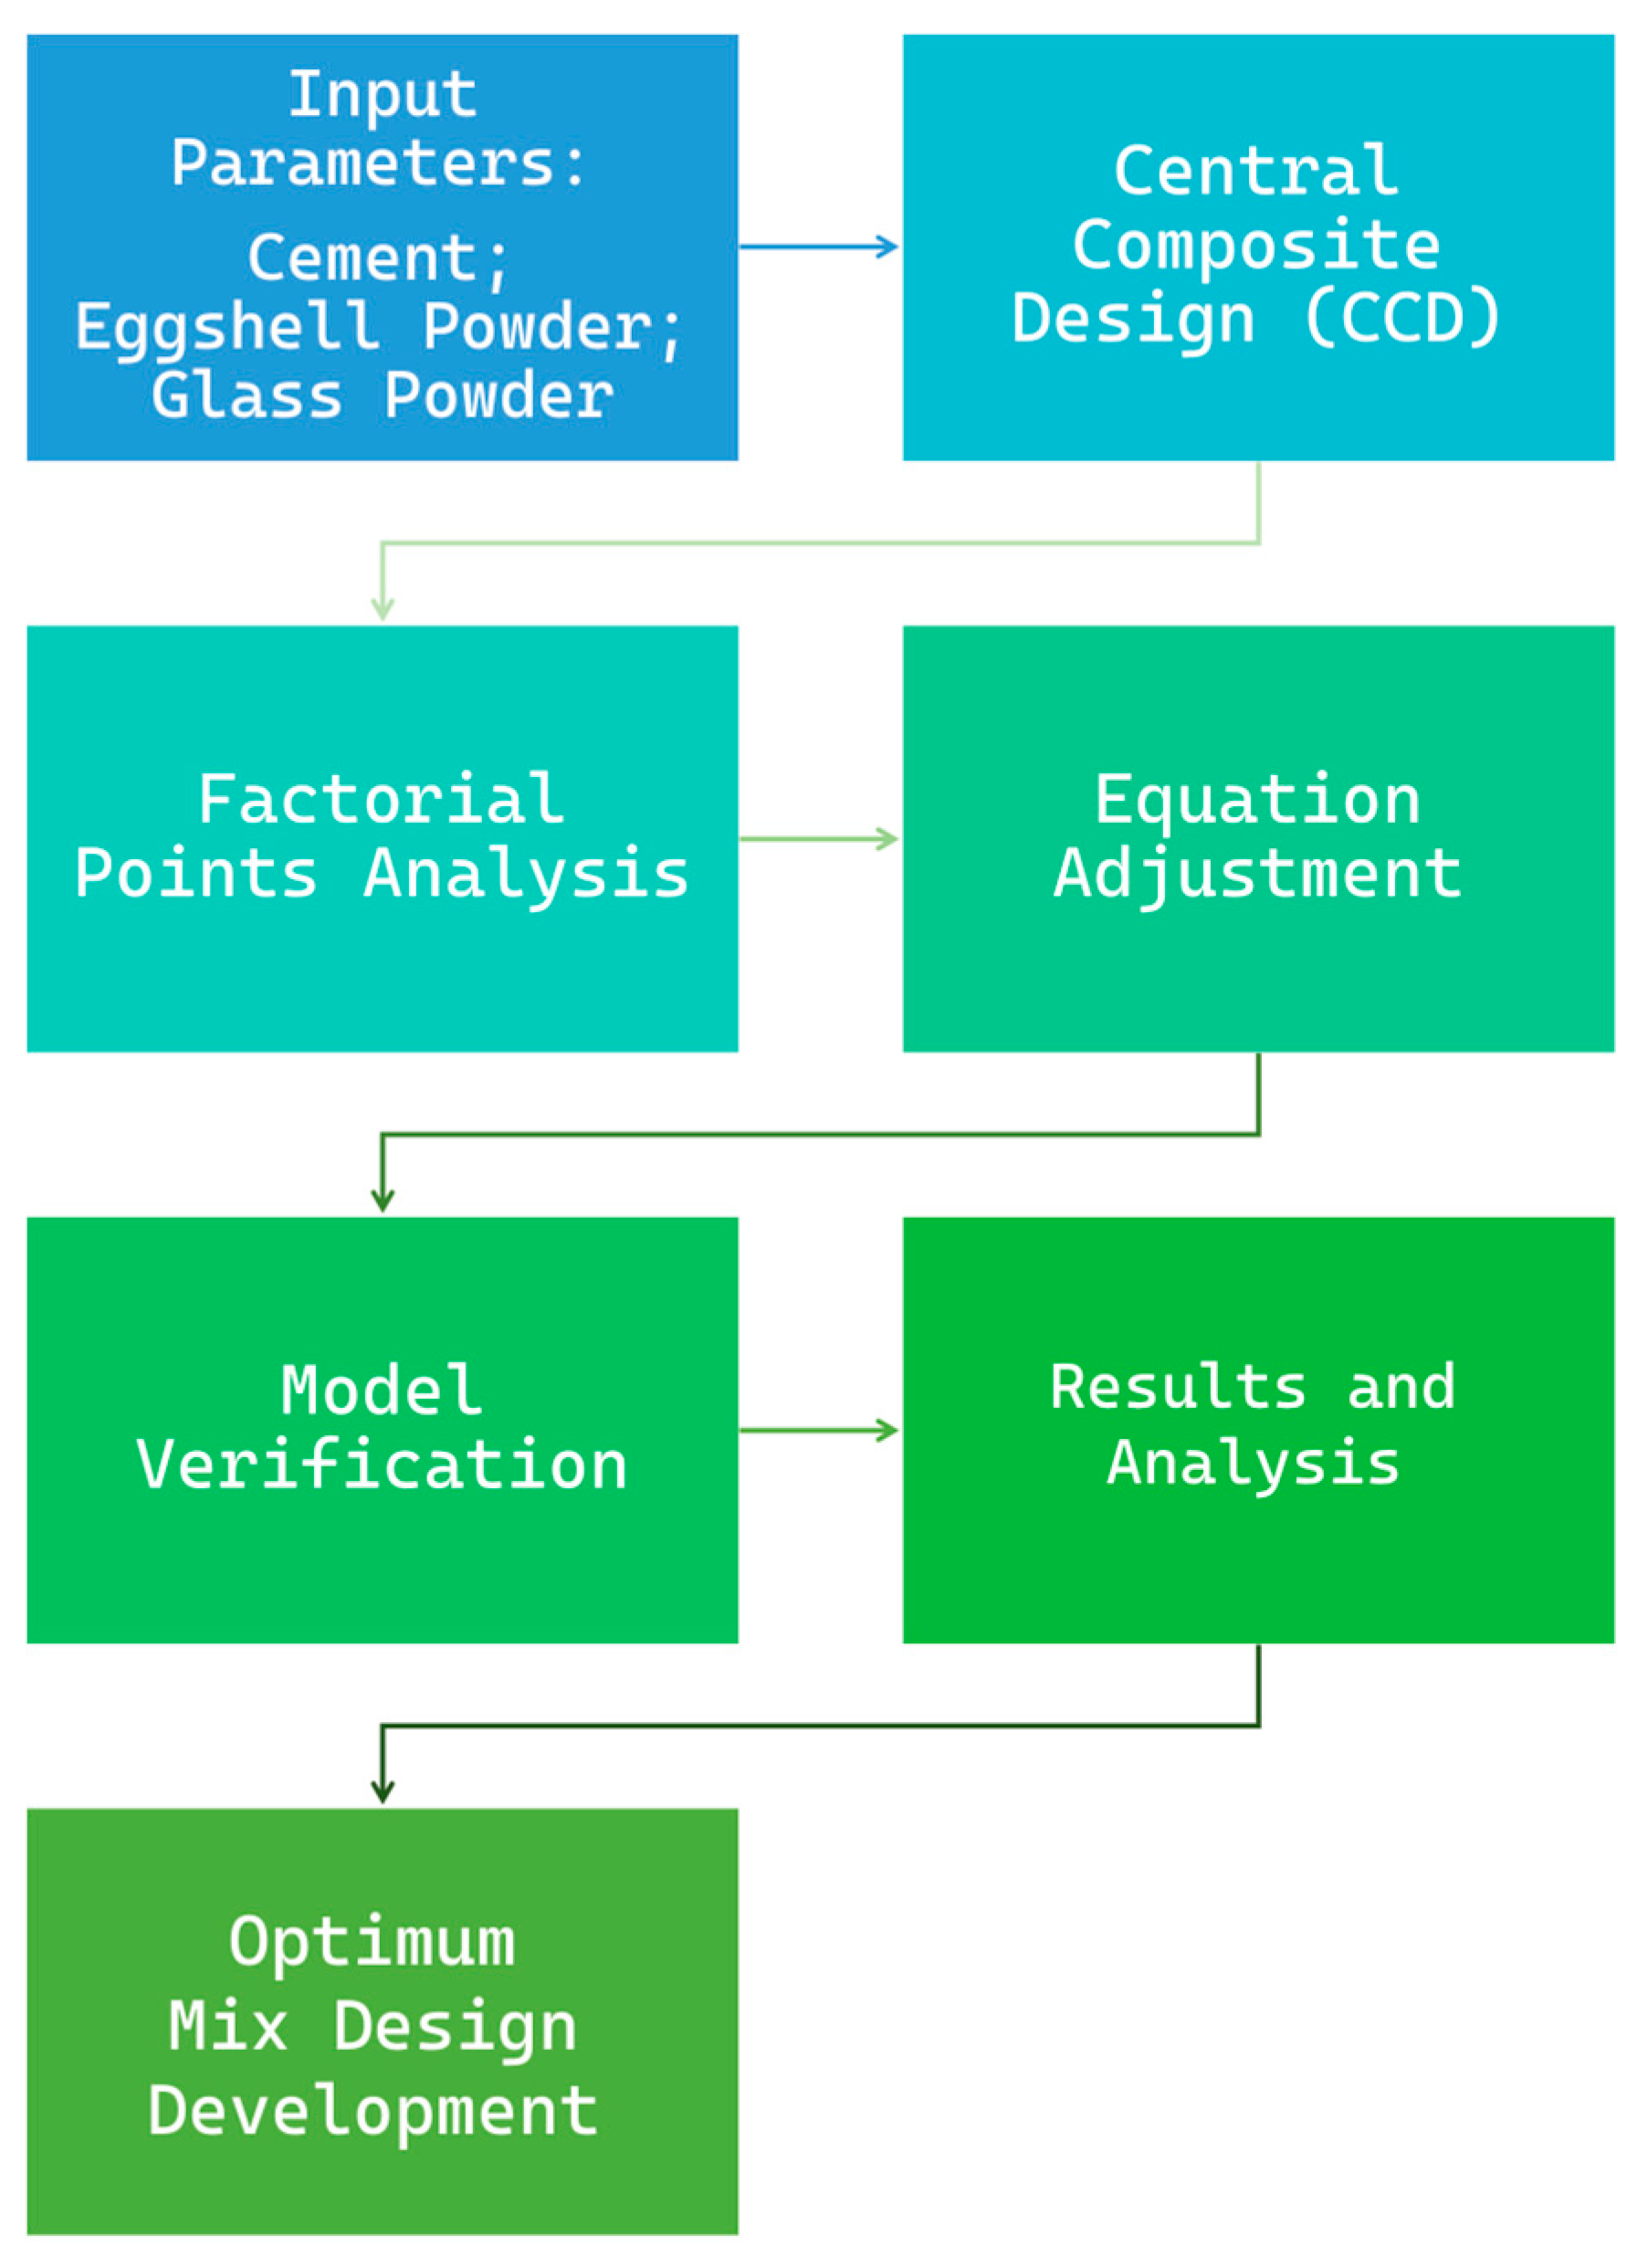
2. Methodology
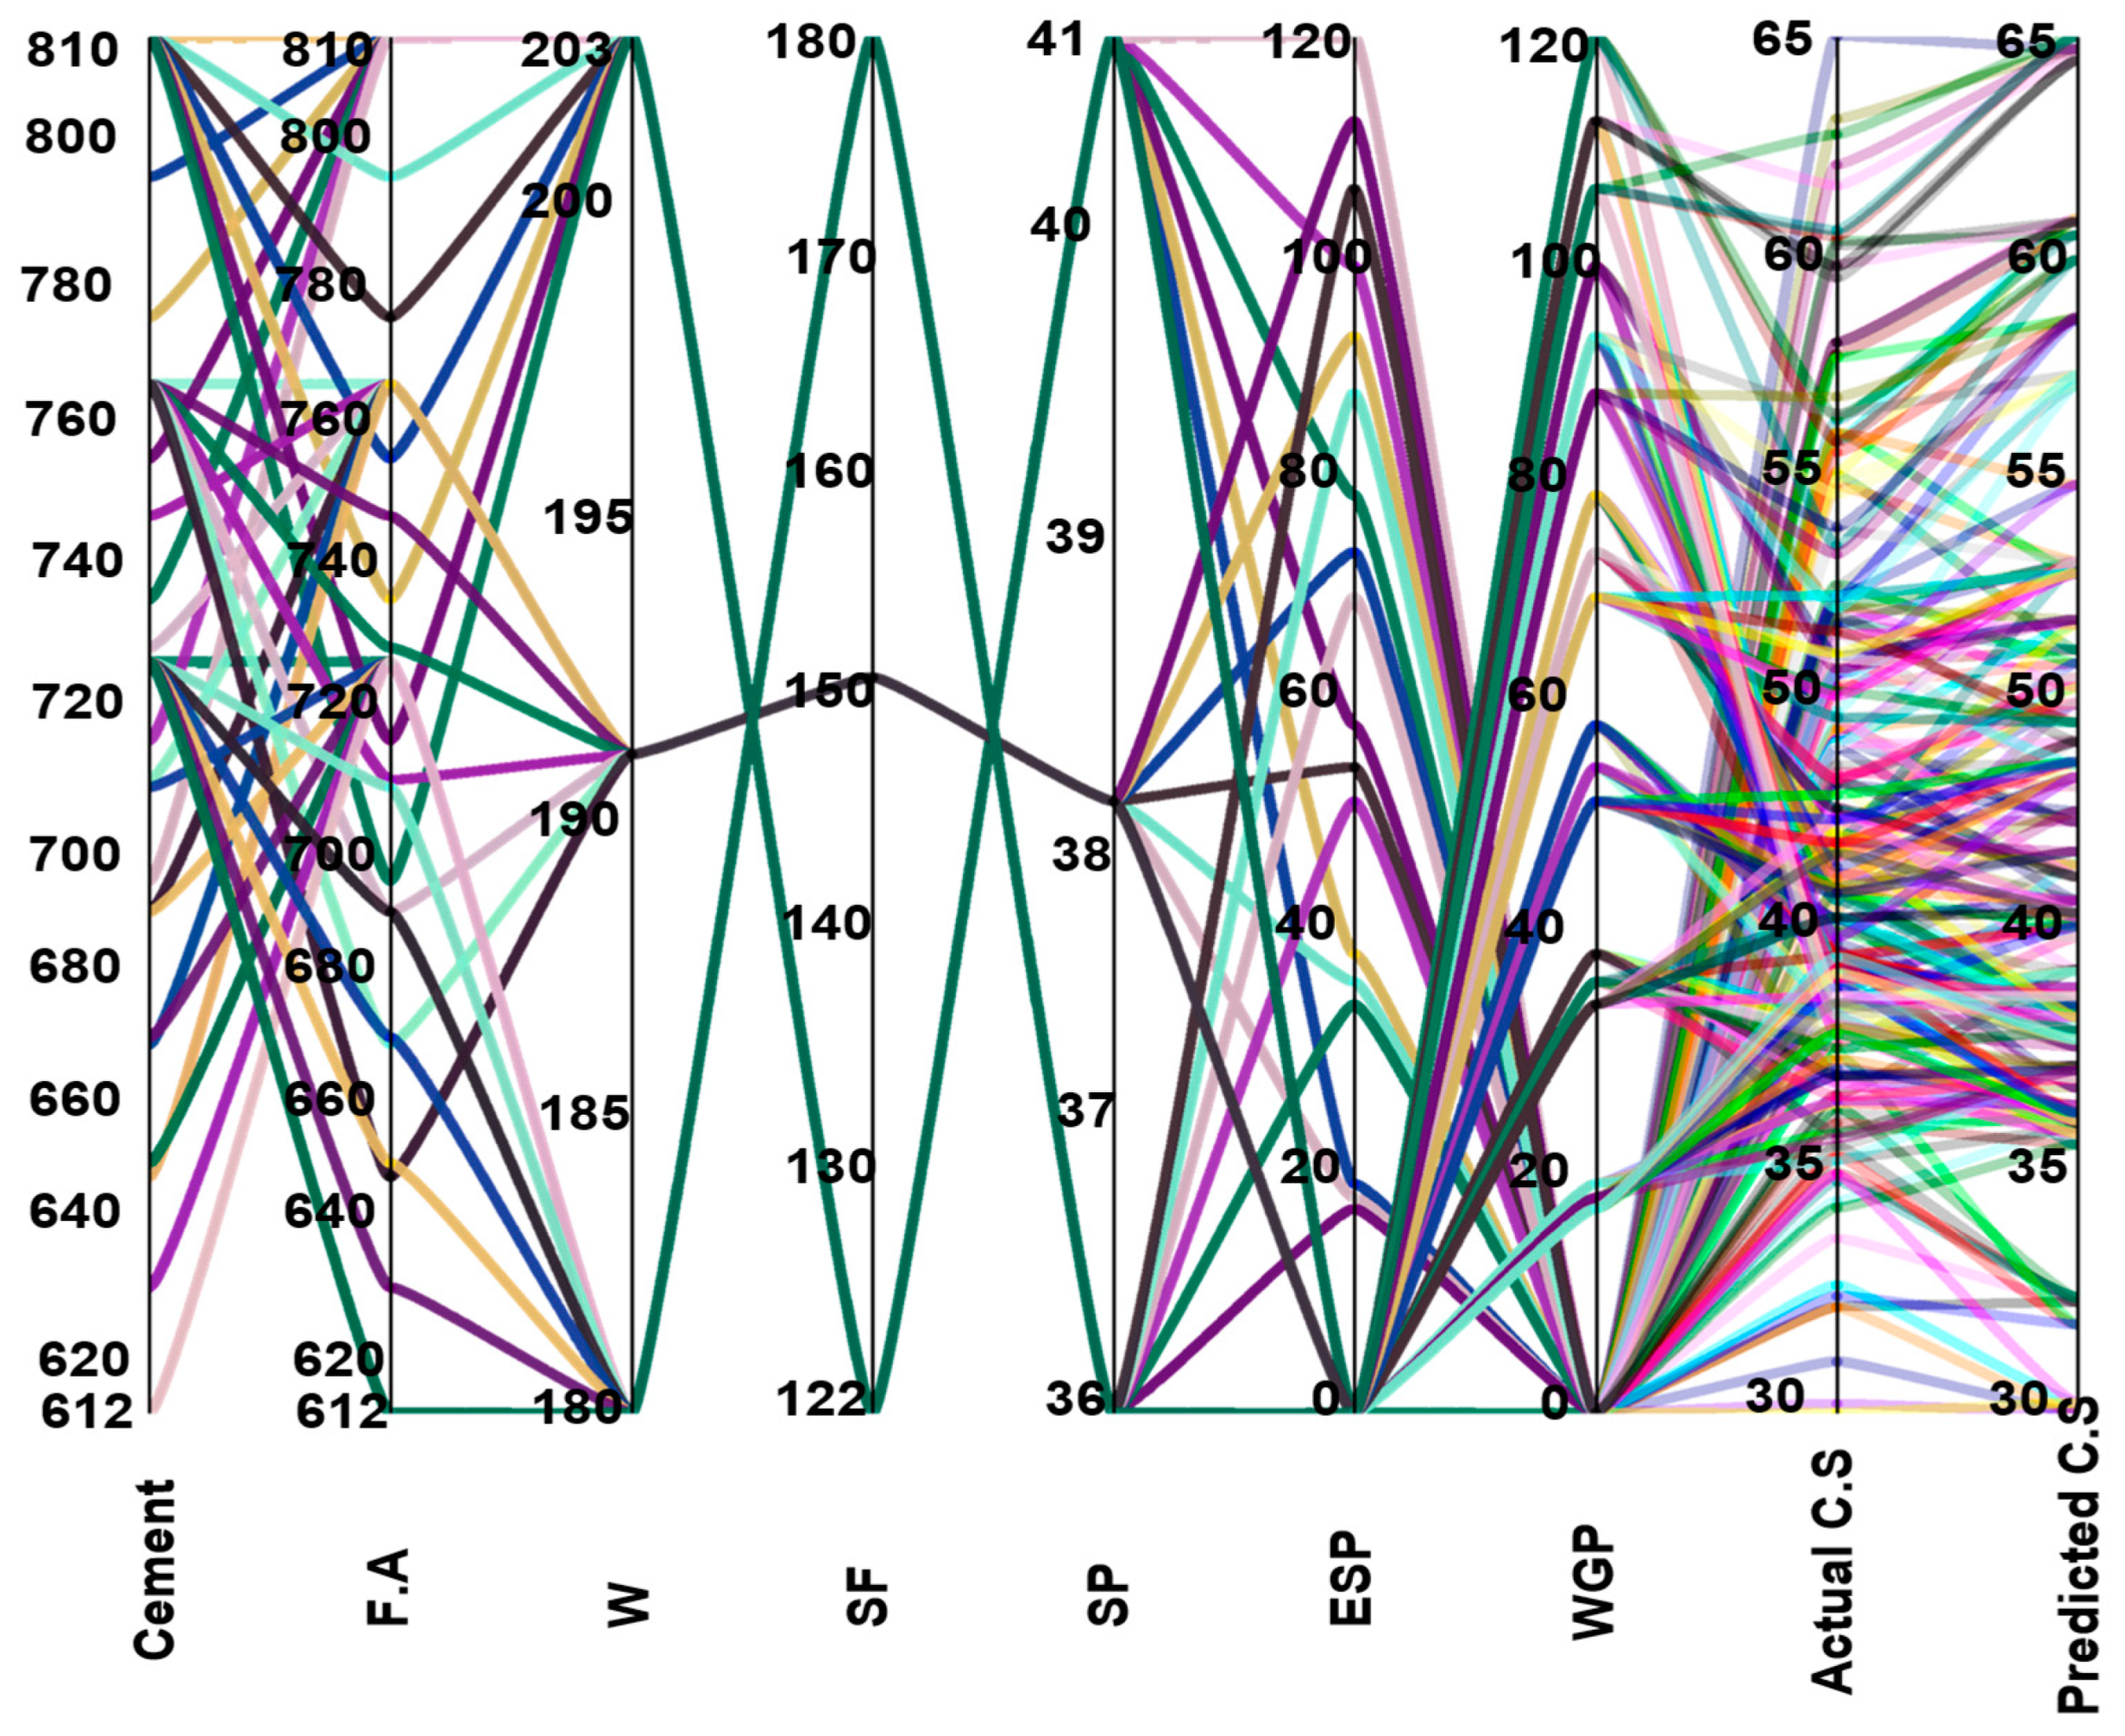
2.1. Selection of Dataset
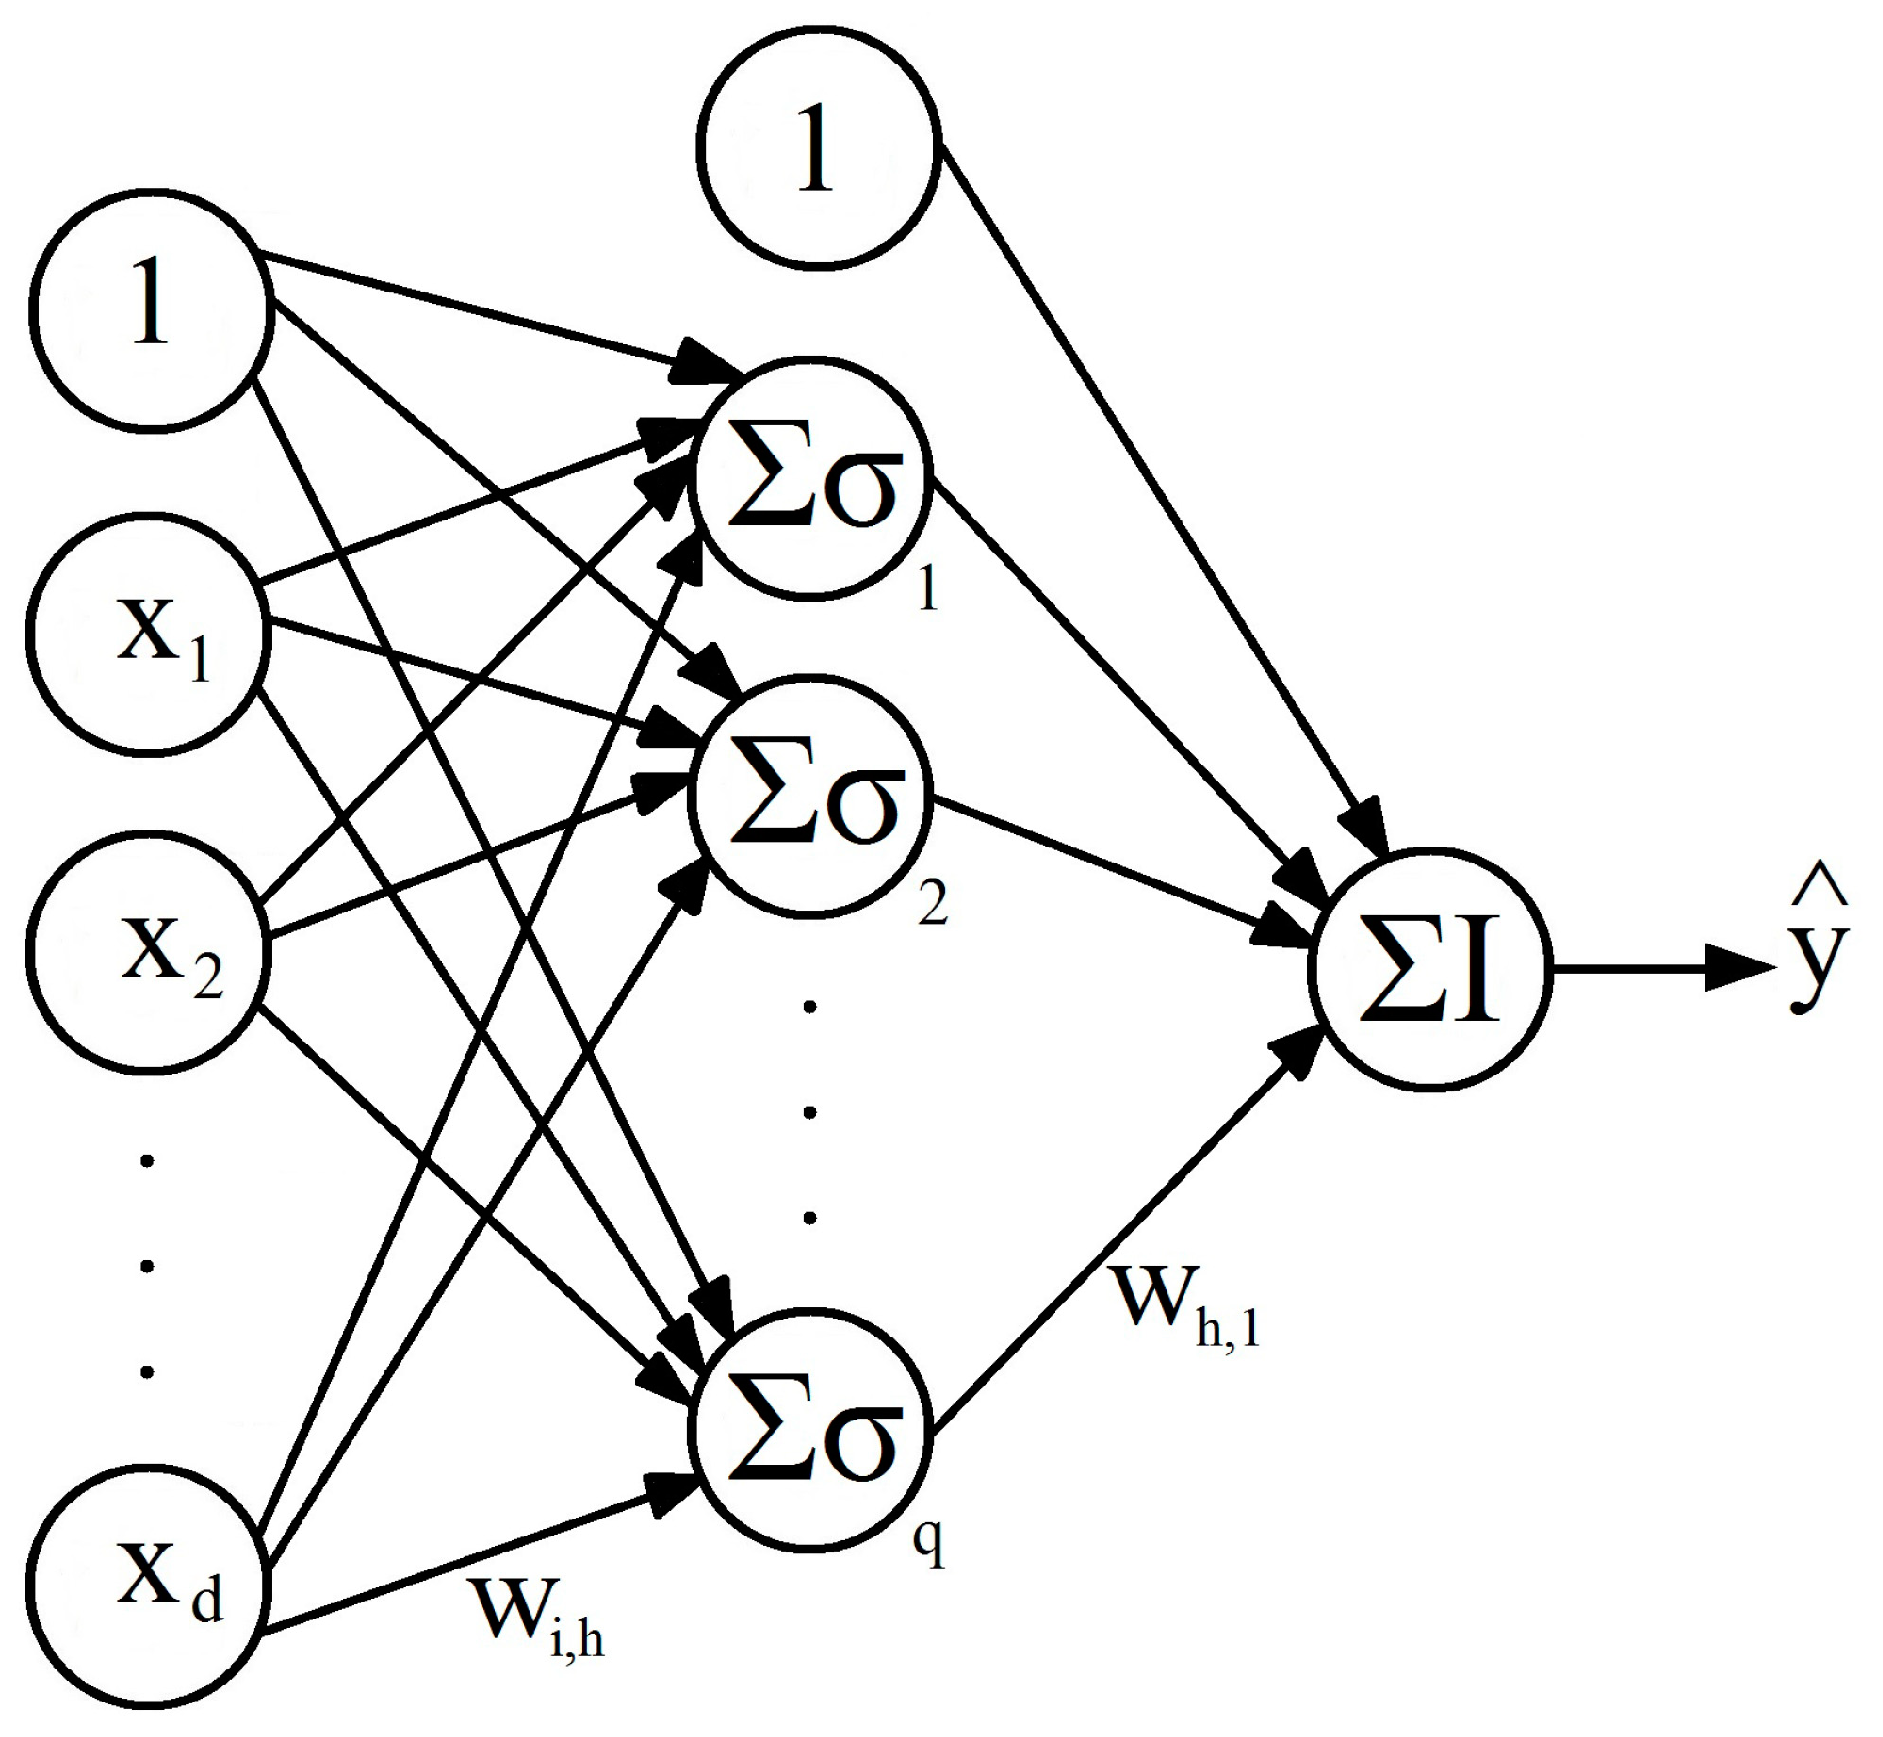
2.2. Artificial Neural Network (ANN)
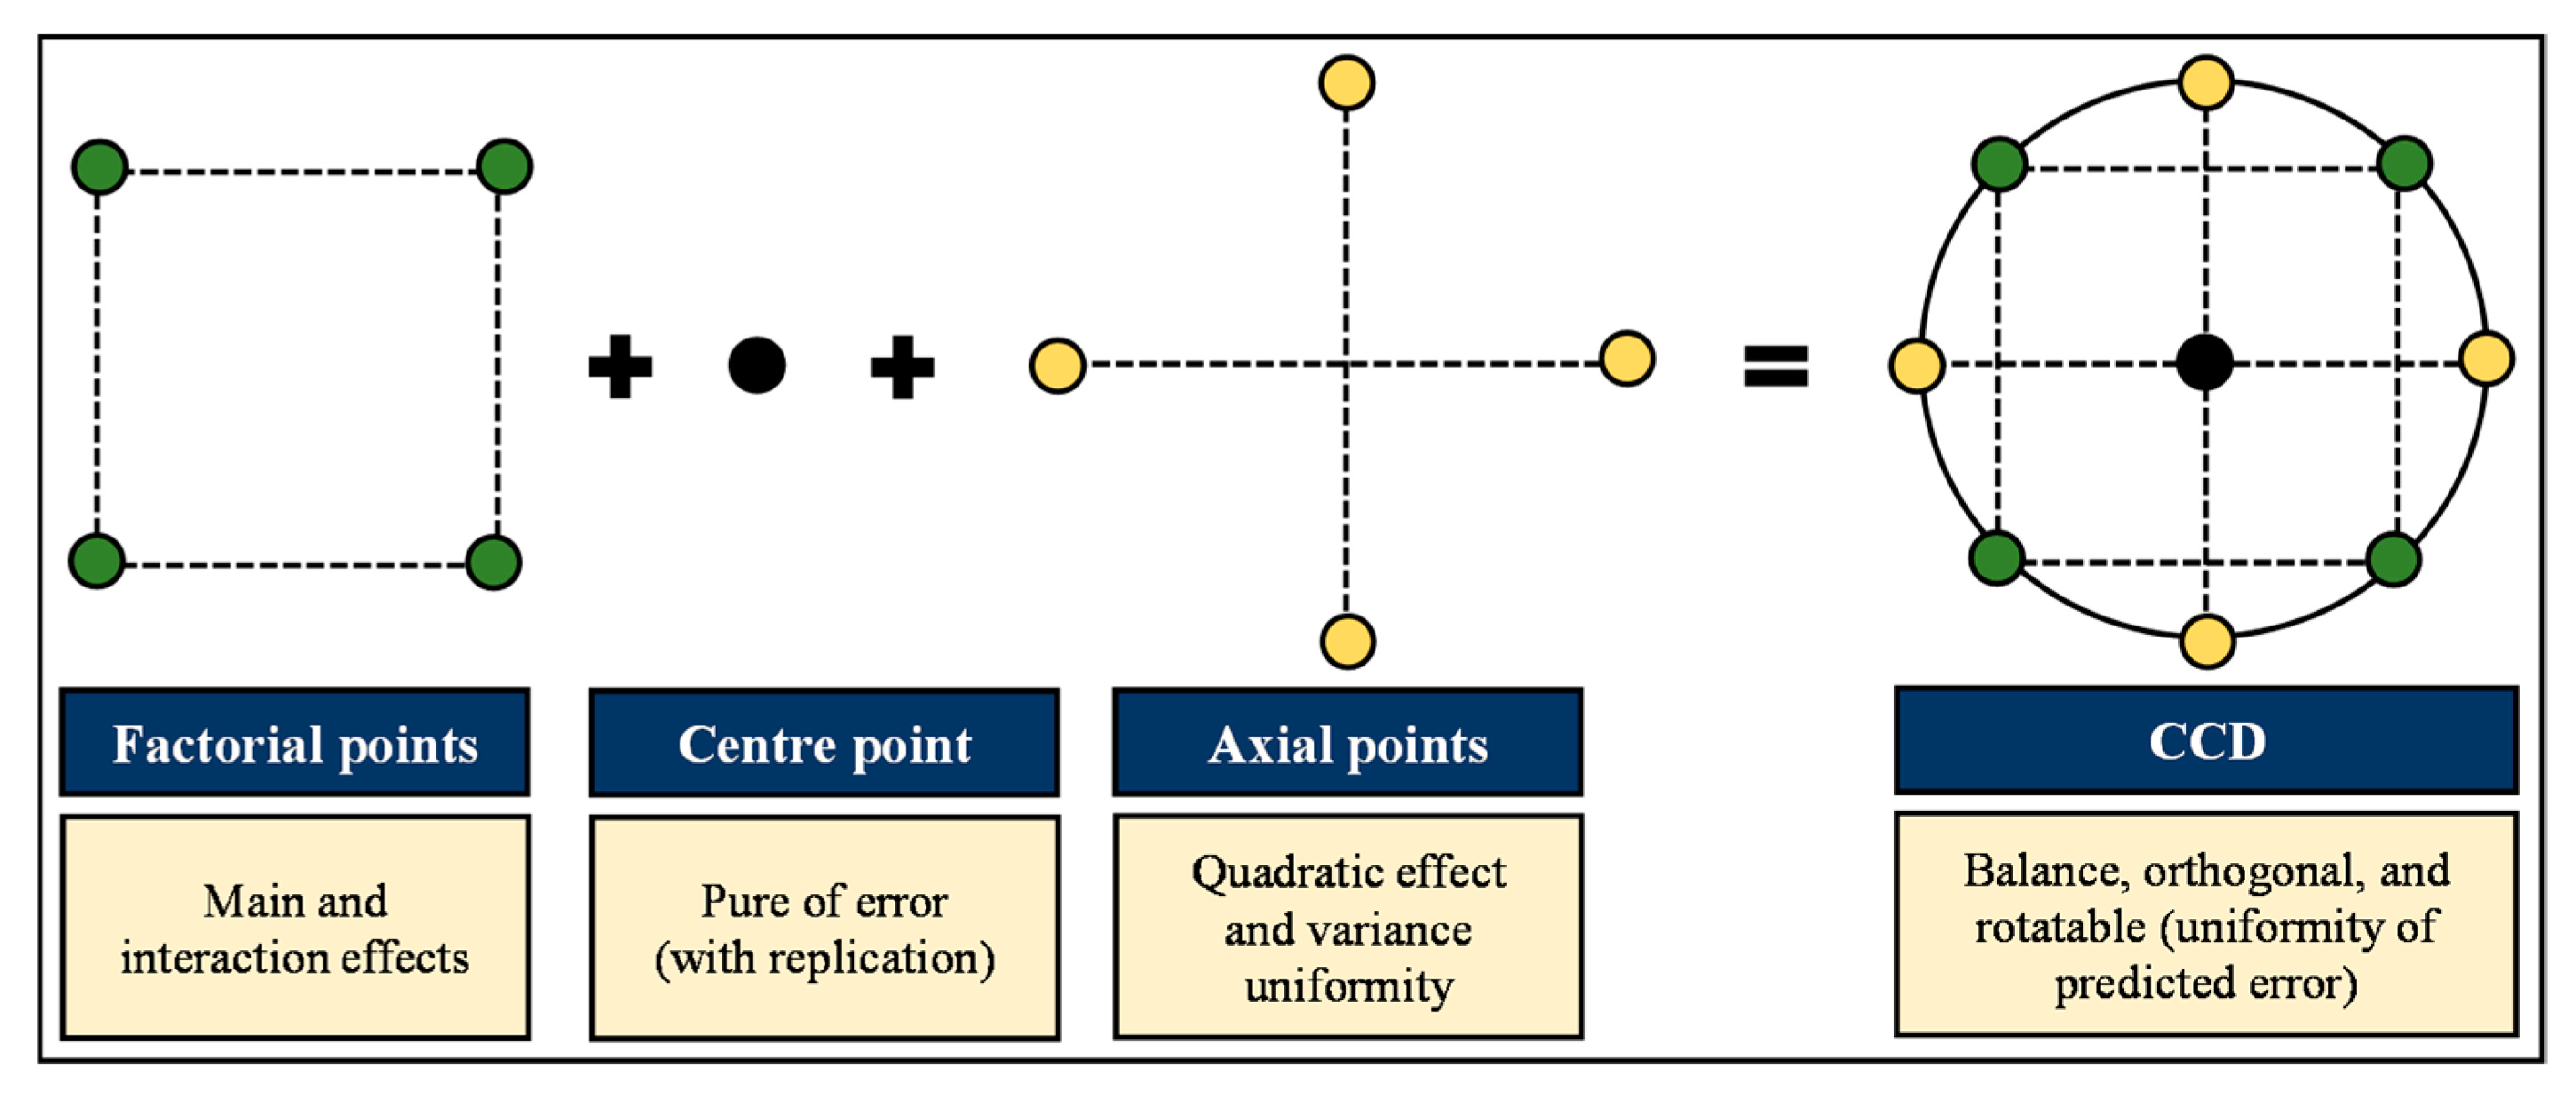
2.3. Response Surface Methodology (RSM)
3. Results and Discussion
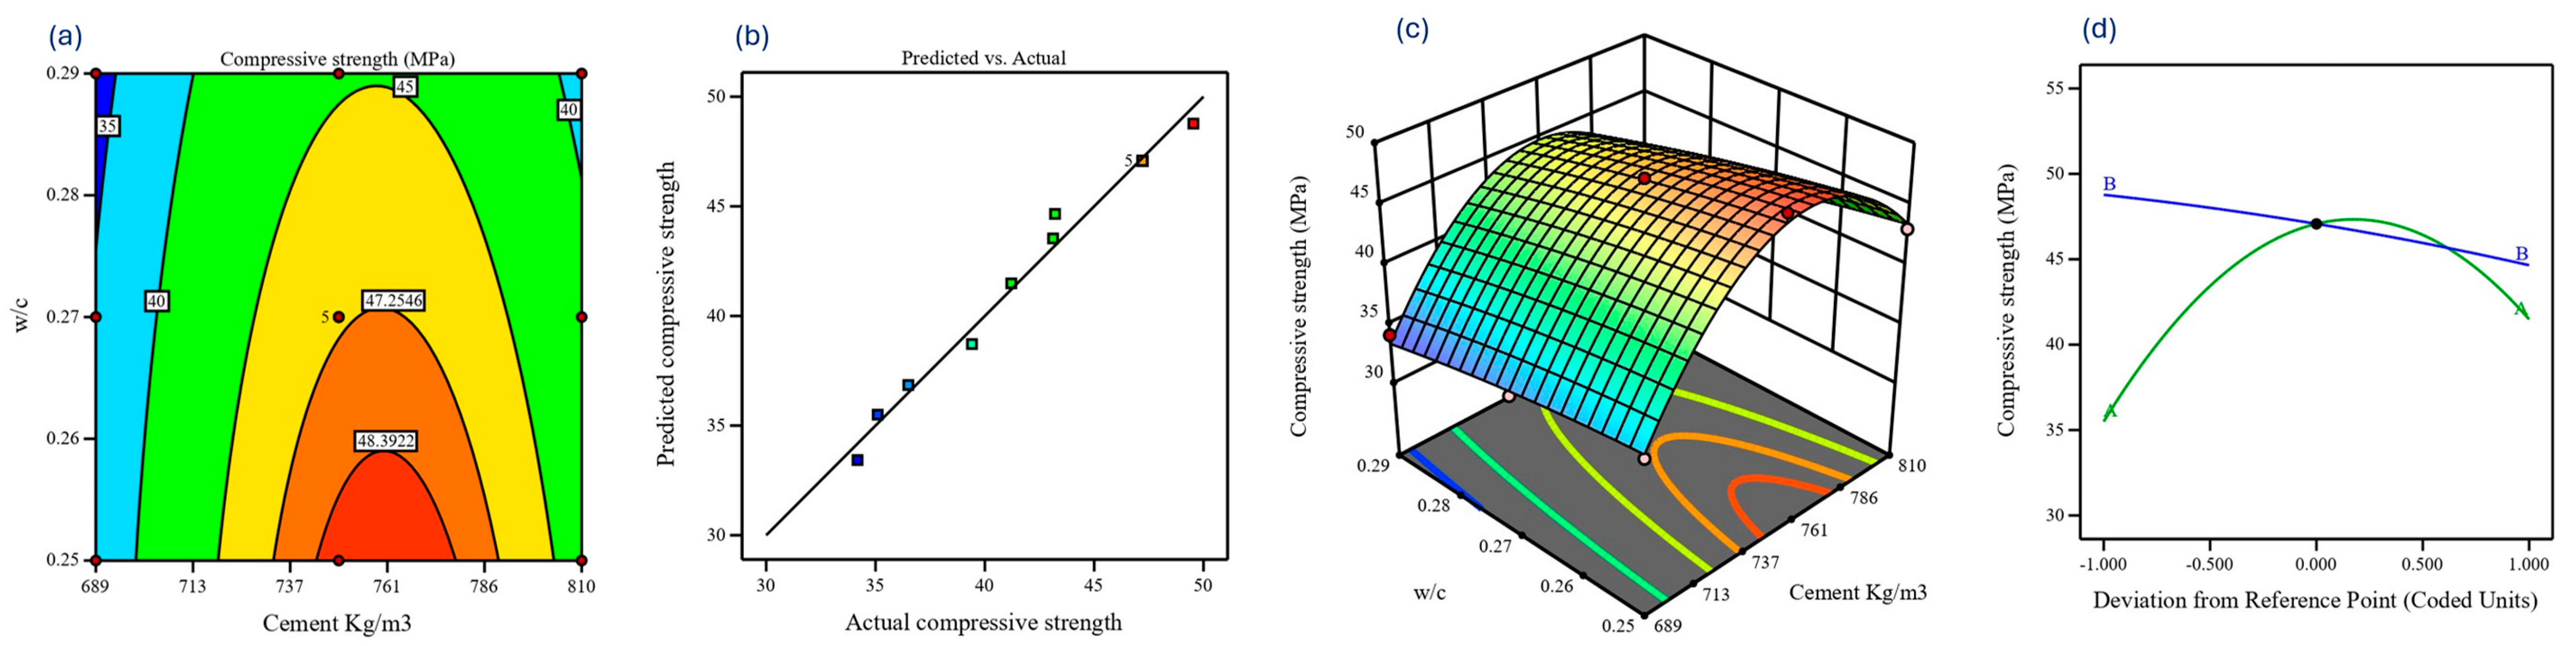
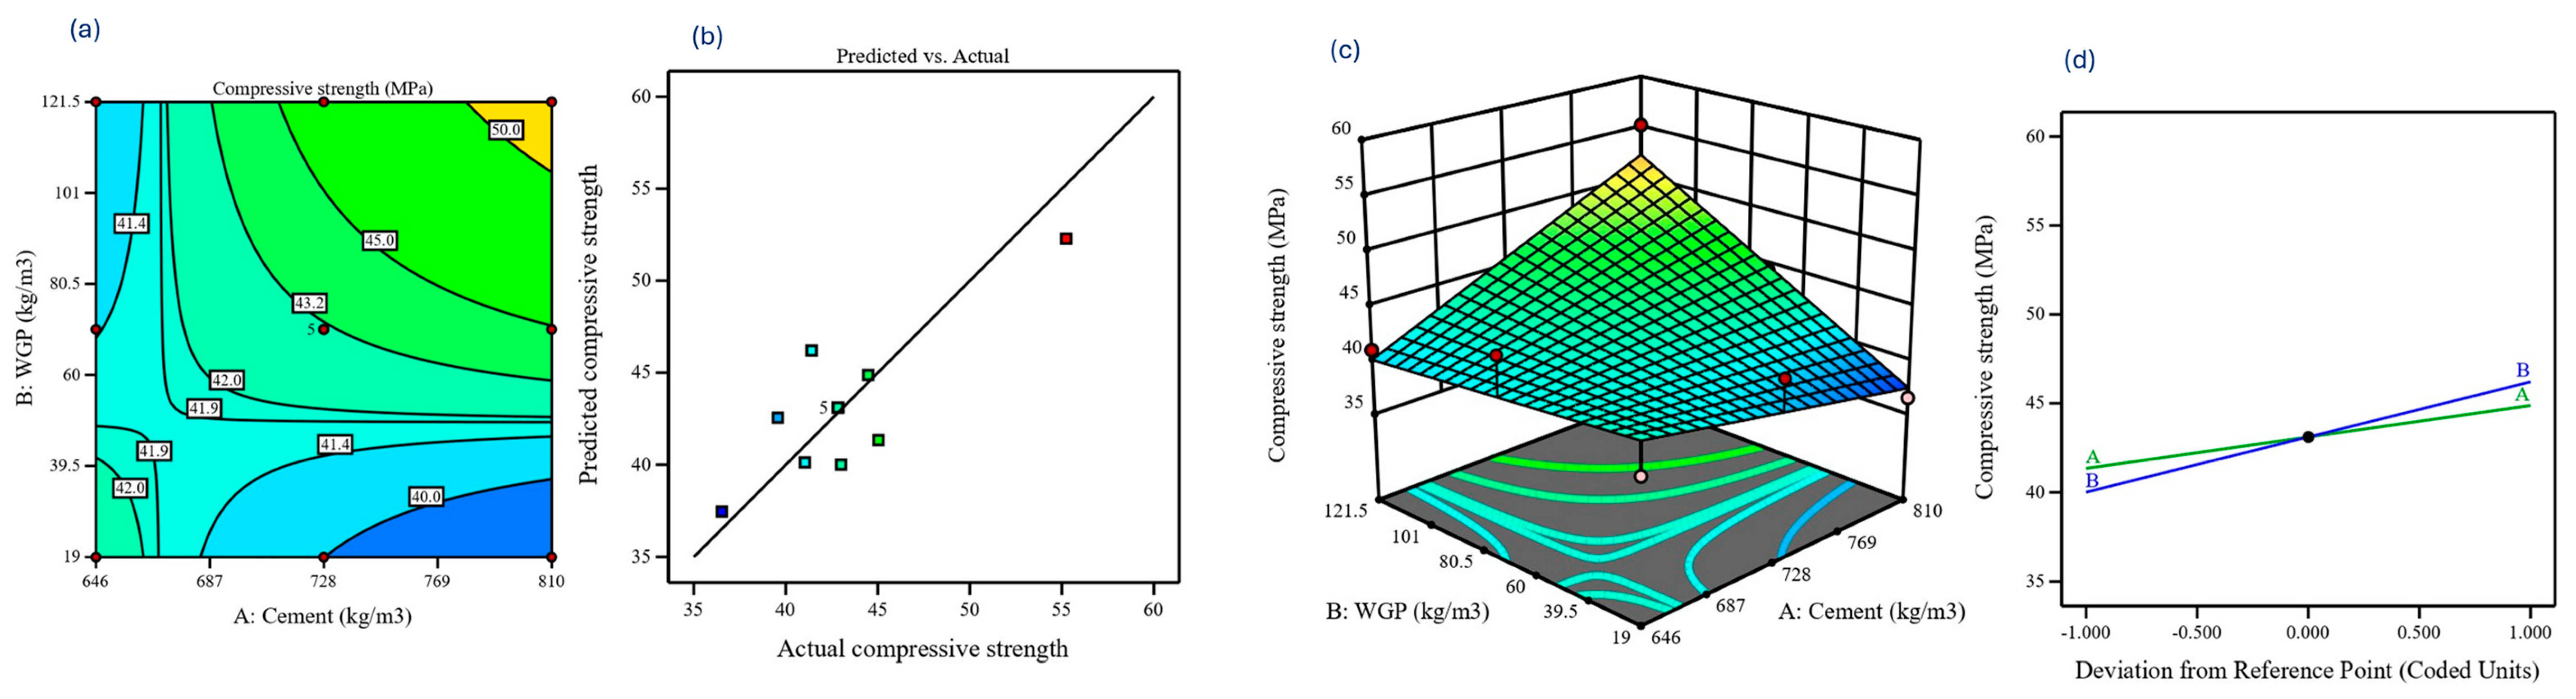
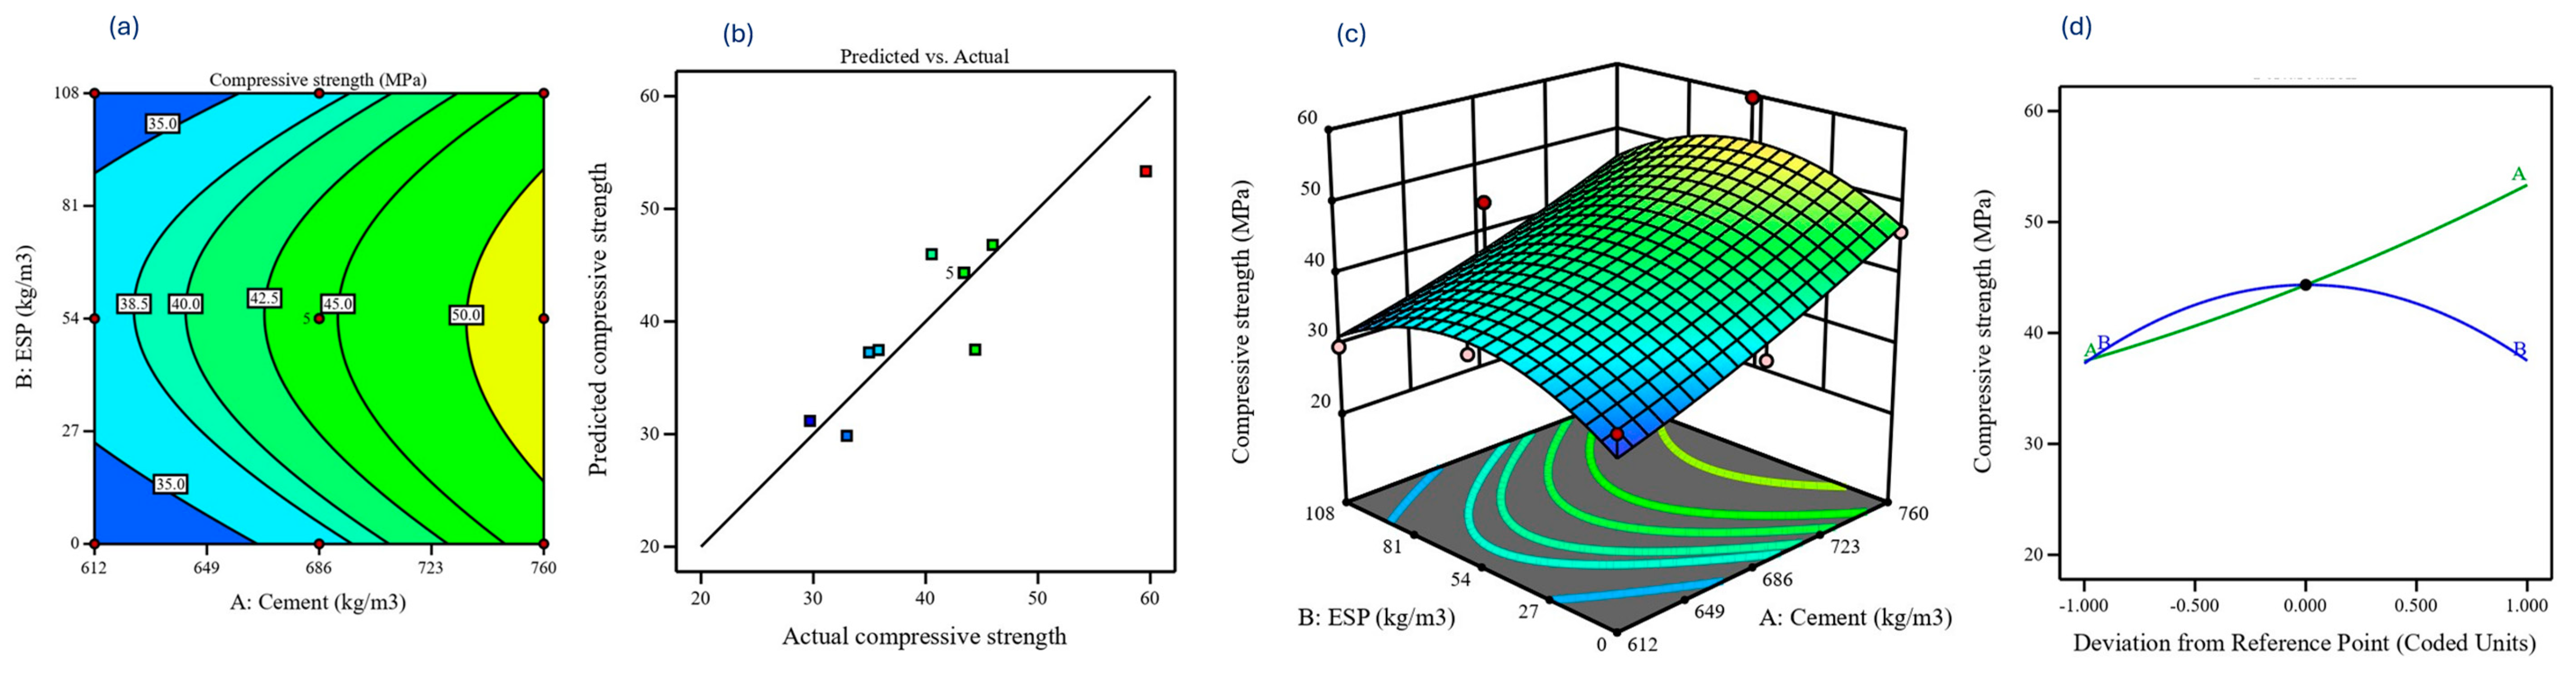
3.1. Predicting Compressive Strength Using RSM
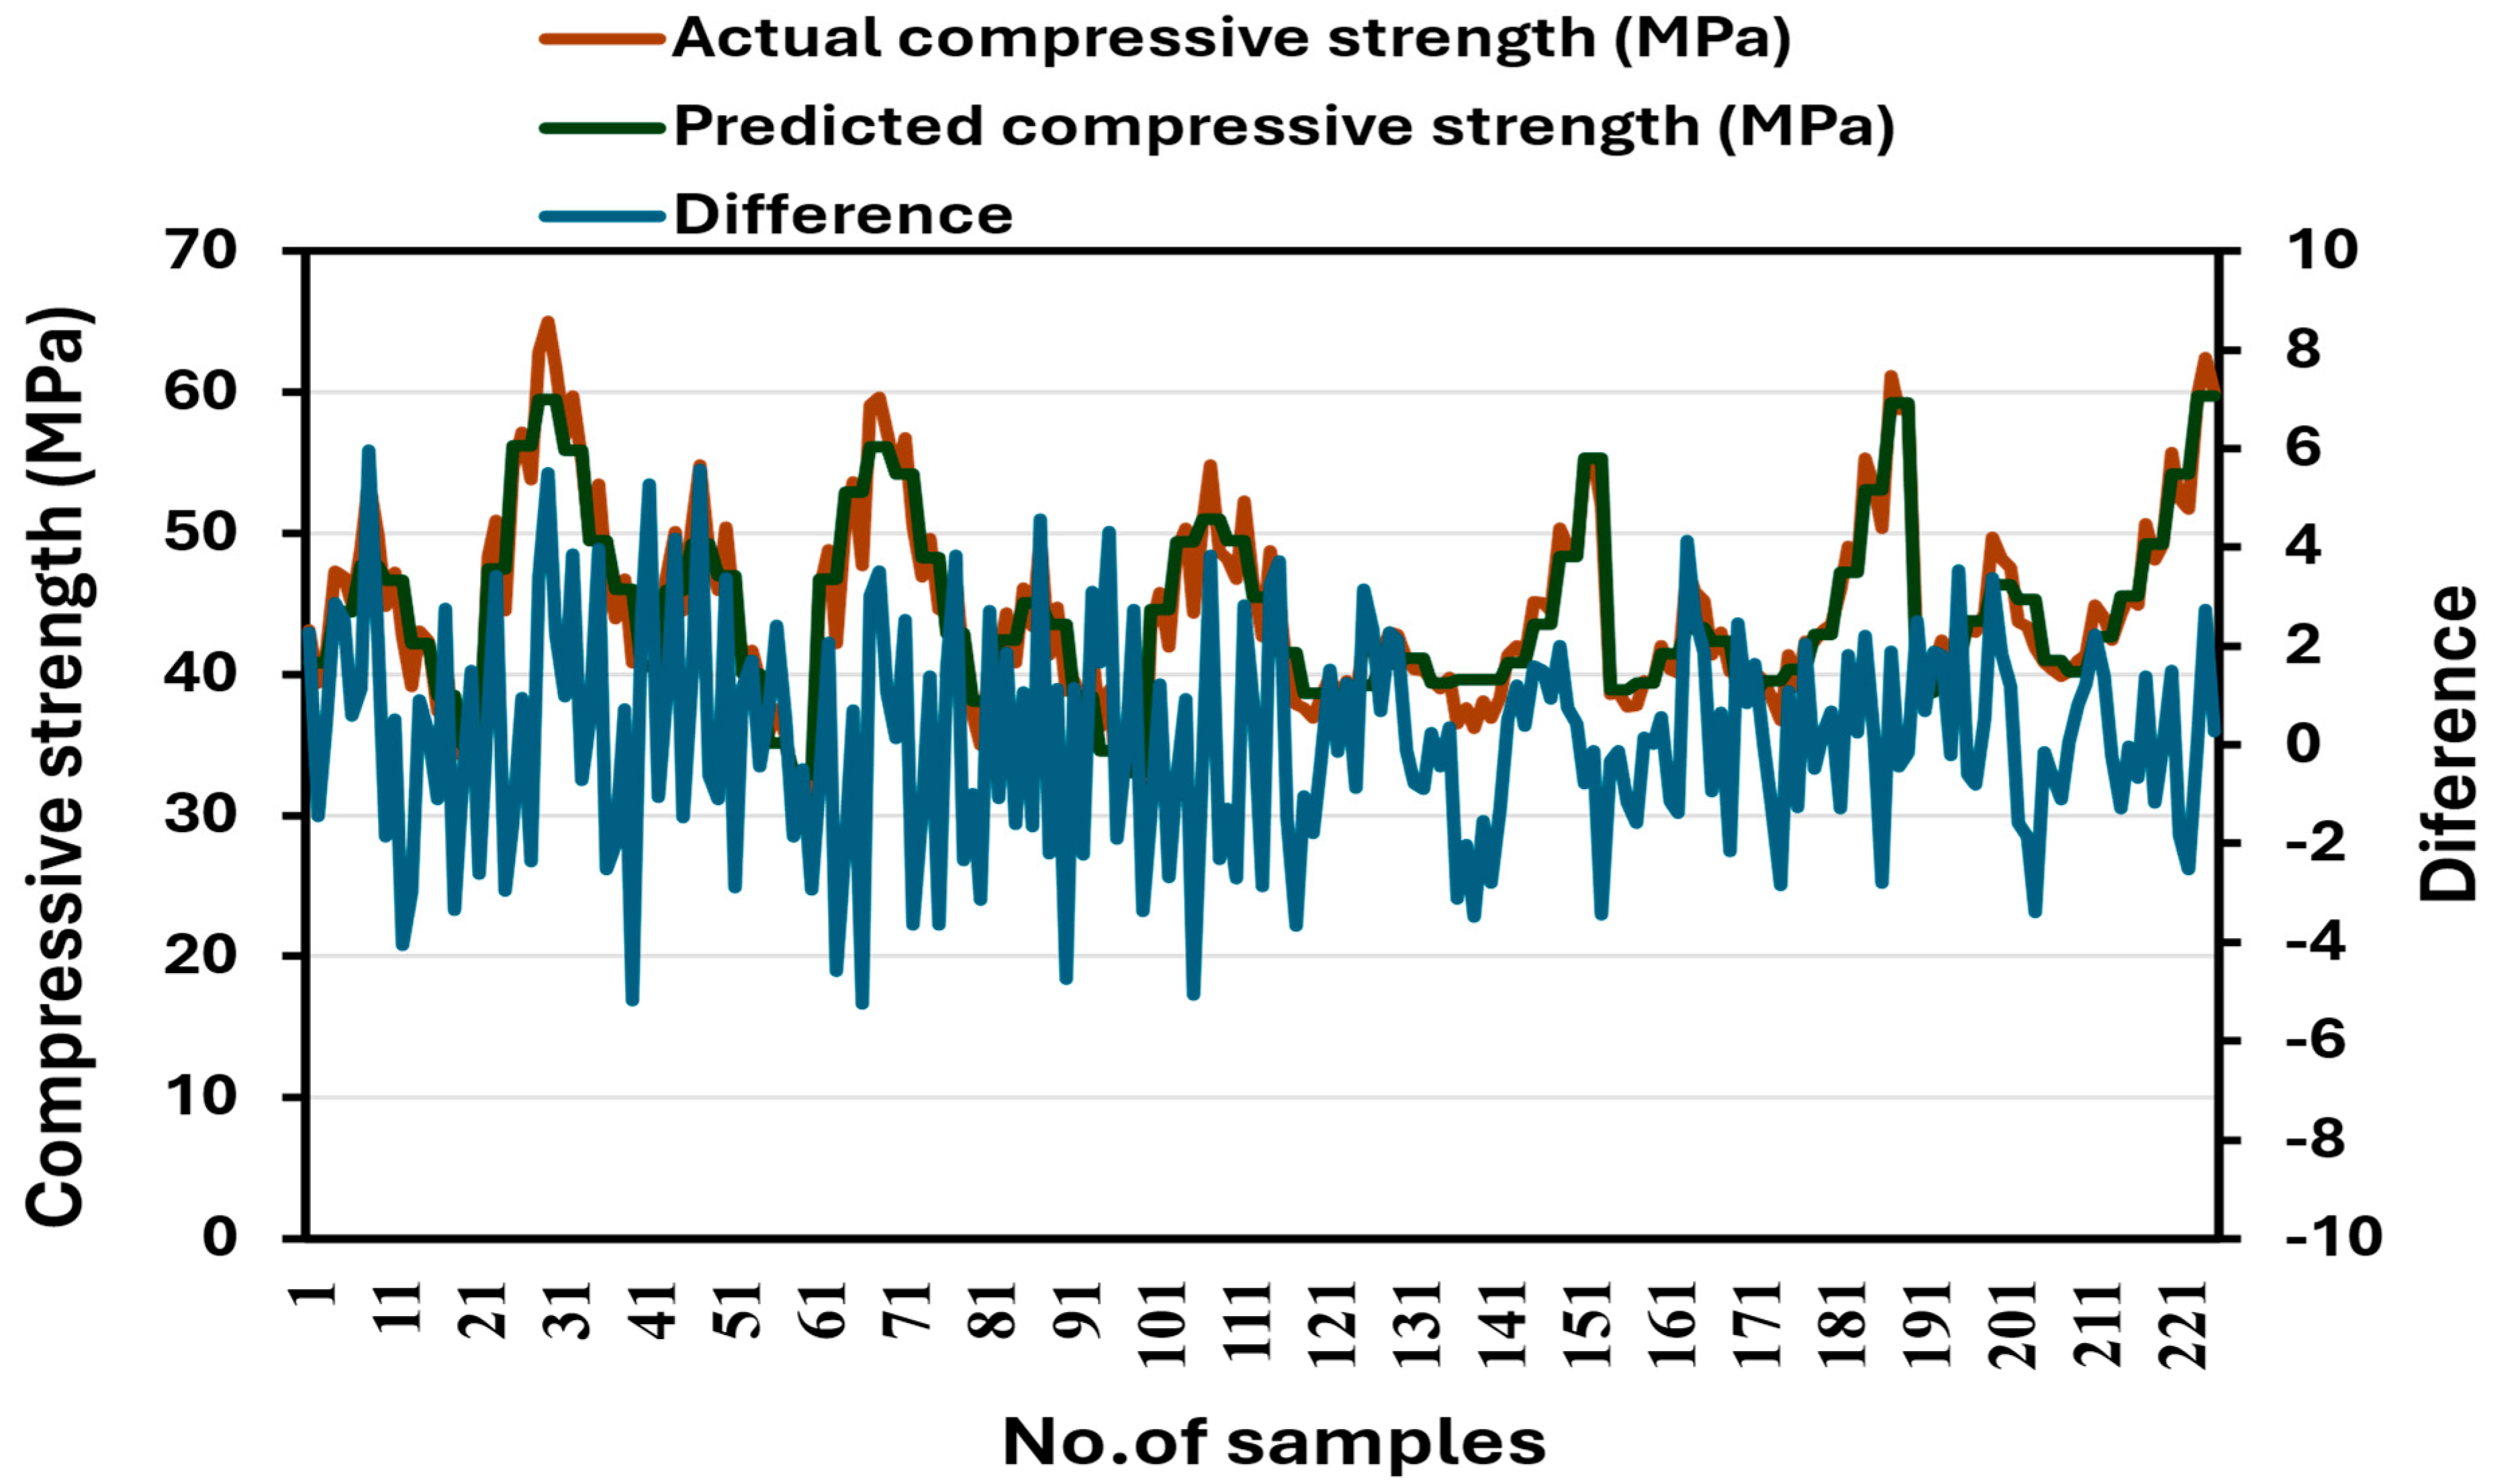
3.2. Predicting Compressive Strength Using ANN
3.3. Validation of RSM and ANN in Mechanical Properties
4. Discussion
5. Conclusions
- Based on the RSM analysis, the two most influential elements in predicting the compressive strength of concrete are cement and w/c ratio with R2 0.8729.
- The RSM predicted compressive strength ranged from a maximum of 49.08 MPa at a cement content of 761 kg/m3 and a water–cement ratio of 0.25, to a minimum of 33.72 MPa at a cement content of 689 kg/m3 and a water–cement ratio of 0.29. The predicted compressive strength values were 43.09, 45.93, 46.84, 45.75, 42.58, and 37.85 MPa at ESP contents of 0, 24.3, 48.6, 72.9, 97.2, and 121.5 kg/m3, respectively.
- The comparison results of the two methods show that the ANN model performs better than the RSM, with a strong correlation coefficient (R2) of 0.907 for compressive strength.
- The maximum compressive strength predicted by the ANN model is 59.72 MPa, closely aligning with the 59.78 MPa predicted by the RSM. For the minimum compressive strength, RSM predicts a value of 22.37 MPa, whereas ANN estimates a higher value of 32.87 MPa. This comparison highlights the slight variations between the two predictive models in estimating compressive strength extremes.
- ANN and RSM models have demonstrated their effectiveness in accurately replicating the compressive characteristics of concrete.
- ANN offers the advantage of predicting multiple previous outcomes simultaneously, while RSM requires grouping prior results to enhance prediction accuracy.
- The development of these reliable predictive models (RSM and ANN) for concrete strengths incorporating ESP and WGP contributes to sustainable construction practices without performing experimental tests in the lab. In addition, it promotes waste material utilization in the field of construction materials, reducing the environmental impact of concrete production.
6. Limitations and Future Recommendations
Supplementary Materials
Author Contributions
Funding
Data Availability Statement
Conflicts of Interest
References
- Jeong, K.; Hong, T.; Kim, J. Development of a CO2 emission benchmark for achieving the national CO2 emission reduction target by 2030. Energy Build. 2018, 158, 86–94. [Google Scholar] [CrossRef]
- Benhelal, E.; Zahedi, G.; Shamsaei, E.; Bahadori, A. Global strategies and potentials to curb CO2 emissions in cement industry. J. Clean. Prod. 2013, 51, 142–161. [Google Scholar] [CrossRef]
- Tan, H.; Du, C.; He, X.; Li, M.; Zhang, J.; Zheng, Z.; Su, Y.; Yang, J.; Deng, X.; Wang, Y. Enhancement of compressive strength of high-volume fly ash cement paste by wet grinded cement: Towards low carbon cementitious materials. Constr. Build. Mater. 2022, 323, 126458. [Google Scholar] [CrossRef]
- Panesar, D.K.; Zhang, R. Performance comparison of cement replacing materials in concrete: Limestone fillers and supplementary cementing materials–A review. Constr. Build. Mater. 2020, 251, 118866. [Google Scholar] [CrossRef]
- Gastaldini, A.; Hengen, M.; Gastaldini, M.; Do Amaral, F.; Antolini, M.; Coletto, T. The use of water treatment plant sludge ash as a mineral addition. Constr. Build. Mater. 2015, 94, 513–520. [Google Scholar] [CrossRef]
- Khan, M.; McNally, C. Recent developments on low carbon 3D printing concrete: Revolutionizing construction through innovative technology. Clean. Mater. 2024, 12, 100251. [Google Scholar] [CrossRef]
- Malhotra, V. Introduction: Sustainable development and concrete technology. Concr. Int. 2002, 24, 22. [Google Scholar]
- Ali, M.; Saidur, R.; Hossain, M. A review on emission analysis in cement industries. Renew. Sustain. Energy Rev. 2011, 15, 2252–2261. [Google Scholar] [CrossRef]
- Hammoudi, A.; Moussaceb, K.; Belebchouche, C.; Dahmoune, F. Comparison of artificial neural network (ANN) and response surface methodology (RSM) prediction in compressive strength of recycled concrete aggregates. Constr. Build. Mater. 2019, 209, 425–436. [Google Scholar] [CrossRef]
- Ejaz, N.; Akhtar, N.; Hashmi, H.; Naeem, U.A. Environmental impacts of improper solid waste management in developing countries: A case study of Rawalpindi city. Sustain. World 2010, 142, 379–387. [Google Scholar]
- Jayasankar, R.; Mahindran, N.; Ilangovan, R. Studies on concrete using fly ash, rice husk ash and egg shell powder. Int. J. Civ. Struct. Eng. 2010, 1, 362–372. [Google Scholar]
- Sathiparan, N. Utilization prospects of eggshell powder in sustainable construction material–A review. Constr. Build. Mater. 2021, 293, 123465. [Google Scholar] [CrossRef]
- Oliveira, D.A.; Benelli, P.; Amante, E.R. A literature review on adding value to solid residues: Egg shells. J. Clean. Prod. 2013, 46, 42–47. [Google Scholar] [CrossRef]
- Laca, A.; Laca, A.; Díaz, M. Eggshell waste as catalyst: A review. J. Environ. Manag. 2017, 197, 351–359. [Google Scholar] [CrossRef]
- Shiferaw, N.; Habte, L.; Thenepalli, T.; Ahn, J.W. Effect of eggshell powder on the hydration of cement paste. Materials 2019, 12, 2483. [Google Scholar] [CrossRef]
- Guan, J.; Liu, L.; Li, L.; Xie, C.; Khan, M. Mesoscopic model for the fracture of polymethyl methacrylate bone cement. Eng. Fract. Mech. 2024, 303, 110085. [Google Scholar] [CrossRef]
- Chandrasekaran, V.; Vasanth, M.; Thirunavukkarasu, S. Experimental investigation of partial replacement of cement with glass powder and eggshell powder ash in concrete. Civ. Eng. Res. J. 2018, 5, 555662. [Google Scholar] [CrossRef]
- Mehta, A.; Ashish, D.K. Silica fume and waste glass in cement concrete production: A review. J. Build. Eng. 2020, 29, 100888. [Google Scholar] [CrossRef]
- Jiang, X.; Xiao, R.; Bai, Y.; Huang, B.; Ma, Y. Influence of waste glass powder as a supplementary cementitious material (SCM) on physical and mechanical properties of cement paste under high temperatures. J. Clean. Prod. 2022, 340, 130778. [Google Scholar] [CrossRef]
- Bilondi, M.P.; Toufigh, M.M.; Toufigh, V. Experimental investigation of using a recycled glass powder-based geopolymer to improve the mechanical behavior of clay soils. Constr. Build. Mater. 2018, 170, 302–313. [Google Scholar] [CrossRef]
- Xiao, R.; Polaczyk, P.; Zhang, M.; Jiang, X.; Zhang, Y.; Huang, B.; Hu, W. Evaluation of glass powder-based geopolymer stabilized road bases containing recycled waste glass aggregate. Transp. Res. Rec. 2020, 2674, 22–32. [Google Scholar] [CrossRef]
- Shi, C.; Wu, Y.; Riefler, C.; Wang, H. Characteristics and pozzolanic reactivity of glass powders. Cem. Concr. Res. 2005, 35, 987–993. [Google Scholar] [CrossRef]
- ASTM International. Standard Specification for Coal Fly Ash and Raw or Calcined Natural Pozzolan for Use in Concrete; ASTM International: West Conshohocken, PA, USA, 2012; p. 4. [Google Scholar]
- Aliabdo, A.A.; Abd Elmoaty, M.; Aboshama, A.Y. Utilization of waste glass powder in the production of cement and concrete. Constr. Build. Mater. 2016, 124, 866–877. [Google Scholar] [CrossRef]
- Golafshani, E.M.; Behnood, A.; Arashpour, M. Predicting the compressive strength of normal and High-Performance Concretes using ANN and ANFIS hybridized with Grey Wolf Optimizer. Constr. Build. Mater. 2020, 232, 117266. [Google Scholar] [CrossRef]
- Foucquier, A.; Robert, S.; Suard, F.; Stéphan, L.; Jay, A. State of the art in building modelling and energy performances prediction: A review. Renew. Sustain. Energy Rev. 2013, 23, 272–288. [Google Scholar] [CrossRef]
- Song, H.; Ahmad, A.; Farooq, F.; Ostrowski, K.A.; Maślak, M.; Czarnecki, S.; Aslam, F. Predicting the compressive strength of concrete with fly ash admixture using machine learning algorithms. Constr. Build. Mater. 2021, 308, 125021. [Google Scholar] [CrossRef]
- Haykin, S. Neural Networks and Learning Machines, 3/E; Pearson Education India: Hoboken, NJ, USA, 2009. [Google Scholar]
- Rahman, A.A.; Zhang, X. Prediction of oscillatory heat transfer coefficient for a thermoacoustic heat exchanger through artificial neural network technique. Int. J. Heat Mass Transf. 2018, 124, 1088–1096. [Google Scholar] [CrossRef]
- Ford, E.; Kailas, S.; Maneparambil, K.; Neithalath, N. Machine learning approaches to predict the micromechanical properties of cementitious hydration phases from microstructural chemical maps. Constr. Build. Mater. 2020, 265, 120647. [Google Scholar] [CrossRef]
- Lau, C.K.; Lee, H.; Vimonsatit, V.; Huen, W.Y.; Chindaprasirt, P. Abrasion resistance behaviour of fly ash based geopolymer using nanoindentation and artificial neural network. Constr. Build. Mater. 2019, 212, 635–644. [Google Scholar] [CrossRef]
- Konstantopoulos, G.; Koumoulos, E.P.; Charitidis, C.A. Testing novel portland cement formulations with carbon nanotubes and intrinsic properties revelation: Nanoindentation analysis with machine learning on microstructure identification. Nanomaterials 2020, 10, 645. [Google Scholar] [CrossRef]
- Adhikary, B.B.; Mutsuyoshi, H. Prediction of shear strength of steel fiber RC beams using neural networks. Constr. Build. Mater. 2006, 20, 801–811. [Google Scholar] [CrossRef]
- Cook, R.; Lapeyre, J.; Ma, H.; Kumar, A. Prediction of compressive strength of concrete: Critical comparison of performance of a hybrid machine learning model with standalone models. J. Mater. Civ. Eng. 2019, 31, 04019255. [Google Scholar] [CrossRef]
- Ferdosian, I.; Camões, A. Eco-efficient ultra-high performance concrete development by means of response surface methodology. Cem. Concr. Compos. 2017, 84, 146–156. [Google Scholar] [CrossRef]
- Desai, K.M.; Survase, S.A.; Saudagar, P.S.; Lele, S.; Singhal, R.S. Comparison of artificial neural network (ANN) and response surface methodology (RSM) in fermentation media optimization: Case study of fermentative production of scleroglucan. Biochem. Eng. J. 2008, 41, 266–273. [Google Scholar] [CrossRef]
- Esfahanian, M.; Nikzad, M.; Najafpour, G.; Ghoreyshi, A.A. Modeling and optimization of ethanol fermentation using Saccharomyces cerevisiae: Response surface methodology and artificial neural network. Chem. Ind. Chem. Eng. Q. 2013, 19, 241–252. [Google Scholar] [CrossRef]
- Hasan, M.M.; Kabir, A. Prediction of compressive strength of concrete from early age test result. In Proceedings of the 4th Annual Paper Meet and 1st Civil Engineering Congress, Dhaka, Bangladesh, 22–24 December 2011; Volume 2011, pp. 978–984. [Google Scholar]
- Ali, M.; Kumar, A.; Yvaz, A.; Salah, B. Central composite design application in the optimization of the effect of pumice stone on lightweight concrete properties using RSM. Case Stud. Constr. Mater. 2023, 18, e01958. [Google Scholar] [CrossRef]
- Grabiec, A.M.; Piasta, Z. Study on compatibility of cement–superplasticiser assisted by multicriteria statistical optimisation. J. Mater. Process. Technol. 2004, 152, 197–203. [Google Scholar] [CrossRef]
- Mandal, A.; Roy, P. Modeling the compressive strength of molasses–cement sand system using design of experiments and back propagation neural network. J. Mater. Process. Technol. 2006, 180, 167–173. [Google Scholar] [CrossRef]
- Nambiar, E.K.; Ramamurthy, K. Models relating mixture composition to the density and strength of foam concrete using response surface methodology. Cem. Concr. Compos. 2006, 28, 752–760. [Google Scholar] [CrossRef]
- Khan, K.; Ahmad, W.; Amin, M.N.; Rafiq, M.I.; Arab, A.M.A.; Alabdullah, I.A.; Alabduljabbar, H.; Mohamed, A. Evaluating the effectiveness of waste glass powder for the compressive strength improvement of cement mortar using experimental and machine learning methods. Heliyon 2023, 9, e16288. [Google Scholar] [CrossRef]
- Alsharari, F.; Khan, K.; Amin, M.N.; Ahmad, W.; Khan, U.; Mutnbak, M.; Houda, M.; Yosri, A.M. Sustainable use of waste eggshells in cementitious materials: An experimental and modeling-based study. Case Stud. Constr. Mater. 2022, 17, e01620. [Google Scholar] [CrossRef]
- Gallo, C. Artificial neural networks tutorial. In Encyclopedia of Information Science and Technology, 3rd ed.; IGI Global: Hershey, PA, USA, 2015; pp. 6369–6378. [Google Scholar]
- Schilling, A.; Maier, A.; Gerum, R.; Metzner, C.; Krauss, P. Quantifying the separability of data classes in neural networks. Neural Netw. 2021, 139, 278–293. [Google Scholar] [CrossRef] [PubMed]
- Güçlüer, K.; Özbeyaz, A.; Göymen, S.; Günaydın, O. A comparative investigation using machine learning methods for concrete compressive strength estimation. Mater. Today Commun. 2021, 27, 102278. [Google Scholar] [CrossRef]
- Muñoz-Zavala, A.E.; Macías-Díaz, J.E.; Alba-Cuéllar, D.; Guerrero-Díaz-de-León, J.A. A Literature Review on Some Trends in Artificial Neural Networks for Modeling and Simulation with Time Series. Algorithms 2024, 17, 76. [Google Scholar] [CrossRef]
- Khandelwal, M.; Singh, T. Prediction of macerals contents of Indian coals from proximate and ultimate analyses using artificial neural networks. Fuel 2010, 89, 1101–1109. [Google Scholar] [CrossRef]
- Singh, T.; Kanchan, R.; Verma, A.; Saigal, K. A comparative study of ANN and neuro-fuzzy for the prediction of dynamic constant of rockmass. J. Earth Syst. Sci. 2005, 114, 75–86. [Google Scholar] [CrossRef]
- Lippmann, R.P. An introduction to computing with neural nets. ACM SIGARCH Comput. Archit. News 1988, 16, 7–25. [Google Scholar] [CrossRef]
- Kewalramani, M.A.; Gupta, R. Concrete compressive strength prediction using ultrasonic pulse velocity through artificial neural networks. Autom. Constr. 2006, 15, 374–379. [Google Scholar] [CrossRef]
- Habibi, A.; Ramezanianpour, A.M.; Mahdikhani, M.; Bamshad, O. RSM-based evaluation of mechanical and durability properties of recycled aggregate concrete containing GGBFS and silica fume. Constr. Build. Mater. 2021, 270, 121431. [Google Scholar] [CrossRef]
- Luthfi, N.; Fukushima, T.; Wang, X.; Takisawa, K. Significance and Optimization of Operating Parameters in Hydrothermal Carbonization Using RSM–CCD. Thermo 2024, 4, 82–99. [Google Scholar] [CrossRef]
- Ofuyatan, O.M.; Agbawhe, O.B.; Omole, D.O.; Igwegbe, C.A.; Ighalo, J.O. RSM and ANN modelling of the mechanical properties of self-compacting concrete with silica fume and plastic waste as partial constituent replacement. Clean. Mater. 2022, 4, 100065. [Google Scholar] [CrossRef]
- Khan, A.Q.; Awan, H.A.; Rasul, M.; Siddiqi, Z.A.; Pimanmas, A. Optimized artificial neural network model for accurate prediction of compressive strength of normal and high strength concrete. Clean. Mater. 2023, 10, 100211. [Google Scholar] [CrossRef]
- Dahmoune, F.; Remini, H.; Dairi, S.; Aoun, O.; Moussi, K.; Bouaoudia-Madi, N.; Adjeroud, N.; Kadri, N.; Lefsih, K.; Boughani, L. Ultrasound assisted extraction of phenolic compounds from P. lentiscus L. leaves: Comparative study of artificial neural network (ANN) versus degree of experiment for prediction ability of phenolic compounds recovery. Ind. Crops Prod. 2015, 77, 251–261. [Google Scholar] [CrossRef]
- Yang, D.; Zhao, J.; Ahmad, W.; Amin, M.N.; Aslam, F.; Khan, K.; Ahmad, A. Potential use of waste eggshells in cement-based materials: A bibliographic analysis and review of the material properties. Constr. Build. Mater. 2022, 344, 128143. [Google Scholar] [CrossRef]
- Khan, U.A.; Jahanzaib, H.M.; Khan, M.; Ali, M. Improving the tensile energy absorption of high strength natural fiber reinforced concrete with fly-ash for bridge girders. Key Eng. Mater. 2018, 765, 335–342. [Google Scholar] [CrossRef]
- Farooqi, M.U.; Ali, M. Durability evaluation of wheat straw reinforced concrete for sustainable structures. J. Build. Eng. 2024, 82, 108400. [Google Scholar] [CrossRef]
- Akbulut, Z.F.; Guler, S.; Osmanoğlu, F.; Kıvanç, M.R.; Khan, M. Evaluating sustainable colored mortars reinforced with fly ash: A comprehensive study on physical and mechanical properties under high-temperature exposure. Buildings 2024, 14, 453. [Google Scholar] [CrossRef]
- Li, G.; Zhou, C.; Ahmad, W.; Usanova, K.I.; Karelina, M.; Mohamed, A.M.; Khallaf, R. Fly ash application as supplementary cementitious material: A review. Materials 2022, 15, 2664. [Google Scholar] [CrossRef]
- Ahmed, T.; Farooqi, M.; Ali, M. Compressive behavior of rice straw-reinforced concrete for rigid pavements. IOP Conf. Ser. Mater. Sci. Eng. 2020, 770, 012004. [Google Scholar] [CrossRef]
- Soroushian, P. Strength and durability of recycled aggregate concrete containing milled glass as partial replacement for cement. Constr. Build. Mater. 2012, 29, 368–377. [Google Scholar]
- Byars, E.; Zhu, H.; Meyer, C. Use of waste glass for construction products: Legislative and technical issues. In Recycling and Reuse of Waste Materials; Thomas Telford Publishing: London, UK, 2003; pp. 827–838. [Google Scholar]
- Rashad, A.M. A brief on high-volume Class F fly ash as cement replacement–A guide for Civil Engineer. Int. J. Sustain. Built Environ. 2015, 4, 278–306. [Google Scholar] [CrossRef]
- Bilim, C.; Atiş, C.D.; Tanyildizi, H.; Karahan, O. Predicting the compressive strength of ground granulated blast furnace slag concrete using artificial neural network. Adv. Eng. Softw. 2009, 40, 334–340. [Google Scholar] [CrossRef]
- Feng, D.-C.; Liu, Z.-T.; Wang, X.-D.; Chen, Y.; Chang, J.-Q.; Wei, D.-F.; Jiang, Z.-M. Machine learning-based compressive strength prediction for concrete: An adaptive boosting approach. Constr. Build. Mater. 2020, 230, 117000. [Google Scholar] [CrossRef]
- Amiri, M.; Hatami, F. Prediction of mechanical and durability characteristics of concrete including slag and recycled aggregate concrete with artificial neural networks (ANNs). Constr. Build. Mater. 2022, 325, 126839. [Google Scholar] [CrossRef]
- Bonagura, M.; Nobile, L. Artificial neural network (ANN) approach for predicting concrete compressive strength by SonReb. Struct. Durab. Health Monit. 2021, 15, 125–137. [Google Scholar] [CrossRef]
- Ghafari, E.; Costa, H.; Júlio, E. RSM-based model to predict the performance of self-compacting UHPC reinforced with hybrid steel micro-fibers. Constr. Build. Mater. 2014, 66, 375–383. [Google Scholar] [CrossRef]
- Li, Q.; Cai, L.; Fu, Y.; Wang, H.; Zou, Y. Fracture properties and response surface methodology model of alkali-slag concrete under freeze–thaw cycles. Constr. Build. Mater. 2015, 93, 620–626. [Google Scholar] [CrossRef]
- Alyamac, K.E.; Ghafari, E.; Ince, R. Development of eco-efficient self-compacting concrete with waste marble powder using the response surface method. J. Clean. Prod. 2017, 144, 192–202. [Google Scholar] [CrossRef]


| Input Parameters | Output Parameter | ||
|---|---|---|---|
| ESP | WGP | Compressive Strength | |
| Statistical indicators | kg/m3 | kg/m3 | MPa |
| Minimum value | 0.00 | 0.00 | 29.70 |
| Mean value | 32.06 | 32.06 | 44.65 |
| Maximum value | 121.50 | 121.50 | 64.98 |
| Standard Deviation | 40.46 | 40.46 | 6.77 |
| Factors | Response | Code | Factors Level of Code | ||
|---|---|---|---|---|---|
| Intermediate Level 0 | High Level +1 | Low Level −1 | |||
| Cement (kg/m3) | 1 | A | 749.25 | 810 | 688.5 |
| w/c | 1 | B | 0.2727 | 0.2948 | 0.2506 |
| Cement (kg/m3) | 2 | A | 728 | 810 | 646 |
| ESP (kg/m3) | 2 | B | 50.75 | 121.5 | 0 |
| Cement (kg/m3) | 3 | A | 686 | 760 | 612 |
| ESP (kg/m3) | 3 | B | 54 | 108 | 0 |
| Cement (kg/m3) | 4 | A | 728 | 810 | 646 |
| WGP (kg/m3) | 4 | B | 70.25 | 121.5 | 19 |
| Response 1 | Response 2 | ||||||||||
|---|---|---|---|---|---|---|---|---|---|---|---|
| Source | Sum of Squares | Mean Square | F-Value | p-Value | Source | Sum of Squares | Mean Square | F-Value | p-Value | ||
| Model | 325.62 | 65.12 | 105.03 | <0.0001 | significant | Model | 569.92 | 113.98 | 4.89 | 0.0304 | significant |
| A-A | 53.76 | 53.76 | 86.71 | <0.0001 | A-A | 337.05 | 337.05 | 14.45 | 0.0067 | ||
| B-B | 25.46 | 25.46 | 41.07 | 0.0004 | B-B | 7.22 | 7.22 | 0.3095 | 0.5953 | ||
| AB | 0.483 | 0.483 | 0.779 | 0.4067 | AB | 36.66 | 36.66 | 1.57 | 0.2501 | ||
| A2 | 203.35 | 203.35 | 327.97 | <0.0001 | A2 | 13.07 | 13.07 | 0.5605 | 0.4785 | ||
| B2 | 0.3593 | 0.3593 | 0.5795 | 0.4714 | B2 | 118.51 | 118.51 | 5.08 | 0.0588 | ||
| Residual | 4.34 | 0.62 | Residual | 163.23 | 23.32 | ||||||
| Lack of Fit | 4.34 | 1.45 | Lack of Fit | 163.23 | 54.41 | ||||||
| Std. Dev. | 0.7874 | Adjusted R2 | 0.9775 | Std. Dev. | 4.83 | Adjusted R2 | 0.7183 | ||||
| Mean | 42.95 | Predicted R2 | 0.8729 | Mean | 47.09 | Predicted R2 | 0.7045 | ||||
| C.V. % | 1.83 | Adeq Precision | 28.688 | C.V. % | 10.25 | Adeq Precision | 7.823 | ||||
| Response 3 | Response 4 | ||||||||||
| Source | Sum of Squares | Mean Square | F-Value | p-Value | Source | Sum of Squares | Mean Square | F-Value | p-Value | ||
| Model | 520.93 | 104.19 | 5.16 | 0.0266 | significant | Model | 157.44 | 31.49 | 3.74 | 0.0473 | significant |
| A-Cement | 378.1 | 378.1 | 18.71 | 0.0035 | A-Cement | 18.76 | 18.76 | 2.23 | 0.1791 | ||
| B-ESP | 0.0913 | 0.0913 | 0.0045 | 0.9483 | B-WGP | 57.6 | 57.6 | 6.84 | 0.0346 | ||
| AB | 1.16 | 1.16 | 0.0572 | 0.8178 | AB | 74.39 | 74.39 | 8.84 | 0.0207 | ||
| A2 | 3.17 | 3.17 | 0.1569 | 0.7038 | A2 | 5.58 | 5.58 | 0.6632 | 0.4423 | ||
| B2 | 133.54 | 133.54 | 6.61 | 0.037 | B2 | 3.52 | 3.52 | 0.4179 | 0.5386 | ||
| Residual | 141.45 | 20.21 | Residual | 58.91 | 8.42 | ||||||
| Lack of Fit | 141.45 | 47.15 | Lack of Fit | 58.91 | 19.64 | ||||||
| Std. Dev. | 4.5 | R2 | 0.7864 | Std. Dev. | 2.9 | R2 | 0.7277 | ||||
| Mean | 41.62 | Adjusted R2 | 0.7339 | Mean | 43.11 | Adjusted R2 | 0.6756 | ||||
| C.V. % | 10.8 | Predicted R2 | 0.6954 | C.V. % | 6.26 | Predicted R2 | 0.6512 | ||||
| Adeq Precision | 7.692 | Adeq Precision | 9.8965 | ||||||||
Disclaimer/Publisher’s Note: The statements, opinions and data contained in all publications are solely those of the individual author(s) and contributor(s) and not of MDPI and/or the editor(s). MDPI and/or the editor(s) disclaim responsibility for any injury to people or property resulting from any ideas, methods, instructions or products referred to in the content. |
© 2024 by the authors. Licensee MDPI, Basel, Switzerland. This article is an open access article distributed under the terms and conditions of the Creative Commons Attribution (CC BY) license (https://creativecommons.org/licenses/by/4.0/).
Share and Cite
Gao, Y.; Ma, R. A Comparative Study of Machine Learning and Conventional Techniques in Predicting Compressive Strength of Concrete with Eggshell and Glass Powder Additives. Buildings 2024, 14, 2956. https://doi.org/10.3390/buildings14092956
Gao Y, Ma R. A Comparative Study of Machine Learning and Conventional Techniques in Predicting Compressive Strength of Concrete with Eggshell and Glass Powder Additives. Buildings. 2024; 14(9):2956. https://doi.org/10.3390/buildings14092956
Chicago/Turabian StyleGao, Yan, and Ruihan Ma. 2024. "A Comparative Study of Machine Learning and Conventional Techniques in Predicting Compressive Strength of Concrete with Eggshell and Glass Powder Additives" Buildings 14, no. 9: 2956. https://doi.org/10.3390/buildings14092956
APA StyleGao, Y., & Ma, R. (2024). A Comparative Study of Machine Learning and Conventional Techniques in Predicting Compressive Strength of Concrete with Eggshell and Glass Powder Additives. Buildings, 14(9), 2956. https://doi.org/10.3390/buildings14092956