Article

Study on the Influence of Spatial Attributes on Passengers’ Path Selection at Fengtai High-Speed Railway Station Based on Eye Tracking

1
School of Architecture and Design, Beijing Jiaotong University (BJTU), Beijing 100044, China
2
Department of Horticulture & Landscape Architecture, Oklahoma State University, Oklahoma City, OK 73107, USA
*
Author to whom correspondence should be addressed.
Buildings 2024, 14(9), 3012; https://doi.org/10.3390/buildings14093012
Submission received: 22 August 2024 / Revised: 11 September 2024 / Accepted: 18 September 2024 / Published: 22 September 2024

Abstract

:
The average daily throughput of large-scale passenger high-speed railway stations is large, and the design of the inbound space connecting with the underground and other modes of transport affects the passengers’ wayfinding behaviour and time spent, which in turn affects the efficiency of the inbound station. How to optimise the design of station entry space and signage arrangement becomes the key to shortening the station entry time. In this paper, eye tracking, spatial syntax, and semantic difference methods are used to evaluate the passenger’s wayfinding process in the underground hub of a large high-speed railway station and the spatial syntax is used to quantify and analyse the wayfinding path segments, to explore the influence of the spatial attributes of different nodes and the spatial arrangement of the guiding signs on the passenger’s wayfinding behaviour data and the difference in attention, and to find out that the connectivity of the wayfinding nodes, the area of the field of view, and the passengers’ The study concludes that the connectivity and visual field area of wayfinding nodes have a strong positive correlation with the passengers’ route choice time, which has less influence on the correct rate of wayfinding and can be taken into less consideration in the subsequent design. While analysing the spatial density of signs and the correct rate of wayfinding in the sample, it is concluded that the density of guide signs is maintained in the interval of 5–11‰, and at the same time, the number is sufficient to point to the destination is a more appropriate interval, and ultimately, the impact of the correct rate of wayfinding of the weighting of the following: signage focus on the time > density of information > density of key information > diameter of the pupil. The study analyses the influencing factors affecting passengers’ wayfinding behaviour from a human factors perspective and provides feedback on the design of underground entry spaces in large passenger high-speed rail stations.

1. Introduction

The “13th Five-Year Plan” period is an important milestone in the history of Beijing’s development, and the development of Beijing’s transport industry has achieved remarkable results. Five large-scale high-speed railway passenger stations have been built in Beijing, and the number of passengers throughput at major high-speed railway passenger stations in Beijing is among the highest in the country, initially building the shape of “Beijing-Tianjin-Hebei on the railway”. However, in the complex internal environment of high-speed railway stations, passengers often lose their way and waste time. Passengers are often confronted with intricate passages, signs, and the distribution of various service facilities in high-speed railway stations. Traditional navigation methods, such as signage and maps, are often unable to meet the needs of passengers, and with the short station entry time, wayfinding is the main task, and passengers want to arrive at the target location in the most efficient way, and time efficiency is of significant significance. Optimising wayfinding behaviour is important for the design enhancement of the traffic space and the optimal configuration of the auxiliary signage system.

2. Research Significance

For the in-depth excavation of traffic spatial wayfinding behaviour influencing factors, the analysis technology and experimental means put forward higher requirements. In the current research on spatial wayfinding behaviour using a variety of presentation methods: the field reality scene, virtual reality three-dimensional model, panoramic photographs, etc., the degree of simulation decreases in turn. At the same time, the research objectives are aimed at sign layout and colour pattern, traffic space pattern, plane layout, visual field area, and other aspects, but roughly divided into two aspects: guide signs and space pattern. The selected indexes are divided into two types of parameters: the number of wayfinding errors, wayfinding time, route choice, walking trajectory, walking path, speed, direction change, and other behavioural data; the scene of different environmental elements of the gaze time, the number of times, the order of the gaze, and other eye movement data [1]. Research technology: eye-tracking technology, behavioural experiments, cognitive mapping, and other means of assistance. The research goal is to understand people’s navigation behaviour, escape, and cognitive process in different architectural environments, to explore how to improve the layout and design of architectural space, and ultimately improve the efficiency and experience of wayfinding [2,3].
There have been a number of studies on the influence of different types of traffic space planar spatial attributes and signage layout on wayfinding behaviour, which concluded that linear space, simple space is easy to develop wayfinding behaviour, or in a certain type of space subjects pay more attention to a certain type of spatial elements. However, there are still some problems in the current research. First, the research on traffic space interchange is still more concentrated in the subjective qualitative stage, or the degree of quantification is not enough, and it is on the way to the researcher’s own subjective cognitive conclusions about the influence of passengers’ wayfinding, and it lacks scientific definitions and data analysis. Secondly, although some of the research combines the quantification of subjective feelings of the passengers by the scientific instruments and at the same time analyses the coupling with the attributes of the traffic space, there are some problems in the experimental parameters. Secondly, although some studies have combined scientific instruments to quantify passengers’ subjective feelings and coupled them with spatial attributes of traffic, there are problems of relatively single experimental parameters, incomplete experimental methodology, and single experimental environment, which have failed to establish a scientific link between passengers’ neurophysiological data and environmental attributes [4]. Therefore, this study quantifies spatial attributes and human physiological feelings on the basis of previous studies, creates an immersive spatial experience, adopts subjective questionnaires, obtains experimental data at the level of wayfinding cognition and efficiency, obtains the coupling relationship between psychological, physiological, and efficiency of human perception, and ultimately analyses the correlation between spatial attributes of buildings, the spatial content of signs, and human perception.

3. Research Status

In previous studies on the effect of spatial openness on subjects’ wayfinding, Xu Jian (2019) [5] simulated the process of subjects’ fighting in a subway station and concluded that a nonlinear planar surface would increase the distance travelled by passengers, while a good visual field and line-of-sight accessibility would contribute to the establishment of paths. Spatial reference; Sun Cheng (2018) [6] concluded in a wayfinding experiment for large commercial spaces that malls with linear plan layouts can provide clearer spatial references for customers; Ye Yingqi (2021) [7] concluded in a campus wayfinding experiment that the probability of hesitant wayfinding behaviours and turning back behaviours increased dramatically in spaces with a higher spatial depth of field of view; Bi Hai (2021) [8] studied tourists’ wayfinding experiments using the visual field method in a showroom wayfinding space and concluded that: spaces with a larger area of spatial field of view have more environmental information in order to select the correct direction, and the efficiency of wayfinding is also lower; Weidai Wei (2023) [9], in a study of different planar forms for elderly people’s wayfinding, concluded that divergent nodes in corridors can make it difficult for elderly people to make choices. Previous studies have concluded that a wider space reduces the wayfinding efficiency of passengers, but they have not quantified it in detail, and the conclusions are more dependent on subjective qualitative judgements, i.e., human judgements or only based on the eye-movement heat map to determine that the presence of environmental elements makes the subjects shorten the distance of the wayfinding, which is a lack of quantitative analysis and scientific definitions; therefore, the present study uses the spatial syntactic method to quantify spatial attributes of the specific space and analyse the coupling of spatial attributes with the correctness of the wayfinding and correctness coupled analysis.
For the study of spatial signage on subjects’ wayfinding, Qi Yi (2021) [10] concluded in a wayfinding experiment in hospital outpatient space that patients pay more attention to the signage system in the wayfinding space of the clinic, followed by the atrium space and mechanical devices such as escalators; Cao Mengmeng (2020) [11] has already concluded that the ranking of passengers’ attention in large-scale passenger transportation hubs in Beijing is as follows: architectural environment > visual guide signs > advertising; Xu Leiqing (2009) [12], in a virtual reality simulation of subway station wayfinding experiments, concluded that a sign density of about 20 m is more conducive to wayfinding efficiency than densities of less than 10 m and more than 60 m; Zhao Yimangan (2023) [13], in a study on the differences in attention paid to different spatial elements of subway stations by residents with different years of residence, concluded that the longer the residents live in subway stations, the more attention is paid to scenic elements other than guide signs and warning signs. The longer the residents live, the more they pay attention to spatial elements other than guide signs and warning signs. Previous studies have not been detailed enough in the classification of signs, and the dependent variable in most of the studies is wayfinding efficiency, and the relationship with the correct rate of wayfinding has not been explored. In this study, we further subdivided the signs of different scenes, utilised the AOI to classify each scene, and introduced the density parameter of scene signs to quantify the environmental elements, so as to reveal the impact of the attention to different scene elements on the efficiency of the wayfinding of the subjects as well as the correct rate of wayfinding.

4. Research Purpose

This study focuses on the underground transfer at Fengtai Station, a large passenger station in Beijing, and adopts a quantitative analysis approach by segmenting the wayfinding task according to different spatial attributes and the spatial share of signs, applying spatial syntax analysis to all segments to find out their spatial attribute indexes, and compiling statistics on the share of signs in the scenario, in order to explore the effects of different spatial attributes of transportation and the share of signs on the wayfinding behaviour of the subjects (time consumed for wayfinding, degree of difficulty, number of wayfinding errors) and the differences in attention to different environmental factors. (time spent on wayfinding, difficulty, and number of wayfinding errors) and the effect of different environmental factors on the attention of the subjects.
The study investigates which elements of the final orientation scenario and the subjects’ behaviour influence the correctness of the subjects’ wayfinding and the strength of each influence factor. The aim of the study is to optimise the spatial arrangement of the traffic space and the signage ratio to reduce the wayfinding time of the subjects, increase the correct wayfinding rate, and improve the efficiency of the subjects in entering the station (Figure 1).
This study uses real-life photographs to simulate passengers’ wayfinding inbound behaviours in the underground connecting space of a high-speed rail station, focussing on solving four problems:
Impacts of different spatial attributes, such as the area of view of the transportation space of high-speed rail stations, on passengers’ path selection.
Impact of different environmental elements of high-speed railway station transportation space on passenger route choice efficiency.
Impact of different subjective evaluations on passengers’ attention to environmental elements.
Factors affecting the correctness of wayfinding behaviour of passengers in the traffic space of high-speed rail stations and their respective strengths and weaknesses.

5. Research Methodology

Experimental Methodology

The combination of high-speed railway station and underground station hub can be varied and roughly divided into four types—away type, proximity separation type, integrated side-by-side type, and integrated overlap type. Before the experiment, the major high-speed railway passenger stations in Beijing (Qinghe Station, Beijing South Station, West Station, North Station, Fengtai Station, etc.) were investigated, and the Fengtai High-speed Railway Station in Beijing selected in this study is an integrated juxtaposition layout, i.e., the halls of the high-speed railway and the underground overlap up and down spatially, so that the passengers need to walk less distance to enter the station, and it is more suitable as an experimental object because it is a linear space for the underground traffic hub to enter the station and the route of the wayfinding route is more complicated for the connecting routes.
As shown in Figure 2, the red line is the correct route for the subjects to enter the station, and 1–6 are several key nodes in the path selected for the occurrence of path bifurcation, according to the actual route to the station to create a picture of the path choice procedure: in accordance with the order of the entry route to the station to take photos of the real scene, the pictures according to the direction of the different labels with a digital label (1,2,3), as shown in Figure 3, the different labels correspond to the different directions of the path-finding process, the subjects according to the scene marking and the spatial environment to make a choice. Subjects, according to the scene marking, and spatial environment, make a choice, press the digital button, and the program will automatically simulate the process of travelling. The next level of photographs is also based on the path in the picture marked with each direction (with 1, 2, and 3 on behalf of the); if it is found that the path is the wrong way, according to esc to return to the last level to make a new choice (simulate the wrong way situation), arrive at the station hall level, and then the prompts to the end of the experiment.
The experimental object selected 35 22–26-year-old students, subjects wearing physiological sensors to watch the screen; the screen shows the path selection procedure; the experiment is based on the ergolab platform V3.17 version; the use of a screen-based eye-tracking instrument synchronous recording of eye movement data; at the end of the experiment, subjects uniformly fill out a subjective evaluation questionnaire. The questionnaire was based on the semantic differential method, with −3 representing negatively poor or unable to complete the indicator and 3 representing positively good or able to complete the indicator, and the subjective evaluation of the openness, brightness, detail, and planar complexity of each wayfinding node, as well as the sense of direction during the process of wayfinding, the sense of getting lost, and whether the signage was able to effectively point to the destination. At the same time, we played back the statistical data of the wayfinding process, such as wayfinding efficiency, wayfinding correct rate, and so on.
In this study, wayfinding efficiency is quantified by wayfinding elapsed time, i.e., the shorter the wayfinding time, the higher the wayfinding efficiency. The correct rate of wayfinding represents the correct rate of making choices before reaching the destination during the wayfinding process, which is quantified by the number of errors in this study, and the fewer the number of errors in the choices, the higher the efficiency of the wayfinding process (Table 1).

6. Conclusion of the Experiment

6.1. Conceptual Definition

Segment the wayfinding path, select the five key intersections on the wayfinding node, quantify the spatial attributes of the signs in the scene, and introduce two parameters: information density and key information density, which represent the proportion of all signs or hints with information in the scene, and the proportion of signs or hints with the ability to point to the final destination, i.e., after dissecting out the irrelevant signs, as shown in Figure 4 and Figure 5. As shown in Figure 4 and Figure 5, node ③ is selected to divide all the signs within the scene and the signs pointing to the waiting room alone, i.e., the white area on the picture, and calculate its percentage in the scene.
At the same time, spatial syntactic parameters are introduced to quantitatively analyse the five nodes on the pathfinding path as in Figure 6, the meanings of some of the spatial syntactic parameters are derived from the Glossary of Spatial Syntactic Terminology, as shown in Table 2 below, such as connectivity, etc. The spatial attribute values of each spatial node are calculated with the help of depthmap software Beta 1.0 as in Table 3.
Playback of all the subjects’ pathfinding videos and with the help of ergolab platform statistics of the basic situation of the subjects’ pathfinding, statistics as in Figure 7, a total of 35 subjects participated in the experiment, of which 22.9% of the subjects did not occur choice error to reach the target point. The pathfinding process took an average of 52.53 s; the average pathfinding per node took an average of 10.51 s; the average number of times the average single intersection of the subjects’ average choice was 1.45 times; at the same time, 90.5% of the subjects occurred pathfinding errors mainly occurred in intersection three and intersection four, other parts occurred fewer errors. At the same time, 90.5% of the subjects’ pathfinding errors occurred mainly in intersection three and intersection four, and fewer errors occurred in other parts.

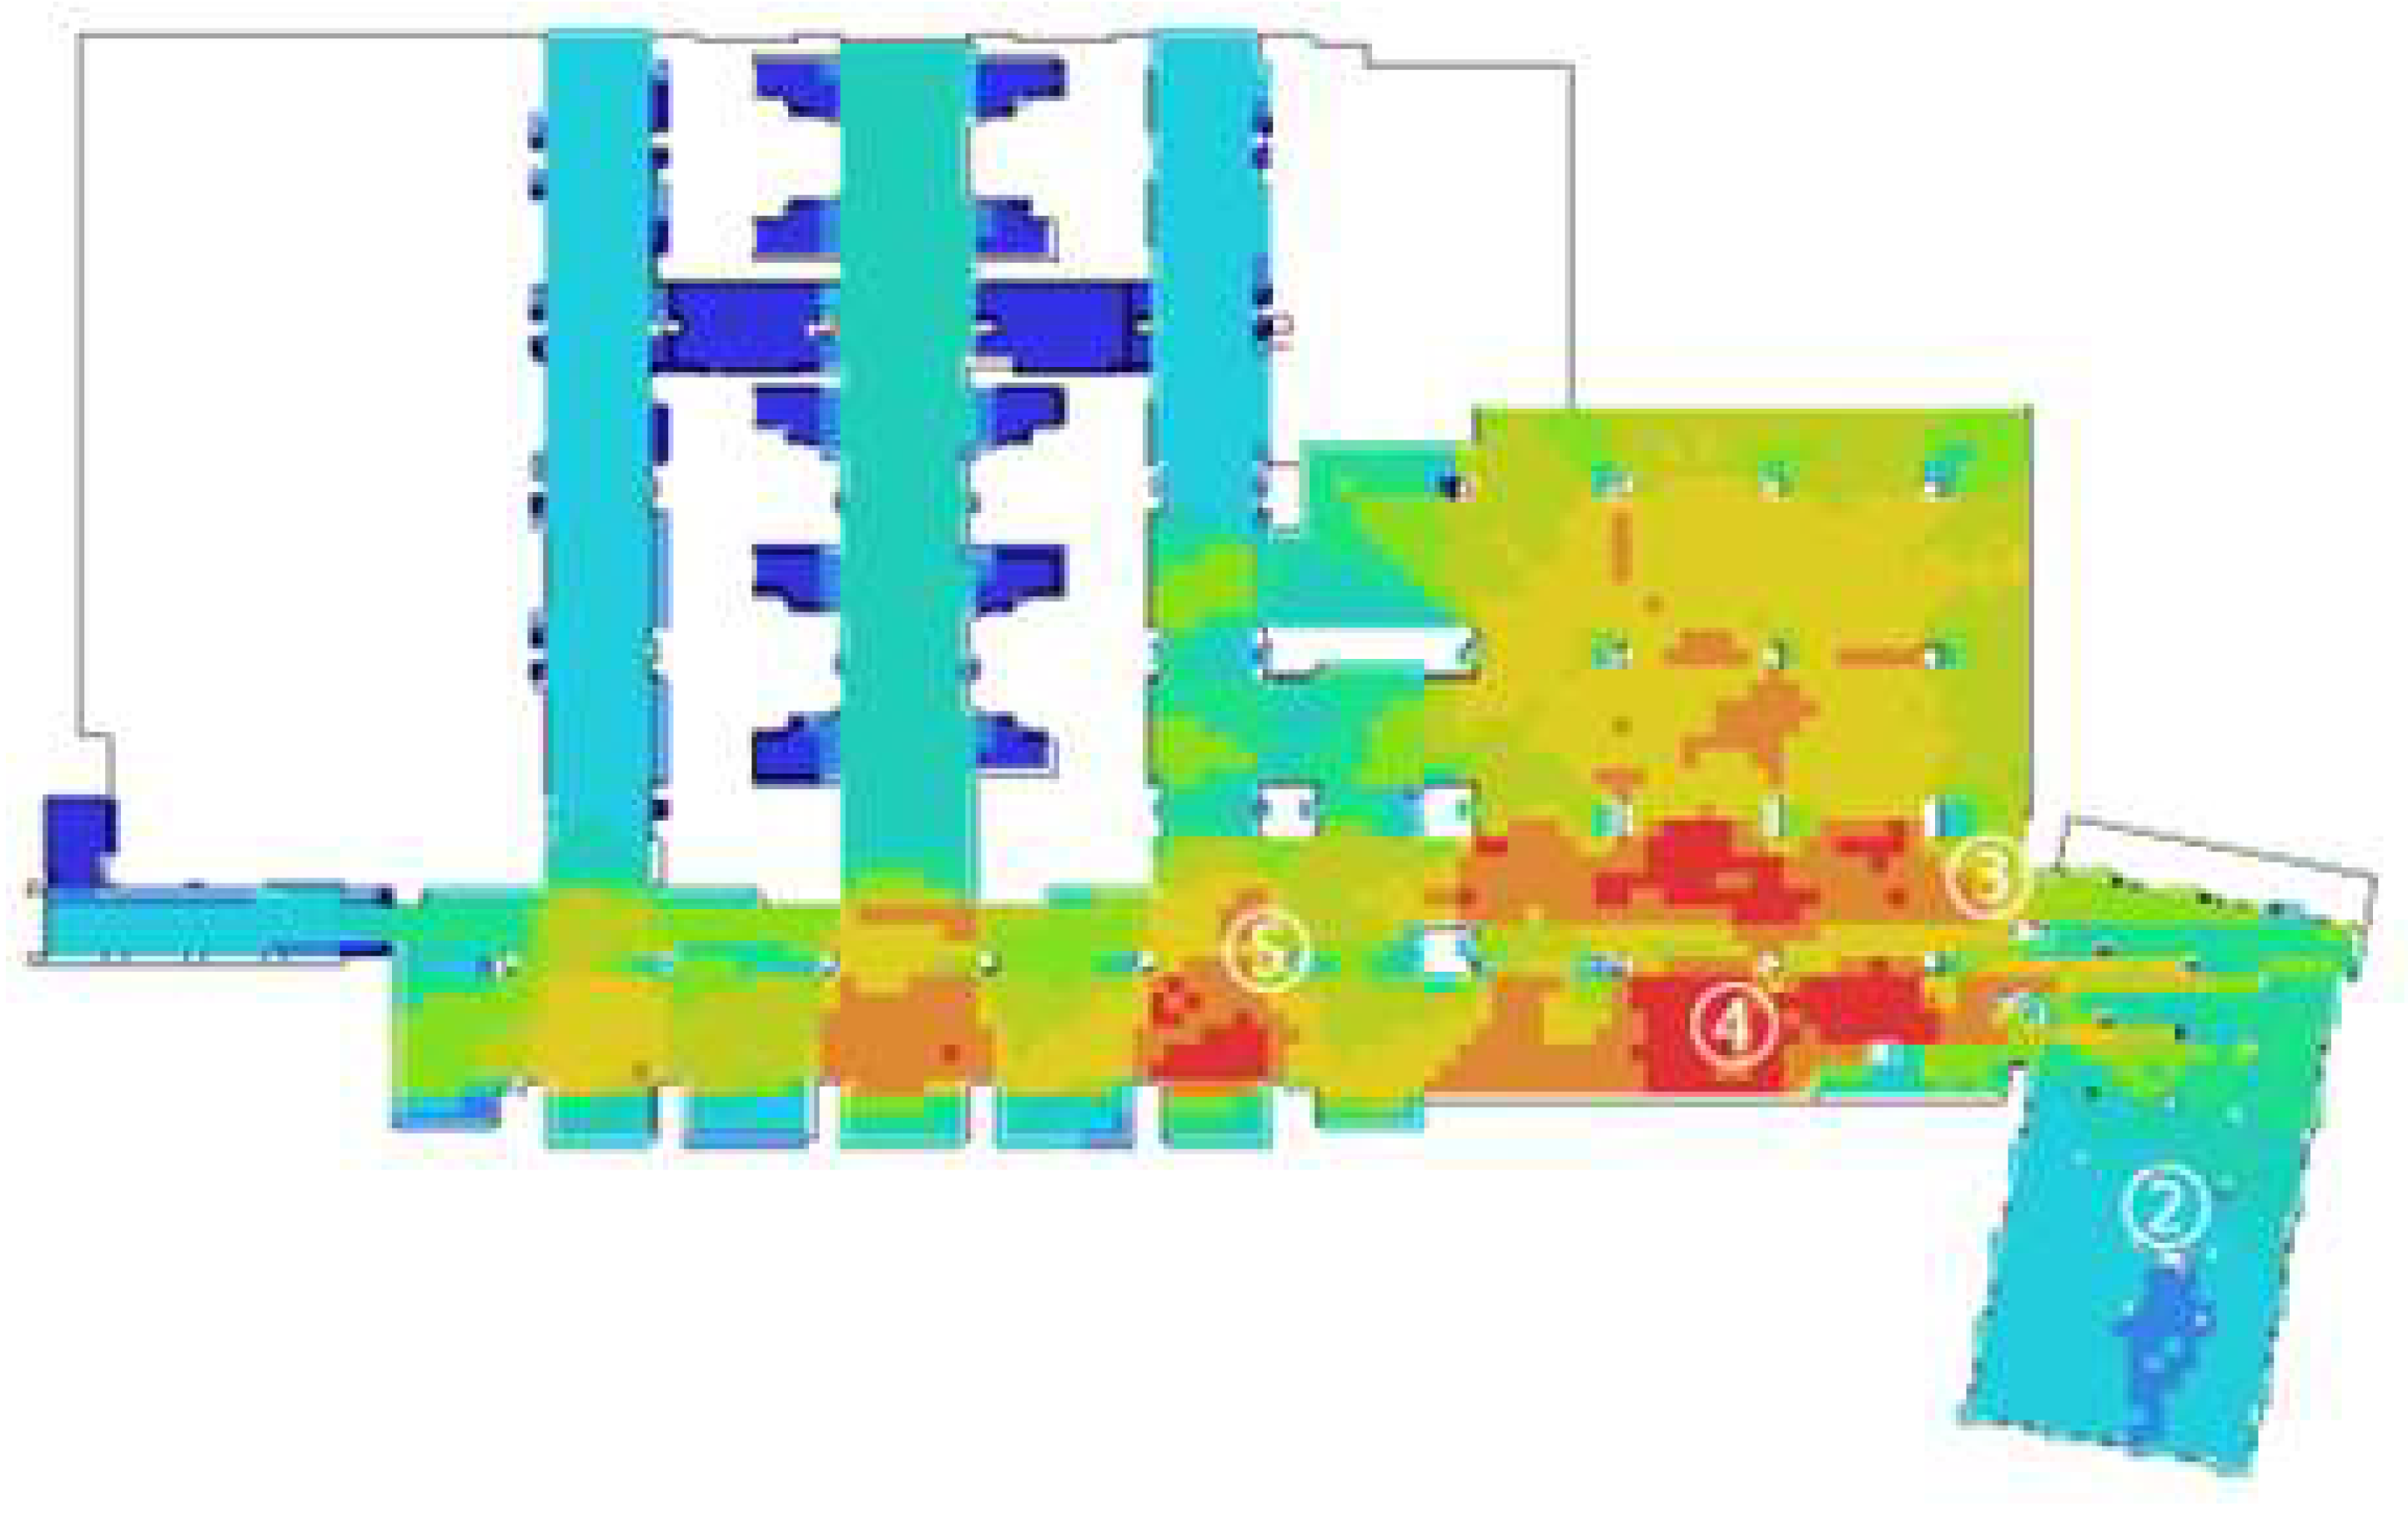
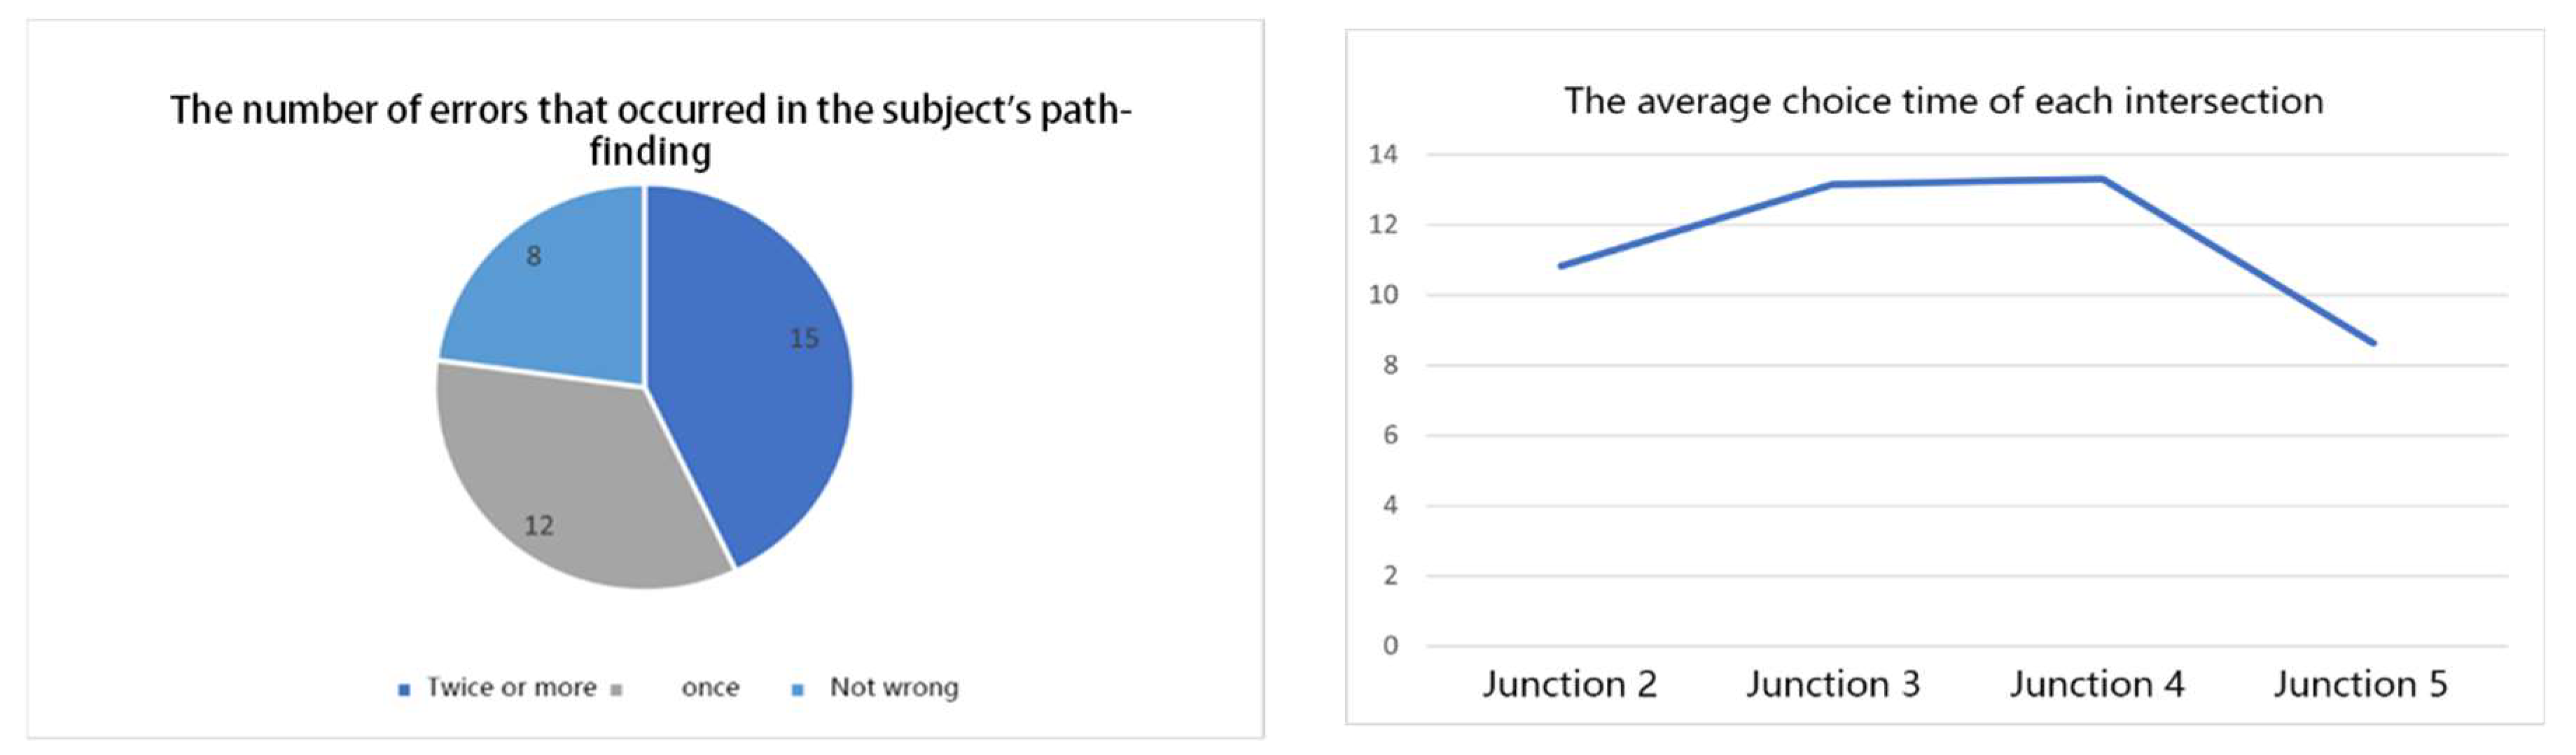
6.2. The Effect of Spatial Attributes of Pathfinding Nodes on Subjects’ Pathfinding Behaviour and Efficiency

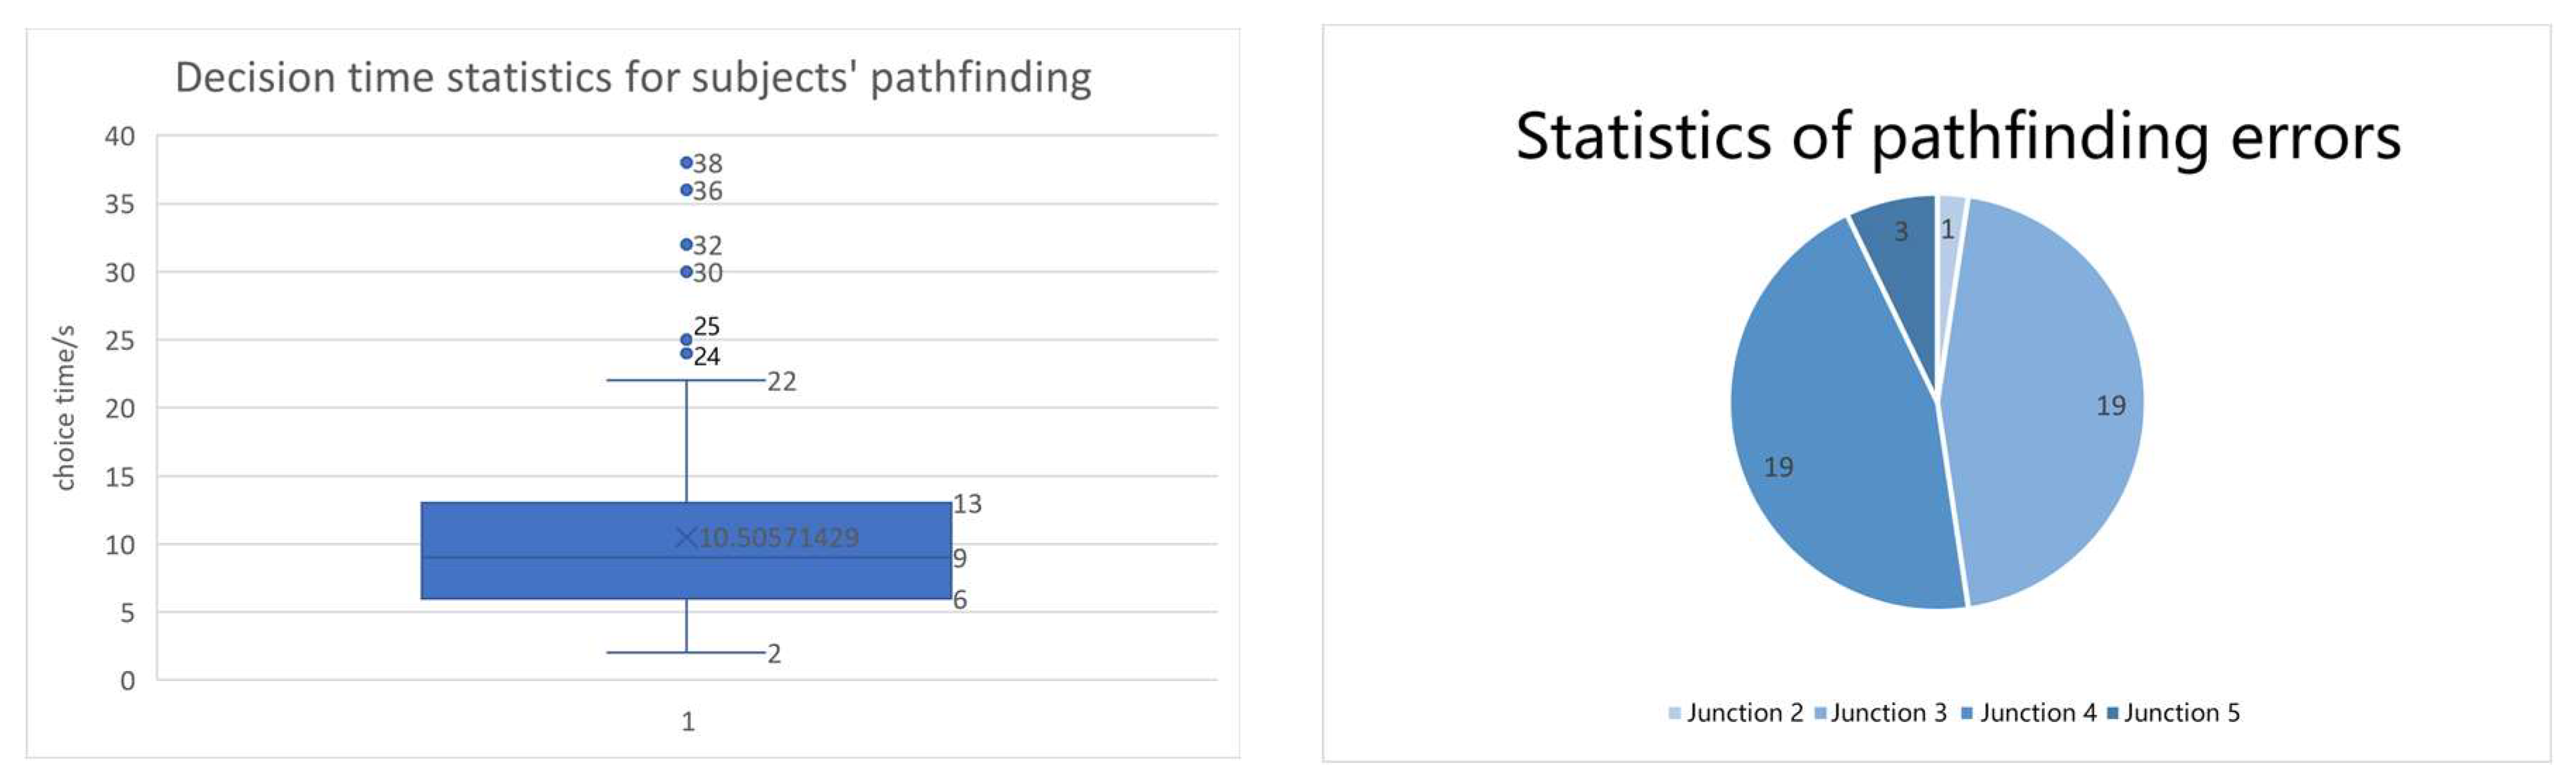
Effect of Spatial Attributes of Pathfinding Nodes on the Difficulty of Pathfinding for Subjects

Statistical subjects each pathfinding node choice of the time spent, representing the subject in this node pathfinding difficulty, choice time increases means that subjects need to spend more time to make a choice, the intersection of the pathfinding difficulty is also greater, the node’s spatial attribute parameters and the corresponding intersection choice time correlation analysis in Table 4 can be obtained from the subject’s path choice time (M = 10.51. SD = 6.630) with the degree of connection (M = 10.51. SD = 1106.81), the field of view area (M = 10.51. SD = 1110.76), and average depth (M = 10.51. SD = 0.26); meanwhile, there are significant negative correlations with compactness (M = 10.51. SD = 0.02) and entropy (M = 10.51. SD = 0.15), which indicate that, with the increase of the area of visual field and connectivity increase, the space becomes more open, and the difficulty of the subjects’ path choice rises, and the two show a strong positive correlation. (M refers to the mean of this value, while SD refers to the standard deviation) (Table 4).
The information density of the node and choice time were analysed for correlation, and the results in Table 5 showed that there was a significant positive correlation between the information density of the scene (M = 0.0215, SD = 0.0119) and the choice time (M = 10.51, SD = 6.630), and there was no correlation with the density of the key information, which indicated that the more the scene’s marking cues were, the longer the subjects needed to spend on the intersection choice time, but there was not a strong correlation with the key information pointing to the goal within the scene, and the correlation was not strong. The correlation was not strong, with the key information pointing to the target within the scene (Table 5).

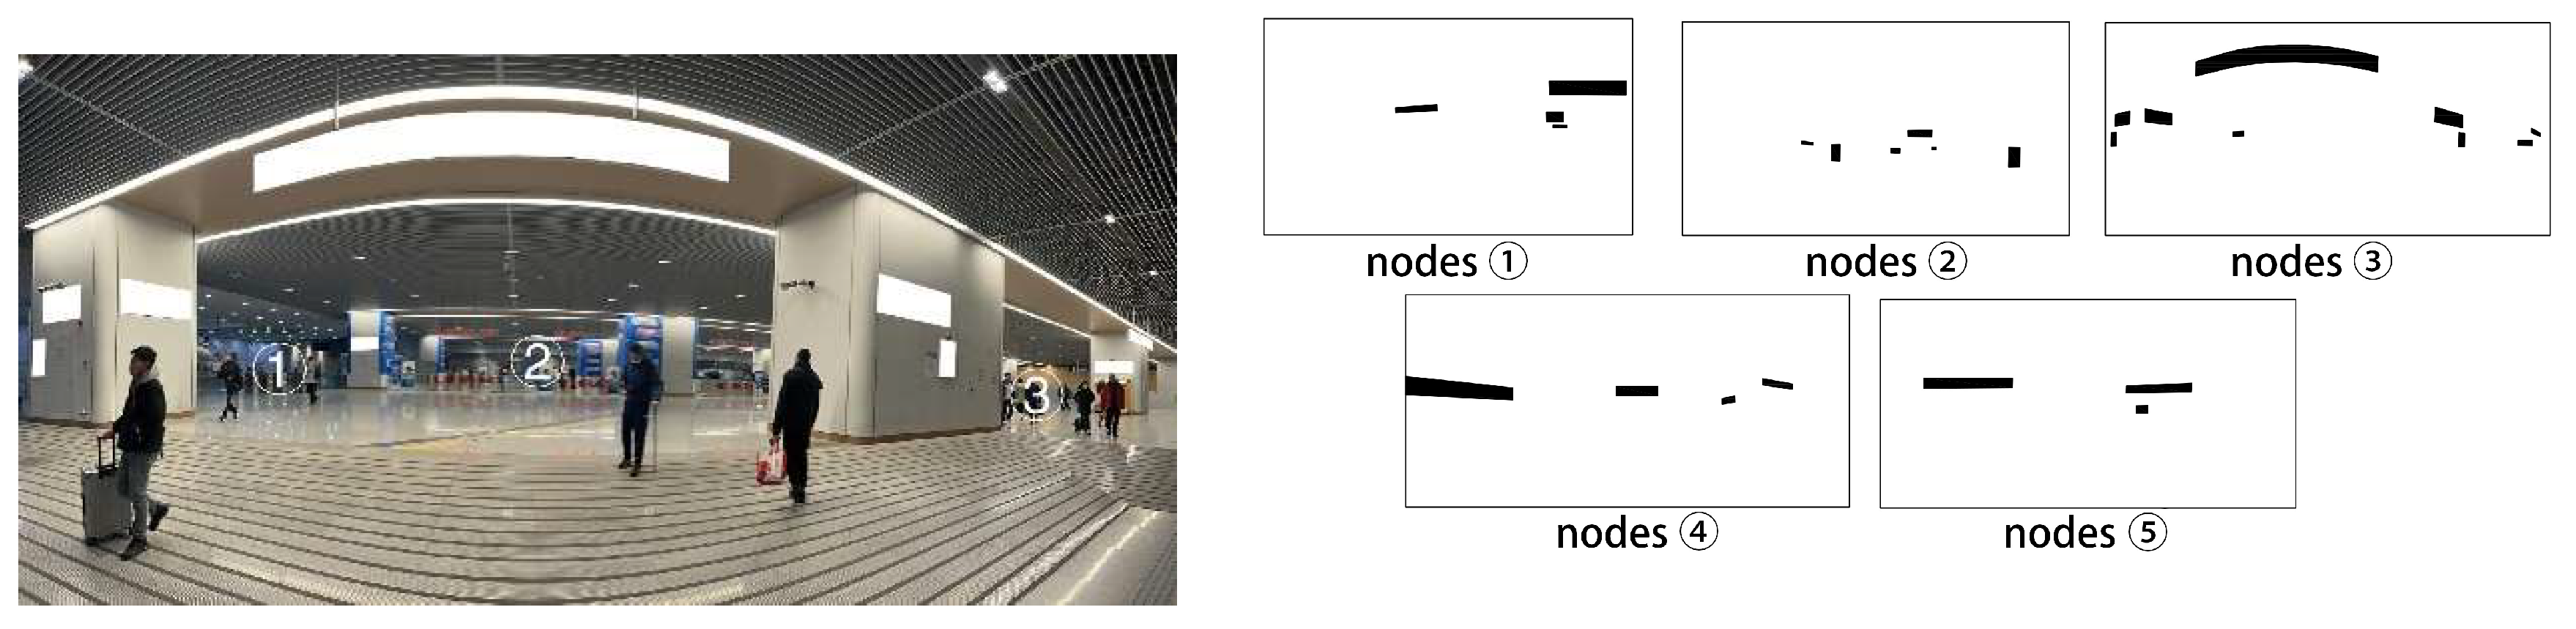
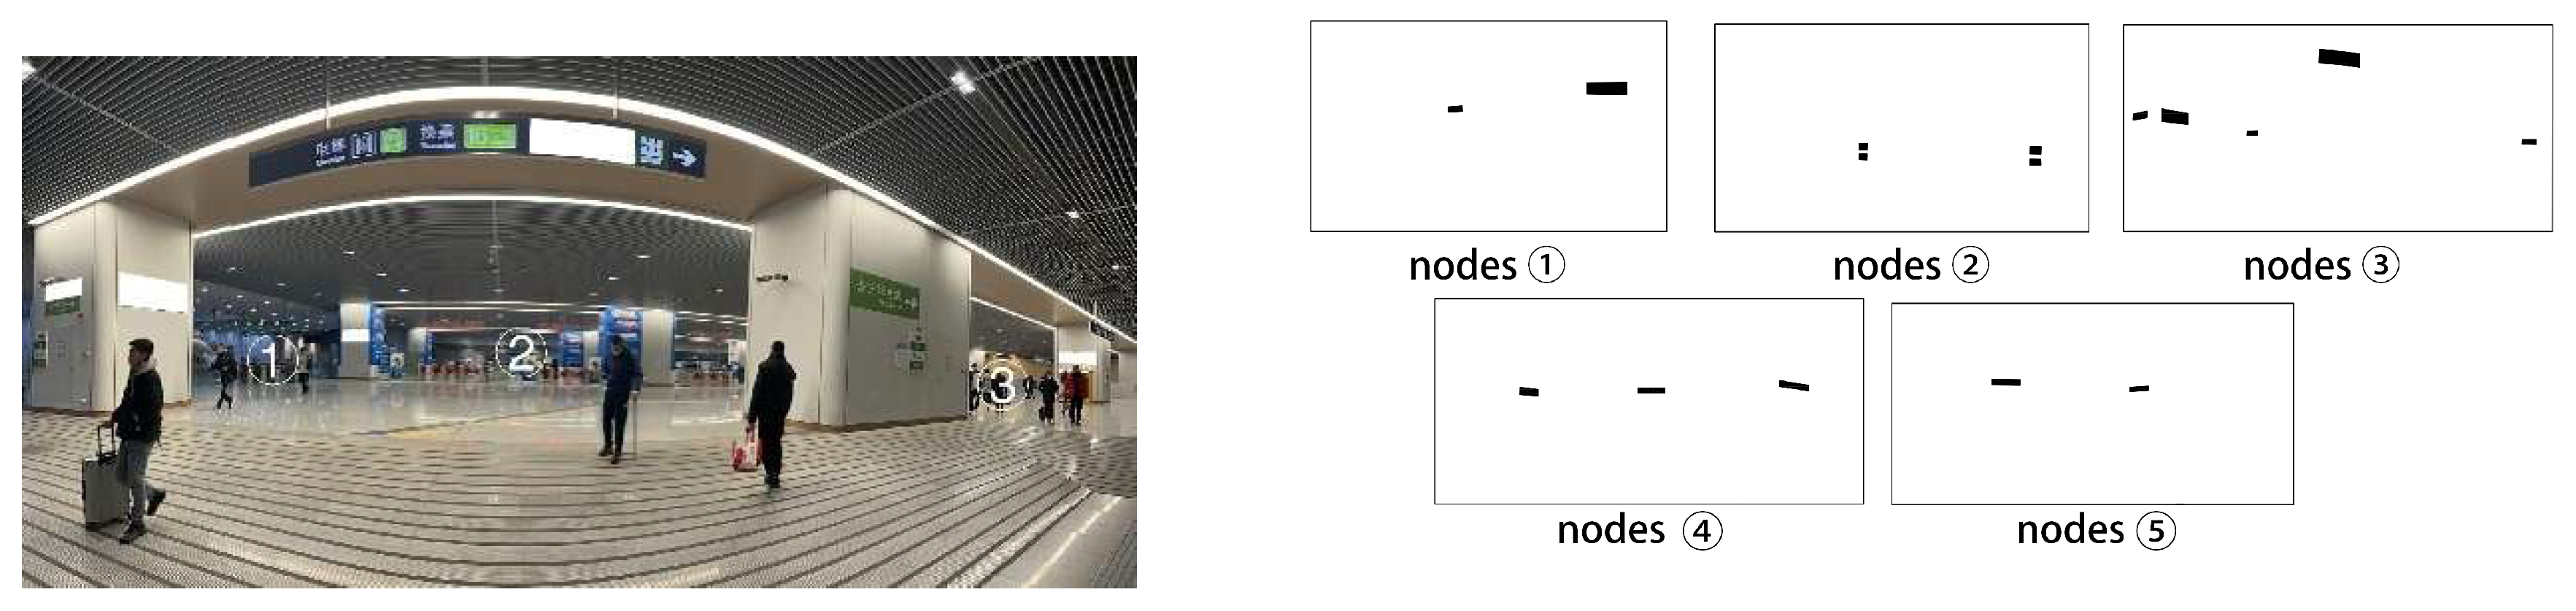
6.3. Differences in Subjects’ Visual Attention Allocation under Different Spatial Attributes of Wayfinding Nodes

AOI (Area Of Interest) partitioning was performed for each node scene, and the wayfinding scene was divided into four main partitions: message board—signs or signs with messages; environmental element—including structures such as roofs, floors, and walls; population—pedestrian components; and mechanisms—such as commercial facilities and transportation equipment in Figure 8. The eye movement data of the subjects in each AOI partition during the wayfinding process were counted: (i) the proportion of the total visit duration, representing the subjects’ attention to different elements in the scene; (ii) the average visit duration, representing the subjects’ attention to different elements or the degree of difficulty in understanding; and (iii) the pupil diameter, representing the cognitive load of the subjects in the scene (Figure 8).
At the same time, the spatial attributes of each node are analysed in correlation with the subjects’ attention. Subjects’ attention times for the four different partitions of the scene’s mechanical devices, crowd, guide signs, and environmental parts are represented by using Tm, Tp, Tmb, and Te, respectively. And the results are shown in Table 6: With the enhancement of the connectivity of the wayfinding nodes, the area of the visual field, the compactness, and the exclusion of obstruction, the subjects’ attention time for the guiding signs rises constantly, and the subjects’ attention for the surroundings is negatively correlated with the compactness and the integration degree and positively correlated with the exclusion of obstruction, the entropy, and the average depth. Reflecting on the real design, the more open and complex the traffic space is, the more guide signs should be arranged.
The information density of each node was also analysed for correlation with the subjects’ attention, and the results can be seen in Table 7: Information density (M = 0.0215, SD = 0.0119) was significantly contended positively correlated with the total access duration to the mechanical part (M = 7.183, SD = 11.097) and to the informational part (M = 24.701, SD = 19.201), and at the same time, the key information density (M = 0.0058, SD = 0.0032) had a significant positive correlation (M refers to the mean, SD refers to the standard deviation) with the total access duration to the information marking section (M = 24.701, SD = 19.201) for that scenario. With the improvement of the density of the signage information in the scene, the subjects pay more attention to the information signage in the scene, which is reflected in the signage design of the real high-speed railway station traffic space. The signage in the scene can be moderately set up, and it is too dense, which will increase the passenger’s time of searching and decision-making and enhance the difficulty of searching.

6.4. The Effect of the Number of Rides Taken by the Subjects on Eye Movement Attention

At the same time, the number of rides in Fengtai HSR station in the past six months was counted, representing the subjects’ familiarity with Fengtai station, and the correlation between the subjects’ familiarity with Fengtai station and the scene elements’ eye movement data were analysed in Table 8, and the results showed that there was a significant negative correlation between the number of rides (M = 0.914286, SD = 1.147156) and the number of information parts (M = 7.183, SD = 11.097) and information parts (M = 24.701, SD = 19.201). 24.701, SD = 19.201) have a significant negative correlation, indicating that in the actual wayfinding process, the more familiar with the wayfinding scene, the less attention will be paid to the part of pointing signs and traffic machinery (Table 8).

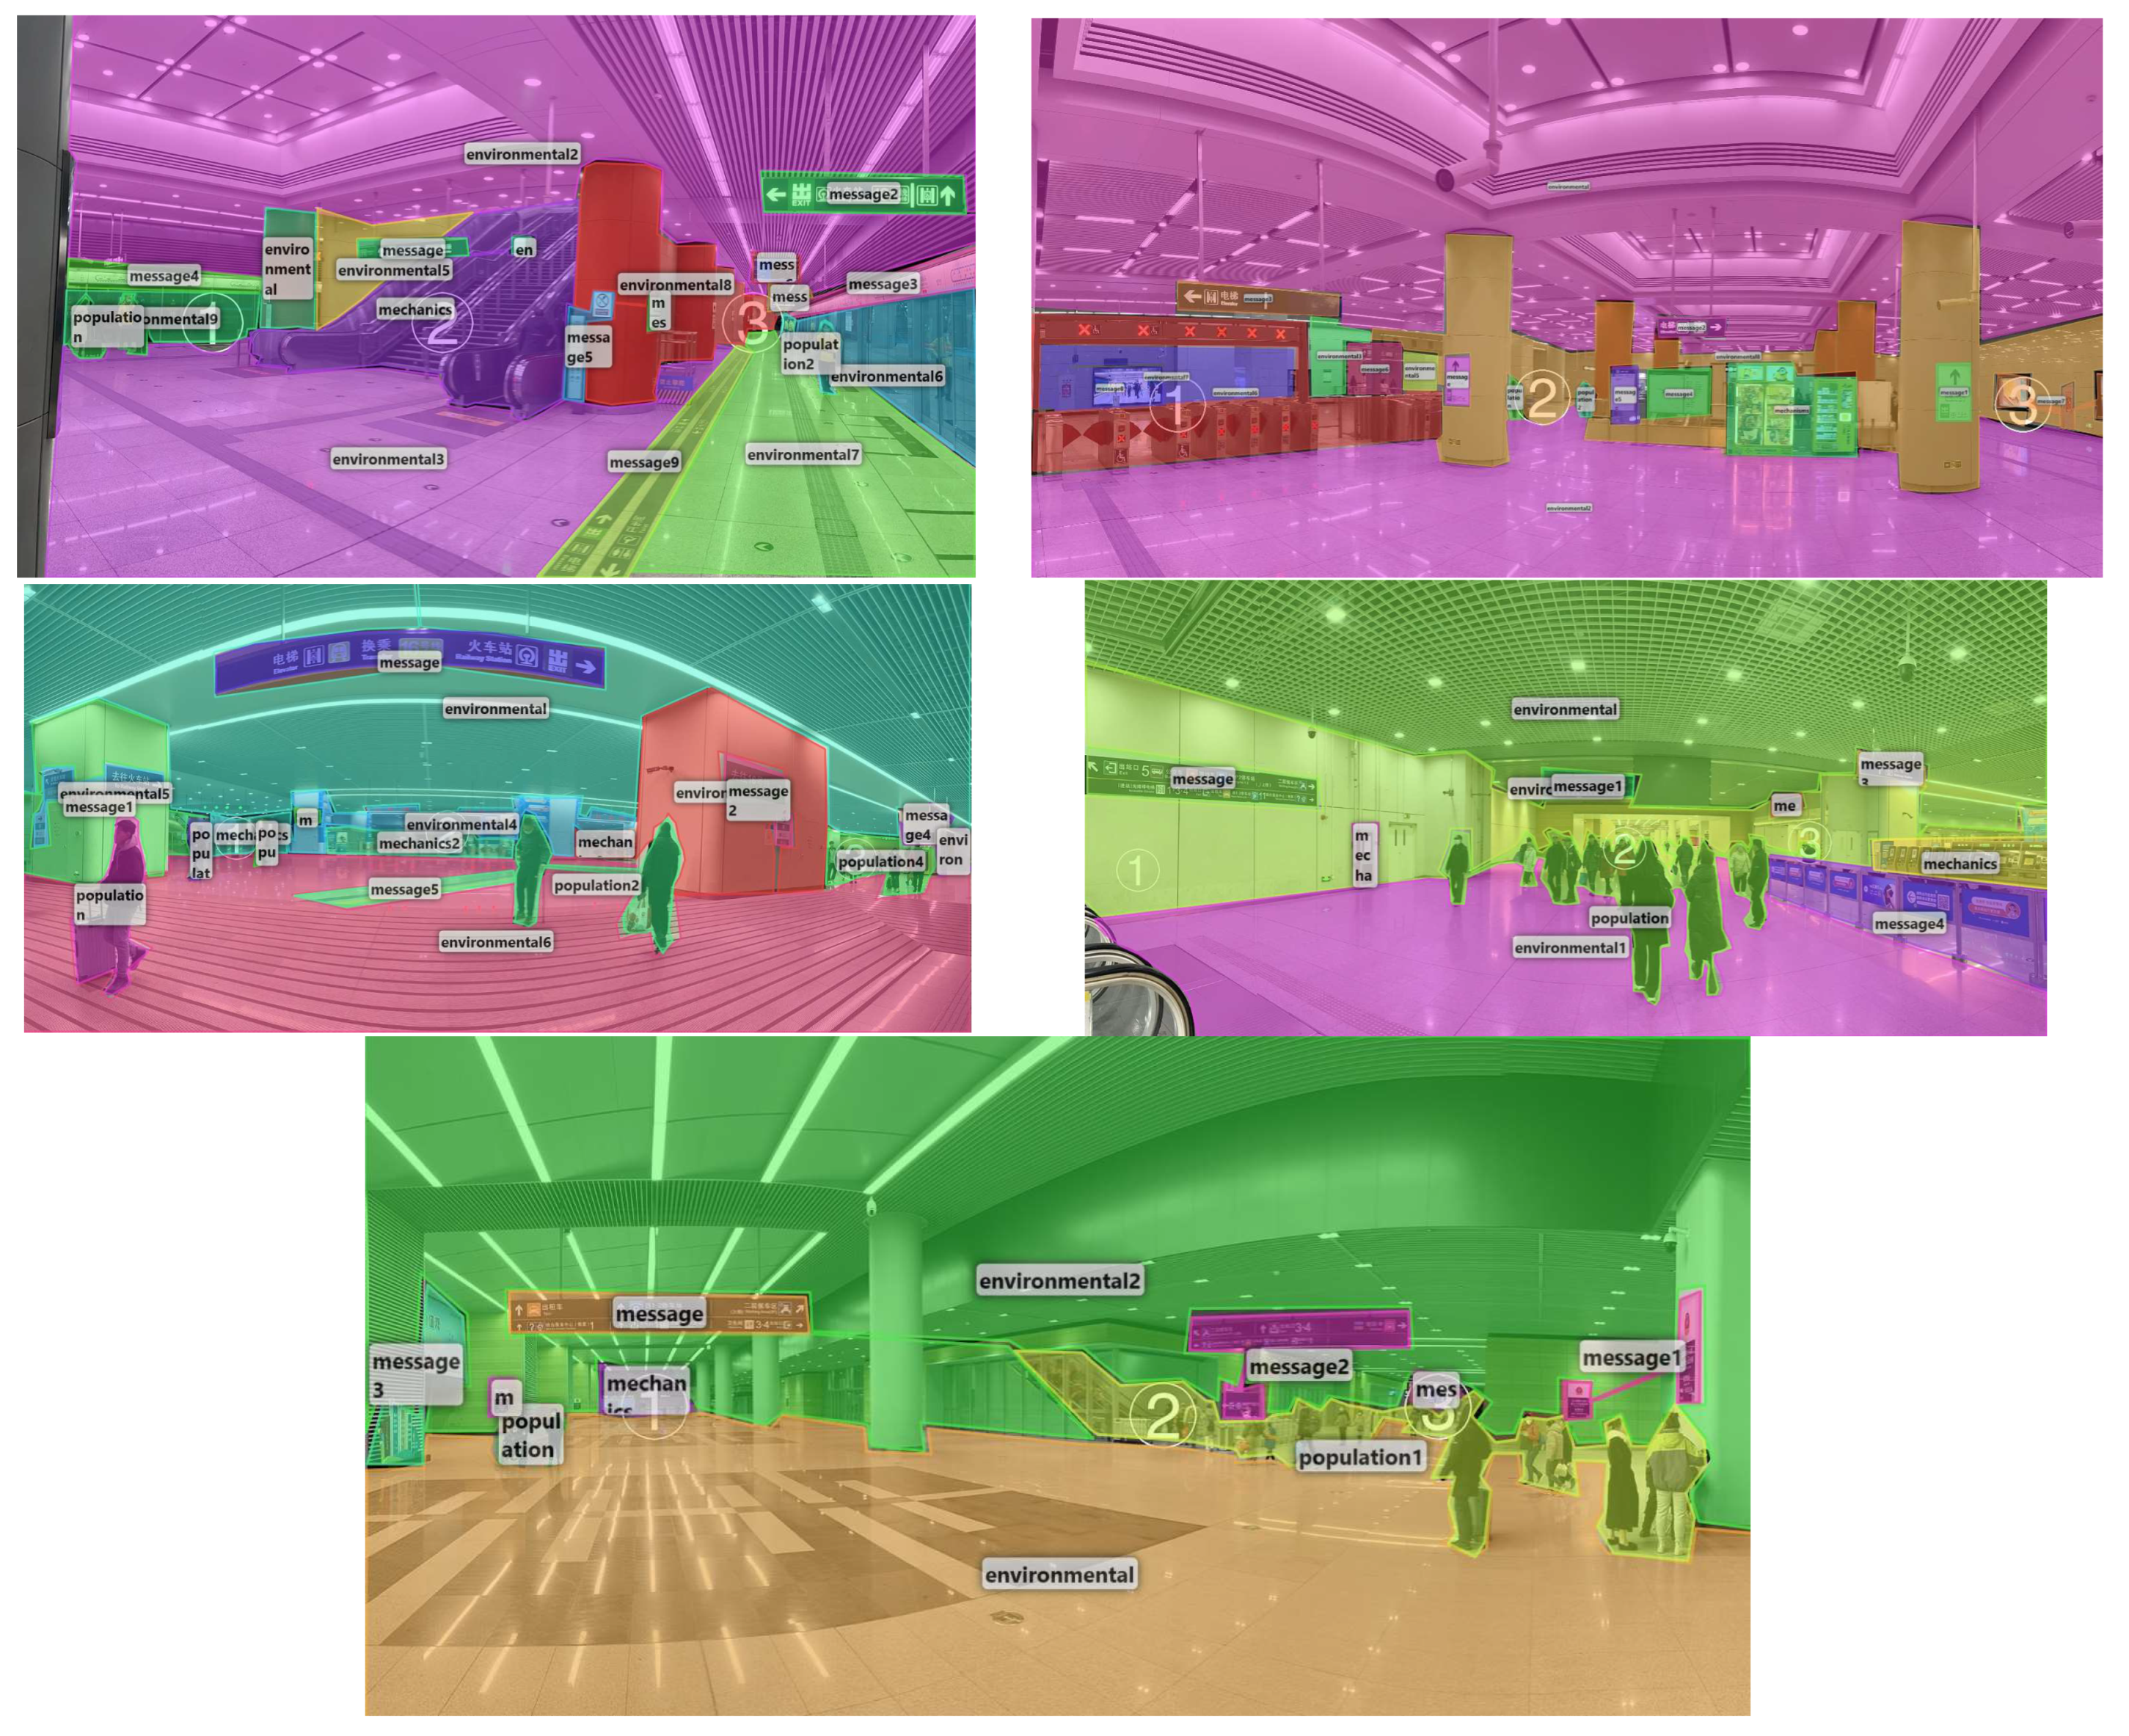
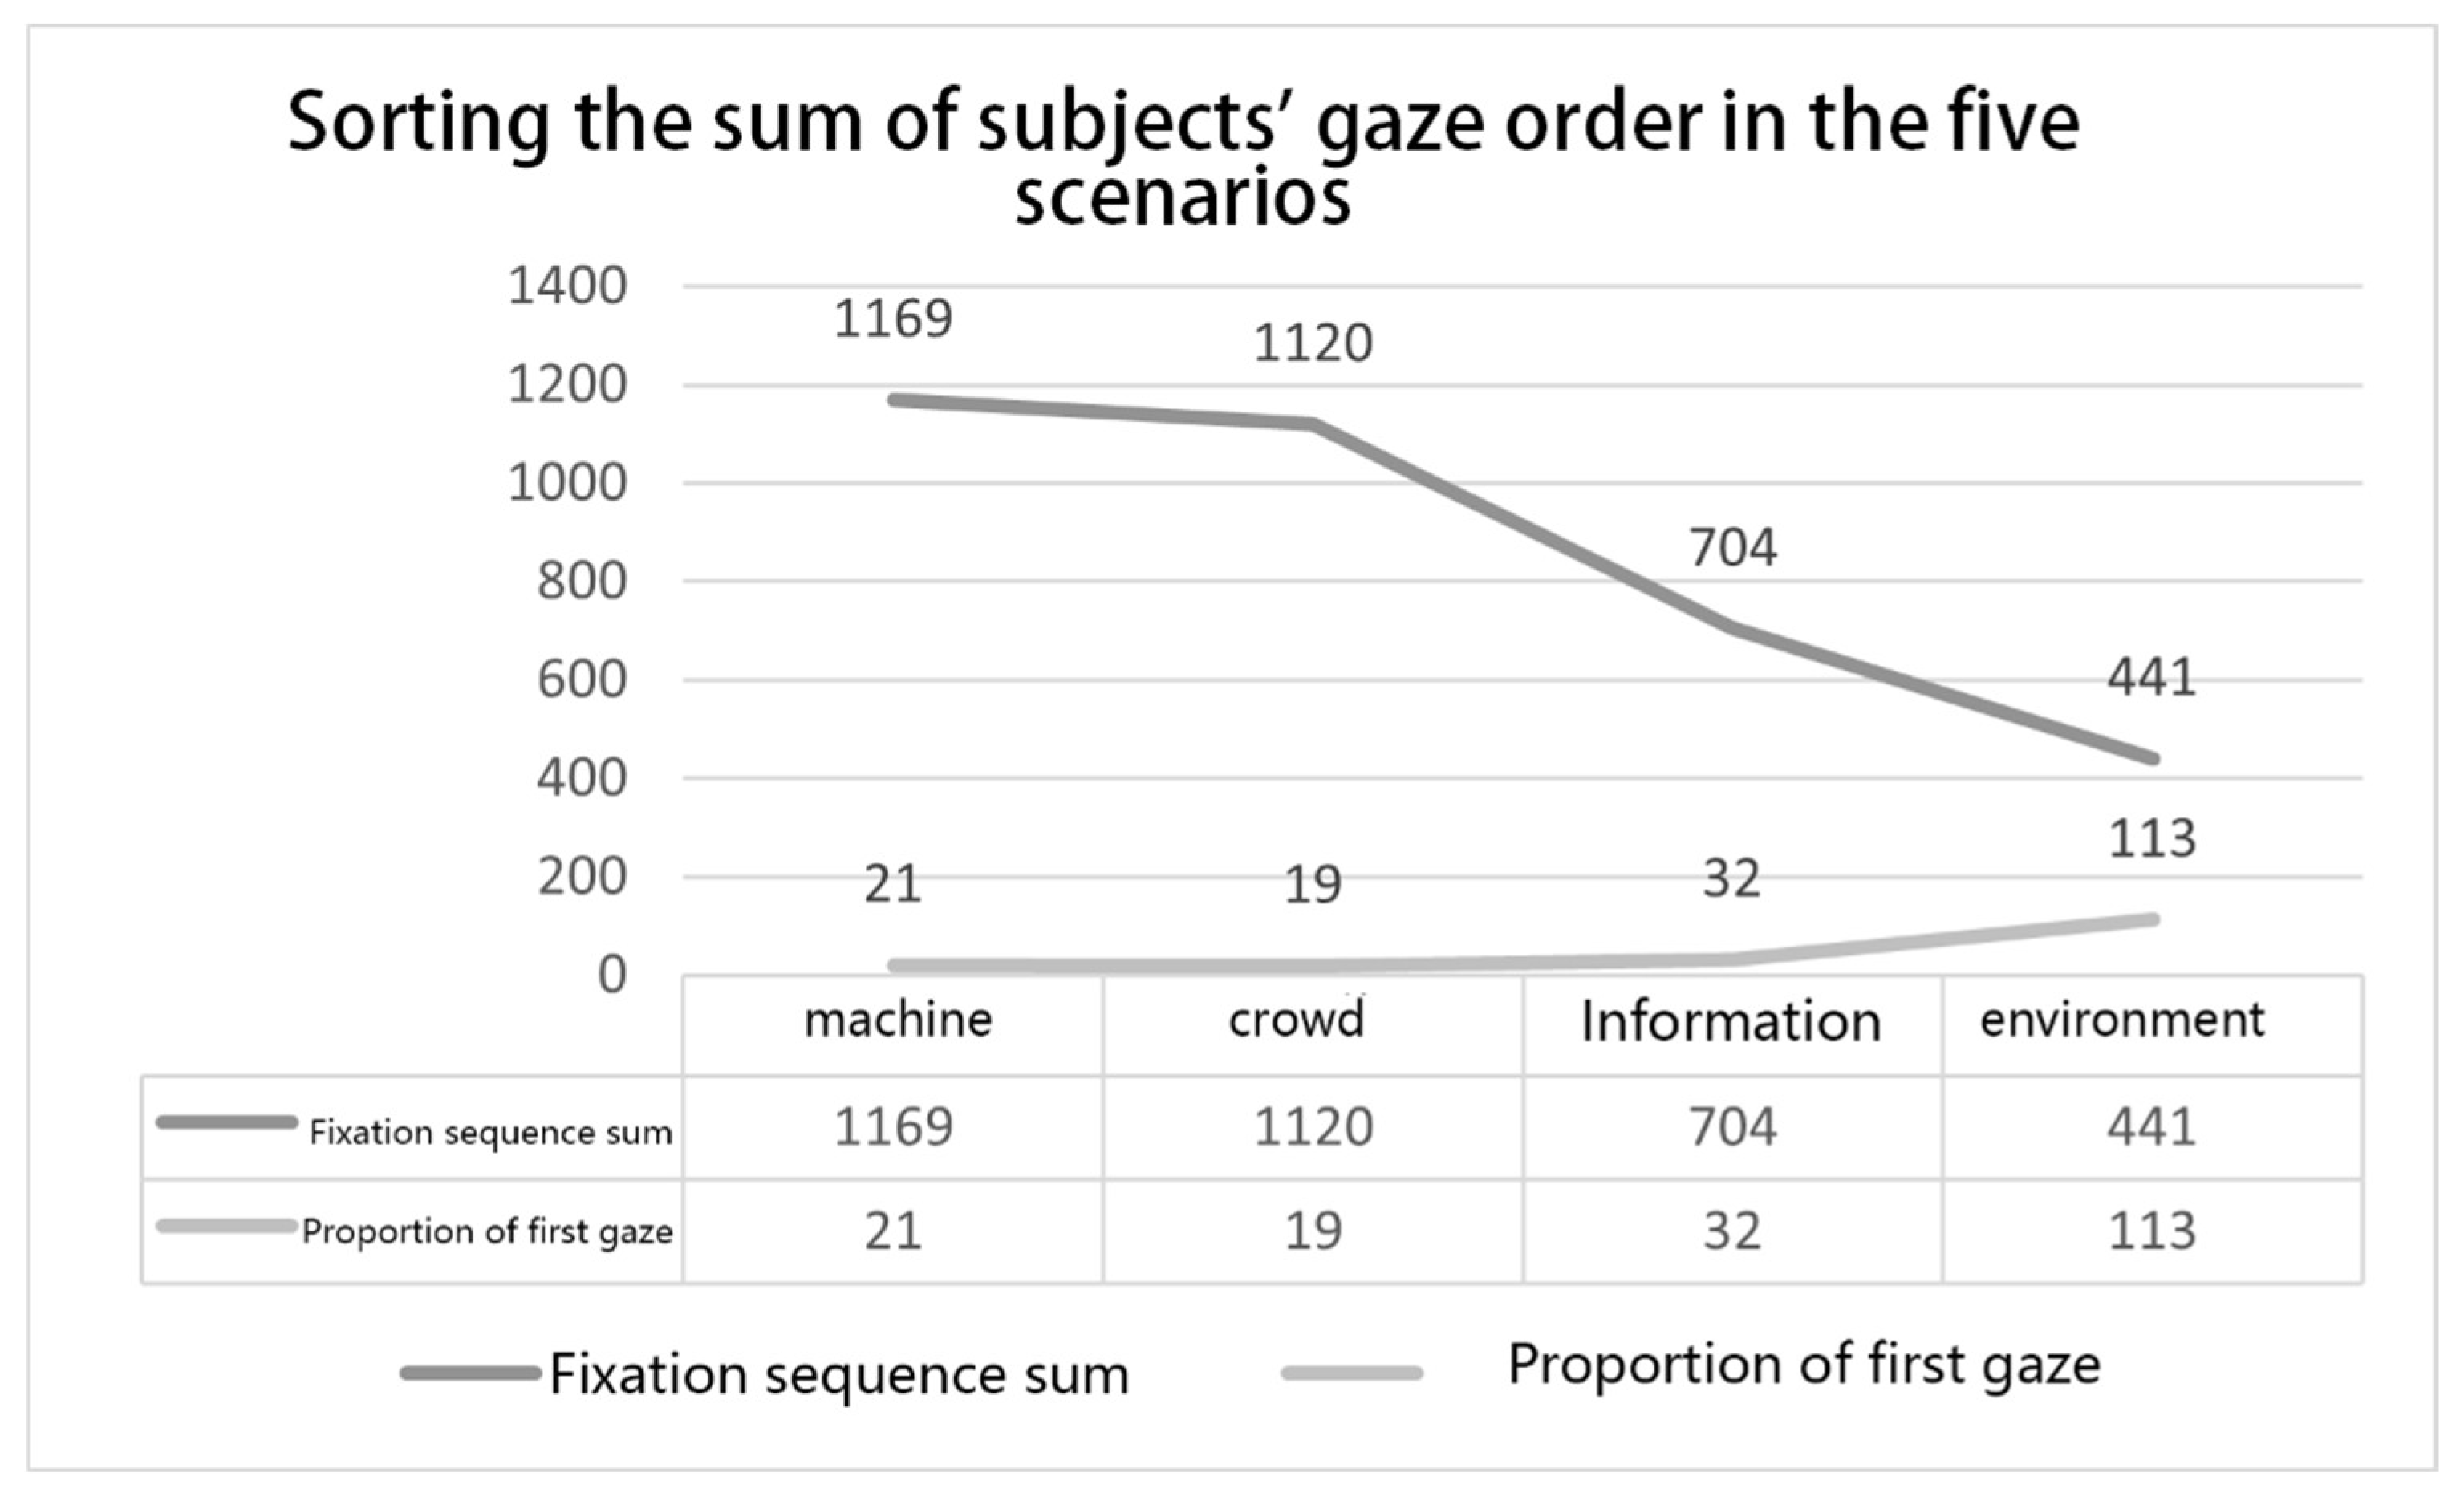
6.5. Order of Subjects’ Attention to Environmental Elements of Pathfinding Nodes

The order of attention to each node partition statistics as in Figure 9, the smaller the proportion of the attention sequence number, the more the proportion of first-time attention indicates that the subjects are more interested in the element. The results show that in each scene, the subjects are more inclined to pay attention for the first time to the ground, the roof, the wall, and other environmental elements, followed by guidance signs and other cues, the crowd and the lift, vending machines, and less attention to the other environmental machinery.

7. Analysis of Subjective Scoring Questionnaires

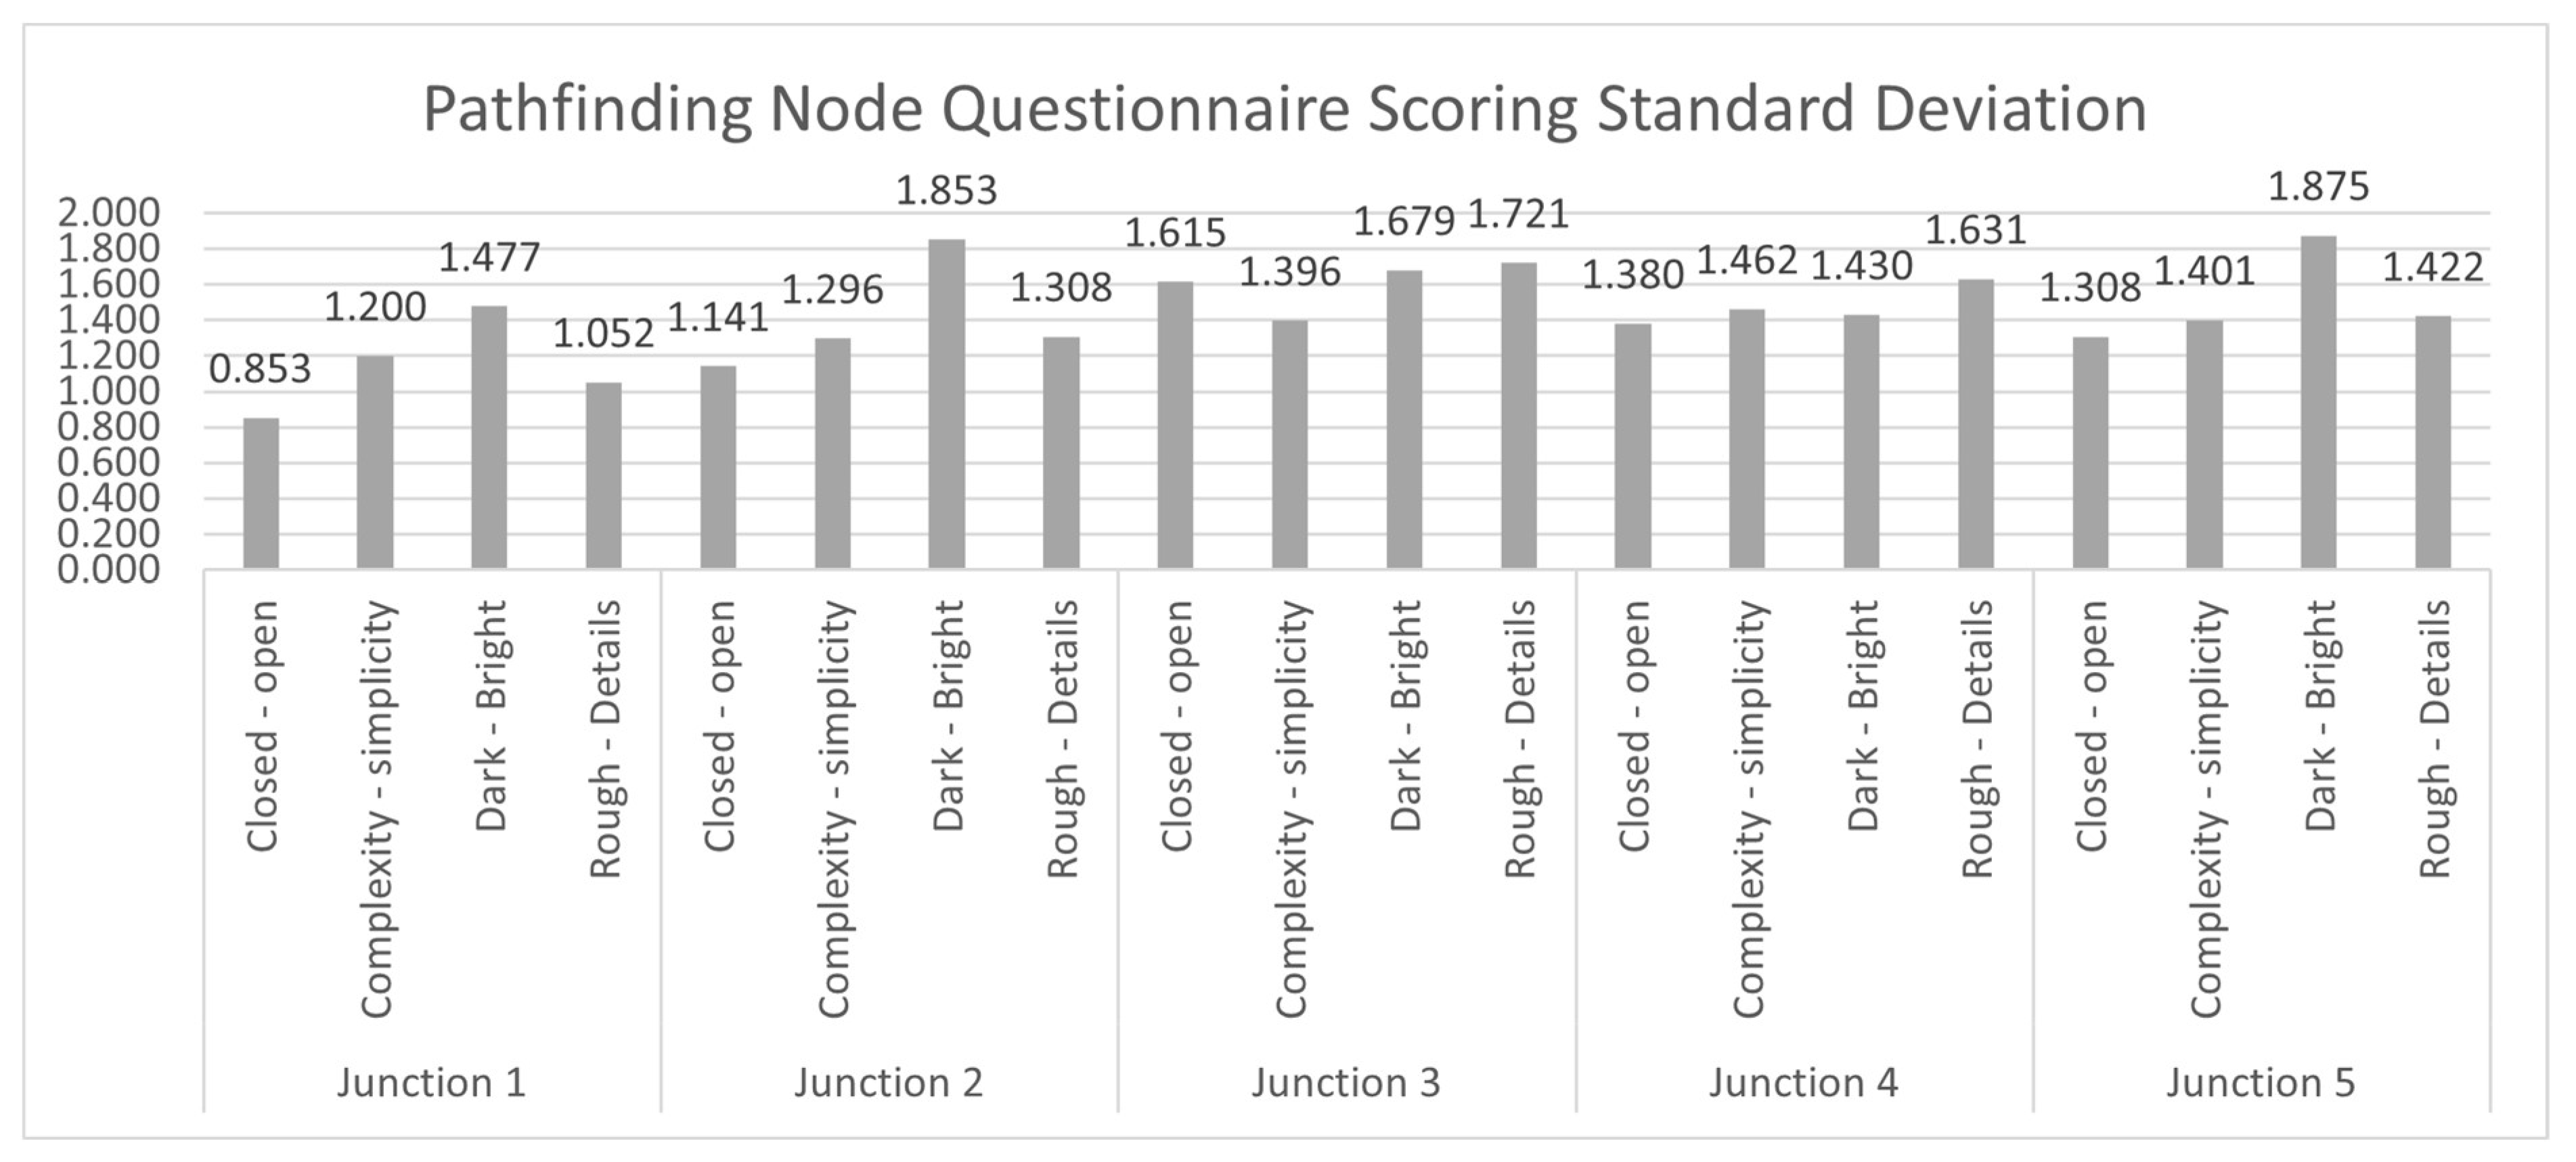
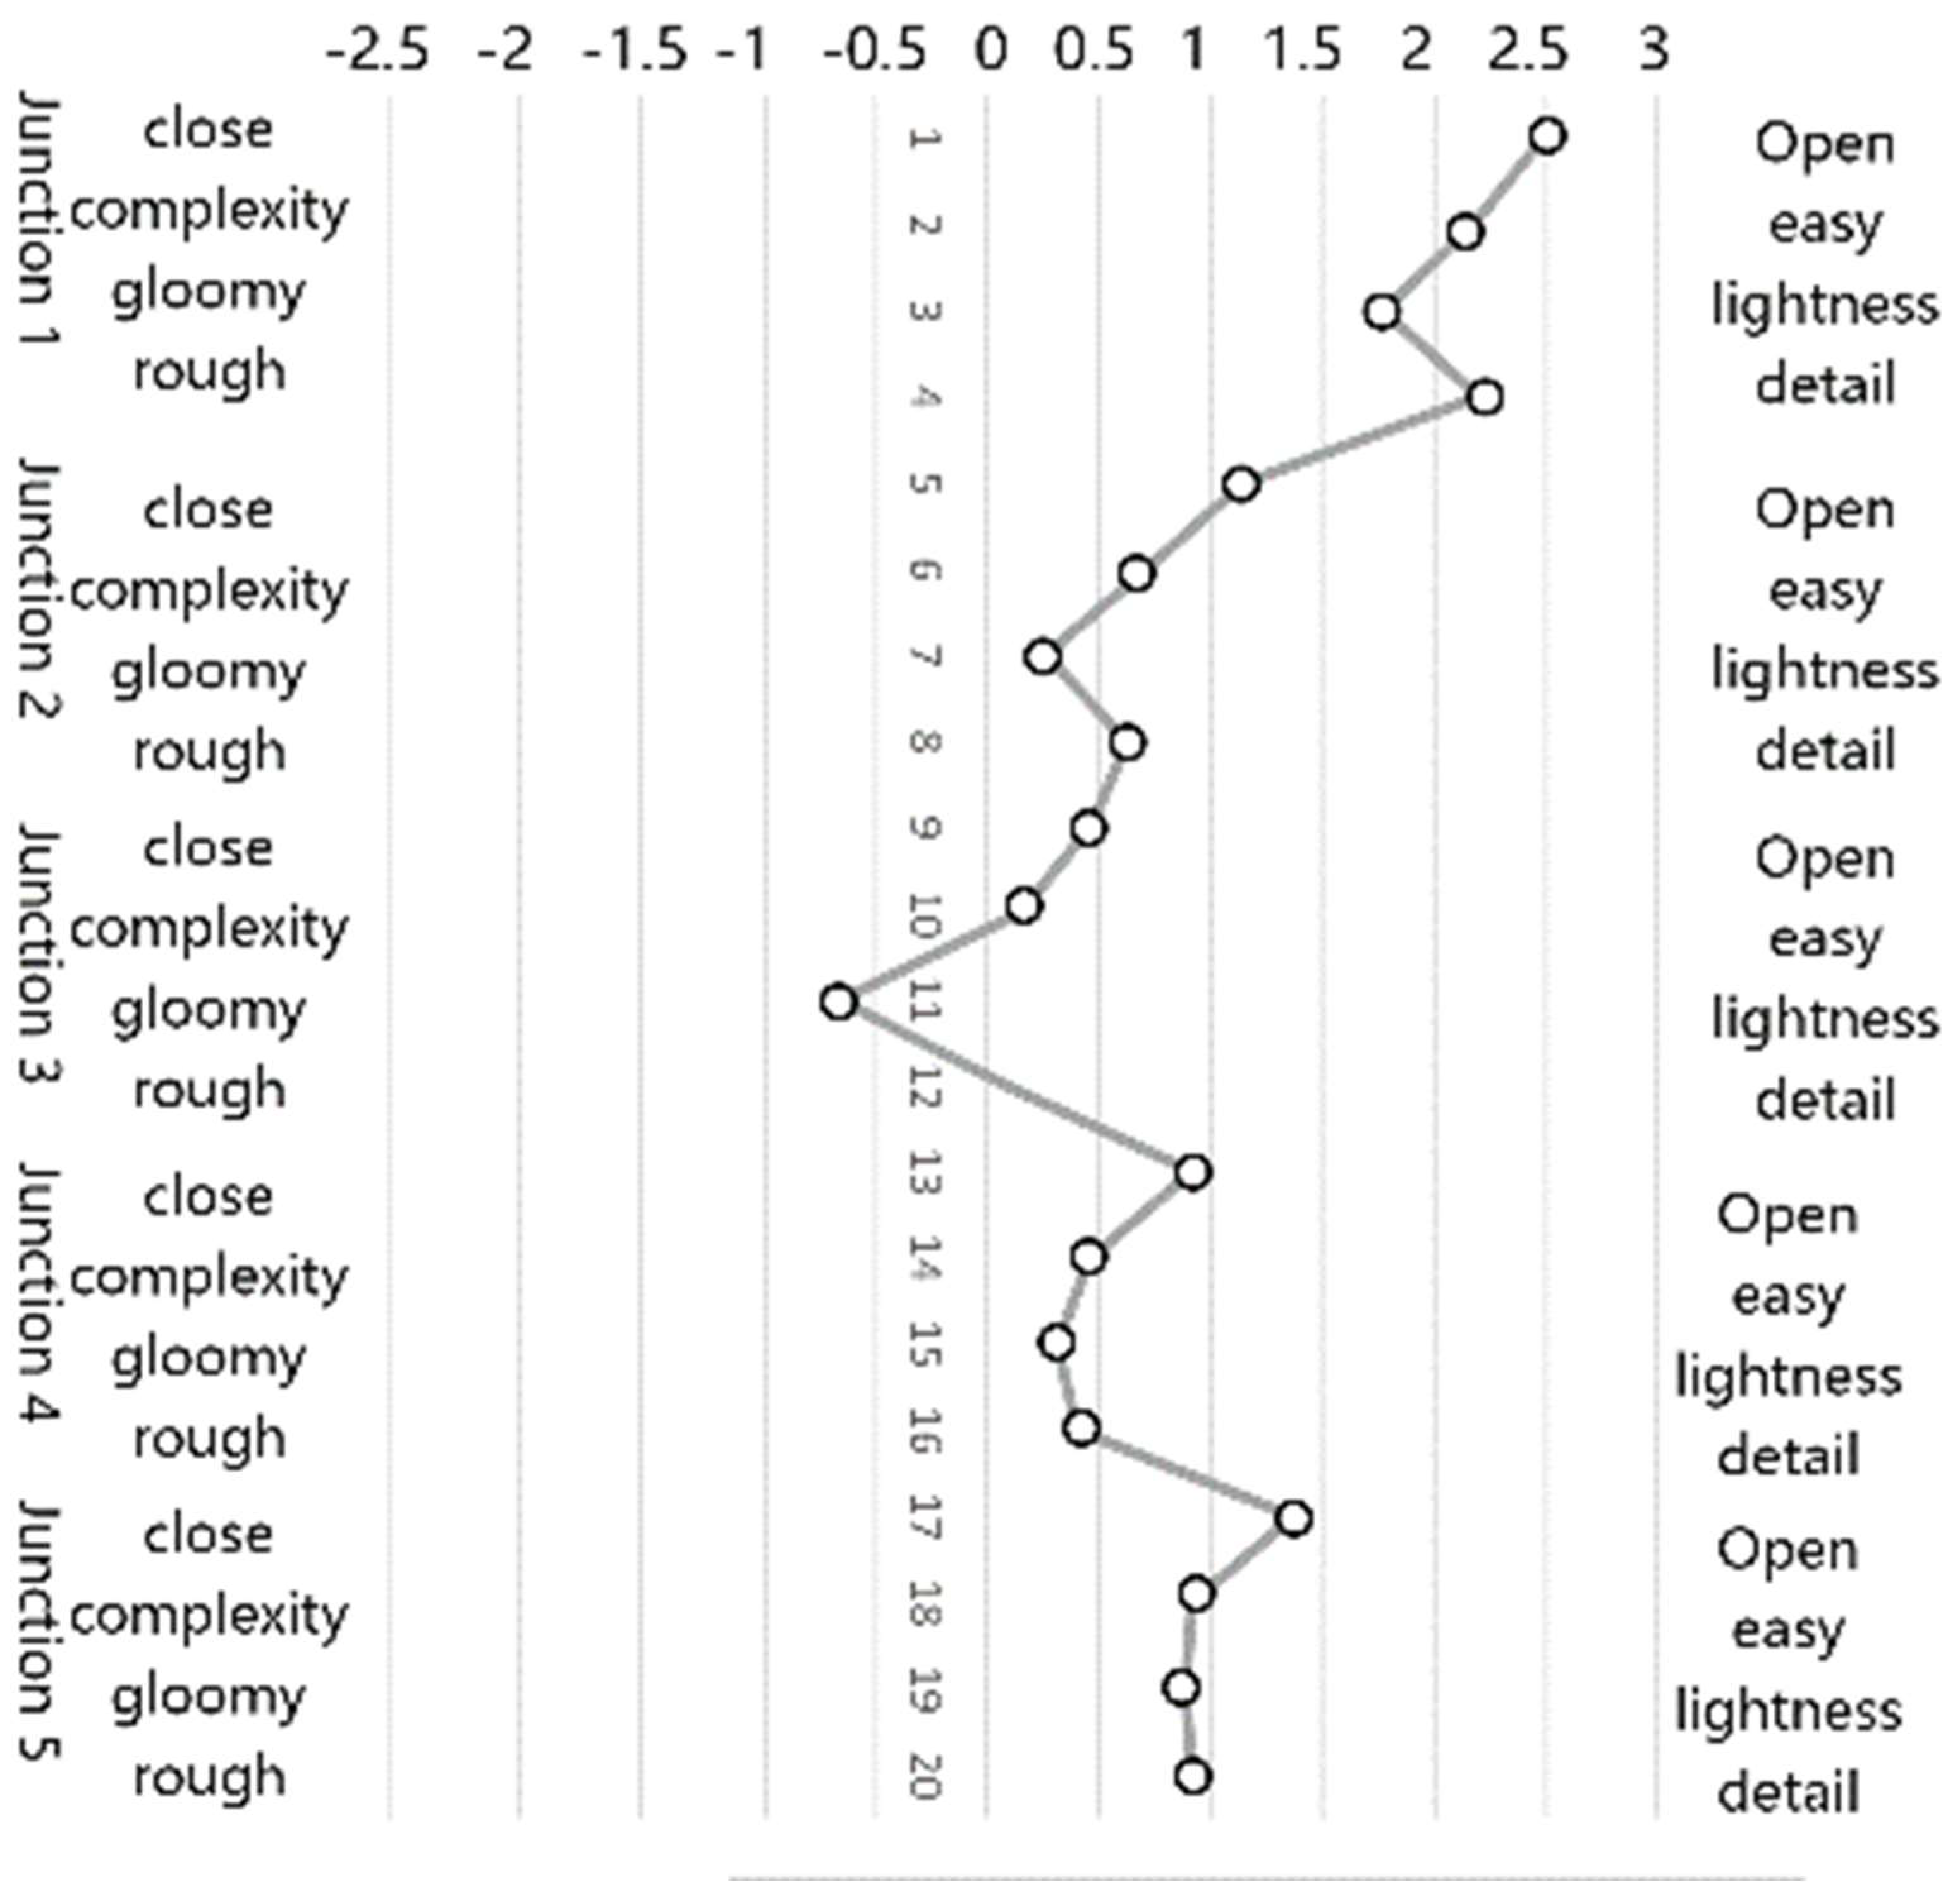
7.1. Questionnaire SD Assessment Results

The five pathfinding nodes were rated on a subjective questionnaire from −3 to 3 according to subjective perception in four dimensions: openness (more closed or more open), planar complexity (more complex or simpler), brightness (brighter or darker), and detail (rougher or containing more detail). The final result is shown in Figure 10.

7.2. Effect of Subjective Ratings of Pathfinding Nodes with Eye Movement Data from Different Partitions of the Corresponding Scene

The study analysed the effect of subjects’ subjective ratings at different wayfinding nodes on the differences in attention to environmental elements in this scenario in Table 9, and the results showed that subjects’ attention to signage information at wayfinding nodes was strongly positively correlated with subjective openness and complexity and positively correlated with the level of detail, and that subjects’ attention to the surrounding elevators, businesses, and other mechanical devices was significantly positively correlated with subjective openness, level of detail, and complexity (Table 9).

7.3. Effect of Spatial Attributes of Wayfinding Nodes on Subjects’ Subjective Ratings

Meanwhile, the correlation analysis between subjects’ subjective experience scores of wayfinding and the spatial attributes of the corresponding nodes was conducted, as shown in Table 10. The conclusion shows that the attributes of the scene’s connectivity, visual field area, compactness, and average depth in the wayfinding behaviour of the subjects are strongly and positively correlated with their subjective sense of direction and the difficulty of wayfinding, which suggests that with the improvement of the openness and complexity of the wayfinding scene, the subjects’ initial sense of direction begins to decrease, and they appear to lose their way. And the effectiveness of the pointing signs is lost, and the difficulty of wayfinding is increasing.
The conclusion of the research feedback in the real scenario of high-speed rail station underground traffic space design is the performance is to try to avoid too complex underground connecting space, reduce the number of forks and bends, the wayfinding behaviour is as simple as possible, and the route performance is suitable for straight line wayfinding.

8. Prediction of Pathfinding Correctness

Regression Analysis of Pathfinding Behaviour Patterns

There were 35 subjects in the experiment, and 75.4% of the 175 choices were made to the correct intersection. Statistical subjects at each intersection choose the correct rate; the correct wayfinding signal is recorded as 0, and the wrong wayfinding behaviour is recorded as 1, for the binary categorical variables, so the choice of the correct rate of intersections with the spatial attributes of the node, the density of markers, and eye movement data binary logistic regression, binary logistic regression can be used for the linear regression output converted to the range of (0, 1) to achieve the modelling of the binary classification problem of correctness is used to predict the probability of correct wayfinding when the subject is wayfinding in the traffic space under that spatial attribute as well as sign arrangement.
The binary logistic regression model was subjected to the Hosmer–Lemeshaw test to test the fit of the model to the real situation, as shown in Table 11. The significance of the binary logistic regression model under the condition of multiple degrees of freedom, p = 0.0950 > 0.05, and the test results show that the model fits well with the real design and truly reflects the interrelationships between the original variables.
Binary logistics regression on the subjects’ wayfinding correct rate and other parameters of the scene, the results are shown in Table 12. The significance of the spatial attributes of the logo in the density of information and key information density of p = 0.006, p = 0.016 is <0.05, indicating that the density of information is an independent influence on the correct rate, and at the same time, the information density and the density of key information of the Exp(B) and 0.604 and 0.420, indicating that the scenarios with less information density and key information density are 0.604 and 0.420 times higher than the scenarios with higher information density and key information density in terms of the dependent variable: passenger wayfinding correct rate. Therefore, the feedback on the real high-speed rail station transportation space design shows that enough information signs pointing to the purpose should be set up to indicate the direction for passengers.
In the eye movement data, pupil diameter p = 0.014, crowd gaze duration p = 0.010, and sign gaze duration p = 0.000, which are all <0.05, indicating that pupil diameter, crowd and sign gaze duration are all independent influences on subjects’ choices, and the corresponding Exp(B) of pupil diameter, crowd, and sign gaze duration are 0.228, 0.950, and 0.879, indicating that passengers with smaller pupil diameter and less gaze duration in the crowd, and sign part of the scene are more likely to be correct in the dependent variable: passenger wayfinding than passengers with larger pupil diameter and less gaze duration in the crowd and sign part of the scene. 0.879, indicating that passengers with smaller pupil diameters and less crowd and sign gaze duration in the crowd and sign portion of the scene were 0.228, 0.950, and 0.879 times more likely than passengers with larger pupil diameters and more crowd and sign gaze duration to be correct on the dependent variable: passenger wayfinding.
At the same time on the five indicators affecting the wayfinding fight rate of the effect of Exp(B) and its 95% confidence interval statistics, see Figure 11, Exp(B) in the figure, the upper and lower limits of the indicators represent the minimum and maximum value of the impact of changes in the independent variable on the dependent variable in the 95% confidence interval, it can be seen that the density of information indicators effect Exp(B) in the lower limit of the 95% confidence interval of 0.377, upper limit is 0.966, indicating that the scenario with low information density is at least 0.377 higher than the scenario with high information density in terms of the correct rate of passenger wayfinding, and at most 0.966 higher. The effect sizes of the parameters of key information density, pupil diameter, crowd, and logo attention Exp(B) and the upper and lower bounds of their 95% confidence intervals can be obtained in the same way.
To summarise, among the metrics for the evaluation of wayfinding correctness, the four metrics of key information density, pupil diameter, crowd, and logo attention are all inversely proportional to the dependent variable (wayfinding correctness) at their 95% confidence intervals, whereas the information density is positively proportional.

9. Summary

This study applies eye tracking technology and the semantic difference method to capture the real-time physiological experience of subjects in the wayfinding process, providing a refined, real-time research means to study the interaction between individual senses and the spatial environment, while at the same time using spatial syntax to quantify spatial attributes, overcoming the analysis of previous studies affecting the wayfinding behaviour of subjects relying on subjective judgements. Qualitative research deficiencies of the study quantified the environmental data on the basis of previous researchers. The results show that in the evaluation index of wayfinding correctness, two indicators such as scene information density and key information density are positively proportional to the dependent variable (wayfinding correctness) within the 95% confidence interval, and three indicators such as pupil diameter, scene crowd, and logo attention time are inversely proportional to each other, and specifically, the scene with less scene information density and less key information density is 0.604, 0.604, and 0.604 times the scene with more information density and key information density, respectively, and 0.604, and 0.604, and 0.604, respectively, of the scene with less scene information density and key information density, respectively, and 0.604 and 0.420 times that of the scene, and the correct wayfinding rate of subjects with smaller pupil diameter and less attention duration in the crowd and logo part of the scene was 0.228, 0.950, and 0.879 times that of the passengers with larger pupil diameter and more attention duration of the crowd and logo, accordingly, the indicators were ranked according to the magnitude of the effect size Exp(B): logo attention time > information density > key information density > pupil diameter, and Exp(B) size represents the importance of the independent variable to the dependent variable.
Previous studies on wayfinding efficiency in transportation space compare: Junhui Li (2024) [14] introduced the area of visual field into the study of wayfinding in hospitals, and this study refined the area of visual field of each part of the transportation space and coupled it with the correct rate of wayfinding, and this paper seeks for a further relationship between the two on the basis of the area of visual field and the correct rate of wayfinding. It is concluded that the area of the visual field is inversely proportional to the wayfinding decision time; Zhao Yi-Mong (2023) [13] simulated the wayfinding of passengers in Beijing subway stations to explore the effect of subjective evaluation on the wayfinding time of the subjects, and this study further explored the association of subjective evaluation of the subjects on the attention to different elements of their scenes on the basis of this study; Wei Dako (2023) [9] investigated the effect of the type of floor plan layout on the wayfinding behaviours and performances of the elderly, and this study unified the quantification of different spatial layouts into spatial layouts, and this study further sought the relationship between them. Different spatial plane layouts are unified and quantified as spatial syntactic parameter indicators, and the study is consistent with this paper: plane layouts are more complex, spatial connectivity with a high degree of plane passengers is more difficult to carry out wayfinding behaviours, increasing the universality of the conclusions of the study; Cao Mengmeng (2022) [11], in response to the interchange of the Beijing South Railway Station, the passengers of the scene elements of the attention to the differences in the statistics arrived at the same conclusions as in the present study: the differences in passenger’s order of the elements of the scene: environmental elements > guide signs > advertising elements > other elements, and this study further concluded that the attention time to signs is inversely proportional to the correct wayfinding rate, which means that the more time passengers spend on signs, the lower the correct wayfinding rate; Bi Hai (2021) [8] used the visual field method to explore the wayfinding behaviours in an exhibition space, and concluded that an increased visual field area would attract subjects to enter and also increase the subjects’ wayfinding time, which is similar to this study.
Therefore, feedback on the reality of high-speed rail station transportation space design for improving passenger wayfinding efficiency stations should:
① Ranking of the importance of factors affecting passenger wayfinding correctness: sign attention time > message density > key message density > pupil diameter.
② The effect of information density on passenger wayfinding phase rate and Correct rate.
In the wayfinding scene, from intersection ② to intersection ③, the density of key information grows from 3‰ to 11‰, with which the wayfinding decision time of the subjects increases by 21.3%, and the wayfinding error rate grows by 51.4%, and from intersection ③ to intersection ④, the density of key information decreases to 5‰, and the wayfinding error rate decreases, which can be concluded according to the scene photos, the distribution of the signs of scene 3 is too dispersed and disordered, and it improves the passengers’ decision time and decreases the correct rate of the passengers. According to the scene photos, it can be concluded that the distribution of signs in Scene 3 is too scattered and cluttered, which improves the time for passengers to choose and reduces the correct rate of passengers’ choice.
③ The effect of spatial attributes on the phase rate and correct rate of passenger wayfinding.
In the actual wayfinding scenario, the spatial connectivity and visual field area increased by 219% and 217%, respectively, when changing from intersection ② to intersection ③, and at the same time, there is a strong correlation with the passenger wayfinding decision time, which has a greater impact on the passenger’s decision time.
However, the correlation is not strong in binary logistic regression, suggesting that changes in spatial attributes do not have a significant impact on the correctness of wayfinding. It can be in a position of less consideration in the subsequent design.
At the same time, this study also has certain defects. The path selection procedure composed of real pictures simulates the wayfinding behaviour of passengers in the real scene, but there are still differences from the real scene in terms of illumination, scene situation, and spatial experience, and there is a certain deviation from the wayfinding behaviour in the space of the real high-speed rail station, and further research on the wayfinding behaviour of high-speed rail stations can be conducted in the future with the help of virtual reality technology to build a virtual scene or a field. At the same time, the sample size of this experiment is small, only for the connecting subway station of Beijing Fengtai Station, and more research samples may be needed in the future to support the theoretical construction and to explore more technical and methodological possibilities, so as to provide technical support for the future improvement of the spatial quality and operational efficiency of subway stations, to promote the enhancement of the spatial quality, and to promote the improvement of the efficiency of the passengers’ entering the station as well as transferring to other stations.

Author Contributions

Writing—original draft, K.Z.; Writing—review & editing, K.Z.; Supervision, Z.Z. and B.Z. All authors have read and agreed to the published version of the manuscript.

Funding

This research received no external funding.

Data Availability Statement

Data are contained within the article.

Conflicts of Interest

The authors declare no conflict of interest.

References

  1. Jin, L.; Yin, S.; Yin, J. Eye-movement characterization of wayfinding behavior in radial shopping space. Eng. Res. -Interdiscip. Perspect. Eng. 2019, 11, 121–128. [Google Scholar]
  2. Zhang, L.; Dang, H.; Mei, X.; Xie, Q. A preliminary study of urban ergonomics-oriented empirical research and design decision-making method for underground space interface. World Archit. 2021, 369, 19–23+126. [Google Scholar] [CrossRef]
  3. Zhang, L. Urban ergonomics: A new path of human-centered, high-quality space-oriented design intervention. Sci. Bull. 2022, 67, 1727–1728. [Google Scholar] [CrossRef]
  4. Li, J.; Zhao, R.; Wu, W.; Jin, Y. Human-environment interaction: Architectural spatial information and human perceptual feedback from the perspective of human factors architecture. Architect 2022, 217, 69–78. [Google Scholar] [CrossRef]
  5. Xu, J.; Zhu, X.; Wang, S. Experiments on path selection in subway stations based on on-site eye movement measurement and virtual scene—An example of three Guangzhou subway stations. New Archit. 2019, 4, 26–32. [Google Scholar]
  6. Sun, C.; Yang, Y. Research on the visual saliency of wayfinding signage based on eye tracking—An example of Harbin Cade Plaza Shopping Center. J. Archit. 2019, 2, 18–23. [Google Scholar]
  7. Ye, Y.; Qu, H.; Ma, Y.; Wang, K. A study on the influence of personal and environmental factors on wayfinding behavior based on eye movement analysis—Taking the campus of Shenyang University of Architecture as an example. Cent. China Archit. 2022, 40, 83–89. [Google Scholar] [CrossRef]
  8. Lu, W.; Bi, H.; Gu, Z. Research on display space measurement based on visual domain analysis—Taking Dalian urban planning exhibition center as an example. New Archit. 2022, 3, 15–20. [Google Scholar] [CrossRef]
  9. Wei, D.; Duan, X. A study on the performance of wayfinding in transportation space of elderly care facilities based on VR experiments. J. Archit. 2023, S2, 88–93. [Google Scholar]
  10. Qi, Y.; Zhang, Y.; Zhou, Q.; Zhang, L. Research on pathfinding and optimization of public space in outpatient department of large general hospital based on eye tracking. Contemp. Archit. 2021, 10, 118–122. [Google Scholar]
  11. Cao, M. Research on Wayfinding Design of Transportation Interchange Space in Beijing Railway Station. Master’s Thesis, Beijing Jiaotong University, Beijing, China, 2020. [Google Scholar] [CrossRef]
  12. Xu, L.; Zhang, W.; Tang, Z. A virtual study on the influence of signage layout features on wayfinding efficiency in subway stations. J. Archit. 2010, S1, 1–4. [Google Scholar]
  13. Xia, H.; Zhao, Y.; Xu, R.; Qu, L. Research on eye movement test and spatial optimization of wayfinding perception in subway station. South. Archit. 2022, 7, 1–9. [Google Scholar] [CrossRef]
  14. Li, J. Application of visual domain method in wayfinding design of large-scale comprehensive buildings. Art Educ. 2024, 5, 270–273. [Google Scholar]
Figure 1. Research framework.
Buildings 14 03012 g001
Figure 2. Pathfinding tasks segmentation. (The numbers 1 to 5 correspond to the five pathfinding nodes primarily analyzed in the experiment).
Buildings 14 03012 g002
Figure 3. Flowchart of pathfinding node.
Buildings 14 03012 g003
Figure 4. Percentage of each node’s information marking, i.e., marking density.
Buildings 14 03012 g004
Figure 5. Percentage of node-orientated destination signs, i.e., key information density at each node.
Buildings 14 03012 g005
Figure 6. Heat map of spatial connectivity for scenes ②–⑤ in depthmap software. Beta 1.0.
Buildings 14 03012 g006
Figure 7. Statistics of the correct rate of the subject’s wayfinding.
Buildings 14 03012 g007aBuildings 14 03012 g007b
Figure 8. Finding node AOI partitioning.
Buildings 14 03012 g008
Figure 9. Statistics of subjects’ gaze number in each scene.
Buildings 14 03012 g009
Figure 10. Mean and standard deviation of subjective ratings for each pathfinding node.
Buildings 14 03012 g010aBuildings 14 03012 g010b
Figure 11. Logistic regression Exp(B) and its upper and lower limits for the evaluation index of the correctness rate of pathfinding.
Buildings 14 03012 g011
Table 1. Experimental conditions and variables.
Experimental ItemExperimental Condition
Display contentPath selection program consisting of different nodes
Experimental equipmentOn-screen eye-tracking device
Electromyography Physiological Sensors (EDA)
Means of presentationScreen display
Number of experimenters35 (20 women/15 men)
Independent VariableSpatial Properties of Pathfinding Nodes/Spatial Properties of Markers
Implicit VariablePath nodes spend time (tpn)
Pathway choice correctness rate (cpn)
Gaze duration (tg) and gaze order (Ng) for different environmental elements
Pupil diameter of the subject while viewing the picture (Dp)
Subjects’ familiarity with Fengtai Station (number of rides in six months Nht)
Table 2. Spatial attributes of pathfinding nodes and identification spatial density implications.
AbbreviationQuantitative Data Meaning
information density:Di (%)Percentage of all signs or cues with messages within the scene.
Density of key informationDki (%)Percentage of signs or cues within the scene that point to the final destination.
ConnectivityCConnectivity measures the number of spaces immediately connecting a space of origin.
field of viewFvcMean value of the area of the building visible from the observation point.
compactnessCpCompactness is to minimise metric or modular distance from all spaces to all others in any contiguous arrangement, and linearity is to minimise visual integration of the contiguous arrangement.
entropy (physics)EA measure of the distribution of locations of spaces in terms of their depth from a space.
degree of integrationDigIntegration is a normalised measure of distance from any space of origin to all others in a system. In general, it calculates how close the origin space is to all other spaces, and can be seen as the measure of relative asymmetry (or relative depth). In general, it calculates how close the origin space is to all other spaces, and can be seen as the measure of relative asymmetry (or relative depth).
Average depthDaMean depth is calculated by assigning a depth value to each space according to how many spaces it is away from the original space, summing these values and dividing by the number of spaces in the system less on (the original space).
Table 3. Spatial attributes and identification density statistics of each pathfinding node.
Di (%)Dki (%)CFvcCpEDigDa
Junction 10.0180.007857.000857.0270.0661.01116.8911.480
Junction 20.0070.0031205.0001212.3200.0301.4558.7802.299
Junction 30.0430.0113844.0003854.0800.0111.20313.2331.864
Junction 40.0230.0052598.0002613.1900.0531.29912.8351.824
Junction 50.0170.0032882.0002896.7100.0431.29313.2931.802
Table 4. Correlation analysis between spatial attributes of wayfinding nodes and subjects’ choice time.
CFvcCpEDigDa
Tpn (s)Pearson Correlation0.249 **0.249 **−0.241 **0.194 *−0.199 **0.190 *
Significance (two-tailed)0.0010.0010.0010.0100.0080.012
Number of cases175175175175175175
Notes: ** Significant correlation at level 0.01 (two-sided). * Significant correlation at level 0.05 (two-sided).
Table 5. Correlation analysis between information density of pathfinding nodes and subjects’ choice time.
Di (%)Dki (%)
Tpn (s)Pearson Correlation0.202 **0.095
Significance (two-tailed)0.0070.209
Number of cases175175
Notes: ** Significant correlation at level 0.01 (two-sided).
Table 6. Correlation analysis of node spatial attributes with eye movement data.
CFvcCpEDigDa
Dp (mm)Pearson Correlation0.1080.108−0.0280.077−0.0380.024
Significance (two−tailed)0.1560.1540.7180.3160.6150.750
Number of cases174174174174174174
Tm (s)Pearson Correlation−0.528 **−0.530 **0.317 **−0.397 **0.299 **−0.255 **
Significance (two−tailed)0.0000.0000.0000.0000.0000.001
Number of cases174174174174174174
Tp (s)Pearson Correlation0.264 **0.265 **0.0260.0690.045−0.082
Significance (two−tailed)0.0000.0000.7300.3630.5570.281
Number of cases174174174174174174
Tmb (s)Pearson Correlation−0.211 **−0.210 **0.166 *0.101−0.0730.060
Significance (two−tailed)0.0050.0050.0290.1850.3400.429
Number of cases174174174174174174
Te (s)Pearson Correlation−0.037−0.037−0.186 *0.223 **−0.268 **0.280 **
Significance (two−tailed)0.6290.6300.0140.0030.0000.000
Number of cases174174174174174174
Notes: ** Significant correlation at level 0.01 (two-sided). * Significant correlation at level 0.05 (two-sided).
Table 7. Correlation analysis between the density of information signs and the concern of environmental elements.
Di (%)Dki (%)Tpn (s)
Dp (mm)Pearson Correlation0.013−0.0690.002
Significance (two-tailed)0.8690.3640.975
Number of cases174174174
Total visit duration as a percentage (%)MechanismPearson Correlation0.213 **0.106−0.245 **
Significance (two-tailed)0.0050.1620.001
Number of cases174174174
PopulationPearson Correlation0.043−0.160 *−0.015
Significance (two-tailed)0.5740.0350.841
Number of cases174174174
Message BoardPearson Correlation0.294 **0.277 **−0.264 **
Significance (two-tailed)000
Number of cases174174174
Environmental ElementPearson Correlation−0.071−0.042−0.114
Significance (two-tailed)0.3540.5780.134
Number of cases174174174
Notes: ** Significant correlation at level 0.01 (two-sided). * Significant correlation at level 0.05 (two-sided).
Table 8. Correlation analysis between the number of vehicle rides taken by the subjects and the level of concern for environmental factors.
Dp (mm)Message BoardEnvironmental ElementMechanismPopulation
NhtPearson Correlation−0.022−0.137 *−0.032−0.257 *−0.131
Significance (two-tailed)0.0900.0320.8540.0130.453
Number of cases3535353535
Notes: * Significant correlation at level 0.05 (two-sided).
Table 9. Correlation analysis between subjective scores of pathfinding nodes and eye movement data of different partitions of the corresponding scene.
Dp (mm)Total Visit Duration as a Percentage
MechanismPopulationMessage BoardEnvironmental
Element
Closed-openPearson Correlation0.0000.215 **-0.0210.232 **0.018
Significance (two-tailed)0.9960.0040.7840.0020.812
Number of cases174174174174174
Rough-DetailsPearson Correlation0.0200.207 **0.0310.160 *0.045
Significance (two-tailed)0.7980.0060.6890.0350.555
Number of cases174174174174174
Dark-BrightPearson Correlation0.0510.141−0.0040.1420.019
Significance (two-tailed)0.5000.0640.9560.0610.803
Number of cases174174174174174
Complexity-simplicityPearson Correlation0.0460.239 **0.0340.236 **−0.063
Significance (two-tailed)0.5480.0020.6520.0020.409
Number of cases174174174174174
Notes: ** Significant correlation at level 0.01 (two-sided). * Significant correlation at level 0.05 (two-sided).
Table 10. Correlation analysis between subjective ratings of subjects’ wayfinding behaviour and spatial attributes of the scene.
CFvcCpEDigDa
Sense of directionPearson Correlation−0.368 **−0.368 **0.385 **−0.279 **0.280 **−0.274 **
Significance (two-tailed)0.0000.0000.0000.0000.0000.000
Number of cases175175175175175175
Feeling of having lost one’s wayPearson Correlation−0.352 **−0.353 **0.361 **−0.299 **0.291 **−0.281 **
Significance (two-tailed)0.0000.0000.0000.0000.0000.000
Number of cases175175175175175175
Marking validityPearson Correlation−0.315 **−0.315 **0.391 **−0.219 **0.248 **−0.254 **
Significance (two-tailed)0.0000.0000.0000.0040.0010.001
Number of cases175175175175175175
Pathfinding difficultyPearson Correlation−0.338 **−0.338 **0.357 **−0.302 **0.296 **−0.287 **
Significance (two-tailed)0.0000.0000.0000.0000.0000.000
Number of cases175175175175175175
Notes: ** Significant correlation at level 0.01 (two-sided).
Table 11. Hosmer–Lemeshaw test for regression models.
Hosmer–Lemeshaw Test
MoveChi-Square (Math.)(Number of) Degrees of Freedom (Physics)Significance
12.74080.950
Table 12. Binary logistics regression model of pathfinding correctness and scene parameters.
Variables in the Equation
BStandard ErrorVardø (City in Finnmark,
Norway)
(Number of) Degrees of Freedom (Physics)SignificanceExp(B)95% Confidence
Interval for Exp(B)
Lower LimitLimit
Step 1aDi (%)373.0136.057.521.00.0060.6040.3770.966
Dki (%)−1033428.445.821.00.0160.4200.1631.084
Dp (mm)−1.480.606.051.00.0140.2280.0700.741
Tm (s)−0.140.083.351.00.0670.8660.7421.010
Pp (%)−0.050.026.551.00.0100.9500.9130.988
Pmb (%)−0.130.0318.311.00.0000.8790.8280.932
Tp (s)−0.020.011.851.00.1730.9850.9631.007
constant5.132.583.951.00.047168.76
Step 1bC−0.500.244.421.00.3560.6040.3770.966
Fvc0.120.240.251.00.6181.1280.7021.814
Cp0.140.140.981.00.3221.1470.8741.506
constant−0.550.235.901.00.0150.575
a. Variables entered in Step 1: Information Density, Key Information Density, Pupil Diameter, Mechanical, Crowd, Information, Environment, Connectedness, Visual Field Area, Compactness, etc. b. Variables entered at step 2: connectivity, field of view area, compactness.
Disclaimer/Publisher’s Note: The statements, opinions and data contained in all publications are solely those of the individual author(s) and contributor(s) and not of MDPI and/or the editor(s). MDPI and/or the editor(s) disclaim responsibility for any injury to people or property resulting from any ideas, methods, instructions or products referred to in the content.

