Abstract
Anchor bolts are often used in nuclear power plants to connect equipment and equipment foundations. Under a severe earthquake, tensile breakout failure is prone to occur in the anchor bolts. As the total amount of installed machines rises, the inertial forces transferred to the anchor bolts under seismic loads also increase significantly. Therefore, the capacity is no longer satisfied by concrete alone, and specialized supplementary reinforcement needs to be installed around the bolts. The study analyzed the tensile behavior of anchor bolts in foundations with supplementary reinforcement experimentally. A total of 16 single-headed anchors in RC foundations with various diameters, yield strengths, and forms of supplementary reinforcement were tested under monotonic tensile loading. The results show that supplemental tie bars and supplemental U-shaped bars, respectively, rely on the bond with the concrete and their own tensile strength to increase the tensile breakout capacity. Furthermore, based on the failure mechanism, a new model considering the terms of concrete resistance and reinforcement resistance for the tensile breakout capacity of headed anchors around with supplementary reinforcement was proposed. Compared with the strut–tie model by EN 1992-4:2018, the predicted results of the model proposed by this study are relatively consistent with the experimental results, while the results by EN 1992-4:2018 are overly conservative.
1. Introduction
In order to reduce carbon emissions and accommodate the growing demand for electricity, nuclear energy is emerging as a primary energy resource for electricity generation. The advantages of nuclear power generation, namely its renewability, efficiency, and carbon-free status, make it an important means of balancing electricity demand and reducing greenhouse gas emissions. This necessitates an augmentation in the aggregate quantity of machinery and equipment employed in the generation of electricity in nuclear power plants [1,2]. In nuclear power plants, equipment is fixed to the equipment foundation by means of fasteners. Based on the method of installation, fasteners can be divided into two categories: cast-in-place anchors and post-installed anchors. There are many types of cast-in-place anchor bolts, such as anchor channels, head bolts, anchor groups, threaded sleeves, etc. Post-installation bolts are more common, including expansion bolts that are mechanically self-locking to the concrete, adhesive anchors that rely on bonding to the concrete, and undercut anchors [3]. During seismic action, the forces on the equipment are transmitted to the equipment foundation through the anchor bolts.
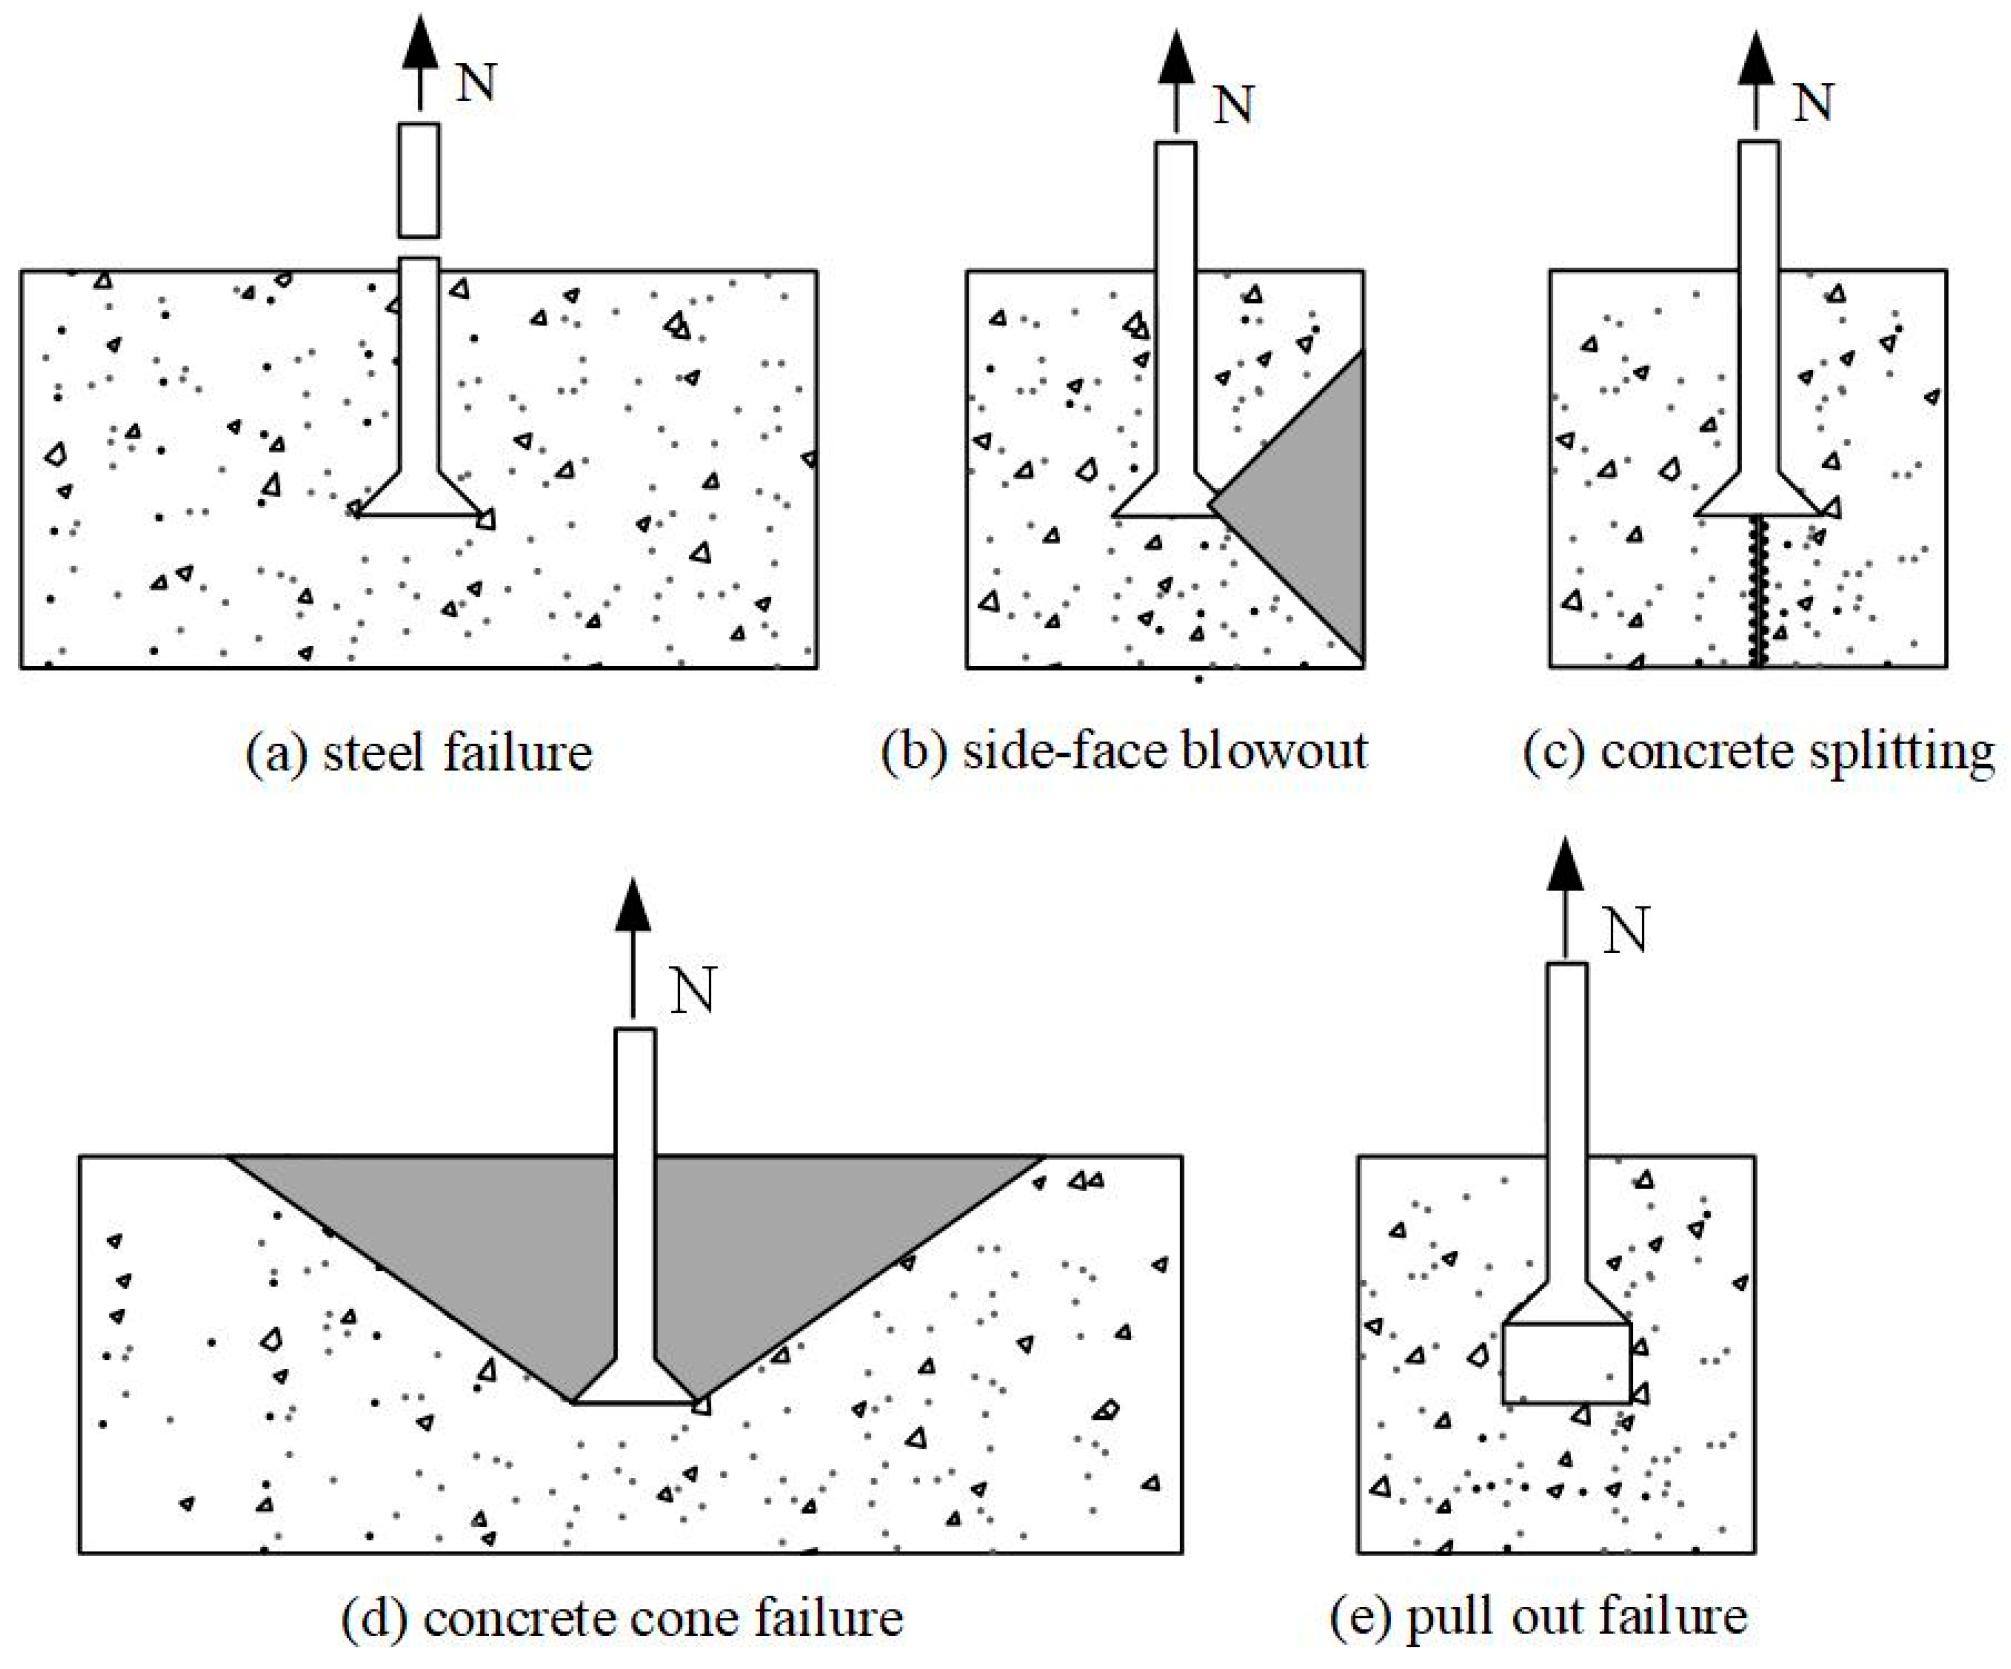
The failure form of a single cast-in-place anchor subjected to tensile loading can be attributed to one or more of the failure modes shown in Figure 1 [4]. Failure mechanisms are influenced by a variety of factors, such as the properties of the anchor bolt (diameter, yield strength, ultimate strength), embedment depth, edge distance, and size of the concrete element. Concrete side-face blowout and concrete splitting are usually associated with the anchor bolt installed in the concrete elements, which are narrow and thin [5]. Even if the embedment depth is different, the anchor bolts with the same edge distance have the same capacity for concrete side-face blowout failure. Eligehausen [6] indicated that the concrete splitting resistance relied on the concrete strength, thickness of the member, edge distance, and the spacing of anchor bolts, and it was recommended that both the anchor spacing and edge distance exceeded 6d0 for the cast-in-place anchor. Fib bulletin 58 [7] specified the minimum thickness requirements for members installed with anchors. Under tensile loading, the behavior of the concrete around the anchor bolt in the form of a cone with a decreasing diameter from top to bottom along the direction of embedment depth away from the original member is referred to as concrete cone failure, also known as tensile breakout failure. Pull-out failure is mostly seen in post-installed anchors with incorrect installation procedures and headed anchors in early-age concrete with shallow embedment depth, while it rarely occurs in mature-age concrete. The equipment foundations in nuclear power plants are characterized by large plane sizes, large thicknesses, and embedded anchor bolts with high strength. Suffering from strong earthquakes, the anchor bolts located in the center of the equipment foundation are prone to tensile breakout failure. Other failure modes can be avoided by additional construction measures.
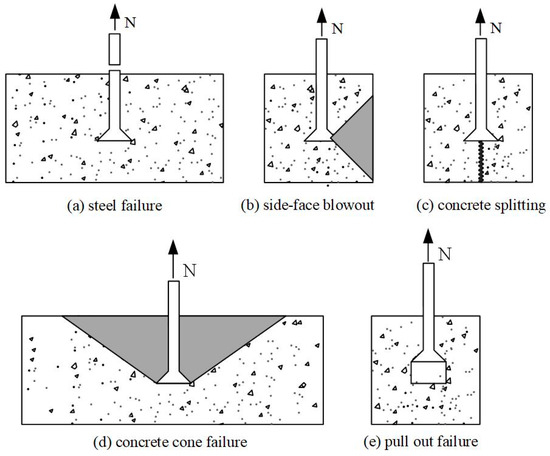
Figure 1.
Failure modes of single anchor bolts in plain concrete under tensile loading.
The failure mechanism of anchor bolts failing in tensile breakout is quite complex. To establish the calculated model of concrete cone capacity, the researchers have carried out numerous studies through experimental investigation, finite element analysis, and theoretical analysis. After a comparative analysis of the advantages and disadvantages of computational models from several organizations, including the PCI design handbook [8] and ACI Committee 349 [9], Klingner [10] proposed the Variable Angle Cone (VAC) method that could reasonably predict the experimental results. The VAC method asserted that the cone failure angle between the breakout plane and the horizontal plane was progressively greater with increasing embedment depth of anchor bolts. When the embedment depth was less than 127 mm, the cone failure angle was 28°, whereas, for depths greater than 127 mm, the cone failure angle gradually increased until it approached 45°. Ballarini and Shah [11] argued that the VAC method was not conservative since the resistance was calculated based on the maximum tensile strength of the matrix on the failure surface. Thus, the model considering nonlinear displacement behavior during the failure process needed to be proposed. However, further discussion has been conducted on cone failure angle and resistance calculation methods. Incorporating the analytical methodology of the VAC method, ACI 349-85 [12] proposed a model that took the influence of the diameter of the anchor head into account and assumed 45° for the cone failure angle. Eligehausen and Sawade [13] conducted pull-out tests on bolts embedded at depths ranging from 130 mm to 520 mm to verify the accuracy of the view that the cone failure angle was consistently 45°. The test results indicated that the cone failure angle was approximately 37.5°. The cracks gradually propagated from the bottom of the bolt to the surface by statistically analyzing the strain gradient pattern in the vicinity of the cracks. As the crack grows steadily, there is a redistribution of tensile stresses on the concrete cone failure surface. In accordance with this fact, a model based on fracture mechanics was proposed. The model assumed that the tensile breakout capacity was proportional to the square term of the multiplication of the fracture energy GF and elasticity modulus Ec. Eligehausen and Ozbolt [13] analyzed the process of tensile breakout failure for headed anchor in plain concrete at three different embedment depths (50 mm, 150 mm, 450 mm) by means of numerical simulation to verify the validity of the model based on linear fracture mechanics. The study indicated that as the embedment depth of the anchor bolts increased, the tensile stresses in the cone failure surface decreased gradually due to the size effect raised by Bazant [14]. Therefore, the actual capacity was lower than the theoretical value based on linear fracture mechanics.
In 1995, Fuch [15] proposed the Concrete Capacity Design (CCD) method, which became the basis for the recommended capacity design formulas on anchor bolts of the design specifications ACI 318-19 [16] and EN 1992-4:2018 [17]. The CCD model took the size effect law into account by assigning a reduction to the exponent of the embedment depth of anchor bolts and assumed that the cone failure angle and the diameter of the failure surface were approximately 35° and three times the embedment depth, respectively. An experimental study of the seismic performance of cast-in-place anchor bolts and post-installed anchors at different loading rates by Solomos and Berra [18] confirmed the assumptions of the CCD method. However, the prediction of the CCD method on the tensile capacity of anchors with embedment depth exceeding 279 mm showed significant deviation. Therefore, ACI 349-01 [19] proposed a modification to the tensile capacity calculation for embedment depths ranging from 279 mm to 635 mm of anchor bolts by assigning an index of 1.67 to the embedment depth term. Lee [20] performed a series of pull-out tests on large diameter anchors with embedment depths from 635 mm to 1143 mm to compare the predicted results among ACI 318-05 [21], ACI 349-97 [22], the CCD method and the Modified CCD method proposed by ACI 349-01. The analysis indicated that ACI 318-05, the CCD method, and the Modified CCD method were overestimated by 18%, 32%, and 9%, respectively, while ACI 349-97 was underestimated by 49%.
The above study is directed at modeling the concrete cone failure capacity of single cast-in-place anchor bolts in plain concrete. With the increase in the total amount of equipment installed in the nuclear power plant, relying only on concrete to resist the vertical component of the seismic load is no longer sufficient to meet the bearing capacity requirements, and it is necessary to install specialized supplemental reinforcement around the anchor bolts. Recommendations for supplemental reinforcement around anchor bolts were given in design specifications ACI 318-19 [16] and EN 1992-4: 2018 [17], which proposed a form of U-shaped bars. Several research studies on the effects of U-bars and surface reinforcements have been published. Ferreira [23] conducted the pull-out test on 16 reinforced concrete blocks embedded with a single anchor bolt. The experimental results revealed that U-shaped bars with a distance of 0.5hef from the anchor bolt could be effective in increasing the tensile breakout capacity of a single anchor bolt, while as the spacing between bars and anchor bolts increases up to 1.1hef, the U-shaped bars no longer play a role in bearing the tensile load. To determine the crack patterns concerning headed anchors with supplementary reinforcement installed under tensile loading, Nunzio [24], Petersen [25], and Nilforoush [26] conducted a rigorous series of experimental investigations. The outcome of these studies showed that supplemental U-shaped bars took up the tension as the concrete stiffness began to degrade, increasing the anchorage ductility and tensile breakout capacity as well as reducing the failure surface area. Furthermore, when subjected to tensile breakout failure, the failure would be accompanied by concrete splitting, but the surface reinforcement can effectively limit the propagation of splitting cracks. In the event of tensile breakout failure, the U-bars of most specimens did not fracture but experienced bond failure. However, the increase in capacity was still very significant, perhaps owing to the fact that the existing codes are overly conservative in their assessment of the bond strength of the reinforcement [27].
In general, the methods for calculating the capacity of concrete cone failure of anchor bolts embedded in plain concrete have been relatively comprehensive, while the only method for predicting the tensile breakout capacity of anchor bolts with supplementary reinforcement was the strut–tie model proposed by EN 1992-4:2018 [17]. The model only considered the role of the supplementary U-shaped bars but ignored the resistance provided by the concrete. However, the anchor bolts embedded in the equipment foundations of nuclear power plants are characterized by large diameters, large-size heads, and large embedment depths, and the resistance provided by the concrete is relatively considerable. Therefore, it is necessary to modify and stabilize the method of calculating the tensile breakout capacity of anchor bolts with supplementary reinforcement. Furthermore, although the current specifications recommend installing U-shaped bars around the anchor bolts, the equipment foundation is secondary cast in the floor slab of the nuclear power plant, and it is inconvenient to install U-shaped reinforcement, while the reinforcements around the anchor bolts are mainly tie bars.
In this study, the influence of U-shaped bars and tie bars on the tensile breakout capacity and anchorage ductility is evaluated experimentally for headed anchors with large heads in RC foundations under monotonic tensile loads. A total of 16 single cast-in-place headed anchors were tested in reinforced concrete foundations with various forms, yield strengths, and diameters supplementary reinforcement. The failure mode, failure surface diameter, ultimate load, and displacement at peak load of each specimen are recorded. Combined with the regression analysis of test results and data of single cast-in-place anchors in plain concrete collected from the literature, a new model of tensile breakout capacity on single-headed anchors with supplementary reinforcement, which took the resistance of concrete into account, was proposed. The model can provide a reference for the design specification of nuclear power plant equipment foundations.
2. Experimental Program
In this test, two types of supplementary reinforcement were installed around the anchor bolts: supplemental tie bars and supplemental U-shaped bars. Supplementary tie bars were installed uniformly around the headed anchor, while supplementary U-bars were installed symmetrically on both sides of the headed anchor. The distance of both supplementary reinforcements from the headed anchor was within 0.75 hef, which was the valid range specified in EN 1992-4:2018 [17]. The test variables also included the embedment depth of the headed anchor (150 mm and 200 mm) and the yield strength (423.2 MPa, 459.6 MPa, 508.7 MPa, 576.4 MPa) and diameter (12 mm and 16 mm) of the supplementary reinforcement.
2.1. Test Specimens and Material Properties
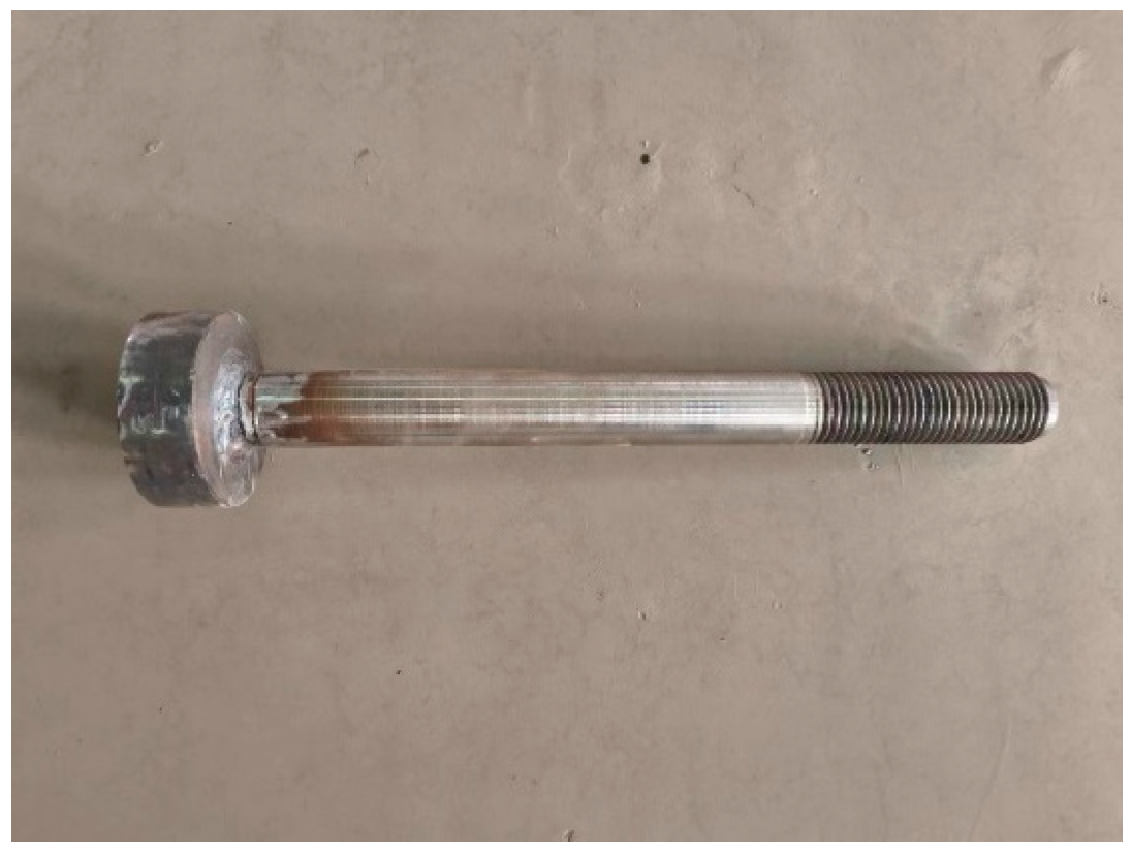
The headed anchors in foundations consisted of a Grade 10.9 and diameter of 36 mm steel rod with yield strength and ultimate strength of 900 and 1000 MPa, respectively. The dimensions of the head were 90 mm in diameter and 30 mm thick (Figure 2).
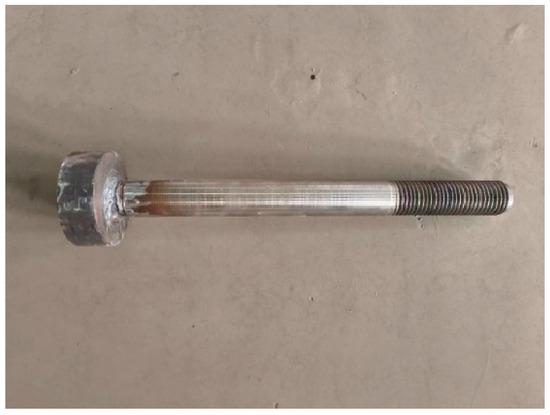
Figure 2.
Headed anchor.
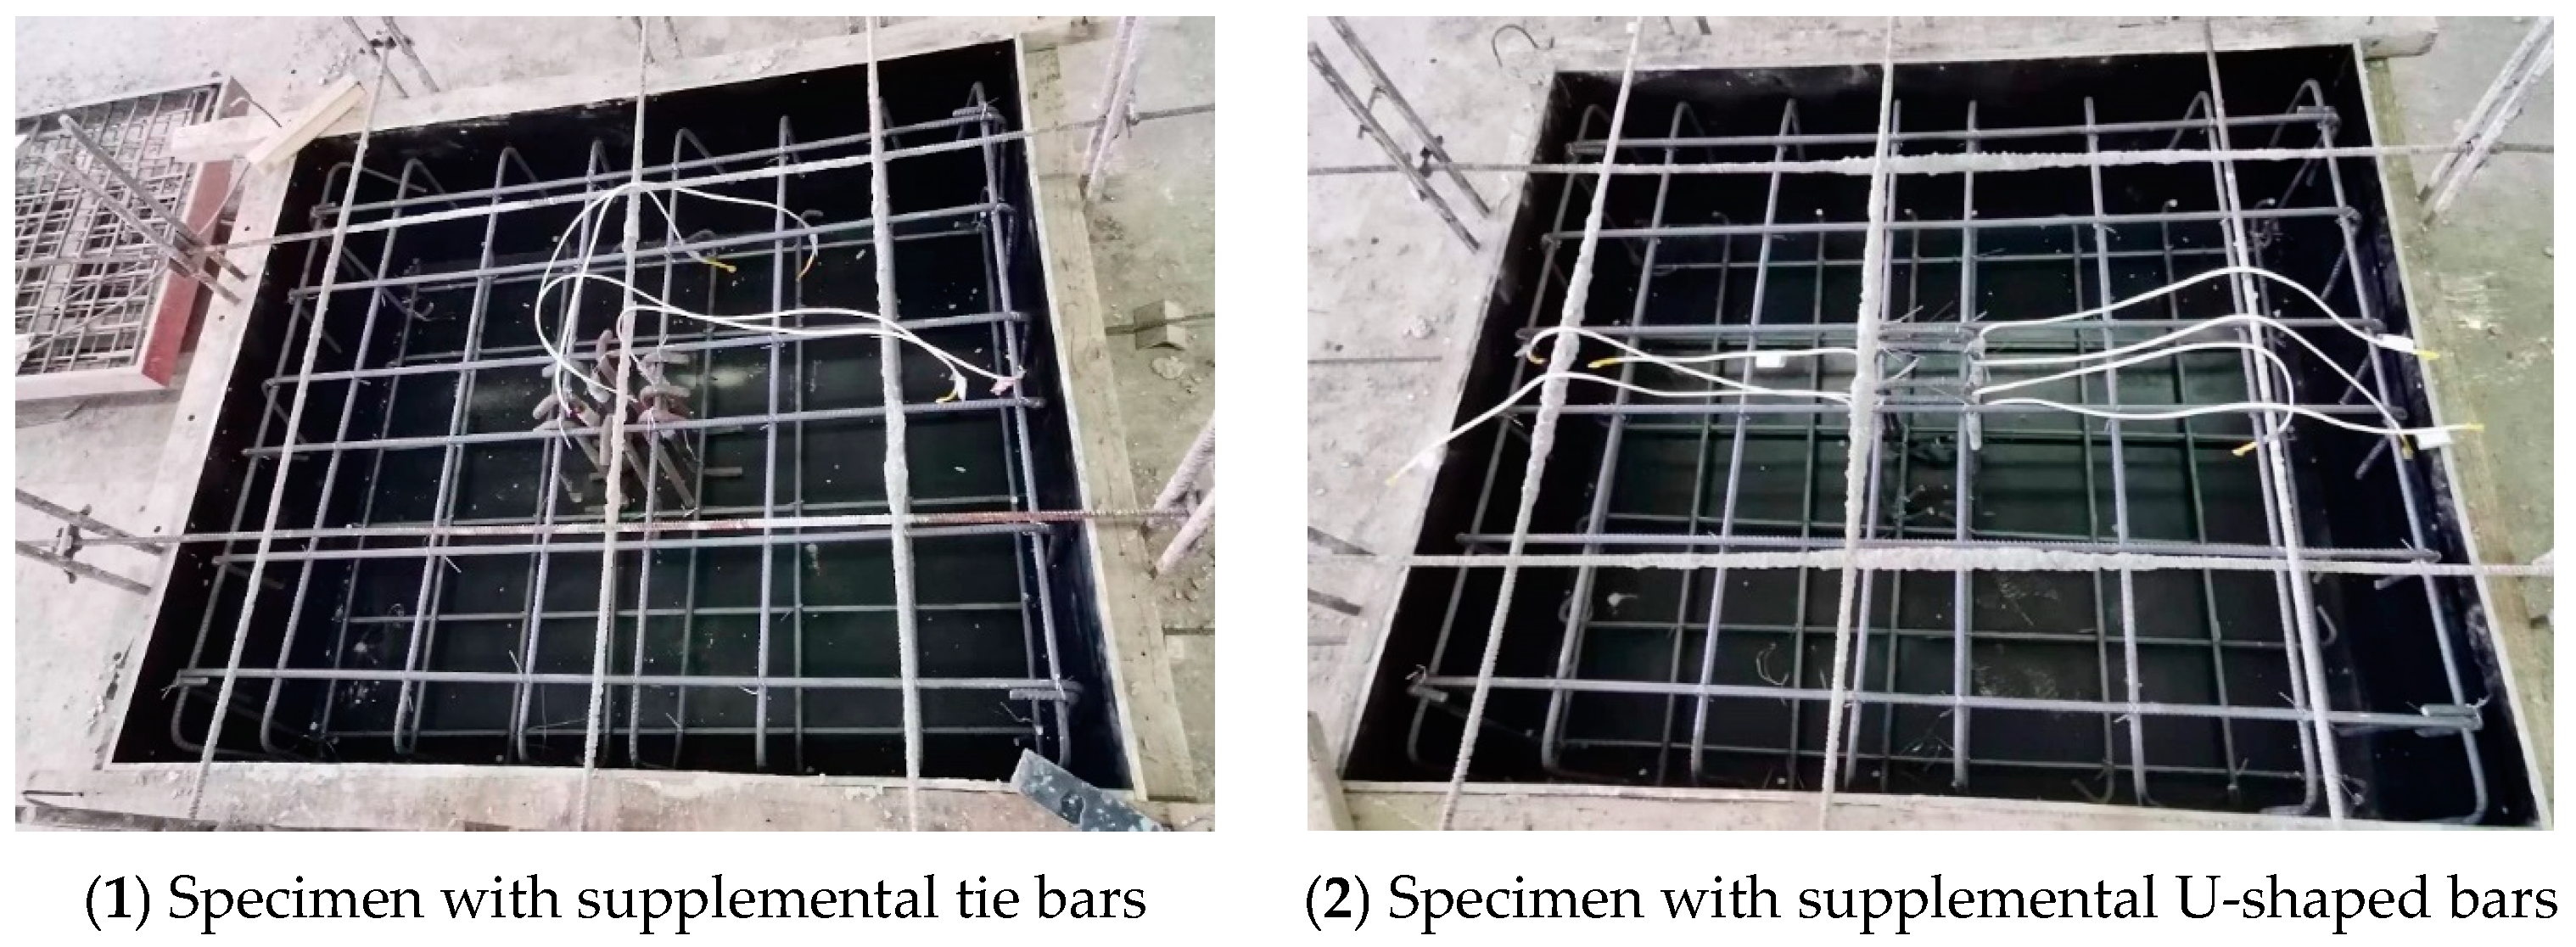
The headed anchor was cast in place in the RC foundation measuring 1400 mm × 1200 mm × 450 mm (length × width × thickness), which was sufficient for the extension of the breakout failure surface and to avoid concrete splitting. The concrete foundation was installed with an orthogonal surface and bottom reinforcement (12 mm in diameter). To avoid influencing the test results, the stirrups (12 mm in diameter) used to maintain the surface and bottom reinforcement were installed only at the corners of the foundations. The spacing of the orthogonal surface reinforcements was 200 mm in all areas except around the headed anchor, where the reinforcement is spaced at 150 mm. The ends of the supplemental tie bars are hooked to the surface and bottom reinforcements (Figure 3(1)). Horizontal segments of supplemental U-shaped bars spanned the surface reinforcements and the ends of vertical segments hooked to the bottom reinforcements (Figure 3(2)). The concrete cover in all directions of the foundation was 20 mm. Of the 16 RC foundation specimens, 2 specimens had no supplemental reinforcement installed, 6 specimens installed supplemental U-shaped bars as specified in ACI 318-19 [16] and EN 1992-4:2018 [17], and 8 specimens had supplemental tie bars installed along the perimeter of the anchor bolts. The main parameters of each foundation specimen, such as the embedment depth of the headed anchor, the form, number, diameter, and yield strength of supplementary reinforcement, are summarized in Table 1.
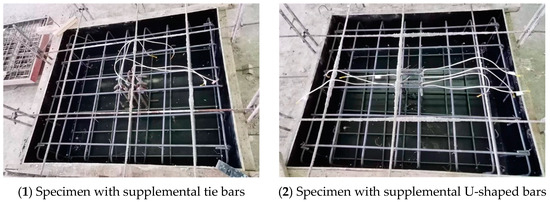
Figure 3.
Supplementary reinforcement layout.

Table 1.
Experimental program.
2.2. Test Setup and Instrumentation
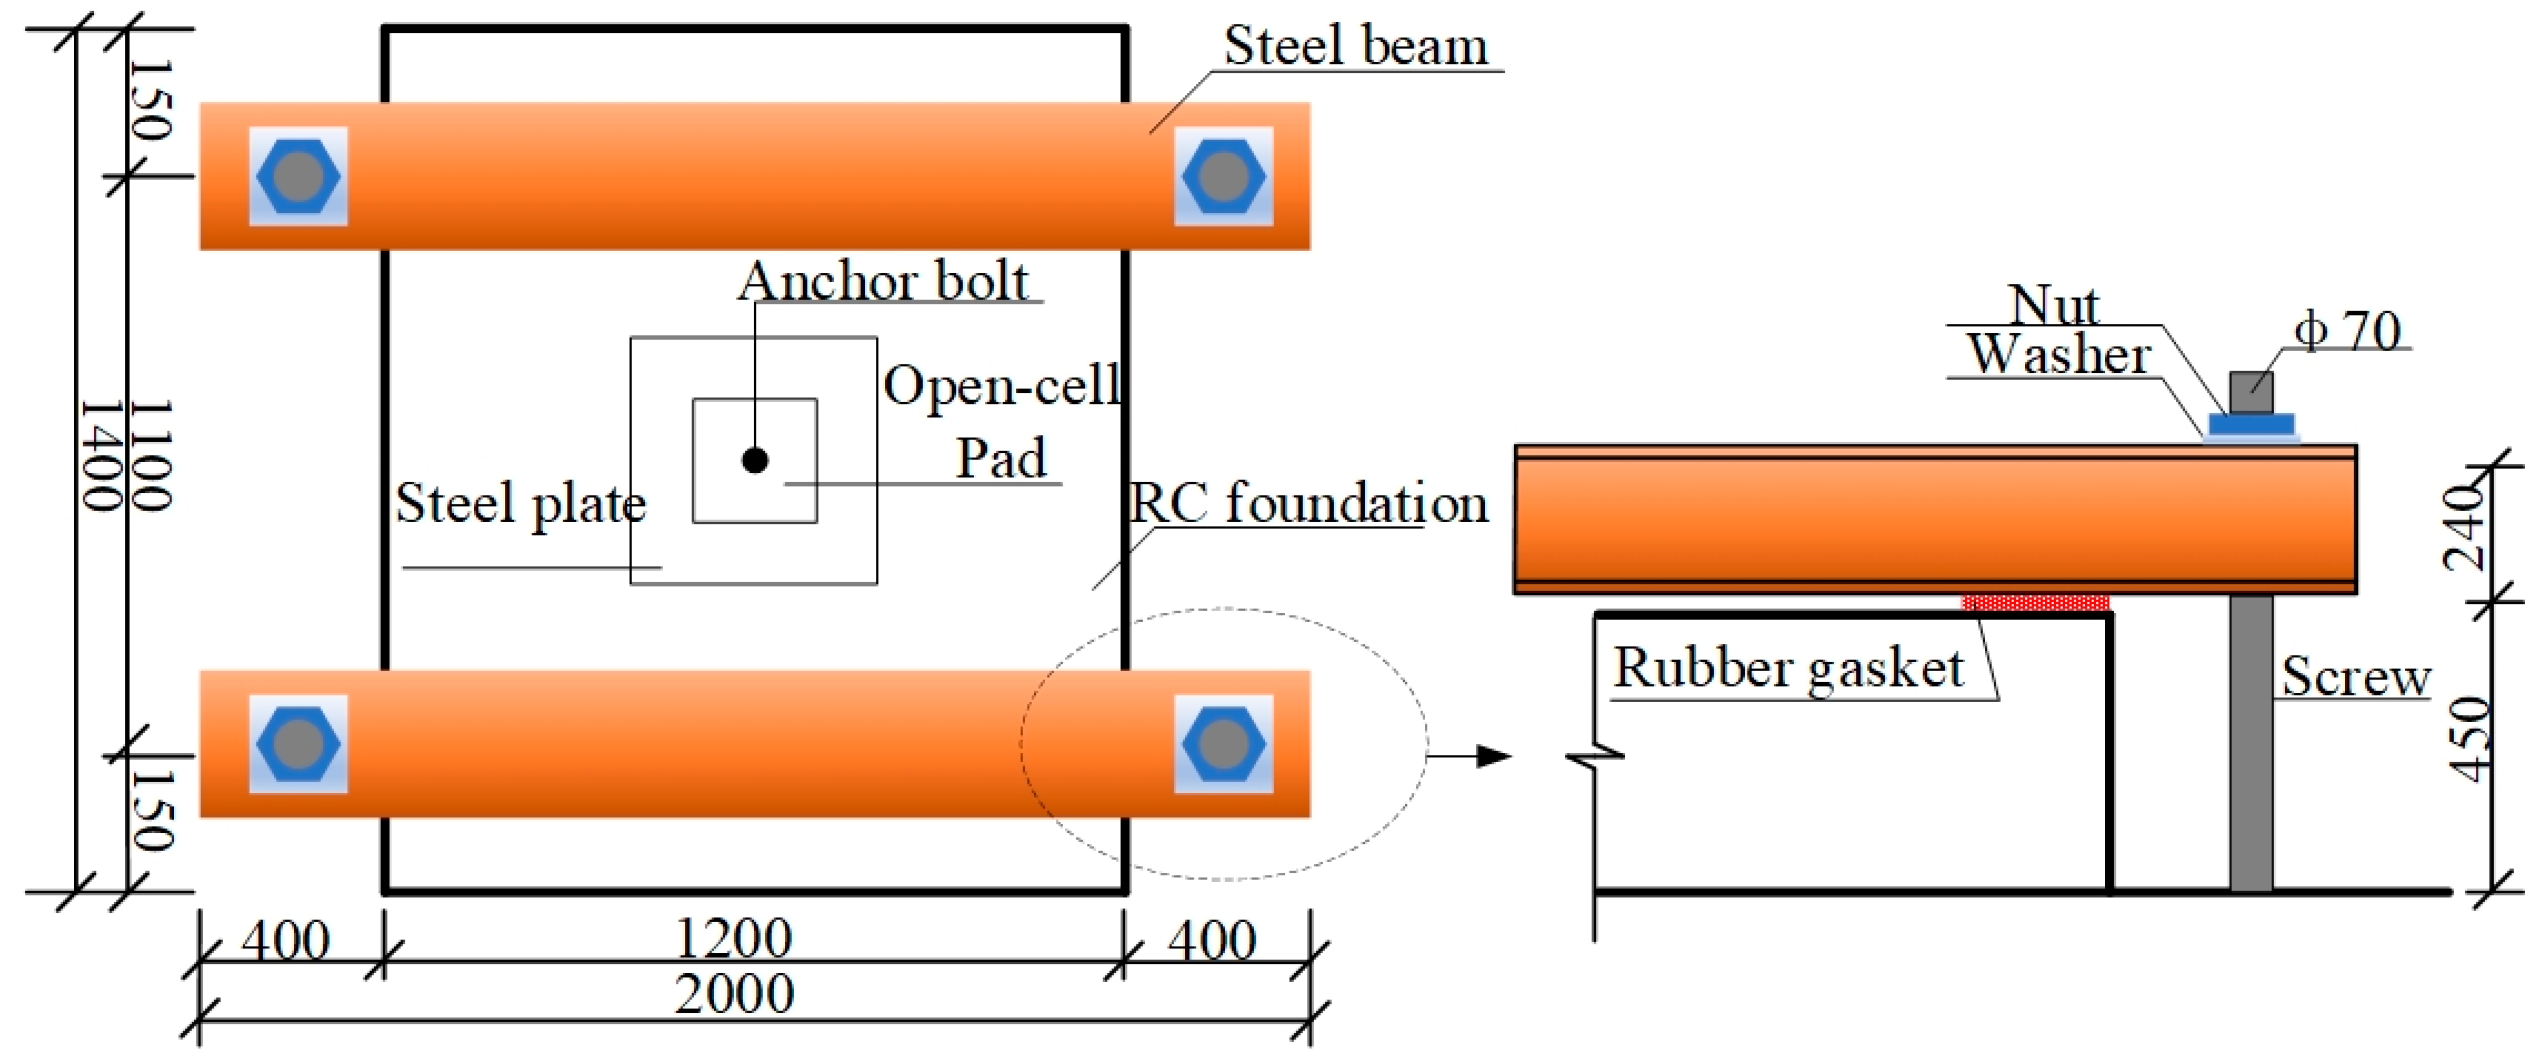
The test setup is shown in Figure 4. The load-controlled loading of the headed bolts was carried out by means of a servo-hydraulic actuator with a maximum range of 2000 kN and a loading rate of 1 kN/s. The bottom of the actuator was fixed to the reaction frame, and the head passed through four screws with 36 mm in diameter and a grade of 8.8. These screws were bolted to the headed anchor through a 50 mm thick steel plate of the same dimensions as the actuator head. To avoid inaccurate displacement measurements due to bending of the center of the steel plate caused by loads, a 60 mm thick open-cell pad was installed on the steel plate to increase its stiffness in the direction of load application.
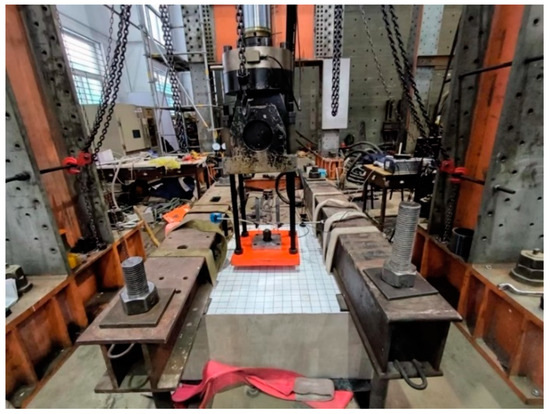
Figure 4.
General view of test setup.
In fact, the equipment foundation is fixed to the floor slab without any constraints on its upper surface. However, this boundary condition could not be fully restored in the series of tests. Therefore, for this test, two steel beams connected to the laboratory’s underground anchorage channel spanned across the top of the foundation specimen. Two rubber sheets measuring 240 mm × 80 mm × 10 mm (length × width × thickness) and spacing at 1.1 m were pasted under each steel beam to reduce the restriction on the concrete surface (Figure 5).

Figure 5.
Limit devices (unit: mm).
The load data during loading were measured by load cells inside the actuator. Displacement data were measured by two displacement sensors with an accuracy of 0.001 mm mounted symmetrically on both sides of the pad. The load and displacement data were recorded dynamically by the acquisition system.
3. Experimental Results and Discussion
3.1. Test on Headed Anchors in Foundations without Supplementary Reinforcement
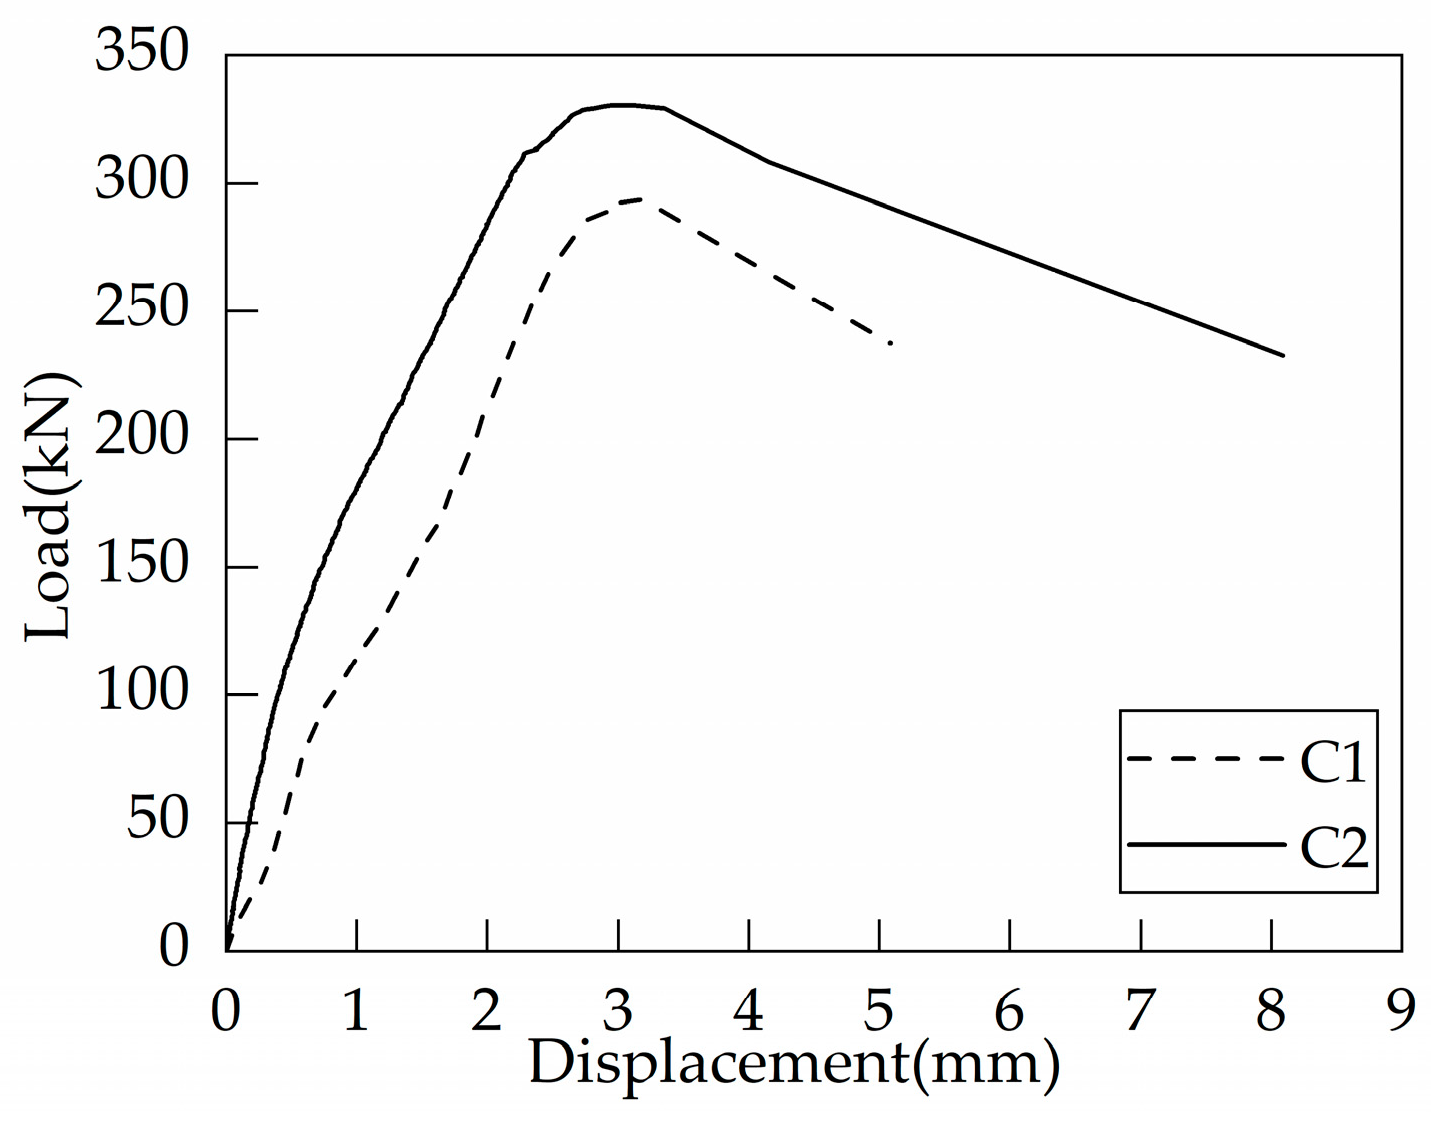
Figure 6 illustrates the crack patterns of the two foundation specimens (C1 and C2) without any supplementary reinforcement at failure. Under tensile loading, the surface of foundation specimens without supplementary reinforcement was pulled up. The concrete in the center of the foundation specimens formed an approximate square bulge. The concrete cone cracks were centered on the headed bolt and dispersed in all directions to the surface of the specimen at the peak load. Cracks parallel to the edges appeared on the side of the concrete at the same time as the surface cracked (Figure 6(3)). Taking the average of measurements in multiple directions, the failure surface diameters of C1 and C2 were 980 mm (6.53 hef) and 1070 mm (5.35 hef), respectively, both of which significantly exceed the assumed values of EN 1992-4:2018 [17] and ACI 318-19 [16]. Figure 7 shows the load-displacement curves of headed bolts in RC foundation specimens without supplementary reinforcement. As can be seen, the increase in the embedment depth of the headed anchor induces a small increase in the ultimate load, but the anchor displacements are almost identical at the peak load. In addition, as the load grows, there is only a slight decrease in anchorage stiffness, which degrades at the instant when the peak load is reached. Based on the post-peak anchorage behavior, the tensile breakout failure is brittle regardless of the embedment depths.
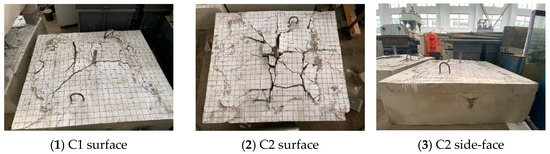
Figure 6.
Failure modes of headed anchors in foundations without supplementary reinforcement.
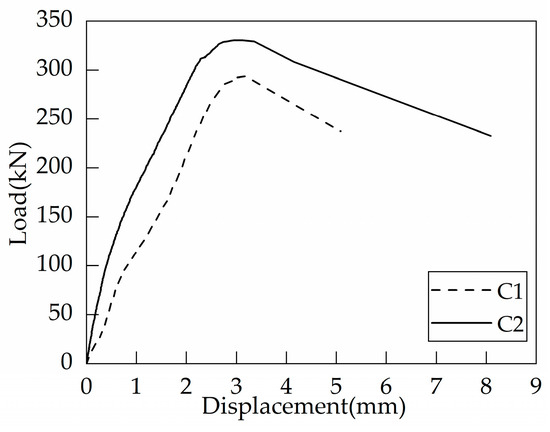
Figure 7.
Load-displacement curves of headed anchors in foundations without supplementary reinforcement.
3.2. Test on Headed Anchors in Foundations with Supplemental Tie Bars
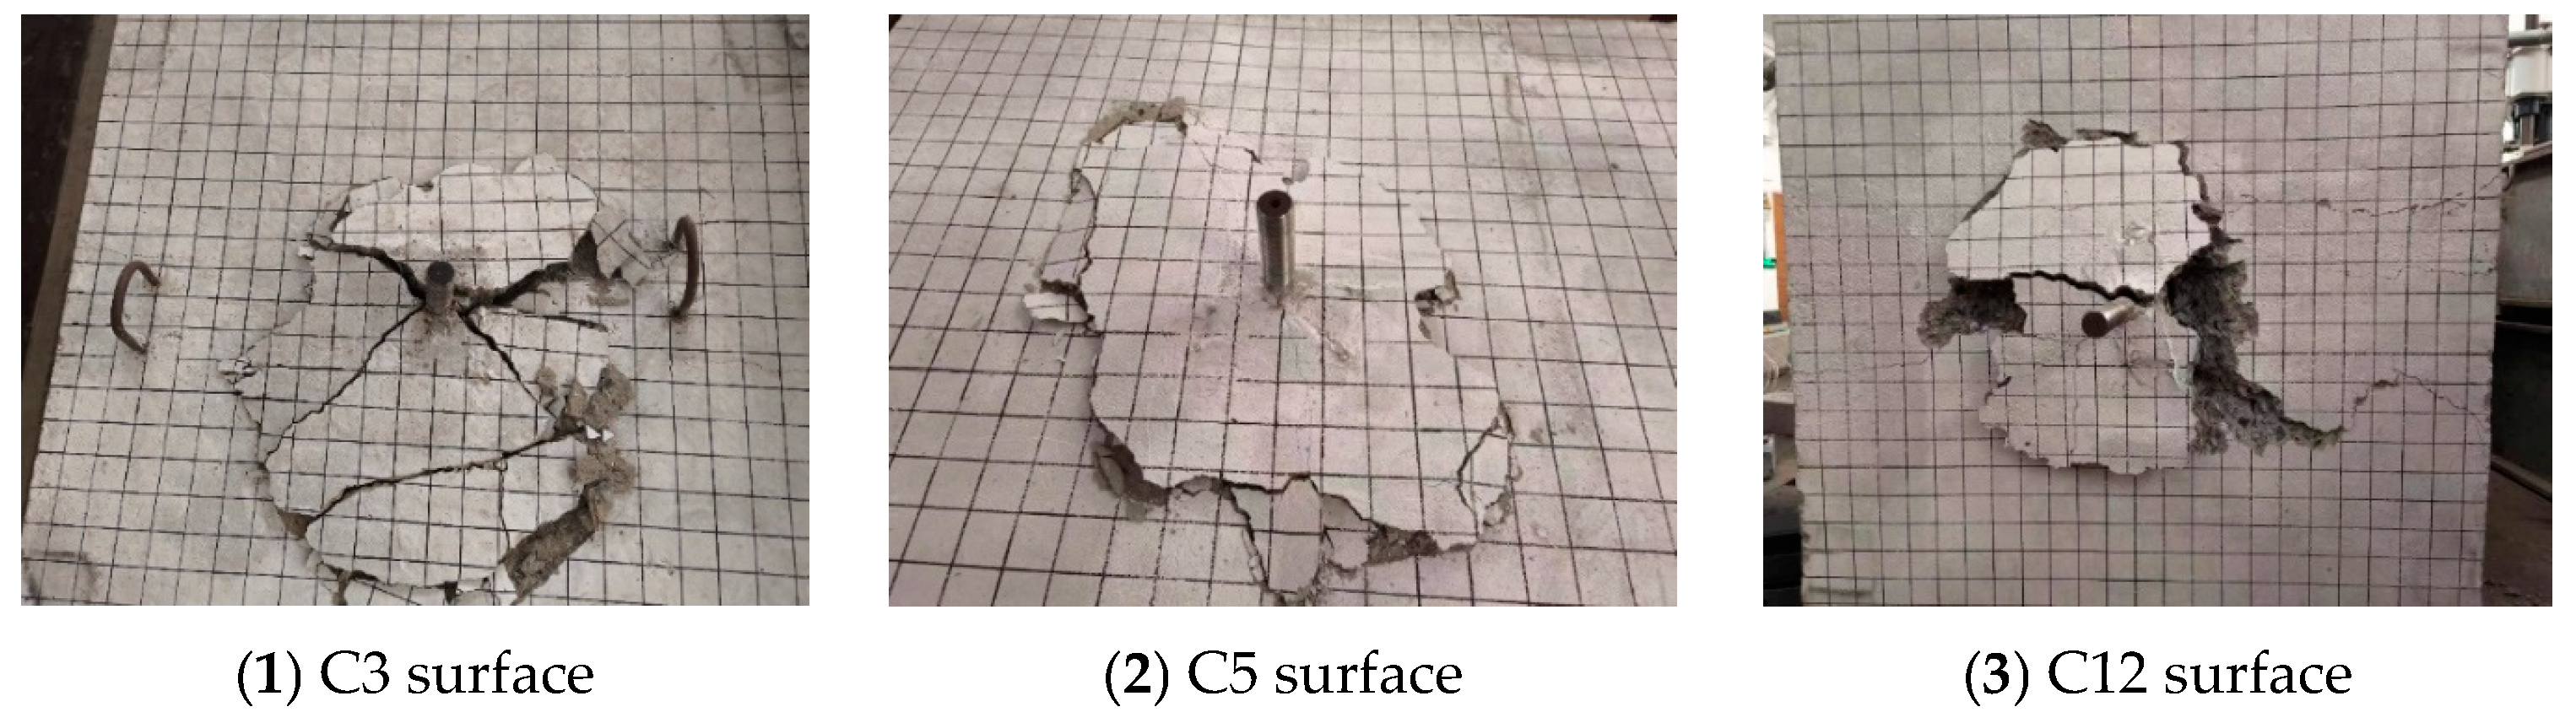
Figure 8 illustrates the crack patterns of part of the RC foundation specimens with supplemental tie bars. Cracks were initiated at the head of the anchor and gradually propagated to the surface as the load increased. When the load reached 60% to 80% of the peak load, a splitting crack along the short axis grew and propagated on the concrete surface, which did not extend through the thickness of the specimens. At peak load, the anchor with surrounding concrete was pulled out together, forming a circular or elliptical cone with a curved generating line. The supplemental tie bars provided a good hooping effect on the concrete around the headed anchor and changed the cracking path of the concrete, resulting in a significantly smaller diameter of the cone failure surface. After the measurements, the average diameters of the failure surface were 460.75 mm (3.07 hef) for C3 to C6 and 379.75 mm (1.89 hef) for C10 to C13.
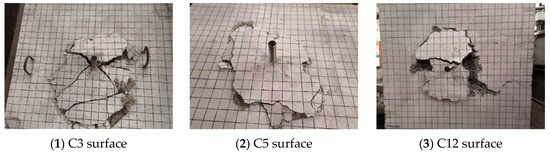
Figure 8.
Failure modes of headed anchors in foundations with supplemental tie bars.
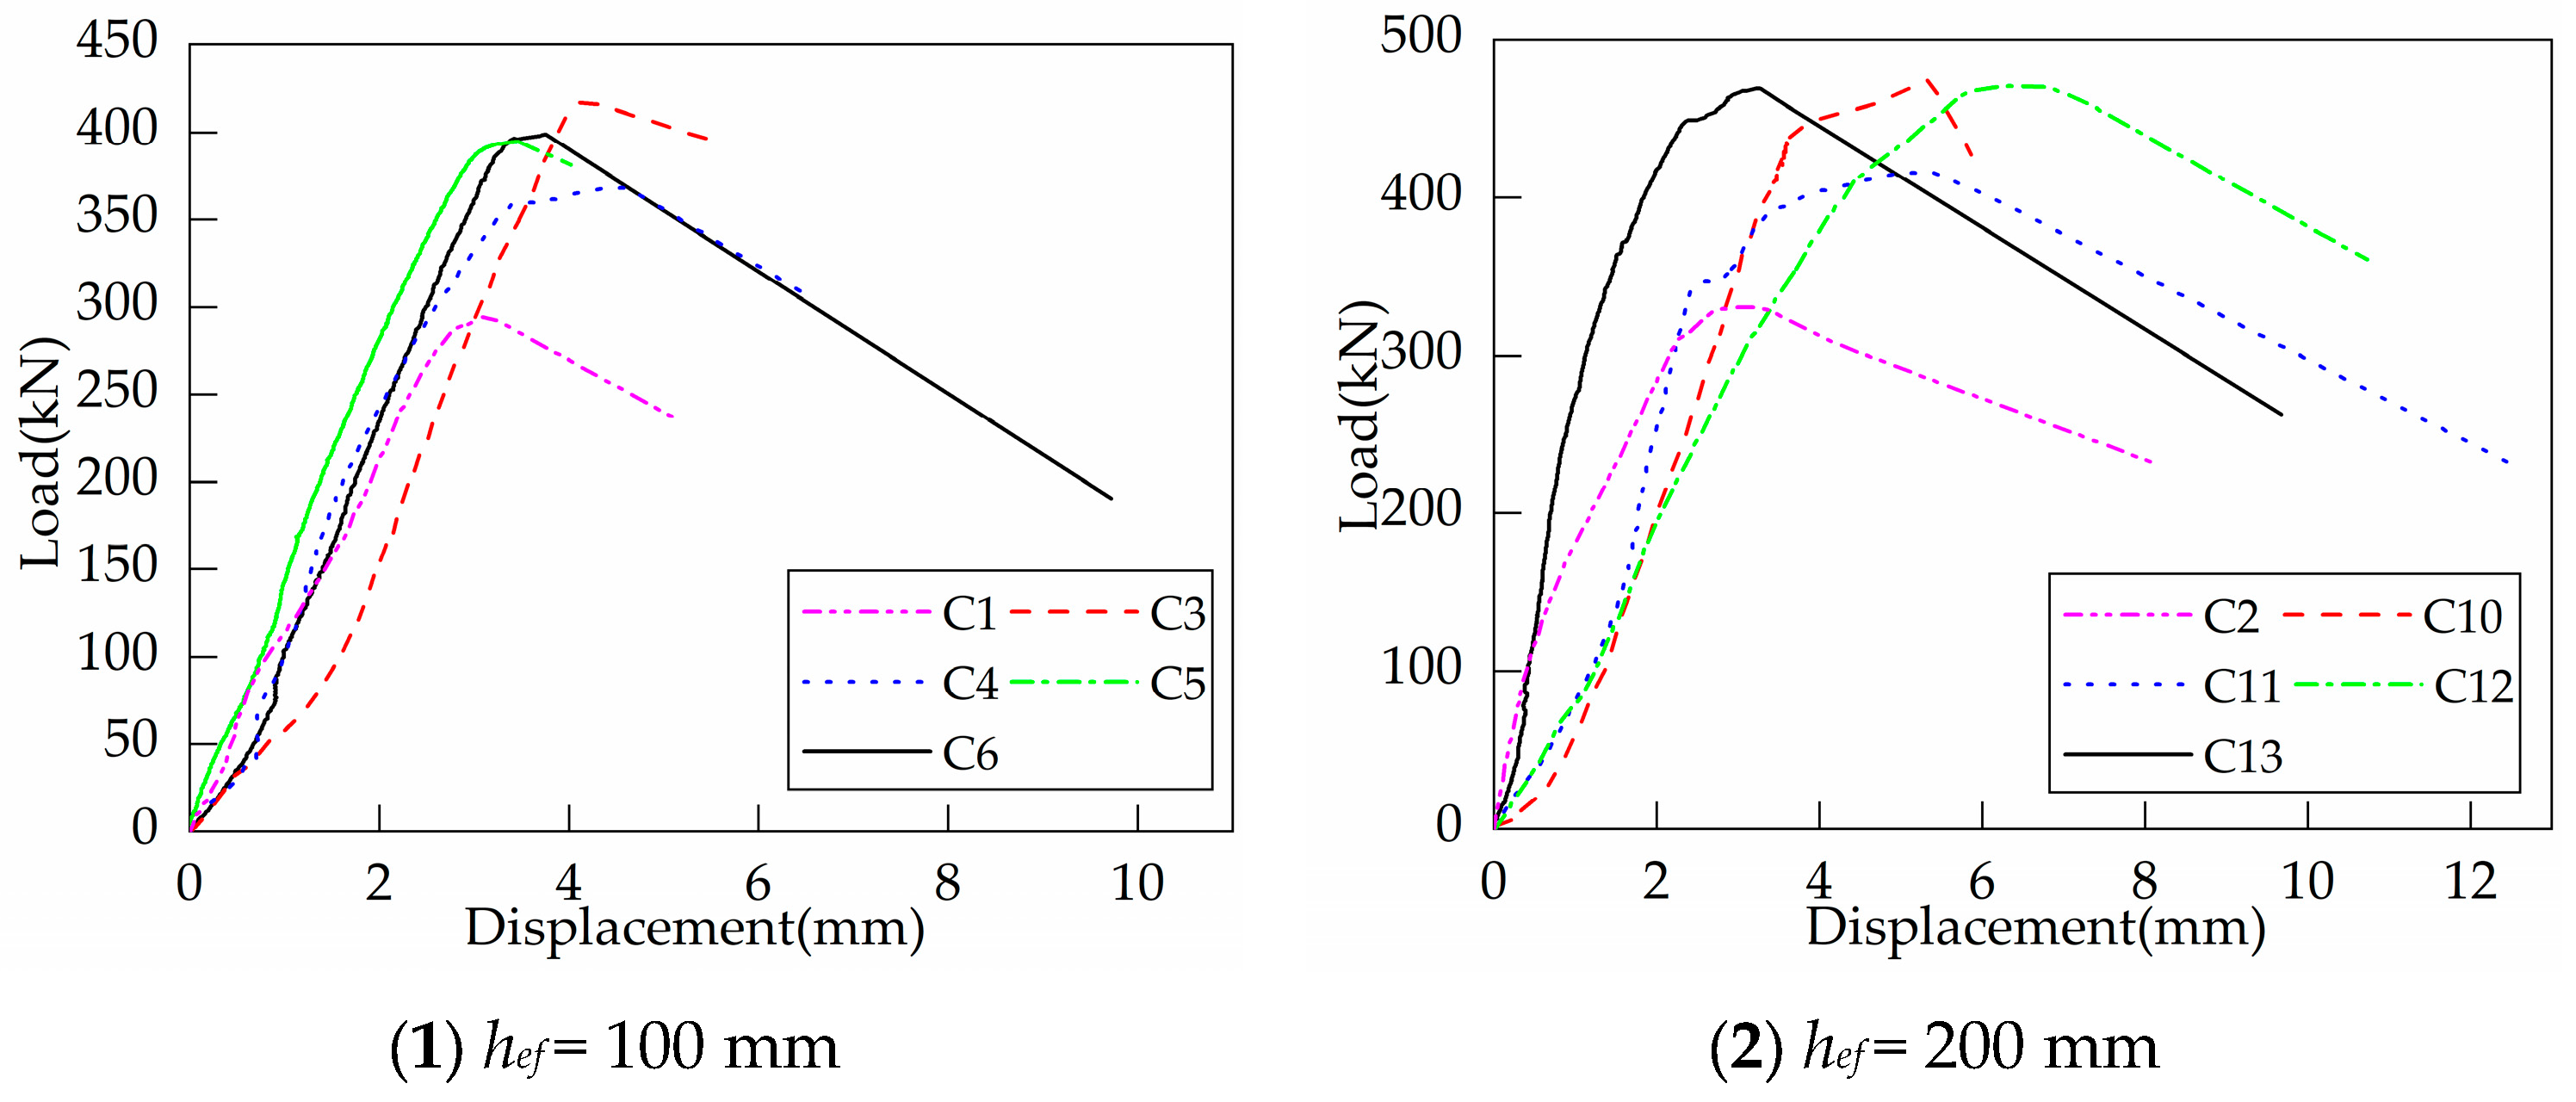
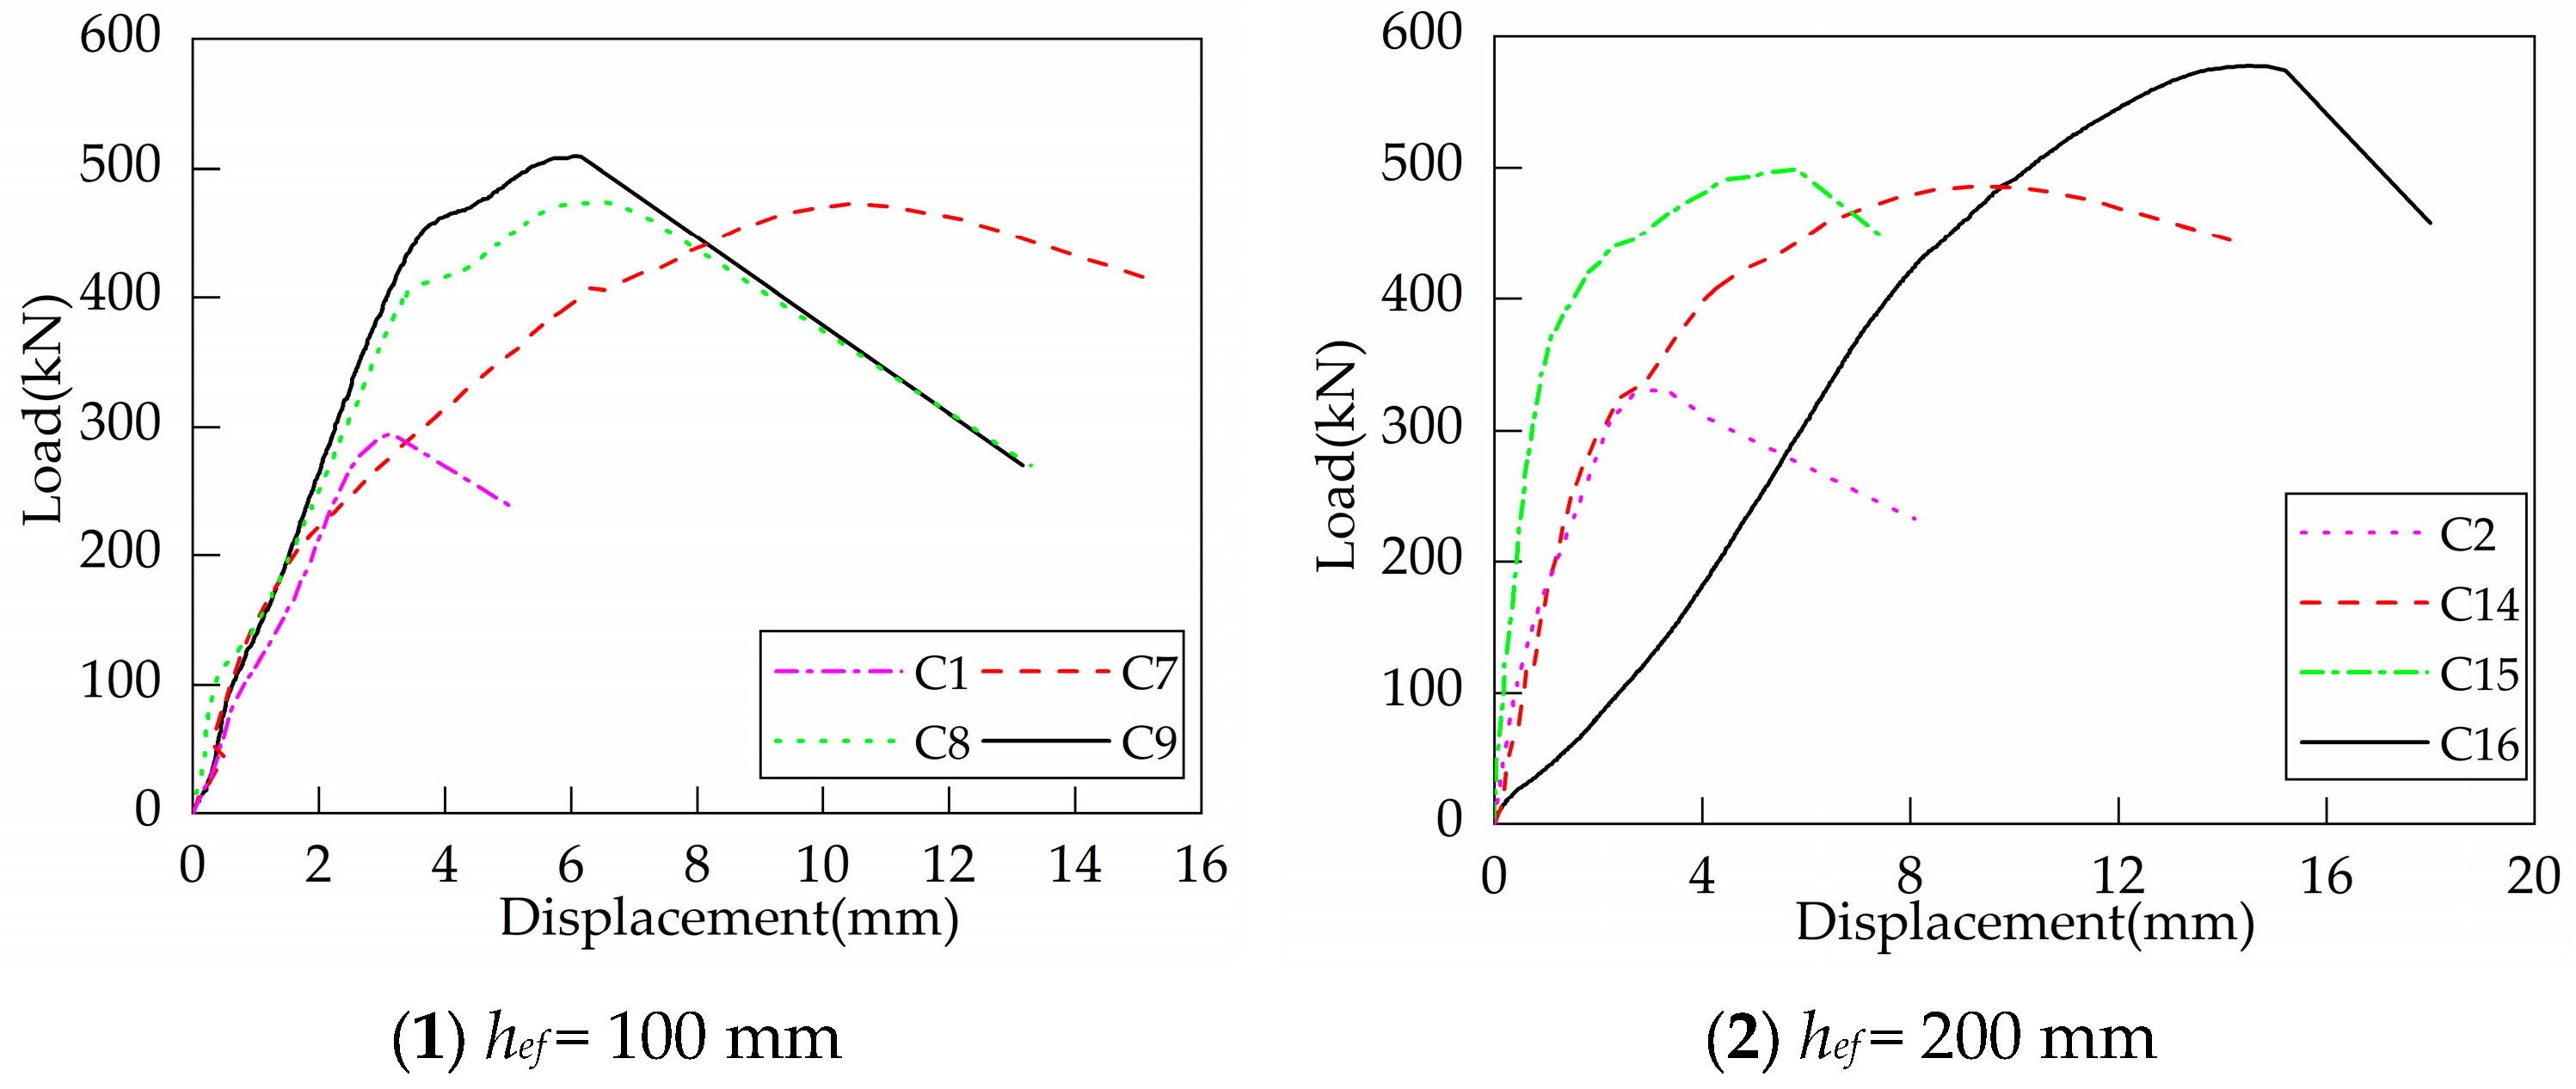
Figure 9 shows the load-displacement curves of headed bolts in RC foundation specimens with supplemental tie bars. The installation of supplemental tie bars results in an increase in the foundation tensile breakout capacity. When the headed anchors are embedded at the same depth, the ultimate loads are relatively close to each other, with a difference of 15% or less, regardless of the variations in yield strength and diameter of the supplemental tie bars. Before reaching the peak load, the load-displacement curves of C3~C6 were basically linear, indicating that there was almost no degradation of the anchorage stiffness. Furthermore, the displacements of the four specimens at peak load are also close to each other. However, the anchorage stiffness of specimens C10~C13 with greater embedment depths of anchors slightly decreases as the load increases.
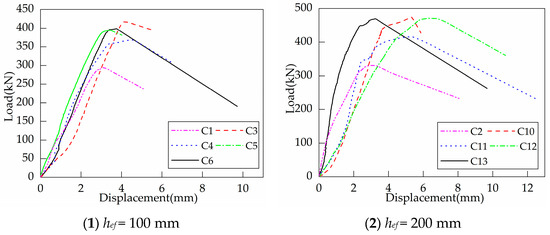
Figure 9.
Load-displacement curves of headed anchors in foundations with supplemental tie bars.
3.3. Test on Headed Anchors in Foundations with Supplemental U-Shaped Bars
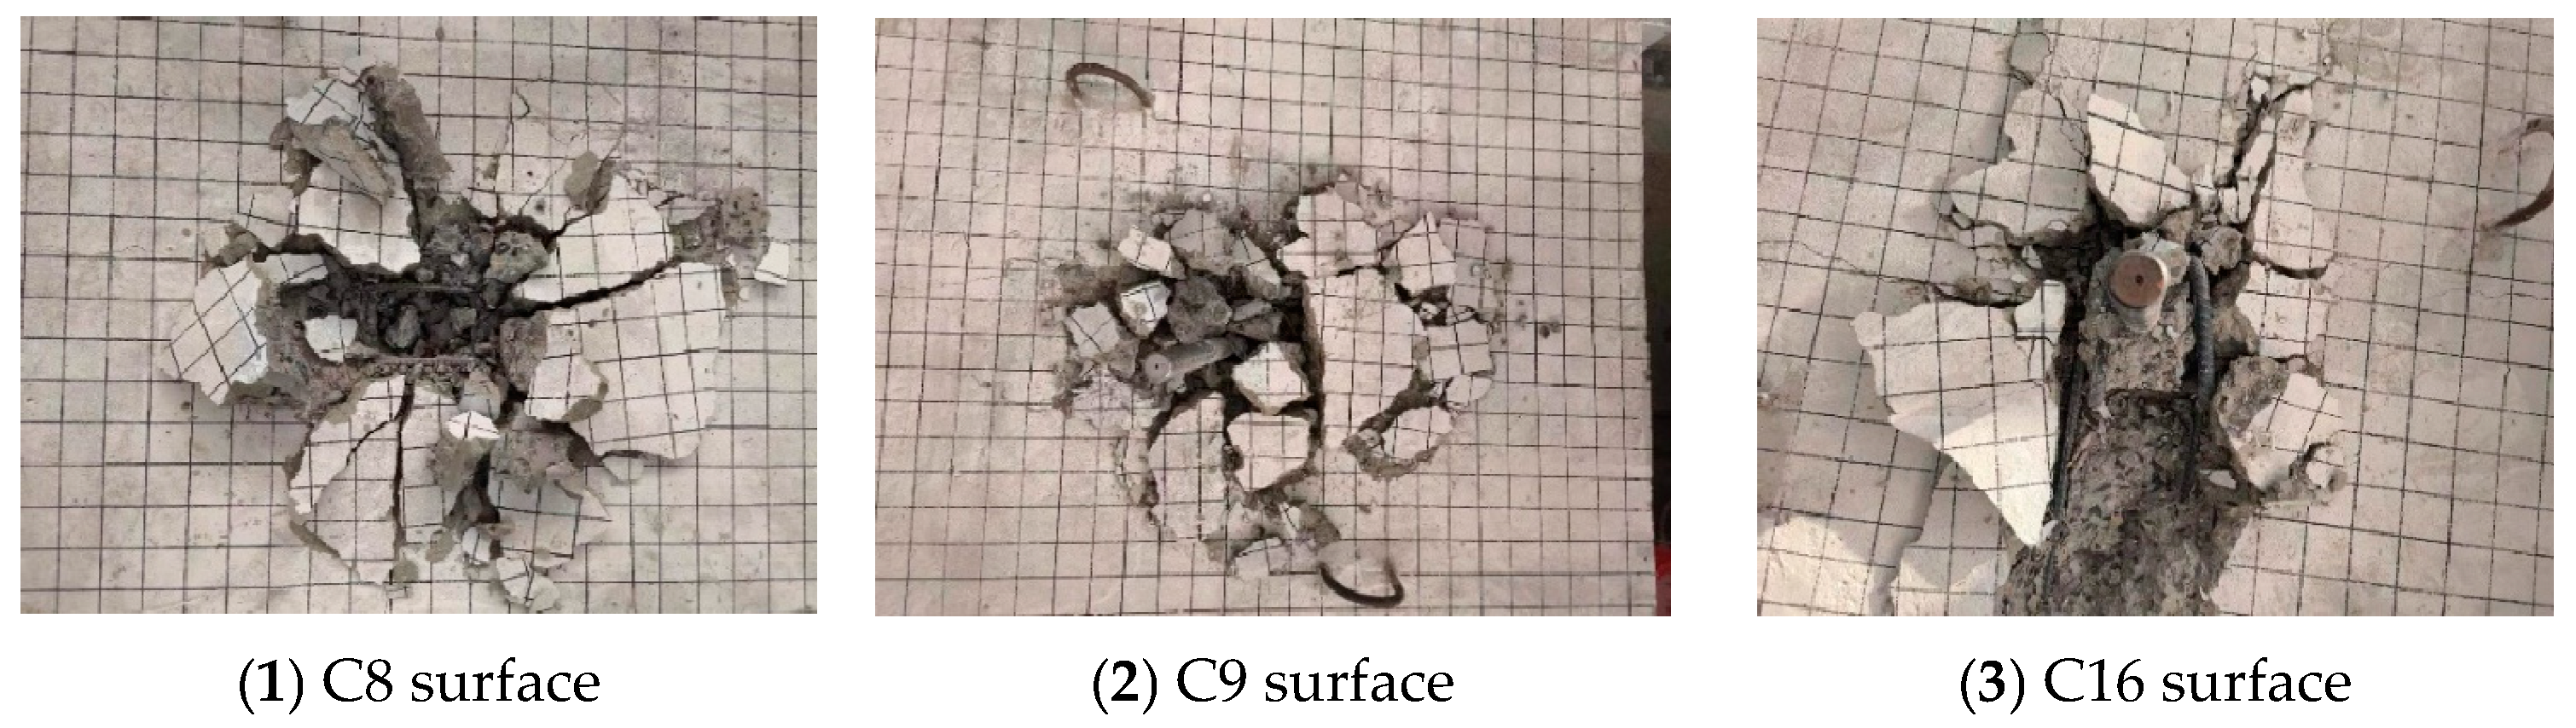
Figure 10 illustrates the failure modes of the foundation specimens with supplemental U-shaped bars. Tensile breakout failure occurred in C7, C8, C14, and C15, while the supplemental U-shaped bars of C9 and C16, which were installed with 576.4 MPa yield strength bars, ruptured at the bends between the horizontal segment and vertical segment.

Figure 10.
Failure modes of headed anchors in foundations with supplemental U-shaped bars.
In contrast to the foundations with supplemental tie bars, the shape of the failure surface of the foundation specimens with supplemental U-bars was extremely irregular. The cracks on the surface were butterfly-shaped, and the concrete within the embedment depth of the headed anchor was completely crushed under tensile loading. Part of the orthogonal surface reinforcement of the specimen was exposed, and both U-shaped bars closest to the headed anchor experienced severe bending deformation or even ruptured. After the measurements, the average failure surface diameters were 403.00 mm (2.69 hef) for C7~C9 and 449.67 mm (2.25 hef) for C14~C16, both of which are slightly less than 3 hef assumed by ACI 318-19 [16] and EN 1992-4:2018 [17].
Figure 11 shows the load-displacement curves of headed anchors in foundations with supplemental U-shaped bars. As can be seen from the curves, the installation of supplemental U-shaped bars significantly increases the ultimate capacity and displacement at peak load. The post-peak curves show that the specimens no longer have any residual capacity. Therefore, although the supplemental U-shaped bars improve the ductility of the specimen to a certain extent, they are still characterized by brittleness at failure. Contrary to the two types of foundation specimens mentioned above, the anchorage stiffness of the specimens with supplemental U-shaped bars is degraded progressively with load growth. The capacity of C16 is significantly higher than the other specimens with the same embedment depth. On the one hand, the rupture of supplementary reinforcement has several consequences. On the other hand, the vertical segments of the supplementary reinforcement constrained the concrete better, allowing the crushed concrete area to be completely limited to the orthogonal reinforcement spacing.
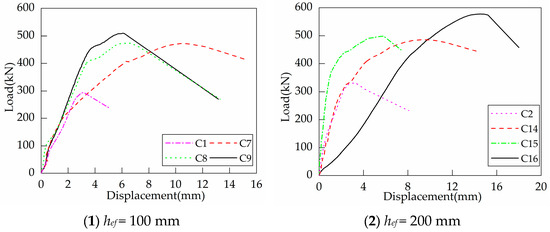
Figure 11.
Load-displacement curves of headed anchor in foundations with supplemental U-shaped bars.
3.4. Influence of Supplementary Reinforcement
Experimental results, such as concrete cube compressive strength on the day of testing fcu, peak load of the specimen Nt, displacement at peak load , the maximum diameter of the failure surface Df, and failure modes are summarized in Table 2.
Table 2.
Test results.
Although both supplemental tie bars and supplemental U-shaped bars can enhance the tensile breakout capacity, the effects of the two are different. Supplemental tie bars alter the cracking path of the concrete but rely only on anchorage to raise the capacity. On the contrary, supplemental U-shaped bars take full advantage of the yield strength and are able to carry tensile loads after the concrete has been withdrawn from work. As can be seen from the statistics in Table 2, compared with the foundation specimens without supplemental reinforcement, the ultimate capacity of the foundation specimens with supplemental tie bars was only 20% to 45% higher, while the ultimate capacity of the foundation specimens with supplemental U-shaped bars was 45% to 75% higher.
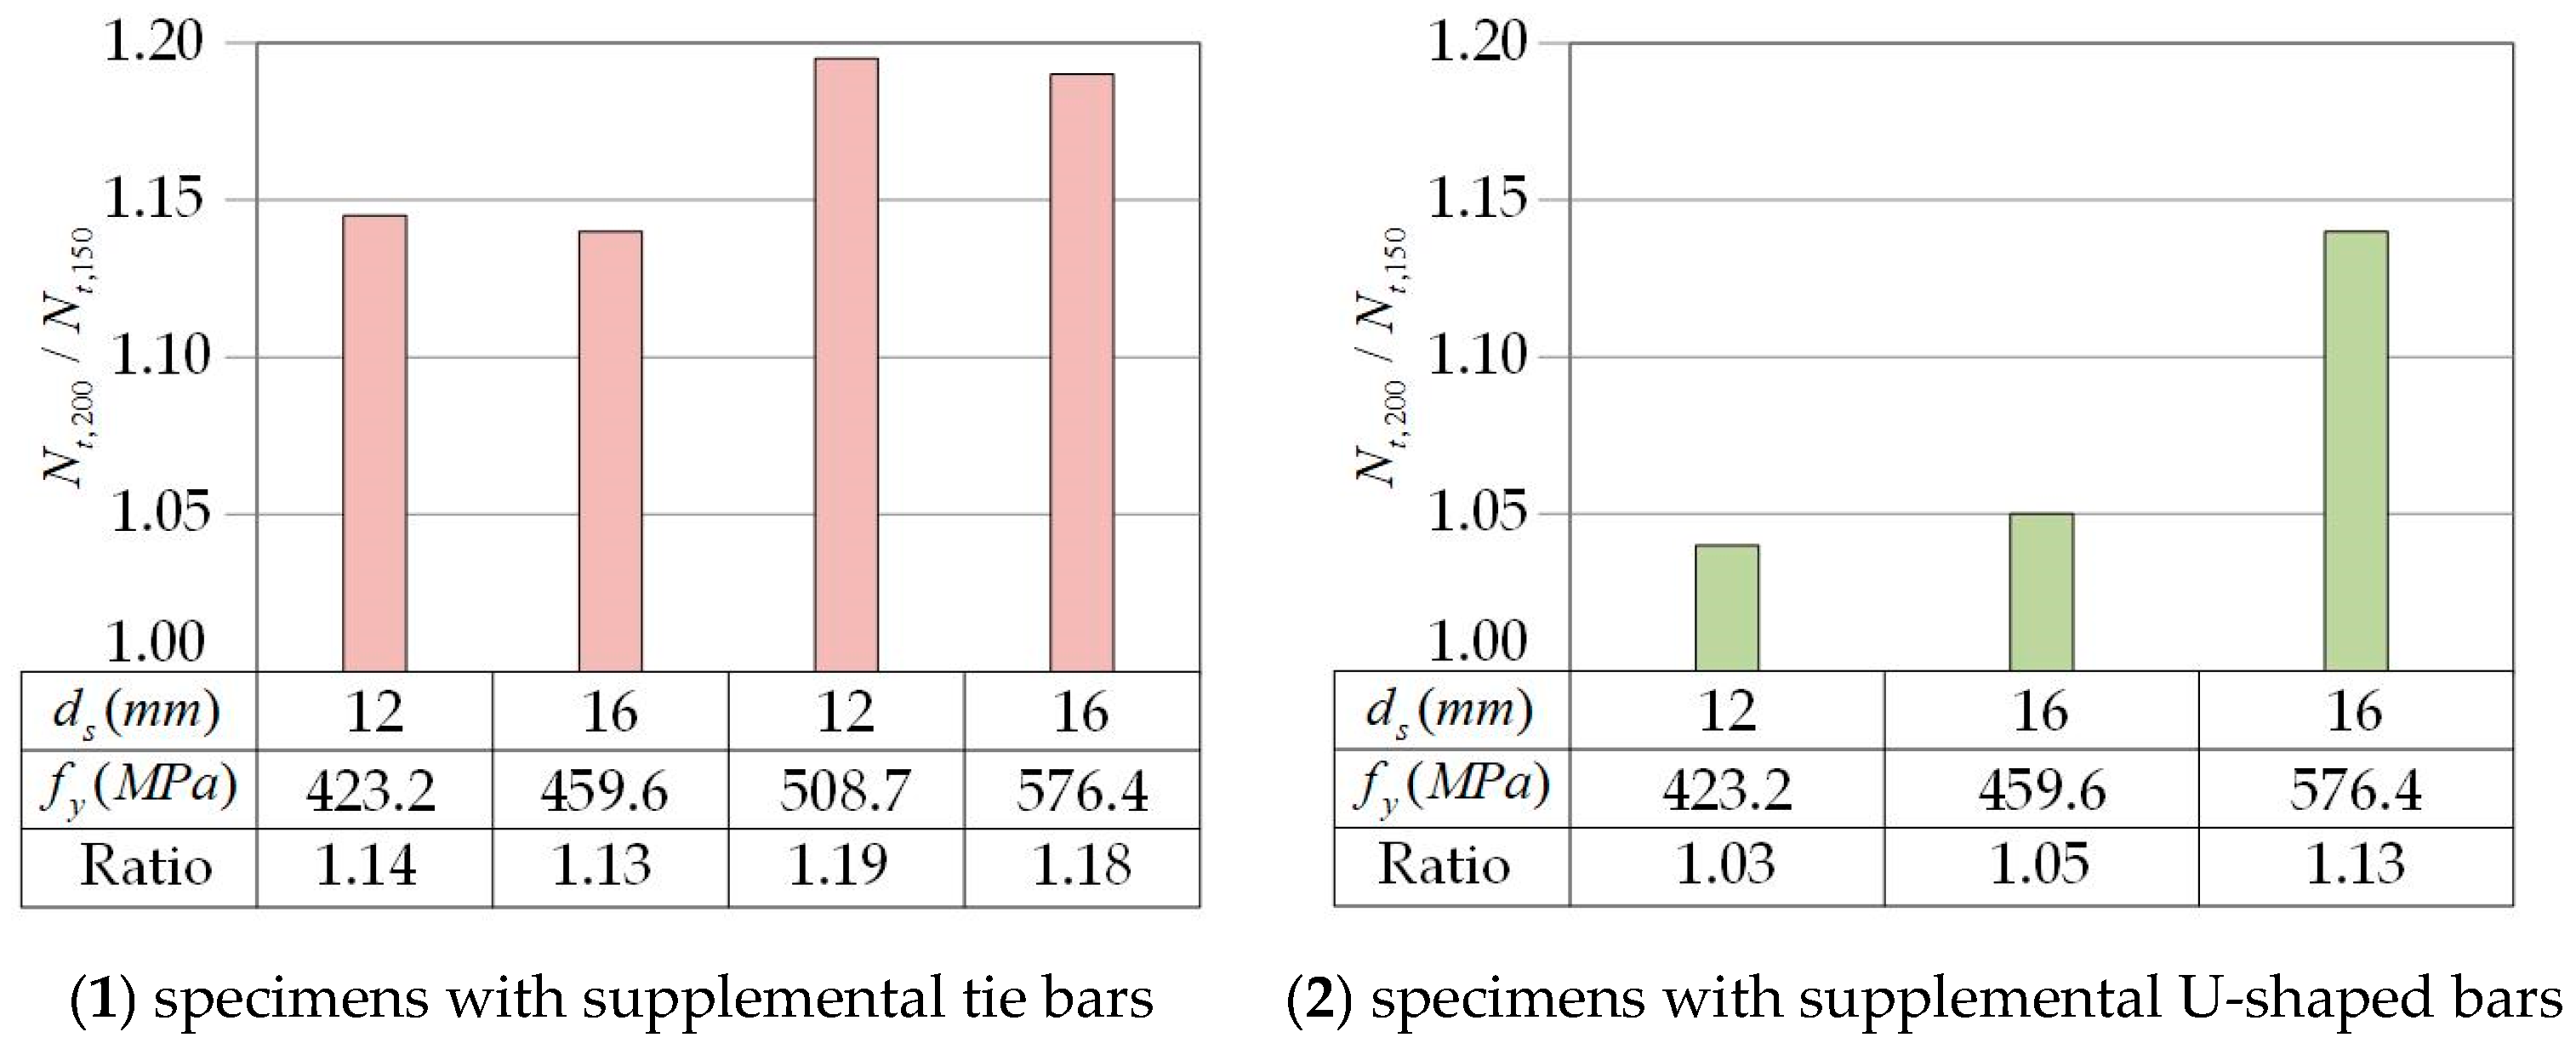
Embedment depth is an equally critical factor in the capacity of anchor bolts. The increase in the embedment depth of the anchor bolts results in an improvement in the ultimate capacity of the specimens with supplemental tie bars by 10% to 20% (Figure 12(1)). In contrast, among the specimens with supplemental U-bars, only the specimens with 576.4 MPa yield strength reinforcements show a 13% improvement in the ultimate capacity, while the remaining two groups are within 5% (Figure 12(2)). As a result, the tensile breakout capacity of the specimens with supplemental tie bars is more sensitive to changes in the embedment depth of the headed anchor.
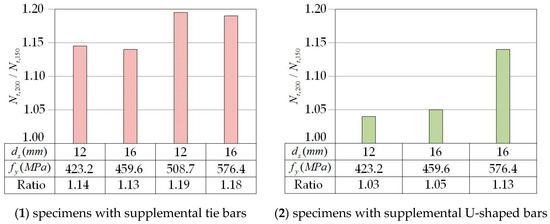
Figure 12.
Ratio of the ultimate load of specimens with 200 mm depth anchor bolts to that of specimens with 150 mm depth anchor bolts.
4. Presentation of the New Model
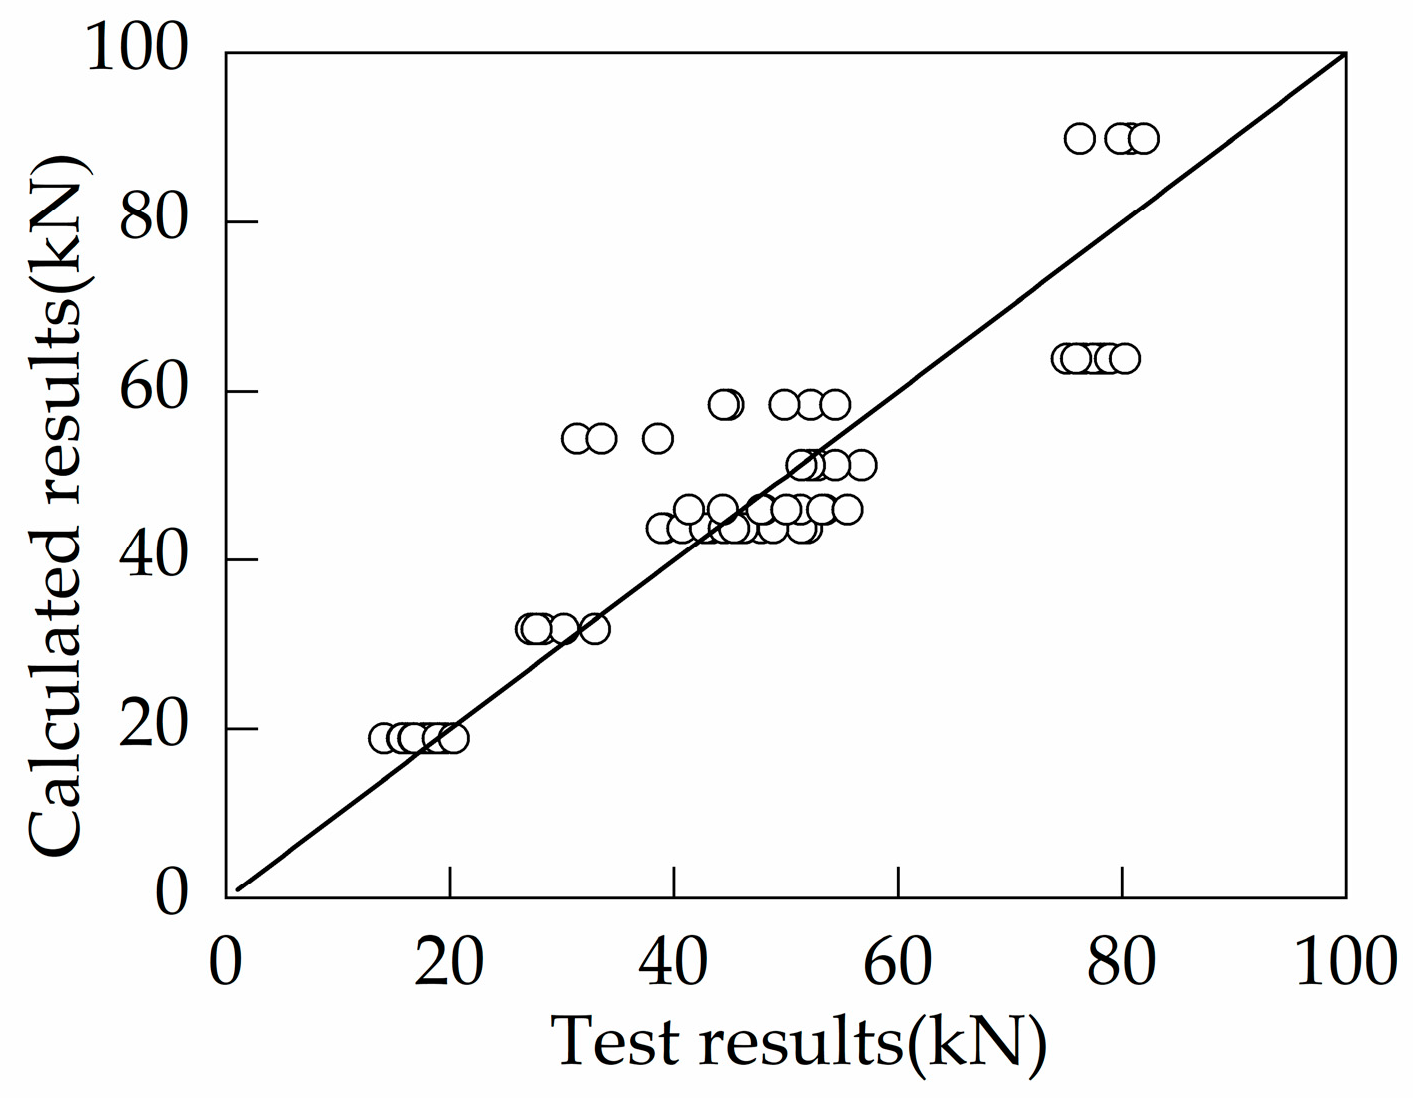
In this section, the data from 73 anchor failure tests in the literature [28,29,30,31] are utilized, and accordingly, regression analysis is performed to obtain a formula (Equation (1)) for the tensile breakout capacity of single-headed anchors embedded in plain concrete. Considering the presence of tensile stresses in the concrete on the failure surface under tensile loading, the exponent of the compressive strength was specified as 0.5 in the analysis. A comparison between the calculated values by Equation (1) and the test results is shown in Figure 13. The average, standard deviation, and coefficient of variation of the ratio of predicted values by Equation (1) to test results are 1.03, 0.18, and 0.17, respectively. In fact, the capacity calculated by Equation (1) for the foundation specimens without supplementary reinforcement in this study is underpredicted, which is due to the following reasons: (1) the diameter of the anchor head is much larger than the statistics utilized in the literature; (2) the specimens in this study are installed with surface reinforcement. Nilforoush [26] indicated that an increase in the diameter of the anchor head significantly improves the tensile breakout capacity, and the installation of surface reinforcement also brings a slight enhancement. However, these factors are not considered in the calculations to obtain more conservative results. In particular, the derivation of the following formulas for the tensile breakout capacity of headed anchor in foundations with supplemental tie bars and foundations with supplemental U-shaped bars are based on Equation (1).
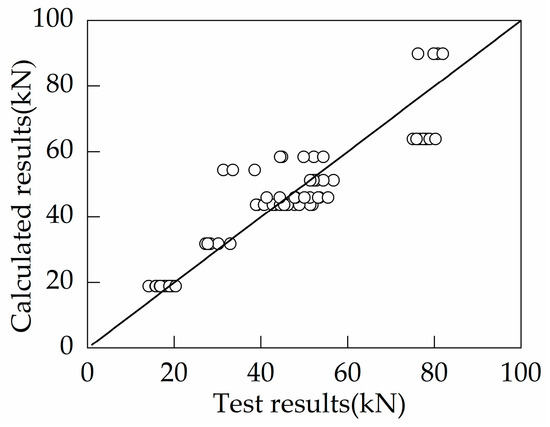
Figure 13.
Comparison of the calculated results and test results of anchor bolts in plain concrete failure in concrete cone failure.
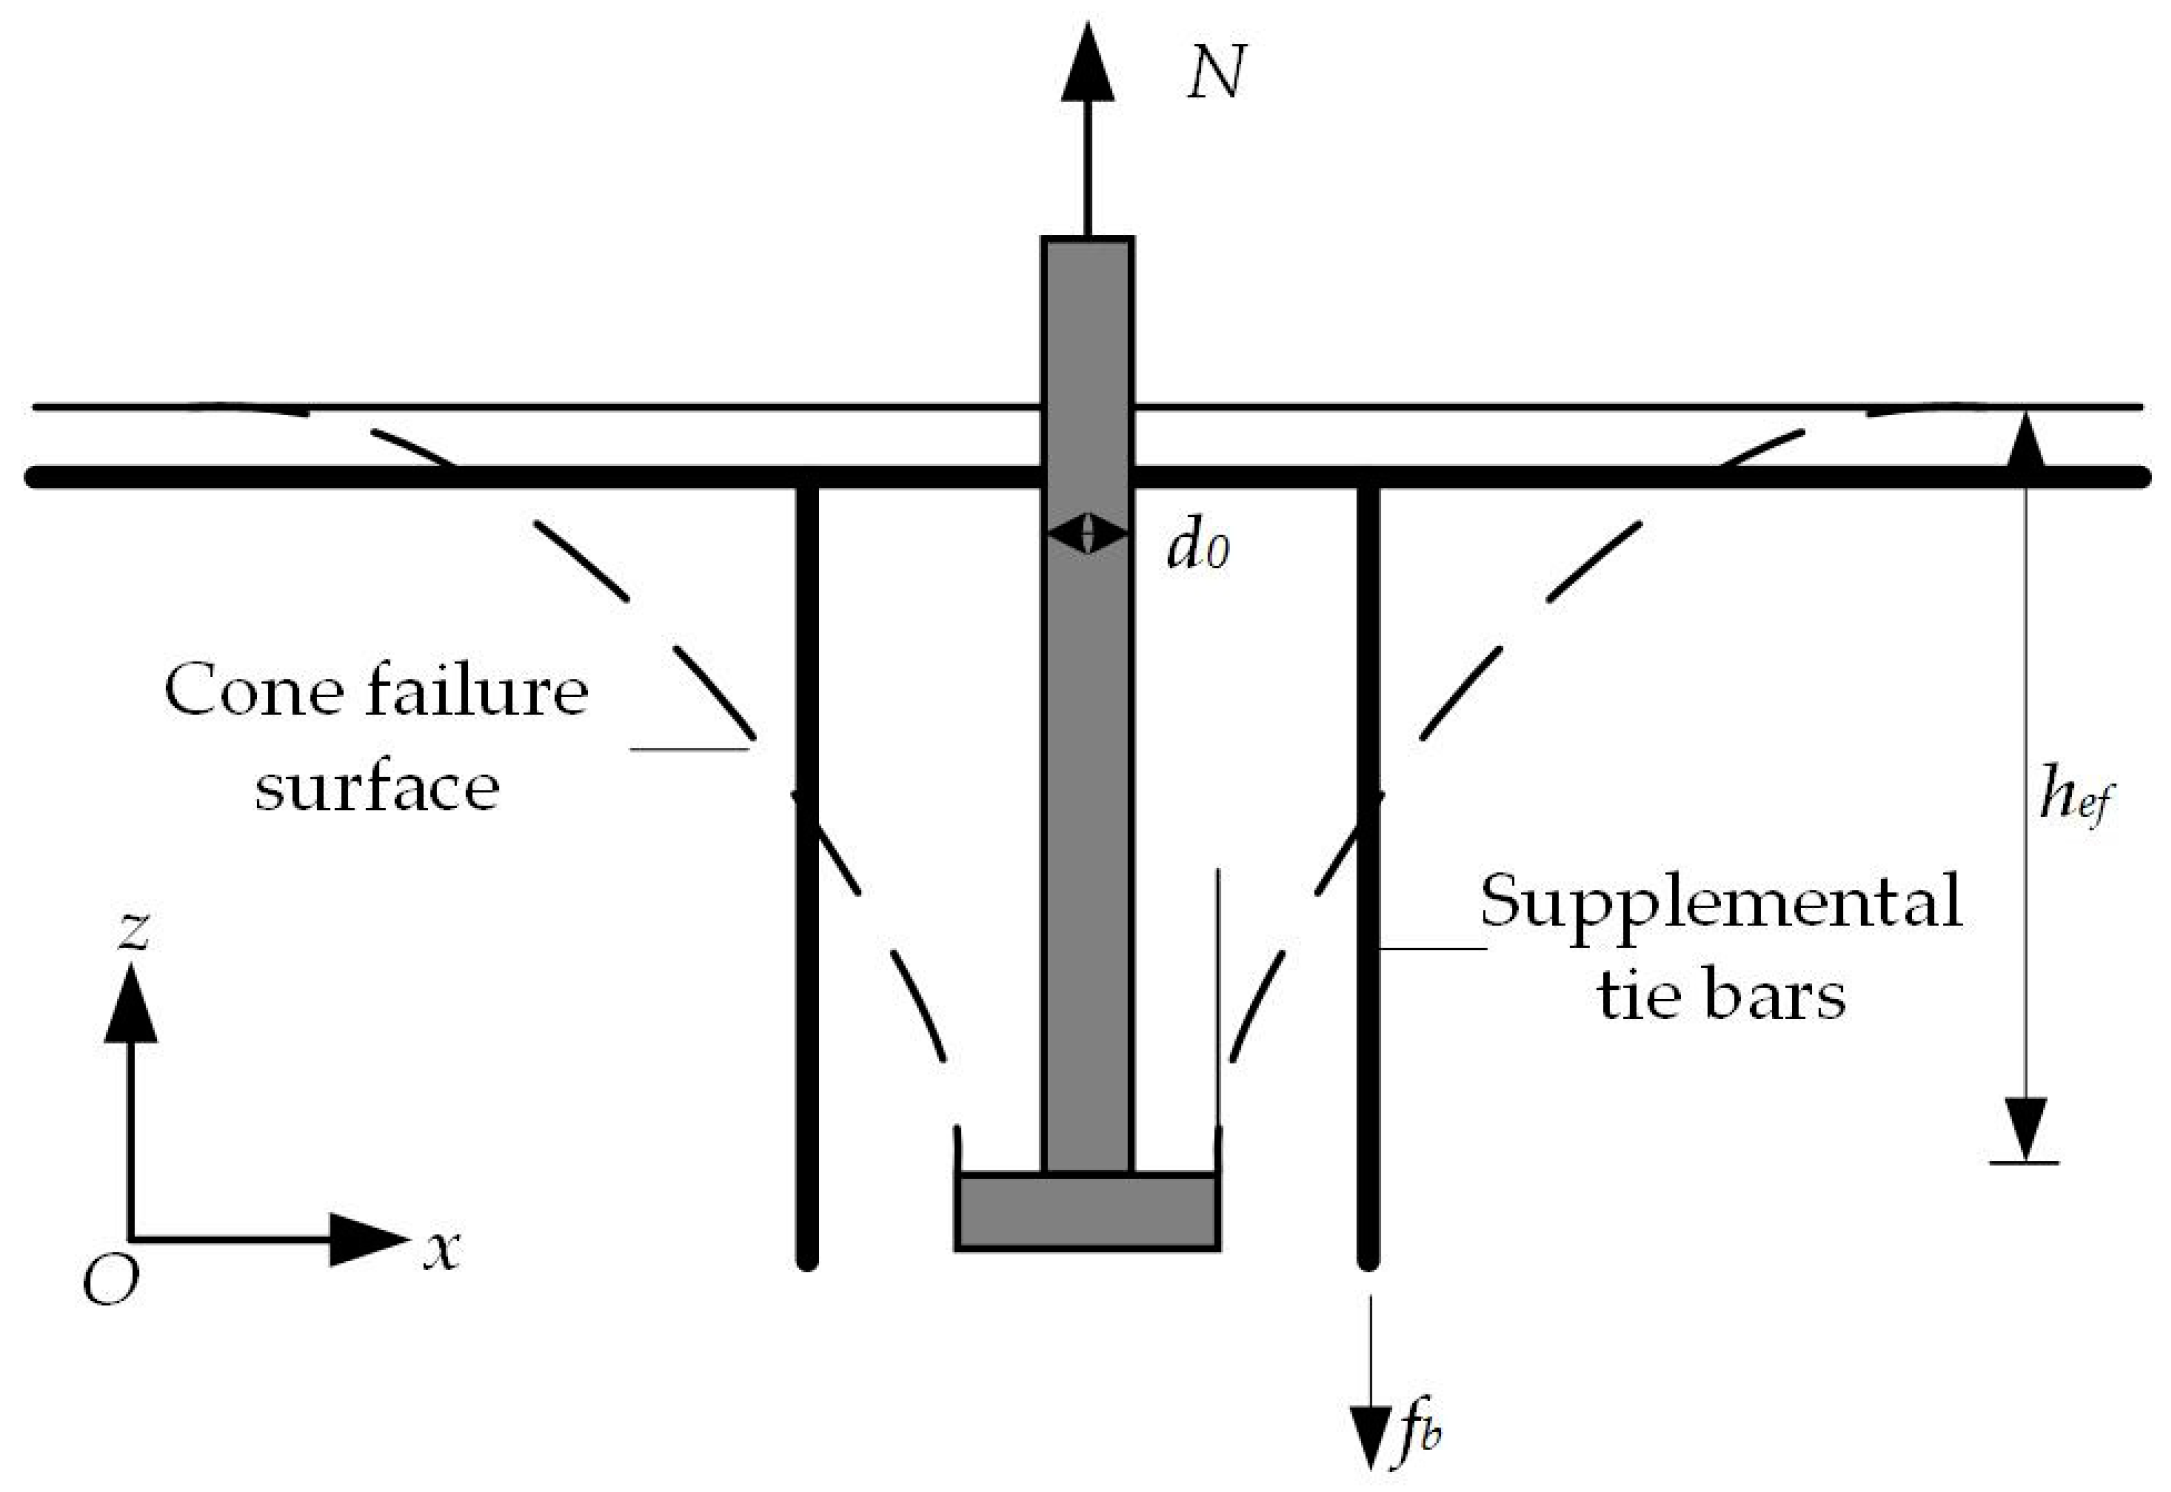
4.1. Model for Headed Anchors in Foundations with Supplemental Tie Bars
A schematic diagram of the failure cone surface of a headed anchor in foundations with supplemental tie bars under tensile loading is shown in Figure 14. Based on the test results in Section III, the installation of supplemental tie bars does not change the failure mode and only increases the tensile breakout capacity. Table 3 investigates the test results Nt of each specimen, the yield force of the supplemental tie bars Asfy, and the predictions Nco of Equation (1). The test results are intermediate between the predicted results of Equation (1) and the sum of the prediction of Equation (1) and the yield force of supplemental tie bars. Therefore, supplemental tie bars do not yield at failure but rely primarily on the bond with the concrete to provide resistance.
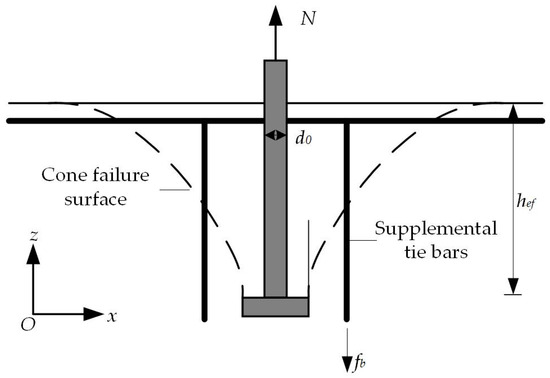
Figure 14.
Schematic diagram of failure cone surface of a headed anchor in foundations with supplemental tie bars.
Table 3.
Tensile breakout capacity of single-headed anchors in foundations with supplemental tie bars.
According to the above analysis, the tensile breakout capacity of single-headed anchors with supplemental tie bars consists of two components: the resistance provided by the concrete on the cone failure surface and the bond provided by the supplemental tie bars. Then, the formula can be expressed in the following form.
where k1 and k2 are empirical coefficients determined by tests.
Factor k1 considers the effect of the reduction in concrete resistance after supplemental reinforcement is installed; k2 is a reduction factor for the bond strength of the tie bars in the range of embedment depths. After regression analysis utilizing the test results, the expression for k1 and the value of k2 are as follows:
Substituting the value of Equation (3) into Equation (2), the following equation is obtained
The calculations of Equation (4) are listed in Table 3. Overall, the calculated results are in relative agreement with the test results.
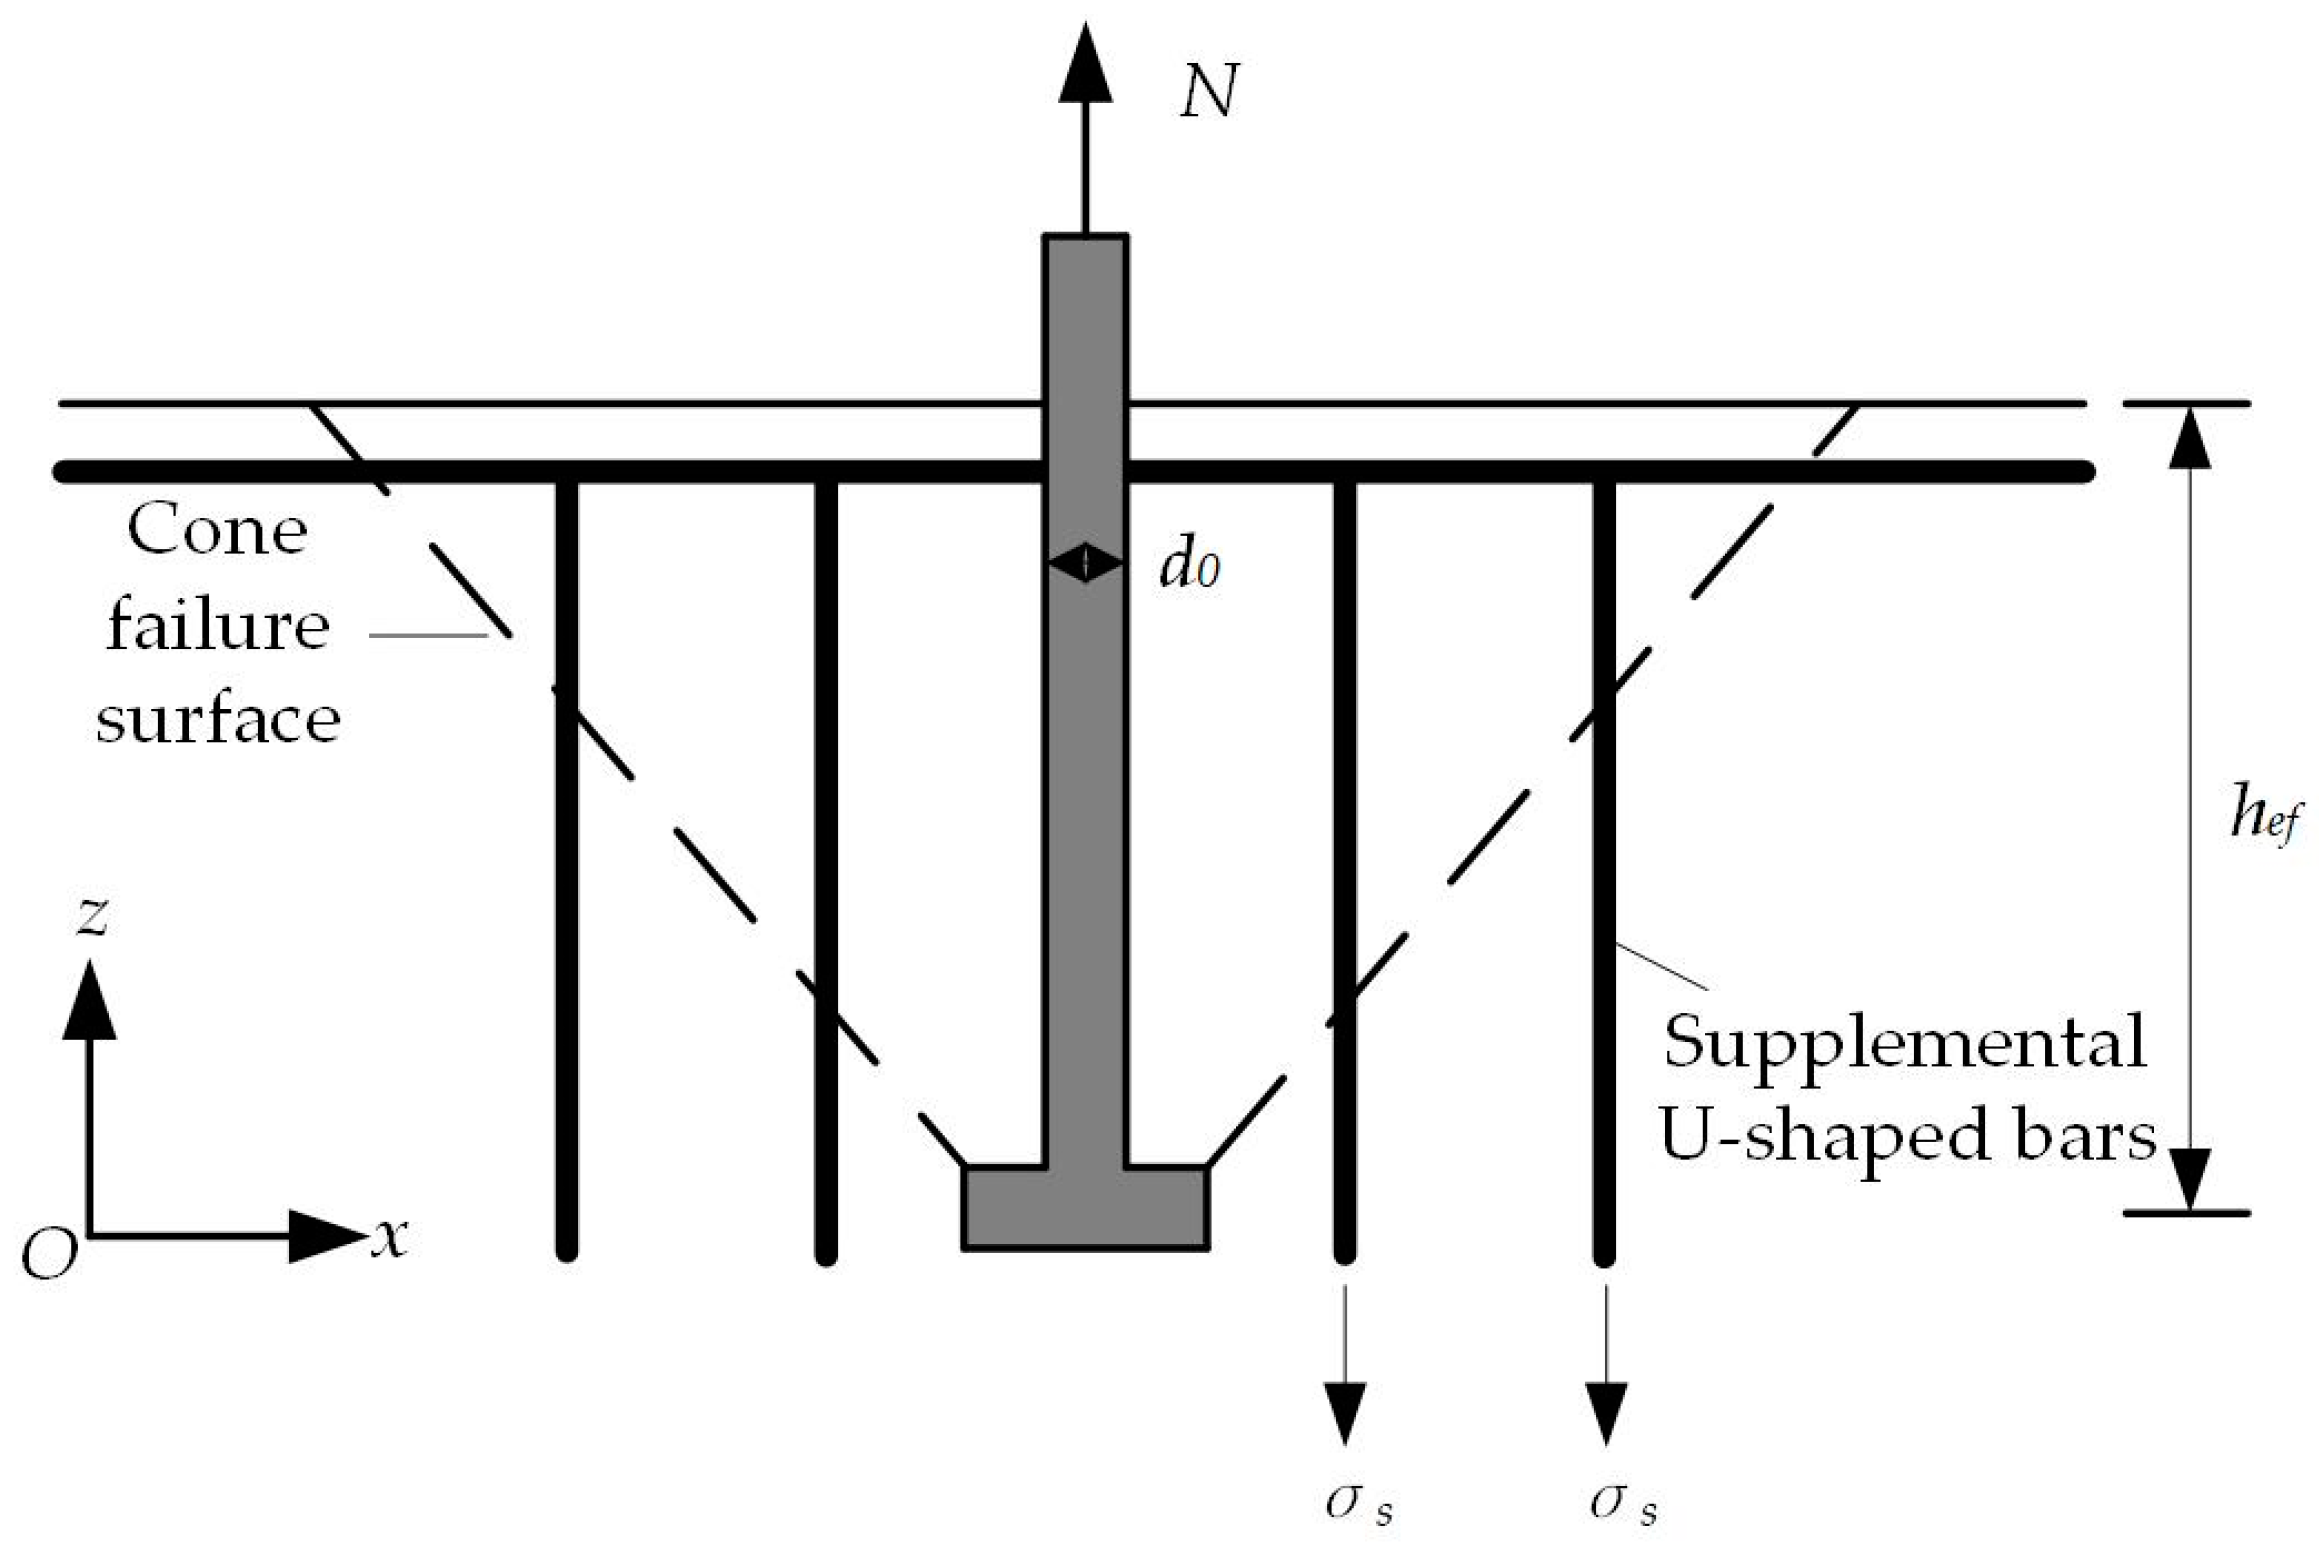
4.2. Model for Headed Anchors in Foundations with Supplemental U-Shaped Bars
Figure 15 shows the failure cone surface of a headed anchor in foundations with supplemental U-shaped bars. The vertical segments of U-shaped bars through the failure cone surface all provide resistance. Similarly, Table 4 presents the test results Nt of each specimen with supplemental U-shaped bars, the reinforcement yield force Asfy, and the calculated values Nco by Equation (1). The capacity of the specimens is significantly higher than the calculated results for Nco. The test results of C7, C8, C14, and C15 are greater than the sum of Asfy and Nco, whereas the test results of C9 and C16 are less than the sum of the two terms, but rupture of the steel shaft is achieved. Thus, the vertical segments of U-shaped bars also bear the tensile force through their own strength while maintaining a proper bond with the concrete. As the concrete gradually withdraws from the work, failure takes one of the following two forms: (1) concrete completely crushed and accompanied by supplementary reinforcement bending; (2) supplementary reinforcement rupture.

Figure 15.
Schematic diagram of failure cone surface of a headed anchor in foundations with supplemental U-shaped bars.
Table 4.
Tensile breakout capacities of single-headed anchors in foundations with supplemental U-shaped bars.
Equally, the tensile breakout capacity of a headed anchor can be described as two components: resistance provided by concrete and yield force of reinforcement. When the U-shaped bars do not break, the formula for calculating capacity can be described in the following form. Specifically, the resistance provided by the reinforcement is based on the area of the reinforcement that passes through the failure cone surface.
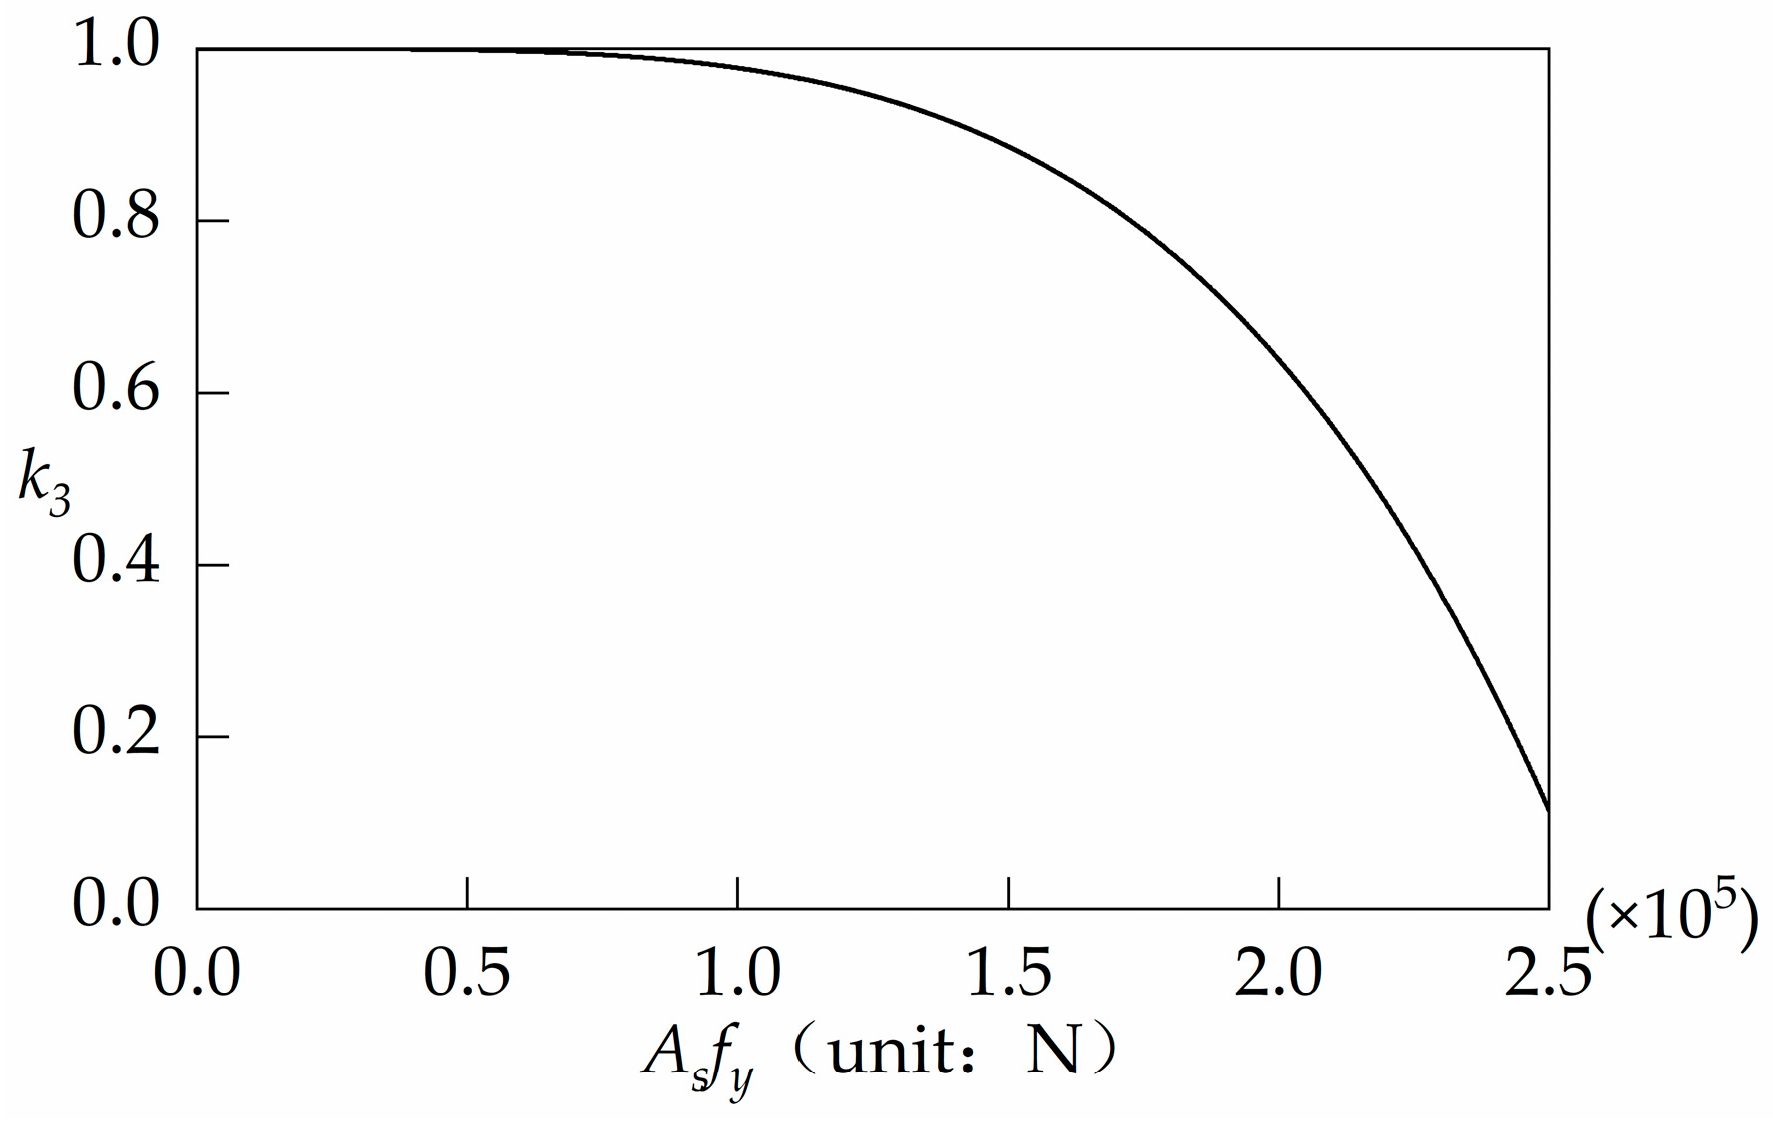
where k3 is the empirical coefficients determined by tests.
Factor k3 considers the reduction of the concrete resistance of the steel reinforcement in sharing the tensile loads. In analyzing the relationship between k3 and Asfy, only the test results of C7, C8, C14, and C15 are used.
where the unit of Asfy is taken as N
Replacing k3 in Equation (5) with Equation (6) yields the following equation
The increase in reinforcement resistance leads to a gradual decrease in the contribution of concrete to the resistance. The curve of and is shown in Figure 16. In addition, the results of the calculation of Equation (7) are listed in Table 4.
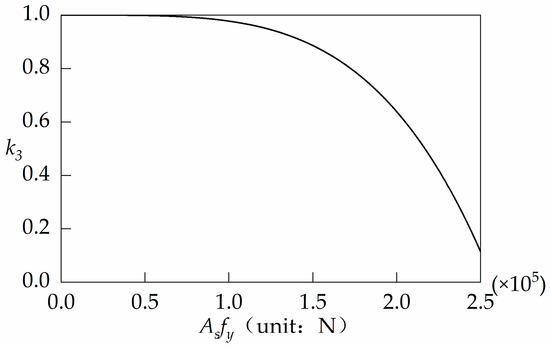
Figure 16.
Relationship of k3 and AsAf.
4.3. Comparison with EN 1992-4:2018
The formulas for calculating the tensile breakout capacity of a single-headed anchor with supplementary reinforcement proposed in this study take both the resistance provided by the reinforcement and the resistance provided by the concrete into account. On the other hand, EN 1992-4:2018 includes a strut–tie model that can be referenced. The model assumes that concrete and steel are regarded as strut and tie, respectively. The resistance of supplementary reinforcement yielded can be calculated by Equation (8), while in the case of the bonding failure in concrete, the resistance is calculated by Equations (9) and (10).
where NRk,re means the yield resistance of supplementary reinforcement (kN); NRd,a means the resistance of supplementary reinforcement associated with anchorage failure (kN); and α1, α2 are influencing factors according to EN 1992-1-1: 2004 [32].
Table 5 lists the ratio of the predicted values of the strut–tie model to the test results and the ratio of calculated values of Equation (4) or Equation (7) to the test results . Since the failure loads for C9 and C16 are not used in the regression analysis for , the average and coefficient of variation of are calculated without the failure load of both. Concerning the failure loads for specimens with supplemental tie bars and specimens with supplemental U-shaped bars, EN 1992-4:2018 underestimates them by 33% and 66%, respectively. In particular, the coefficient of variation of exceeds 0.2 in the calculation of the failure load of specimens with supplemental tie bars, indicating a high degree of dispersion in the calculation results of EN 1992-4: 2018. Therefore, it is necessary to introduce a modified concrete resistance term for the calculation of the tensile breakout capacity.
Table 5.
Comparison of the results of the formula proposed in this research with the results of the formula designed by EN 1992-4:2018.
Although the formulas proposed in this study can predict the bearing capacity of anchors with large heads failing in tensile breakout relatively well, a factor of 0.5 is proposed to be applied to Equations (4) and (7) to ensure that there is a sufficient safety reserve in the bearing capacity of the members in practical engineering applications.
5. Conclusions
In this study, the effect of supplemental tie bars and supplemental U-shaped bars on the tensile breakout of single-headed anchors was evaluated by means of proposed static pull-out tests on 16 equipment foundations. After regression analysis of the tensile breakout test data collected in the literature for anchor bolts in unreinforced concrete and the test results in this study, the failure mechanism of headed anchors with supplementary reinforcement was elucidated, and a new model for calculating the tensile breakout capacity of single-headed anchors in RC members with supplemental tie bars or U-shaped bars was proposed. Furthermore, the failure loads were compared with the predictions by the strut–tie model in EN 1992-4:2018. The main conclusions are as follows:
(1) The installation of supplemental tie bars alters the cracking path of the concrete by restraining the concrete within the area of the reinforcement where the headed anchor is located, effectively reducing the failure surface area. With the installation of supplemental tie bars, the tensile breakout capacity of single-headed anchors in RC foundations increases by 25% to 45%. Moreover, an increase in the embedment depth of headed anchors can similarly lead to a small improvement in tensile breakout capacity. However, supplementary tie bars do not fully utilize their own yield strength, relying primarily on the bond with the concrete to provide resistance, and there is little enhancement in anchorage ductility;
(2) As the horizontal part of the U-shaped reinforcement ensures the bond with the concrete, the vertical part can continue to bear the tensile force by its own strength after the concrete withdraws from the work, thus improving the tensile breakout capacity and the anchorage ductility. With the installation of supplemental U-shaped bars, the tensile breakout capacity of single-headed anchors in RC foundations increases by 45% to 75%. In particular, the embedment depth is no longer a critical factor, and its increase can only slightly improve the tensile breakout capacity. Although U-shaped bars enable the strength to be fully utilized, steel with high yield strength is not installed as far as possible in practical engineering applications;
(3) Test results reveal that the strut–tie model in EN 1992-4:2018 significantly underestimates the tensile breakout capacity of a headed anchor. In this study, a reduction factor is introduced to the resistance term of concrete for each of the supplemental reinforcement forms. A new model for calculating the tensile breakout capacity of a headed anchor that includes both the concrete resistance and the reinforcement resistance is proposed.
This study only executed pull-out tests on single-headed anchors, which turned out to be limiting. In fact, anchor groups are also applied in the project to resist external loads. More research needs to be presented on the calculation of the tensile breakout capacity of anchor groups.
Author Contributions
Y.X.: Writing—original draft, visualization, review and editing, methodology; Experimental investigation. C.C. and M.X.: Funding acquisition, supervision, methodology; J.G.: Data curation; All authors have read and agreed to the published version of the manuscript.
Funding
This work was supported by China Nuclear Power Engineering Co., Ltd. Project: Research on bearing capacity of nuclear power plant equipment foundation. Beijing. China (Grant NO. KY22156).
Data Availability Statement
All data generated or analyzed during this study are included in this published article.
Conflicts of Interest
Author Chaoqun Chen and Minglei Xie were employed by the company China Nuclear Power Engineering Co., Ltd. The remaining authors declare that the research was conducted in the absence of any commercial or financial relationships that could be construed as a potential conflict of interes
Nomenclature
| Area of supplementary reinforcement (mm2) | |
| Area of the i-th supplementary reinforcement (mm2) | |
| Reinforcement diameter (mm) | |
| Design bond strength according to EN 1992-1: 2004 | |
| Uniaxial compressive strength of concrete (cylinder) calculated by 0.8 (MPa) | |
| Concrete compressive strength measured on cubes with a side length of 150 mm at the time of the test (MPa) | |
| Yield strength of supplementary reinforcement (MPa) | |
| The anchorage length in the break-out body (mm) | |
| Embedment depth (mm) | |
| Number of supplemental reinforcement | |
| Capacity calculated by EN 1992-4: 2018 | |
| Ultimate load of reinforced foundation tensile breakout failure in tension (kN) | |
| Ultimate capacity of specimens with embedment depth of 150 mm (kN) | |
| Ultimate capacity of specimens with embedment depth of 200 mm (kN) | |
| Stress of reinforcement (MPa) | |
| Displacement at peak load (mm) | |
| Displacement at peak load of headed anchor with 150 mm embedment depth (mm) | |
| Displacement at peak load of headed anchor with 150 mm embedment depth (mm) |
References
- Li, X.; Gong, J. Probabilistic evaluation of the leak-tightness function of the nuclear containment structure subjected to internal pressure. Reliab. Eng. Syst. Saf. 2024, 241, 109684. [Google Scholar] [CrossRef]
- Li, X.; Wu, X.; Gong, J. Failure behavior and probabilistic safety assessment of containment structure under internal pressure considering time-varying prestress loss. Eng. Struct. 2024, 319, 118884. [Google Scholar] [CrossRef]
- ACI Committee 349; ACI 349-13: Code Requirements for Nuclear Safety-Related Concrete Structures and Commentary. American Concrete Institute: Farmington Hills, MI, USA, 2013.
- Karmokar, T.; Mohyeddin, A.; Lee, J.; Paraskeva, T. Concrete cone failure of single cast-in anchors under tensile loading–A literature review. Eng. Struct. 2021, 243, 112615. [Google Scholar] [CrossRef]
- Di Nunzio, G.; Muciaccia, G. Cast-in-place fasteners under tensile loading: A critical review. Structures 2022, 41, 1532–1545. [Google Scholar] [CrossRef]
- Eligehausen, R.; Mallée, R.; Silva, J.F. Design of Fastenings, Anchorage in Concrete Construction; John Wiley & Sons: Hoboken, NJ, USA, 2013. [Google Scholar]
- Fib Bulletin 58: Design of Anchorages in Concrete; Federation Internationale Dubeton: Lausanne, Switzerland, 2011.
- PCI Design Handbook: Precast and Prestressed Concrete, 2nd ed.; Prestressed Concrete Institute: Chicago, IL, USA, 1978.
- ACI Committee 349; ACI 349-76: Code Requirements for Nuclear Safety Related Concrete Structures and Commentary. American Concrete Institute: Farmington Hills, MI, USA, 1976.
- Klingner, R.E.; Mendonca, J.A. Tensile capacity of short anchor bolts and welded studs: A literature review. J. Proc. 1982, 79, 270–279. [Google Scholar]
- Ballarini, R.; Shah, S.P.; Keer, L.M. Failure characteristics of short anchor bolts embedded in a brittle material. Proc. R. Soc. Lond. A Math. Phys. Sci. 1986, 404, 35–54. [Google Scholar]
- ACI Committee 349; ACI 349-85: Code Requirements for Nuclear Safety-Related Concrete Structures and Commentary. American Concrete Institute: Farmington Hills, MI, USA, 1985.
- Eligehausen, R.; Sawade, G. A fracture mechanics based description of the pull-out behavior of headed studs embedded in concrete. In Fracture Mechanics of Concrete Structures (From Theory to Applications); University of Stuttgart: Stuttgart, Germany, 1989; pp. 281–298. [Google Scholar]
- Bažant, Z.P. Size effect in blunt fracture: Concrete, rock, metal. J. Eng. Mech. 1984, 110, 518–535. [Google Scholar] [CrossRef]
- Fuchs, W.; Eligehausen, R.; Breen, J.E. Concrete capacity design (CCD) approach for fastening to concrete. Struct. J. 1995, 92, 73–94. [Google Scholar]
- ACI Committee 318; ACI 318-19: Building Code Requirements for Structural Concrete and Commentary. American Concrete Institute: Farmington Hills, MI, USA, 2019.
- EN 1992-4; Eurocode 2. Design of Concrete Structures. Design of Fastenings for Use in Concrete. European Commission: Brussels, Belgium, 2018.
- Solomos, G.; Berra, M. Testing of anchorages in concrete under dynamic tensile loading. Mater. Struct. 2006, 39, 695–706. [Google Scholar] [CrossRef]
- ACI Committee 349; ACI 349-01: Code Requirements for Nuclear Safety-Related Concrete Structures and Commentary. American Concrete Institute: Farmington Hills, MI, USA, 2001.
- Lee, N.H.; Kim, K.S.; Chang, J.B.; Park, K.R. Tensile-headed anchors with large diameter and deep embedment in concrete. ACI Struct. J. 2007, 104, 479. [Google Scholar]
- ACI Committee 318; ACI 318-05: Building Code Requirements for Structural Concrete and Commentary. American Concrete Institute: Farmington Hills, MI, USA, 2005.
- ACI Committee 349; ACI 349-97: Code Requirements for Nuclear Safety-Related Concrete Structures and Commentary. American Concrete Institute: Farmington Hills, MI, USA, 1997.
- Ferreira, M.; Pereira, F.M.; Lima, N.; Oliveira, M. Influence of the flexural and shear reinforcement in the concrete cone resistance of headed bars. Eng. Struct. 2021, 248, 113212. [Google Scholar] [CrossRef]
- Di Nunzio, G.; Muciaccia, G. Behavior and design of screwed-head fasteners in reinforced concrete in tension. Struct. Concr. 2021, 22, 894–910. [Google Scholar] [CrossRef]
- Petersen, D.; Lin, Z.; Zhao, J. Design of anchor reinforcement for seismic tension loads. Eng. Struct. 2018, 164, 109–118. [Google Scholar] [CrossRef]
- Nilforoush, R.; Nilsson, M.; Elfgren, L. Experimental evaluation of influence of member thickness, anchor-head size, and orthogonal surface reinforcement on the tensile capacity of headed anchors in uncracked concrete. J. Struct. Eng. 2018, 144, 04018012. [Google Scholar] [CrossRef]
- Rabi, M.; Cashell, K.A.; Shamass, R.; Desnerck, P. Bond behaviour of austenitic stainless steel reinforced concrete. Eng. Struct. 2020, 221, 111027. [Google Scholar] [CrossRef]
- Tóth, M.; Bokor, B.; Sharma, A. Anchorage in steel fiber reinforced concrete–concept, experimental evidence and design recommendations for concrete cone and concrete edge breakout failure modes. Eng. Struct. 2019, 181, 60–75. [Google Scholar] [CrossRef]
- Karmokar, T.; Mohyeddin, A.; Lee, J. Tensile behaviour of cast-in headed anchors in ambient-temperature cured geopolymer concrete. Eng. Struct. 2022, 266, 114643. [Google Scholar] [CrossRef]
- Li, F.; Gao, H.; Jiang, Y.; Wen, T.; Zhan, Y.; Chen, Z.; Shen, D. Tensile behavior of stud connectors in high strength concrete. Adv. Struct. Eng. 2021, 24, 3677–3690. [Google Scholar] [CrossRef]
- Shin, J.; Kim, J.H.; Chang, H.J. Anchor plate effect on the breakout capacity in tension for thin-walled concrete panels. Eng. Struct. 2016, 106, 147–153. [Google Scholar] [CrossRef]
- EN 1992-1-1:2004; Eurocode 2: Design of Concrete Structures–Part 1-1. General Rules and Rules for Buildings. European Commission: Brussels, Belgium, 2004.


Disclaimer/Publisher’s Note: The statements, opinions and data contained in all publications are solely those of the individual author(s) and contributor(s) and not of MDPI and/or the editor(s). MDPI and/or the editor(s) disclaim responsibility for any injury to people or property resulting from any ideas, methods, instructions or products referred to in the content. |
© 2024 by the authors. Licensee MDPI, Basel, Switzerland. This article is an open access article distributed under the terms and conditions of the Creative Commons Attribution (CC BY) license (https://creativecommons.org/licenses/by/4.0/).