
Experimental and Numerical Simulation Study on the Mechanical Properties of Integrated Sleeve Mortise and Tenon Steel–Wood Composite Joints


Abstract
:1. Introduction
2. Experimental Study
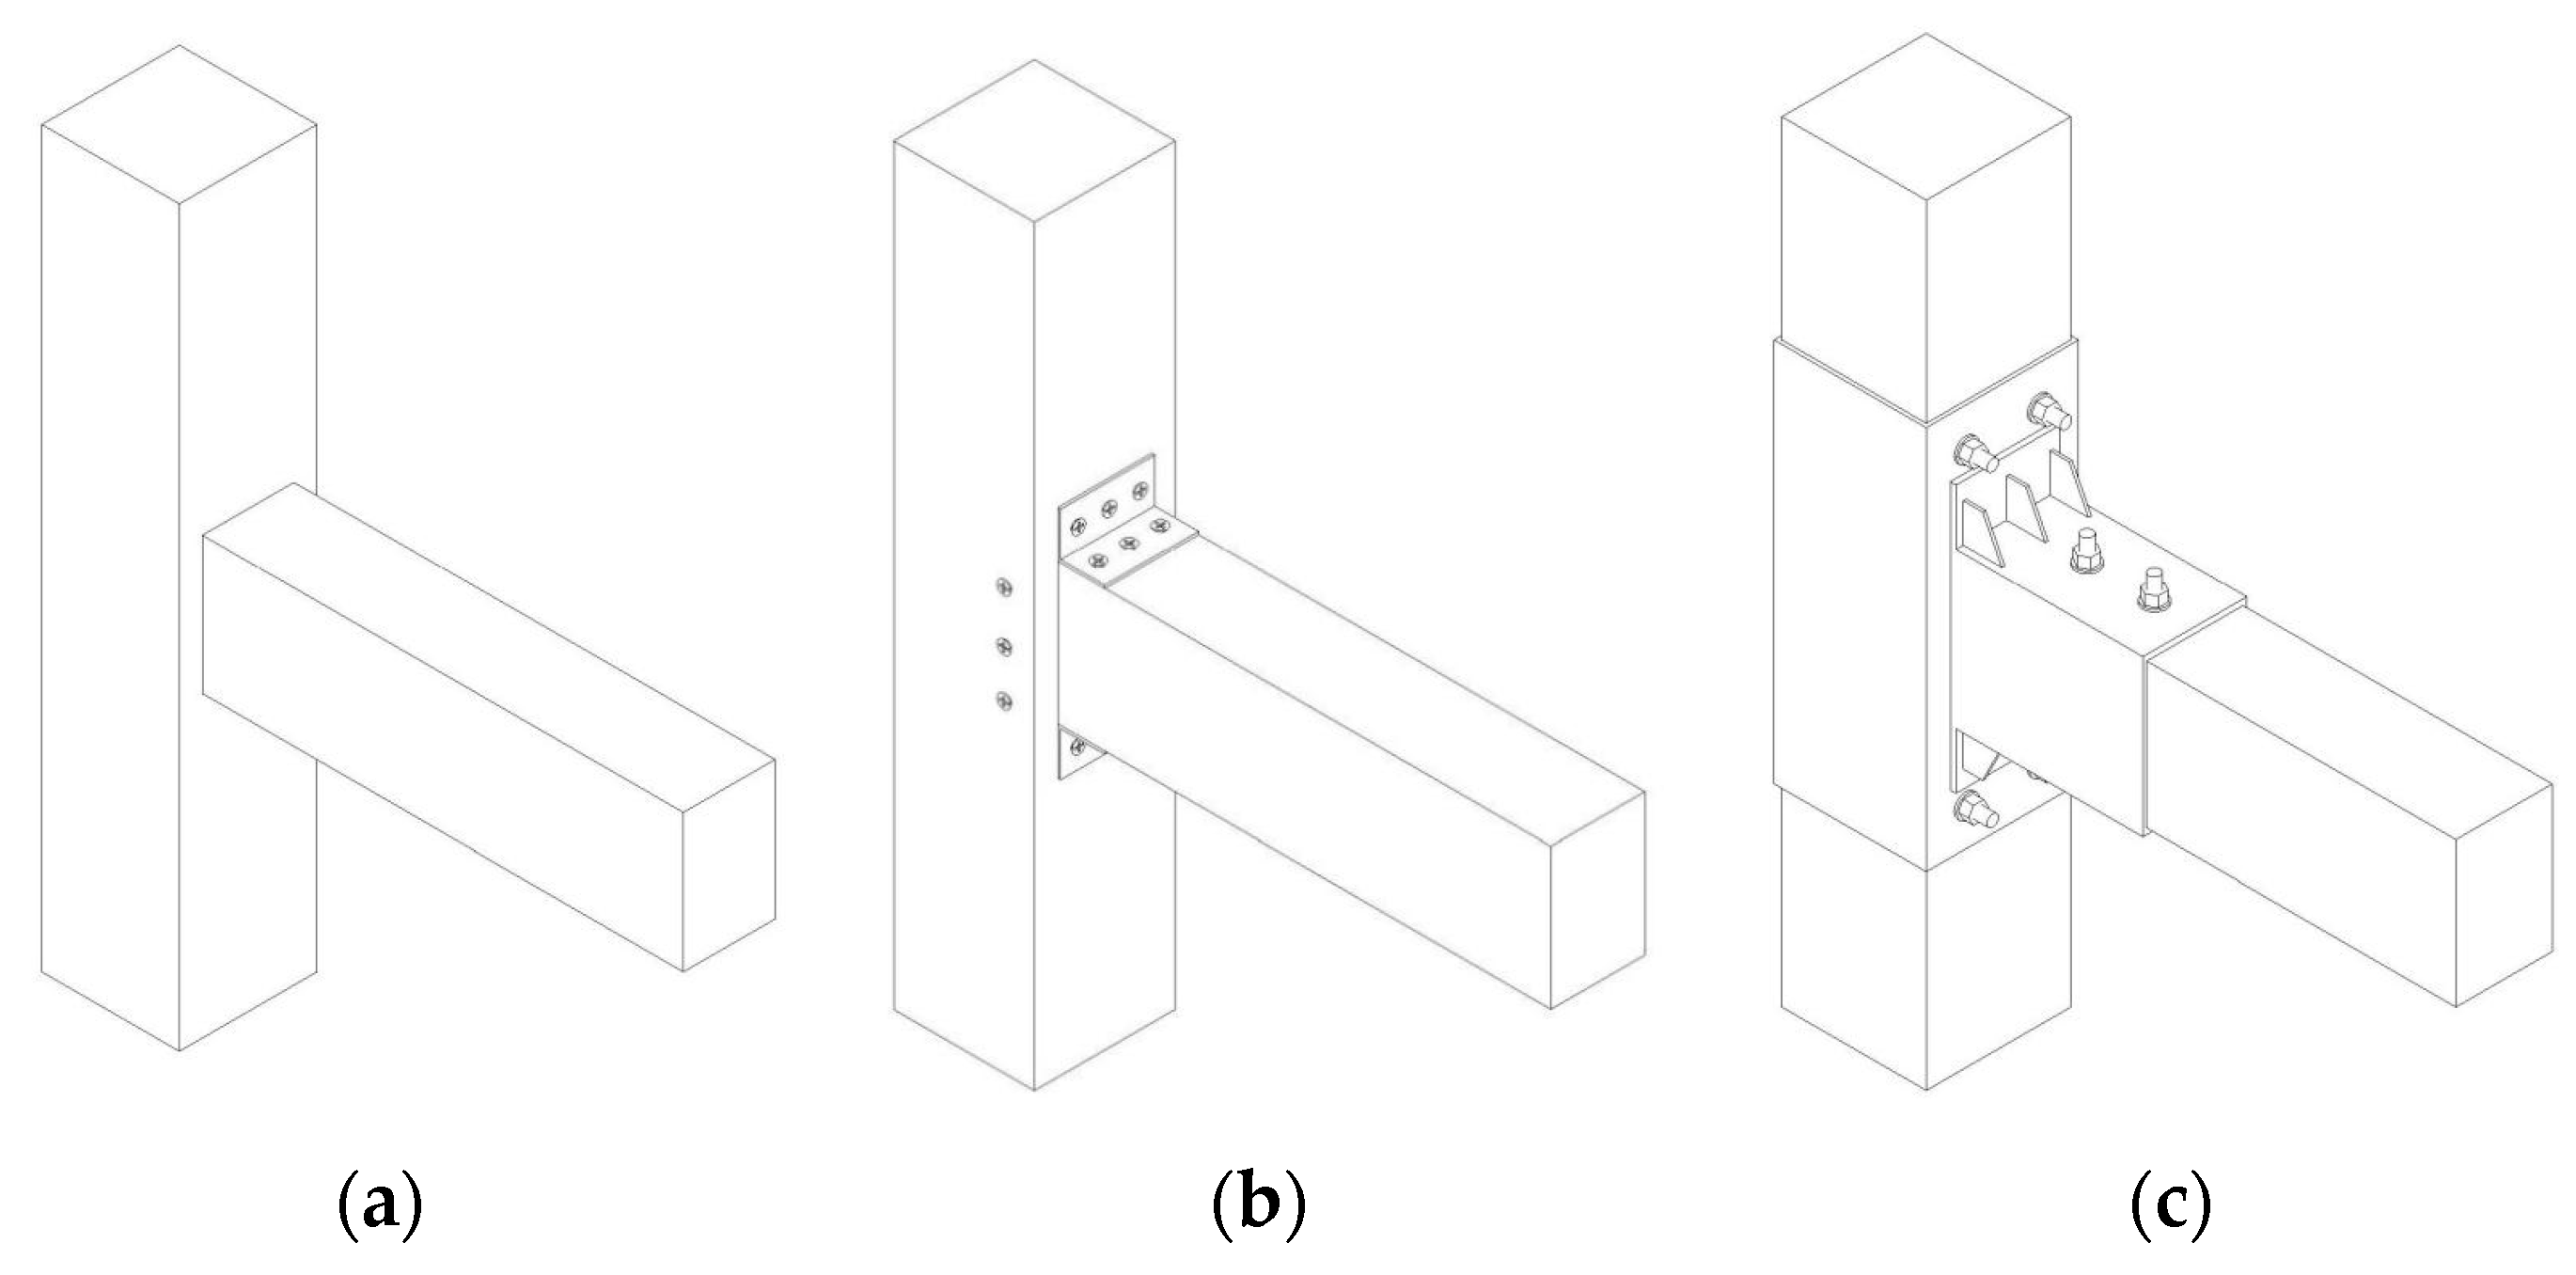
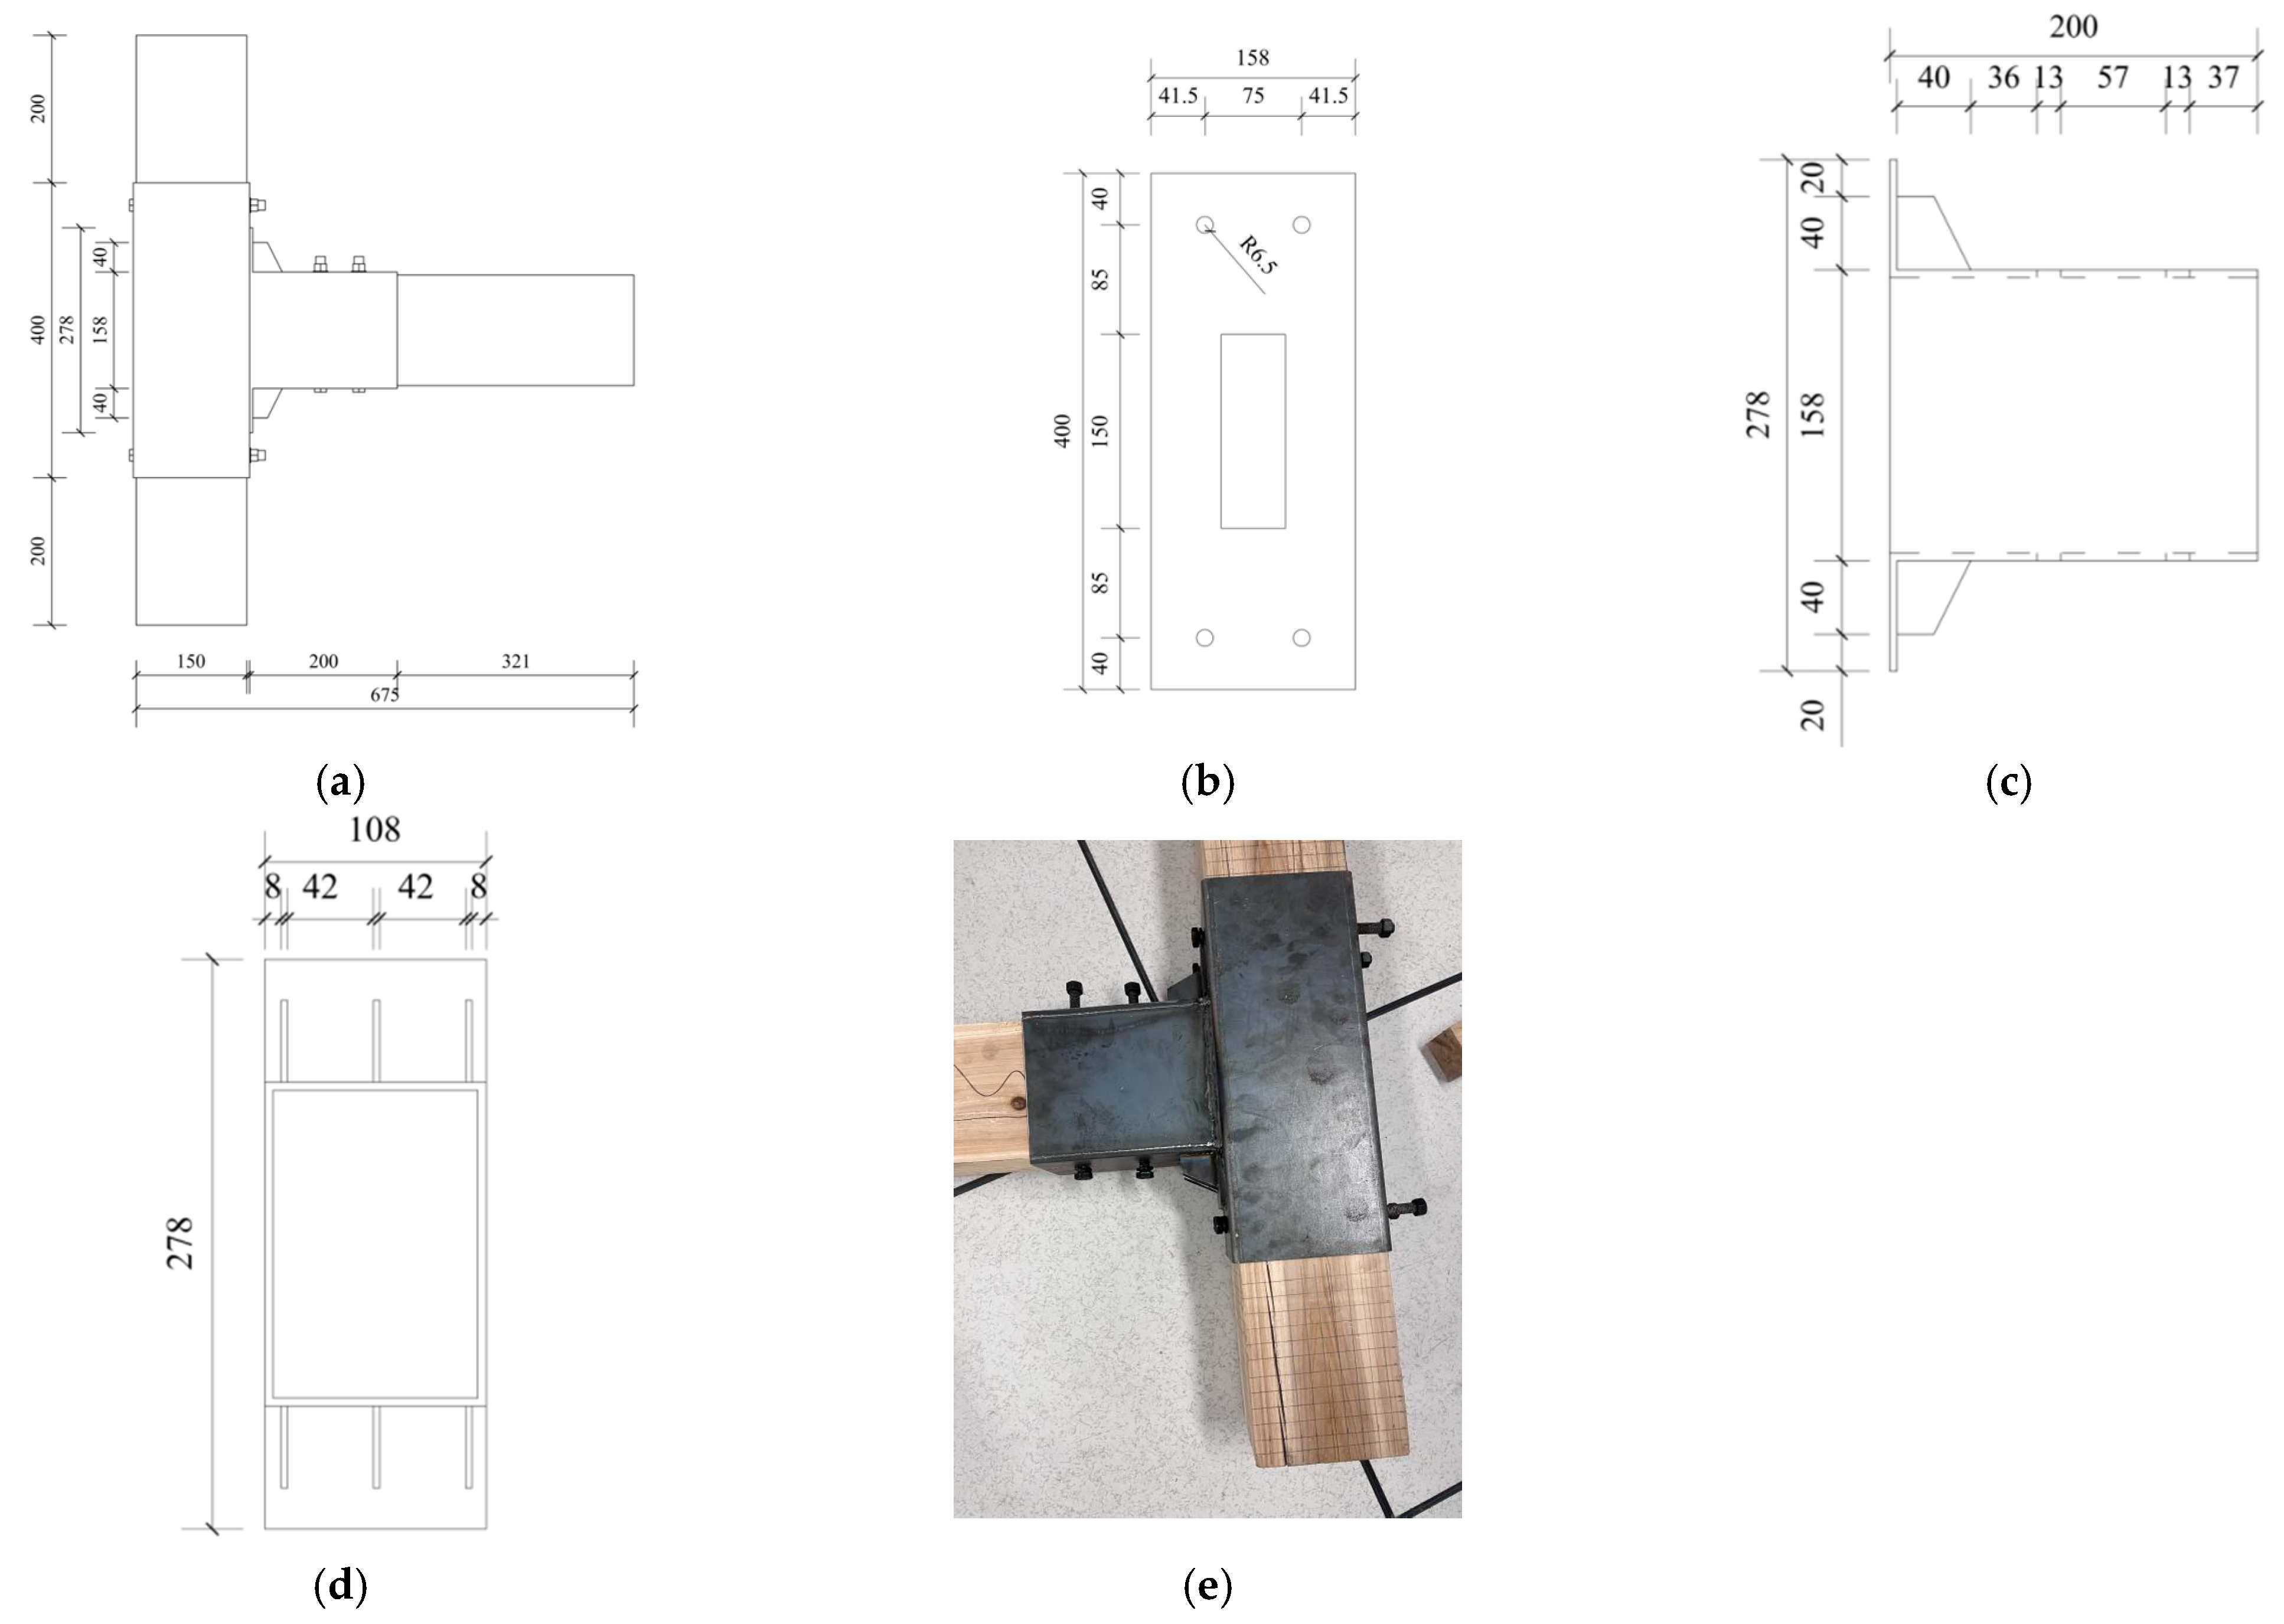
2.1. Specimen Design and Fabrication
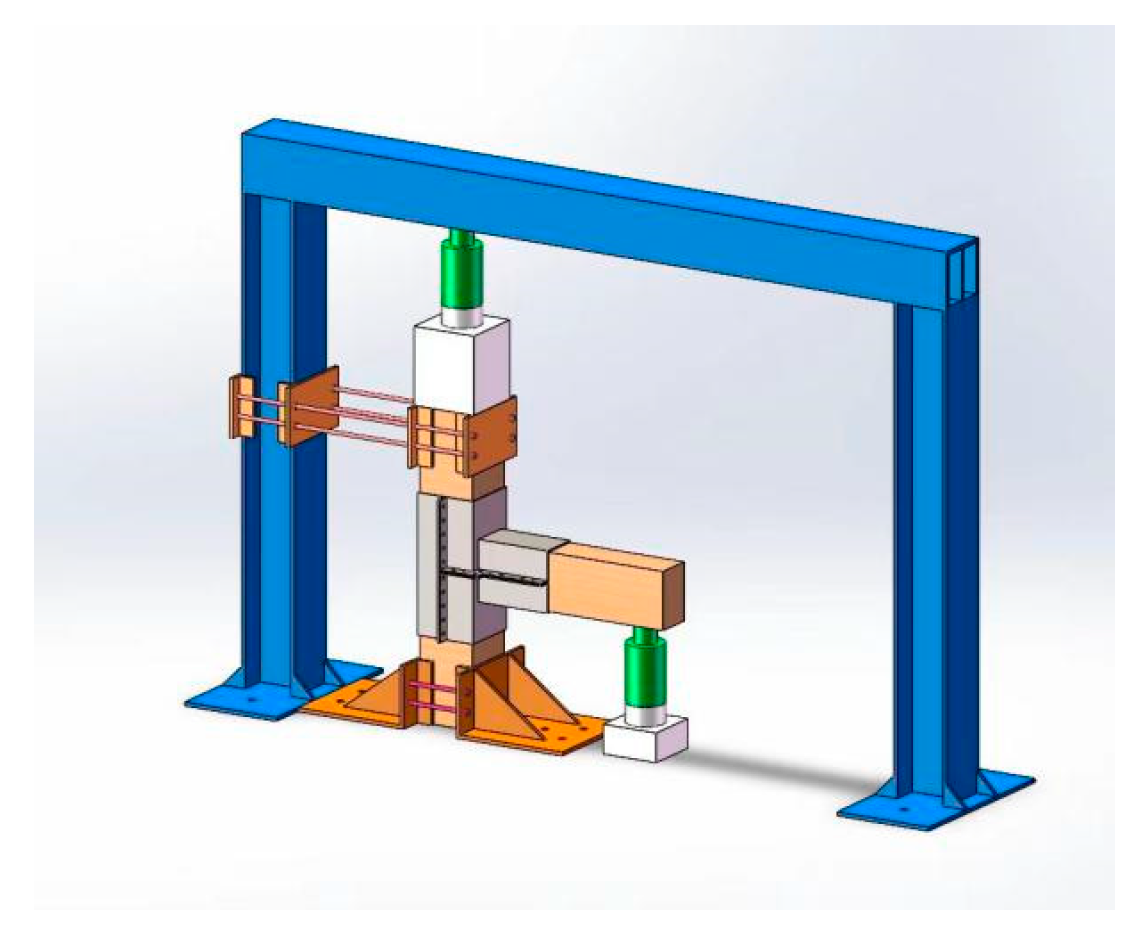
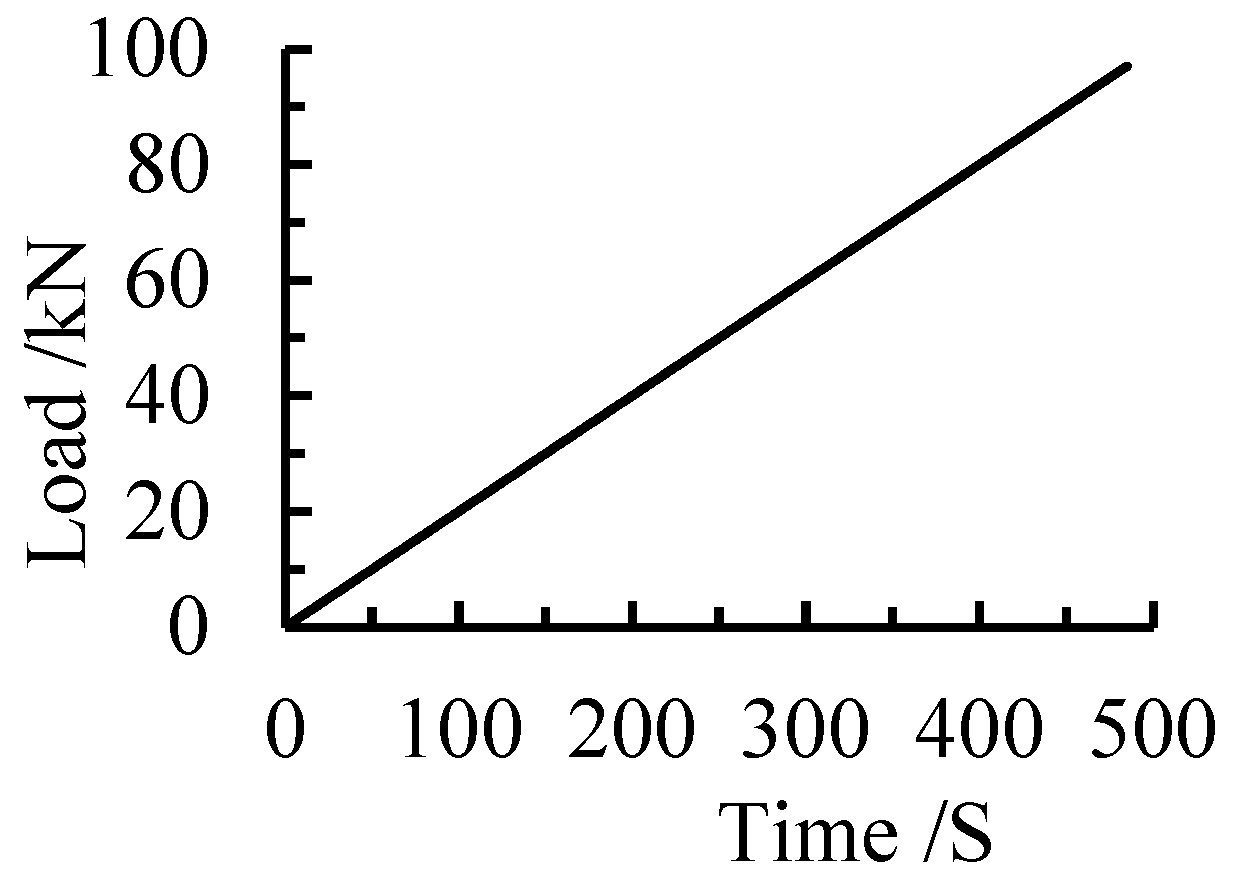
2.2. Test Loading
2.3. Measuring Point Arrangement and Measuring Point Content
3. Experimental Result Analysis
3.1. Joint Failure Phenomenon
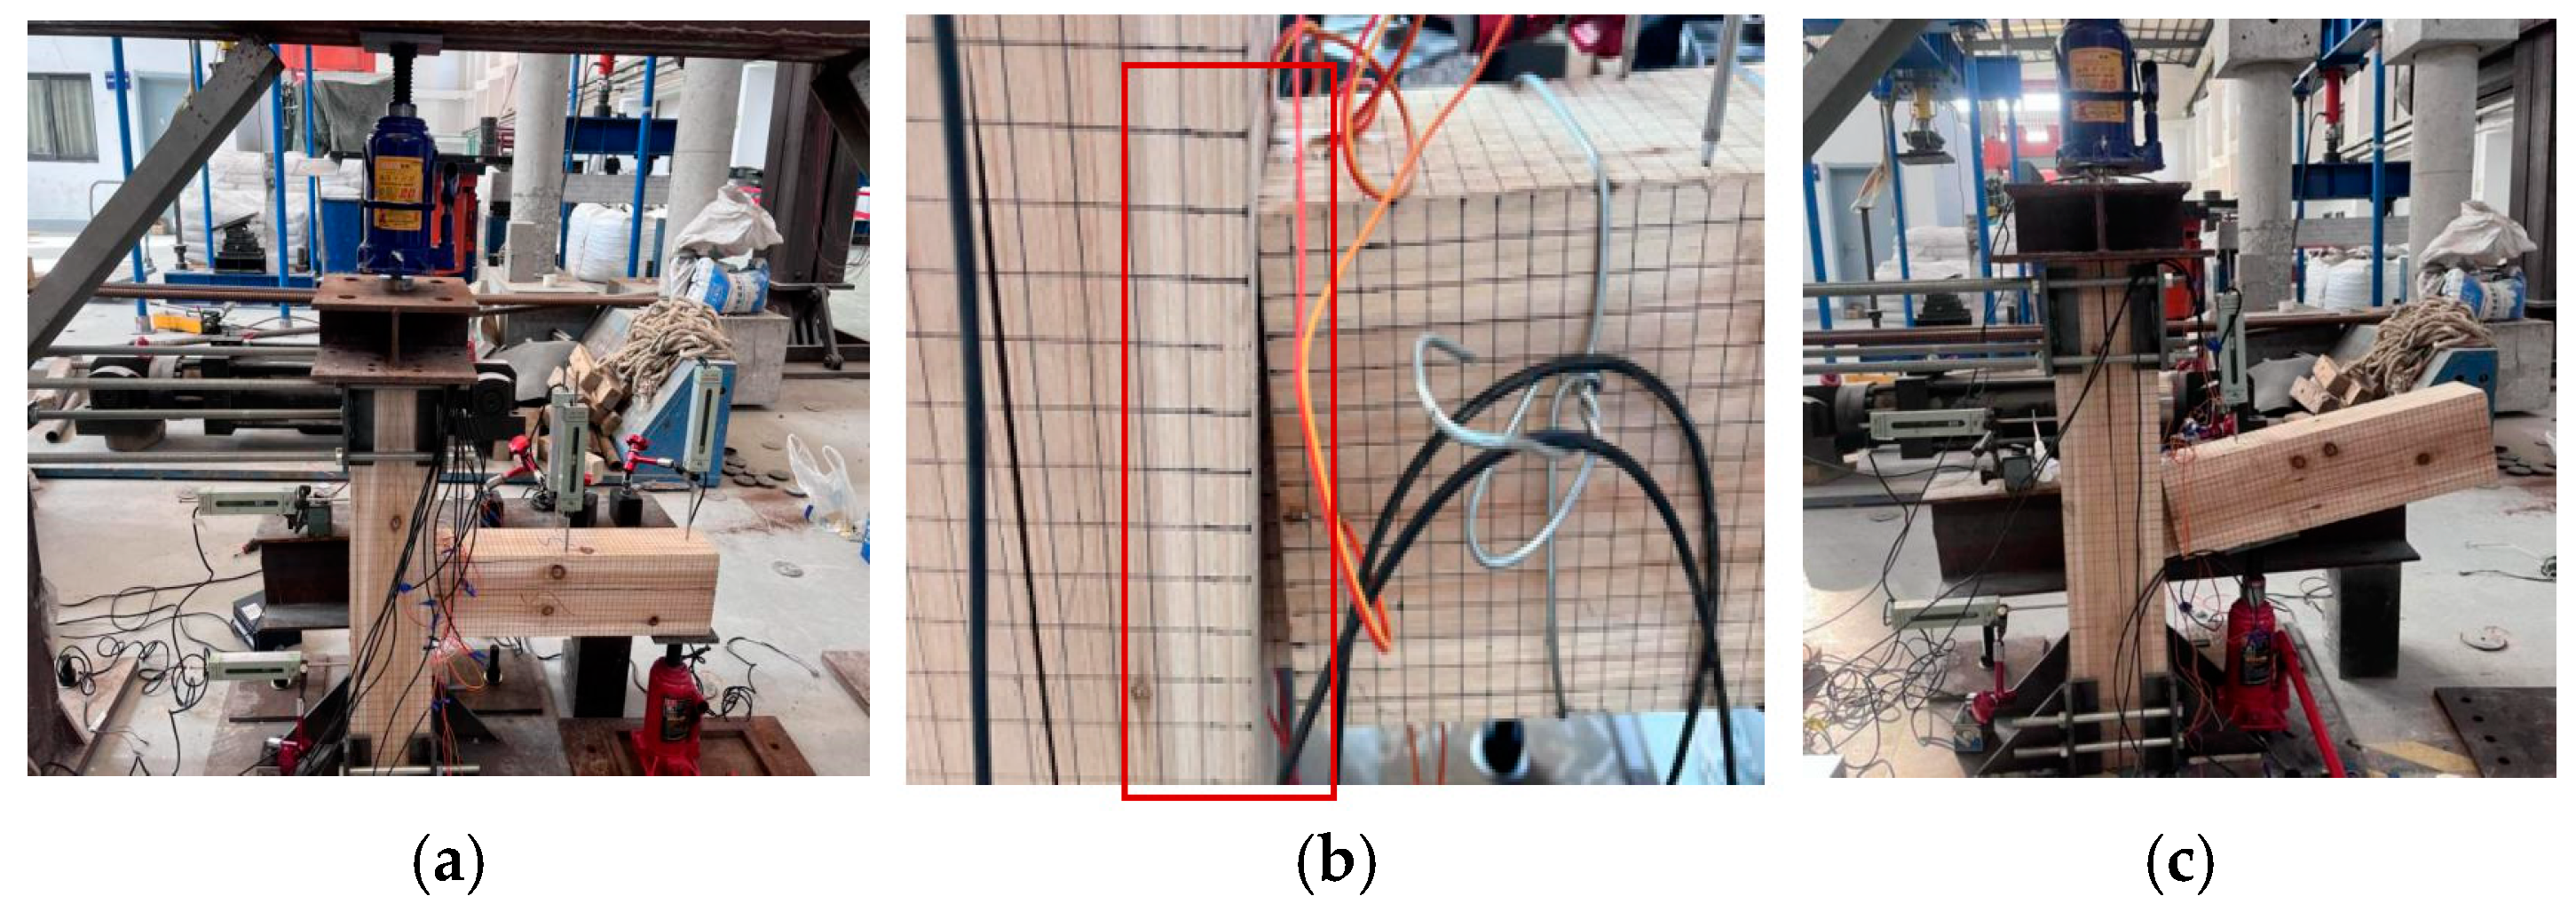
3.1.1. Failure Phenomenon of Specimen J-1
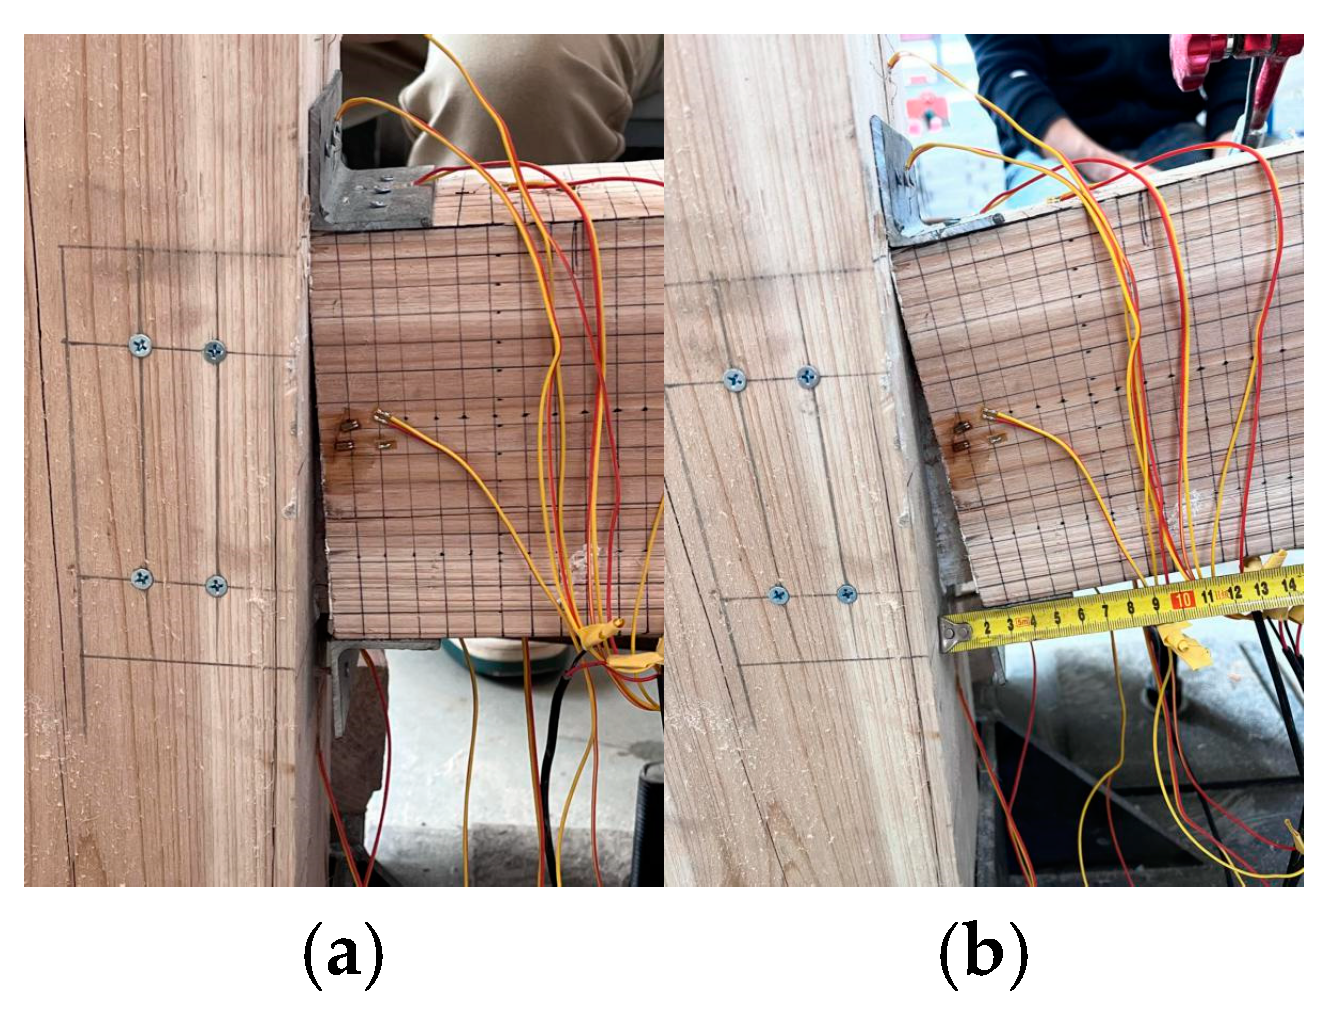
3.1.2. Failure Phenomenon of Specimen J-2
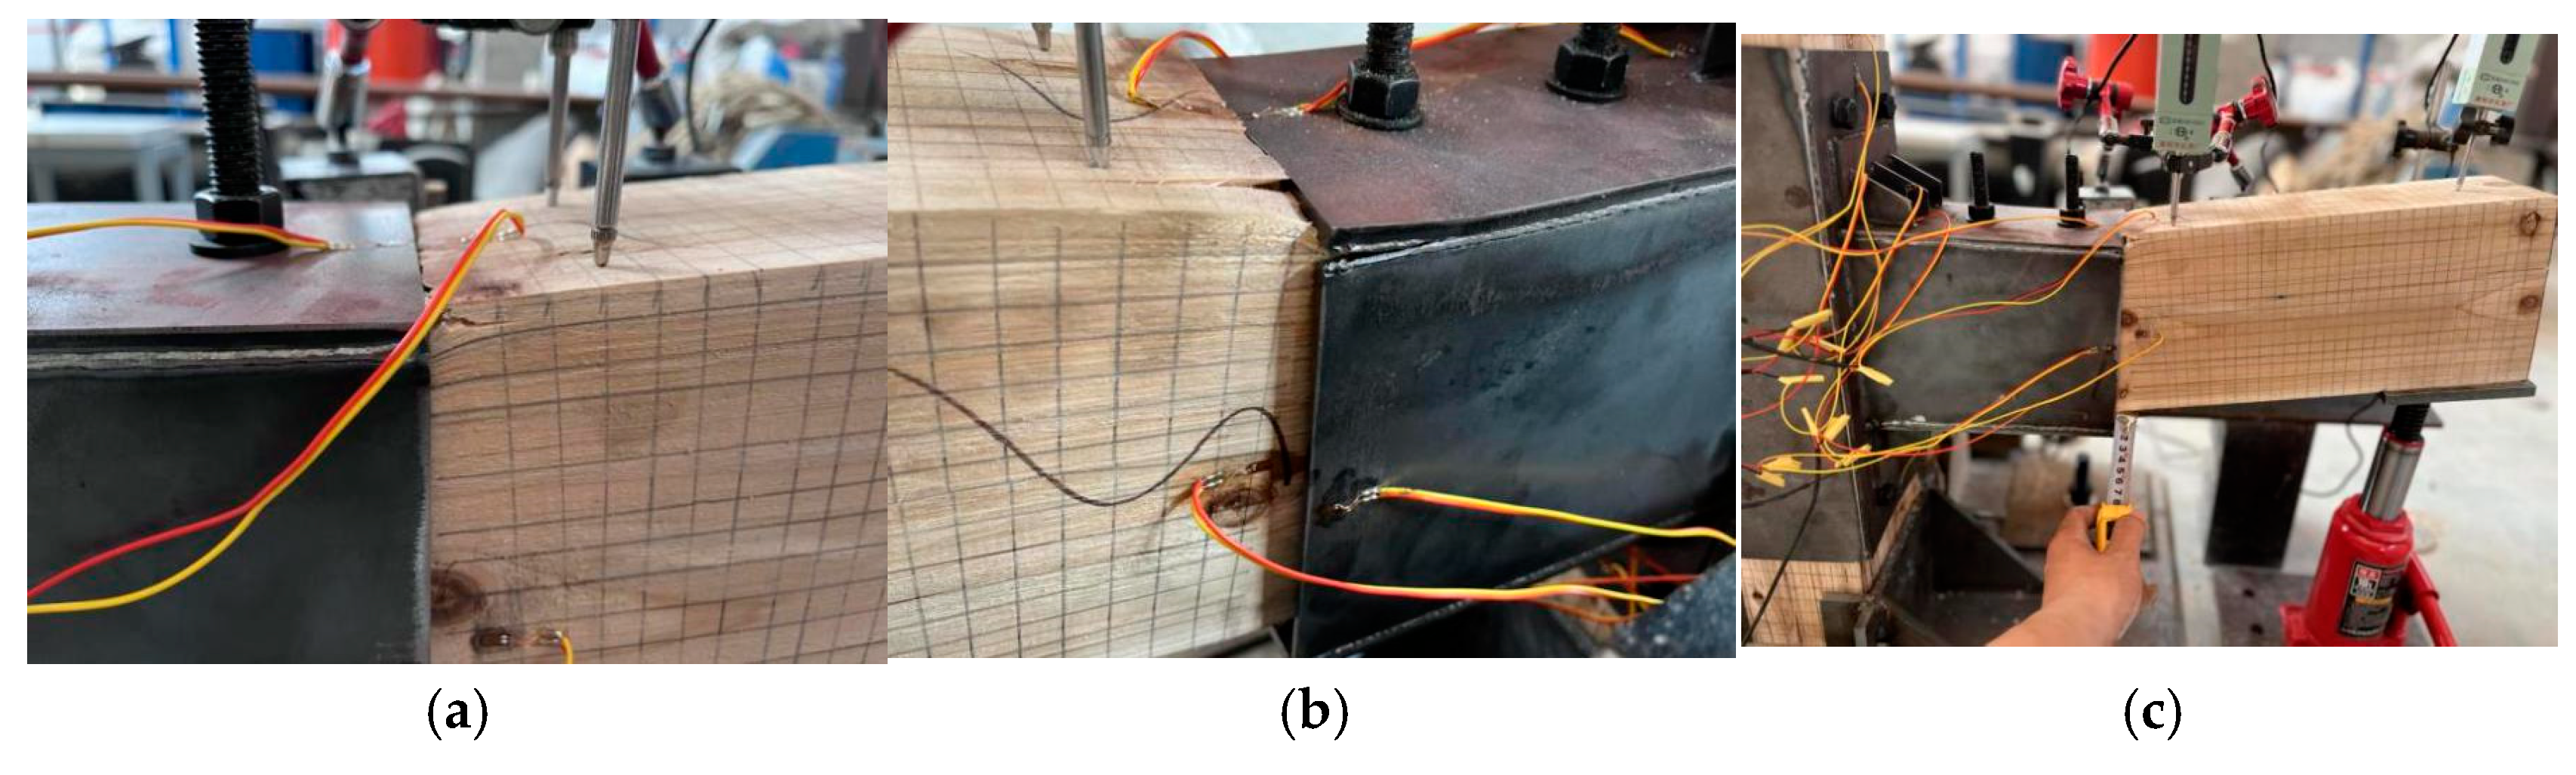
3.1.3. Failure Phenomenon of Specimen J-3
3.1.4. Failure Phenomenon of Specimen J-4
3.2. Analysis of the Results of the Node Moment—Rotation Curve
- (1)
- Each joint change is divided into elastic, yielding, strengthening, and descending stages, and the curve shows a trend of rising–flattening–descending. The deformation and stress of the mortise–tenon interface increase during the initial loading stage, and the M–θ curve grows linearly in the elastic stage. As the bending moment increases, the yielding deformation of the mortise–tenon increases, and the curve stiffness decreases with the appearance of a platform in the yielding stage. After the joint yields, it enters the strengthening stage, the stress of the tenon increases excessively, and the joint has plastic deformation, with the upper surface of the tenon being extruded and the lower surface being stretched. As the plastic deformation increases, the contact area between the lower surface of the tenon and the mortise hole decreases, and the unloading curve of the joint enters the descending stage until the end of the test.
- (2)
- Comparing the M–θ curves of joints J-1 and J-2, with the increase in reinforcement methods, the initial stiffness and ultimate bending moment of each joint are significantly improved. Comparing joints J-2 and J-1, the angle steel restricts the beam end displacement during the initial loading stage, making the initial stiffness of J-2 greater than that of J-1. As the self-tapping screws are pulled out, the J-2 curve enters the yielding, rising, and strengthening stages. At this time, the lower angle steel connection column end screws fail, and the ultimate bending moment value of J-2 is greater than that of J-1. In the descending section of the curve, due to the resistance of the upper angle steel to the bending moment, the lower surface of the tenon detaches from the mortise opening faster, and the curve descends more rapidly.
- (3)
- For the sleeve-reinforced J-3 and J-4 joints, their strength and stiffness are significantly improved compared with J-1 and J-2. Although there are differences in the curve changes of the two joints, the overall trend is consistent. Compared with the joints without sleeve reinforcement, there is a significant difference in the rising stage of the curve. During the initial loading stage, the steel sleeve and the through bolts restrict the displacement of the wooden beam, and the rotational stiffness of the structure rises along the Y-axis, making the joint nearly rigid. With the plastic deformation of the bolt holes of the wooden beam and the lap joint of the sleeve and the bending deformation of the sleeve, after the joint enters the yielding stage, there is a strengthening stage, and the stiffness slowly rises with the increase in the load until the ultimate bending moment. Then, the curve enters the descending stage due to the damage of the steel plate and the cracking of the wooden beam.
- (4)
- The initial rotational stiffness of J-2, J-3, and J-4 are 3.96, 6.99, and 13.62 times that of J-1, while the ultimate bending moments are 1.97, 7.11, and 7.39 times, respectively.
4. Finite Element Numerical Simulation and Verification
4.1. Constitutive Relationship of Materials
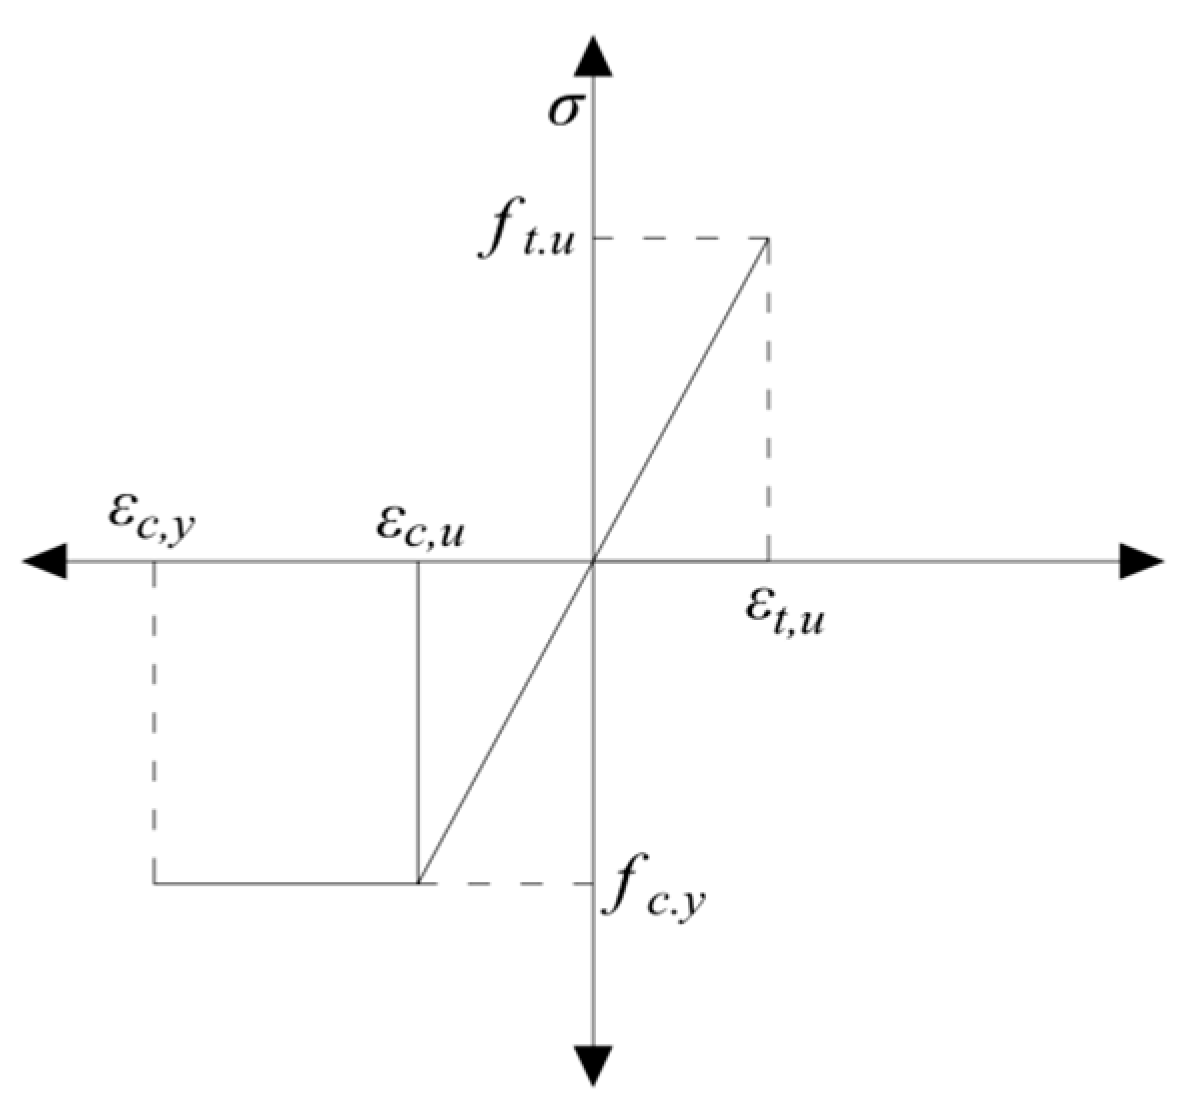
4.1.1. Constitutive Relationship of Wood Along the Grain
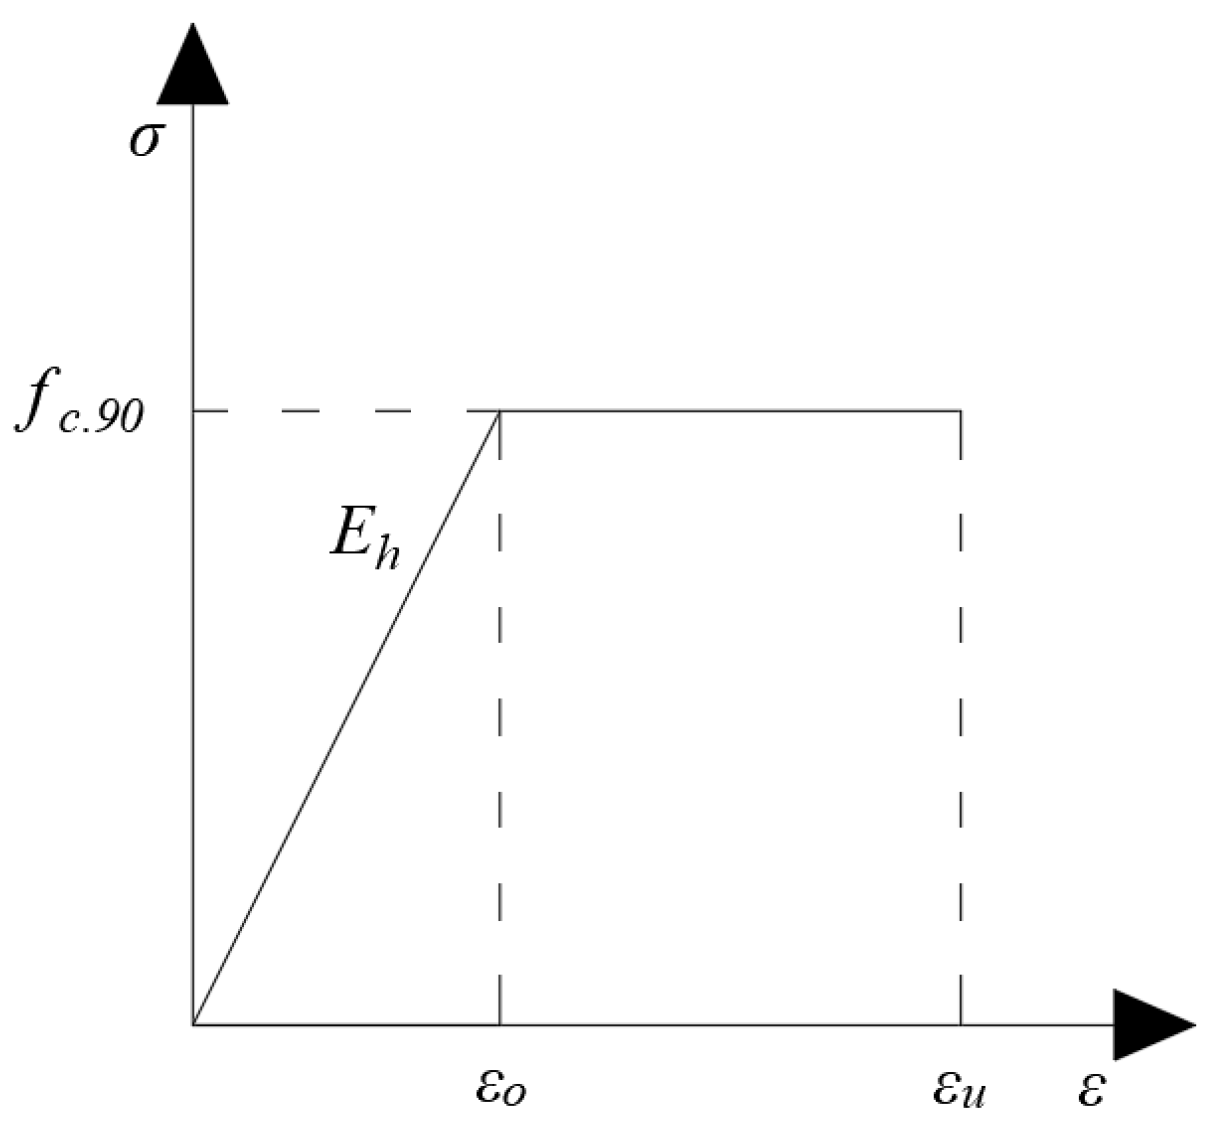
4.1.2. Constitutive Relationship of Wood Across the Grain
- (1)
- The specific values of the material properties of wood in the elastic stage are shown in Table 3 below.
- (2)
- The Hill yield criterion is used to determine the yield stress in different directions during the plastic phase [32]. σ0 represents the reference value of the yield strength (in this paper, the compressive strength along the grain is selected), σij represents the yield stress value of the material in each direction, and R11, R22, R33, R12, R13, and R23 represent the ratios of the yield strengths in each direction. The yield strengths and yield strength coefficients in each direction of wood in the plastic stage are shown in Table 4.
4.2. Mesh Generation and Element Selection
4.3. Contact Settings
4.4. Boundary Conditions and Load Application System
- Initial load step (step-initial):
- ○
- First, add contact relationships to each component in the model;
- ○
- Second, set the initial displacement boundary conditions at the upper and lower ends of the column, which is consistent with the one-way hinged support that fixes the upper and lower ends of the column in the test.
- First load step (step-1): Add the corresponding load boundary at the top of the column. The axial force in the Z-direction is 25 kN, which is the same as the fixed load applied by the jack at the top of the column in the test.
- Second load step (step-2): Apply the full-range displacement load at the beam end. During the calculation process, the maximum displacement is set to 100 mm. In addition, the NIgeom switch in ABAQUS is set to on to consider geometric nonlinearity.
4.5. Comparison Between Finite Element Calculation Results and Experimental Calculation Results
4.6. Analysis of Finite Element Stress Nephogram
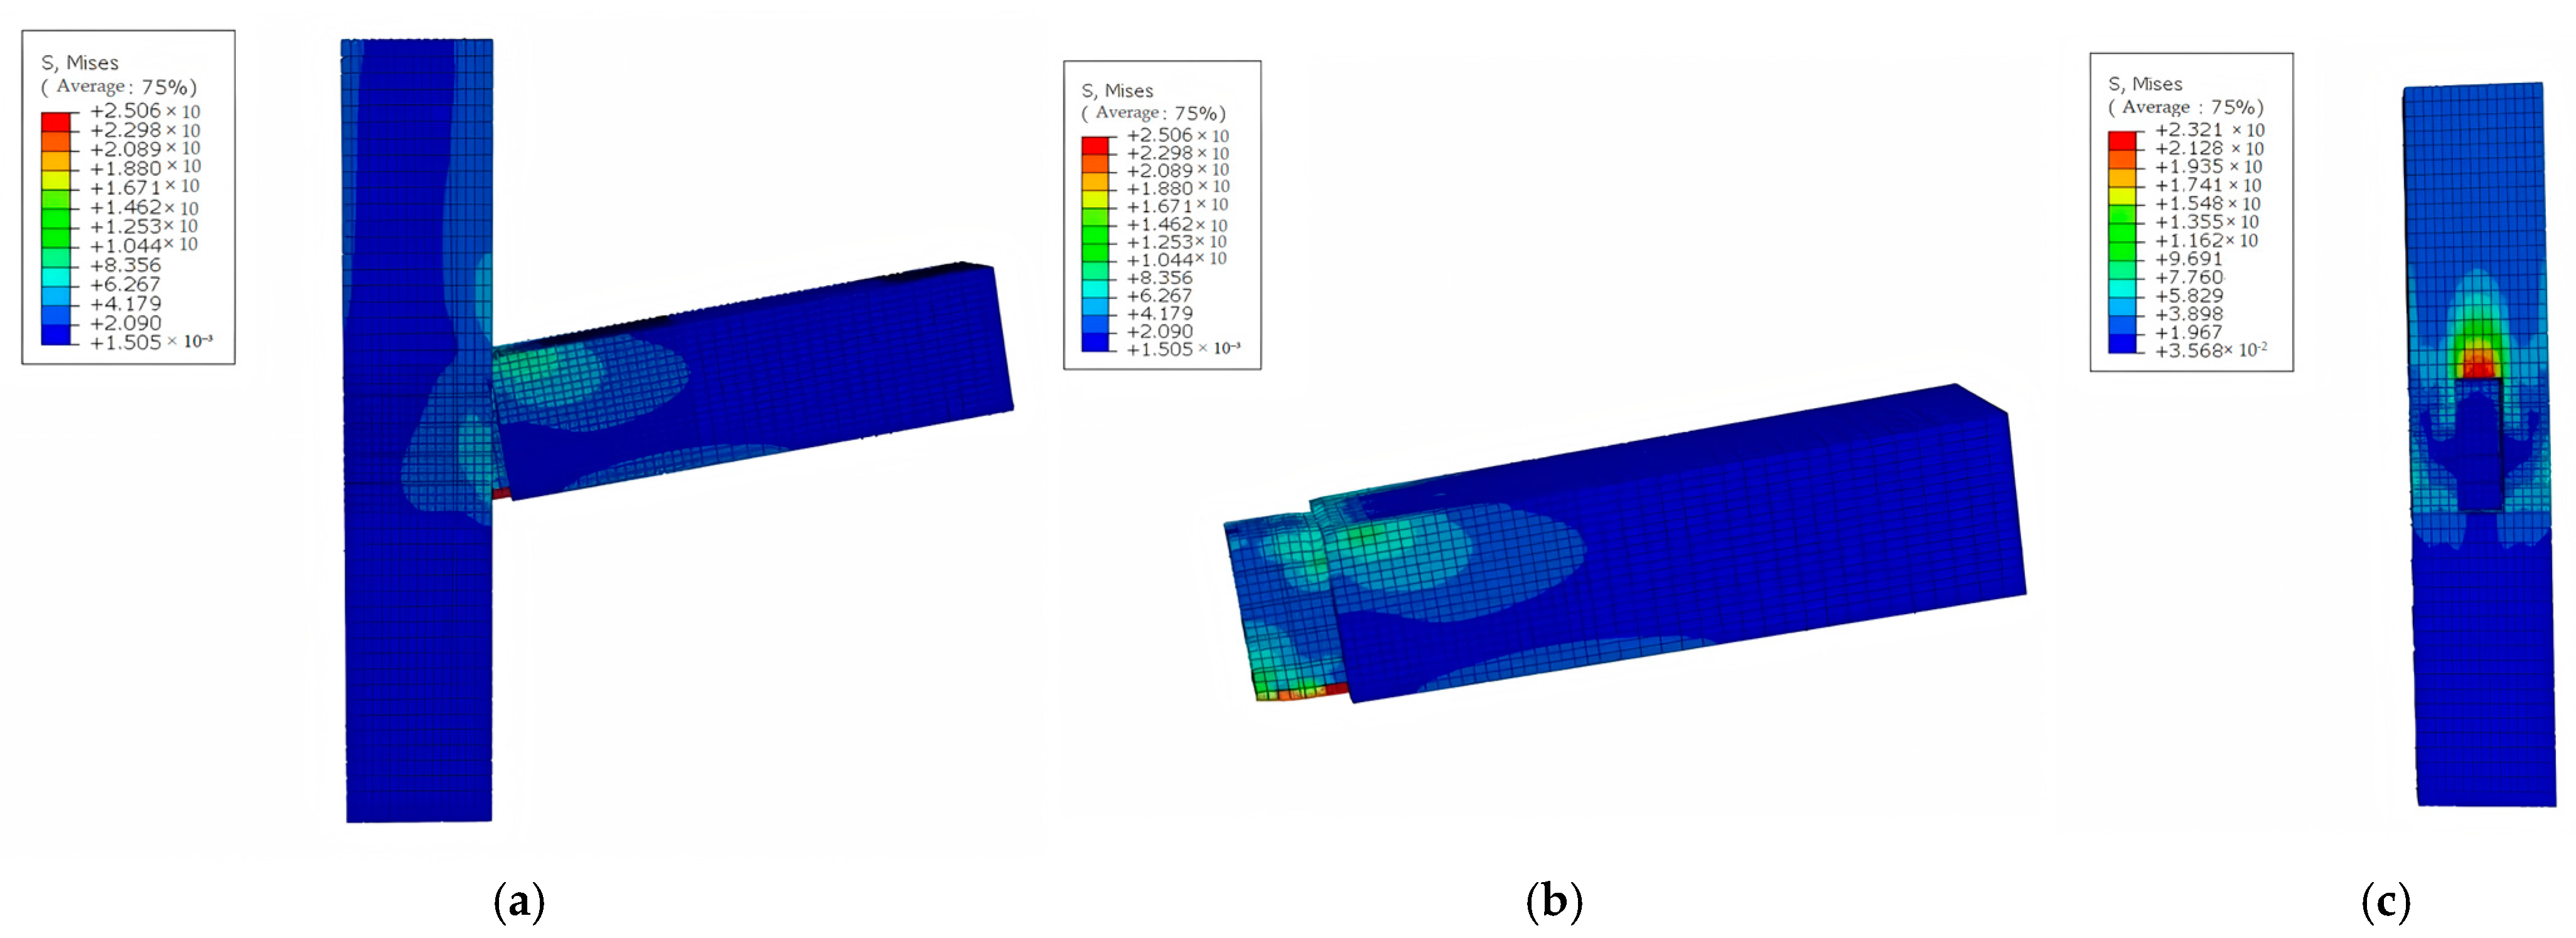
4.6.1. J-1 Joint
4.6.2. J-2 Joint
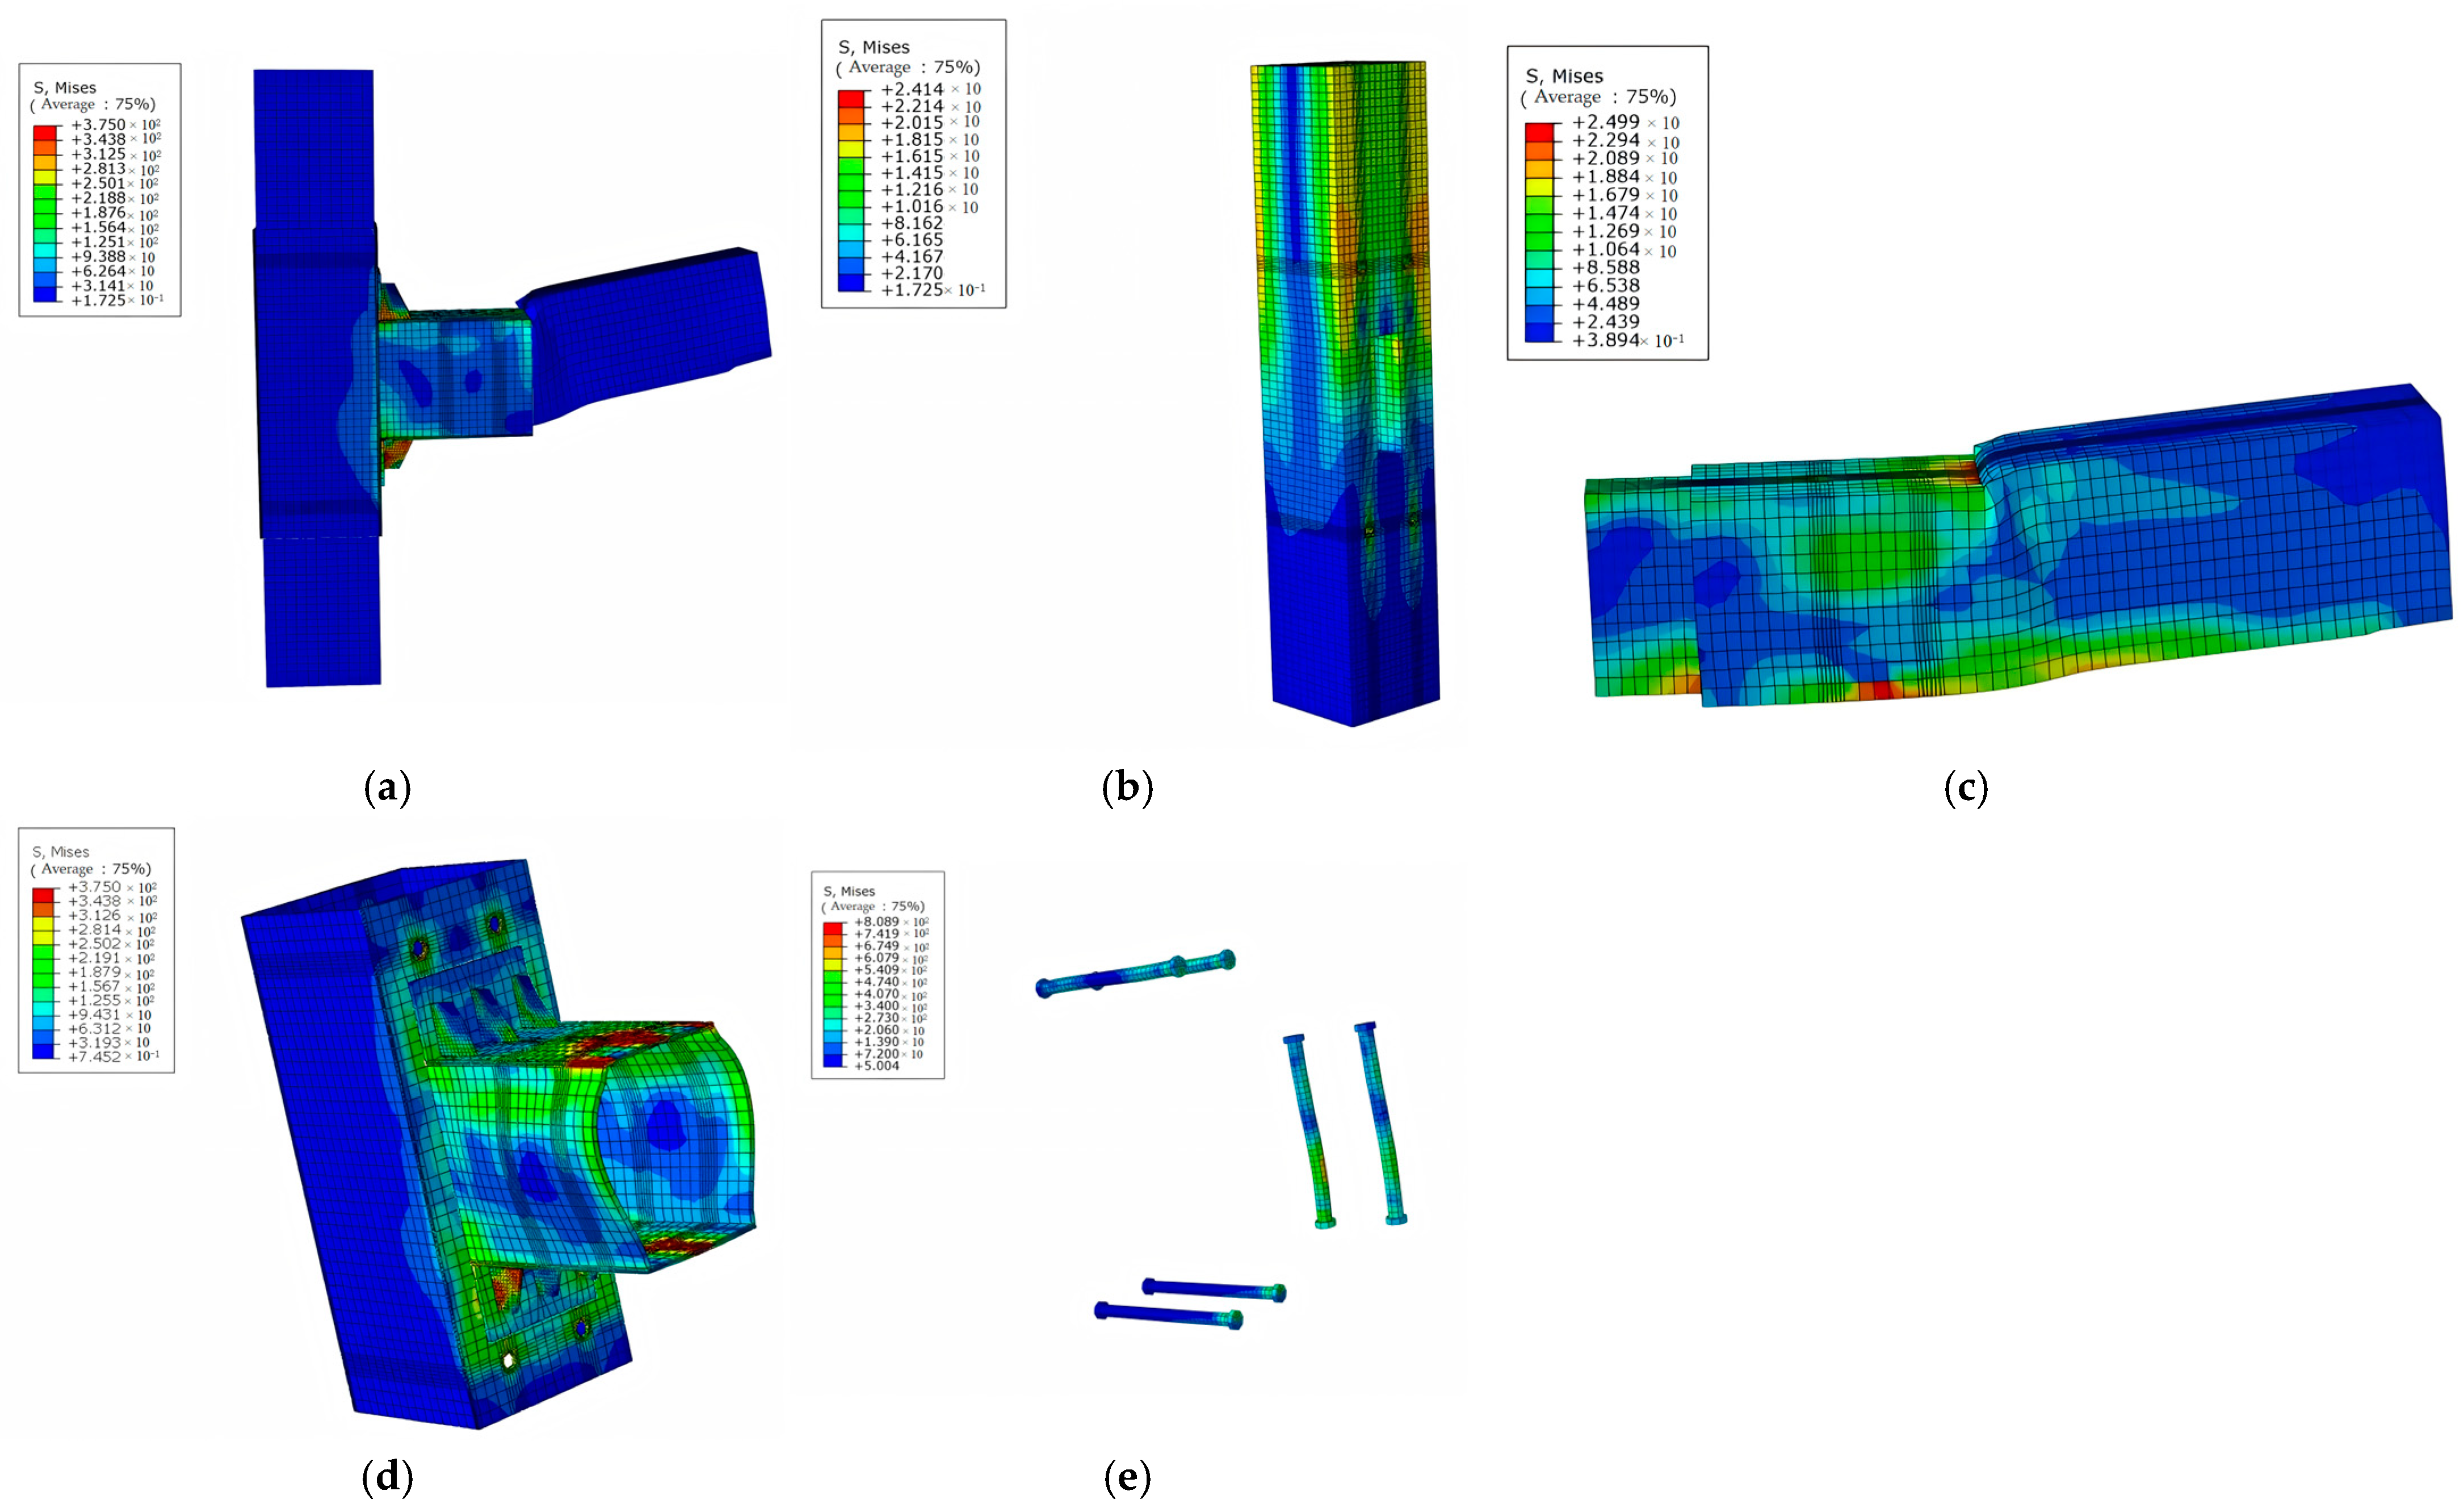
4.6.3. J-3 Joint
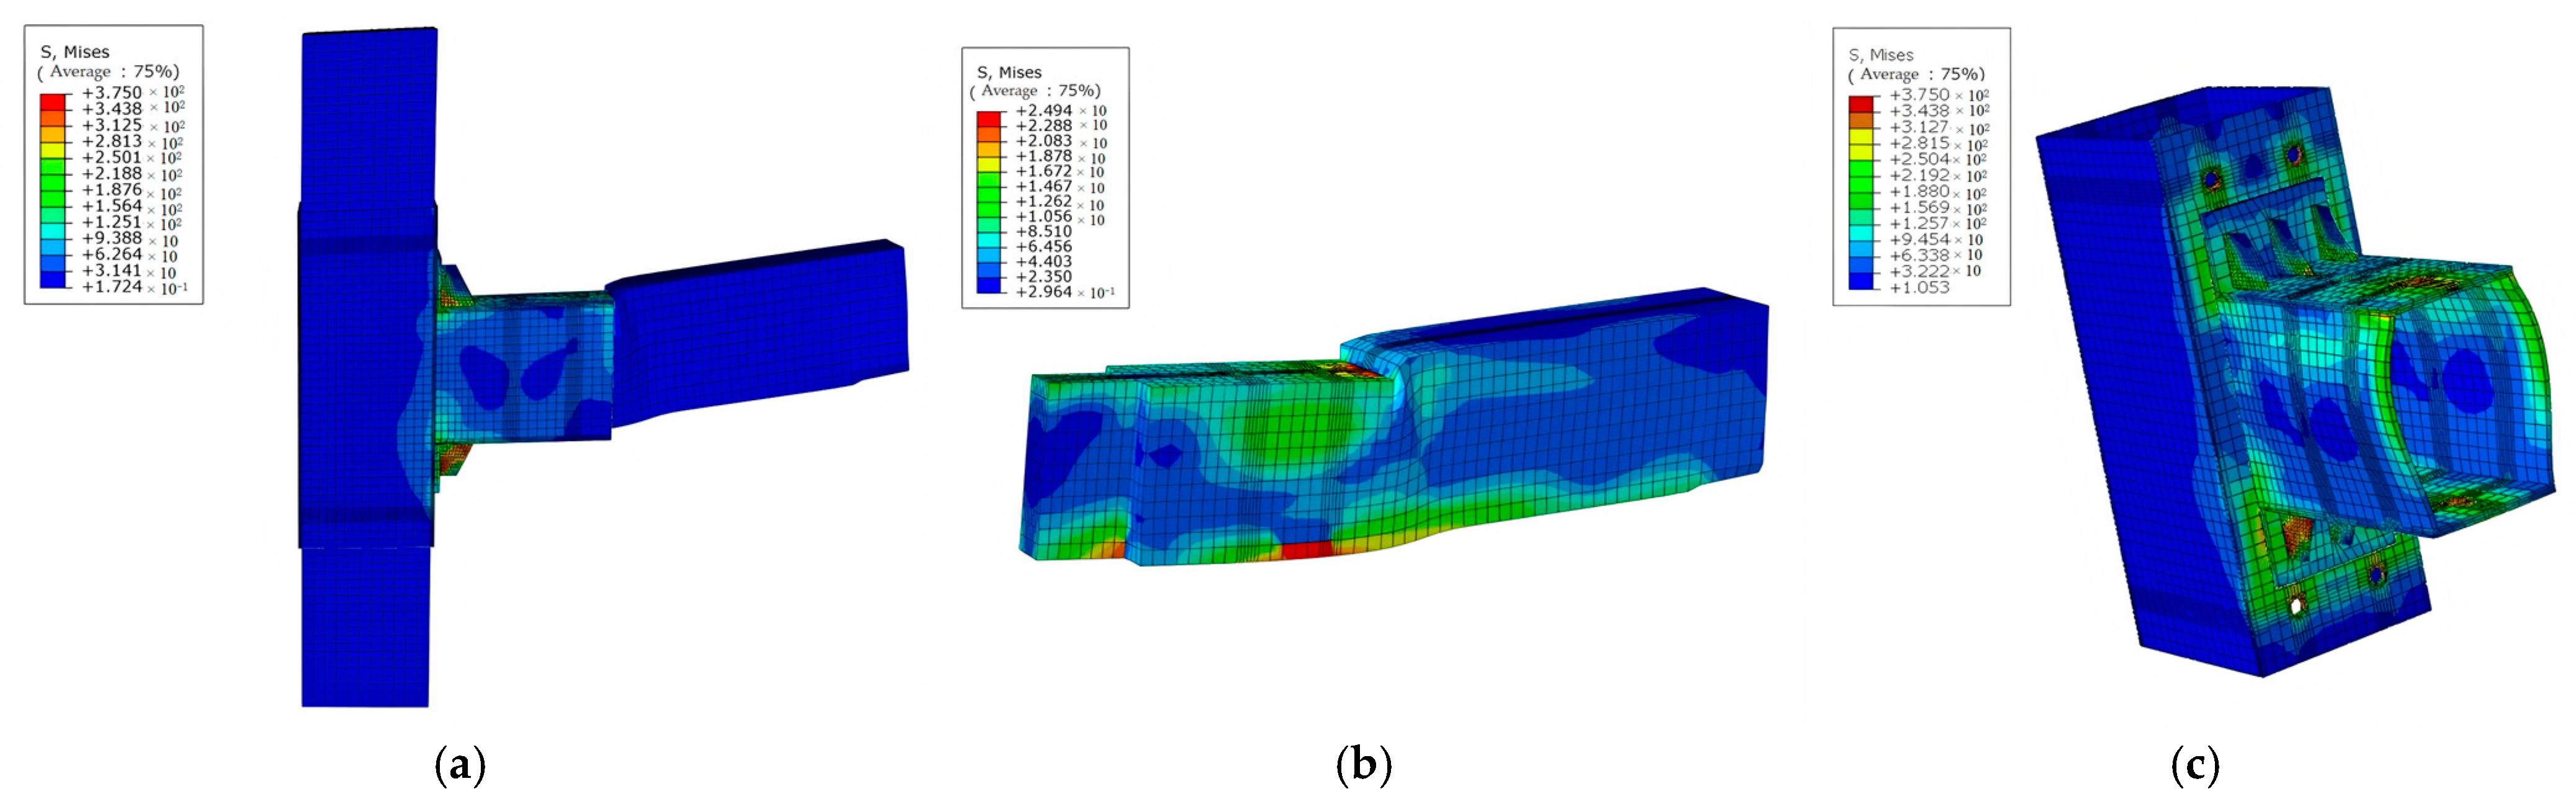
4.6.4. J-4 Joint
5. Conclusions
- (1)
- In the monotonic loading tests, the joints without steel sleeve reinforcement exhibited compression deformation at both the mortise hole and the upper surface of the tenon under the action of the bending moment. Additionally, a tenon pulling phenomenon occurred on the lower surface of the tenon. Ultimately, the entire joint suffered from tenon pulling failure, leading to a loss of bearing capacity for the specimen. Compared with the joints without steel sleeve reinforcement, the load-bearing capacity and initial stiffness of the joints with steel sleeve reinforcement are significantly improved. The failure mode is characterized by the fracture at the edges of the steel plate and the tearing deformation of the wooden beam, while the wooden column and the column sleeve remain intact and undamaged. Designing new types of reinforced joints can provide a variety of reinforcement methods to meet different structural requirements and economic benefits.
- (2)
- The M–θ curves of the specimens show a downward trend. The stiffness of all joints decreases with the increase in joint rotation angle, and the joints without steel sleeve reinforcement have lower initial stiffness and a faster rate of degradation, which indicates poorer seismic resistance for the joint. The joints reinforced with steel sleeves have a high initial stiffness. Although the rate of degradation slows down gradually in the later stages of loading, it still tends to stabilize slowly, which demonstrates good seismic performance for the joint. The maximum value of the tenon pulling for the joint does not change significantly due to the factors of angle steel, self-tapping screws, or structural adhesive, while the tenon pulling amount in the sleeve-reinforced joints is minimal, which indicates that the tenon pulling failure is effectively prevented by the steel sleeves.
- (3)
- In numerical simulations, the areas with high stress in joints without sleeve reinforcement are primarily located at the upper and lower ends of the tenon. The compressive stress at both the upper and lower edges of the tenon is mainly distributed along the grain direction of the beam. The stress becomes more pronounced as the distance to the variable cross-section decreases. The stress on the column sleeve of joints reinforced with steel sleeves and bolts is relatively low. Meanwhile, the areas with greater strain in the beam sleeve are mainly concentrated on the side with the welded stiffeners and its surroundings. Additionally, the strain around the bolt holes is quite noticeable.
Author Contributions
Funding
Data Availability Statement
Conflicts of Interest
References
- Fa, G.; Wang, Q. Experimental study on seismic performance of mortise-tenon joints strengthened with BFRP. Build. Struct. 2012, 42, 152–156. [Google Scholar]
- Zhou, Q.; Yan, W.; Zhou, H.; Zhang, Y. Seismic test of ancient building mortise-tenon joints strengthened with steel components. J. Appl. Basic Eng. Sci. 2012, 20, 1063–1071. [Google Scholar]
- Xu, M.; Qiu, H.; Chun, Q. Calculation of bearing capacity of mortise-tenon joints of ancient wooden structures strengthened with carbon fiber. Earthq. Resist. Eng. Retrofit. 2013, 35, 121–124. [Google Scholar]
- Chang, W.; Hsu, M.; Komatsu, K. Rotational performance of traditional Nuki joints with gap I: Theory and verification. J. Wood Sci. 2006, 52, 58–62. [Google Scholar] [CrossRef]
- Chang, W.; Hsu, M. Rotational performance of traditional Nuki joints with gap II:the behavior of butted Nuki joint and its comparison with continuous Nuki joint. J. Wood Sci. 2007, 53, 401–407. [Google Scholar] [CrossRef]
- Shao, J.; Wang, K.; Kaewunruen, S.; Cai, W.; Wang, Z. Experimental Investigations into Earthquake Resistance of Steel Frame Retrofitted by Low-Yield-Point Steel Energy Absorbers. Appl. Sci. 2019, 9, 3299. [Google Scholar] [CrossRef]
- Xu, T.; Shao, J.; Zhang, J.; Kaewunruen, S. Experimental Performance Evaluation of Multi-Storey Steel Plate Shear Walls Designed by Different Methods. Int. J. Civ. Eng. 2019, 17, 1145–1154. [Google Scholar] [CrossRef]
- Wang, Z.; Shao, J. Study on Quasi-Static Axial Compression Performance and Energy Absorption of aluminum Foam-Filled Steel Tubes. Materials 2023, 16, 4485. [Google Scholar] [CrossRef] [PubMed]
- Liu, K.; Shao, J.; Tang, B.; Wu, Q.; Wang, Z. Seismic Performance of Low-Yield-Point Steel Plate Shear Walls Under Horizontal Cyclic Load. Iran. J. Sci. Technol. Trans. Civ. Eng. 2022, 16, 3739–3752. [Google Scholar] [CrossRef]
- Liu, Q.; Shao, J.; Tang, B.; Wang, Z. Experimental Investigation into Failure Modes of Low-Yield-Point Steel Plate Shear Walls. Appl. Sci. 2022, 12, 5632. [Google Scholar] [CrossRef]
- Wang, T.; Shao, J.; Zhao, C.; Liu, W.; Wang, Z. Shaking Table Test for Evaluating the Seismic Performance of Steel Frame Retrofitted by Buckling-Restrained Braces. Shock. Vib. 2021, 2021, 6654201. [Google Scholar] [CrossRef]
- Wang, T.; Shao, J.; Xu, T.; Wang, Z. Study on Axial Compression Properties of Aluminum Foam-flled Steel Tube Members After High Temperature. Iran. J. Sci. Technol. Trans. Civ. Eng. 2021, 46, 883–900. [Google Scholar]
- Chen, C.; Qiu, H.; Bao, Y.; Hao, X. Experimental study on flexural performance of asymmetric mortise-tenon joints under positive and negative bending. J. Southeast Univ. (Nat. Sci. Ed.) 2014, 44, 1224–1229. [Google Scholar]
- Yang, H.F.; Ling, Z.B.; Liu, W.Q.; Ren, X.; Lu, W.D. Experimental study on ductile flexural joints of glued laminated timber beams and columns under monotonic and low-cycle repeated loads. J. Build. Struct. 2015, 69, 131–138. [Google Scholar]
- Tannert, T. Improved performance of reinforced rounded dovetail joints. Constr. Build. Mater. 2016, 118, 262–267. [Google Scholar] [CrossRef]
- Crayssac, E.; Song, X.; Wu, Y.; Li, K. Lateral performance of mortise-tenon jointed traditional timber frames with wood panel infill. Eng. Struct. 2018, 161, 223–230. [Google Scholar] [CrossRef]
- Rad, A.R.; Burton, H.; Weinand, Y. Performance assessment of through-tenon timber joints under tension loads. Constr. Build. Mater. 2019, 207, 706–721. [Google Scholar]
- Panoutsopoulou, L.; Mouzakis, C. Experimental investigation of the behavior of traditional timber mortise-tenon T-joints under monotonic and cyclic loading. Constr. Build. Mater. 2022, 348, 128655. [Google Scholar] [CrossRef]
- Wang, M.; Song, X.; Gu, X.; Zhang, Y.; Luo, L. Research on rotational performance of bolt-steel filler plate joints of glued laminated timber beams and columns. J. Build. Struct. 2014, 35, 141–150. [Google Scholar]
- Sun, H.; Lu, W.; Zhao, K.; Fan, N. Calculation of flexural bearing capacity of bolted joints of glued laminated timber beams and columns enhanced by self-tapping screws. Struct. Eng. 2015, 31, 46–50. [Google Scholar]
- Luo, E. Research on Mechanical Properties of Bolted Joints with Built-In Steel Plates in Wooden Reticulated Shells. Master’s Thesis, Harbin Institute of Technology, Harbin, China, 2015; pp. 70–71. [Google Scholar]
- Zhou, T.; Guan, Z. A new approach to obtain flat nail embedding strength of double-sided nail plate joints. Constr. Build. Mater. 2011, 25, 598–607. [Google Scholar] [CrossRef]
- Bader, T.K.; Schweigler, M.; Hochreiner, G.; Serrano, E.; Enquist, B.; Dorn, M. Dowel deformations in multi-dowel LVL-connections under moment loading. Wood Mater. Sci. Eng. 2015, 10, 216–231. [Google Scholar] [CrossRef]
- Masaeli, M.; Karampour, H.; Gilbert, B.P.; Talebian, N.; Behnia, A. Numerical assessment of the interaction between shear and moment actions in LVL bolted connections. J. Build. Eng. 2022, 55, 104695. [Google Scholar] [CrossRef]
- Li, J. Yingzao Fashi; The Commercial Press: Shanghai, China, 1950. [Google Scholar]
- GB 50005-2003; Code for Design of Timber Structures. Standardization Administration of China: Beijing, China, 2003.
- Wang, W. Research on Mechanical Properties of Mortise-Tenon Joints of Ancient Wooden Structures After Reinforcement. Master’s Thesis, Southeast University, Nanjing, China, 2017. [Google Scholar]
- Xu, D.; Xue, J.; Qi, L.; Chen, J.; Xu, Y. Research on seismic performance of hook mortise joints of column-and-tie timber structures. J. Build. Struct. 2024, 45, 187–196. [Google Scholar]
- Cao, L. Simulation Study on Seismic Performance of Single- and Double-Span Timber Structures. Master’s Thesis, Taiyuan University of Technology, Taiyuan, China, 2017. [Google Scholar]
- Wang, T. Research on Mechanical Properties and Fire Resistance of Joints of Ethnic Timber Structures in Southeast Guizhou. Master’s Thesis, Jiangsu University of Science and Technology, Zhenjiang, China, 2021. [Google Scholar]
- GB/T 1927.1-2021; Test Methods for Physical and Mechanical Properties of Clear Small-Sized Wood Specimens—Part 1: Collection of Test Materials. Standardization Administration of China: Beijing, China, 2021.
- Wang, Z.; Shi, A.; Wang, T.; Shao, J. Research on the Physical and Mechanical Properties of Chinese Fir in Southeast Guizhou. Fujian Archit. Constr. 2020, 06, 87–91. [Google Scholar]
- Xue, J.; Liang, X.; Song, D.; Wu, C. Experimental Research and Finite Element Analysis on the Eccentric Compression Performance of Bracket Sets of the Capital. J. Build. Struct. 2022, 43, 199–209. [Google Scholar]
- Li, Y.; Cheng, X.; An, Y.; Yang, X.; Lu, G.; Liu, J. Experimental and Finite Element Analysis on the Seismic Performance of the Cantilever Section of a New Stepped Joint. J. Harbin Inst. Technol. 2024. Available online: https://link.cnki.net/urlid/23.1235.T.20240201.1230.002 (accessed on 28 December 2024).
- Gan, S. Experimental Research and Engineering Demonstration on the Seismic Performance of Traditional Timber Structure Mortise-Tenon Joints Strengthened with Viscoelastic Dampers. Master’s Thesis, Kunming University of Science and Technology, Kunming, Yunnan, 2023. [Google Scholar]


| Specimen Number | Reinforcement Method | Steel Plate Thickness/mm |
|---|---|---|
| J-1 | None | - |
| J-2 | Structural adhesive, angle steel, self-tapping screw | 4 |
| J-3 | Steel sleeve | 4 |
| J-4 | Steel sleeve | 6 |
| Specimen Number | Initial Rotational Stiffness/(kN·m/rad) | Yielding Bending Moment/(kN·m) | Ultimate Bending Moment/(kN·m) |
|---|---|---|---|
| J-1 | 25.03 | 0.901 | 1.214 |
| J-2 | 99 | 1.84 | 2.392 |
| J-3 | 175 | 7.176 | 8.625 |
| J-4 | 341 | 8.418 | 8.97 |
| E1/MPa | E2/MPa | E3/MPa | μ12 | μ13 | μ23 | G12/MPa | G13/MPa | G23/MPa |
|---|---|---|---|---|---|---|---|---|
| 10,969.7 | 250 | 242.7 | 0.54763 | 0.46125 | 0.409 | 857.25 | 685 | 205 |
| Yield Strength (MPa) | σ11 | σ22 | σ33 | σ12 | σ13 | σ23 | σ0 |
| 25 | 1.5 | 1.5 | 2.01 | 2.01 | 2.01 | 25 | |
| Yield Strength Coefficient | R11 | R22 | R33 | R12 | R13 | R23 | |
| 1 | 0.06 | 0.06 | 0.12 | 0.12 | 0.12 |
| Boundary Conditions | Boundary Location | Condition Settings | |
|---|---|---|---|
| Reference Point | Coupling Surface | ||
| Load boundary | RP-1 | Column top | A concentrated force in the Z-axis direction with a vertical load of 25 kN |
| Displacement boundary | RP-1 | Column top | Constraints on displacements U1 and U3 and rotation UR2 |
| None | Column bottom | Constraints on displacements U1 and U3 and rotation UR2 | |
| RP-2 | Loading surface at the beam end | Application of a predetermined displacement load in the Z-direction | |
Disclaimer/Publisher’s Note: The statements, opinions and data contained in all publications are solely those of the individual author(s) and contributor(s) and not of MDPI and/or the editor(s). MDPI and/or the editor(s) disclaim responsibility for any injury to people or property resulting from any ideas, methods, instructions or products referred to in the content. |
© 2025 by the authors. Licensee MDPI, Basel, Switzerland. This article is an open access article distributed under the terms and conditions of the Creative Commons Attribution (CC BY) license (https://creativecommons.org/licenses/by/4.0/).
Share and Cite
Wang, Z.; Yang, W.; Gao, Z.; Shao, J.; Li, D. Experimental and Numerical Simulation Study on the Mechanical Properties of Integrated Sleeve Mortise and Tenon Steel–Wood Composite Joints. Buildings 2025, 15, 137. https://doi.org/10.3390/buildings15010137
Wang Z, Yang W, Gao Z, Shao J, Li D. Experimental and Numerical Simulation Study on the Mechanical Properties of Integrated Sleeve Mortise and Tenon Steel–Wood Composite Joints. Buildings. 2025; 15(1):137. https://doi.org/10.3390/buildings15010137
Chicago/Turabian StyleWang, Zhanguang, Weihan Yang, Zhenyu Gao, Jianhua Shao, and Dongmei Li. 2025. "Experimental and Numerical Simulation Study on the Mechanical Properties of Integrated Sleeve Mortise and Tenon Steel–Wood Composite Joints" Buildings 15, no. 1: 137. https://doi.org/10.3390/buildings15010137
APA StyleWang, Z., Yang, W., Gao, Z., Shao, J., & Li, D. (2025). Experimental and Numerical Simulation Study on the Mechanical Properties of Integrated Sleeve Mortise and Tenon Steel–Wood Composite Joints. Buildings, 15(1), 137. https://doi.org/10.3390/buildings15010137