Abstract
This research proposes an integrated lighting and solar shading strategy to improve energy efficiency and user comfort in a retrofit project in a temperate-humid climate. The study examines a future library addition to an existing faculty building in Bursa, featuring highly glazed façades (77% southwest, 81% northeast window-to-wall ratio), an open-plan layout, and situated within an unobstructed low-rise campus environment. Trade-offs between daylight availability, heating, cooling, lighting energy use, and visual and thermal comfort are evaluated through integrated lighting (DIALux Evo), climate-based daylight (CBDM), and energy simulations (DesignBuilder, EnergyPlus, Radiance). Fifteen solar shading configurations—including brise soleil, overhangs, side fins, egg crates, and louvres—are evaluated alongside a daylight-responsive LED lighting system that meets BS EN 12464-1:2021. Compared to the reference case’s unshaded glazing, optimal design significantly improves building performance: a brise soleil with 0.4 m slats at 30° reduces annual primary energy use by 28.3% and operational carbon emissions by 29.1% and maintains thermal comfort per ASHRAE 55:2023 Category II (±0.7 PMV; PPD < 15%). Daylight performance achieves 91.5% UDI and 2.1% aSE, with integrated photovoltaics offsetting 129.7 kWh/m2 of grid energy. This integrated strategy elevates the building’s energy class under national benchmarks while addressing glare and overheating in the original design.
1. Introduction
Indoor environmental quality (IEQ) refers to the conditions within a building, encompassing factors such as air quality, lighting, acoustics, thermal comfort, and the overall psychological environment. A high IEQ is crucial for enhancing cognitive function, concentration, and well-being in libraries, ultimately impacting student performance. Research indicates a strong correlation between IEQ and library user satisfaction [1,2,3]. For instance, Li, Wu, and Su [4] studied the influence of design features such as lighting and acoustics on learning performance, proposing design enhancements to adapt libraries for the digital age. Aflaki et al. [5] investigated IEQ in a campus library, identifying issues such as high humidity, inadequate air velocity, low light intensity, and poor temperature control. Their study suggests design strategies for improving thermal comfort, such as increasing both indoor air temperature and the window-to-wall (WWR) ratio. In a related context, Akanmu, Nunayon, and Eboson [6] evaluated three university libraries in Nigeria, discovering problems like insufficient lighting, high noise levels, and thermal discomfort, all of which adversely affect users. Additionally, Qashqari and Jefferies [7] found that comfortable conditions in libraries significantly enhance user satisfaction, leading to better concentration, longer visits, improved mood, and a favorable perception of the library.
Visual comfort, a crucial component of IEQ, is integral to the design and functionality of library spaces. Effective lighting enhances architectural aesthetics and fosters a tranquil environment, where key factors such as illuminance levels, glare control, and color rendering play a significant role in creating a conducive atmosphere for reading and comprehension. Libraries should comply with the BS EN 12464-1:2021 standard [8], which provides guidelines on indoor lighting metrics for different library zones.
Further research has emphasized the importance of visual comfort in library environments. For instance, Lin et al. [9] studied lighting asset management in Swedish public libraries, revealing a gap between actual lighting conditions and stakeholder expectations. Kan-Kilic and Hasirci [10] assessed the impact of lighting on user satisfaction in a Scottish university library through observational studies and surveys, identifying key factors that affect visit duration and user comfort. Manav, Kutlu, and Küçükdoğu [11] combined measurements with a questionnaire to evaluate visual comfort in a university library, leading to design recommendations based on computer simulations. Similarly, Şener and Köknel Yener [12] utilized computer simulations and field measurements to assess lighting principles in a Turkish university library, focusing on visual comfort requirements.
Lighting design should prioritize energy-efficient strategies while ensuring user visual comfort. Libraries can enhance energy efficiency by employing LED lighting, optimizing daylight harvesting, and implementing smart controls. The literature review by Yu and Su [13] emphasizes integrating natural light with electric lighting for sustainable lighting design. Shao et al. [14] analyzed energy-saving options in library lighting through building information modeling (BIM) and proposed a smart control system reliant on wireless sensor networks. Balocco and Volante [15] focused on retrofitting lighting in a historic university library, aiming to balance lighting quality with heritage conservation. Lo Verso et al. [16] highlighted user preferences and modeling techniques in optimizing daylighting and reducing lighting energy consumption in educational spaces. Additionally, Nasrollahi and Shokry [17] utilized Relux software to parametrically analyze how architectural elements impact daylighting, visual comfort, and electrical energy performance in study spaces.
The building envelope is critical for attaining visual comfort and energy efficiency, employing passive design elements such as size, shape, orientation, transparency ratio, and material properties. Boyden and Weiner [18] discussed libraries as examples of sustainable design, showcasing energy-saving strategies like optimized daylighting in a case study. Xuan and Hongyan [19] explored energy-efficient features of a library in China, including efficient LED lamps and lighting control. Afacan [20] employed a user-centered design approach to gather student input on green design attributes related to energy efficiency and technology. Shane [21] highlighted the role of building design in reducing energy costs and advocated for passive solar design using examples from public and academic libraries. Further research by Omar et al. [22] studied how architectural elements like volume depth, window size, and glass transmittance influence daylight availability and energy performance in libraries. Liu and Ren [23] also presented a design strategy focused on improving energy efficiency in libraries through green performance analysis.
Current research has focused on optimizing design strategies for university libraries. Gao et al. [24] introduced a multi-objective optimization method to balance daylighting and thermal performance in library atriums located in cold regions, resulting in improved energy efficiency and sufficient daylight. Bai et al. [25] conducted experiments on atrium design, achieving a balance between natural lighting and energy consumption. Xu et al. [26] created a multi-objective optimization framework utilizing machine learning algorithms to address performance simulation efficiency, balancing building energy consumption, indoor thermal comfort, and daylighting performance in library atrium spaces. The study by Zhou et al. [27] applies the LightGBM algorithm to optimize the initial design of a library in a cold region of China, focusing on factors such as indoor temperature and lighting. By utilizing generative design and multi-objective optimization, it demonstrates that this approach can effectively enhance user comfort and energy efficiency. Additionally, a recent study by Cui and Ahn [28] optimized key lighting variables affecting library reading spaces to improve illumination uniformity and visual comfort while minimizing energy consumption.
Effective solar shading is another key aspect to managing heat transmission while providing natural light, ventilation, and outdoor views, thus enhancing comfort and reducing HVAC loads. Voronkova and Podlasek [29] addressed glare and overheating issues at the University of Warsaw Library, emphasizing the need for improved solar control. Dabaj, Rahbar, and Vojdani Fakhr [30] found that venetian blinds are more effective than perforated solar screens in minimizing glare in an Iranian library reading room, demonstrating the importance of balancing daylight with user comfort. Wen et al. [31] used a multi-objective genetic algorithm to optimize shading strategies in a Shanghai university library, revealing that north-facing serrated windows and vertical slats effectively reduce glare while maintaining satisfactory illuminance levels compared to alternative designs. Zhang and Li [32] investigated window opening and solar shading in a tropical educational building, identifying the WWR as influential in energy use, daylight access, and occupant comfort. The capability of multi-objective optimization is additionally highlighted by Miao et al. [33] demonstrating significant reductions in energy consumption and enhanced occupant comfort by dynamically adapting architectural designs to future climate scenarios.
Innovative daylighting and renewable energy systems are also key components for fostering sustainable architecture. Noorzai et al. [34] analyzed the performance of vertically mounted photovoltaic (PV) integrated shading devices to optimize both daylighting and energy efficiency in educational buildings. Bande et al. [35] designed a parametric dynamic façade for a library extension, achieving substantial reductions in energy consumption and an improvement in daylight analysis. Garcia-Fernandez and Omar [36] proposed integrating solar systems, nanomaterials, and a novel lighting system in the Alexandria Library to enhance daylight availability and energy consumption while preserving its architectural identity. Furthermore, Xue, Wang, and Wang [37] developed a mobile-app-controlled smart shading device that adjusts to block direct sunlight based on sensor data and user preferences, thereby enhancing visual comfort.
As libraries transform into dynamic spaces that serve diverse community functions, the need for environments prioritizing user comfort and energy efficiency has become increasingly important. Despite significant advancements in library design, many existing studies focus on isolated elements of IEQ or energy efficiency, often overlooking the interactions between these components. This study addresses these gaps by creating and evaluating an energy-efficient and comfortable library environment that combines interior lighting design, solar shading strategies, and renewable energy system. Specifically tailored for a new library unit in a temperate humid climate in Turkiye, this integrated approach utilizes computer simulations to assess multiple factors simultaneously. The key objectives are: (1) to develop an interior lighting system that satisfies the visual comfort needs of library users; (2) to analyze how different external shading devices can effectively control solar gains and minimize cooling requirements; (3) to evaluate daylight performance through both static and climate-based dynamic daylight metrics; (4) to gauge thermal comfort based on Fanger’s comfort indices; and (5) to examine the overall impact of lighting automation, solar shades, and PV panels on total annual energy consumption and operational carbon emissions, to identify solutions that achieve a balance between energy efficiency, user comfort, and adherence to national and international building performance standards.
2. Materials and Method
The study commenced with the design proposal of an interior lighting system for a library, developed using DIALux Evo 13.1, in compliance with visual comfort standards outlined in BS EN 12464-1:2021 [8]. Key factors, such as maintained illuminance (Ēm), illuminance uniformity (UO), color rendering index (Ra), and unified glare rating (RUGL), were emphasized in the design. Following the lighting design, solar shading strategies were evaluated using the DesignBuilder v7 interface. Additionally, rooftop PV panels were integrated into the model.
Energy simulations were conducted using the EnergyPlus v9.4 engine to perform iterative performance comparisons between the base case and solar shading alternatives. Climate datasets were obtained in typical meteorological year (TMY) format [38]. This process generated annual operational end-use energy data for lighting, cooling, and heating, which were subsequently converted into primary energy and carbon emissions using government-regulated factors: 1 for natural gas and 1.677 for electricity, with carbon emission factors of 0.234 for natural gas and 0.478 for electricity [39].
According to the national building energy performance classification (EPC) system, new constructions in Turkiye are graded from the most efficient Class A (where EP < 0.4 × PEI and GHGP < 0.4 × GHG) to the least efficient Class C (where 0.8 × PEI ≤ EP < PEI and 0.8 × GHG ≤ GHGP < GHG). For new educational buildings located within the third heating degree-day (HDD) zone, the primary energy indicator (PEI) is set at 255 kWh/m2/a, while the greenhouse gas reference indicator (GHG) is 45 kg CO2 eq/m2/a [40]. Compliance with the national Building Energy Performance Directive (BEP) [41] was assessed, determining the EPC based on primary energy consumption (EP) and the greenhouse gas emission (GHGP) class based on end-use energy consumption.
The ASHRAE-55 [42] standard defines thermal comfort as a predicted mean vote (PMV) value within ±0.5, which corresponds to a predicted percentage of dissatisfied (PPD) of up to 10% (Category I). A PMV range of ±0.7 and a PPD of less than 15% is considered an acceptable level of thermal comfort (Category II) for typical applications in most new and existing buildings. According to EN 16798-1 [43], a PMV of ±0.2 and a PPD of less than 6% correspond to Category A (I), which are optimal thermal comfort conditions for spaces occupied by vulnerable groups such as the elderly, children, and individuals with disabilities. Category B (II) is defined by a PMV of ±0.5 and a PPD of less than 10%, representing the recommended thermal comfort for offices and residences. For each scenario, the thermal sensation of library users during the occupied period of the year was analyzed using the PMV and PPD metrics and benchmarked against ASHRAE-55 [42] Category II (±0.7 PMV; PPD < 15%) and EN 16798-1 [43] Category B (±0.5 PMV; PPD < 10%).
Further, the annual daylight performance for each scenario was assessed utilizing the average daylight factor (aDF) and climate-based daylight modeling (CBDM) metrics through Radiance simulations. The results were assessed for compliance with established limits and thresholds for aDF, useful daylight illuminance (UDI), annual sunlight exposure (aSE), and spatial daylight autonomy (sDA) [44,45,46,47,48].
The aDF was calculated as the ratio of interior daylight illuminance to that on an unobstructed horizontal surface under CIE overcast sky conditions, using a median external diffuse (zenith) illuminance of 19,000 lux [49]. The BS EN 17037 [49] standard requires a minimum daylight factor of 2.6% for libraries in Turkiye to achieve 500 lux illumination for 50% of daylight hours. BS 8206-2 [50] recommends that a daylight factor of 5% or higher indicates a sufficiently lit environment that generally does not require artificial lighting.
For the CBDM evaluation, annual daylighting simulations were conducted using dynamic blinds (LM-83-12), aligned with the zone occupancy schedule (08:00–18:00) and excluding unlit hours [48]. The working plane height was set at 0.76 m (desk height) above the floor, with a 0.30 × 0.30 m grid spaced 0.5 m from the walls. According to the UDI method, a lower threshold of 300 lux was set for inadequate lighting and an upper threshold of 2000 lux for excessive lighting, which may cause visual discomfort, targeting at least 50% of the floor area during occupied hours. The sDA calculations assessed whether a minimum illuminance threshold of 500 lux can be maintained by daylight alone for 55% of the floor area, which is suitable for library reading areas. Additionally, the aSE metric quantified the number of hours a space is exposed to sunlight to identify potential instances of visual discomfort, glare, and undesirable heat gain. The aSE threshold is set at 250 h annually for 10% of the library floor area receiving over 1000 lux [51].
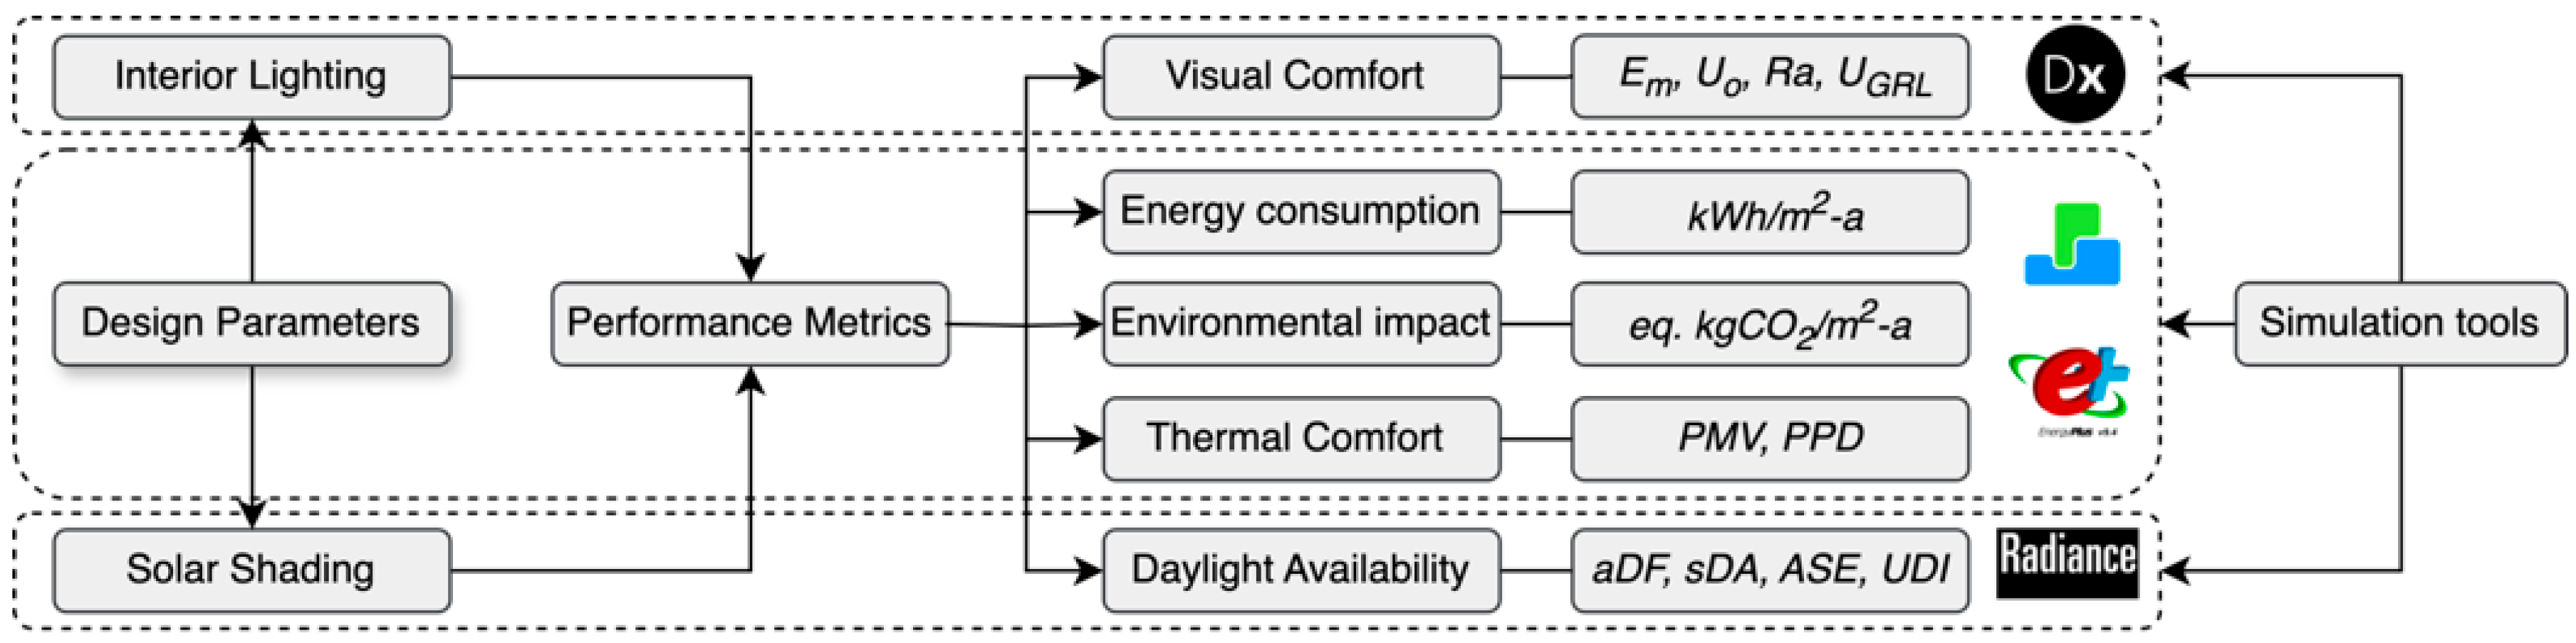
The overall workflow of the study is illustrated in Figure 1, which outlines the data collected from each simulation tool during the analysis. Table 1 provides a summary of the key simulation inputs, performance metrics, and regulatory benchmarks adopted in this research.
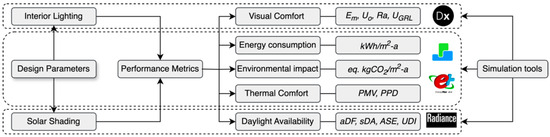
Figure 1.
The workflow in the modeling and simulation process.

Table 1.
Simulation parameters, metrics, and compliance standards and thresholds.
2.1. Case Study
This study explores the architectural potential of converting a loft into a library space, revitalizing underutilized areas to foster a sense of community and continuity in public spaces. By transforming the existing roof, the project aims to create a functional environment that meets the current needs of students and academic staff.
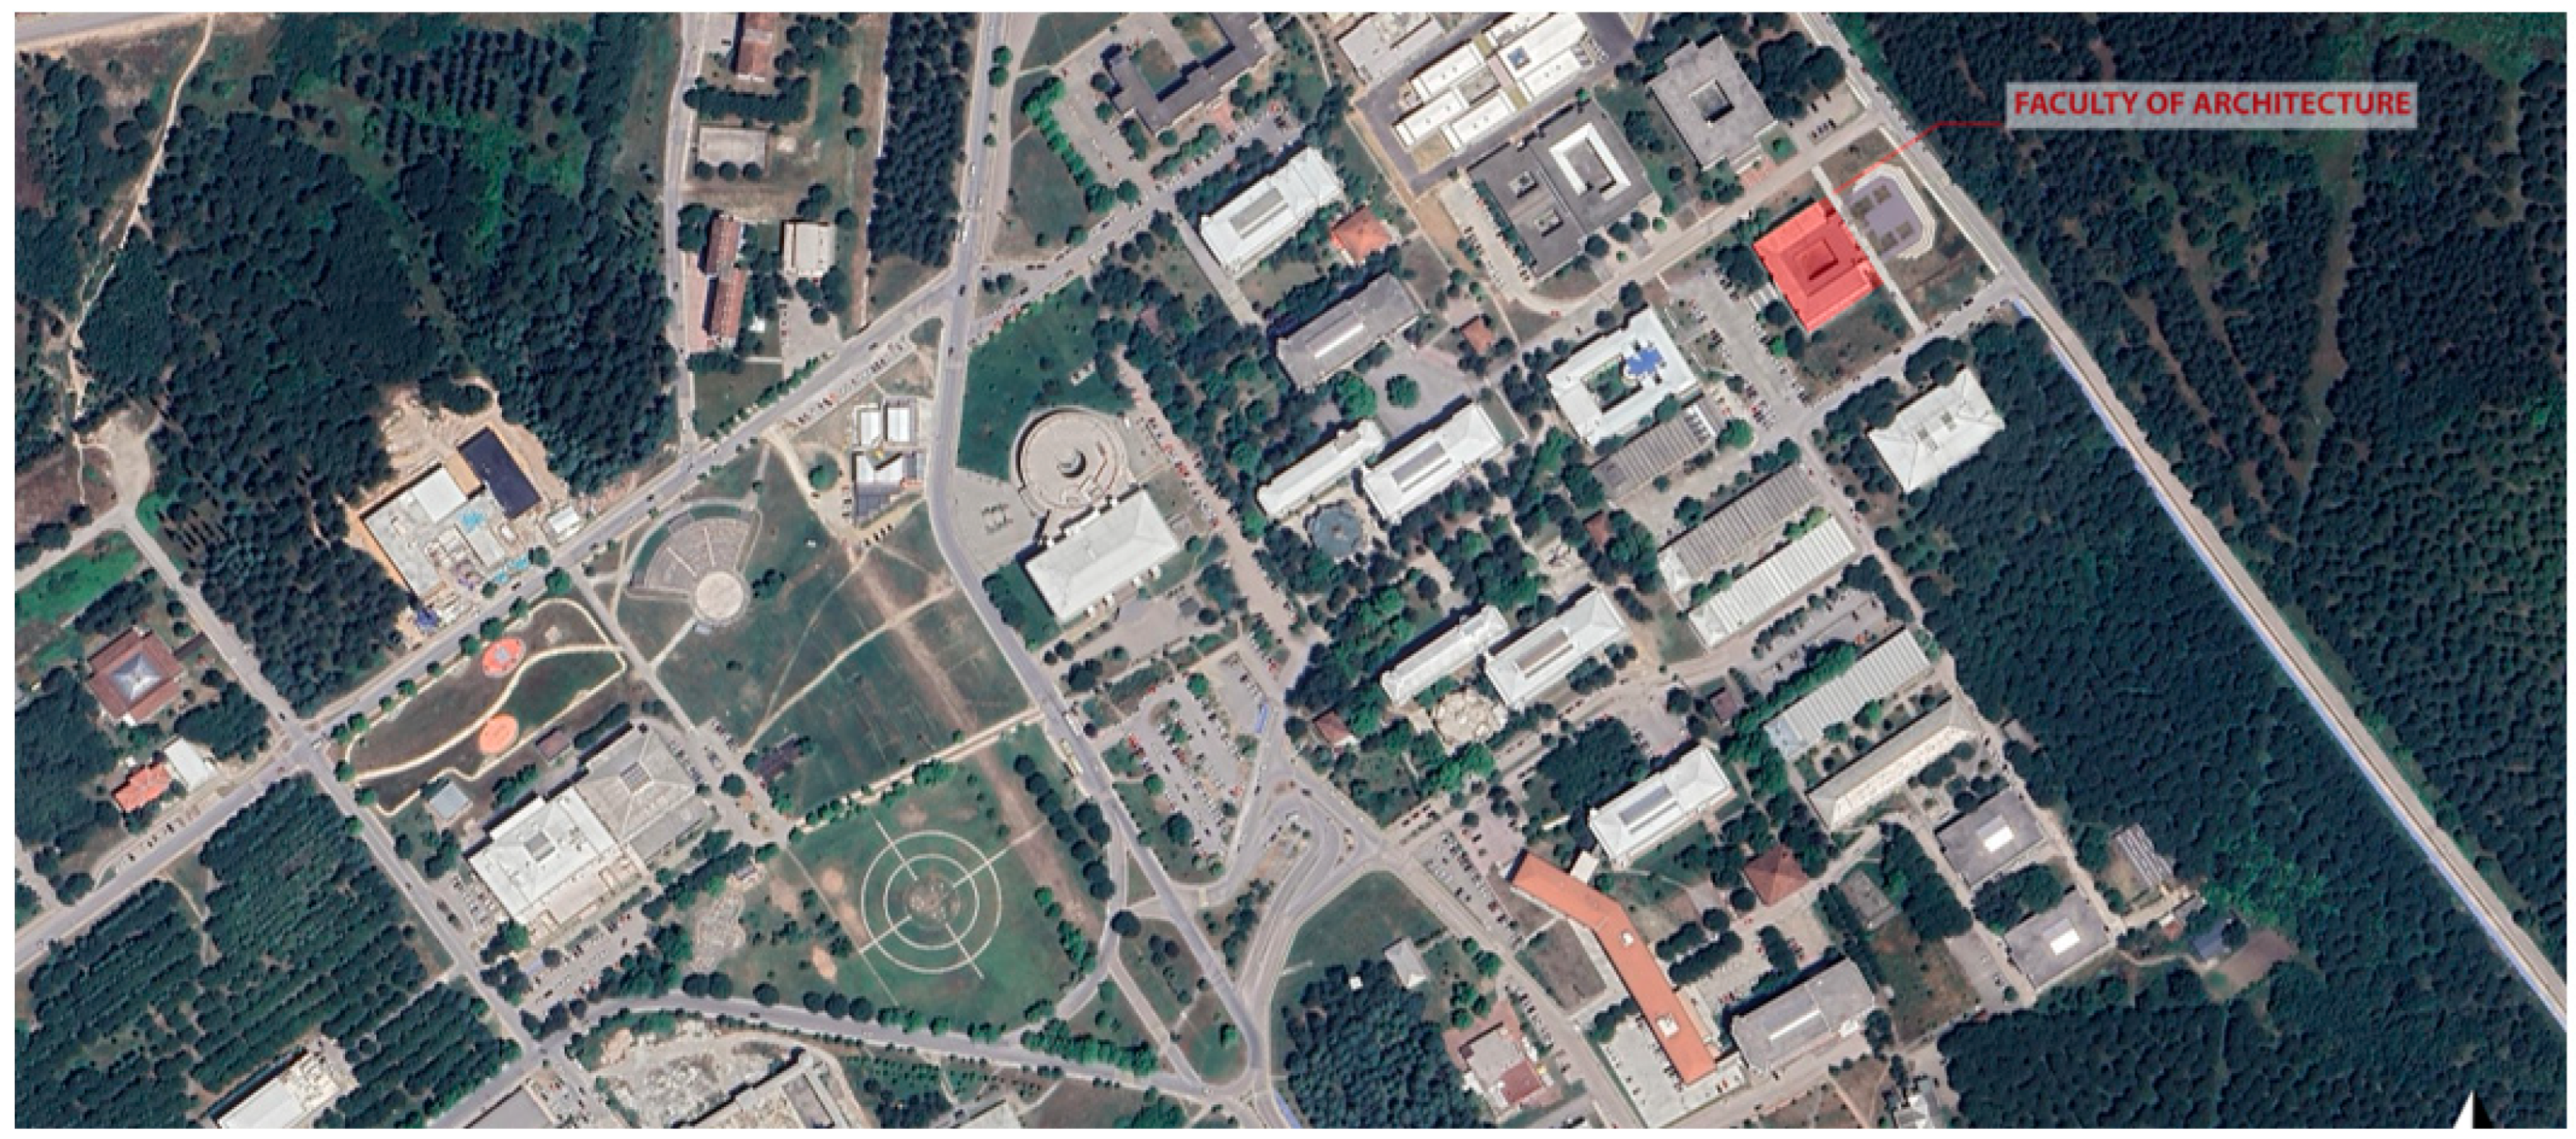
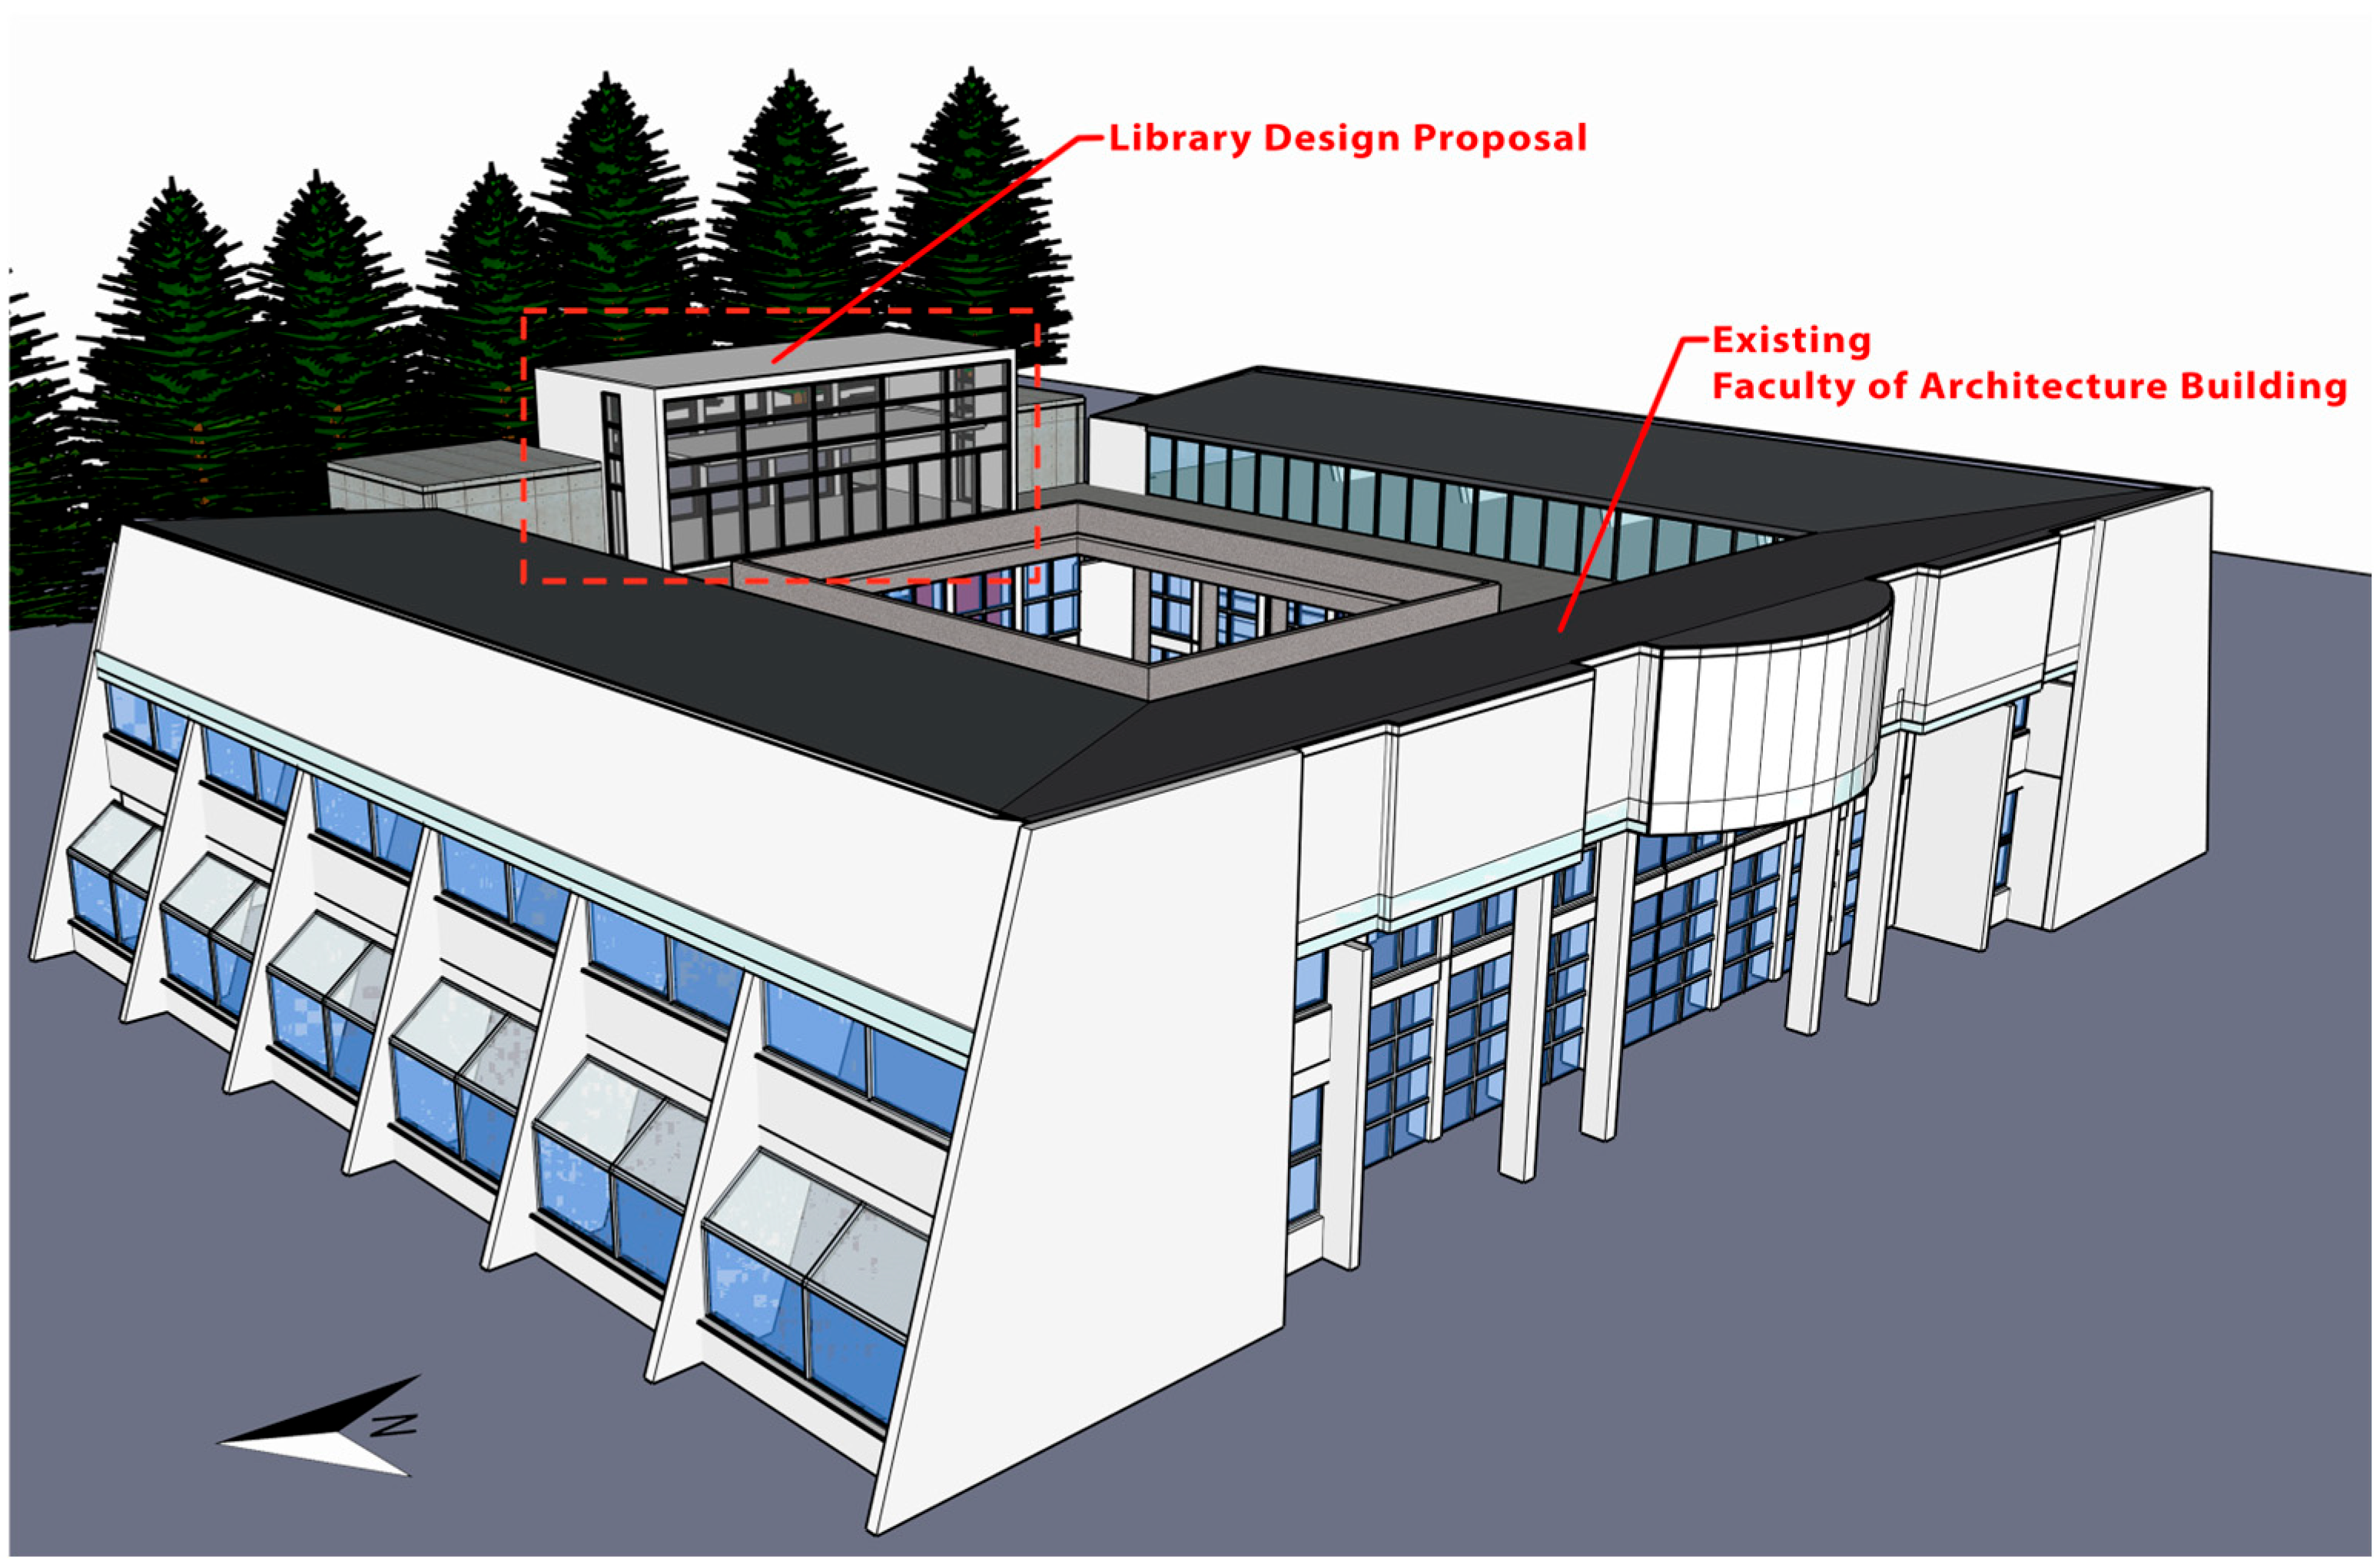
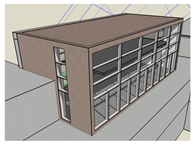
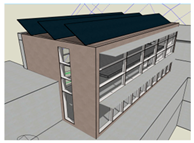
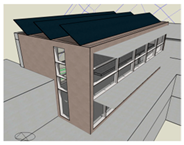
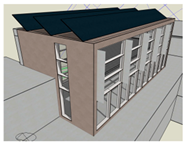
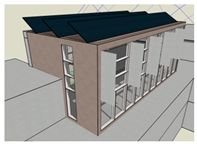
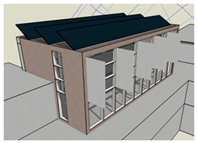
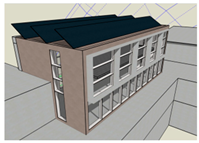
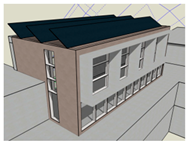
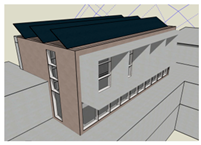
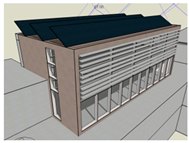
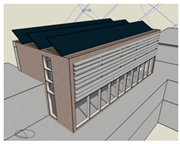
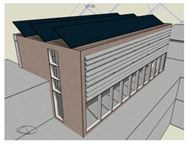
The new library addition will be integrated into the existing Bursa Uludag University (BUÜ) Faculty of Architecture building in northwestern Turkiye. The original skillion roof has been replaced with a terrace, providing additional outdoor space and expanding classroom capacity. The library will occupy the northern end of the flat roof, with its envelope designed to harmonize with the architectural features of the existing building. Design considerations include window proportions and the northeast façade’s concrete columns, which serve as structural shading elements. An aerial photograph of the campus area and a 3D perspective of the proposed library are presented in Figure 2 and Figure 3, respectively.

Figure 2.
Aerial photograph of the BUÜ campus area, highlighting the case study building [52].
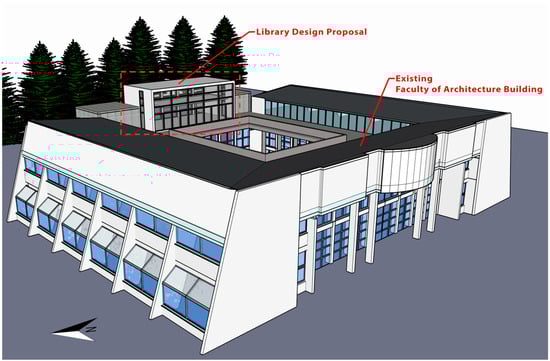
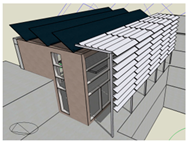
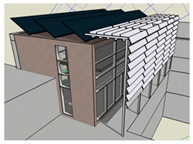
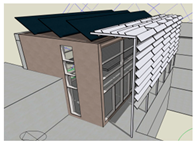
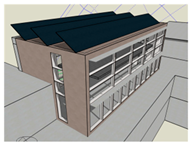
Figure 3.
3D visualization of the library addition’s integration with the existing faculty building (SketchUp model by author).
The new library unit has approximately 150 m2 gross area divided among two floors: a ground floor and a mezzanine floor. A visual connection between indoor and outdoor spaces is established through fully glazed main facades. The transparent perimeter of the library offers unobstructed views of the university’s forestland to the northeast and the faculty building’s terrace and courtyard to the southwest. The building also benefits from natural daylight through vertical openings in the side walls. The site analysis confirms no shading risk from adjacent faculty buildings (12 m tall at 50 m distance) or vegetation (approximately 20 m tall pine trees, located 60 m to the northeast), ensuring year-round unimpeded daylight access.
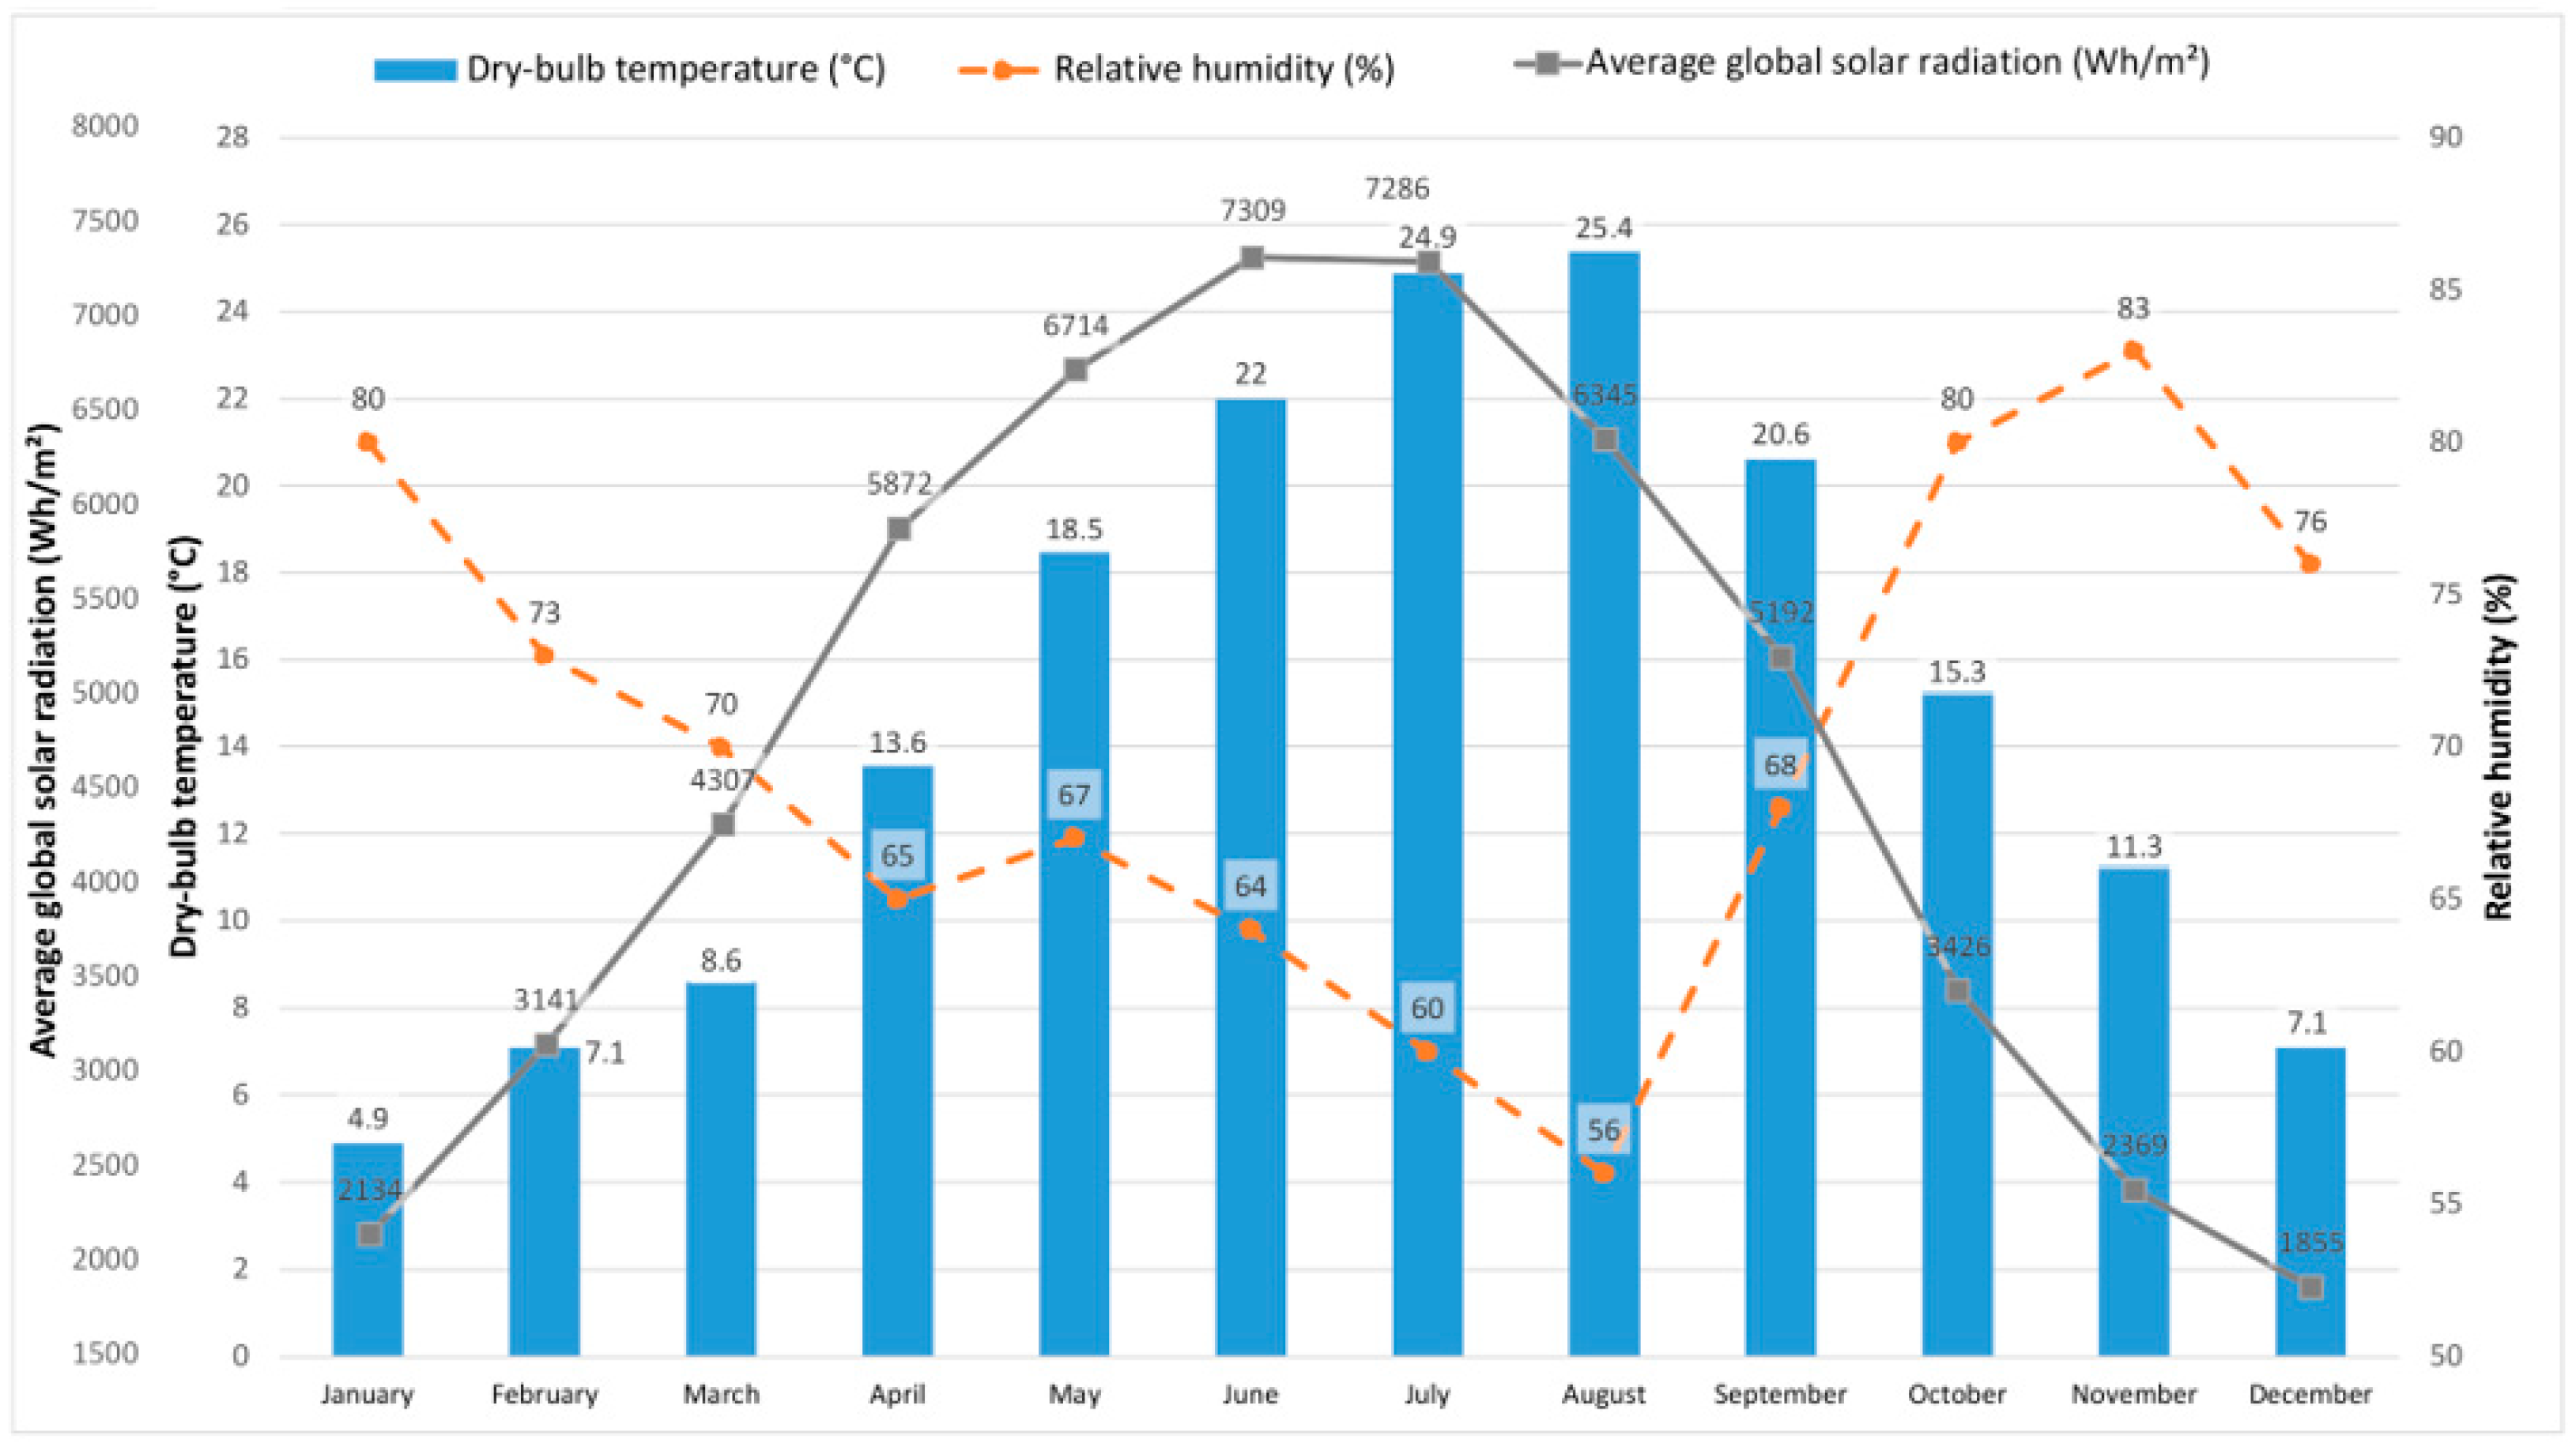
The graph in Figure 4 illustrates the monthly distribution of dry-bulb temperature (°C), relative humidity (%), and average solar radiation (Wh/m2) for the study region. These data were adapted from the TMY records spanning 2009–2023, representing Bursa’s temperate humid climate zone [38]. Table 2 outlines the boundary conditions and parameter settings used in the simulation models.
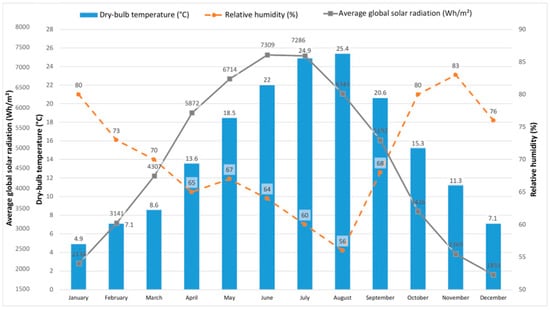
Figure 4.
Monthly variations in solar radiation, temperature, and humidity (2009–2023 TMY data) for Bursa, Turkiye (climate data adapted from [38]; visualization by the authors).
Table 2.
Boundary conditions and parameter settings for simulation model.
2.2. Interior Lighting Design
Firstly, an electric lighting system is designed for the new library addition. The main objective is to meet the indoor library lighting requirements in BS EN 12464-1:2021 [8], ensuring compliance with the threshold values for Ēm, UO, Ra, and RUGL in Table 3. The maintained average cylindrical illuminance (Ēm,z) for perceiving objects and people within this space, wall illuminance (Ēm,wall), and ceiling illuminance (Ēm,c) for room brightness, along with illuminance uniformity are calculated. The mean ambient illuminance (Ēamb) is also determined using the equation below and verified to satisfy the range 200 lx < Ēamb < 500 lx, in accordance with the same standard.
Ēamb = (Ēv wall1 + Ēv wall2 + Ēv wall3 + Ēv wall4 + Ēceiling)/5
Table 3.
Lighting requirements for library interiors [8].
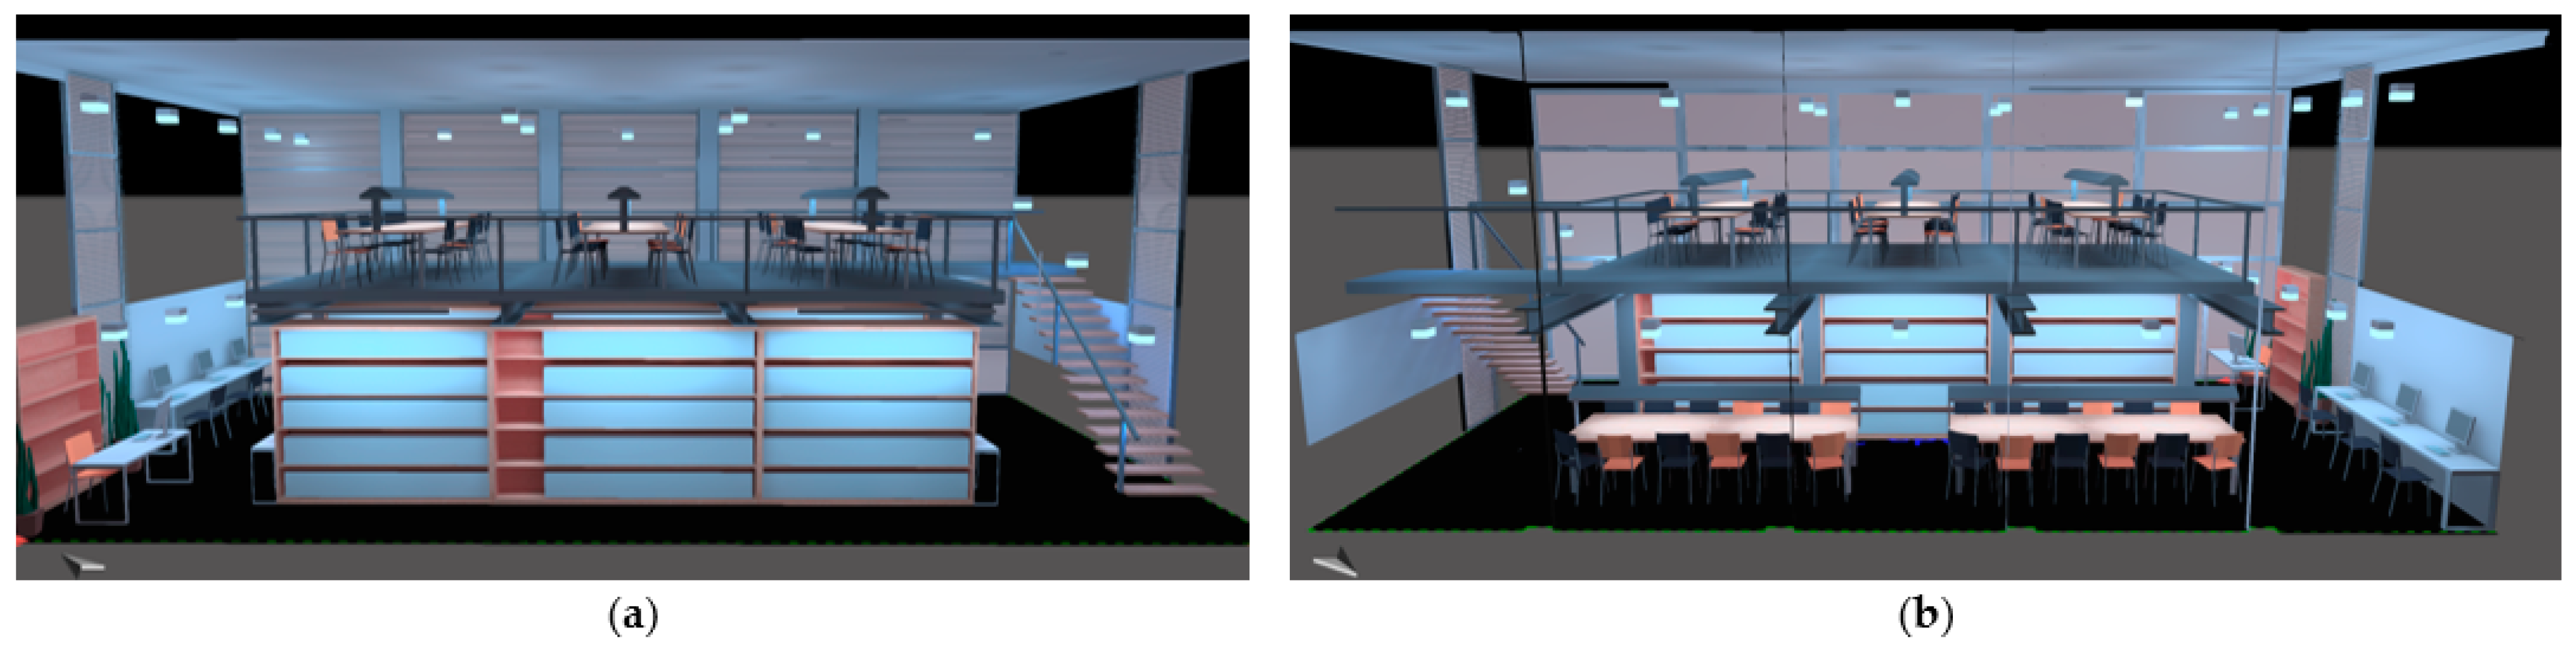
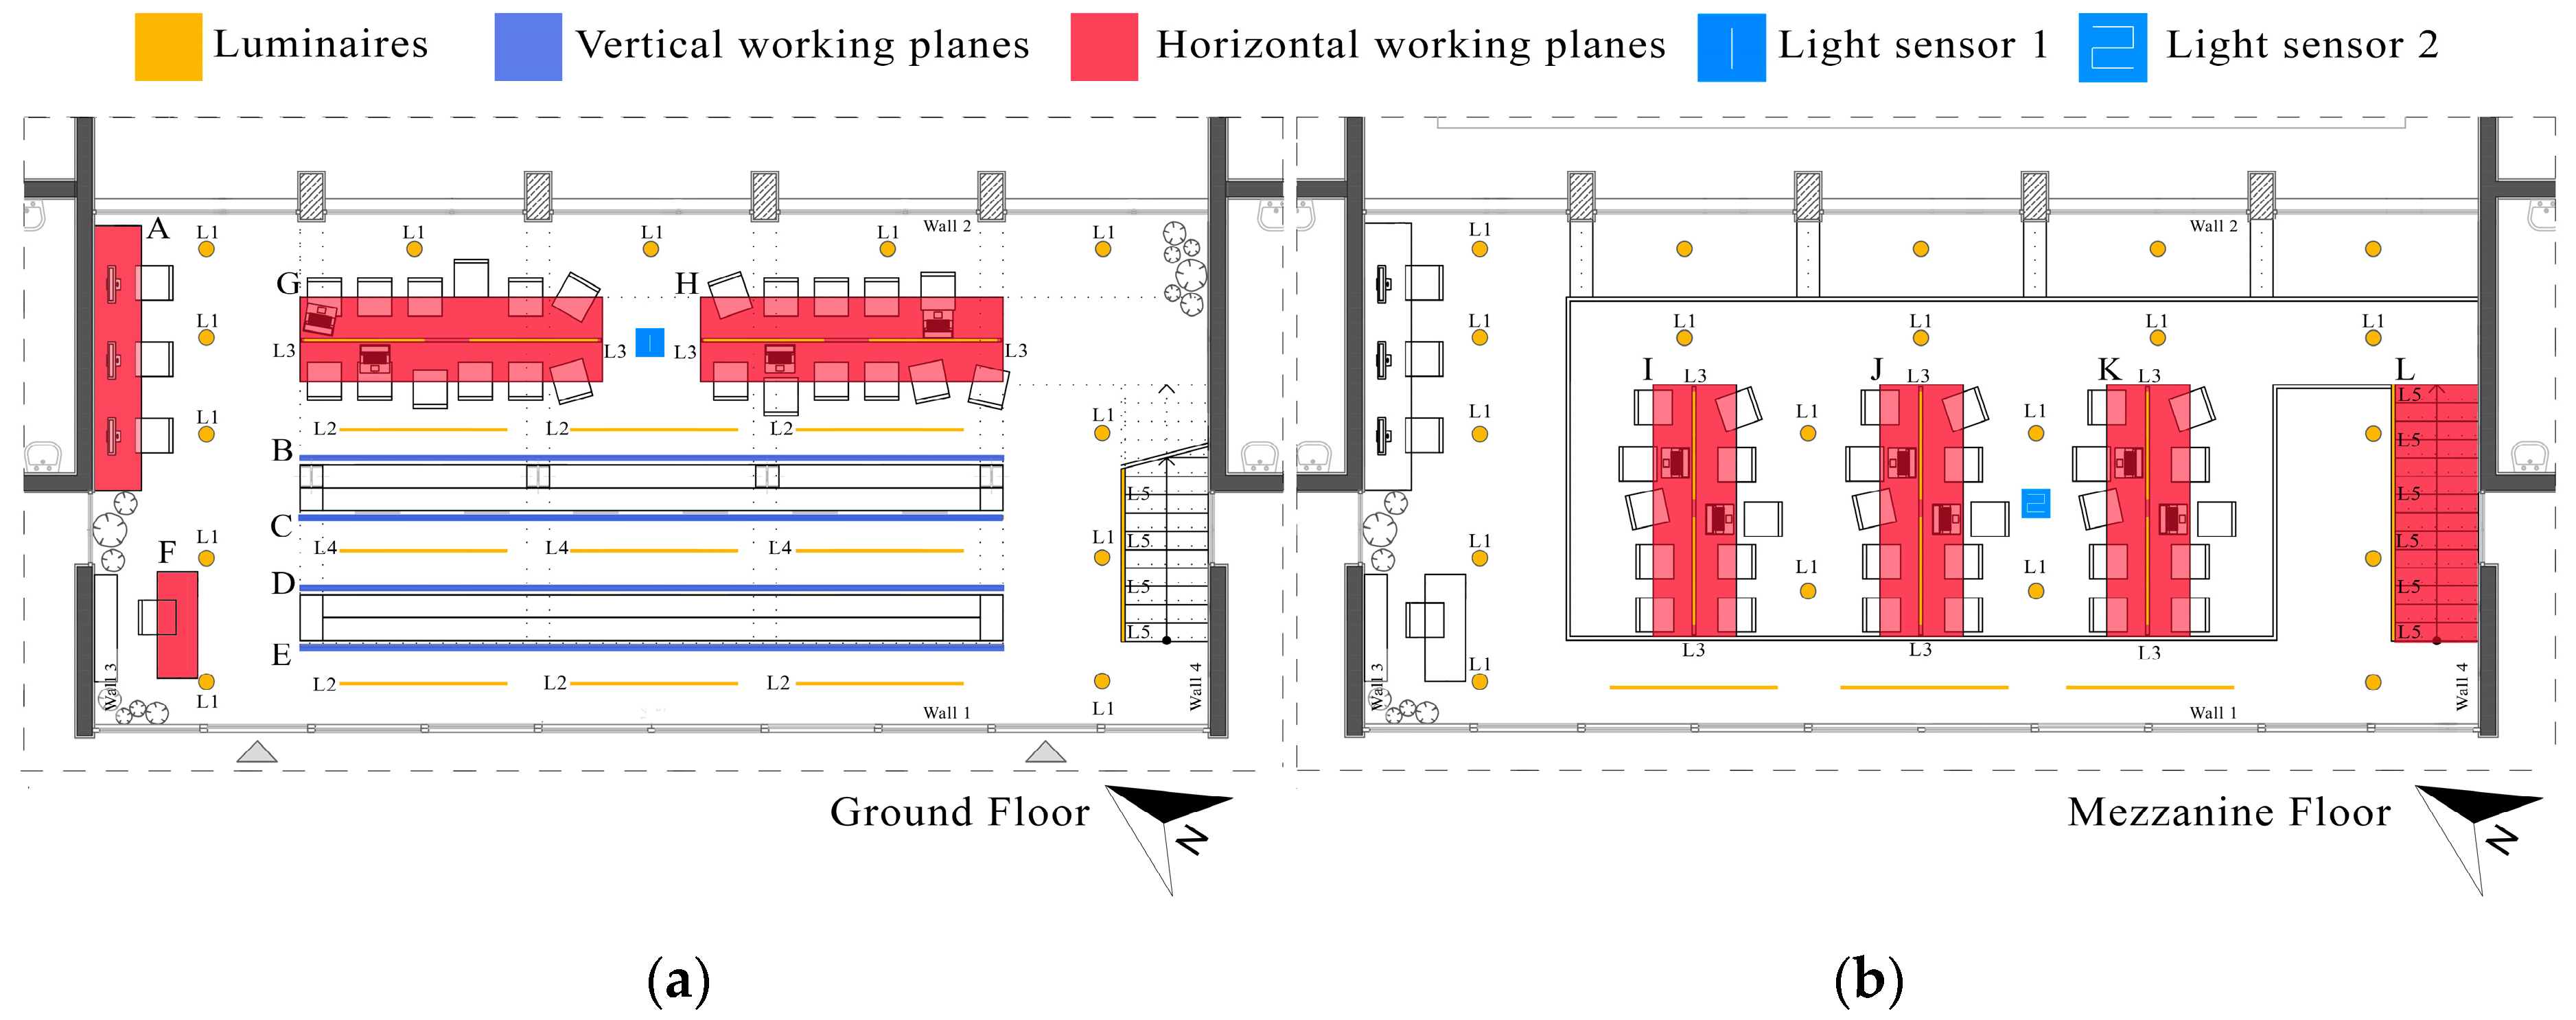
The building layout consists of two rows of book stacks with four study carrels, two reading areas (one on the mezzanine floor), a computer workstation and librarian desk, and an info point. As a passive design strategy, the bookshelves are arranged in rows parallel to the southwest façade, with reading areas oriented toward the northeastern landscape. Figure 5 illustrates the library’s 3D visuals from the southwest (a) and northeast (b) façades. Figure 6 displays the furnished floor plans, including the lighting system layout. Luminaires are marked in yellow and labeled L1 through L5. Electric lighting and daylighting levels were evaluated for both vertical and horizontal reference working planes (see Figure 6).
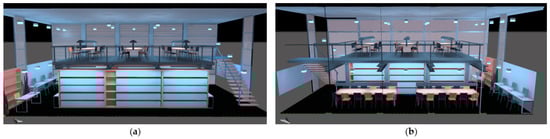
Figure 5.
DIALux Evo 3D model visuals of the library from (a) the southwest façade; (b) northeast façade.
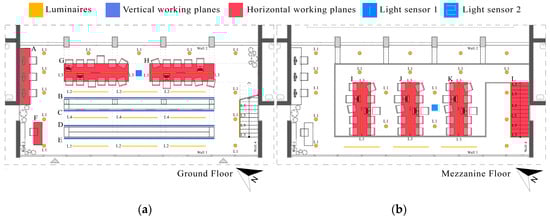
Figure 6.
Overlay of architectural and lighting plans for (a) the ground floor; (b) the mezzanine floor.
After reviewing different indoor lighting products from the DIALux library [56], dimming-compatible luminaires were selected for this study due to their luminous efficacy, color characteristics, light distribution type, interior design of the space, and task-specific needs. The selected LED lamps feature a color temperature of 3000 K and a color rendering index (CRI) ranging from 80 to 90. Table 4 presents the luminaires used in the indoor lighting project (L1 to L5), along with their product features, areas of application, and technical data.
Table 4.
Technical specifications of luminaires used in the library project (data sourced from DIALux Luminaire Finder [56]).
Globe luminaires (L1) are used throughout the library for general lighting, creating a comfortable atmosphere with soft, uniform, and shadow-free illumination. During daylight hours, the general lighting level is adjusted by light sensors and supplemented by linear rows of pendant and surface-mounted luminaires (L2, L4) installed on the mezzanine ceiling, centered above the aisles. The goal is to achieve even light distribution across the shelves through an asymmetrical and downward-directed lighting scheme, ensuring that adequate light reaches the bottom of the stack. Additionally, six LED strips (L5), each 1 m in length, are placed beneath the handrail to illuminate circulation areas. For task lighting, furniture-mounted luminaires (L3) are selected to illuminate the reading tables, increasing local illuminance on the working plane to 500 lux while maintaining a minimum general lighting level of 300 lux. Discomfort glare (RUGL) is another visual requirement monitored on the reading areas, workstations, and the librarian counter, where computer-based tasks are performed.
The simulations compare daylighting and electric lighting performance for the base case and the best-performing scenario across typical working hours (9:00, 12:00, 15:00, and 17:00) and seasonal conditions: December 21st (Commission Internationale de l’Eclairage—CIE overcast sky), March 21st (CIE intermediate sky), and June 21st (CIE clear sky). Ēm and UO values are calculated for the reference working planes, along with the daylight factor (DF), which represents the ratio of interior illuminance to outdoor illuminance from an unobstructed hemisphere under a CIE overcast sky.
Data from DIALux Evo, including luminaire types and power density values for both general and task lighting, were integrated into the DesignBuilder energy model. The target illuminance is set at 500 lux, which is necessary for visual tasks such as reading and typing. Two daylight sensors are positioned at ceiling height—one beneath the mezzanine floor and the other beneath the roof slab (see Figure 6)—to ensure consistent illuminance throughout the library during operating hours year-round, and to track lighting energy consumption under different solar shading scenarios. The integration of lighting automation optimizes lighting energy consumption by dynamically dimming general lighting in response to daylight levels, maintaining a linear correlation between daylight availability and artificial light output. When daylight levels reach the minimum dimming threshold of 500 lux, the electric lighting is completely turned off.
2.3. Solar Shading Design
The library’s northeast façade features an internal solar shading system composed of medium-reflectivity Venetian blinds (ρ = 0.5) with a 30° slat angle. Positioned 5 cm behind the glazing, the blinds optimize early-morning daylight penetration while diffusing natural light uniformly across the space during daytime hours. To optimize daylight availability and mitigate glare, dynamically controlled blinds (ρ = 0.5) are installed on the southwestern façade, designed in compliance with the Illuminating Engineering Society (IES) LM-83-23 method [51].
For the external solar shading strategy, fifteen design alternatives featuring steel blades (ρ = 0.70) were evaluated to manage solar gains and glare while minimizing total annual energy use. The first three shading scenarios (S1–S3) incorporate brise soleil systems, comprising fixed vertical slats mounted on an aluminum frame, positioned 2 m from the glazing. The subsequent solar shading scenarios include horizontal overhangs (S4–S6) and side fins (S7–S9), extending 0.5 m, 1 m, and 1.5 m from the southwest façade; egg crate configurations (S10–S12), featuring interconnected horizontal and vertical elements at matching depths; and fixed louver systems (S13–S15) with slat angles of 15°, 30°, and 45°. Table 5 provides 3D visualizations of the solar shading scenarios investigated in this study, offering a comparative overview of their geometric configurations and spatial relationships.
Table 5.
3D visualizations of solar shading scenarios (generated in DesignBuilder by author).
Simulations were initially conducted for the base case, which assumed continuous operation of the lighting system during the library’s occupied hours, without any internal or external shading strategies. Subsequent simulations were performed to evaluate the impact of integrating lighting automation with solar shading options on the building’s total annual energy use, thermal comfort, and daylight availability.
3. Results
3.1. Energy Use and Carbon Emissions
The solar shading scenarios were evaluated, generating annual operational end-use energy data for lighting, cooling, and heating. As illustrated in Figure 7, the reference scenario—without daylight-dependent lighting automation—revealed that cooling loads dominated total primary energy consumption at 61.1% (97.1 kWh/m2/a), driven by solar and internal heat gains. Heating and lighting accounted for 19.4% (30.8 kWh/m2/a) and 19.5% (31 kWh/m2/a), respectively. Fixed shading scenarios demonstrate higher heating energy use compared to the base case, reflecting reduced solar heat gain during winter months and highlighting the inherent trade-offs between heating and cooling demands. Despite this, the solar shading designs achieve a lower total annual primary energy consumption than the base case, enhancing overall energy performance and reducing environmental impact.
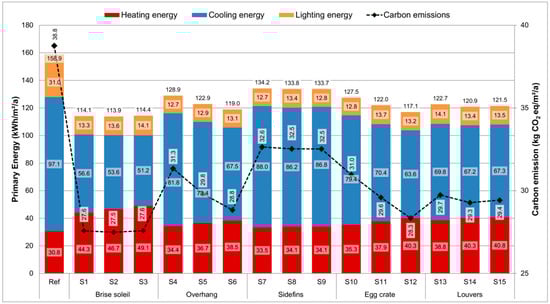
Figure 7.
Building energy simulation results: base case vs. solar shading alternatives.
For primary energy and operational carbon emissions, values peak in side fins scenarios (e.g., 134.2 kWh/m2/a and 32.6 kg CO2 eq/m2/a for S7) and reach the lowest levels in brise soleil configurations, indicating superior performance. Among the evaluated alternatives, the fixed brise soleil design (S2)—with a slat angle of 30° and a depth of 0.4 m—emerges as the most energy-efficient.
In this optimal scenario, the major energy use is incurred by cooling, accounting for 47.1% (53.6 kWh/m2/a), followed by heating at 41% (46.7 kWh/m2/a) and lighting loads at 11.9% (13.6 kWh/m2/a). Compared to the base case, S2 reduces total annual primary energy by 28.3%, CO2 emissions by 29.1%, and cooling demand by 44.8%, while increasing heating energy by 51.7%; photosensors further cut lighting energy use by 56.2%. Notably, 1.5 m overhangs (S6) and egg crate designs (S12) also outperform the base case in overall efficiency.
The base case attained a Class B energy performance index (EP: 158.9 kWh/m2/a) for primary energy consumption and a Class C carbon emissions index (GHGP: 38.8 kg CO2 eq/m2/a) for end-use energy. The PV system generates 129.7 kWh/m2 of electricity, fully offsetting the building’s lighting and cooling energy demands. This enhancement upgrades the building’s energy and greenhouse gas performance to Class A across all evaluated solar shading scenarios.
3.2. Interior Lighting
The DIALux Evo results for electric lighting and daylighting simulations—evaluated under the summer and winter solstices, the equinox, and nighttime conditions—are summarized in Table 6 for both the reference case and the best-performing brise soleil scenario (S2). Horizontal working plane heights are set at 0.76 m for PC workstation (A), counter (F), and reading tables (G–K), and stair level (0 m) for stairs (L). Vertical working planes for bookshelves (B–E) span a range (0.4–1.8 m) to accommodate different user postures and ensure ergonomic flexibility, including the seated (1.20 m) and standing (1.60 m) eye levels. The maintained average cylindrical illuminance (Ēm,z) and its uniformity (UO,z) are calculated for the same area size for each type of task, but the height of the horizontal plane is positioned at 1.20 m for seated (A, G–K) and at 1.60 m (B–F, L) for standing users.
Table 6.
Simulation results for daylighting and electric lighting: base case (ref) vs. brise soleil (S2).
A three-color background scale in Table 6 visually contrasts the base case and S2, highlighting performance differences. Light levels falling to meet the threshold values for Ēm, UO, or DF or rising to exceed RUGL limits are marked in red. Values approaching the visual comfort threshold appear in yellow, while optimal values are shown in green. Daylight levels surpassing 2000 lux, indicating potential glare or unwanted solar gains, are also flagged in red.
For electric lighting, the requirements for illuminance and glare control are met in accordance with BS EN 12464-1:2021 [8]. The required maintained average illuminance on walls (Ēv,wall1: 244 lx; Ēv,wall2: 236 lx; Ēv,wall3: 264 lx; Ēv,wall4: 228 lx), the maintained average illuminance on the ceiling (Ēceiling: 195 lx), and illuminance uniformity (UO,wall1: 0.46; UO,wall2: 0.32; UO,wall3: 0.16; UO,wall4: 0.12; UO,ceiling: 0.46) all comply with the standard (see Table 3). The calculated mean ambient illuminance (Ēamb: 233 lx) also falls within the recommended range (see Equation (1)). However, the RUGL value on the vertical working plane of the bookshelves exceeds the standard limits, but this is exempt under BS EN 12464-1:2021 [8].
Daylight simulations in Table 6 indicate that neither the base case nor the brise soleil scenario (S2) achieves adequate daylight levels in the library during the winter solstice, particularly at 09:00 and 17:00. This shortfall necessitates supplemental electric lighting in critical areas—specifically bookshelf aisles beneath the mezzanine floor (C, D) and upstairs reading tables (I–K)—where the daylight factor (DF) consistently falls below 5% on overcast winter days. During the equinox and summer solstice, illuminance levels vary significantly by location and working plane orientation. While both scenarios generally meet minimum illuminance requirements during operating hours, bookshelves under the mezzanine continue to underperform, falling short of daylight adequacy.
On the other hand, the unshaded base case exhibits excessive illuminance, particularly on the afternoon of June 21st for SW-facing surfaces (e.g., Ēm: 24,503 lx for ref. vs. 1096 lx for S2 at Counter F), raising concerns about photodegradation risks for the collection (bookshelf E). In contrast, scenario S2 effectively resolves these issues by controlling excessive illuminance, reducing peak values, and improving light distribution uniformity—particularly at reading tables (G–K)—without compromising functional lighting standards.
3.3. Daylight Availability
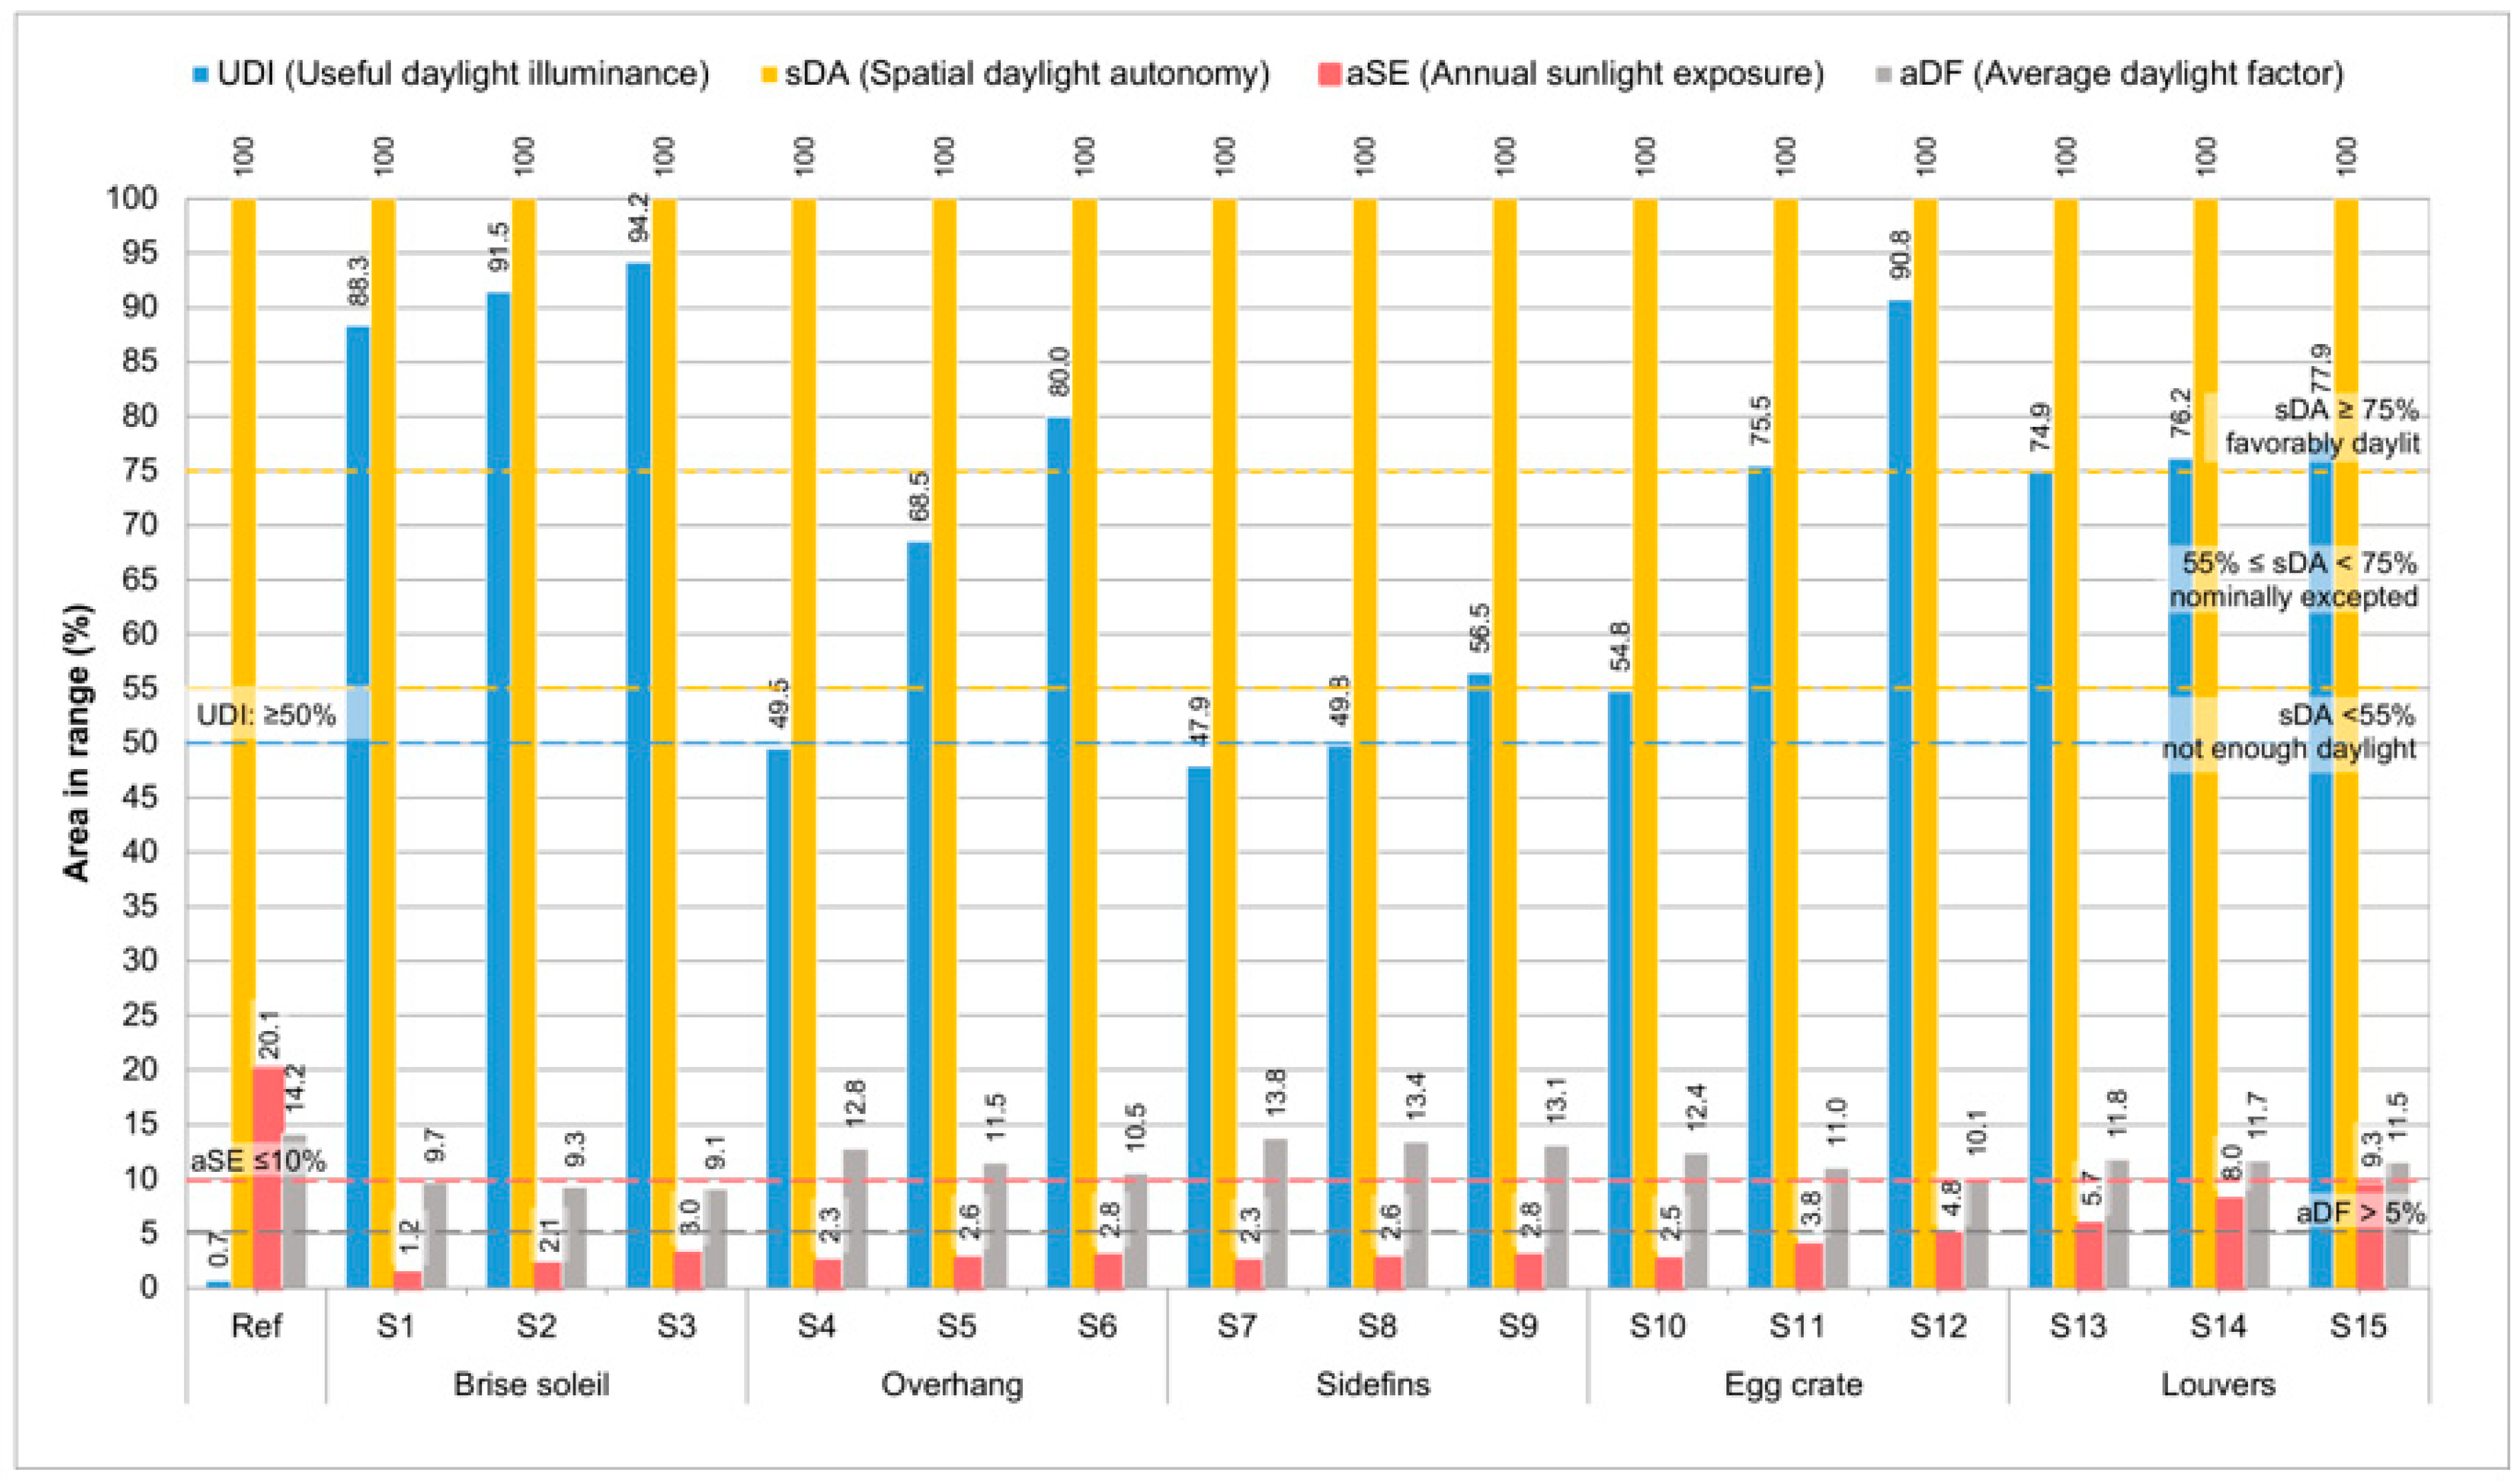
The library’s daylight availability was evaluated under both static and dynamic conditions, confirming compliance with the established thresholds for aDF and CBDM metrics. Figure 8 illustrates the percentages of floor area within the specified range that satisfy the required criteria for annual daylighting performance.

Figure 8.
Daylighting performance simulation results: Reference case vs. solar shading alternatives.
The analysis reveals that all shading strategies met the minimum threshold of 2.6% and exceeded the 5% aDF target. The unshaded base case achieved the highest aDF (14.16%), while brise soleil configurations (S1–S3) yielded lower values, ranging from 9.1% to 9.7%.
All scenarios fully satisfied the sDA300lx>55% criterion, confirming sufficient and evenly distributed daylight for library activities such as reading and typing. However, this compliance in certain cases led to exceeding the UDI300–2000lx>50% upper threshold (2000 lx). As illustrated in Figure 8, the base case exhibited a critically low UDI (0.7%), indicating risks of glare and dependence on interior blinds, whereas overhangs (S4) and side fins (S7, S8) failed to achieve UDI target (>50%), with less than half of the floor area within the ideal range. The brise soleil designs (S1–S3) achieved the best balance, with UDI values up to 94.2%.
The base case’s high aSE1000/250h<10% (20.1%) underscored risks of glare and overheating—issues effectively mitigated by all shading alternatives (aSE < 10%). Overall, brise soleil configurations emerged as the most advantageous solar shading strategies, balancing daylight adequacy (sDA) with visual comfort (UDI, aSE).
3.4. Thermal Comfort
The thermal comfort conditions of both the base case and the solar shading design options were evaluated using Fanger’s comfort indices. Table 7 presents the monthly average indoor operative temperature (Top, °C), relative humidity (Rh, %), and thermal comfort simulation results during library operational hours. A three-color background scale is used to visually compare the base case with design alternatives, highlighting performance variations in Table 7. Optimal PMV and PPD values (−0.5 < PMV < +0.5, PPD < 10%) are indicated in green, values approaching the thermal comfort thresholds (−0.7 < PMV < +0.7, PPD < 15%) are shown in yellow, and discomfort-indicating values are highlighted in red.
Table 7.
Thermal comfort simulation results comparing the base case with solar shading alternatives.
The simulation results reveal that in the unshaded base case, the thermal sensation index (PMV) exceeds 0.70, indicating slightly warm conditions, with over 15% of occupants likely dissatisfied (PPD) from June to October. Solar shading strategies improve thermal comfort by reducing monthly average operative temperatures by 1–2 °C during summer months (e.g., July: 28.09 °C → 26.5 4°C with brise soleil S3) and maintaining indoor relative humidity within acceptable ranges (40–60%), despite a slight increase (2–5%) due to reduced solar heat gain. Shading alternatives shifted PMV levels closer to the neutral and lowered PPD values, reflecting fewer dissatisfied occupants (e.g., July PMV: 0.89 → 0.46 and PPD: 22.59% → 9.54% with brise soleil S3).
As shown in Table 7, among all shading options, only the brise soleil S3 consistently maintains PMV within ±0.5 and PPD below 10%, complying with ASHRAE-55 [42] Category I and EN 16798-1 Category B thresholds year-round. S1 and S2 also demonstrate robust performance by mitigating peak temperatures, enhancing thermal comfort (PMV ±0.7, PPD <15%), and potentially reducing cooling loads.
4. Discussion and Conclusions
The proposed framework offers a replicable model for transforming underutilized roof spaces into library environments that effectively balance user comfort, energy efficiency, and daylight availability through a comprehensive approach that integrates both passive and active design parameters.
This study initially highlights the significance of interior lighting design in creating a sustainable, user-centered library that promotes an engaging and productive learning environment. Key criteria include task lighting for reading areas, bookshelves, and PC workstations, selecting appropriate luminaires and managing light levels through automation. The proposed interior lighting design complies with the BS EN 12464-1:2021 standard for visual comfort, incorporating daylight-responsive controls and dimmable LED technology to achieve a 54.3–58.9% reduction in lighting energy use.
The study secondly highlights the critical role of shading systems in building envelope design by reducing solar gain, cooling loads, and glare while ensuring adequate daylight. CBDM metrics enable a collective evaluation of both daylight availability and sunlight management, with high UDI and sDA values indicating beneficial daylight levels for tasks, while low aSE values reflect effective sunlight control. As highlighted in previous studies [13,16,24,26], daylight availability metrics, in conjunction with building performance simulations, empower designers to enhance daylight distribution, thereby promoting both energy efficiency and user comfort.
Similar studies in the literature have shown that horizontal overhangs effectively shade windows from direct sunlight, especially during high sun angles in summer, while vertical side fins provide targeted shading for east- and west-facing windows, and egg crate systems offer shading across various sun angles [23,30,31]. However, among the evaluated shading alternatives, brise soleil configurations—particularly for the southwest façade—emerged as optimal solutions, demonstrating a better balance of energy consumption, user comfort and daylight availability. The findings reveal that, despite a 51.7% increase in heating energy use, the overall energy performance of the most effective design solution S2 (slat angle of 30°, depth of 0.4 m) improves by 28.3%, and operational carbon emissions decrease by 29.1% compared to the unshaded base case. The brise soleil option S3 (slat angle of 45°, depth of 0.4 m) meets thermal comfort criteria (PMV ±0.5, PPD < 10%) aligning with ASHRAE 55 Category I and EN 16798-1 Category B standards. Meanwhile, two other brise soleil options (S1, S2) maintain an elevated yet acceptable thermal performance (PMV ±0.7, PPD < 10%), effectively filtering sunlight and mitigating overheating risks associated with the building’s high WWR. Additionally, they achieved favorable daylight metrics, maintaining an aDF greater than 5%, UDI over 50%, and sDA exceeding 75%, while keeping aSE below 10%. However, overhangs (0.5 m) and side fins (0.5–1.0 m) underperform, exhibiting UDI values below 50%. The integration of PV panels also significantly improves the building’s energy performance by meeting the total annual electrical loads for cooling and lighting in each solar shading scenario.
This study demonstrates that integrating lighting and solar shading strategies can significantly enhance building performance, particularly in library settings. Through simulation-based analyses aligned with established standards, our research identifies design interventions that improve both thermal and visual comfort while also reducing annual energy consumption and operational CO2 emissions. Unlike previous studies that often focused on singular aspects of building performance in libraries—such as investigations of IEQ [5,6], visual comfort and lighting systems [9,10,11,12,15,16] or energy efficiency [22,36]—this research integrates multiple strategies—lighting design and automation, solar shading, and PV panels—within a unified framework. While not exhaustive of all building performance factors (e.g., acoustics, air quality, psychological environment, spatial ergonomics, and material sustainability), this approach advances beyond isolated analyses by explicitly addressing the interplay between daylight availability, visual and thermal comfort, and energy consumption in Turkiye’s temperate climate. The study thus provides a more comprehensive perspective on library design, bridging gaps in the literature and emphasizing the need to balance competing priorities.
While this study contributes valuable insights into enhancing library design through integrated lighting and solar shading strategies, several limitations must be acknowledged. First, the research specifically targets academic libraries, which may limit the applicability of the findings to other workspace environments, such as classrooms and offices, that have different user requirements and operational characteristics. Each design alternative presents unique benefits and challenges, and the selection of optimal strategies is contingent upon various factors, including local climate, building orientation, user preferences, aesthetic considerations, regulatory frameworks, technological advancements, and budget constraints. Furthermore, the reliance on simulation-based analyses introduces uncertainties, as the accuracy of the results is influenced by assumptions regarding user behavior and occupancy patterns that might not accurately represent real-world conditions. Additionally, the design strategies were evaluated in a temperate climate, which could affect their efficiency in different climatic zones or under varying climate conditions, thereby limiting the generalizability of the findings.
To enhance the robustness and applicability of future research, long-term performance evaluations should be conducted across diverse case studies and climate zones, addressing practical implementation challenges and climate change scenarios. Optimization algorithms could be leveraged for multi-criteria decision making, balancing energy efficiency, user comfort, cost, and environmental impact. These efforts must be grounded in field measurements of real-world parameters (e.g., daylight availability, glare perception, energy use) and user assessments (e.g., occupant surveys, post-occupancy evaluations) to refine design outcomes. Future studies should also incorporate model calibration and validation protocols using empirical data, alongside metrics like daylight autonomy (DA) and daylight glare probability (DGP) to assess annual daylight sufficiency and visual comfort under dynamic conditions. Post-occupancy evaluations will provide critical insights into real-time user experiences, enabling the refinement of lighting and shading designs based on actual usage patterns. By examining the adaptability of these strategies to evolving user demands—particularly in the digital age and post-pandemic context—this approach can foster more responsive, user-centric library spaces that effectively meet comfort and energy efficiency goals over time.
Author Contributions
Conceptualization, E.K. and B.M.; methodology, E.K.; software, E.K.; validation, E.K. and B.M.; formal analysis, E.K.; investigation, E.K.; resources, E.K. and B.M.; data curation, E.K.; writing—original draft preparation, E.K.; writing—review and editing, B.M.; visualization, E.K.; supervision, B.M.; project administration, B.M. All authors have read and agreed to the published version of the manuscript.
Funding
This research received no external funding.
Data Availability Statement
The data used to support the findings of this study are available from the corresponding author upon reasonable request.
Acknowledgments
The authors would like to thank Özgür Ediz for his significant contributions to the architectural design of the library.
Conflicts of Interest
The authors declare no conflicts of interest.
References
- Cha, S.H.; Kim, T.W. What Matters for Students’ Use of Physical Library Space? J. Acad. Librariansh. 2015, 41, 274–279. [Google Scholar] [CrossRef]
- Zhang, Z. The effect of library indoor environments on occupant satisfaction and performance in Chinese universities using SEMs. Build. Environ. 2019, 150, 322–329. [Google Scholar] [CrossRef]
- Peng, L.; Wei, W.; Fan, W.; Jin, S.; Liu, Y. Student Experience and Satisfaction in Academic Libraries: A Comparative Study among Three Universities in Wuhan. Buildings 2022, 12, 682. [Google Scholar] [CrossRef]
- Li, L.H.; Wu, F.; Su, B. Impacts of Library Space on Learning Satisfaction—An Empirical Study of University Library Design in Guangzhou, China. J. Acad. Librariansh. 2018, 44, 724–737. [Google Scholar] [CrossRef]
- Aflaki, A.; Esfandiari, M.; Jarrahi, A. Multi-Criteria Evaluation of a Library’s Indoor Environmental Quality in the Tropics. Buildings 2023, 13, 1233. [Google Scholar] [CrossRef]
- Akanmu, W.P.; Nunayon, S.S.; Eboson, U.C. Indoor environmental quality (IEQ) assessment of Nigerian university libraries: A pilot study. Energy Built Environ. 2021, 2, 302–314. [Google Scholar] [CrossRef]
- Qashqari, A.; Jefferies, T. Improve Thermal Performance and comfortable Design of Public Library Located in Middle Eastern Regions Facing Drastic Climate Change. Proc. IOP Conf. Ser. Earth Environ. Sci. 2024, 1363, 012090. [Google Scholar] [CrossRef]
- BS EN 12464-1:2021; Light and Lighting of Workplaces: Part 1-Indoor Workplaces, CEN/TC 169. European Committee for Standardization: Bruge, Belgium, 2021.
- Lin, J.; Hedekvist, P.O.; Mylly, N.; Bollen, M.; Shen, J.; Xiong, J. Human-Centric and integrative lighting asset management in public libraries: Qualitative insights and challenges from a Swedish field study. IEEE Access 2024, 12, 40905–40921. [Google Scholar] [CrossRef]
- Kan-Kilic, D.; Hasirci, D. Daylighting Concepts for University Libraries and Their Influences on Users’ Satisfaction. J. Acad. Librariansh. 2011, 37, 471–479. [Google Scholar] [CrossRef]
- Manav, B.; Kutlu, R.; Küçükdoğu, M.Ş. Analyzing the lighting design and suggestions on human-centric lighting at IKU library. In Proceedings of the 10th National Lighting Congress, (ATMK), İstanbul, Turkey, 16–18 April 2015; pp. 25–32. [Google Scholar]
- Şener, F.; Köknel-Yener, A. Lighting principles in libraries and investigation of a case study. In Proceedings of the 7th National Lighting Congress, (ATMK), İstanbul, Turkey, 27–28 November 2008; pp. 147–154. [Google Scholar]
- Yu, X.; Su, Y. Daylight availability assessment and its potential energy saving estimation—A literature review. Renew. Sustain. Energy Rev. 2015, 52, 494–503. [Google Scholar] [CrossRef]
- Shao, Z.; Li, Y.; Huang, P.; Abed, A.M.; Ali, E.; Elkamchouchi, D.H.; Abbas, M.; Zhang, G. Analysis of the opportunities and costs of energy saving in lightning system of library buildings with the aid of building information modelling and Internet of things. Fuel 2023, 352, 128918. [Google Scholar] [CrossRef]
- Balocco, C.; Volante, G. A method for sustainable lighting, preventive conservation, energy design and technology—Lighting a historical church converted into a university library. Sustainability 2019, 11, 3145. [Google Scholar] [CrossRef]
- Lo Verso, V.R.M.; Fregonara, E.; Caffaro, F.; Morisano, C.; Peiretti, G.M. Daylighting as the driving force of the design process: From the results of a survey to the implementation into an advanced daylighting project. J. Daylighting 2014, 1, 36–55. [Google Scholar] [CrossRef]
- Nasrollahi, N.; Shokry, E. Parametric analysis of architectural elements on daylight, visual comfort, and electrical energy performance in the study spaces. J. Daylighting 2020, 7, 57–72. [Google Scholar] [CrossRef]
- Boyden, L.; Weiner, J. Sustainable libraries: Teaching environmental responsibility to communities. Bottom Line 2000, 13, 74–83. [Google Scholar] [CrossRef]
- Xuan, W.; Hongyan, L. Energy Saving and Green Building Design of Libraries: The case study of Zhengzhou Library. In Proceedings of the World Library and Information Congress, 77th IFLA General Conference and Assembly, San Juan, Puerto Rico, 13–18 August 2011; pp. 25–32. [Google Scholar]
- Afacan, Y. Sustainable library buildings: Green design needs and interior architecture students’ ideas for special collection rooms. J. Acad. Librariansh. 2017, 43, 375–383. [Google Scholar] [CrossRef]
- Shane, J. Perspectives on positioning your library for solar (and financial) gain: Improving energy efficiency, lighting, and ventilation with primarily passive techniques. J. Acad. Librariansh. 2012, 38, 115–122. [Google Scholar] [CrossRef]
- Omar, O.; Garcia-Fernandez, B.; Fernandez-Balbuena, A.A.; Vazquez-Molini, D. Optimization of daylight utilization in energy saving application on the library in faculty of architecture, design and built environment, Beirut Arab University. Alex. Eng. J. 2018, 57, 3921–3930. [Google Scholar] [CrossRef]
- Liu, Q.; Ren, J. Research on the building energy efficiency design strategy of Chinese universities based on green performance analysis. Energy Build. 2020, 224, 110242. [Google Scholar] [CrossRef]
- Gao, Y.; Zhao, S.; Huang, Y.; Pan, H. Multi-objective optimization of daylighting–thermal performance in cold-region university library atriums: A parametric design approach. Energies 2025, 18, 1184. [Google Scholar] [CrossRef]
- Bai, W.; Guo, W.; He, Y.; Wu, Y.; Liang, S.; Zhang, S. Research on the optimization design of the atrium space form in university libraries based on the coupling of daylighting and energy consumption. Buildings 2024, 14, 2715. [Google Scholar] [CrossRef]
- Xu, S.; Chen, Y.; Liu, J.; Kang, J.; Gao, J.; Qin, Y.; Tan, W. Comprehensive improvement of energy efficiency and indoor environmental quality for university library atrium: A multi-objective fast optimization framework. Front. Archit. Res. 2025, 14, 449–470. [Google Scholar] [CrossRef]
- Zhou, Y.; Wang, W.; Wang, K.; Song, J. Application of LightGBM Algorithm in the Initial Design of a Library in the Cold Area of China Based on Comprehensive Performance. Buildings 2022, 12, 1309. [Google Scholar] [CrossRef]
- Cui, X.; Ahn, C.-W. Multi-Objective Optimization of Natural Lighting Design in Reading Areas of Higher Education Libraries. Buildings 2025, 15, 1560. [Google Scholar] [CrossRef]
- Voronkova, I.; Podlasek, A. The use of transparent structures to improve light comfort in library spaces and minimize energy consumption: A case study of Warsaw, Poland. Energies 2024, 17, 3007. [Google Scholar] [CrossRef]
- Dabaj, B.; Rahbar, M.; Vojdani Fakhr, B. Impact of different shading devices on daylight performance and visual comfort of a four opening sides’ reading room in Rasht. J. Daylighting 2022, 12, 47–65. [Google Scholar] [CrossRef]
- Wen, S.; Hu, X.; Hua, G.; Xue, P.; Lai, D. Comparing the performance of four shading strategies based on a multi-objective genetic algorithm: A case study in a university library. J. Build. Eng. 2023, 63, 105532. [Google Scholar] [CrossRef]
- Zhang, J.; Ji, L. Optimization and prediction of energy consumption, daylighting, and thermal comfort of buildings in tropical areas. Adv. Civ. Eng. 2022, 2022, 3178269. [Google Scholar] [CrossRef]
- Miao, Y.; Chen, Z.; Chen, Y.; Tao, Y. Sustainable architecture for future climates: Optimizing a library building through multi-objective design. Buildings 2024, 14, 1877. [Google Scholar] [CrossRef]
- Noorzai, E.; Bakmohammadi, P.; Garmaroudi, M.A. Optimizing daylight, energy and occupant comfort performance of classrooms with photovoltaic integrated vertical shading devices. Arch. Eng. Des. Manag. 2023, 19, 394–418. [Google Scholar] [CrossRef]
- Bande, L.; Hamad, H.; Alqahtani, D.; Alnahdi, N.; Ghunaim, A.; Fikry, F.; Alkhatib, O. Design of innovative parametric/dynamic façade integrated in the library extension building on UAEU campus. Buildings 2022, 12, 1101. [Google Scholar] [CrossRef]
- Garcia-Fernandez, B.; Omar, O. Integrated innovative solar lighting system for optimization of daylight utilization for public library in Alexandria, Egypt. Ain Shams Eng. J. 2023, 14, 101819. [Google Scholar] [CrossRef]
- Xue, J.; Wang, Y.; Wang, M. Smart design of portable indoor shading device for visual comfort: A case study of a college library. Appl. Sci. 2021, 11, 10644. [Google Scholar] [CrossRef]
- Climate.OneBuilding. Climate Data for Bursa, Turkiye. Available online: https://climate.onebuilding.org/WMO_Region_6_Europe/TUR_Turkiye/index.html#IDBU_Bursa- (accessed on 2 August 2024).
- Turkish Republic Ministry of Energy and Natural Resources. Primary Energy and Carbon Emissions Conversion Factors for Natural Gas and Electricity. Available online: https://webdosya.csb.gov.tr/db/meslekihizmetler/icerikler/elektr-k-enerj-s-n-n-b-r-nc-l-enerj--katsay-s--2025-20241213085049.docx (accessed on 15 February 2025).
- BEP-TR:2010; Building Energy Performance National Calculation Methodology. Republic of Turkey Official Gazette, 27778. Turkish Republic Ministry of Public Works and Settlement: Ankara, Turkey, 2010.
- BEP:2022; Regulation on the Amendment of the Energy Performance Regulation in Buildings (BEP). Republic of Turkey Official Gazette, 31755. Turkish Republic Ministry of Public Works and Settlement: Ankara, Turkey, 2022.
- ANSI/ASHRAE Standard 55:2023; Thermal Environmental Conditions for Human Occupancy. American Society of Heating, Refrigerating and Air Conditioning Engineers: Atlanta, GA, USA, 2023.
- CEN EN 16798-1:2019; Energy Performance of Buildings—Part 1: Indoor Environmental Input Parameters for Design and Assessment of Energy Performance of Buildings Addressing Indoor Air Quality, Thermal Environment, Lighting and Acoustics. Module M1-6. European Committee for Standardization (CEN): Brussels, Belgium, 2019.
- Nabil, A.; Mardaljevic, J. Useful daylight illuminances: A replacement for daylight factors. Energy Build. 2006, 38, 905–913. [Google Scholar] [CrossRef]
- Reinhart, C.F.; Mardaljevic, J.; Rogers, Z. Dynamic daylight performance metrics for sustainable building design. Leukos 2006, 3, 7–31. [Google Scholar] [CrossRef]
- Mardaljevic, J.; Heschong, L.; Lee, E. Daylight metrics and energy savings. Light. Res. Technol. 2009, 41, 261–283. [Google Scholar] [CrossRef]
- Heschong, L.; Wymelenberg, V.D.; Andersen, M.; Digert, N.; Fernandes, L.; Keller, A.; Loveland, J.; Mckay, H.; Mistrick, R.; Mosher, B. Approved Method: IES Spatial Daylight Autonomy (sDA) and Annual Sunlight Exposure (ASE); IES-Illuminating Engineering Society: New York, NY, USA, 2012. [Google Scholar]
- IESNA:2012; LM-83-12 IES Spatial Daylight Autonomy (sDA) and Annual Sunlight Exposure (ASE). IESNA Lighting Meas: New York, NY, USA, 2012.
- BS EN 17037+A1:2021; Daylight in Buildings. British Standards Institution (BSI): London, UK, 2021.
- BS 8206-2:2008; Lighting for Buildings—Part 2: Code of Practice for Daylighting. British Standards Institution (BSI): London, UK, 2008.
- ANSI/IES LM-83-23:2022; Approved Method: IES Spatial Daylight Autonomy (sDA) and Annual Sunlight Exposure (ASE). Illuminating Engineering Society: New York, NY, USA, 2022.
- Google LLC. Aerial Photograph of the Campus Area and the Case Study Building. Available online: https://earth.google.com/web/ (accessed on 22 February 2025).
- Beck, H.E.; Zimmermann, N.E.; McVicar, T.R.; Vergopolan, N.; Berg, A.; Wood, E.F. Present and future Köppen-Geiger climate classification maps at 1-km resolution. Sci. Data 2018, 5, 180214. [Google Scholar] [CrossRef]
- TSE: 2013; TS 825 Thermal Insulation Requirements for Buildings. Turkish Standards Institution: Ankara, Türkiye, 2013.
- Sisecam. Şişecam Facade Glass Catalogue: Glass Solutions for Facades. Available online: https://www.sisecam.com/tr/s-business-segments/s-flat-glass/Documents/Brosur/%C5%9Ei%C5%9Fecam%20Cephe%20Camlar%C4%B1.pdf (accessed on 10 February 2025).
- DIALux Luminaire Finder. Available online: https://luminaires.dialux.com/en#0 (accessed on 15 September 2024).


Disclaimer/Publisher’s Note: The statements, opinions and data contained in all publications are solely those of the individual author(s) and contributor(s) and not of MDPI and/or the editor(s). MDPI and/or the editor(s) disclaim responsibility for any injury to people or property resulting from any ideas, methods, instructions or products referred to in the content. |
© 2025 by the authors. Licensee MDPI, Basel, Switzerland. This article is an open access article distributed under the terms and conditions of the Creative Commons Attribution (CC BY) license (https://creativecommons.org/licenses/by/4.0/).