Review

Review of Condition Rating and Deterioration Modeling Approaches for Concrete Bridges

Department of Building and Real Estate, The Hong Kong Polytechnic University, Hong Kong, China
*
Author to whom correspondence should be addressed.
Buildings 2025, 15(2), 219; https://doi.org/10.3390/buildings15020219
Submission received: 5 December 2024 / Revised: 25 December 2024 / Accepted: 8 January 2025 / Published: 13 January 2025
(This article belongs to the Section Building Structures)

Abstract

:
Concrete bridges are the most prevalent bridge type worldwide, forming critical components of transportation infrastructure. These bridges are subjected to continuous deterioration due to environmental exposure and operational stresses, necessitating ongoing condition monitoring. Despite extensive research on condition rating and deterioration modeling of concrete bridges, a comprehensive and comparative understanding of these processes remains underexplored. This paper addresses this gap by conducting a critical scientometric and systematic review of condition rating and deterioration modeling approaches for concrete bridges to highlight their strengths and limitations. Accordingly, most of the condition rating methods were found to have a heavy reliance on qualitative visual inspections (VI) and inherent subjective assumptions. Techniques such as fuzzy logic and non-destructive evaluation (NDE) methods were identified as promising tools to mitigate uncertainties and enhance accuracy. Moreover, the performance of most deterioration models was dependent on the quality of the historical condition data. The advancement of hybrid deterioration models, such as integrating artificial intelligence (AI) with stochastic and physics-based approaches, has proven to be a powerful strategy, combining the strengths of each method to deliver enhanced condition predictions. Finally, this study offers key insights and future research directions to assist researchers and policymakers in advancing sustainable concrete bridge management practices.

1. Introduction

Bridges are vital components that provide connectivity across geographical barriers, facilitating transportation and supporting economic and social welfare. In the United States (US), there are over half a million bridges that play a crucial role in supporting the connectivity and efficiency of the nation’s transportation network [1]. This expansive infrastructure continuously deteriorates over time due to aging under exposure to environmental, operational, and mechanical deteriorating factors [2]. For instance, in the US more than 42% of the bridges are over 50 years old, with more than 42,000 bridges reported to be in poor condition. Moreover, in 2024, the number of bridges in fair condition have increased to more than 300,000 bridges as shown in Figure 1 [1]. Therefore, efficient bridge management is necessary to ensure the safety and functionality of these bridges [3].
Concrete bridges are the most common bridge types around the globe. As illustrated in Figure 2, 66% of existing bridges in the US are constructed with reinforced or prestressed concrete, highlighting the predominance of concrete structures [4]. Concrete bridges are subject to continuous deterioration which necessitates ongoing condition monitoring to effectively assess their condition and performance over time [5]. This necessitates the existence of rational and systematic bridge condition rating approaches. Condition rating is the assessment of the bridge’s current state relative to its as-built condition to provide a condition index [6]. Condition indices guide decision-making related to the maintenance, rehabilitation, and replacement of concrete bridges and ultimately support infrastructure sustainability and safety [7]. However, most existing indexes rely on subjective assumptions and are highly dependent on the expertise of inspectors, which introduces uncertainties in the condition rating [8].
The change in condition rating over time can be used to model the deterioration of bridge elements and components [9]. Reliable deterioration modeling facilitates efficient inspection planning, supports informed maintenance decisions, and ensures the long-term performance and safety of bridge infrastructure [10]. Deterioration models can be established using the historical data of condition ratings. Data-driven deterioration models can be realized via statistical, stochastic, and artificial intelligence (AI) approaches [11]. In addition, deterioration models can be established through physical-based methods through simulation and finite element models [12]. Given the variety of deterioration modeling methods, it can be challenging to identify the model that performs best in a specific scenario.
Although condition rating and deterioration modeling for concrete bridges have been intensively studied in the literature, there remains a lack of comprehensive and comparative understanding of these processes. The diversity of condition rating methods in the literature and industry necessitates a comprehensive analysis to identify their limitations and guide future research efforts toward meaningful improvements. The commonly used condition rating methods heavily rely on the subjective judgment of inspectors and are based on subjective assumptions. This subjectivity introduces uncertainty into the overall condition rating of bridges and their components. The quality of condition rating methods affects the performance of subsequent deterioration modeling. Similarly, the diverse range of deterioration modeling approaches underscores the importance of examining and comparing these methods to evaluate their applicability in specific scenarios, identify their limitations, and guide future research toward achieving significant advancements. Few review studies have touched on these crucial aspects; Di Mucci et al. [13] studied the use of artificial intelligence for bridge structural health management in terms of condition inspection and condition forecasting. In addition, Srikanth and Arockiasamy [14] provided computational examples of deterioration models for timber and concrete bridges, while Ibrahim et al. [2] discussed the deterioration factors for concrete bridge decks. To the best of our knowledge, this is the first study to provide a comprehensive review of condition rating and forecasting for concrete bridges. Accordingly, this review paper aims to fill knowledge gaps in this critical area.
To address the research gap in concrete bridge condition rating and deterioration modeling, this study conducts a comprehensive and comparative review analysis of the existing condition rating and forecasting for concrete bridges. This paper examines the state-of-the-art in condition rating and deterioration modeling to inform and guide future advancements in this critical area. In this study, scientometric and systematic analyses were employed to perform a comprehensive literature review of 124 journal articles following the established PRISMA protocol [15]. This review performs an in-depth comparative analysis of various condition rating and deterioration methods for concrete bridges and their components. This study evaluates the strengths and weaknesses of these methods, providing insights into their applicability and offering recommendations for their suitability in different scenarios. Finally, insightful recommendations and future research directions are outlined to guide researchers and transportation agencies to achieve sustainable concrete bridge management.

2. Materials and Methods

Figure 3 illustrates the methodology of the current study, in accordance with PRISMA protocols [15], performed in three consecutive stages: (1) conducting a research query on the Scopus database, (2) screening to exclude irrelevant papers and snowballing to include relevant papers not appearing in the query, and (3) performing a comprehensive scientometric and systematic review.
In the first stage, the review objectives guided the selection of keywords for the search query. The review goal was to comprehend concrete bridge condition rating and condition prediction to identify research gaps and outline future research needs. Subsequently, the query was conducted on the Scopus database to identify relevant publications. Scopus is widely recognized as one of the largest and most comprehensive literature databases [16,17]. The search query was designed as follows: (TITLE-ABS-KEY (concrete AND (bridge OR bridges)) AND TITLE-ABS-KEY ((condition AND (rating OR index OR prediction)) OR (deterioration AND modeling))). This broad search returned 1787 publications.
In the second stage, the search was constrained to articles between 2004 and 2025 in the subject area of engineering and using the English language. In addition, the unrelated keywords were excluded. This refinement reduced the number of publications to 298. Subsequently, the titles and the abstracts were skimmed to exclude more irrelevant publications. Consequently, the number of publications was reduced to only 143 articles. During the full-text review, 48 articles were further excluded, considering the divergence of their focus. Additionally, snowballing was performed to identify missed articles, and another 29 articles were added to the recognized articles. Finally, the number of articles considered for the current study was 124.
The retained articles were studied using scientometric and systematic analysis. The scientometric analysis was accomplished using VOSviewer_1.6.18 [18] and the Bibliometrix R package [19]. The analysis was performed to recognize publication trends and identify prominent authors, institutions, journals, and countries. Subsequently, a thorough systematic analysis was conducted to understand the methods used for condition rating and forecasting of concrete bridges. Finally, research gaps were identified, and corresponding future research needs were outlined to support continuous learning in the field.

3. Scientometric Review

A critical scientometric analysis was conducted in this section to examine research trends and identify prominent researchers and journals. This analysis helps readers understand shifts in research focus, recognize the influential journals, and comprehend the structure of research networks within the field of concrete bridge condition rating and prediction between 2004 and 2025 using 124 publications. The yearly number of publications and the publication trend are depicted in Figure 4. It was noticed that the research output was limited and steady before 2013. Subsequently, the number of yearly publications increased to reach its peak in 2023 with 19 publications.

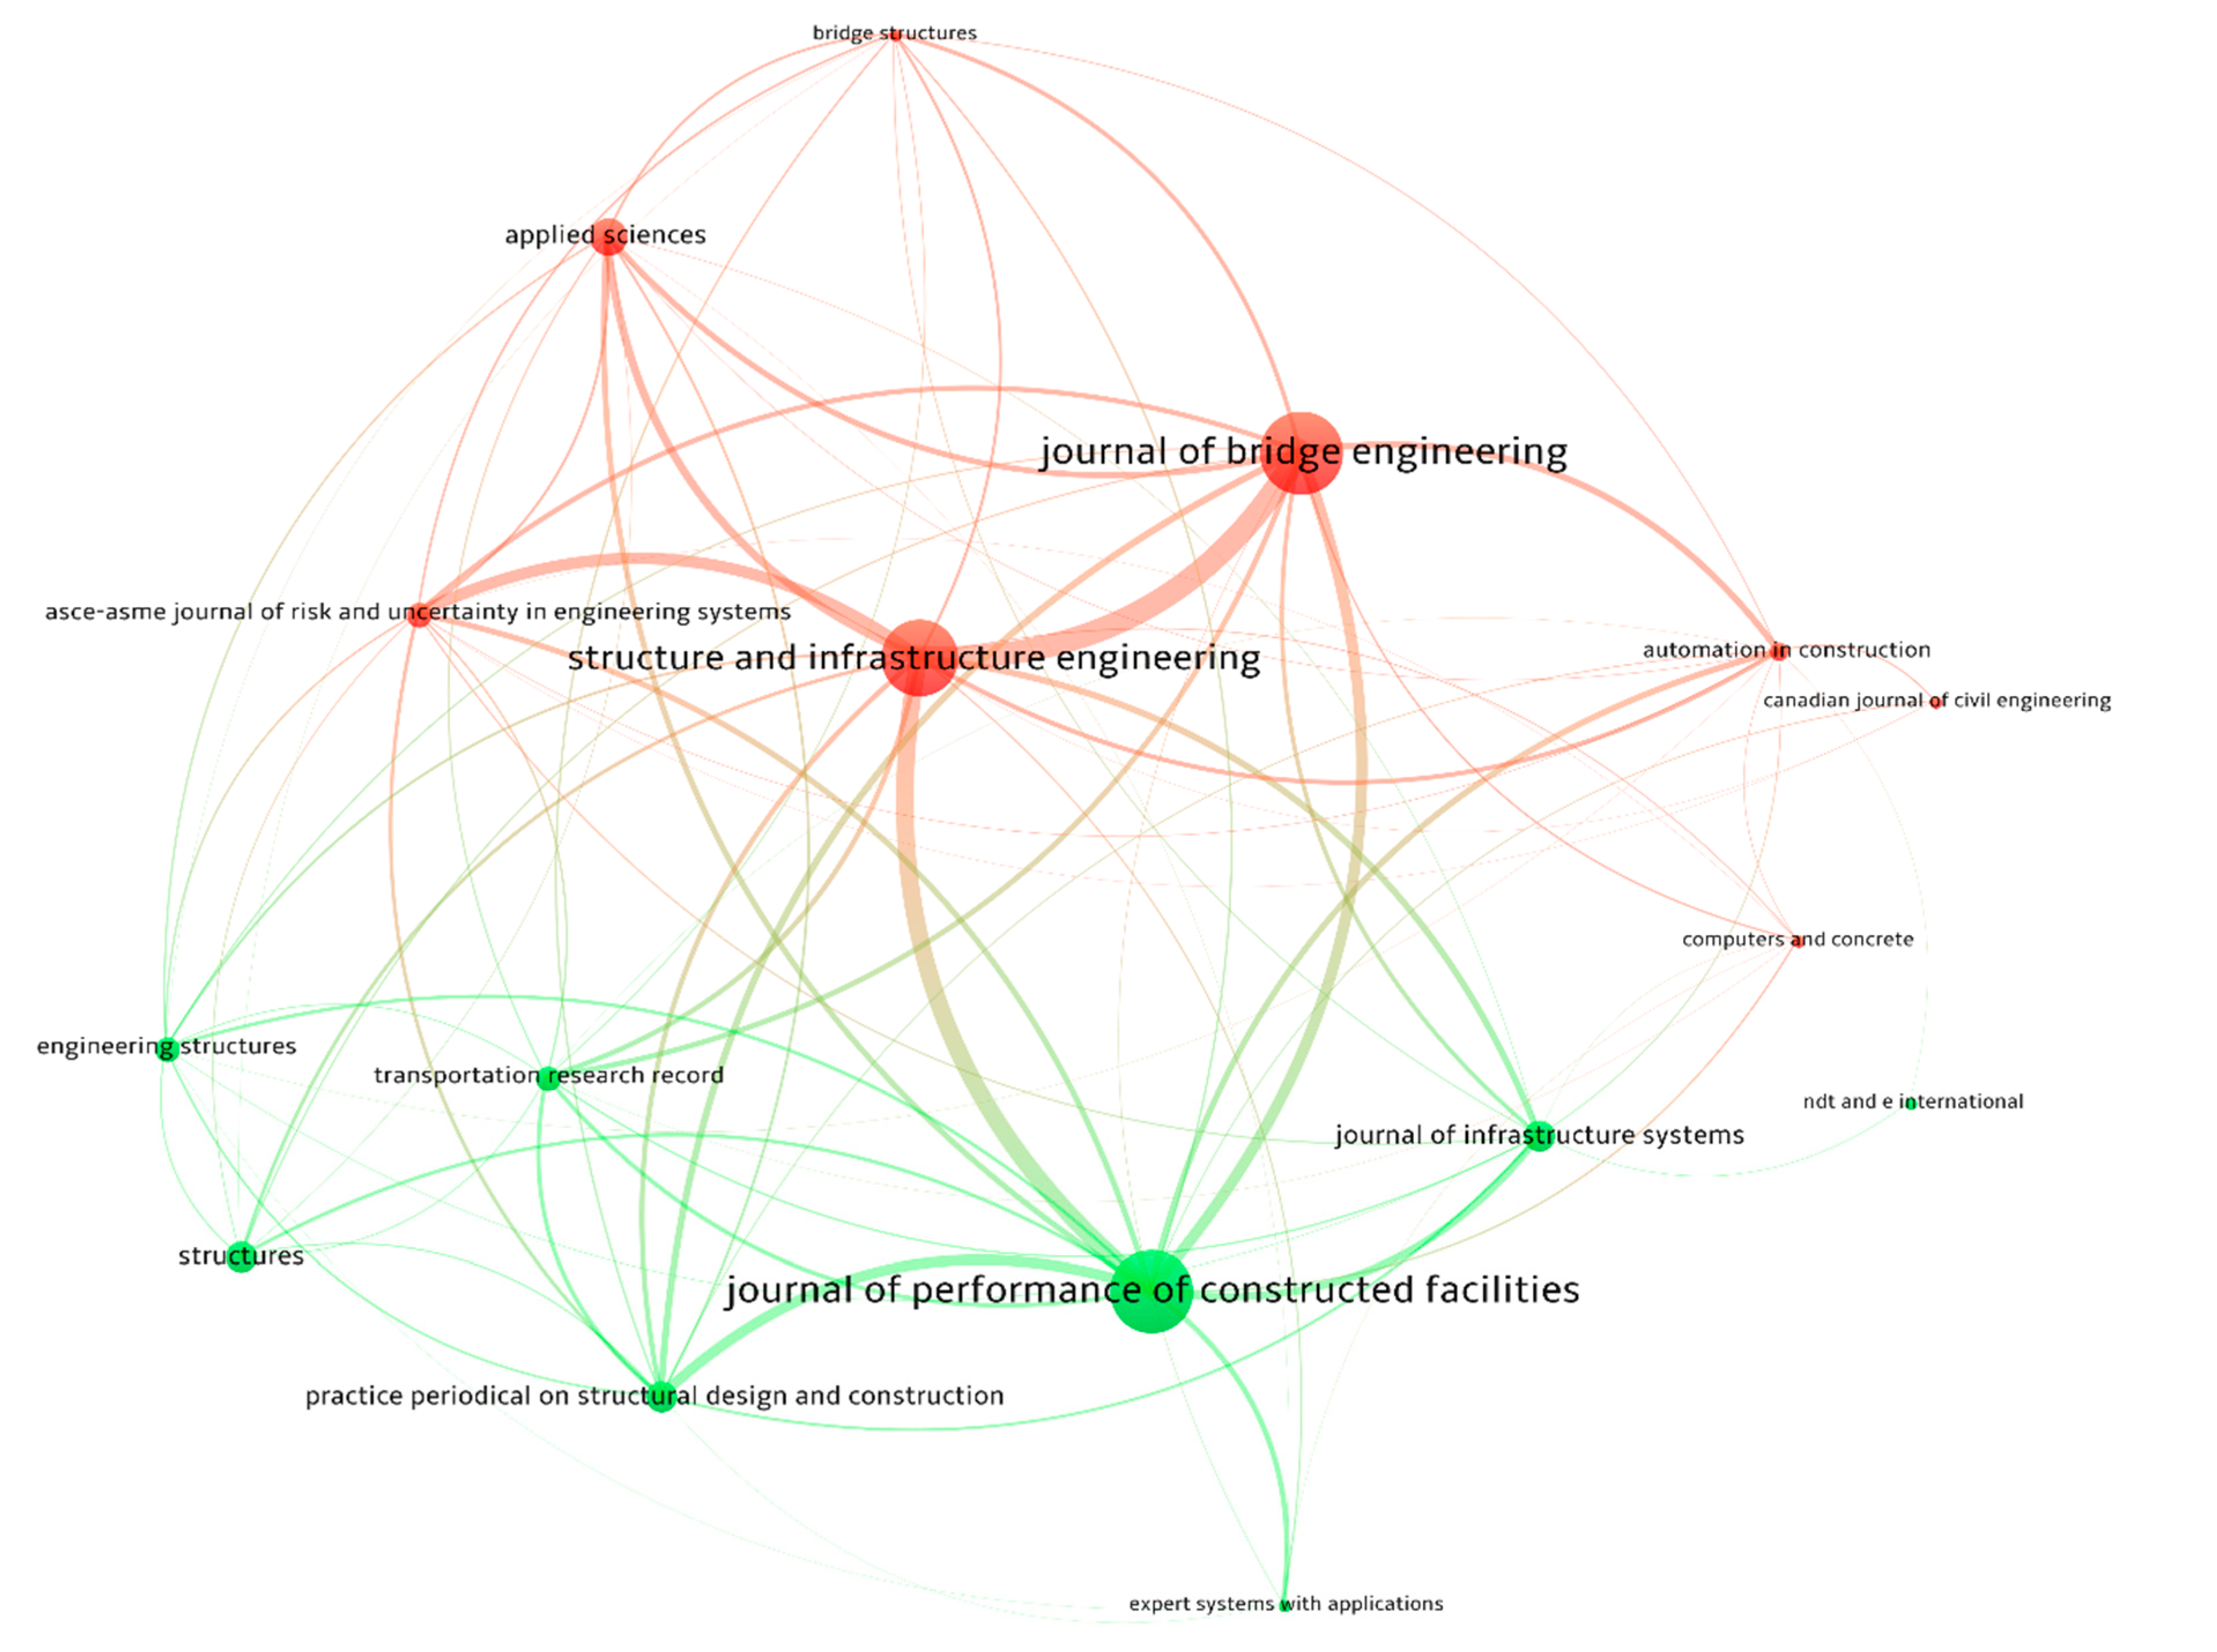
3.1. Journals Co-Citation Analysis

Table 1 summarizes the most prominent journals in concrete bridge condition rating and condition prediction. Journal of Bridge Engineering, Journal of Performance of Constructed Facilities, and Structure and Infrastructure Engineering emerged as the top productive journals, with respective h-indices of 9, 9, and 8, and publication counts of 13, 13, and 12, respectively. In addition, Figure 5 shows the prominent journals in bridge condition rating and prediction, with connections representing a co-citation map that divides the journals into two distinct clusters, highlighted in red and green.

3.2. Leading Institutions and Authors

Table 2 summarizes the leading authors in concrete bridge condition rating and prediction. According to bibliometric analysis, Zayed T emerged as the most prominent author with a total of 8 publications. Additionally, the most influential institutions and countries in the field. Concordia University leads with eight publications, followed by Tongji University and the Turner–Fairbank Highway Research Center with five each. Furthermore, the USA, China, and Canada are identified as the most productive countries, which can be attributed to the extensive bridge infrastructure in these regions. This analysis identifies the key authors, institutions, and countries leading advancements in concrete bridge condition rating and prediction, helping researchers to establish collaborative networks to progress in this critical field.

3.3. Keywords Analysis

This section expounds on the most frequent keywords, keyword co-occurrence map, and its temporal evolution.

3.3.1. Most Occurred Author Keywords

Table 3 presents the twenty most frequently used keywords. The top five accruing keywords are deterioration, concrete, bridges, concrete bridges, and bridge decks. These keywords describe the primary focus of the investigated literature about concrete bridge infrastructure. There was also an emphasis on bridge decks as they experience accelerated deterioration due to direct exposure to dynamic traffic loads and environmental factors, making them a priority for condition assessment and maintenance planning. The remaining fifteen keywords emphasize inspection and assessment methods, including visual inspection and non-destructive testing. They also focus on condition assessment, condition rating, deterioration modeling, and condition prediction. Additionally, these keywords highlight aspects of bridge management, decision-making, and maintenance actions.

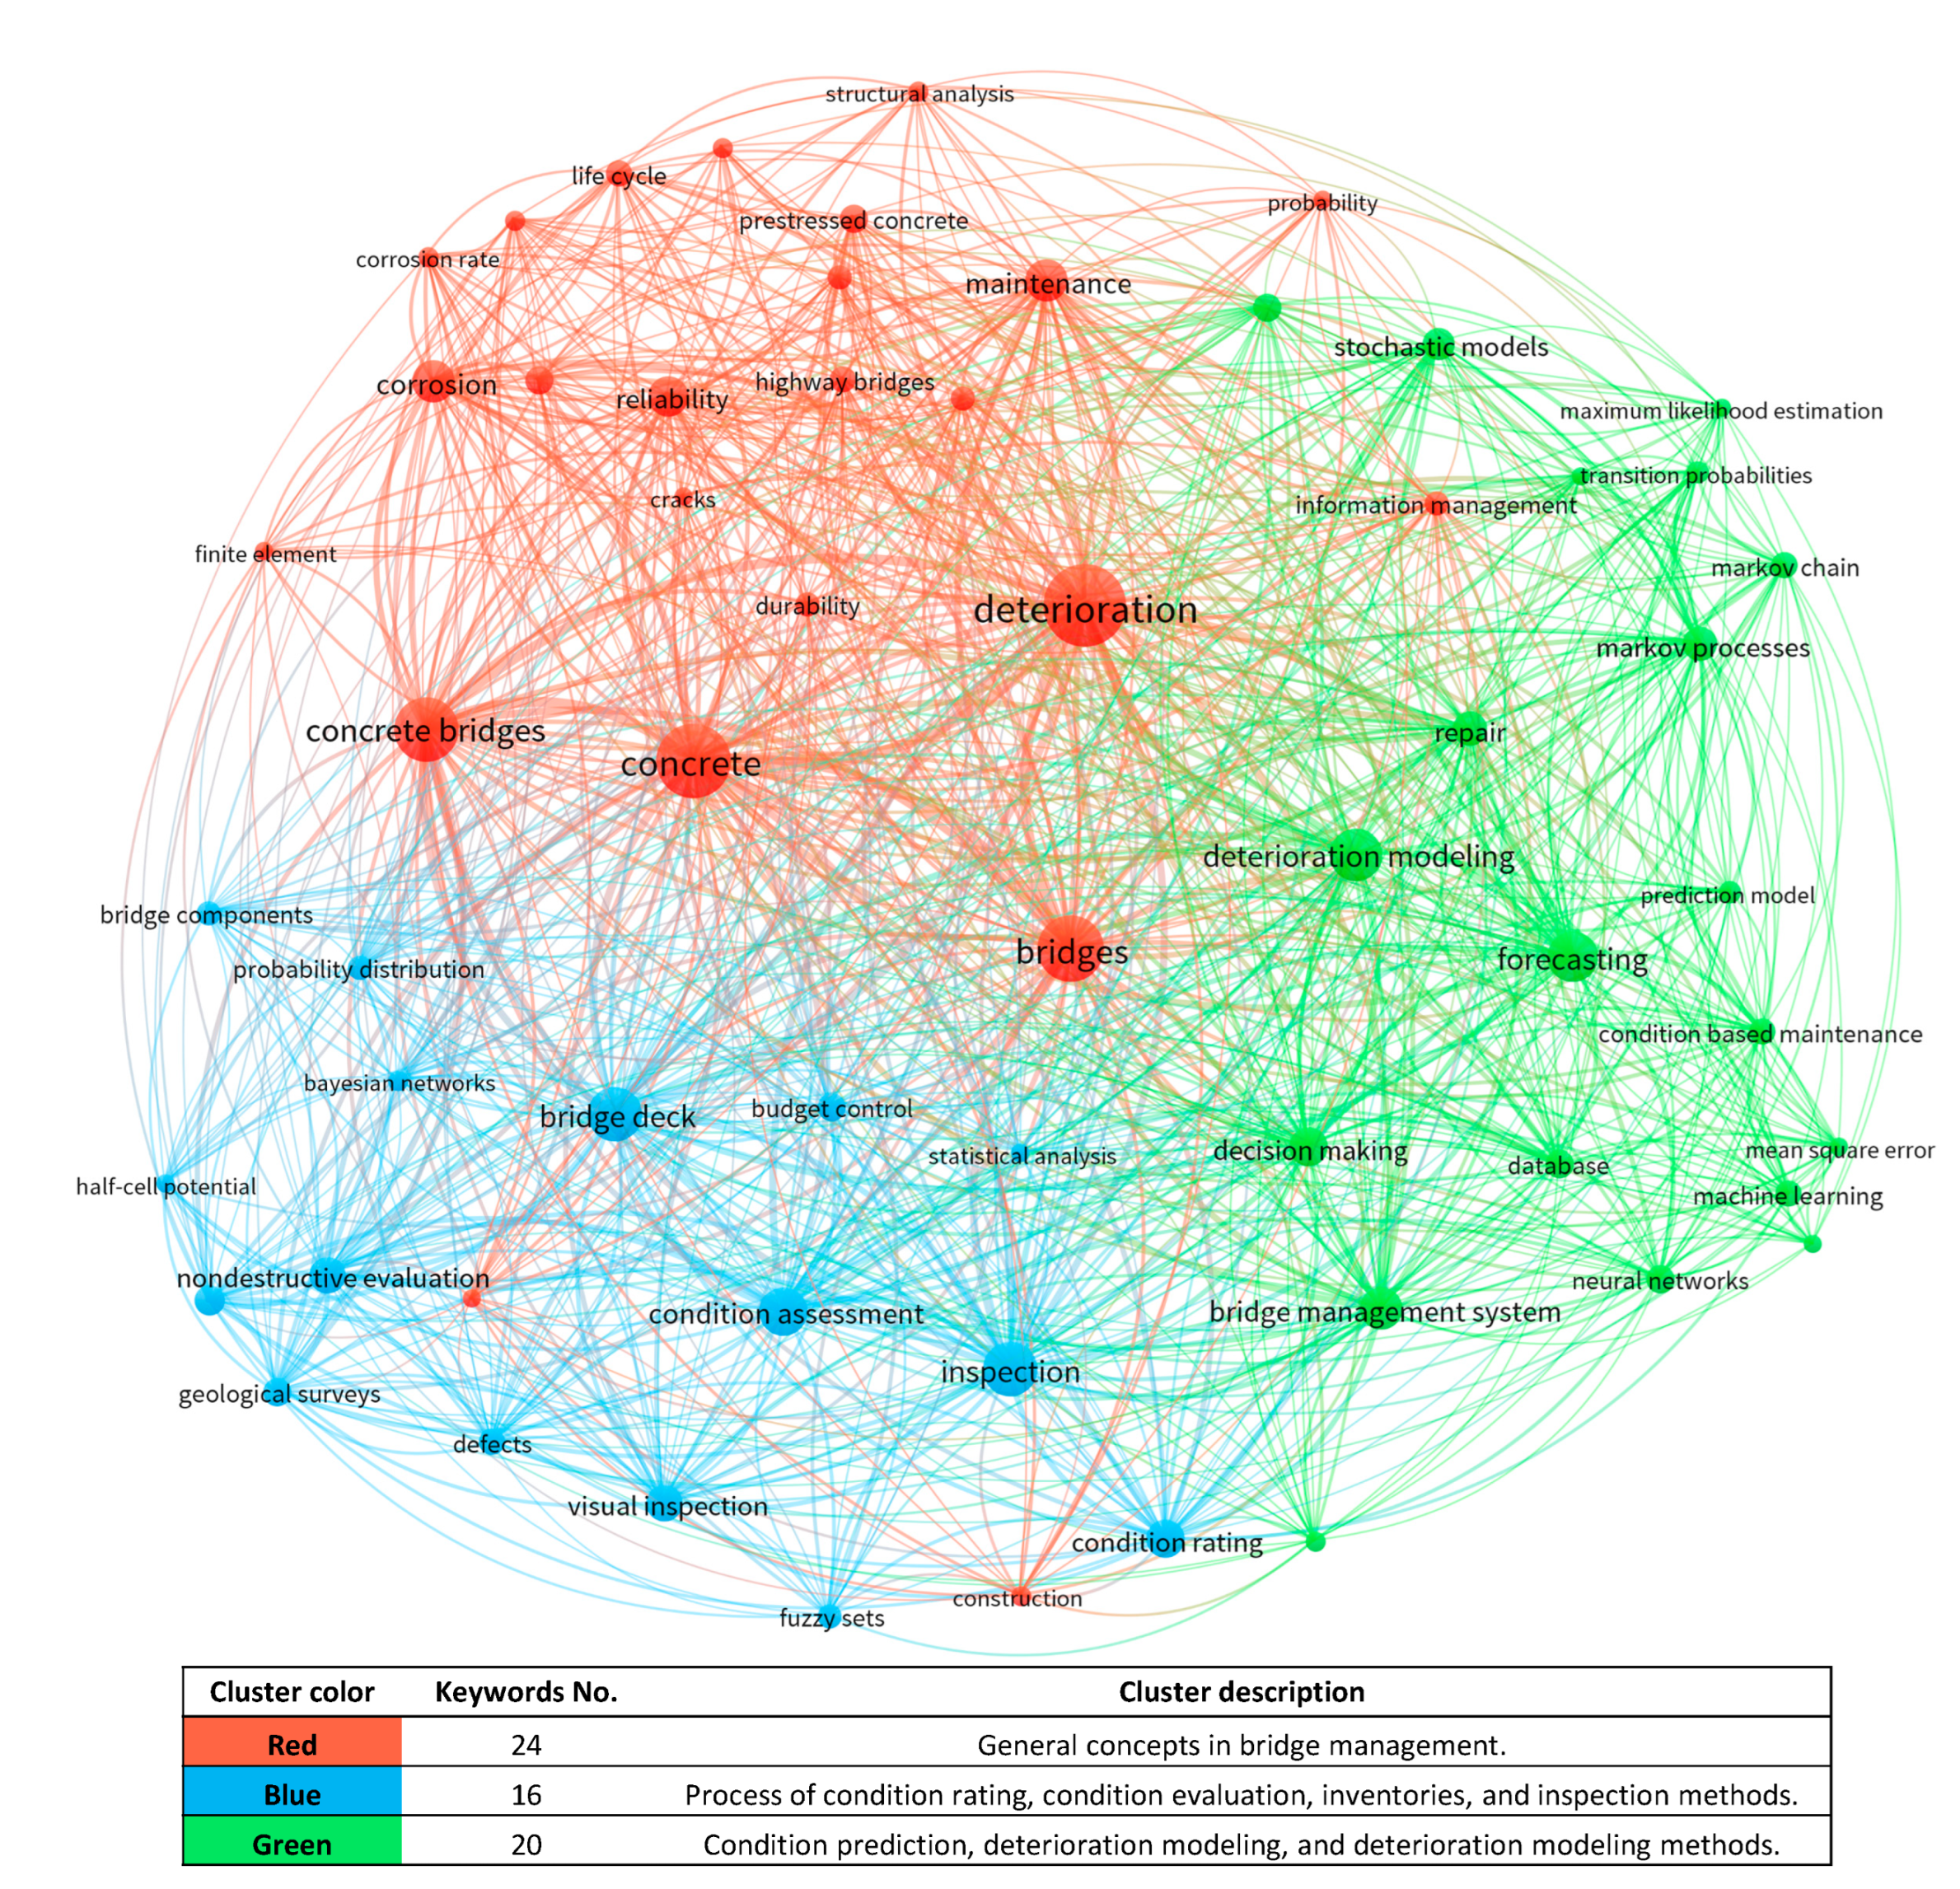
3.3.2. Keyword Co-Occurrence Map

The keywords in the reviewed literature were analyzed to create a co-occurrence map and to cluster the keywords to highlight the primary research directions in the field. Sixty keywords with a minimum occurrence of four times were used for the analysis. The co-occurrence map in Figure 6 depicts keywords frequency and connections where the size of each node represents the frequency of the keywords, and the thickness of each link corresponds to the co-occurrence of the connected keywords. As depicted in Figure 6, the keywords were clustered, and the clusters are visually distinguishable by color variations.
As depicted in Figure 6, the first cluster, highlighted in red, represents general concepts in bridge management, including terms such as “concrete bridges”, deterioration”, “maintenance”, “information management”, “life cycle”, “structural analysis”, “durability”, and “reliability”. The second cluster, highlighted in blue, encompasses terms related to the process of condition rating, including keywords associated with condition evaluation and inventories, such as “condition assessment”, “bridge components”, and “defects”. It also includes inspection methods, such as “nondestructive testing”, “half-cell potential”, and “visual inspection”. The third cluster, highlighted in green, encompasses terms related to condition prediction and deterioration modeling, such as “deterioration modeling”, “predictive modeling”, and “forecasting”. It also includes various modeling methods, including “stochastic models”, “Markov chains”, “machine learning”, and “neural networks”.

3.3.3. Temporal Analysis

Figure 7 presents the temporal analysis of the 60 most occurred keywords where the size of each node represents the frequency of the keywords, and the thickness of each link corresponds to the co-occurrence of the connected keywords. Moreover, the colors indicate the average publication year for the occurrence of each keyword. The temporal analysis provides interesting remarks regarding the research trend in the area of concrete bridge condition rating and condition prediction. Figure 7 depicts a general trend in the research output, as most of the research articles were published after 2016. Keywords such as condition rating bridge management systems and bridges were consistently used during the two decades as they represent the general research topic. In addition, the keywords of statistical analysis and fuzzy set illustrate that these areas we more popular during the first decade. In addition, terms related to nondestructive testing gained more popularity during the last decade. Moreover, keywords related to AI, such as machine learning (ML) and deep learning (DL), were more popular during the last 5 years, indicating a new trend in concrete bridge condition prediction approaches. It can be noted that these keywords overlap with those in the third cluster deliberated previously.

4. Systematic Review

Although the scientometric analysis is advantageous, it is inadequate to provide a comprehensive understanding of the reviewed literature. Thus, this study implemented an extensive systematic review to comprehend the concrete bridge condition rating and condition prediction processes. As depicted in Figure 8, the reviewed literature is divided into studies on condition rating and condition prediction. The condition rating studies, accounting for 22% of the reviewed literature, primarily focus on developing reliable condition indices to display the current condition of existing structures based on inspection data. Conversely, the condition prediction studies, representing 78% of the reviewed literature, focus on modeling bridge deterioration to forecast the expected bridge condition over specific time periods.
The systematic review is structured as outlined in Figure 9. Firstly, Section 4.1 highlights the importance of inventories in bridge management systems. Subsequently, Section 4.2 explores defect detection and evaluation methods. Section 4.3 focuses on condition rating methodologies, and finally, Section 4.4 studies deterioration modeling and condition prediction approaches. Consequently, Section 5 highlights the research gaps and future directions, while Section 6 presents the conclusions.

4.1. Inventory

Bridge management starts with conducting inventories to collect information about the existing bridges. The inventory usually includes information about descriptive information, such as structure type and material, and condition information, such as inspection data. A comprehensive inventory is vital for an effective bridge management system (BMS) [20]. The inventory is generally guided by inventory manuals, which give guidelines for collecting, storing, and updating information about bridge elements.
Inventory manuals outline comprehensive guidelines for the standardized collection of bridge data, ensuring that information is reported in a consistent format across various departments of transportation (DOTs). For instance, in the US, the National Bridge Inventory (NBI) manual regulates the inventory data collection and storage processes [21], as illustrated in Table 4. This enables the integration of bridge condition and performance data into a national database managed by the Federal Highway Administration (FHWA) [22].
In addition to the national inventories, the agencies usually have more detailed inventories for their local BMS [23]. For instance, in the US, the AASHTO Manual for Bridge Element Inspection (MBEI) [24] provides guidelines for element-level condition rating. The MBEI includes three levels of element inspection. The first is the National Bridge Elements (NBEs), which provides guidelines for the main components such as slabs and decks, substructure, superstructure, bearings, railings, and culverts. The second level comprises Bridge Management Elements (BMEs), which include less critical bridge components, such as wearing surfaces and joints, typically managed by local agencies. The third is Agency-Developed Elements (ADEs), which include the additional elements defined by the agency that are not included in the NBE and BME [24].

4.2. Defects Detection and Evaluation

The bridge condition rating process starts by identifying and evaluating the existing defects and evaluating their severity and extent. Typically, inspection manuals provide standardized guidelines for inspectors on how to measure and assess various types of defects [20].

4.2.1. Visual Inspection-Based Defect Evaluation

The defects outlined in most transportation agencies’ manuals are mainly detected by means of visual inspection (VI) or simple techniques such as chain drag and hammer tapping [25]. For example, the primary defects occurring in concrete elements specified by the MBEI in Table 5 are detected visually or using simple tools such as meters and hammers. Accordingly, each defect is evaluated and assigned a condition state ranging from one to four, based on its severity and extent [24]. VI is a straightforward and cost-effective method of assessment, with major costs primarily associated with traffic management and labor [26]. However, the visual evaluation of defects heavily relies on the subjective judgment of the inspector [27]. Consequently, VI may underestimate or overestimate the severity of observed defects and overlook underlying defects [8].

4.2.2. DL-Based Surface Defects Inspection

The adoption of DL techniques for detecting and classifying concrete bridge surface defects has gained momentum in recent years. These methods offer a more quantitative assessment of surface defects compared to VI. However, several limitations necessitate further investigation and improvements for these models. For instance, Xiong et al. [28] and Bae et al. [29] utilized DL frameworks for accurate crack identification in digital images. Similarly, Wan et al. [30] applied a DL-based surface damage detection and classification for cracks and spalling. However, the variability in damage modes across different bridges limits the generalizability of their approach. Zhang et al. [31] expanded on this by detecting cracks, pop-outs, spalls, and exposed rebars using YOLOv3. Despite achieving promising results, these approaches require larger datasets of validated inspection images to ensure consistency and reliability. Moreover, these methods identify defects without providing quantitative measurements of their dimensions or precise spatial locations, which are essential for a comprehensive assessment of structural integrity.
Another group of studies investigated the adoption of DL and computer vision techniques for detecting and measuring defects’ severity and extent by integrating object detection and segmentation. For instance, Rubio et al. [32] employed Convolutional Networks to detect and segment spalling and rebar exposure. However, the training data were limited to large defects, which compromised the models’ ability to detect small damages. Ding et al. [33] used unmanned aerial vehicles (UAV) to capture the images and employed DL algorithms to detect and segment cracks with widths as small as 0.2 mm. However, their approach struggled with curved surfaces, such as circular bridge piers, and lacked the integration of crack positional data in a 3D space, which is critical for comprehensive structural health assessments. Saleem et al. [34] extended UAV capabilities by integrating GPS, IMU, and LiDAR technologies for georeferenced image capture. While their system demonstrated potential, it remained limited to single-class damage detection, highlighting the need for multi-class extension. Lin et al. [35] introduced an advanced UAV-based inspection framework that utilized high-resolution images to generate 3D point clouds for damage detection and localization. While the results indicated the system’s efficacy, particularly for spalling and exposed rebar detection, the accuracy for cracks and other minor defects required significant improvement.
The reviewed studies reveal notable gaps in the current state of DL applications for bridge surface damage inspection. Many approaches are constrained by the availability and quality of training datasets, limiting their ability to generalize across diverse bridge structures, particularly in detecting small damages such as fine cracks. In addition, quantifying damage dimensions and integrating spatial positional data into the detected defects remain underexplored, despite their importance for structural health assessment.

4.2.3. Non-Destructive Defect Evaluation

To address the uncertainty inherent in qualitative visual inspections, multiple researchers have proposed the use of quantitative non-destructive evaluation (NDE) techniques as a supplement to the VI [36]. NDE methods require no damage to the structure or extraction of specimens, provide quantitative measures of detected defects, and allow for the early identification of underlying issues [36].
Table 6 summarizes the NDE technologies used in the development of condition rating/index systems. For instance, the NDE techniques used to detect and quantify delamination included Chain Drags (CD), Impact Echo (IE), and Infrared Thermography (IR) [37,38]. Moreover, methods such as Half-Cell Potential (HCP), Ground Penetrating Radar (GPR), and Electrical Resistivity (ER) are employed for corrosion evaluation [39,40]. In addition, Rebound Hammer (RH) is used to assess concrete compressive strength [41], while Ultrasonic Pulse Velocity (UPV) evaluates concrete material damage [40]. Additionally, surface defects, including cracking, spalling, and staining, are quantified using Digital Photogrammetry (DP) [42]. More recently, techniques such as Synthetic Aperture Radar have been introduced for structural health monitoring to observe the displacements in concrete bridges over time, which provides affordable large-scale monitoring for concrete bridges [43]. The performance of the most commonly used NDE is summarized in Table 7. Although NDE techniques demonstrate strong defect detection capabilities, their performance tends to decline under varying environmental conditions. Additionally, these methods face limitations in terms of speed and cost when applied to large and extensive bridge structures. The complexity of data processing and interpretation further hampers their efficiency. To address these challenges, advancements are needed to reduce data collection time, such as adopting 3D GPR arrays instead of conventional single antennas [44]. Furthermore, the development of standardized and automated processing and interpretation tools is essential to enhance their applicability to extensive infrastructures like concrete bridges [36,43].
Nondestructive evaluation (NDE) techniques are valuable tools for quantifying defect severity and can detect hidden defects at early stages of deterioration. This capability enables the application of preventive maintenance and empowers more sustainable infrastructure management [36]. Some agencies, such as the US Federal Highway Administration [1], have started conducting pilot case studies and collecting data using NDT in multiple DOTs. However, NDE data can be complex and require specialized expertise to interpret accurately. Additionally, NDE techniques have limitations in terms of their applicability and suitability for different environments, structures, and materials [55]. This leaves room for uncertainty in the inputs from NDE techniques.

4.2.4. Fuzzified Defects Evaluation

Multiple researchers used fuzzy logic to take the uncertainties from VI and NDE into account. Fuzzy logic is a form of handling inherited uncertainties and vagueness. Fuzzy set theory was introduced by Zadeh [56]. Unlike the crisp condition state illustrated in Table 5, fuzzy set theory allows the defect to have a degree of belonging to multiple condition states within a value between 0 and 1. For instance, a fuzzy set A in a universe of discourse X is defined by Equation (1).
A = { x , μ c x x X }
where μ c x is the membership function of condition c, and x is an element in the universe X. The membership function maps elements to a real number in the interval [0, 1], which represents the degree of belonging of the value x in the fuzzy set c.
The shape of the membership function μ c x defines the fuzziness of the set. The membership function shape can be triangular, trapezoidal, Gaussian, or other types of shapes. Figure 10 gives an example of fuzzy sets of triangular membership functions. Any value of defect condition (x) that represents the extent and severity of a certain defect can be represented by the degrees of belonging to each condition state. For instance, the fuzzy condition of very severe defects covering 36% of the bridge deck (x = 36) is represented by the vector that holds the probability of the defect to be in Excellent, Good, Fair, and Poor condition as follows [ μ Excellent 36 = 0 , μ Good 36 = 0 , μ Fair 36 = 0.5 , μ Poor 36 = 0.5 ] .
Multiple studies employed fuzzy theory to fuzzify the inputs from the detected defects. For instance, Sasmal et al. [57] fuzzified the input data obtained from the bridge inspector’s crisp evaluation (1–9) using nine fuzzy membership functions [57]. Moreover, Tarighat and Miyamoto [8] proposed a system where inspectors assign a defect score ranging from 0 to 100, which was then converted into fuzzy linguistic terms. Each defect was represented by a specific set of membership functions, facilitating a more detailed assessment. Similarly, Ramezanianpout et al. [58] used predefined fuzzy sets of crack width and depth to provide fuzzy inputs of linguistic descriptions of crack severity level.
In addition to VI, the fuzzy theory was implemented to comprise the uncertainties of NDT. For instance, Dinh and Zayed [48] considered the area percentages of three GPR conditions as membership in a fuzzy set that includes three membership functions, where the fuzzy set was formulated using questionnaire surveys. In a similar study, Omar et al. [38] used the 2012 Ministry of Transportation of Quebec (MTQ) fuzzy scale to transform the severity and extent of the defects obtained using VI, IR, and GPR into fuzzy condition categories, as depicted in Figure 10. Subsequently, the area percentages of condition categories were used as weights to aggregate the fuzzy condition categories from various severities of the same defect.

4.3. Condition Rating

Section 4.2 discussed defect detection and evaluation. This section covers the process of aggregating defects to provide overall bridge condition ratings. Inspection manuals usually provide guidelines for rating bridge elements. For instance, MBEI depicts the process of assessing bridge elements. Accordingly, the elements are divided into measurable units, such as square meters (m2), and these units are evaluated based on the existing defects, as illustrated in Table 5. If multiple defects are present in the same area, the most severe defect is considered representative of the condition in that area. Accordingly, the element is assigned a condition state of one to four based on the severity and extent of the detected defects.
Ultimately, the condition rating of diverse elements is aggregated to provide an overall Bridge Condition Index (BCI) or Bridge Health Index (BHI) [23]. BCI/BHI is a crucial measure as it delivers a single index for evaluating a bridge’s functionality and health based on the condition of its structural element and the services it provides. There are various methods to calculate the condition index of concrete bridges. These methods include ratio-based, weighted average, worst-condition component, and other methods.

4.3.1. Ratio-Based Condition Rating

The ratio-based methods primarily determine the ratio of the structure’s current value to its original value. An example of this approach is the California BHI [59]. California BHI starts by evaluating individual elements by capturing the severity and extent of deterioration. In this process, inspectors evaluate the condition of measurable units of each element and categorize it into different condition categories, such as “Severe”(4), “Poor” (3), “Fair” (2), and “Good” (1). Each condition category has a specific value-reduction factor (RF), which can be determined using Equation (2). The current element value (CEV) is then derived by multiplying the quantity of each condition category by the value-reduction factor and the unit failure cost, as illustrated in Equation (3). Subsequently, the element’s original value or failure cost (FC) is computed using Equation (4), where the total element quantity is multiplied by the unit failure cost. Finally, the summation of the current value of all bridge elements is divided by the summation of their original values to provide overall BHI, as depicted in Equation (5).
R F = 1 c o n d i t i o n   s t a t e   n u m b e r 1 N u m b e r   o f   c o n d i t o n   s t a t e s 1
C E V = Q i × R F i × F C
T E V = T E Q × F C
B H I = C E V T E V × 100
Some researchers have incorporated fuzzy theory to account for the uncertainties inherent in VI in the ratio condition rating calculations. For instance, Abu Dabous et al. [60] used fuzzy reduction factors for condition categories to estimate the bridge deck health index (BDHI). In addition, Tarighat and Miyamoto [8] fuzzified the defect evaluation inputs and employed fuzzy rules to integrate the condition from various defects and provide a crisp BDHI. Ramezanianpout et al. [58] fuzzified the inputs of crack width and depth and used a fuzzy rules inference system to integrate the inputs. Subsequently, the center of area defuzzification was used to calculate the BDHI.
In the same vein, some researchers in the reviewed literature used fuzzified inputs from NDE to provide BDHI. For instance, Dinh and Zayed [48] represented the area percentages of three GPR condition categories as fuzzy memberships and utilized the weighted fuzzy union (WFU) operation and centroid method to provide a crisp BDHI from 0 to 100. Moreover, Omar et al. [38] used the 2012 MTQ fuzzy scale to transform condition categories based on defect severity and extent obtained from IR, GPR, and VI. Subsequently, area percentages were used as weights to aggregate the fuzzy conditions. Finally, the defects were integrated using Weighted Fuzzy Union (WFU) to provide a BDHI from 0 to 100, where the weights were obtained using fuzzy pairwise comparison.
The ratio-based condition rating method provides an objective and thorough assessment of the bridge condition by evaluating the severity and extent of defects. This allows for capturing a comprehensive overview of the quantities and severities of defects. This information is valuable to plan maintenance, repair, and rehabilitation activities. It also helps to apply efficient resource allocation at the network level [48]. However, some agencies may not have the element-level evaluation needed to assign the health index. In addition, the effect of quantitative cost or the effect of defects on bridge stability encompasses multiple assumptions and uncertainties.

4.3.2. Categorial Weighted-Based Condition Rating

Categorial weighted-based condition rating evaluates the structure’s condition by aggregating the categorial condition of individual elements. This aggregation is similar to the Analytic Hierarchy Process (AHP), which is a multi-attribute decision-making (MADM) method that breaks down complex decisions into a hierarchy of simpler components. In concrete bridge rating, the goal is to determine the bridge condition index. The hierarchy includes the component level, element level, and finally the defect level. The process starts by providing a crisp evaluation of bridge elements, such as numbers (1–5), which may refer to conditions of (good–severe), based on the qualitative judgment of defect severity and extent by the inspector. The condition of each component is then evaluated through the weighted summation of the conditions of the elements under that component. The element’s weight or importance represents its contribution to the overall component condition. Similarly, the bridge condition is evaluated by the weighted summation of component conditions, where the weights represent the influence of specific components on the overall bridge condition. These weights are typically assigned based on expert judgment using pairwise comparison matrices [51].
United Kingdom (BCI), Austria (BCI), and South Africa (BCI) are examples of categorial weighted-based BCI [23]. For instance, the United Kingdom (BCI) applies the method using one hierarchy level where it assigns condition scores for each element based on the extent and severity of deterioration [23]. Subsequently, the bridge condition index is estimated as a weighted summation of the bridge elements, taking into account both the importance of each element (EIF) and its condition score (ECI), as illustrated in Equation (6). Accordingly, the bridge condition index is computed using a predefined equation to assign a linguistic representation of the bridge condition, such as “Very good”, “good”, “fair”, “poor”, and “very poor”.
BCS = i = 1 n ECI i × E I F i i = 1 n E I F i
where n is the number of elements.
Some researchers used NDE to provide a more objective condition index. For instance, Pailes and Gucunski [37] used multimodal NDT to quantify different types of defects on bridge decks. Subsequently, they employed the US National Bridge Inspection Standards (NBIS) of NDT to assign conditions from zero to nine based on the area of severe delamination and the area of other defects. Pailes and Gucunski [37] found that the NDT inspection is more conservative as it quantifies hidden defects. In addition, Abu Dabous et al. [50] merged the defect maps of GPR, IR, and VI to remove the overlap. Subsequently, the defective area percentage was used to assign CI from one to five based on the Colorado DOT condition evaluation manual that depends on the total defective area. More recently, Rashidi et al. [40] employed time laps NDE inspection to evaluate the bridge deck using statistical measures of deviation from the original state. The statistical deviation was calculated using the square root of the Jensen-Shannon divergence (JSD). Finally, the BDCI of (0–10) was calculated using Equation (7).
BDCI = 10(1 − sqrt(JSD))
Some researchers integrated VI with NDE to provide a more comprehensive condition index. For instance, Akgul [53] integrated VI with NDE techniques, including polarization resistance, penetration resistance, and pulse velocity, to provide a more comprehensive BCI. AHP and the frequency of NDE technique usage in the literature were used to assign weights to the NDE and VI, enabling the determination of the overall condition index (CI) on a scale of one to five. The weights for VI, polarization resistance, penetration resistance, and pulse velocity were 0.5, 0.25, 0.15, and 0.10, respectively. Similarly, Pushpakumara et al. [51] integrated VI with NDE, including RH, UPV, and ER, to evaluate concrete bridge elements. Accordingly, each m2 was rated from one to four based on the Visual Information Factor (VIF), Crack Details Factor (CDF), and NDE Factor (NDF). Subsequently, the Condition Index (CI) for each m2 was aggregated to provide the Element Condition Index (ECI). Finally, the Bridge Condition Index (BCI) was estimated using the weighted sum of ECI, where the weights were assigned based on environmental factors, element importance, and construction type. Moreover, Sasmal et al. [7,57] applied the fuzzy weighted average (FWA) in a hierarchy where weights were derived using AHP. The final BCI was obtained by defuzzifying the resultant fuzzy set using the alpha-cut resolution technique.
Categorial weighted-based condition rating provides a comprehensive view of the bridge condition and assists in planning maintenance and rehabilitation activities by establishing a consistent framework within the agency. However, it is challenging to gauge the weight or the impact of individual element conditions on the overall bridge structural integrity.

4.3.3. Worst-Conditioned Component-Based Condition Rating

The worst-conditioned component approach starts by assigning a deficiency ratio for each element [23]. Consequently, it identifies the critical defective element and assigns its condition to the related component. Subsequently, the overall condition index of the bridge is assigned based on the worst conditioned component, taking into consideration the extent of damage in other components.
The Japanese BCI, German BCI, and US NBI are examples of the worst-conditioned component BCI. For instance, the NBI provides guidelines for rating the major bridge components, including deck, superstructure, and substructure. Each of these components obtains a rating scale of zero to nine, as illustrated in Table 8. Subsequently, the overall condition of the bridge is determined based on the lowest condition rating among critical components.
This worst-conditioned component BCI method helps identify high-risk bridges and assess the bridge’s vulnerability during extreme events or disasters. Moreover, it facilitates the comparison of bridge conditions and performance at various DOTs and identifies trends in the deterioration or improvement of the nation’s bridge infrastructure. However, this approach does not provide a complete picture of how deterioration is distributed across the bridge structure.

4.3.4. Other Methods

In addition to the previously discussed condition rating methods, the reviewed literature exhibits other approaches for concrete bridge conditions rating, as summarized in Table 9. It was notable that the bridge deck was the most investigated component. This can be attributed to the fact that bridge decks experience the most rapid deterioration among bridge components due to their direct exposure to dynamic loads and chlorides from deicing salts [60]. Liu et al. [41] developed a condition rating approach for reinforced concrete bridge superstructure using fuzzy c-mean clustering optimized by particle swarm (FCM-PSO). The method evaluates five measurable condition metrics and normalizes them to apply fuzzy clustering to cluster the concrete bridges. The clusters were ordered based on the maintenance priority, and cluster centroids were used to prioritize the maintenance of newly inspected concrete bridges. In addition, Arong et al. [61] used support vector machine (SVM) to obtain condition evaluation of concrete bridge decks based on the presence of peeling and exposed steel bars.

4.4. Condition Forecasting and Deterioration Models

Throughout service life, concrete bridges deteriorate under exposure to various operational and environmental factors. The environmental factors mainly include freeze and thaw cycles, airborne chloride, excessive moisture, and extreme weather. The operational factors mainly include traffic loads, chlorides from deicing salts, and maintenance activities [62]. A considerable amount of research endeavors have been focused on modeling the deterioration process for concrete bridges. Multiple types of deterioration models were developed in the process. As illustrated in Figure 11, these models include mechanistic models, deterministic (statistical) models, stochastic models, and Artificial intelligence (AI) models. Figure 11 illustrates that stochastic models are the most widely used for deterioration modeling, while AI gained prominence in recent years.
Deterioration modeling has been implemented by DOTs to improve their bridge management systems and decision-making policies regarding maintenance, rehabilitation, and replacement activities. For instance, the FHWA’s Long-Term Bridge Performance (LTBP) InfoBridge program [63] integrated three types of condition forecast, namely deterministic, stochastic Markov, and ML-based models. These models leverage historical NBI data to predict the condition of bridge components like decks, superstructures, and substructures, with updates made annually to reflect the latest data. Tools within InfoBridge, such as the Performance Transition Forecast and Condition Transition History, enable detailed analysis of bridge condition changes over time and across networks, supporting strategic planning. Additionally, features like the Asset Valuation Tool provide insights into the financial value of bridge assets, aiding state agencies in resource allocation and prioritization. Despite their advancements, these tools emphasize the ongoing need for improved data integration and enhanced modeling approaches to maximize their effectiveness [63].

4.4.1. Statistical Deterioration Models

Deterministic Regression

Deterministic regression models assume that bridge deterioration is predictable and can be represented by an empirical relationship. In these models, the bridge condition is modeled as a dependent variable, and time and other factors as independent variables [64]. In the reviewed literature, regression analysis has been applied to model the relationship between bridge conditions and time, as well as to analyze the relationship between bridge conditions and multiple independent variables. The framework for the deterministic deterioration model development is illustrated in Figure 12.
As illustrated in Table 10, considerable research in the revised literature applied regression analysis to model the relationship between bridge conditions and time. For instance, Bolukbasi et al. [64] used third-degree polynomial regressions to model bridge component deterioration as a function of age under different explanatory factors. To improve the model’s accuracy, Bolukbasi et al. [64] applied filtration to the data by removing instances where the condition improved over time and imposing a limit on the duration a component can remain in a single condition state. Similarly, Tolliver and Lu [65] used third-degree polynomial regressions with adjustable intercepts based on bridge material, design, and AADT. In addition, sigmoid functions were used to model the deterioration progress in the bridge deck from condition data collected using time-lapse NDT [40,42,66]. Sigmoid functions represent the natural deterioration process as it starts with a slow deterioration rate and steps with time, indicating an accelerated rate of deterioration due to accumulating stresses and environmental factors [66].
Regression analysis was also used to model the relationship between bridge conditions and multiple independent variables. For instance, Hasan and Elwakil [67] examined the impact of explanatory factors on the deterioration of bridge superstructures using data from NBI and used multiple regression to model bridge deterioration as a function of significant influential factors. Similarly, Hasan and Elwakil [68] utilized multiple regression to model the deterioration based on the deterioration factors affecting the bridge superstructures. In the same regard, Srikanth and Arockiasamy [69] used t-statistics to determine the significant explanatory variables and used multivariate regression to model the deterioration process. Moreover, Ghonima et al. [70] used logistic regression to evaluate the performance of bridge decks where the deterioration rate (high/low) was the dependent variable, while the independent variables included AADT, environmental factors, structural characteristics, and maintenance activities.

Descriptive Statistics

As illustrated in Table 10, descriptive statistics have been utilized in the reviewed literature to comprehend bridge deterioration mechanisms by summarizing and analyzing large sets of inspection and condition data. This method mainly analyses data trends to provide meaningful information about the deterioration rate, deterioration factors, and structural performance.
In this regard, Wang [46] conducted statistical analysis on the Australian bridge superstructure to comprehend the condition trends. Wang used ANOVA to identify influential factors and used them to obtain condition trends by grouping bridges into categories of unusual deterioration, normal deterioration, and condition improvement. Similarly, Kim [71] analyzed condition trends in bridge decks and superstructures. Initially, Kim employed ANOVA to determine significant deterioration factors. Subsequently, Kim examined bridges’ deterioration rates to assess their performance across zones with similar characteristics. More recently, Alogdianakis et al. [72] evaluated the impact of coastal distance and airborne sea chlorides on bridge deterioration. In their study, Alogdianakis et al. [72] statistically analyzed subgroups with varying distances from the sea. The results concluded that the critical coastal distance for the chloride effect ranges between 2 and 3 km, with the impact being most significant at distances less than 1 km. Similarly, Treat and Dymond [73] applied statistical analysis to find the effect of epoxy-coated reinforcement and other explanatory factors on bridge deterioration. Moreover, Srikanth and Arockiasamy [74] developed non-parametric deterioration models to assess the reliability of bridges using the average time in condition rating (ATICR) and Kaplan–Meier (K-M) estimates to track the survival probability of bridges over time.
Statistical deterioration models are simple and provide valuable insights into determining the significant deterioration factors, especially at the network level [75]. However, this method does not take into consideration the internet uncertainty in infrastructure deterioration [76]. In addition, these models require large amounts of data. Moreover, it cannot represent the interaction between bridge elements and components [77].
Table 10. Summary of statistical deterioration modeling approaches in the literature.
Ref.ComponentData CategoryMethodFactors
[64]Deck, substructure, and superstructure.Illinois DOTRegression3rd-degree polynomial Age, material, structure, location, and ADT
[65]Bridge.NBIRegression3rd-degree polynomialAge, material, structure, and ADT.
[70]DeckNBIRegressionLogistic regressionADT, environmental factors, structural characteristics, and maintenance activities.
[67]SuperstructureNBIRegressionMultiple regressionAge, ADT, percent of truck, structure length, deck width, roadway width, skewness, span length, and structure type.
[68]DeckNBIRegressionMultiple regressionSkewness, span length, structure length, road width, deck width, inspection frequency, and ADTT.
[46]Deck and superstructureAustralia DOTsDescriptiveANOVA and trend analysis.Construction year, inspection year, inspector, and road class.
[72]BridgeNBIDescriptiveTrend analysisDecaying salt, coastal distance, year of construction, materials, and structural types.
[71]Deck and superstructure.NBIDescriptiveANOVA and trend analysis.Design, ADT, and environment.
[40,42,66]DeckNDTRegressionSigmoid functionsDesign, ADT, and environment, and age.
[73]DeckNBE rating Descriptive% of bridges in condition states 3 and 4.Deck design, ADT, route type, skewness, and coating type.
[69]Superstructure and substructure.NBIRegressiont-statistics and multivariate regression Age, number of spans, ADT, waterways, route, interstate-state, and coastal distance.
[78]DeckNBIRegression3rd degree polynomial.Age and ADTT.
[79]BridgeSpainDescriptiveDurability indexAge, design, and environment.
[74]BridgeNBIDescriptiveATICR and K-MAge, ADT environment, wearing surface, classification, skewness, and design parameters.

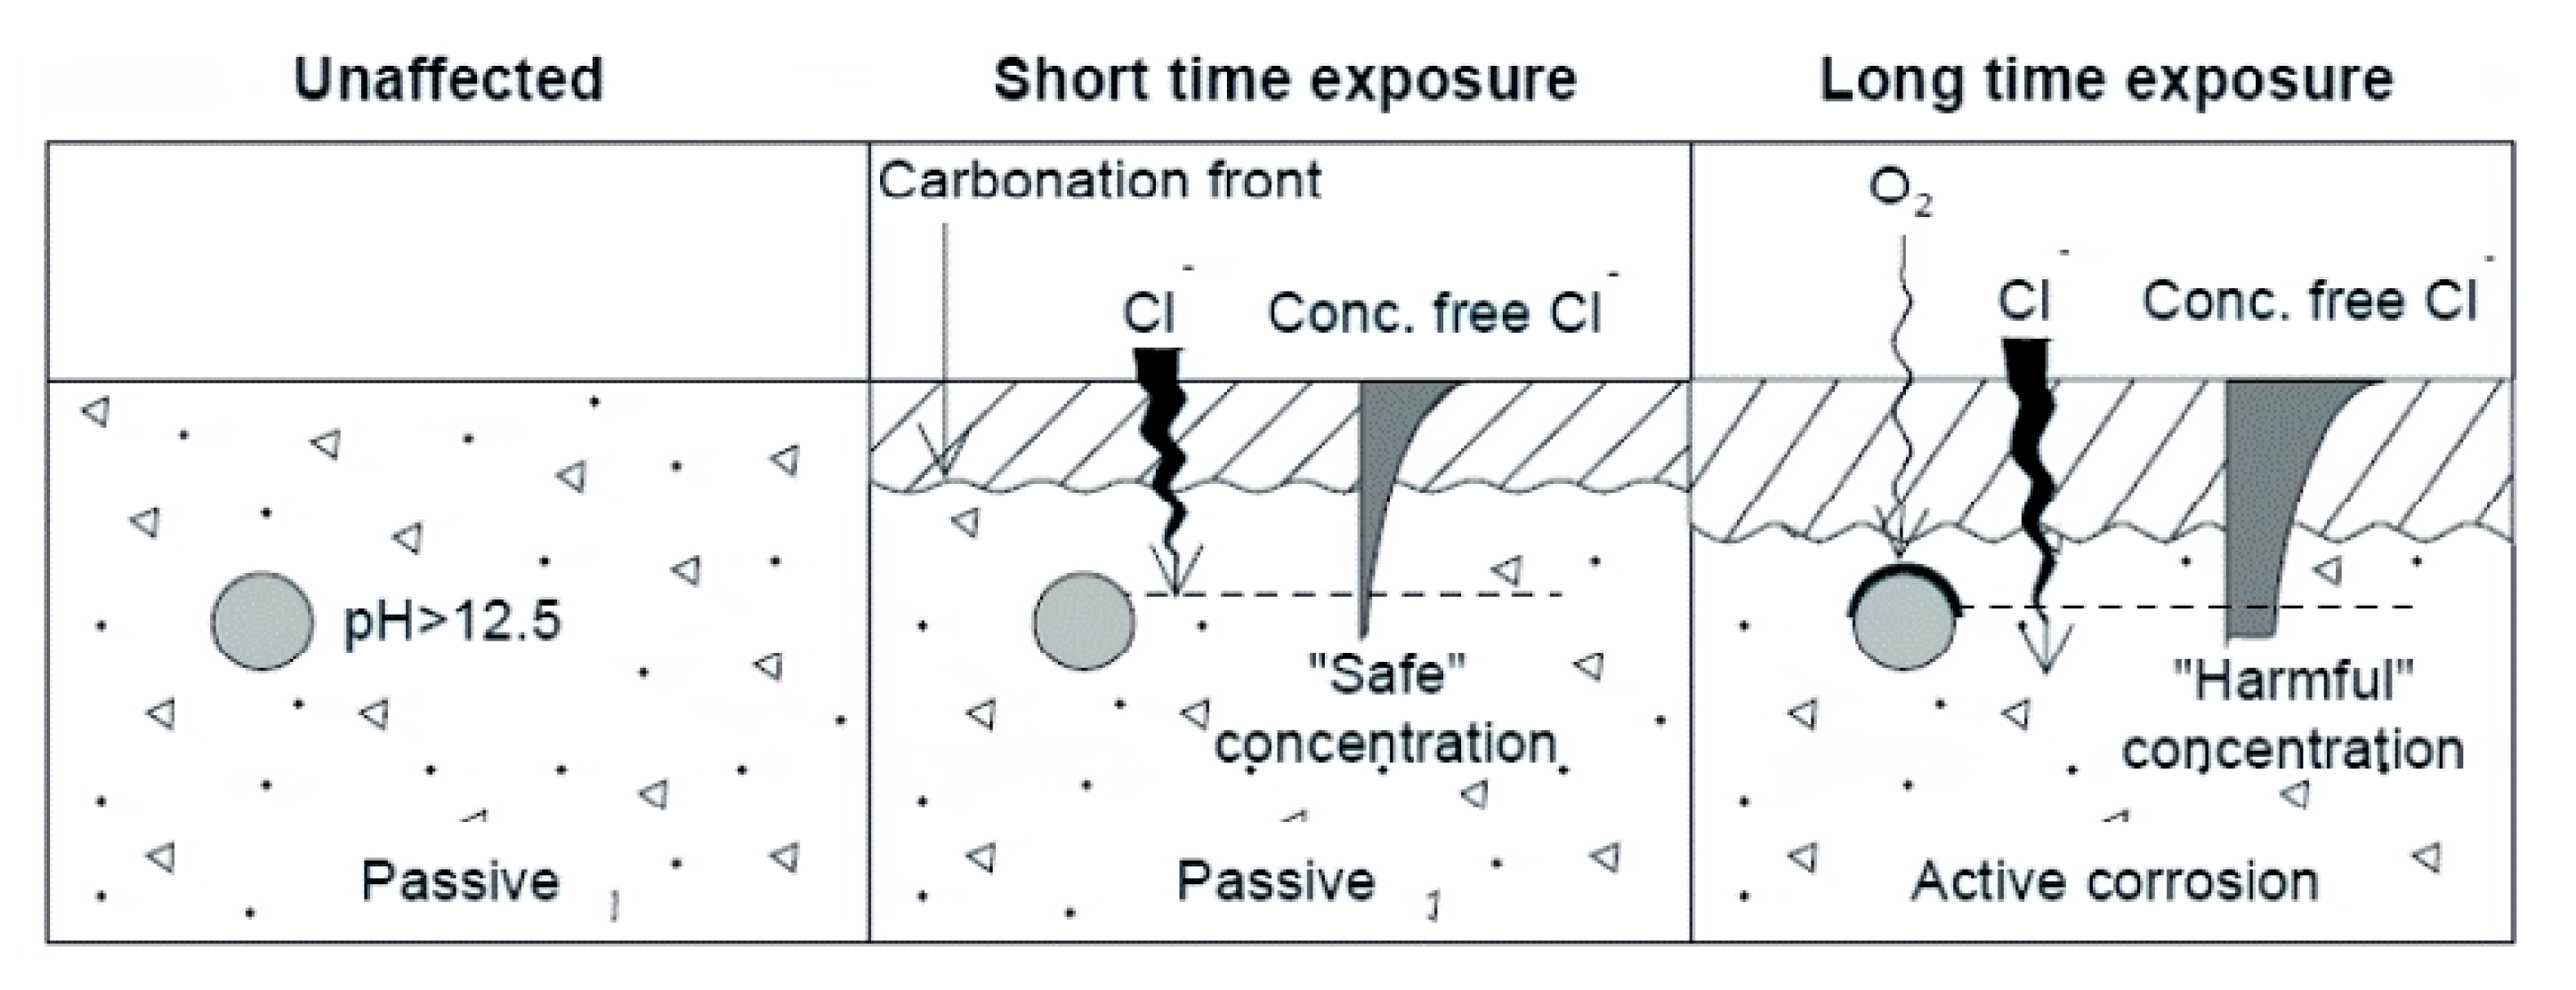
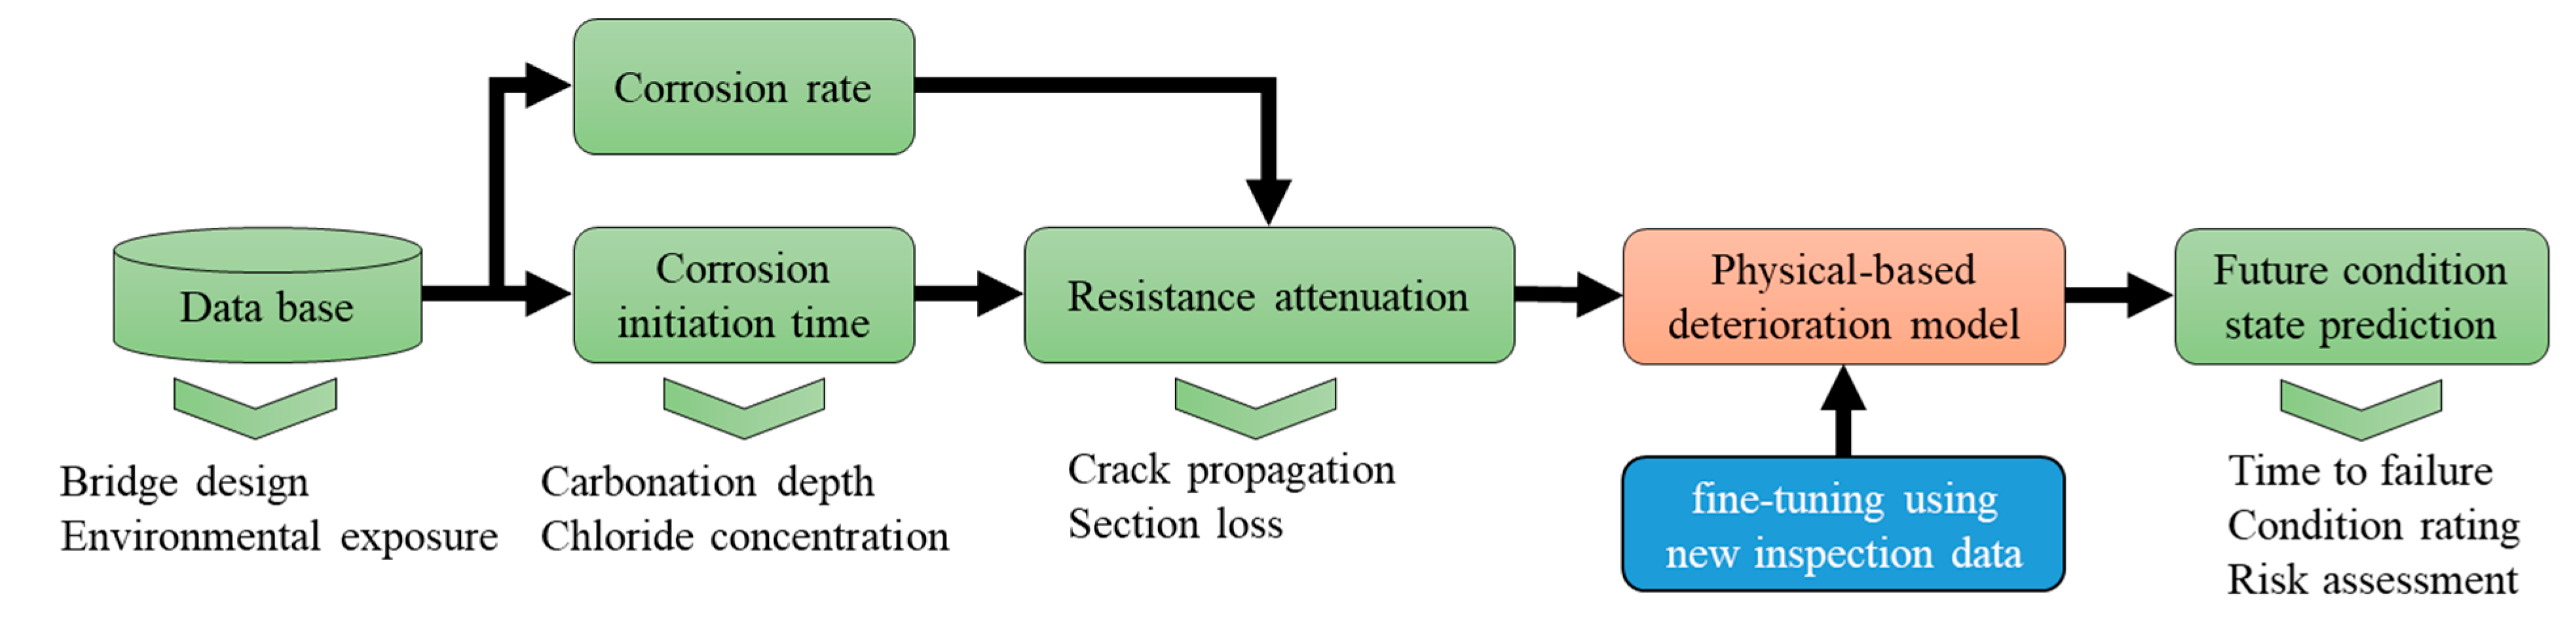
4.4.2. Mechanistic Deterioration Models

Mechanistic models do not depend on qualitative measurements of bridge conditions; instead, they rely on the mechanical, physical, and environmental parameters that control the deterioration of concrete bridges. These parameters are used to simulate the deterioration processes to evaluate the structural reliability and predict the future condition rating of concrete bridges. This simulation can be integrated into bridge management systems to ensure timely maintenance and rehabilitation [62].
Upon reviewing the literature, corrosion modeling emerged as the most commonly used mechanistic deterioration model, as depicted in Table 11. Corrosion simulation primarily focuses on modeling the time to corrosion, corrosion rate, and the effects of corrosion on structural resistance. In sound concrete, the reinforcement is protected by a passivation layer created by a high-pH environment [80]. However, with the penetration of moisture and chloride ions or if carbonation reduces the pH of the concrete cover, corrosion initiates, as illustrated in Figure 13 [81,82]. Once corrosion starts, there will be a progression in rebar section loss and accumulation of corrosion by-products that cause internal stresses in the concrete cover, leading to cracking and spalling [83].
The study by Liu and Weyers [84] formulated the base for most corrosion-based mechanistic deterioration modeling. In their study, Liu and Weyers conducted experimentation to estimate the corrosion rate as a function of time, temperature, chloride content, and concrete ohmic resistance. In the same vein, Parameswaran et al. [85] investigated the carbonation rate in different concrete mixes and linked it with time to corrosion to provide guidelines for better concrete designs. Moreover, Balafas and Burgoyne [86] presented a numerical framework to predict the build-up of pressure caused by corrosion byproducts. Accordingly, the model was used to predict the time of concrete cover failure. Hu et al. [87] employed the same concepts and included variations in design and environmental parameters to provide a framework of mechanistic models based on corrosion-induced damages, as illustrated in Figure 14.
More recently, Atadero et al. [88] developed a deterioration model that predicts the remaining service life of bridges by modeling both corrosion initiation and corrosion-induced cracking. They incorporate Bayesian updating based on new inspection data to enhance prediction accuracy over time. The model was employed to plan inspection intervals to ensure timely maintenance. Wang et al. [89] simulated the corrosion initiation and propagation to predict cracking time. The model was calibrated by comparing the expected crack with data-driven deterioration curves.
Moreover, Heo [90] modeled bridge resistance deterioration in corrosive environments and under varying traffic conditions. The model was calibrated using historical inspection data to enhance its reliability. Similarly, Yuan et al. [91] introduced a Gamma process-based model to mathematically model the resistance deterioration of concrete bridge components under the influence of environmental, material, and load factors. The resistance deterioration included the sequential effects of carbonation, corrosion, cracking, and section losses using the fuzzy evaluation method combined with the analytic hierarchy process (AHP). The deterioration model was validated through experimental loading tests.
Mechanistic models provide quantitative deterioration forecasting to evaluate the reliability of bridge elements with limited historical data. However, these models are complex and computationally demanding, rendering them not appropriate for network-level modeling [75,92]. Moreover, most available mechanistic deterioration models predict damage in straightforward scenarios and do not account for complex factors such as the presence of epoxy overlays, cathodic protection, maintenance interventions, and other complications. Thus, these models are considered more suitable for the project level or as supplementary to other deterioration modeling [93].
Table 11. Summary of mechanistic deterioration modeling approaches in the literature.
RefComponentLocationDeterioration IndicatorMethodologyObjectiveFactors
[62]DeckKoreaChloride corrosion.Corrosion modeling, stress-strain evaluation.Time to failure.Traffic loads, environmental effects, material, and structural evaluation.
[85]BridgeIndiaCarbonation corrosionTime to corrosion-Carbonation rate. Time to failure.Material, environment, and cover depth.
[94]GirdersColombiaChloride corrosion and fatigue.Model corrosion–fatigue under various environments. Time to failureFatigue loads, and environment.
[12]BridgeIranChloride corrosion-crack.ANN to model corrosion cracking.Maintenance planning.Environment, chloride, cover depth, and material.
[3]Deck and superstructureCanadaChloride corrosion.Finite element modeling. Reliability analysisStructure, loads, and environment
[95]BridgeUKChloride and carbonation-corrosion.Corrosion modelingcondition-monitoring.Overweight trucks.
[96]BridgeChinaChloride corrosion Corrosion and resistance attenuation modeling.Time to failure.Loads and material.
[97]DeckAustraliaGPR corrosivity.Finite element model Reliability index.Design and age.
[98]BridgeAustriaChloride corrosionChloride ingress modelReliability analysis.Age, material, environment, and cover depth.
[88]DeckNBIChloride corrosion.Time to corrosion and cracking, Bayesian updating.Inspection planning.Age, material, and environment.
[90]Girders and deckKoreaChloride corrosion Corrosion rate and resistance attenuationReliability index.Environment, Age, and ADT.
[91]BridgeChinaChloride and carbonation corrosion.Gamma process, AHP, and fuzzy to model resistance deterioration.Load rating, reliability assessment, and time to failure.Age, environment, and load.
[99]GirdersChinaChloride corrosion Flexural capacity degradation Reliability indexAge, environment, material, and load.
[89]ColumnNew York DOTChloride corrosion Corrosion-cracking propagation simulationCondition prediction.Age and environment.
[100]BridgeAustraliaChloride and carbonation corrosion.Faraday’s law for corrosion modeling.Reliability index.Age.

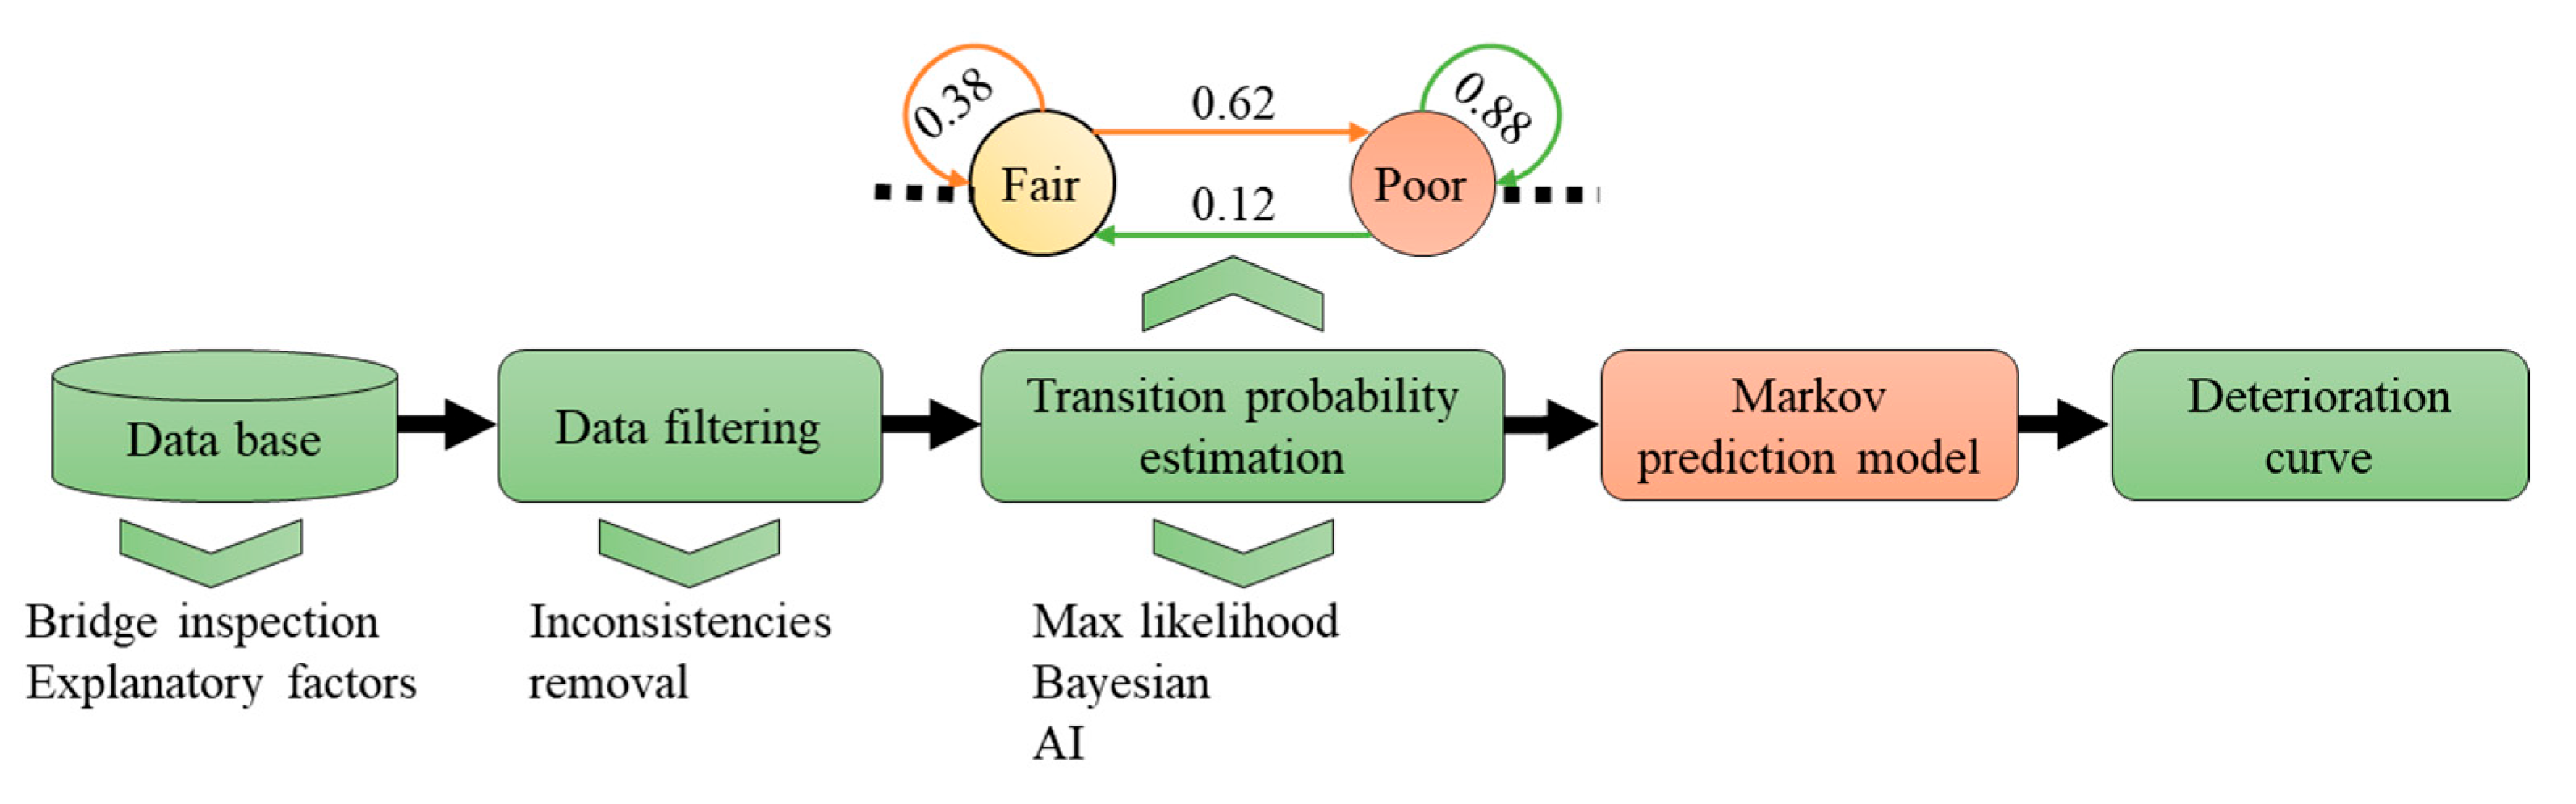
4.4.3. Stochastic Deterioration Models

Stochastic models assume that bridge deterioration results from one or more random variables. These models capture the uncertainty and randomness inherent in the deterioration process. As illustrated in Table 12, stochastic models are primarily classified into state-based and time-based models.

State-Based Markov Models

In state-based models, known as Markov chain, deterioration is modeled by predicting the probability of transition from one condition state to another during a discrete time period, given a set of explanatory factors such as material type, climate, and Average Daily Traffic (ADT) [101]. Transition probability estimation is the main step for developing Markov-based deterioration models. Markovian transition probabilities are obtained from experts’ opinions and inspection data using various methods. These methods mainly include empirical estimation using transition frequencies [14], Maximum Likelihood Estimation (MLE) for larger datasets [102], Bayesian estimation to incorporate prior knowledge [103], and AI for complex factors [101]. The general framework for developing a state-based Markov deterioration model is illustrated in Figure 15.
Markov chain theory assumes that the transition probability is only dependent on the current state (memoryless), and the probability remains constant through the bridges’ service life [104]. Transition probability from state i to state j can be mathematically presented as illustrated in Equation (8). The transition probabilities are typically arranged in a transition probability matrix P, as illustrated in Equation (9) [105]. The probability matrices are usually developed for data subsets under the effect of uniform deterioration factors. Accordingly, the expected condition state after a time period can be calculated using Equation (10). Subsequently, the annual predictions can be used to develop deterioration curves (Figure 16) to evaluate the performance of structures with specific explanatory factors.
P X n + 1 = j X n = i .
P = p 11 p 1 m p i j p m 1 p m m
E ( t ) = P ( 0 ) × P t × S
where Xn is the condition state of the bridge at time-step n, Xn+1 is the state of the bridge after one time-step, P is the transition probability matrix, pij is the probability of transition from condition state i to condition state j, m is the number of condition states, E(t) is the expected condition state after time period t, P ( 0 ) is the initial condition vector, and S is the vector of all possible condition states.
As illustrated in Table 12, Bayesian estimation was the most commonly used method for modeling the transition probabilities [103,106,107]. Bayesian theory incorporates measurable deterioration factors such as bridge age, environmental exposure, and bridge type and integrates them with unknown random variables. In addition, it allows for incorporating expert judgment when data are limited. Mishalani et al. [102] compared Bayesian with the max likelihood for updating transition probability, and Bayesian was superior. Moreover, to deal with the problem of missing data, Mašović and Hajdin [108] employed an expectation-maximization algorithm, which iteratively predicts the missing inspection, to provide complete transition probabilities for a discrete Markov chain.
Mechanistic modeling was also employed to obtain transition probabilities for Markov chain models. For instance, Zhang et al. [109] simulated the expected thermal loads and applied them to a finite element model to obtain Markovian transition probabilities. Subsequently, Bayesian updating was applied based on new inspection data to refine the model’s accuracy. Moreover, Khatami et al. [110,111] simulated corrosion initiation and propagation to predict the Markovian transition probabilities. Subsequently, data-driven transition probabilities were used to calibrate the deterioration models.
AI was also utilized to estimate the transition probabilities of Markovian deterioration models in complex datasets following the framework outlined in Figure 17. For instance, Yosri et al. [112] employed a genetic algorithm (GA) to estimate temporal state transition probabilities. Moreover, Liu et al. [101] used a convolutional neural network (CNN) to estimate transition probabilities in the presence of complex influencing factors. Similarly, Zhang et al. [77] trained an artificial neural network (ANN) using NBI data to predict bridge condition ratings and used genetic algorithms to derive the Markov chain’s transition probability matrix that matches the predicted deterioration curve derived from the ANN. AI can improve the reliability and subjectivity of Markovian transition estimation. However, the major drawback is that deep learning models lack reliability when training data are insufficient. For example, if there are no recorded observations for bridges with a certain condition rating, the number of transitions observed from this rating to others would be zero [101].
Markov models offer a straightforward approach to predicting bridge conditions at the network level and are compatible with limited and discrete bridge condition data. However, these models assume uniform deterioration rates and stationary transition probabilities and rely solely on the current condition, which is an unrealistic simplification [113]. In addition, the transition probabilities are often challenging to assess objectively [92]. Thus, these models usually provide a qualitative prediction of future condition states, making them unsuitable for reliability assessment [14].

State-Based Semi-Markov Model

The Semi-Markov model is an extension of Markov chain models where the time the bridge stays in a condition state (sojourn time) is taken into consideration [114]. Thus, the transition becomes dependent on the current condition state and the time spent on that condition state, as illustrated in Equation (11). The sojourn time is expressed as a random variable using probability distributions such as Gamma or Weibull [115].
Q i j t = P X n + 1 = j , T s n + 1 T s n t X n = i
where the Semi-Markov kernel Q i j t is a one-step transition to prosperity, and T S n + 1 T S n is the duration for successive transitions where the time needed to transition to j starting from the moment of making the transition to i is less than t.
In this regard, Sobanjo [115] developed a Semi-Markov model to predict future bridge conditions by creating transition probability kernels to improve the accuracy of bridge condition forecasting. Guo and Liang [116] integrated mechanistic models with stochastic models to plan the maintenance of concrete elements subjected to chloride-induced deterioration. In their model, Guo and Liang [116] used Fick’s Law to model chloride diffusion and Semi-Markov chains to model the probabilistic transitions between various deterioration states. Moreover, Furtado and Ribeiro [117] used semi-Markovian models to evaluate the effect of various deterioration factors and found that length, span number, and environmental conditions are critical deterioration factors. In addition, Zambon et al. [9] utilized Semi-Markov models based on VI and analytical deterioration models. In their model, the sojourn times within the Semi-Markov framework were derived from analytical deterioration models of carbonation-induced corrosion. By accounting for these underlying processes, the developed model provided a more realistic assessment of bridge conditions over time [9].
The Semi-Markov model is a more comprehensive approach than the conventional Markov chain models as they take into consideration the current state and the time spent in that state. Thus, they enhance the accuracy of condition predictions [115]. Moreover, the time dependency enables the model to handle irregularities in inspection intervals in cases where inspections are not uniformly spaced. However, Semi-Markov models require more complex and extended data collection, rendering it unfeasible for limited databases [117].

Time-Based Stochastic Models

Following the framework illustrated in Figure 18, Time-based methods model the time an element stays in a particular condition state as a random variable, using probability distributions such as the Gamma and Weibull distributions, as depicted in Figure 19. In this regard, Sobanjo et al. [118] applied fit tests for lognormal, exponential, and Weibull distributions to model sojourn times at various condition states, taking into consideration the effect of bridge age, type, and location. Weibull was the best-performing distribution for evaluating the reliability of various bridge categories. Similarly, Zambon et al. [113] compared multiple stochastic prediction models, and the findings indicated that gamma-based models perform better than others.
Probability distributions were employed to simulate future deterioration, conduct survival and failure probability analyses, and perform reliability assessments. For instance, Nasrollahi and Washer [119] employed a time-based stochastic model to optimize the inspection intervals for bridge superstructures by estimating the time to failure at a 5% probability. The results indicated that the standard 24-month interval used by NBI is significantly shorter than necessary, especially for superstructures in non-poor conditions. Zambon et al. [113] developed gamma distribution-based deterioration models after dividing the data into subgroups under uniform influencing factors, including type, distance to the sea, material, and age. In the same vein, Manafpour et al. [120] used a gamma distribution-based model to study the effect of explanatory factors on bridge deck deterioration. Accordingly, the most critical factors were the type of rebar protection, span type, number of spans, bridge deck length, bridge location (interstate or instate), type of overlay, and interstate routes.
Time-based models explicitly present deterioration as a function of time and capture the randomness incorporated into the deterioration process. As a result, time-based models are often used to model the age-dependent probability of failure to plan maintenance and inspection activities [119]. However, these models require a substantial amount of condition data to represent complex distribution parameters accurately. Therefore, time-based models are best suited when there is a significant amount of historical inspection data available [14].
Table 12. Summary of stochastic deterioration modeling approaches in the literature.
RefComponentData SourceCategoryMethodologyFactors
[106]DeckAustraliaState-basedMarkov and Bayesian theoryEnvironmental exposure, structure type, and age.
[115]BridgeFlorida DOTState-basedSemi-MarkovianAge, type, and location.
[107]DeckJapan VIState-basedMarkov and Bayesian theoryStructural, amount of decaying salts, and age.
[108]BridgeSerbia DOTsState-basedMarkov chains and expectation maximization algorithm.Age.
[121]BridgeNew Zealand DOTsState-basedSemi-MarkovianMaterial and age.
[102]DeckOhio DOTState-basedMarkov and Bayesian theoryAge.
[103]DeckQuebec DOTState-basedMarkov and Bayesian theoryBridge defects, and age.
[9]BridgeAustriaState-basedAnalytical deterioration models and Semi-MarkovAge, material, and environment.
[110]BridgeFlorida DOTState-basedCorrosion-cracking simulation and Markov.Age and environment
[112]BridgeOntario DOTState-basedGA-MarkovAge and material.
[116]BridgeSynthesizedState-basedSemi-MarkovianChloride diffusion.
[117]BridgeBrazil DOTsState-basedSemi-MarkovianMaterial, age, span number, length, bridge typology, traffic load, and environmental conditions.
[101]BridgeNBIState-basedCNN-MarkovAge, ADT, ADTT, maintenance actions, inspection history, climate, and 19 design parameters.
[111]DeckFlorida DOTState-basedCorrosion-cracking simulation and Markov.Age and environment.
[109,122]Bridge pylons, and columns.ChinaState-basedThermal loads, finite elements and MarkovTemperature.
[123]Box Girder BridgesNBIState-basedSemi-Markovian and Weibull distributionAge and bridge length.
[77]BridgeNBIState-basedReliefF, ENN, and MarkovAge, ADTT, material, bridge type, and skew.
[92]BridgeNew York DOTTime-basedCompared time-based and state-basedRegion, material types, and design types.
[118]BridgeFlorida DOTTime-basedWeibull distributionAge, type, and location.
[119]SuperstructureNBITime-basedWeibull distributionMaterial, and age.
[113]DeckPortuguese DOTsTime-basedGamma distributionType, distance to the sea, material, and age.
[120]DeckPennsylvania DOTTime-basedWeibull distributionStructural, average daily traffic (ADT), route type, and environmental conditions.
[124]DeckNBITime-basedWeibull and lognormal distributions.Environmental factors.

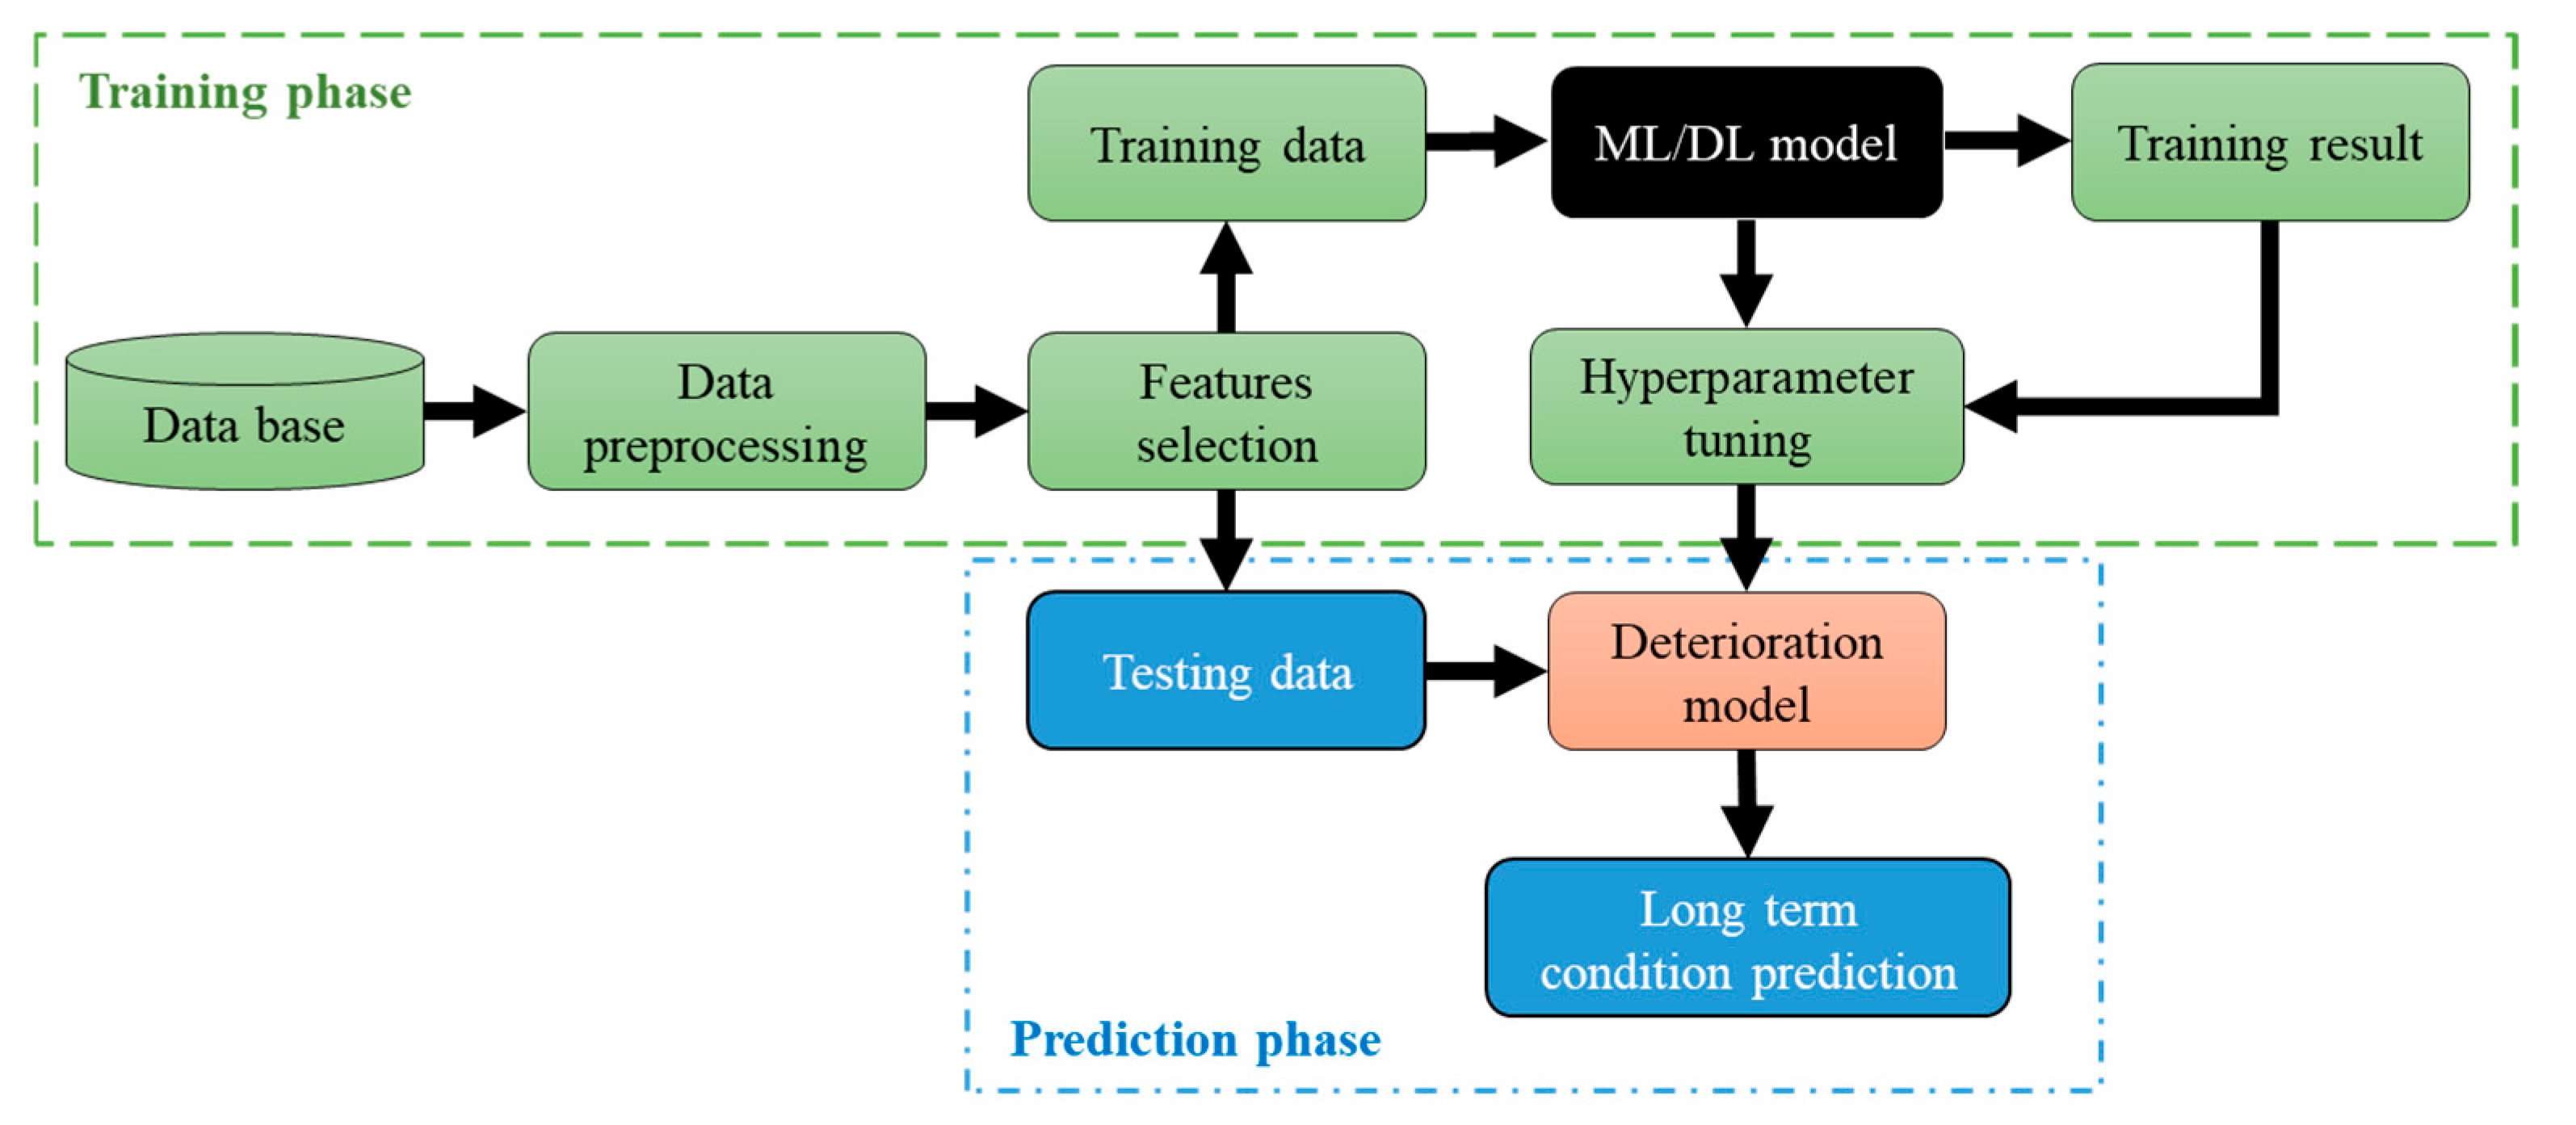
4.4.4. Artificial Intelligence Deterioration Models

AI has been extensively used to model the deterioration process due to its capabilities to handle complex, nonlinear, and large datasets. AI techniques such as ML and DL offer advanced capabilities in analyzing and comprehending the deterioration patterns in concrete bridges. ML and DL concrete bridge deterioration models are trained on historical inspection data under explanatory factors such as age, structural properties, environmental conditions, and traffic loads. The trained models are then used to predict the condition and simulate the deterioration of bridges under specific explanatory factors [11]. As illustrated in Table 13, traditional ML and DL models, along with sequential DL and physics-informed ML models, have been employed for enhanced deterioration modeling and condition prediction.

ML and DL Deterioration Models

The general scheme for developing ML and DL-based deterioration models is illustrated in Figure 20. ML models have been used to provide accurate predictions with limited training data. For instance, Mia and Kameshwar [125] used random forest (RF) to predict the deck, superstructure, and substructure conditions by training the model using NBI data. In addition, Rajkumar et al. [126] combined an autoencoder (AE) deep learning model with RF to improve prediction accuracy. The AE-Rf achieved remarkable accuracy of up to 79% in predicting condition ratings without using extensive historical condition data, rendering it reliable for applications with limited data.
With large databases like the NBI, training DL networks for deterioration modeling has become more feasible. Santamaria Ariza et al. [11] conducted a comparison between the commonly used deterioration modeling methods, such as Markov models, with Artificial Neural Networks (ANNs) models. The quality of fit between the observations and predictions demonstrated that ANN was the most accurate method. In addition, Li and Burgueño [127] conducted a comparative study between different ANNs to predict the condition rating of deck abutments. Accordingly, Ensembles of Neural Networks (ENNs) was the most efficient algorithm and achieved an average prediction accuracy of 86%. In addition, Zhu and Wang [128] employed the ReliefF feature selection algorithm to select 13 of 25 explanatory factors to train a DL deterioration model. The DL model combined a five-layer stack of ConvSRUs for temporal patterns with a CNN that includes three spatiotemporal convolutional layers and two fully connected layers to capture spatial features. This hybrid setup effectively modeled spatial and temporal deterioration patterns and achieved an accuracy of up to 90%.
DL-based deterioration models improved condition prediction accuracy by capturing the complex effects of a wide range of deterioration factors. However, these models require well-structured and comprehensive bridge condition databases, such as the NBI, which may not be available for some DOTs. To address this challenge, Feng et al. [129] used a natural language processing-based ML approach to extract the condition data from inspection reports. Indeed, further research is required to develop feasible solutions for establishing structured databases.

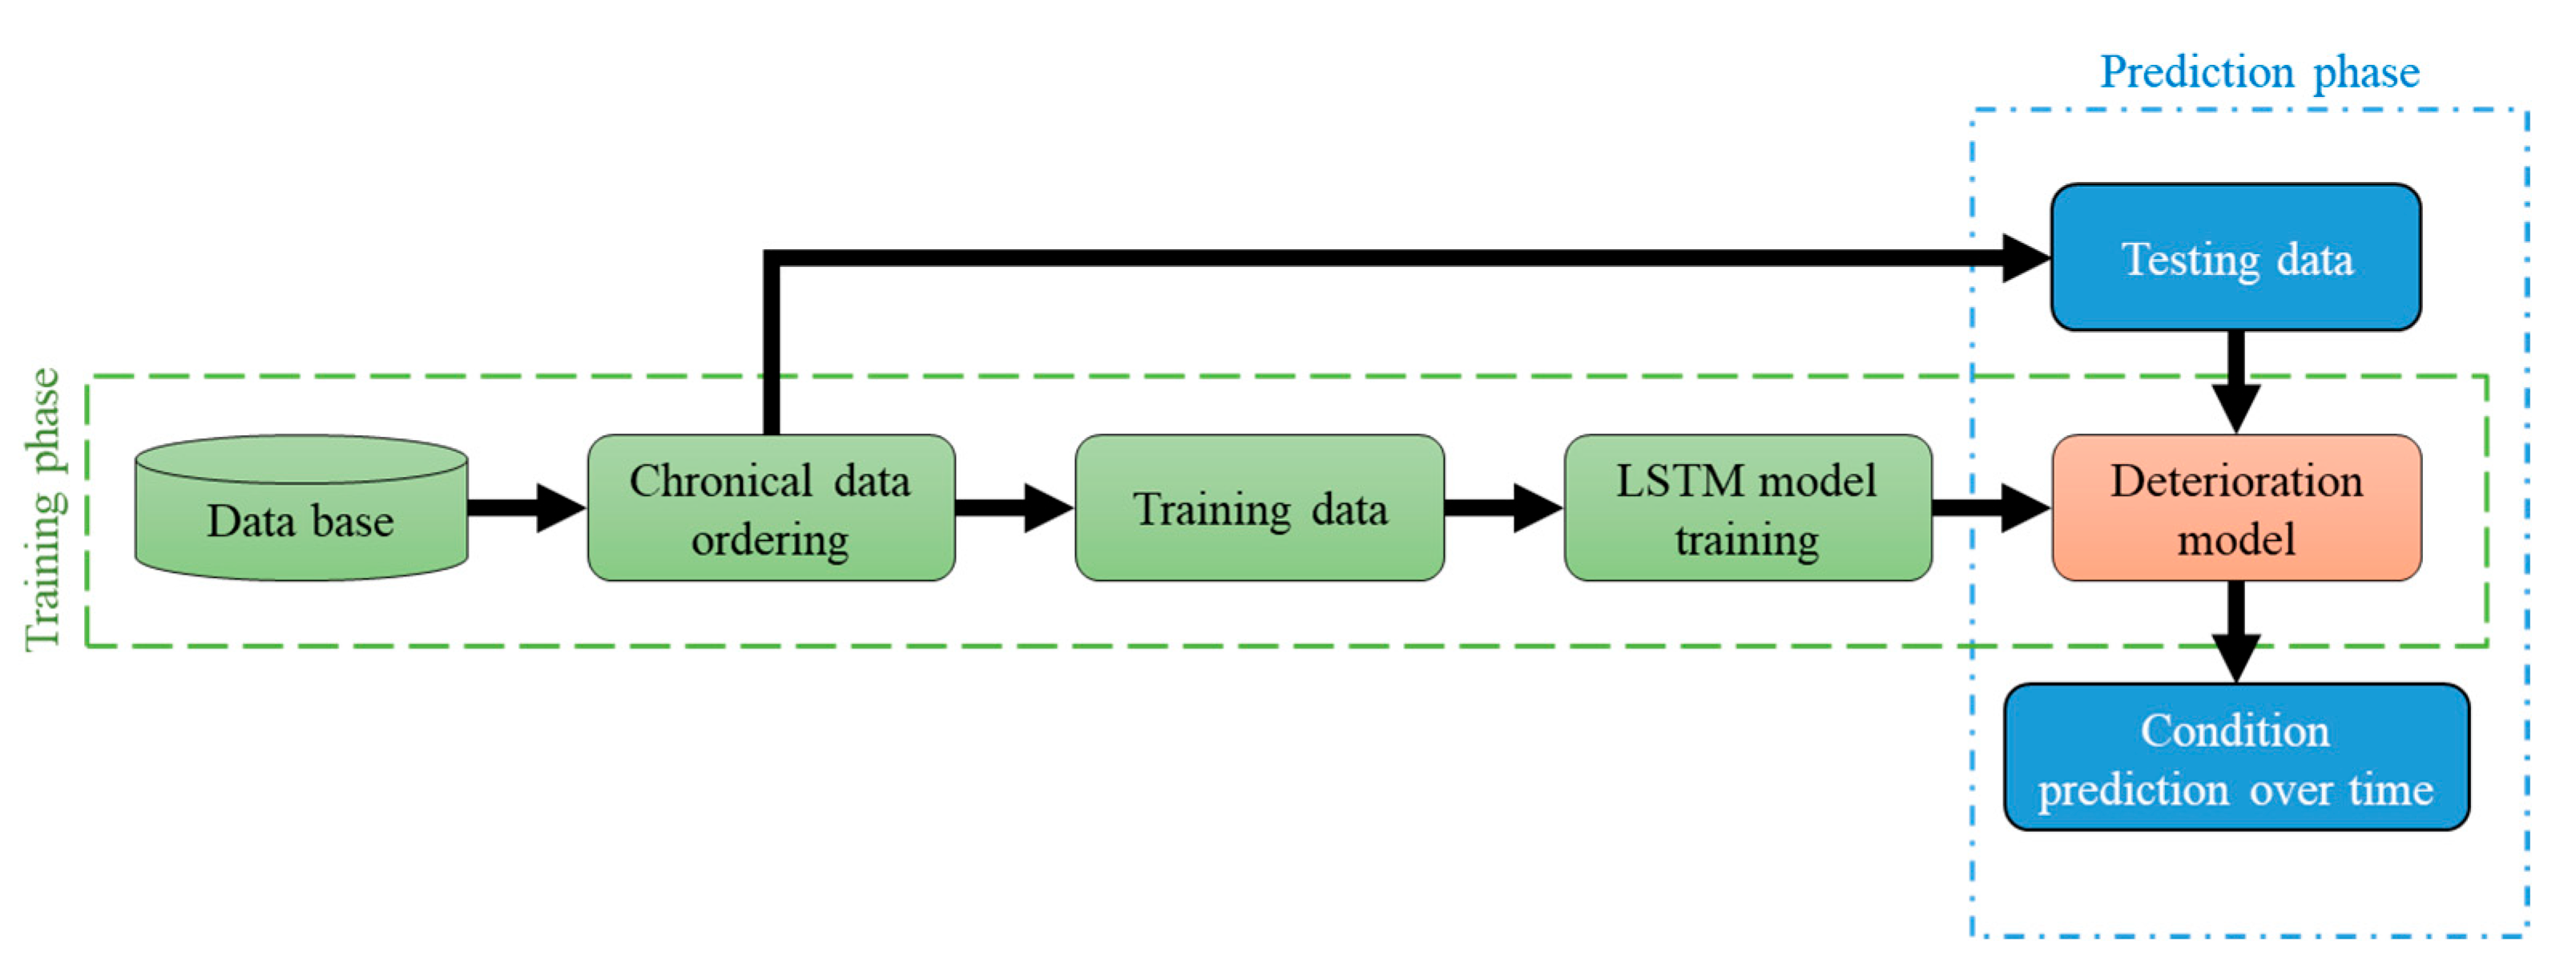
Sequential DL Deterioration Models

Sequential deep learning models use chronologically ordered condition data to analyze how bridge decks deteriorate over time, where each condition state is considered to be influenced by past states. In this regard, Kwon et al. [130] used long short-term memory (LSTM), a specific RNN architecture designed to handle time-series data, to model the carbonation considering the history of environmental data. The developed carbonation model overcame the limitations of ordinary models in the literature. Similarly, as illustrated in Figure 21, Miao et al. [131] employed LSTM-RNN to model the deterioration process, where 12 influencing factors were represented by time-related vectors and fed to the model in chronological order. Although the model achieved 80% accuracy, it was complex and sensitive to uncertainties in the influencing factors. Similarly, Jing et al. [132] compared an LSTM-RNN model with regression models and found that the LSTM-RNN model was superior in predicting bridge condition ratings.
Sequential deep learning models can capture the time-based patterns that reflect how the current condition behaves in the future. Models like LSTM can improve condition prediction accuracy by capturing the temporal dependencies in condition data and environmental exposure [131]. Accordingly, this improves maintenance planning and prevents critical failure [132]. However, these models demand high-quality data to capture the long-term dependencies. Thus, these models are sensitive to uncertainties in the influencing factors [131].

Knowledge-Informed ML Deterioration Models

Knowledge-informed machine learning (ML) models were used to improve deterioration modeling and reduce the demand for historical data by leveraging the precision of physical theories and the robustness of ML algorithms. In this regard, Kazantzi et al. [133] used finite element models to evaluate the vertical drift ratio (VDR) caused by tendon loss. Subsequently, the k-nearest neighbors (K-NN) algorithm was employed to predict the damage state based on the VDR without the need for expensive finite element models. Moreover, Hu and Liu [134] developed a physics-informed machine learning model (DT-Onto) to predict bridge deterioration. As illustrated in Figure 22, an ontology, which is a representation of physical knowledge in a structured format, was used to incorporate knowledge related to defects such as corrosion, carbonation, and cracking into the loss function of the machine learning model. This helps to capture semantic relationships and physical mechanisms affecting the data to support more accurate condition predictions.
Hu and Liu [134] used experimental results to demonstrate that knowledge-informed ML enhanced the accuracy of concrete deck condition forecasting by 10.0% compared to standalone ML methods. This approach also improved the interpretability of the prediction outcomes, highlighting the potential of the proposed ontology to represent structural deterioration knowledge and automatically instantiate mathematical physics models for physics-informed ML-based bridge data analysis. Knowledge-informed ML models demonstrated improved training and condition prediction performance. However, they are often complex and require more research to prove their effectiveness in complex problems such as bridge deterioration. To manage this complexity, some concepts are often excluded to avoid unnecessary complexity. Additionally, these models also lack the ability to handle incomplete information in complex datasets. There is also a need for advanced and adaptable neural network architectures to handle large and imbalanced datasets. Despite these challenges, this approach has the potential to improve deterioration modeling and reduce the demand for historical data [134].
Table 13. Summary of AI-based deterioration modeling approaches in the literature.
RefComponentDataMethodPerformanceFactors
MetricResult
[135]DeckWisconsin DOTANOVA, ANNAccuracy75%Age, maintenance history, inspection history, district, ADT, environment, and 5 design parameters.
[136]BridgeNBICNNAccuracy85%.Geographic location, ADT, ADTT, operation history, age, and 11 design parameters.
[127]AbutmentNBIENNsAccuracy86%Age, temperature, ADT, surface type, structural type, and 3 design parameters.
[11]DeckNBIANNsMAE0.31Age.
[137]BridgeChinaU-NetAccuracy92%Age, ADT, ADTT, maintenance actions, inspection history, and 10 design parameters.
[128]BridgeTexas DOTReliefF, RNN, and CNNAccuracy80–93%Age, Geographic location, ADTT, inspection history, and 6 design parameters.
[138]DeckMichigan DOTCatBoostAccuracy96%Age, ADT, inspection history, 4 design parameters
[139]BridgeOntarioMGGPRMSE2.85Age, Geographic location, climate, inspection history, material, geometry.
[75]DeckNBIXGBoostAccuracy70%Age, freeze–thaw, ADTT, and rainfall.
[76]DeckJapanRNNAccuracy85%Age, environment, ADT, ADTT, deck type, deck area.
[125]BridgeNBIRFAccuracy93%Age, ADT, ADTT, maintenance actions, inspection history, climate, and 19 design parameters.
[126]BridgeNBIAE-RFAccuracy90%Age, ADT, inspection history, and 3 design parameters.
[130]DeckKoreaLSTMRMSE5.25Age and environment.
[131]BridgeJapanLSTMAccuracy80%Age, elevation, ADT, ADTT, temperature, CO2, salt, weather, length, and width.
[140]DeckNBILSTM-CNNAccuracy95%Age, Geographic location, ADT, ADTT, inspection history, 2 design parameters.
[132]Box girderChinaLSTM-RNNRSME1.135Age, inspection history, ADT, length, and width.
[141]DeckNBICNN-LSTMAccuracy90%Age, inspection history, ADT, environment, and 10 design parameters.
[134]BridgeNBIDT-KL-OntoPrecision/Recall75%/33%Age, climate factors, loading, material, design.
[133]BridgeGreecek-NN and finite element--Vertical deflection and concrete properties.

5. Gaps and Future Directions

This paper presents a comprehensive review of concrete bridge condition rating and deterioration modeling approaches. Accordingly, the main challenges and research gaps in these areas are identified, along with proposed future directions to advance this critical field of study.

5.1. Condition Rating Methods

5.1.1. Current State in Condition Rating

  • The ratio-based condition rating method offers an objective and comprehensive assessment of bridge conditions by evaluating the severity and extent of defects. This approach provides a detailed overview of defect quantities and severities, facilitating the planning of maintenance, repair, and rehabilitation activities, as well as enabling efficient resource allocation at the network level. However, its application may be limited for agencies lacking the element-level evaluation required to assign a health index. Moreover, incorporating the quantitative cost of defects involves multiple assumptions and uncertainties, which can affect the method’s reliability.
  • The weighted categorical condition rating method offers a comprehensive perspective on bridge condition and aids in planning maintenance and rehabilitation activities by providing a consistent framework within the agency. However, accurately determining the weight or impact of individual element conditions on the overall structural integrity of the bridge remains a significant challenge.
  • The worst-conditioned component method plays a crucial role in identifying high-risk bridges and evaluating their vulnerability during extreme events or disasters. This approach also aids in comparing bridge conditions and performance across different DOTs, allowing for the identification of trends in the deterioration or improvement of the nation’s bridge infrastructure. Despite its advantages, this method has limitations, as it does not offer a comprehensive view of how deterioration is distributed throughout the entire bridge structure.
  • The condition rating approaches in the literature and industry heavily rely on qualitative VI, which depends significantly on the subjective judgment of inspectors. As a result, VI may underestimate or overestimate the severity of observed defects and may overlook underlying issues. Incorporating quantitative DL-based surface defect detection and NDE techniques can provide more objective evaluations. Additionally, the use of fuzzy logic offers a promising method to reduce uncertainty in condition ratings.

5.1.2. Condition Rating Research Needs and Future Directions

  • The condition rating approaches in the literature and industry heavily rely on subjective assumptions. For instance, in the ratio-based condition rating method, more research is needed to provide more objective assumptions regarding defects’ quantitative cost. In addition, in the weighted categorical condition rating method, further research is still needed to objectively determine the weight or impact of elements’ conditions on overall bridge structural integrity, considering variations in bridge design and other influencing factors.
  • DL surface defects evaluation promises to address the limitations of VI. However, the performance of these models is constrained by the availability and the quality of training datasets. In addition, quantifying damage dimensions and integrating spatial positional data into the detected defects remain underexplored, despite their importance for structural health assessment. These limitations underscore the need for future research to develop scalable, accurate, and multifunctional damage detection systems that incorporate advanced frameworks for defect detection, quantification, and spatial positioning.
  • NDE and fuzzy logic have the potential to reduce the uncertainties associated with condition rating approaches. However, NDE methods currently lack standardized protocols to ensure consistent and reliable condition assessments. Furthermore, research on applying fuzzy logic in this area remains limited. Therefore, there is an urgent need to develop systematic methodologies for standardizing and integrating NDE and fuzzy logic into bridge condition rating systems, enabling bridge inspectors to readily implement these approaches and minimize uncertainty in condition assessments.
  • Future research is also needed to propose multi-dimensional condition rating frameworks that integrate various rating methods, leveraging the strengths of each approach. This framework could include tools to translate ratings between methods for a more comprehensive assessment of bridge conditions.

5.2. Deterioration Modeling

5.2.1. Current State of Deterioration Modeling

  • Statistical deterioration models are simple and provide valuable insights into deterioration trends and significant deterioration factors, especially at the network level. However, these models do not take into consideration the inherent uncertainty in infrastructure deterioration. In addition, these models cannot represent the interaction between bridge elements.
  • Mechanistic models provide quantitative deterioration modeling to predict damages in bridge elements and are suitable for reliability analysis. However, these models are complex and computationally demanding, rendering them inappropriate for network-level modeling. Moreover, most available mechanistic deterioration models predict damage in straightforward scenarios and do not account for complex factors such as the presence of epoxy overlays, cathodic protection, maintenance interventions, and other complications. Thus, these models are considered more suitable for the project level or as supplementary to other deterioration modeling
  • Markov models provide a simple stochastic method for predicting bridge conditions and generating survival-analysis curves at the network level. They are compatible with limited and discrete bridge condition data. However, these models assume uniform deterioration rates and stationary transition probabilities and rely solely on the current condition, which are unrealistic simplifications. In addition, the transition probabilities are often challenging to assess objectively. Thus, these models usually provide a qualitative prediction of future condition states, making them unsuitable for reliability assessment.
  • The Semi-Markov model is a more comprehensive approach than the conventional Markov chain models as they take into consideration the current state and the time spent in that state. Thus, they enhance the accuracy of condition predictions. Moreover, the time dependency enables the model to handle irregularities in inspection intervals in cases where inspections are not uniformly spaced. However, Semi-Markov models require more complex and extensive data collection, making it infeasible for limited databases.
  • DL-based deterioration models for concrete bridges hold significant potential for improving condition prediction accuracy by capturing the complex interactions among various deterioration factors. However, their effectiveness is heavily reliant on the availability of structured and comprehensive bridge condition databases, which are often lacking.
  • Sequential deep learning models can capture the time-based patterns that reflect how the current condition behaves in the future. Models like LSTM can improve condition prediction accuracy by capturing the temporal dependencies in condition data and environmental exposure. Accordingly, this improves maintenance planning and prevents critical failure. However, these models demand high-quality data to capture the long-term dependencies.
  • Knowledge-informed ML models demonstrated improved training and condition prediction performance. This method has the potential to improve deterioration modeling approaches and reduce the demand for historical data. However, they need more research to prove their validity in complex problems such as concrete bridge deterioration modeling.

5.2.2. Deterioration Modeling Research Needs and Future Directions

  • In stochastic models, assessing transition probabilities objectively is often challenging. Thus, integrating AI and mechanistic models with stochastic approaches, such as Markovian deterioration models, can significantly improve their predictive accuracy while maintaining minimal computational costs. Consequently, further research is essential to effectively merge AI and mechanistic models with stochastic deterioration modeling, offering promising advancements in predicting concrete bridge deterioration.
  • Physical-informed ML, can significantly enhance the efficiency and accuracy of condition prediction, reduce computational costs, and lessen the reliance on extensive historical data. However, there is a need to improve the representativeness of physics-informed machine learning by integrating new concepts from emerging mathematical physics models and extending its ability to capture the semantics of bridge data. In addition, future research should focus on developing frameworks that seamlessly integrate heterogeneous bridge data and scientific structural knowledge to develop efficient physics-informed ML methods.
  • To unlock the full potential of deep learning models, additional research is necessary to enhance their performance, optimize their computational efficiency, and improve their adaptability to various data conditions, including cases with incomplete datasets.
  • Many agencies do not have a comprehensive inventory of bridge conditions and inspection data necessary for modeling deterioration. There is a significant gap in effective methods for collecting data from the vast number of bridges across the country. Therefore, research is needed to develop and validate convenient, affordable, and scalable data collection methods using innovative technologies such as smartphones, drones, and cloud computing. Additionally, it is important to advance AI techniques to extract vital information from unstructured data sources, such as inspection images and monitoring reports. This will facilitate the use of diverse and non-standardized data formats in deterioration modeling.

6. Conclusions

This paper highlights the importance of concrete bridges and the need for robust condition rating and forecasting approaches to support more informed management decisions. In this regard, this paper conducted a comprehensive scientometric and systematic review analysis of 124 publications to comprehend the range of condition rating and deterioration modeling methods. The scientometric analysis examined research trends and identified prominent researchers, journals, institutions, and countries leading advancements in concrete bridge condition rating and prediction. This helps researchers to establish collaborative networks to progress in this critical field. Moreover, keyword analysis comprehended the trends in research subjects during the last two decades. For instance, research related to AI was more popular during the last 5 years, indicating a new trend in concrete bridge condition rating and prediction approaches.
On the other hand, the systematic review analysis offered a detailed understanding of concrete bridge condition rating approaches, including ratio-based, weighted categorical, and worst-conditioned component methods. It also revealed that these methods often rely on subjective visual inspections and incorporate subjective assumptions, introducing uncertainty and bias. To address these challenges, the study explored techniques such as non-destructive evaluation (NDE), computer vision, and fuzzy theory to enhance objectivity and reduce uncertainty in condition rating. Additionally, the comparative analysis of deterioration modeling approaches explored their methodologies, highlighting the advantages and limitations of statistical, mechanistic, stochastic, and AI-based models. A significant limitation of these models is their heavy reliance on well-structured historical databases. To address this, the study suggested the adoption of hybrid models to reduce dependency on historical data. Furthermore, it emphasized the need for research focused on developing accessible, cost-effective, and scalable data collection methods leveraging innovative technologies such as smartphones and cloud computing, in addition to methods for extracting essential information from unstructured data sources.

Author Contributions

N.F.: conceptualization, literature review, methodology, data collection, analysis, and writing; T.Z.: review, editing, and supervision; A.F.: conceptualization, data collection, review, and editing. All authors have read and agreed to the published version of the manuscript.

Funding

The authors gratefully acknowledge the support from the Smart Traffic Fund (STF) under grant number PSRI/14/2109/RA.

Data Availability Statement

Some or all data that support the findings of this study are available from the corresponding author upon reasonable request.

Conflicts of Interest

The authors declare no conflicts of interest.

References

  1. FHA Bridge Condition by Highway System. Available online: https://www.fhwa.dot.gov/bridge/nbi/condition.cfm (accessed on 14 November 2024).
  2. Ibrahim, A.; Abdelkhalek, S.; Zayed, T.; Qureshi, A.H.; Mohammed Abdelkader, E. A Comprehensive Review of the Key Deterioration Factors of Concrete Bridge Decks. Buildings 2024, 14, 3425. [Google Scholar] [CrossRef]
  3. Ghodoosi, F.; Bagchi, A.; Zayed, T. System-Level Deterioration Model for Reinforced Concrete Bridge Decks. J. Bridg. Eng. 2015, 20, 04014081. [Google Scholar] [CrossRef]
  4. FHA Bridges by Year Built, Year Reconstructed and Material Type. Available online: https://www.fhwa.dot.gov/bridge/nbi/no10/yrblt_yrreconst13.cfm#a (accessed on 14 November 2024).
  5. Minchin, R.E.; Zayed, T.; Boyd, A.J.; Mendoza, M. Best Practices of Bridge System Management—A Synthesis. J. Manag. Eng. 2006, 22, 186–195. [Google Scholar] [CrossRef]
  6. Alsharqawi, M.; Zayed, T.; Abu Dabous, S. Integrated Condition-Based Rating Model for Sustainable Bridge Management. J. Perform. Constr. Facil. 2020, 34, 04020091. [Google Scholar] [CrossRef]
  7. Sasmal, S.; Ramanjaneyulu, K. Condition Evaluation of Existing Reinforced Concrete Bridges Using Fuzzy Based Analytic Hierarchy Approach. Expert Syst. Appl. 2008, 35, 1430–1443. [Google Scholar] [CrossRef]
  8. Tarighat, A.; Miyamoto, A. Fuzzy Concrete Bridge Deck Condition Rating Method for Practical Bridge Management System. Expert Syst. Appl. 2009, 36, 12077–12085. [Google Scholar] [CrossRef]
  9. Zambon, I.; Vidović, A.; Strauss, A.; Matos, J. Condition Prediction of Existing Concrete Bridges as a Combination of Visual Inspection and Analytical Models of Deterioration. Appl. Sci. 2019, 9, 148. [Google Scholar] [CrossRef]
  10. Kim, S.; Ge, B.; Frangopol, D.M. Probabilistic Optimum Bridge System Maintenance Management Considering Correlations of Deteriorating Components and Service Life Extensions. ASCE-ASME J. Risk Uncertain. Eng. Syst. A Civ. Eng. 2022, 8, 04022023. [Google Scholar] [CrossRef]
  11. Santamaria Ariza, M.; Zambon, I.; Sousa, H.S.; Campos e Matos, J.A.; Strauss, A. Comparison of Forecasting Models to Predict Concrete Bridge Decks Performance. Struct. Concr. 2020, 21, 1240–1253. [Google Scholar] [CrossRef]
  12. Firouzi, A.; Rahai, A. Reliability Assessment of Concrete Bridges Subject to Corrosion-Induced Cracks during Life Cycle Using Artificial Neural Networks. Comput. Concr. 2013, 12, 91–107. [Google Scholar] [CrossRef]
  13. Di Mucci, V.M.; Cardellicchio, A.; Ruggieri, S.; Nettis, A.; Renò, V.; Uva, G. Artificial Intelligence in Structural Health Management of Existing Bridges. Autom. Constr. 2024, 167, 105719. [Google Scholar] [CrossRef]
  14. Srikanth, I.; Arockiasamy, M. Deterioration Models for Prediction of Remaining Useful Life of Timber and Concrete Bridges: A Review. J. Traffic Transp. Eng. 2020, 7, 152–173. [Google Scholar] [CrossRef]
  15. Kamioka, H. Preferred Reporting Items for Systematic Review and Meta-Analysis Protocols (Prisma-p) 2015 Statement. Jpn. Pharmacol. Ther. 2019, 47, 1177–1185. [Google Scholar]
  16. Echchakoui, S. Why and How to Merge Scopus and Web of Science during Bibliometric Analysis: The Case of Sales Force Literature from 1912 to 2019. J. Mark. Anal. 2020, 8, 165–184. [Google Scholar] [CrossRef]
  17. Scopus Content Coverage Guide; Elsevier: Amsterdam, The Netherlands, 2020.
  18. Centre for Science and Technology Studies, Leiden University. Vosviewer. Available online: https://www.vosviewer.com/ (accessed on 15 November 2024).
  19. K-Synth Srl Bibliometrix. Available online: https://www.bibliometrix.org/home/ (accessed on 15 November 2024).
  20. Watanabe, M.; Goso, T.; Ibayashi, K. Method for the Rapid Creation of Bridge Database Systems and Practices in Developing Countries. Pract. Period. Struct. Des. Constr. 2023, 28, 04022062. [Google Scholar] [CrossRef]
  21. The United States Department of Transportation. Specifications for the National Bridge Inventory; The United States Department of Transportation: Washington, DC, USA, 2022. [Google Scholar]
  22. Radovic, M.; Ghonima, O.; Schumacher, T. Data Mining of Bridge Concrete Deck Parameters in the National Bridge Inventory by Two-Step Cluster Analysis. ASCE-ASME J. Risk Uncertain. Eng. Syst. A Civ. Eng. 2017, 3, F4016004. [Google Scholar] [CrossRef]
  23. Chase, S.B.; Adu-Gyamfi, Y.; Aktan, A.E.; Minaie, E. Synthesis of National and International Methodologies Used for Bridge Health Indices; Technical Report for United States Department of Transportation; Department of Transportation: Springfield, VA, USA, 2016. [Google Scholar]
  24. New Jersey Department of Transportation. Bridge Element Inspection Manual; New Jersey Department of Transportation: Trenton, NJ, USA, 2014; Volume 2014. [Google Scholar]
  25. Stochino, F.; Fadda, M.L.; Mistretta, F. Low Cost Condition Assessment Method for Existing RC Bridges. Eng. Fail. Anal. 2018, 86, 56–71. [Google Scholar] [CrossRef]
  26. Abdelkhalek, S. Managing the Inspection Process of Concrete Bridge Decks. Ph.D. Thesis, The Hong Kong Polytechnic University, Kowloon, Hong Kong, 2022. [Google Scholar]
  27. Alsharqawi, M.; Zayed, T.; Abu Dabous, S. Integrated Condition Rating and Forecasting Method for Bridge Decks Using Visual Inspection and Ground Penetrating Radar. Autom. Constr. 2018, 89, 135–145. [Google Scholar] [CrossRef]
  28. Xiong, C.; Zayed, T.; Mohammed, E. A Novel YOLOv8-GAM-Wise-IoU Model for Automated Detection of Bridge Surface Cracks. Constr. Build. Mater. 2024, 414, 135025. [Google Scholar] [CrossRef]
  29. Bae, H.; Jang, K.; An, Y.K. Deep Super Resolution Crack Network (SrcNet) for Improving Computer Vision–Based Automated Crack Detectability in in Situ Bridges. Struct. Heal. Monit. 2021, 20, 1428–1442. [Google Scholar] [CrossRef]
  30. Wan, H.; Gao, L.; Yuan, Z.; Qu, H.; Sun, Q.; Cheng, H.; Wang, R. A Novel Transformer Model for Surface Damage Detection and Cognition of Concrete Bridges. Expert Syst. Appl. 2023, 213, 119019. [Google Scholar] [CrossRef]
  31. Zhang, C.; Chang, C.C.; Jamshidi, M. Concrete Bridge Surface Damage Detection Using a Single-Stage Detector. Comput. Civ. Infrastruct. Eng. 2020, 35, 389–409. [Google Scholar] [CrossRef]
  32. Rubio, J.J.; Kashiwa, T.; Laiteerapong, T.; Deng, W.; Nagai, K.; Escalera, S.; Nakayama, K.; Matsuo, Y.; Prendinger, H. Multi-Class Structural Damage Segmentation Using Fully Convolutional Networks. Comput. Ind. 2019, 112, 103121. [Google Scholar] [CrossRef]
  33. Ding, W.; Yang, H.; Yu, K.; Shu, J. Crack Detection and Quantification for Concrete Structures Using UAV and Transformer. Autom. Constr. 2023, 152, 104929. [Google Scholar] [CrossRef]
  34. Saleem, M.R.; Park, J.W.; Lee, J.H.; Jung, H.J.; Sarwar, M.Z. Instant Bridge Visual Inspection Using an Unmanned Aerial Vehicle by Image Capturing and Geo-Tagging System and Deep Convolutional Neural Network. Struct. Heal. Monit. 2021, 20, 1760–1777. [Google Scholar] [CrossRef]
  35. Lin, J.J.; Ibrahim, A.; Sarwade, S.; Golparvar-Fard, M. Bridge Inspection with Aerial Robots: Automating the Entire Pipeline of Visual Data Capture, 3D Mapping, Defect Detection, Analysis, and Reporting. J. Comput. Civ. Eng. 2021, 35, 04020064. [Google Scholar] [CrossRef]
  36. Abdelkader, E.M.; Zayed, T.; Faris, N. Synthesized Evaluation of Reinforced Concrete Bridge Defects, Their Non-Destructive Inspection and Analysis Methods: A Systematic Review and Bibliometric Analysis of the Past Three Decades. Buildings 2023, 13, 800. [Google Scholar] [CrossRef]
  37. Pailes, B.M.; Gucunski, N. Multimodal Nondestructive Testing Damage Quantification, Presentation, and Condition Rating of Bridge Decks. Transp. Res. Rec. 2015, 2481, 26–31. [Google Scholar] [CrossRef]
  38. Omar, T.; Nehdi, M.L.; Zayed, T. Integrated Condition Rating Model for Reinforced Concrete Bridge Decks. J. Perform. Constr. Facil. 2017, 31, 04017090. [Google Scholar] [CrossRef]
  39. Faris, N.; Zayed, T.; Abdelkader, E.M.; Fares, A. Corrosion Assessment Using Ground Penetrating Radar in Reinforced Concrete Structures: Influential Factors and Analysis Methods. Autom. Constr. 2023, 156, 105130. [Google Scholar] [CrossRef]
  40. Rashidi, M.; Azari, H.; Nehme, J. Assessment of the Overall Condition of Bridge Decks Using the Jensen-Shannon Divergence of NDE Data. NDT E Int. 2020, 110, 102204. [Google Scholar] [CrossRef]
  41. Liu, H.; Wang, X.; Jiao, Y.; He, X.; Wang, B. Condition Evaluation for Existing Reinforced Concrete Bridge Superstructure Using Fuzzy Clustering Improved by Particle Swarm Optimisation. Struct. Infrastruct. Eng. 2017, 13, 955–965. [Google Scholar] [CrossRef]
  42. Gucunski, N.; Pailes, B.; Kim, J.; Azari, H.; Dinh, K. Capture and Quantification of Deterioration Progression in Concrete Bridge Decks through Periodical NDE Surveys. J. Infrastruct. Syst. 2017, 23, B4016005. [Google Scholar] [CrossRef]
  43. Calò, M.; Ruggieri, S.; Nettis, A.; Uva, G. A MTInSAR-Based Early Warning System to Appraise Deformations in Simply Supported Concrete Girder Bridges. Struct. Control Heal. Monit. 2024, 2024, 8978782. [Google Scholar] [CrossRef]
  44. Gagarin, N.; Goulias, D.; Mekemson, J.; Cutts, R.; Andrews, J. Development of Novel Methodology for Assessing Bridge Deck Conditions Using Step Frequency Antenna Array Ground Penetrating Radar. J. Perform. Constr. Facil. 2020, 34, 04019113. [Google Scholar] [CrossRef]
  45. Sasmal, S.; Ramanjaneyulu, K.; Gopalakrishnan, S.; Lakshmanan, N. Fuzzy Logic Based Condition Rating of Existing Reinforced Concrete Bridges. J. Perform. Constr. Facil. 2006, 20, 261–273. [Google Scholar] [CrossRef]
  46. Ramezanianpout, A.A.; Shahhosseini, V.; Moodi, F. A Fuzzy Expert System for Diagnosis Assessment of Reinforced Concrete Bridge Decks. Comput. Concr. 2009, 6, 281–303. [Google Scholar] [CrossRef]
  47. Abu Dabous, S.; Alkass, S.; Zaki, A. A Probabilistic Methodology for Bridge Deck Condition Assessment. Bridg. Struct. 2008, 4, 49–56. [Google Scholar] [CrossRef]
  48. Zhang, H.; Fu, X.; Gong, M. Comparative Analysis of Condition Assessment Standards for Roads and Bridges Based on Fuzzy Comprehensive Evaluation. Aust. J. Civ. Eng. 2023, 1–11. [Google Scholar] [CrossRef]
  49. Dinh, K.; Zayed, T. GPR-Based Fuzzy Model for Bridge Deck Corrosiveness Index. J. Perform. Constr. Facil. 2016, 30, 04015069. [Google Scholar] [CrossRef]
  50. Wang, X.; Foliente, G. Identifying Bridge Structural Condition Development Trends via Categorical Inspection Condition Rating with Case Studies. Struct. Infrastruct. Eng. 2008, 4, 449–466. [Google Scholar] [CrossRef]
  51. Stochino, F.; Fadda, M.L.; Mistretta, F. Assessment of RC Bridges Integrity by Means of Low-Cost Investigations. Frat. Ed Integrita Strutt. 2018, 12, 216–225. [Google Scholar] [CrossRef]
  52. Inkoom, S.; Sobanjo, J. Availability Function as Bridge Element’s Importance Weight in Computing Overall Bridge Health Index. Struct. Infrastruct. Eng. 2018, 14, 1598–1610. [Google Scholar] [CrossRef]
  53. Abu Dabous, S.; Yaghi, S.; Alkass, S.; Moselhi, O. Concrete Bridge Deck Condition Assessment Using IR Thermography and Ground Penetrating Radar Technologies. Autom. Constr. 2017, 81, 340–354. [Google Scholar] [CrossRef]
  54. Pushpakumara, B.H.J.; De Silva, S.; Subashi De Silva, G.H.M.J. Visual Inspection and Non-Destructive Tests-Based Rating Method for Concrete Bridges. Int. J. Struct. Eng. 2017, 8, 74–91. [Google Scholar] [CrossRef]
  55. Zhou, C.; Wu, Y.; Cui, G.; Zhang, A.; Gao, Y.; Wang, X.; Ouyang, J.; Sun, H.; Liang, Y.; Liu, Z.; et al. Comprehensive Measurement Techniques and Multi-Index Correlative Evaluation Approach for Structural Health Monitoring of Highway Bridges. Meas. J. Int. Meas. Confed. 2020, 152, 107360. [Google Scholar] [CrossRef]
  56. Akgul, F. Inspection and Evaluation of a Network of Concrete Bridges Based on Multiple NDT Techniques. Struct. Infrastruct. Eng. 2020, 17, 1076–1095. [Google Scholar] [CrossRef]
  57. Abdelkhalek, S.; Zayed, T. Performance Assessment Model of Non-Destructive Technologies in Inspecting Concrete Bridge Decks. Struct. Infrastruct. Eng. 2023, 19, 216–237. [Google Scholar] [CrossRef]
  58. Rens, K.L.; Nogueira, C.L.; Transue, D.J. Bridge Management and Nondestructive Evaluation. J. Perform. Constr. Facil. 2005, 19, 3–16. [Google Scholar] [CrossRef]
  59. Johnson, M.B.; Kerr, R.I.; Thompson, T.S.; Ailaney, R.K. Bridge Management Experiences of California, Florida, and South Dakota; The United States Department of Transportation: Washington, DC, USA, 2005; p. 28. [Google Scholar]
  60. Zadeh, L.A. Fuzzy Sets. Inf. Control 1965, 8, 338–353. [Google Scholar] [CrossRef]
  61. Arong; Murakami, S.; Ichikawa, H.; Zadeh, L.A.; Yiliguoqi. Utilization of SVM in the Soundness Evaluation of Reinforced Concrete Slab Bridge. J. Japan Soc. Civ. Eng. 2020, 8, 59–70. [Google Scholar] [CrossRef]
  62. Oh, B.H.; Lew, Y.; Choi, Y.C. Realistic Assessment for Safety and Service Life of Reinforced Concrete Decks in Girder Bridges. J. Bridg. Eng. 2007, 12, 410–418. [Google Scholar] [CrossRef]
  63. FHWA LTBP Tools and Products. Available online: https://highways.dot.gov/research/long-term-infrastructure-performance/ltbp/products (accessed on 25 December 2024).
  64. Bolukbasi, M.; Mohammadi, J.; Arditi, D. Estimating the Future Condition of Highway Bridge Components Using National Bridge Inventory Data. Pract. Period. Struct. Des. Constr. 2004, 9, 16–25. [Google Scholar] [CrossRef]
  65. Tolliver, D.; Lu, P. Analysis of Bridge Deterioration Rates: A Case Study of the Northern Plains Region. J. Transp. Res. Forum 2012, 50, 87–100. [Google Scholar] [CrossRef]
  66. Kim, J.; Gucunski, N.; Dinh, K. Deterioration and Predictive Condition Modeling of Concrete Bridge Decks Based on Data from Periodic NDE Surveys. J. Infrastruct. Syst. 2019, 25, 04019010. [Google Scholar] [CrossRef]
  67. Hasan, S.; Elwakil, E. Stochastic Regression Deterioration Models for Superstructure of Prestressed Concrete Bridges in California. J. Struct. Integr. Maint. 2019, 4, 97–108. [Google Scholar] [CrossRef]
  68. Hasan, S.; Elwakil, E. National Bridge Inventory Data-Based Stochastic Modeling for Deck Condition Rating of Prestressed Concrete Bridges. Pract. Period. Struct. Des. Constr. 2020, 25, 04020022. [Google Scholar] [CrossRef]
  69. Srikanth, I.; Arockiasamy, M. Remaining Service Life Prediction of Aging Concrete Bridges Based on Multiple Relevant Explanatory Variables. Pract. Period. Struct. Des. Constr. 2021, 26, 04021036. [Google Scholar] [CrossRef]
  70. Ghonima, O.; Anderson, J.C.; Schumacher, T.; Unnikrishnan, A. Performance of US Concrete Highway Bridge Decks Characterized by Random Parameters Binary Logistic Regression. ASCE-ASME J. Risk Uncertain. Eng. Syst. A Civ. Eng. 2020, 6, 04019025. [Google Scholar] [CrossRef]
  71. Kim, Y.J.; Queiroz, L.B. Big Data for Condition Evaluation of Constructed Bridges. Eng. Struct. 2017, 141, 217–227. [Google Scholar] [CrossRef]
  72. Alogdianakis, F.; Charmpis, D.C.; Balafas, I. Macroscopic Effect of Distance from Seacoast on Bridge Deterioration—Statistical Data Assessment of Structural Condition Recordings. Structures 2020, 27, 319–329. [Google Scholar] [CrossRef]
  73. Treat, C.; Dymond, B.Z. Deterioration of Concrete Bridge Decks Containing Epoxy-Coated and Uncoated Reinforcement. J. Bridg. Eng. 2021, 26, 2–5. [Google Scholar] [CrossRef]
  74. Srikanth, I.; Arockiasamy, M. Development of Non-Parametric Deterioration Models for Risk and Reliability Assessments of Concrete and Timber Bridges. J. Perform. Constr. Facil. 2022, 36, 04021114. [Google Scholar] [CrossRef]
  75. Yang, C.; Wang, X.; Nassif, H. Impact of Environmental Conditions on Predicting Condition Rating of Concrete Bridge Decks. Transp. Res. Rec. 2024. [Google Scholar] [CrossRef]
  76. Miao, P.; Yokota, H. Comparison of Markov Chain and Recurrent Neural Network in Predicting Bridge Deterioration Considering Various Factors. Struct. Infrastruct. Eng. 2024, 20, 250–262. [Google Scholar] [CrossRef]
  77. Zhang, T.; Chen, H.; Cui, X.; Li, P.; Zou, Y. Condition Rating Prediction for Highway Bridge Based on Elman Neural Networks and Markov Chains. Appl. Sci. 2024, 14, 1444. [Google Scholar] [CrossRef]
  78. Lou, P.; Nassif, H.; Su, D.; Truban, P. Effect of Overweight Trucks on Bridge Deck Deterioration Based on Weigh-in-Motion Data. Transp. Res. Rec. 2016, 2592, 86–97. [Google Scholar] [CrossRef]
  79. Alonso Medina, P.; León González, F.J.; Todisco, L. Data-Driven Prediction of Long-Term Deterioration of RC Bridges. Constr. Build. Mater. 2022, 317, 125790. [Google Scholar] [CrossRef]
  80. Fu, P.; Li, X.; Xu, L.; Xin, L. Life-Cycle Seismic Damage Identification and Components Damage Sequences Prediction for Cable-Stayed Bridge Based on Fragility Analyses. Bull. Earthq. Eng. 2021, 19, 6669–6692. [Google Scholar] [CrossRef]
  81. Isgor, O.B.; Razaqpur, A.G. Modelling Steel Corrosion in Concrete Structures. Mater. Struct. Constr. 2006, 39, 291–302. [Google Scholar] [CrossRef]
  82. Quraishi, M.; Nayak, D.; Kumar, R.; Kumar, V. Corrosion of Reinforced Steel in Concrete and Its Control: An Overview. J. Steel Struct. Constr. 2017, 3, 1–6. [Google Scholar] [CrossRef]
  83. Faris, N.; Zayed, T.; Fares, A.; Abdelkhalek, S.; Abdelkader, E.M. Automated Rebar Recognition and Corrosion Assessment of Concrete Bridge Decks Using Ground Penetrating Radar. Autom. Constr. 2024, 166, 105631. [Google Scholar] [CrossRef]
  84. Liu, Y.; Weyers, R. Modeling the Time-to-Corrosion Cracking in Chloride Contaminated Reinforced Concrete Structures. ACI Mater. J. 1998, 95, 675–680. [Google Scholar] [CrossRef]
  85. Parameswaran, L.; Kumar, R.; Sahu, G.K. Effect of Carbonation on Concrete Bridge Service Life. J. Bridg. Eng. 2008, 13, 75–82. [Google Scholar] [CrossRef]
  86. Balafas, I.; Burgoyne, C.J. Modeling the Structural Effects of Rust in Concrete Cover. J. Eng. Mech. 2011, 137, 175–185. [Google Scholar] [CrossRef]
  87. Hu, N.; Haider, S.W.; Burgueno, R. Development and Validation of Deterioration Moels Fo Concree Bridge Decks—Phase 2: Mechanics-Based Degradation Models; Technical Report for United States Department of Transportation: Lansing, MI, USA, 2013. [Google Scholar]
  88. Atadero, R.A.; Jia, G.; Abdallah, A.; Ozbek, M.E. An Integrated Uncertainty-Based Bridge Inspection Decision Framework with Application to Concrete Bridge Decks. Infrastructures 2019, 4, 50. [Google Scholar] [CrossRef]
  89. Wang, H.; Ranade, R.; Okumus, P. Calibrating a Physics-Based Corrosion Model with Field-Based Bridge Condition Data. J. Bridg. Eng. 2023, 28, 04023020. [Google Scholar] [CrossRef]
  90. Heo, W.H. Performance-Based Reliability Estimates for Highway Bridges Considering Previous Inspection Data. Appl. Sci. 2020, 10, 1873. [Google Scholar] [CrossRef]
  91. Yuan, Y.; Han, W.; Guo, T.; Chen, X.; Xie, Q. Establishment and Updating of Nonstationary Resistance Deterioration Model of Existing Concrete Bridge Component. J. Perform. Constr. Facil. 2020, 34, 04020104. [Google Scholar] [CrossRef]
  92. Agrawal, A.K.; Kawaguchi, A.; Chen, Z. Deterioration Rates of Typical Bridge Elements in New York. J. Bridg. Eng. 2010, 15, 419–429. [Google Scholar] [CrossRef]
  93. Nickless, K.; Atadero, R.A. Mechanistic Deterioration Modeling for Bridge Design and Management. J. Bridg. Eng. 2018, 23, 04018018. [Google Scholar] [CrossRef]
  94. Bastidas-Arteaga, E.; Bressolette, P.; Chateauneuf, A.; Sánchez-Silva, M. Probabilistic Lifetime Assessment of RC Structures under Coupled Corrosion-Fatigue Deterioration Processes. Struct. Saf. 2009, 31, 84–96. [Google Scholar] [CrossRef]
  95. Jones, G.; Lambert, P. Predicting Service Life from Site-Accessed Corrosion Rate Data. Proc. Inst. Civ. Eng. Forensic Eng. 2016, 169, 53–60. [Google Scholar] [CrossRef]
  96. Jiang, H.; Li, S.; Jiang, R. Residual Service Life Prediction for Bridges Based on Critical Life Curves. J. Perform. Constr. Facil. 2017, 31, 04017053. [Google Scholar] [CrossRef]
  97. Ghodoosi, F.; Bagchi, A.; Zayed, T.; Hosseini, M.R. Method for Developing and Updating Deterioration Models for Concrete Bridge Decks Using GPR Data. Autom. Constr. 2018, 91, 133–141. [Google Scholar] [CrossRef]
  98. Zambon, I.; Vidović, A.; Strauss, A.; Matos, J. Use of Chloride Ingress Model for Condition Assessment in Bridge Management. Gradjevinar 2019, 71, 359–373. [Google Scholar] [CrossRef]
  99. Wang, S.; Zhang, L.; Su, H.; Du, J. Time-Dependent Robustness-Based Condition Assessment of RC Bridges Subjected to Corrosion. Structures 2021, 34, 4500–4510. [Google Scholar] [CrossRef]
  100. Alam, J.; Zhang, H.; Neves, L.A.C.; Dias-da-Costa, D. Sequential Bayesian Updating for Time-Variant Reliability Analysis of Ageing Structures. Mech. Syst. Signal Process. 2023, 204, 110774. [Google Scholar] [CrossRef]
  101. Liu, H.; Nehme, J.; Lu, P. An Application of Convolutional Neural Network for Deterioration Modeling of Highway Bridge Components in the United States. Struct. Infrastruct. Eng. 2023, 19, 731–744. [Google Scholar] [CrossRef]
  102. Mishalani, R.G.; Shafieezadeh, A.; Li, Z. Updating Bridge Deck Condition Transition Probabilities as New Inspection Data Are Collected: Methodology and Empirical Evaluation. Transp. Res. Rec. 2018, 2672, 93–102. [Google Scholar] [CrossRef]
  103. Mohammed Abdelkader, E.; Zayed, T.; Marzouk, M. A Computerized Hybrid Bayesian-Based Approach for Modelling the Deterioration of Concrete Bridge Decks. Struct. Infrastruct. Eng. 2019, 15, 1178–1199. [Google Scholar] [CrossRef]
  104. Madanat, S.; Mishalani, R.; Wan Ibrahim, W.H. Estimation of Infrastructure Transition Probabilities from Condition Rating Data. J. Infrastruct. Syst. 1995, 1, 120–125. [Google Scholar] [CrossRef]
  105. Jiang, Y.; Sinha, K.C. Bridge Service Life Prediction Model Using the Markov Chain. Transp. Res. Rec. 1989, 1223, 24–30. [Google Scholar]
  106. Wang, X.; Nguyen, M.; Foliente, G.; Ye, L. An Approach to Modelling Concrete Bridge Condition Deterioration Using a Statistical Causal Relationship Based on Inspection Data. Struct. Infrastruct. Eng. 2007, 3, 3–15. [Google Scholar] [CrossRef]
  107. Mizutani, D.; Matsuoka, K.; Kaito, K. Statistical Deterioration Prediction Model Considering the Heterogeneity in Deterioration Rates by Hierarchical Bayesian Estimation. Struct. Eng. Int. J. Int. Assoc. Bridg. Struct. Eng. 2013, 23, 394–401. [Google Scholar] [CrossRef]
  108. Zhang, M.; Ruan, X.; Li, Y.; Fu, B. Probability-Based Surface Deterioration Assessment of Bridge Pylon and State Updating Using Inspected Crack Length Distribution. Struct. Infrastruct. Eng. 2023, 21, 1–19. [Google Scholar] [CrossRef]
  109. Khatami, D.; Shafei, B. Impact of Climate Conditions on Deteriorating Reinforced Concrete Bridges in the US Midwest Region. J. Perform. Constr. Facil. 2021, 35, 04020129. [Google Scholar] [CrossRef]
  110. Khatami, D.; Shafei, B.; Bektas, B. Data-Assisted Prediction of Deterioration of Reinforced Concrete Bridges Using Physics-Based Models. J. Infrastruct. Syst. 2023, 29, 05023003. [Google Scholar] [CrossRef]
  111. Yosri, A.; Elleathy, Y.; Hassini, S.; El-Dakhakhni, W. Genetic Algorithm-Markovian Model for Predictive Bridge Asset Management. J. Bridg. Eng. 2021, 26, 04021052. [Google Scholar] [CrossRef]
  112. Zambon, I.; Vidovic, A.; Strauss, A.; Matos, J.; Amado, J. Comparison of Stochastic Prediction Models Based on Visual Inspections of Bridge Decks. J. Civ. Eng. Manag. 2017, 23, 553–561. [Google Scholar] [CrossRef]
  113. Ibe, O.C. Controlled Markov Processes. In Markov Processes for Stochastic Modeling; Elsevier: Waltham, MA, USA, 2013; ISBN 9780124077959. [Google Scholar]
  114. Sobanjo, J.O. State Transition Probabilities in Bridge Deterioration Based on Weibull Sojourn Times. Struct. Infrastruct. Eng. 2011, 7, 747–764. [Google Scholar] [CrossRef]
  115. Guo, C.; Liang, Z. Semi-Markovian Maintenance Optimization for Reinforced Concrete Enabled by a Synthesized Deterioration Model. IEEE Trans. Reliab. 2022, 71, 1577–1589. [Google Scholar] [CrossRef]
  116. Furtado, F.; Ribeiro, D. Railway Bridge Management System Based on Visual Inspections with Semi-Markov Continuous Time Process. KSCE J. Civ. Eng. 2023, 27, 233–250. [Google Scholar] [CrossRef]
  117. Sobanjo, J.; Mtenga, P.; Rambo-Roddenberry, M. Reliability-Based Modeling of Bridge Deterioration Hazards. J. Bridg. Eng. 2010, 15, 671–683. [Google Scholar] [CrossRef]
  118. Nasrollahi, M.; Washer, G. Estimating Inspection Intervals for Bridges Based on Statistical Analysis of National Bridge Inventory Data. J. Bridg. Eng. 2015, 20, 04014104. [Google Scholar] [CrossRef]
  119. Manafpour, A.; Guler, I.; Radlińska, A.; Rajabipour, F.; Warn, G. Stochastic Analysis and Time-Based Modeling of Concrete Bridge Deck Deterioration. J. Bridg. Eng. 2018, 23, 04018066. [Google Scholar] [CrossRef]
  120. Mašović, S.; Hajdin, R. Modelling of Bridge Elements Deterioration for Serbian Bridge Inventory. Struct. Infrastruct. Eng. 2014, 10, 976–987. [Google Scholar] [CrossRef]
  121. Bush, S.J.W.; Henning, T.F.P.; Raith, A.; Ingham, J.M. Development of a Bridge Deterioration Model in a Data-Constrained Environment. J. Perform. Constr. Facil. 2017, 31, 04017080. [Google Scholar] [CrossRef]
  122. Zhang, K.; Lei, J.; Wang, Z.; Yuan, Q. A Numerical Algorithm for Damage Progression of Reinforced Concrete Bridge Piers during Air Temperature and Solar Radiation Cycles. Eng. Struct. 2024, 319, 118876. [Google Scholar] [CrossRef]
  123. Zhu, Z.; Ye, K.; Yu, X.; Lin, Z.; Xu, G.; Guo, Z.; Lu, S.; Nie, B.; Chen, H. State-Based Technical Condition Assessment and Prediction of Concrete Box Girder Bridges. Buildings 2024, 14, 543. [Google Scholar] [CrossRef]
  124. Chyad, A.M.; Abudayyeh, O. Impact of Environmental Factors on the Condition Rating of Concrete Bridge Decks Using Statistical-Distribution Methods. Pract. Period. Struct. Des. Constr. 2021, 26, 04021014. [Google Scholar] [CrossRef]
  125. Mia, M.M.; Kameshwar, S. Machine Learning Approach for Predicting Bridge Components’ Condition Ratings. Front. Built Environ. 2023, 9, 1254269. [Google Scholar] [CrossRef]
  126. Rajkumar, M.; Nagarajan, S.; Arockiasamy, M. Bridge Infrastructure Management System: Autoencoder Approach for Predicting Bridge Condition Ratings. J. Infrastruct. Syst. 2023, 29, 04022042. [Google Scholar] [CrossRef]
  127. Li, Z.; Burgueño, R. Using Soft Computing to Analyze Inspection Results for Bridge Evaluation and Management. J. Bridg. Eng. 2010, 15, 430–438. [Google Scholar] [CrossRef]
  128. Zhu, J.; Wang, Y. Feature Selection and Deep Learning for Deterioration Prediction of the Bridges. J. Perform. Constr. Facil. 2021, 35, 04021078. [Google Scholar] [CrossRef]
  129. Feng, D.C.; Wang, W.J.; Mangalathu, S.; Sun, Z. Condition Assessment of Highway Bridges Using Textual Data and Natural Language Processing- (NLP-) Based Machine Learning Models. Struct. Control Heal. Monit. 2023, 2023, 761154. [Google Scholar] [CrossRef]
  130. Kwon, T.H.; Kim, J.; Park, K.T.; Jung, K.S. Long Short-Term Memory-Based Methodology for Predicting Carbonation Models of Reinforced Concrete Slab Bridges: Case Study in South Korea. Appl. Sci. 2022, 12, 12470. [Google Scholar] [CrossRef]
  131. Miao, P.; Yokota, H.; Zhang, Y. Deterioration Prediction of Existing Concrete Bridges Using a LSTM Recurrent Neural Network. Struct. Infrastruct. Eng. 2023, 19, 475–489. [Google Scholar] [CrossRef]
  132. Jing, G.; Ruiying, L.; Yao, Z. Comparison of Regression Model and LSTM-RNN Model in Predicting Deterioration of Prestressed Concrete Box Girder Bridges. Struct. Eng. Mech. 2024, 91, 39–47. [Google Scholar] [CrossRef]
  133. Kazantzi, A.K.; Moutsianos, S.; Bakalis, K.; Mitoulis, S.A. Cause-Agnostic Bridge Damage State Identification Utilising Machine Learning. Eng. Struct. 2024, 320, 118887. [Google Scholar] [CrossRef]
  134. Hu, X.; Liu, K. Structural Deterioration Knowledge Ontology towards Physics-Informed Machine Learning for Enhanced Bridge Deterioration Prediction. J. Comput. Civ. Eng. 2023, 37, 04022051. [Google Scholar] [CrossRef]
  135. Huang, Y.-H. Artificial Neural Network Model of Bridge Deterioration. J. Perform. Constr. Facil. 2010, 24, 597–602. [Google Scholar] [CrossRef]
  136. Liu, H.; Zhang, Y. Bridge Condition Rating Data Modeling Using Deep Learning Algorithm. Struct. Infrastruct. Eng. 2020, 16, 1447–1460. [Google Scholar] [CrossRef]
  137. Lei, X.; Xia, Y.; Komarizadehasl, S.; Sun, L. Condition Level Deteriorations Modeling of RC Beam Bridges with U-Net Convolutional Neural Networks. Structures 2022, 42, 333–342. [Google Scholar] [CrossRef]
  138. Almarahlleh, N.; Liu, H.; Abudayyeh, O.; Almamlook, R. Predicting Concrete Bridge Deck Deterioration: A Hyperparameter Optimization Approach. J. Perform. Constr. Facil. 2024, 38, 04024009. [Google Scholar] [CrossRef]
  139. Elleathy, Y.; Ghaith, M.; Haggag, M.; Yosri, A.; El-Dakhakhni, W. Climate-Induced Deterioration Prediction for Bridges: An Evolutionary Computing-Based Framework. Innov. Infrastruct. Solut. 2024, 9, 114. [Google Scholar] [CrossRef]
  140. Saremi, S.G.; Goulias, D.; Zhao, Y. Alternative Sequence Classification of Neural Networks for Bridge Deck Condition Rating. J. Perform. Constr. Facil. 2023, 37, 04023025. [Google Scholar] [CrossRef]
  141. Abu Dabous, S.; Ibrahim, F.; Alzghoul, A. Modelling Bridge Deterioration Using Long Short-Term Memory Neural Networks: A Deep Learning-Based Approach. Smart Sustain. Built Environ. 2024; ahead of print. [Google Scholar] [CrossRef]
Figure 1. Bridge conditions trends in the US.
Buildings 15 00219 g001
Figure 2. Bridges types in the US.
Buildings 15 00219 g002
Figure 3. Review methodology.
Buildings 15 00219 g003
Figure 4. Publication trend over the period of 2004–2024.
Buildings 15 00219 g004
Figure 5. Co-citation network of prominent journals in concrete bridge condition rating and prediction.
Buildings 15 00219 g005
Figure 6. Keyword mapping and clustering.
Buildings 15 00219 g006
Figure 7. Temporal keyword mapping.
Buildings 15 00219 g007
Figure 8. The distribution of the reviewed articles by focus area.
Buildings 15 00219 g008
Figure 9. Systematic review structure.
Buildings 15 00219 g009
Figure 10. 2012 Ministry of Transportation of Quebec (MTQ) fuzzy scale.
Buildings 15 00219 g010
Figure 11. Deterioration models (a) usage and (b) trends in the literature.
Buildings 15 00219 g011
Figure 12. Deterministic deterioration models framework.
Buildings 15 00219 g012
Figure 13. Corrosion initiation due to carbonation and chloride ions [82].
Buildings 15 00219 g013
Figure 14. Mechanistic deterioration models framework.
Buildings 15 00219 g014
Figure 15. Markov chain deterioration modeling framework.
Buildings 15 00219 g015
Figure 16. Deterioration curves from Markovian models under three different deteriorating environments.
Buildings 15 00219 g016
Figure 17. AI-based framework for estimating Markov chain transition probabilities.
Buildings 15 00219 g017
Figure 18. Time-based deterioration models framework.
Buildings 15 00219 g018
Figure 19. Probability distributions for a time-based deterioration model.
Buildings 15 00219 g019
Figure 20. ML and DL deterioration models framework.
Buildings 15 00219 g020
Figure 21. Sequential DL deterioration models framework.
Buildings 15 00219 g021
Figure 22. Knowledge-informed ML and DL framework for deterioration modeling.
Buildings 15 00219 g022
Table 1. Quantitative summary of prominent journals in concrete bridge condition rating and prediction.
Sourceh_IndexPublications
Journal of Bridge Engineering913
Journal of Performance of Constructed Facilities913
Structure and Infrastructure Engineering812
Applied Sciences (Switzerland)46
Structures45
Asce-Asme Journal of Risk and Uncertainty in Engineering Systems, Part A: Civil Engineering34
Automation in Construction33
Journal of Infrastructure Systems35
Practice Periodical on Structural Design and Construction35
Transportation Research Record34
Table 2. Quantitative summary of prominent authors, institutions, and countries in concrete bridge condition rating and condition prediction.
AffiliationPublicationsCountryPublicationsAuthorPublications
Concordia University8USA78Zayed T8
Tongji University5China49Abu Dabous 4
Turner–Fairbank Highway Research Center5Canada28Bagchi A4
Amirkabir University of Technology4Japan18Dinh K4
Florida Atlantic Univ.4India9Strauss A4
Hokkaido University4Australia8Wang X4
Southeast University4Portugal7Zambon I4
University Of Sharjah4UAE7Arockiasamy M3
Colorado State University3Iran6Ghodoosi F3
Concordia Univ.3Republic of Korea6Gucunski N3
Table 3. Most occurred author keywords.
KeywordOccurrenceTotal Link Strength
Deterioration75514
Concrete59427
Bridges48355
Concrete bridges45326
Bridge deck34268
Inspection33256
Deterioration modeling30215
Forecasting28238
Condition assessment26207
Bridge management system21171
Corrosion21122
Maintenance20155
Reliability18110
Condition rating17143
Decision making17131
Nondestructive evaluation15131
Visual inspection15103
Markov processes14121
Table 4. US NBI manual.
Inventory RequirementDetails
Descriptive dataBridge identificationIdentification (name, number, …)
Location (state, place, …)
Classification (owner, maintenance responsibility, …)
Bridge material and typeSpan material and type (number of spans, span type, …)
Substructure material and type (configuration, foundation type, …)
Roadside hardware (railing, transitions, …)
Bridge geometryGeometries and dimensions (total length, span length, …)
Bridge featuresFeature identification (type, name, …)
Routes (number, type, service type, …)
Highways (function classification, traffic load, …)
Railroads (service type, dimensions, …)
Navigable waterways (dimensions, substructure navigation protection, …)
Loads, load rating, and postingLoads and load rating (design load, load rating factor, …)
Load posting status (statues, change date, …)
Load evaluation and posting (legal load rating, configuration, …)
Condition dataInspectionsInspection requirements (fatigue details, underwater inspection, …)
Inspection events (type, due date, interval, …)
Bridge conditionComponent condition ratings (deck, superstructure, substructure, …)
Element identification (number, quantity, …)
Element conditions (state 1, state 2 state 3 state 4)
Appraisal (scour vulnerability, seismic vulnerability, …)
Work events (year build, …)
Table 5. Concrete elements defects evaluation guidelines in the MBEI [24].
DefectsCondition States
1234
GoodFairPoorSever
Delamination/patched area/spallNoneSound patch. Delamination/spall depth < 1 in or diameter < 6 in.Non sound patch. Delamination/spall depth > 1in or diameter > 6 in.The defects may impact the strength or serviceability of the element or bridge.
Exposed RebarNoneNo measurable losses in rebar.With measurable losses but does not threaten the structural integrity.
Rust/Efflorescence StainingNoneNo heavy build-up.Heavy build-up.
CrackingWidth < 0.012 in or spacing > than 3 ft.Width (0.012–0.05) in or spacing (1–3) ft.Width > 0.05 in or spacing < than 1 ft.
DamageNot applicable.State 2 material damage.State 3 material damage.State 4 material damage.
Table 6. Means of defect evaluation in the literature.
ReferenceCracks/SpallDelaminationCorrosionConcrete HealthLoadingInput Type
[45,46,47,48]VI Fuzzy
[46,47,49]VI Crisp
[8]VIHammerGPR, HCP, ER. Fuzzy
[37]VIIE, CDGPR, HCP, ER. Crisp
[48] GPR Fuzzy
[38]VIIRGPR Fuzzy
[6,27]VI GPR Crisp
[50]VIIRGPR Crisp
[41]VI HCPRHAcceleration sensorsCrisp
[42]DPIEGPR, ER, HCPUPV Crisp
[51]VI ERRH, UPV Crisp
[40] IEER, HCP, GPR.UPV Crisp
[52] HCP Stress-strain gageCrisp
[53]VI HCPUPV, Penetration resistance. Crisp
Table 7. NDE performance from very poor to very good according to cost, speed, complexity, defect detection capability, and performance under different environments [54].
NDECostSpeedComplexityPerformanceCapability
GPRpoorpoorpoorfairvery good
IEvery poorvery poorvery poorpoorvery good
UPVvery poorvery poorvery poorpoorvery good
HCPpoorvery poorvery poorpoorfair
ERpoorpoorvery poorpoorfair
IRfairpoorpoorvery poorvery good
DPgoodgoodmoderatepoorfair
Table 8. NBI condition rating guidelines.
CodeConditionDescription
9ExcellentIsolated inherent defects.
8Very goodSome inherent defects.
7GoodSome minor defects.
6SatisfactoryWidespread minor or isolated moderate defects.
5FairSome moderate defects; strength and performance of the component are not affected.
4PoorWidespread moderate or isolated major defects; strength and/or performance of the component is affected.
3SeriousMajor defects; strength and/or performance of the component is seriously affected. Condition typically necessitates more frequent monitoring, load restrictions, and/or corrective actions.
2CriticalMajor defects; component is severely compromised. Condition typically necessitates frequent monitoring, significant load restrictions, and/or corrective actions in order to keep the bridge open.
1Imminent failureBridge is closed to traffic due to component condition. Repair or rehabilitation may return the bridge to service.
0FailedBridge is closed due to component condition, and is beyond corrective action. Replacement is required to restore service.
Table 9. Summary of condition rating approaches in the literature.
Ref.ComponentDefectsToolsInput Methodology
[60]DeckCrack, spalling, and delaminationVIFuzzyMonto Carlo simulation to defuzzify the final CI.
[8]DeckCrack, spalling, delamination, and corrosionVI, hammer tapping, HCPFuzzyFuzzy rules inference system to combine the condition from various defects.
[58]DeckCrackVIFuzzyFuzzy rules inference system to combine fuzzified inputs for crack width and depth. Difuzzified using center of the area.
[37]DeckSevere delamination, incipient delamination, corrosion, and corrosiveness.CD, IE, HCP, ER, and GPR.CrispAssign a CI of 0 to 9 based on the area of severe delamination and area of other defects.
[48]DeckCorrosionGPRFuzzyUsed weighted fuzzy union (WFU) and centroid defuzzification to yield an HI from 0 to 100.
[38]DeckDelamination, corrosion, scaling cracking, spalling, pop-out.IR, GPR, VIFuzzyThe fuzzy condition of defects was integrated via weighted summation. WFU was used to defuzzify and yield a HI from 0 to 100.
[41]SuperstructureConcrete strength, corrosion, crack, strain, and natural frequency.VI, HCP, RH, and acceleration sensors.CrispFCM-PSO to cluster the bridges into five condition categories based on five metrics for maintenance prioritization.
[50]DeckSurface defect, corrosion, and delamination.VI, GPR, and IR.CrispRemove overlap to calculate the defected area percentage, and use the Colorado DOT manual to assign a CI from 1 to 5 based on total defected area.
[42]DeckCorrosion, delamination, and material damage.ER, HCP, GPR, IE, and UPV. CrispProvide HI (0–100) for each NDE and use the average as the overall HI.
[27]DeckDelamination, scaling cracking, spalling, deposits, joints, pop-out, and corrosion.VI and GPRCrispQuality Function Deployment integrating VI and Ground Penetrating Radar (GPR) evaluation
[40]DeckCorrosion, material damage, and delamination.ER, HCP, GPR, UPV, and IE.CrispTime laps NDE inspection was used along with Jensen- Shannon divergence to provide a CI of (0–10).
Disclaimer/Publisher’s Note: The statements, opinions and data contained in all publications are solely those of the individual author(s) and contributor(s) and not of MDPI and/or the editor(s). MDPI and/or the editor(s) disclaim responsibility for any injury to people or property resulting from any ideas, methods, instructions or products referred to in the content.

