
Research on Concrete Beam Damage Detection Using Convolutional Neural Networks and Vibrations from ABAQUS Models and Computer Vision

Abstract
:1. Introduction
2. Deep Learning Models Using Vibration Signals
2.1. Deep Learning-Based Damage Detection Using Vibration Data Obtained in ABAQUS
2.2. CNN-Based Structural Damage Detection Through Raw Vibration Data Obtained in Experiments
2.3. The Proposed CNN Model
2.4. Data Collection Through ABAQUS Modeling
3. Results of Simulation Model for Training, Validation, and Prediction
4. Experiment on Beams in Lab
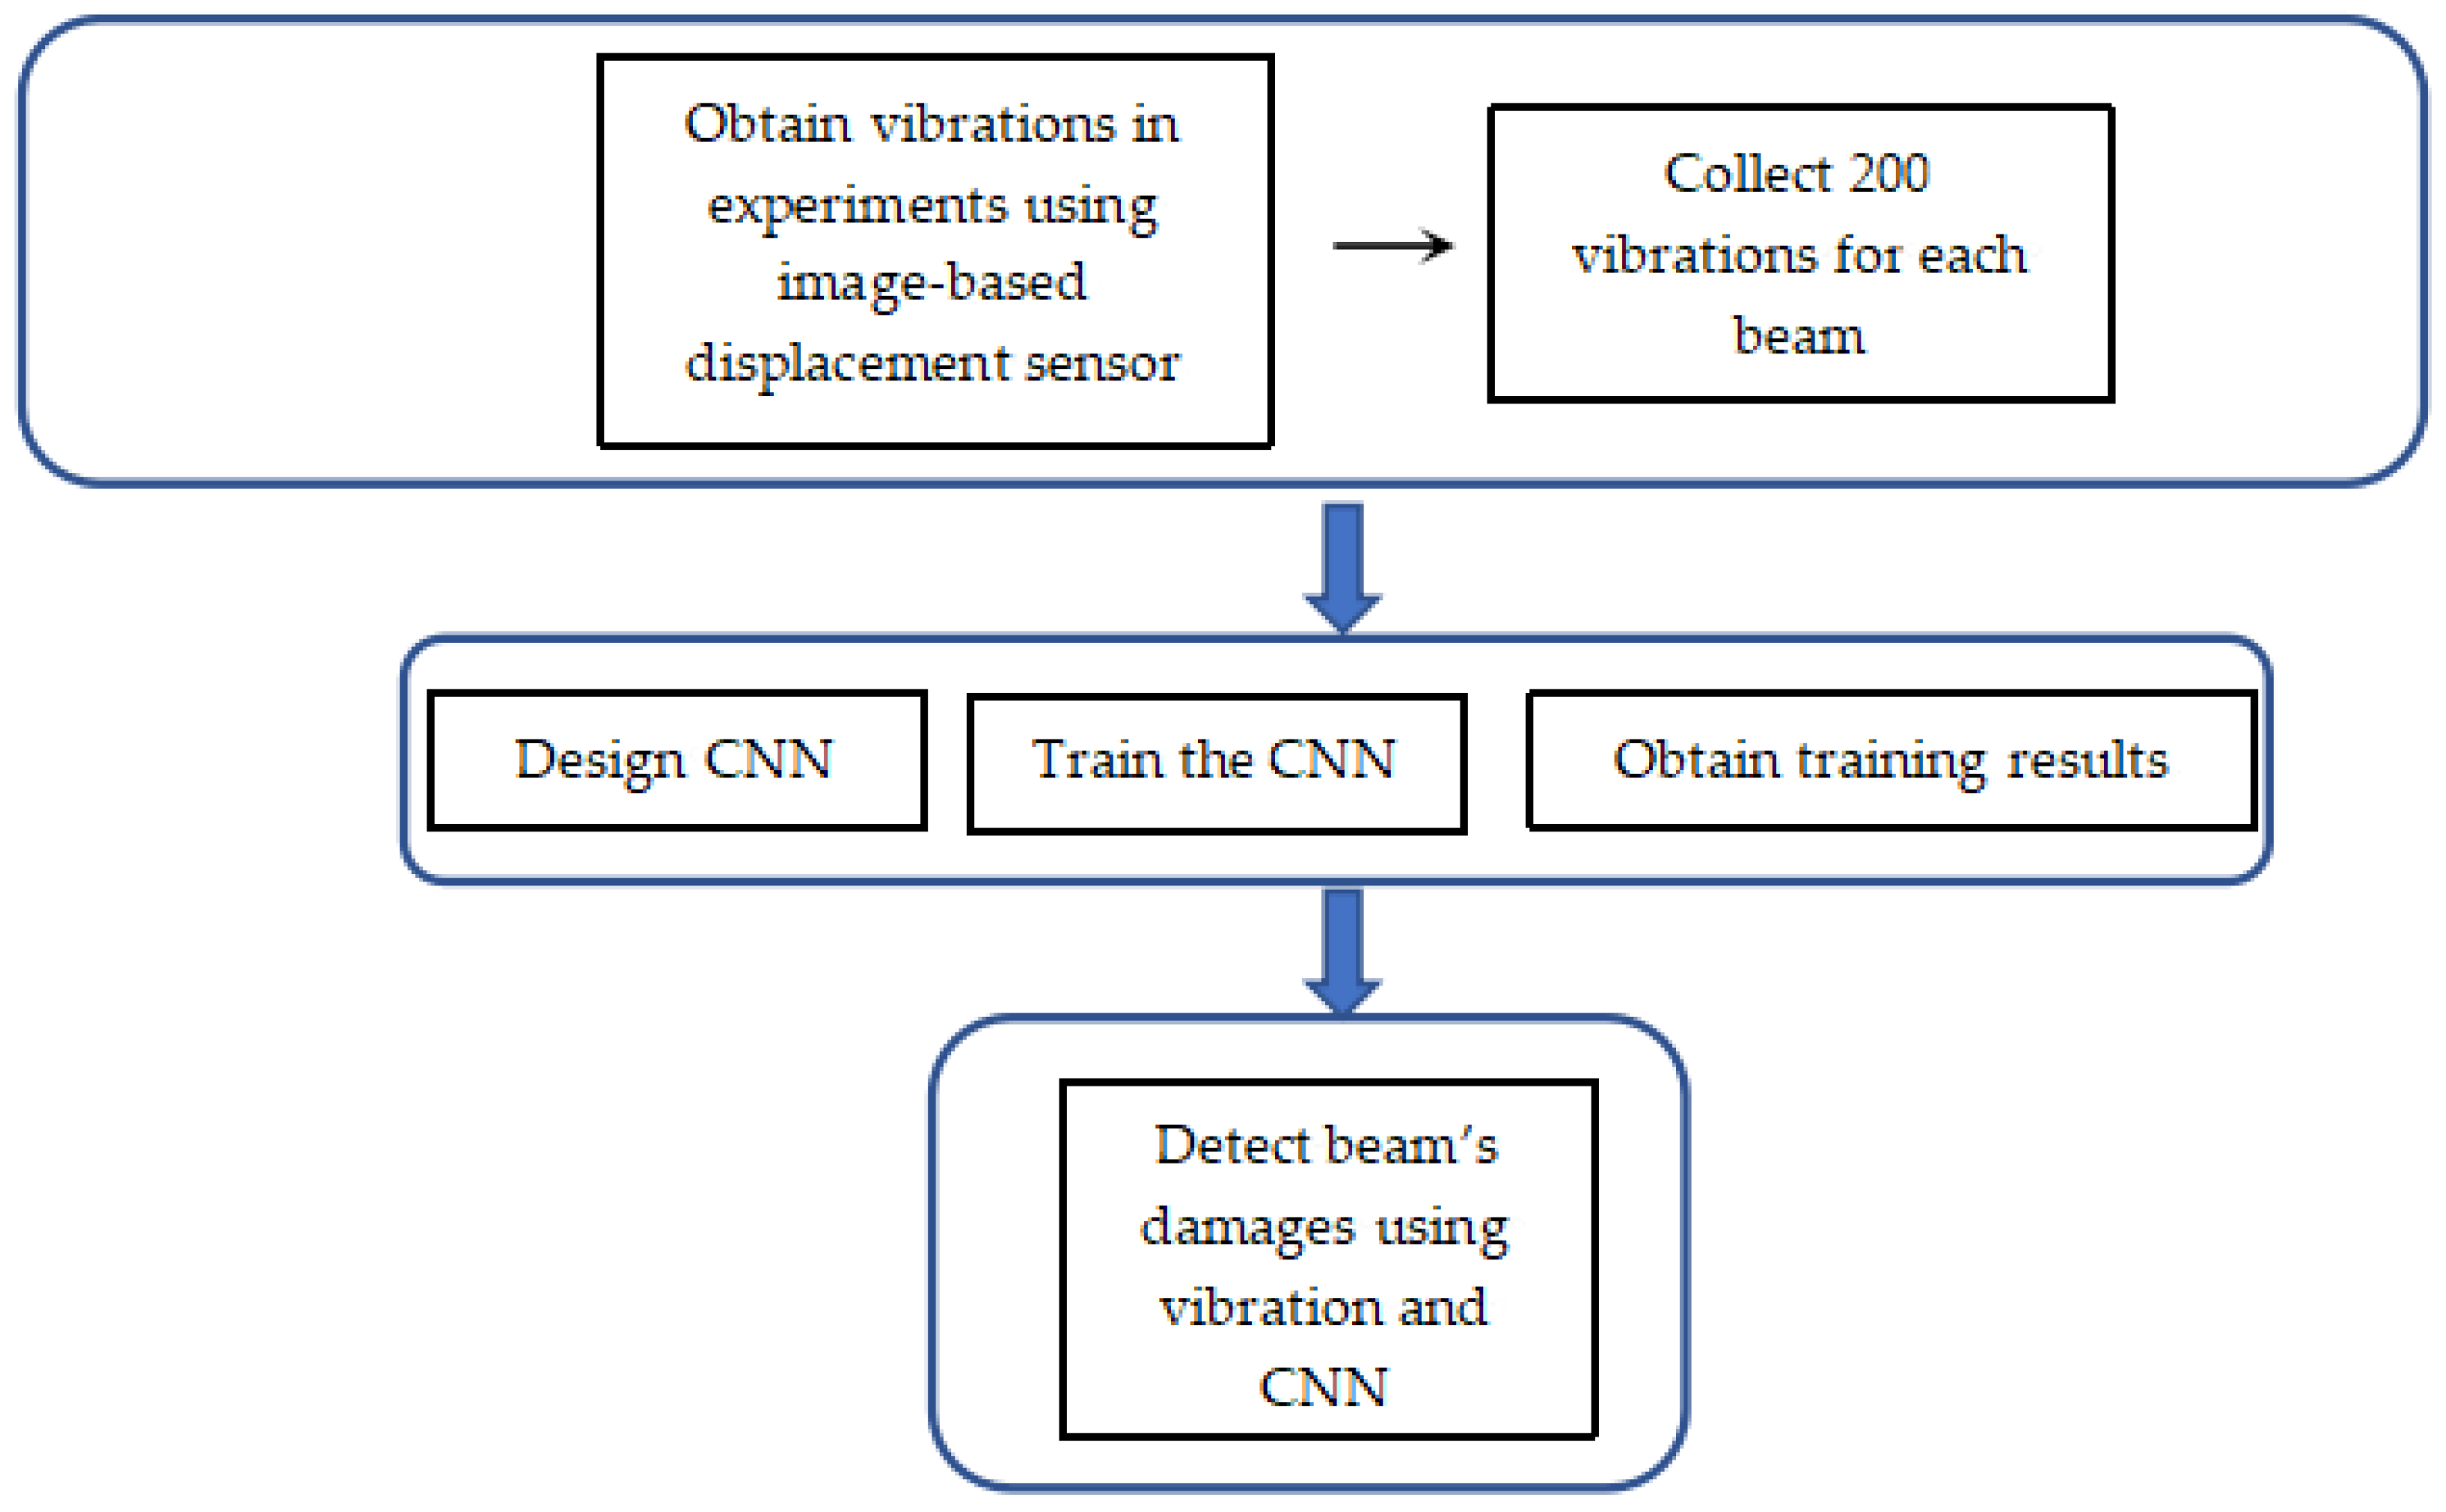
4.1. Methodologies of the Proposed Computer Vision-Based Displacement Sensor
4.2. Optimized Computer Vision-Based Displacement Sensor
4.3. Plan of the Experiment
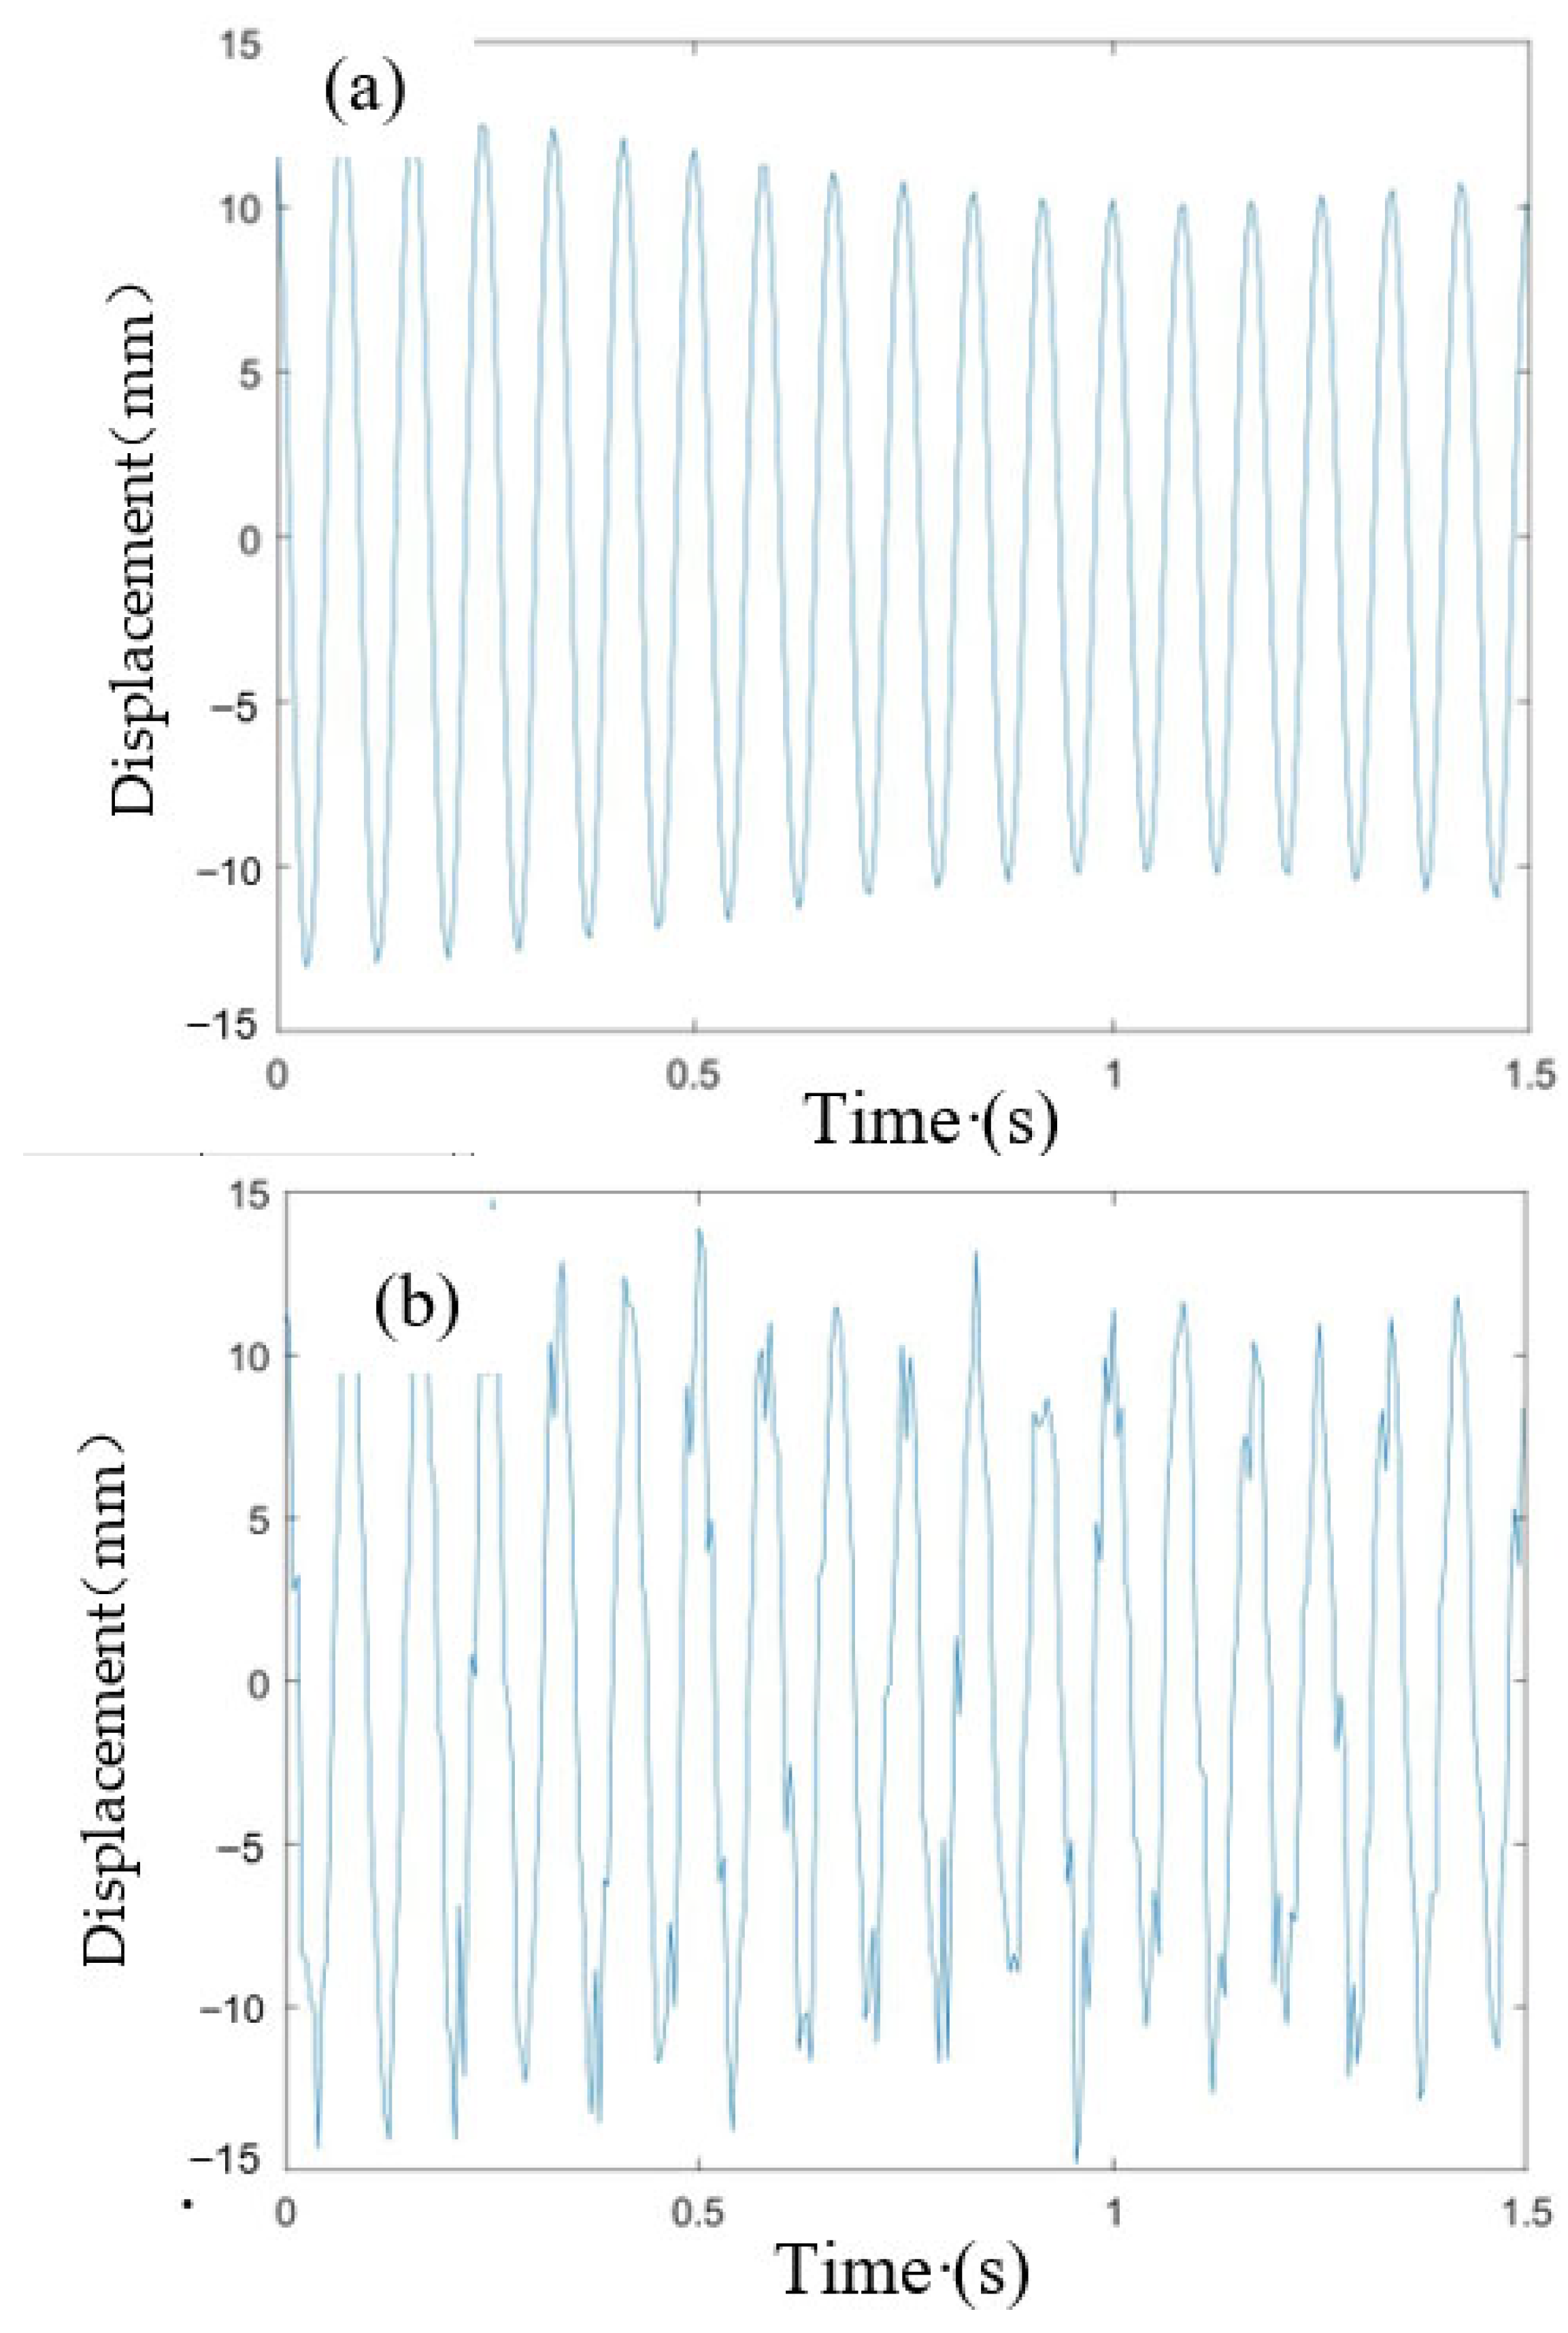
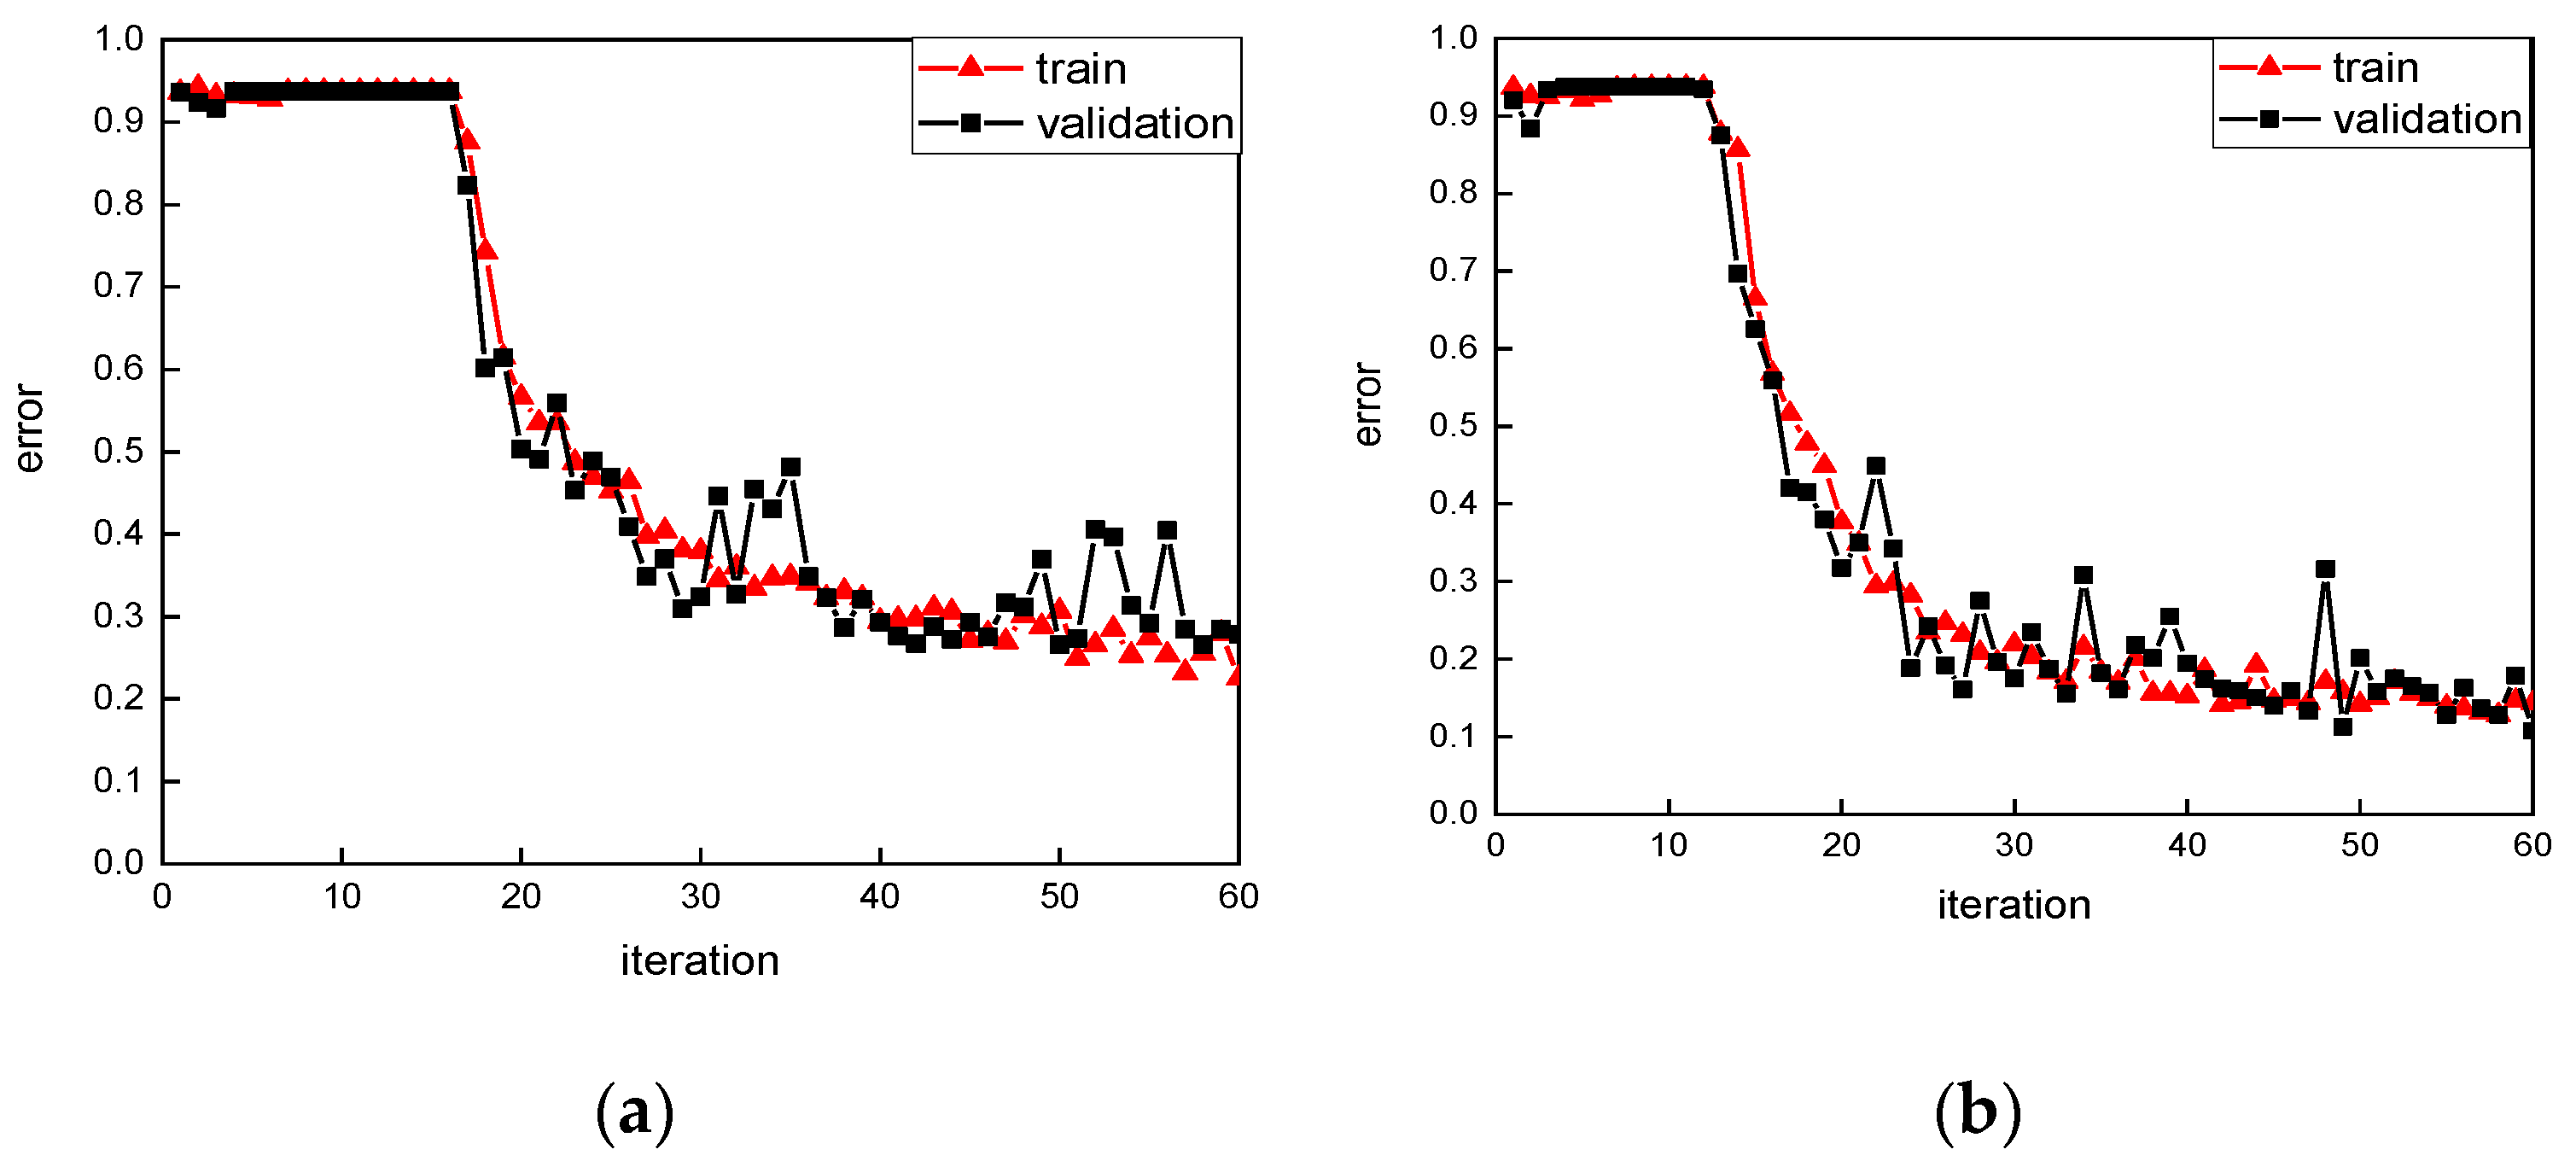
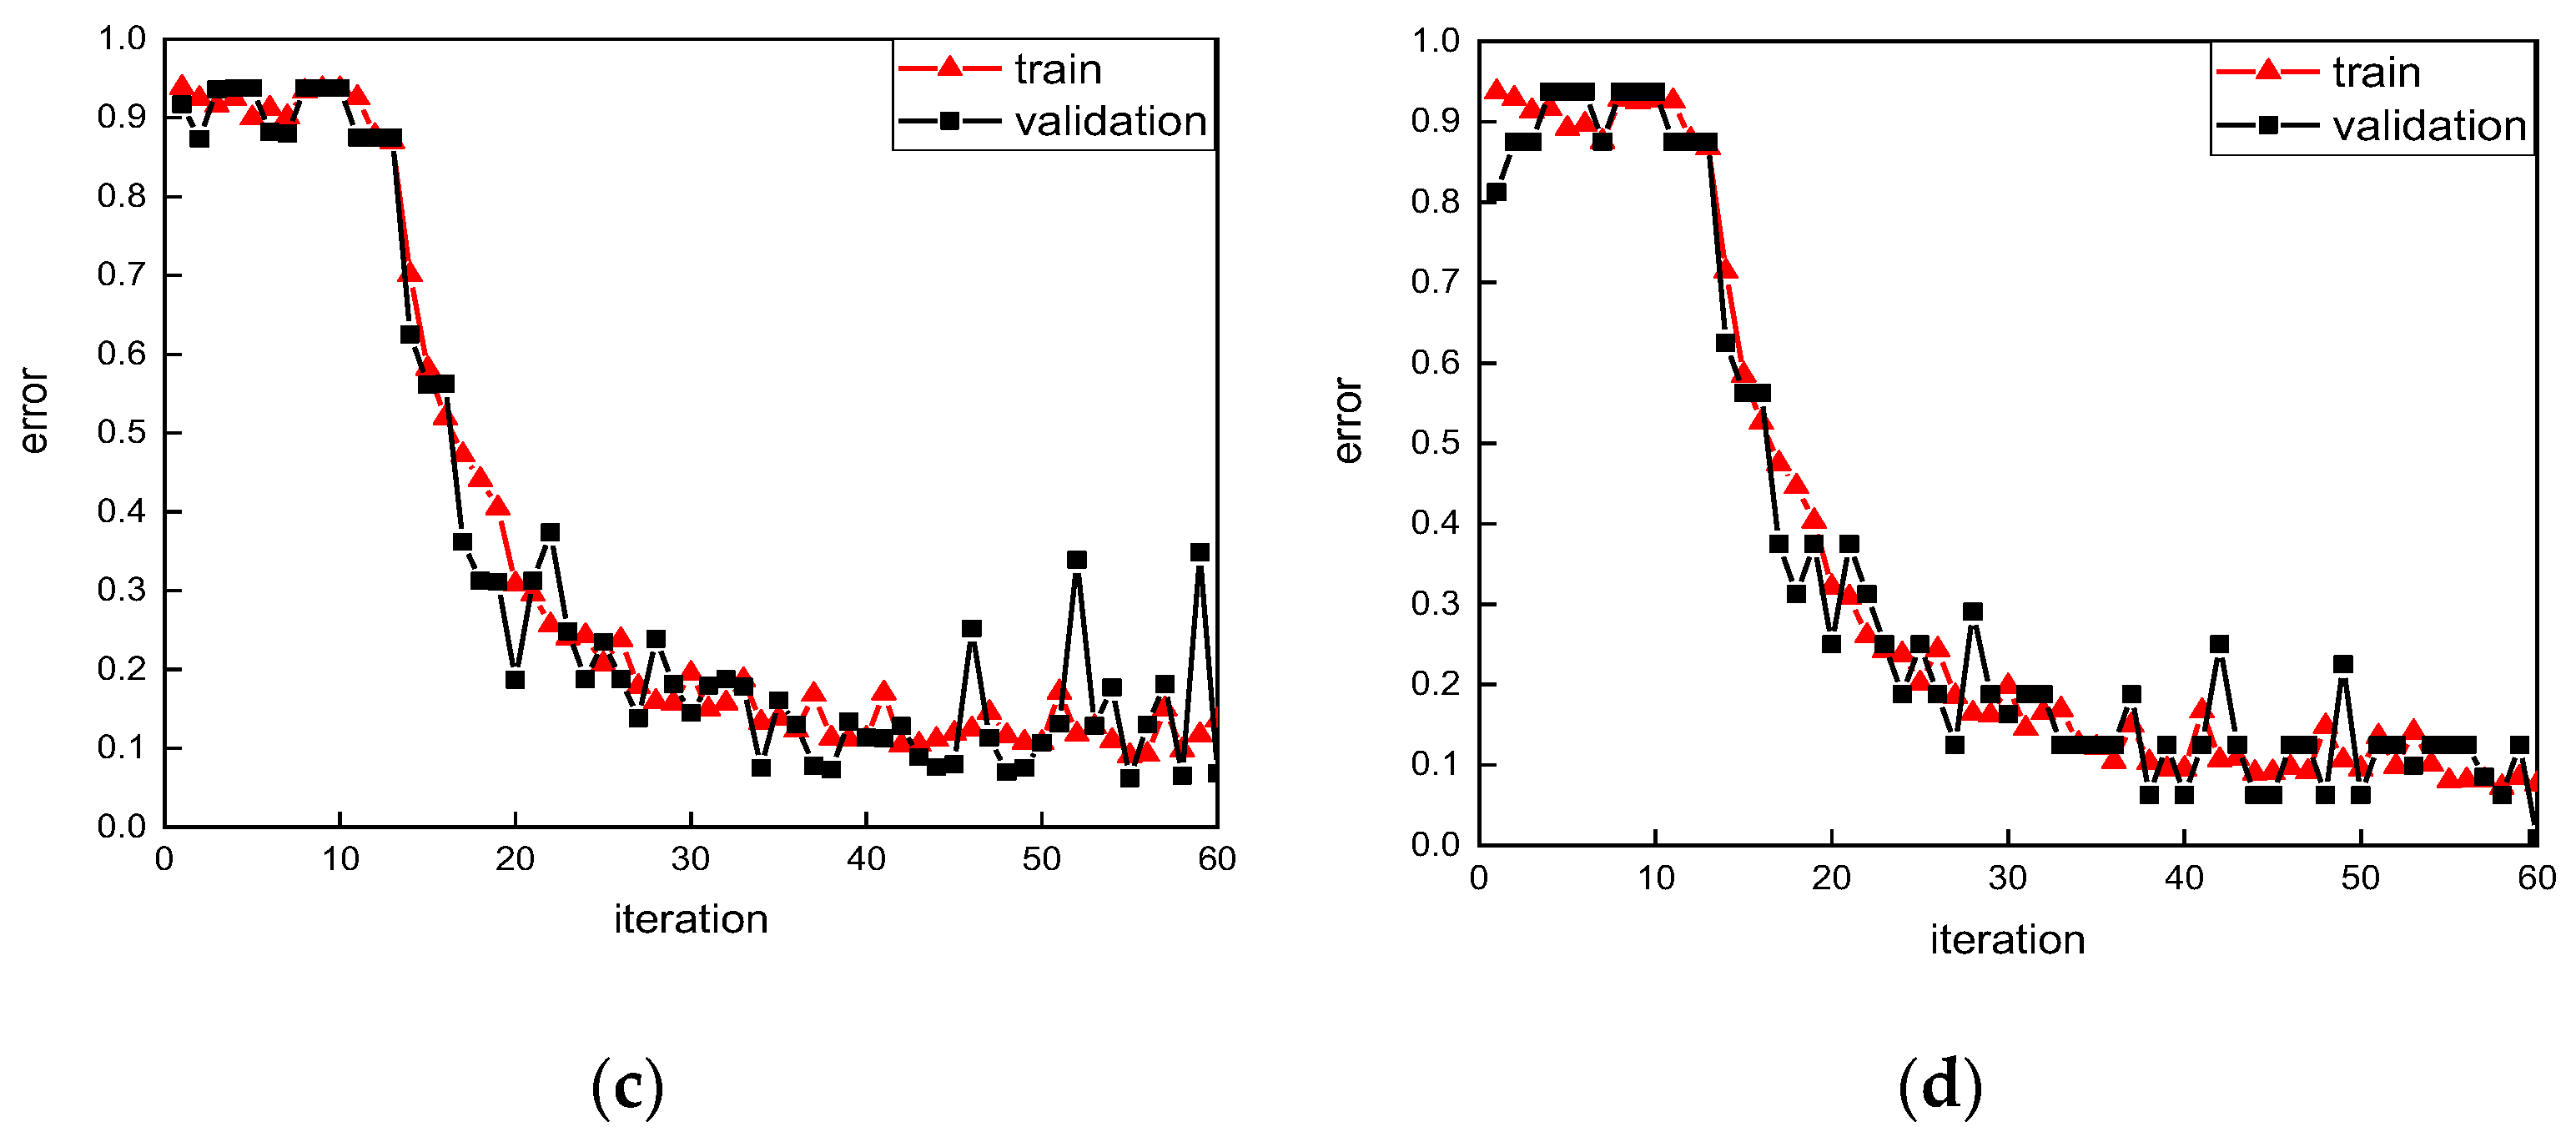
4.4. Results of Lab Experiments
5. Conclusions
- The proposed deep learning-based system was trained on beams’ raw displacement collected from ABAQUS, with an accuracy of nearly 100%.
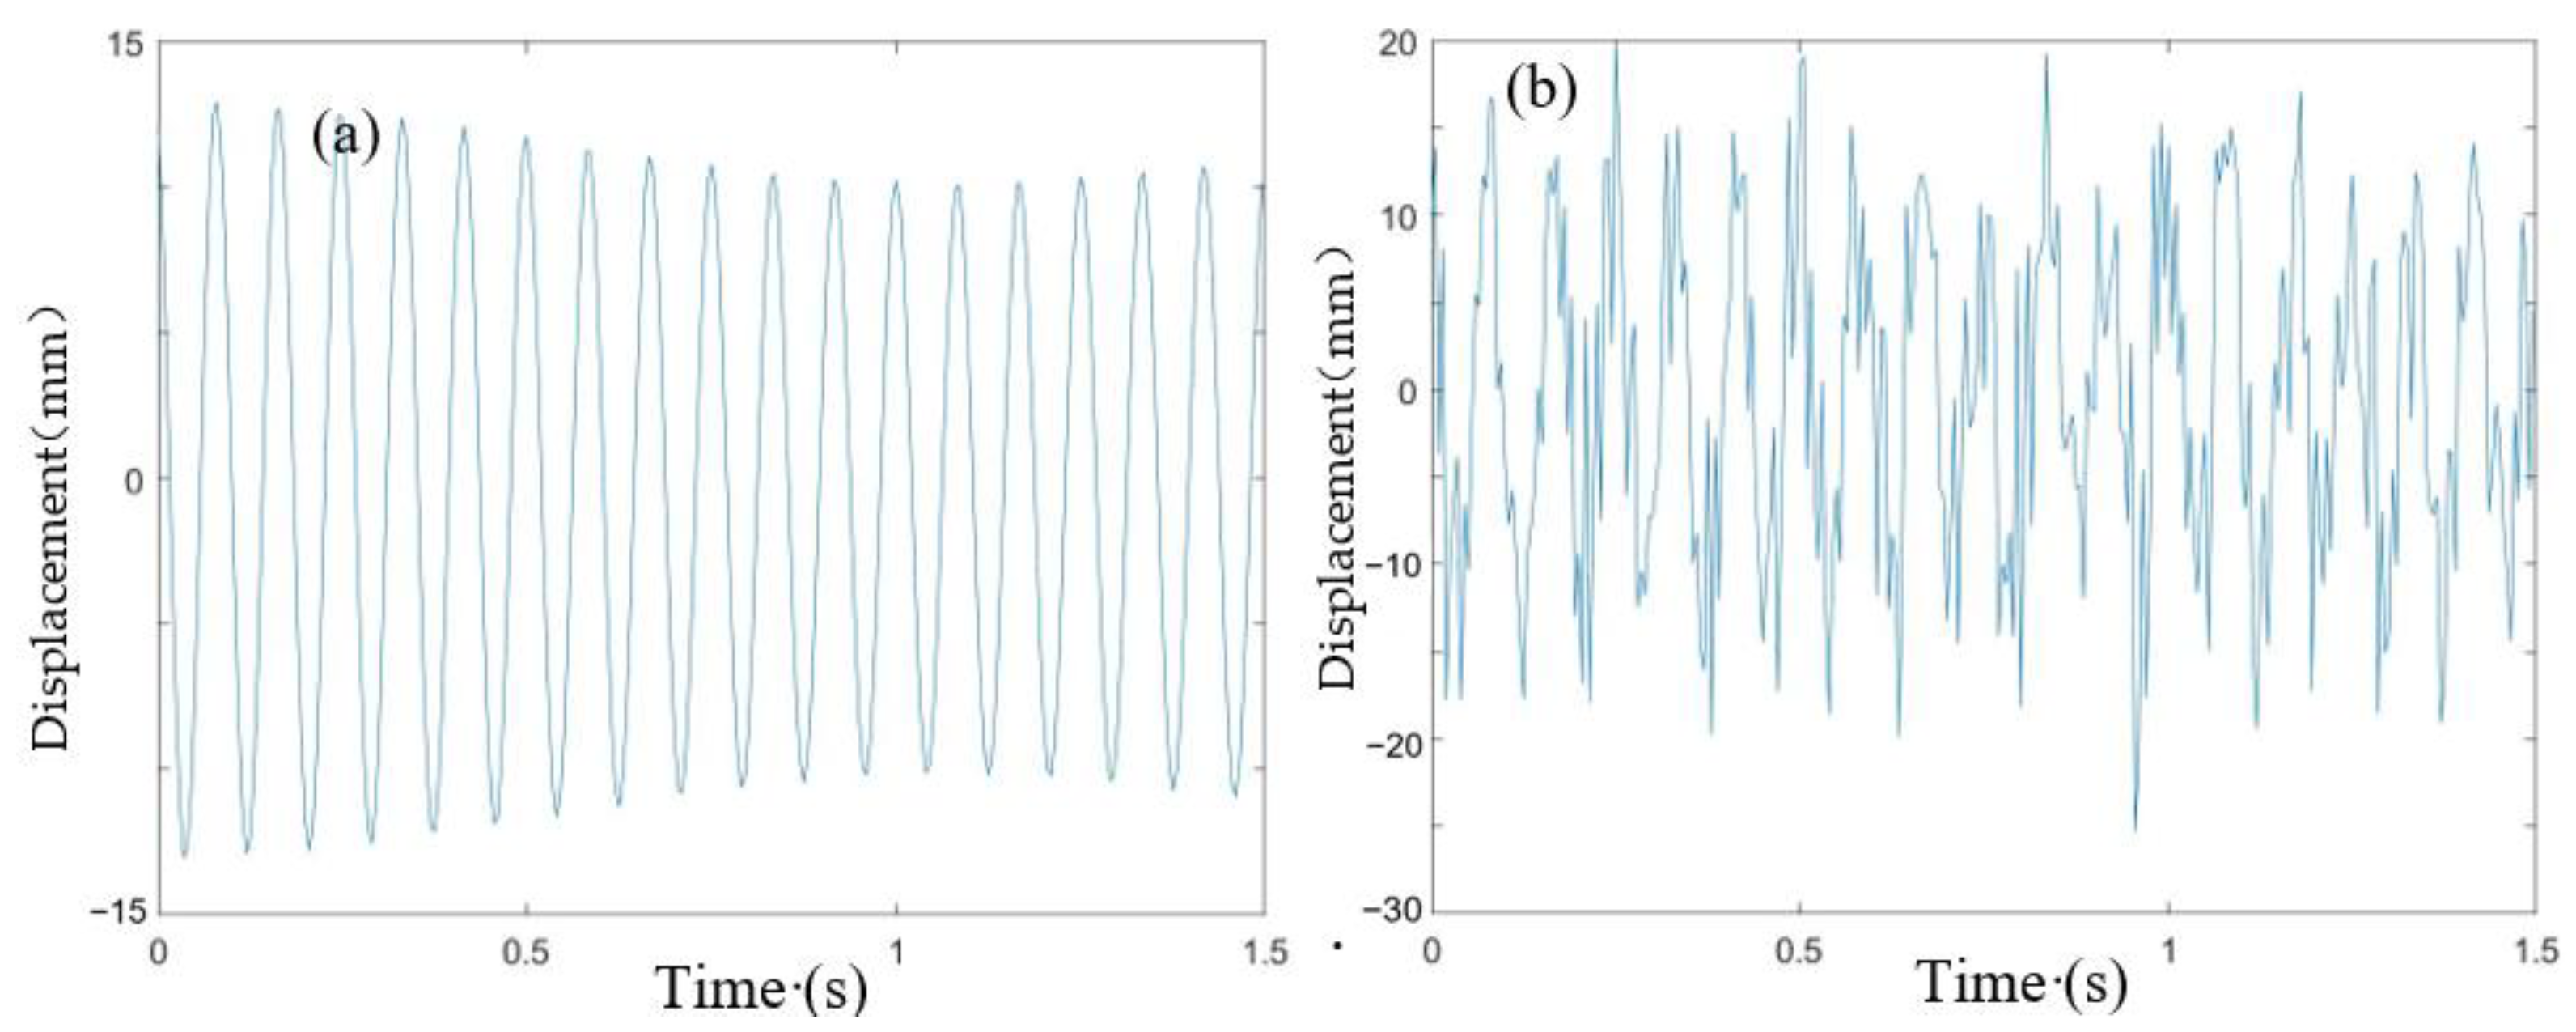
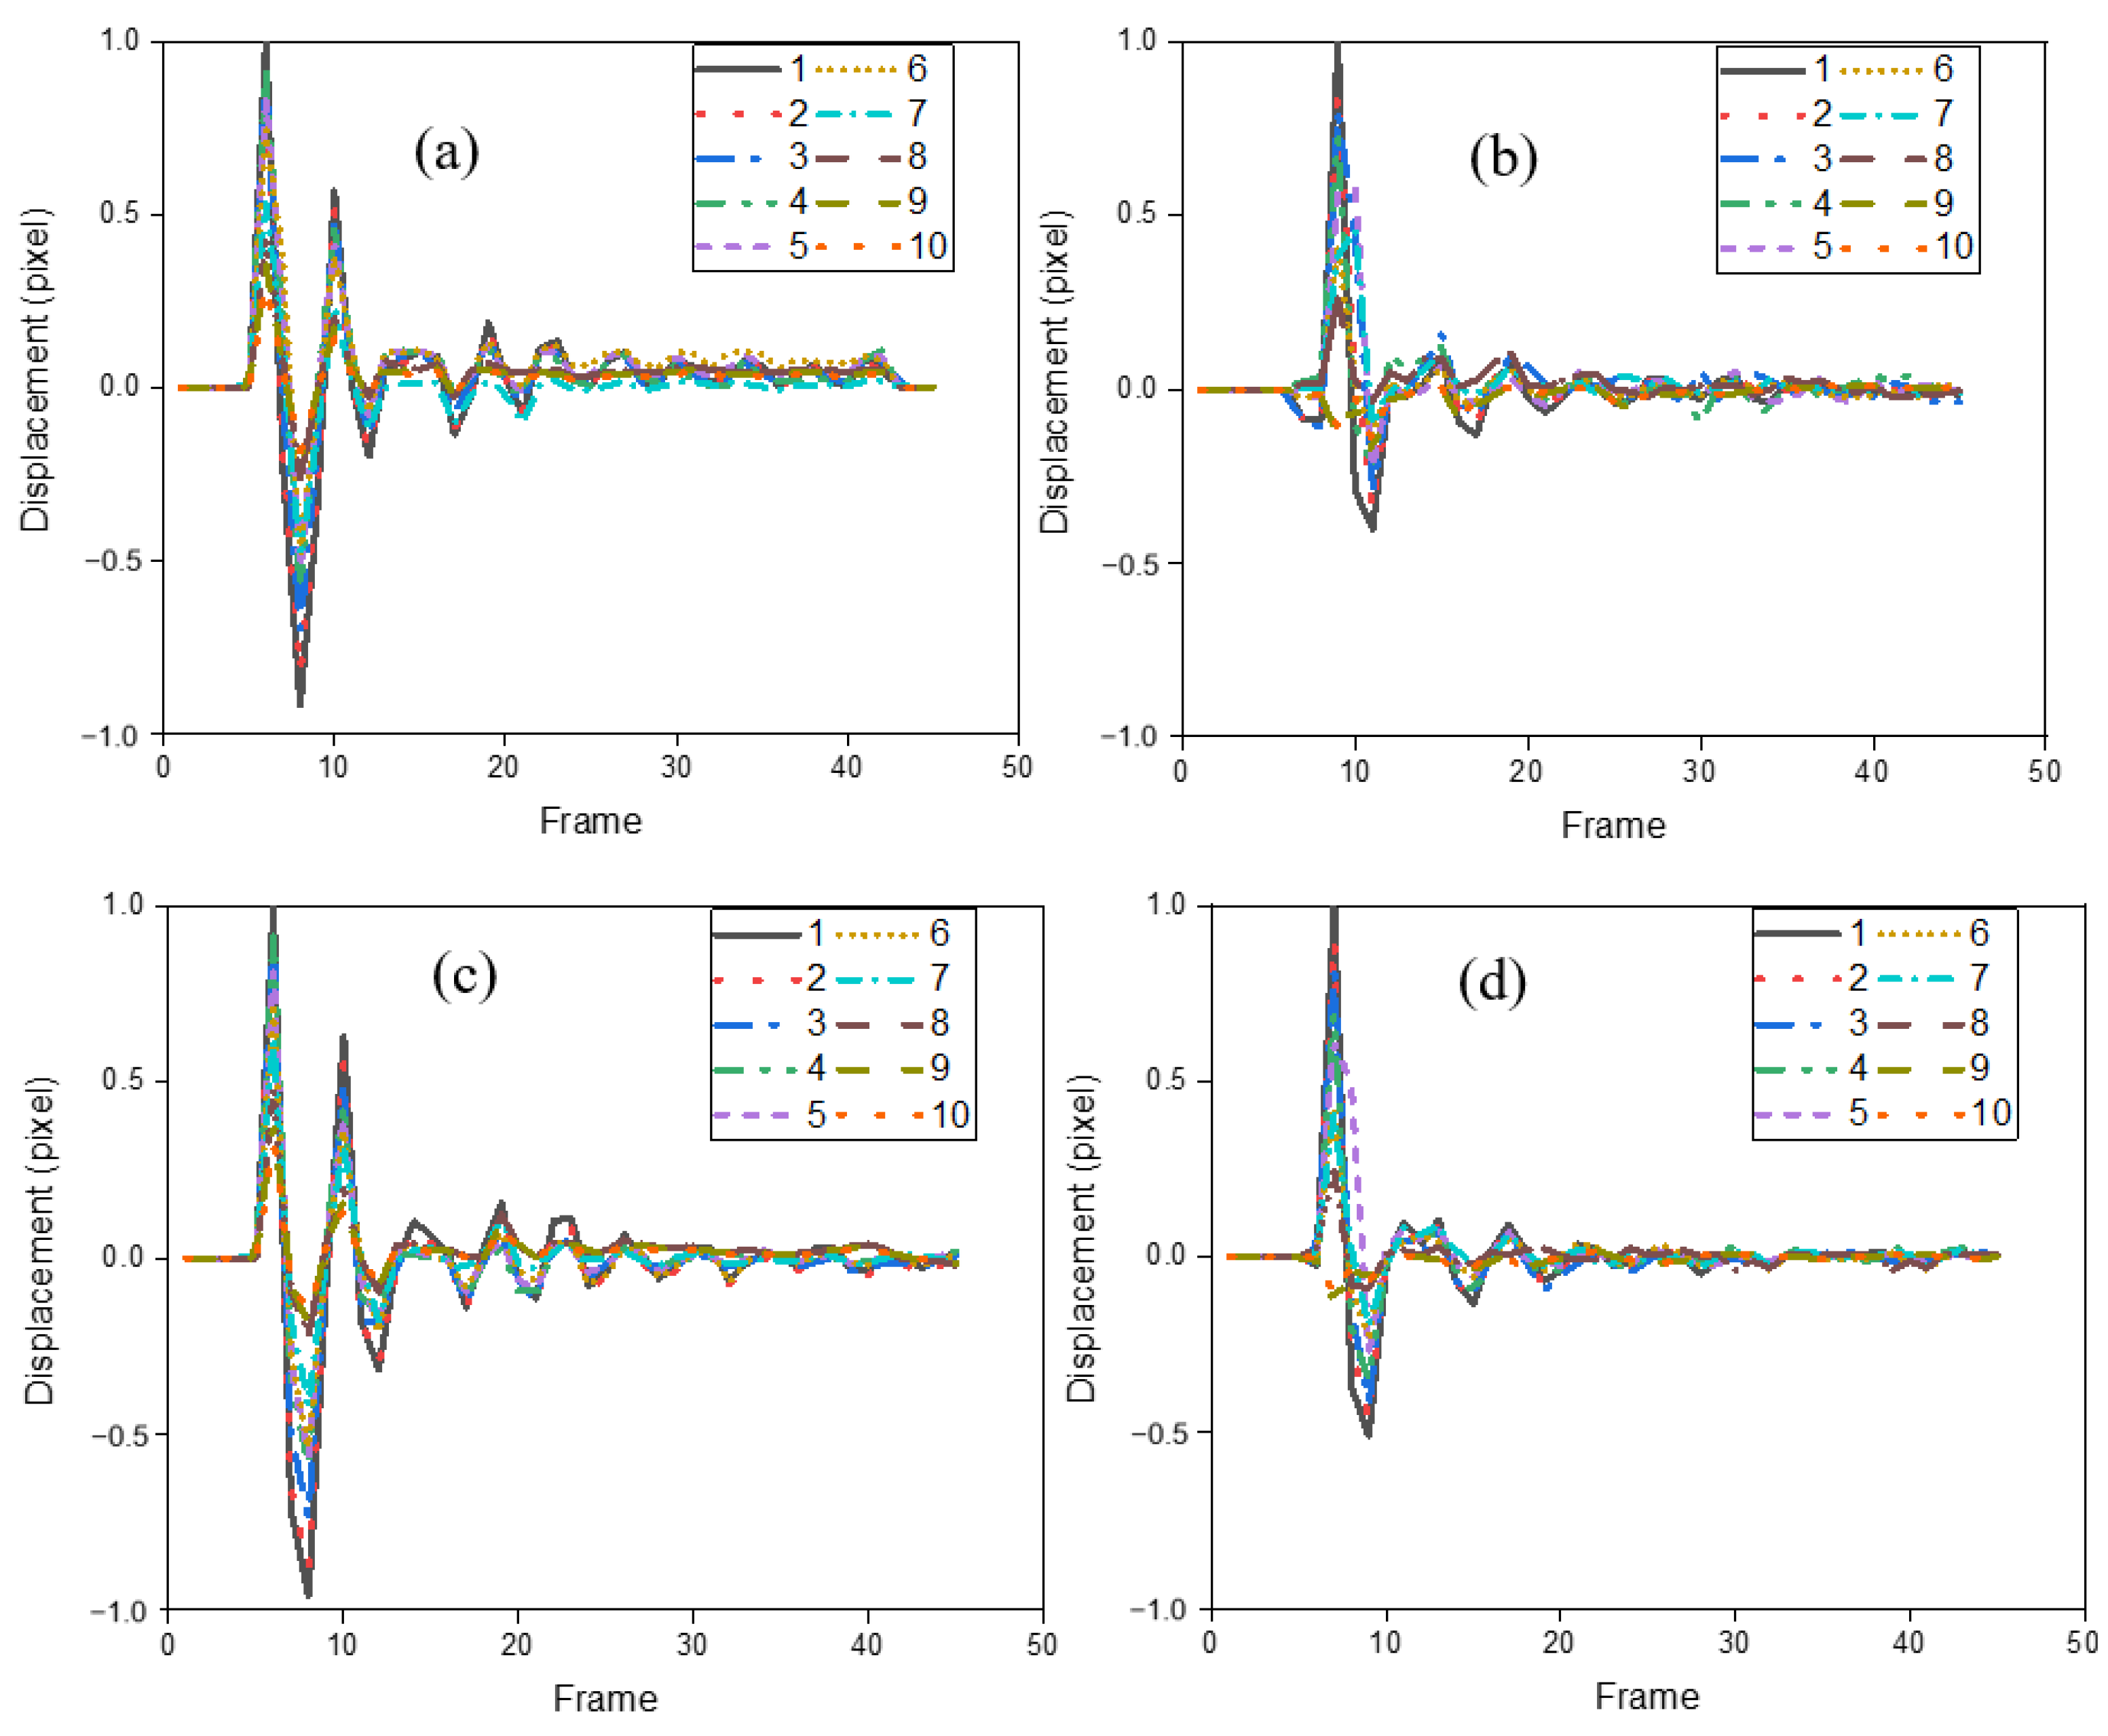
- The proposed computer vision-based displacement sensor detected the vibration of the beams successfully with high accuracy. And the developed computer vision-based displacement method detected the vibrations at 10 different points on the beam successfully. And this method only needs around 15 s to operate 700 images that contain 7000 coordinates in total.
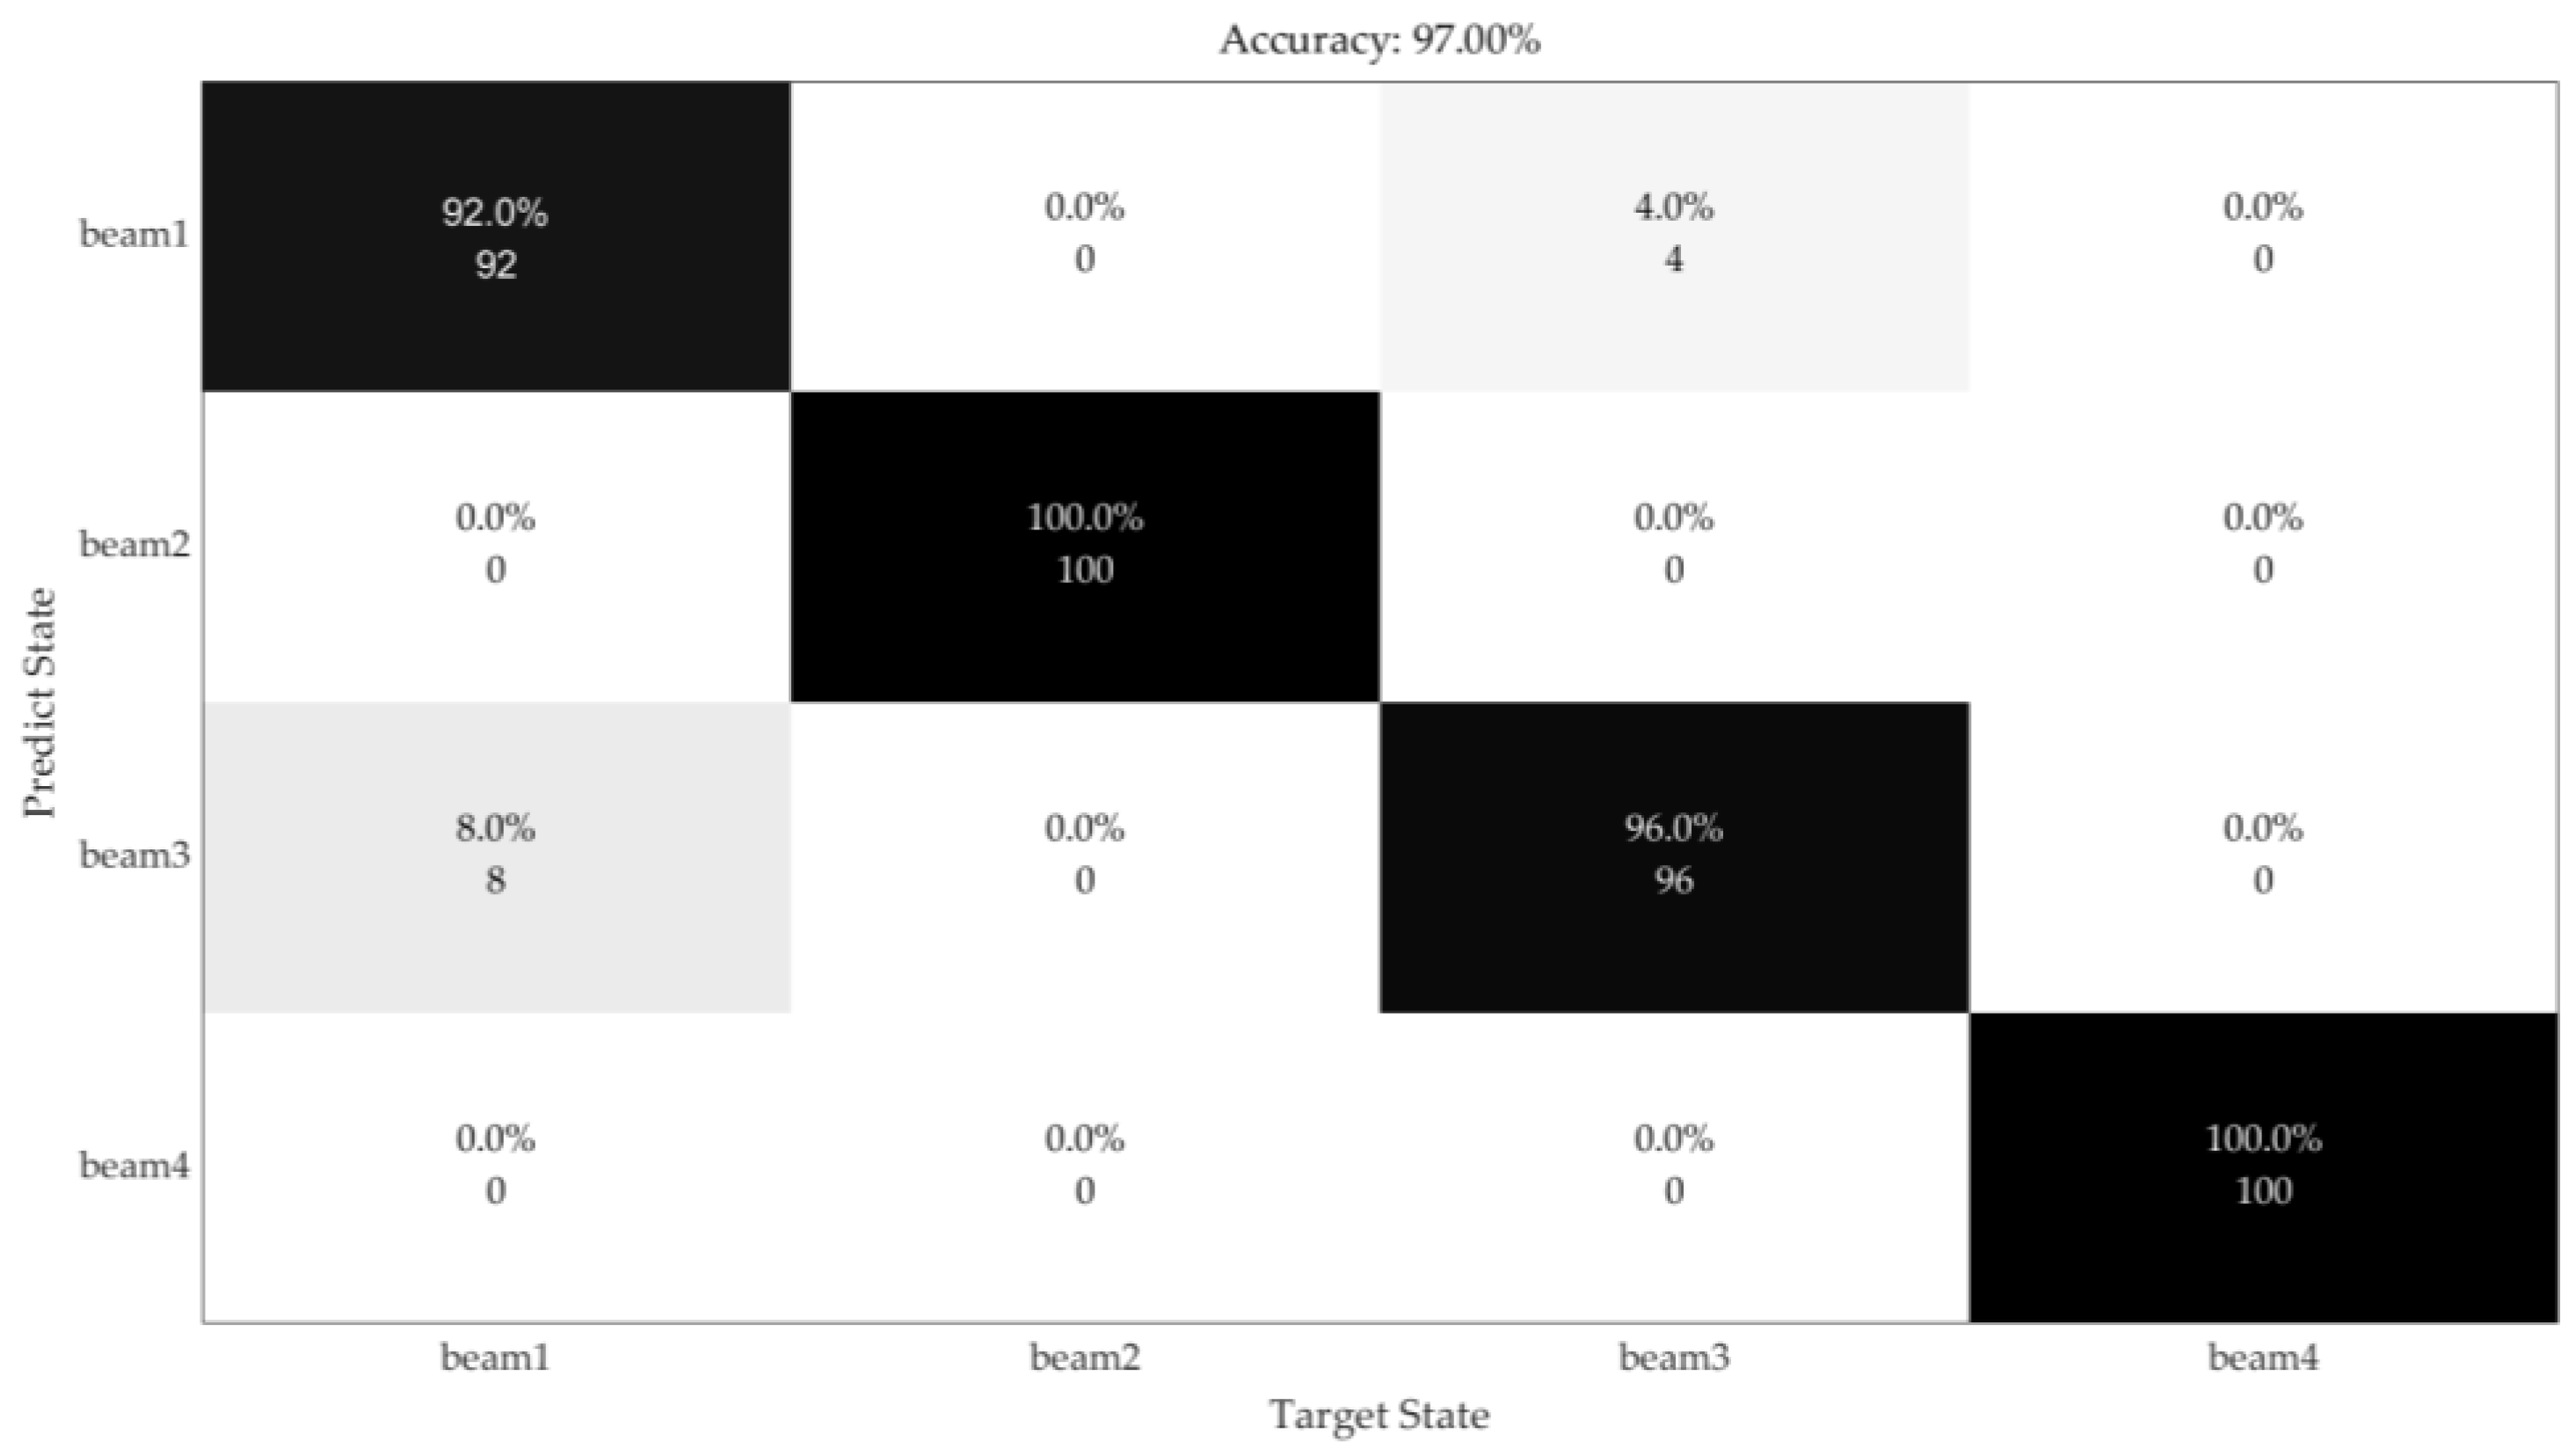
- The proposed deep learning net detected beams’ damage with 97% accuracy using the vibrations obtained by the developed computer vision-based vibration system.
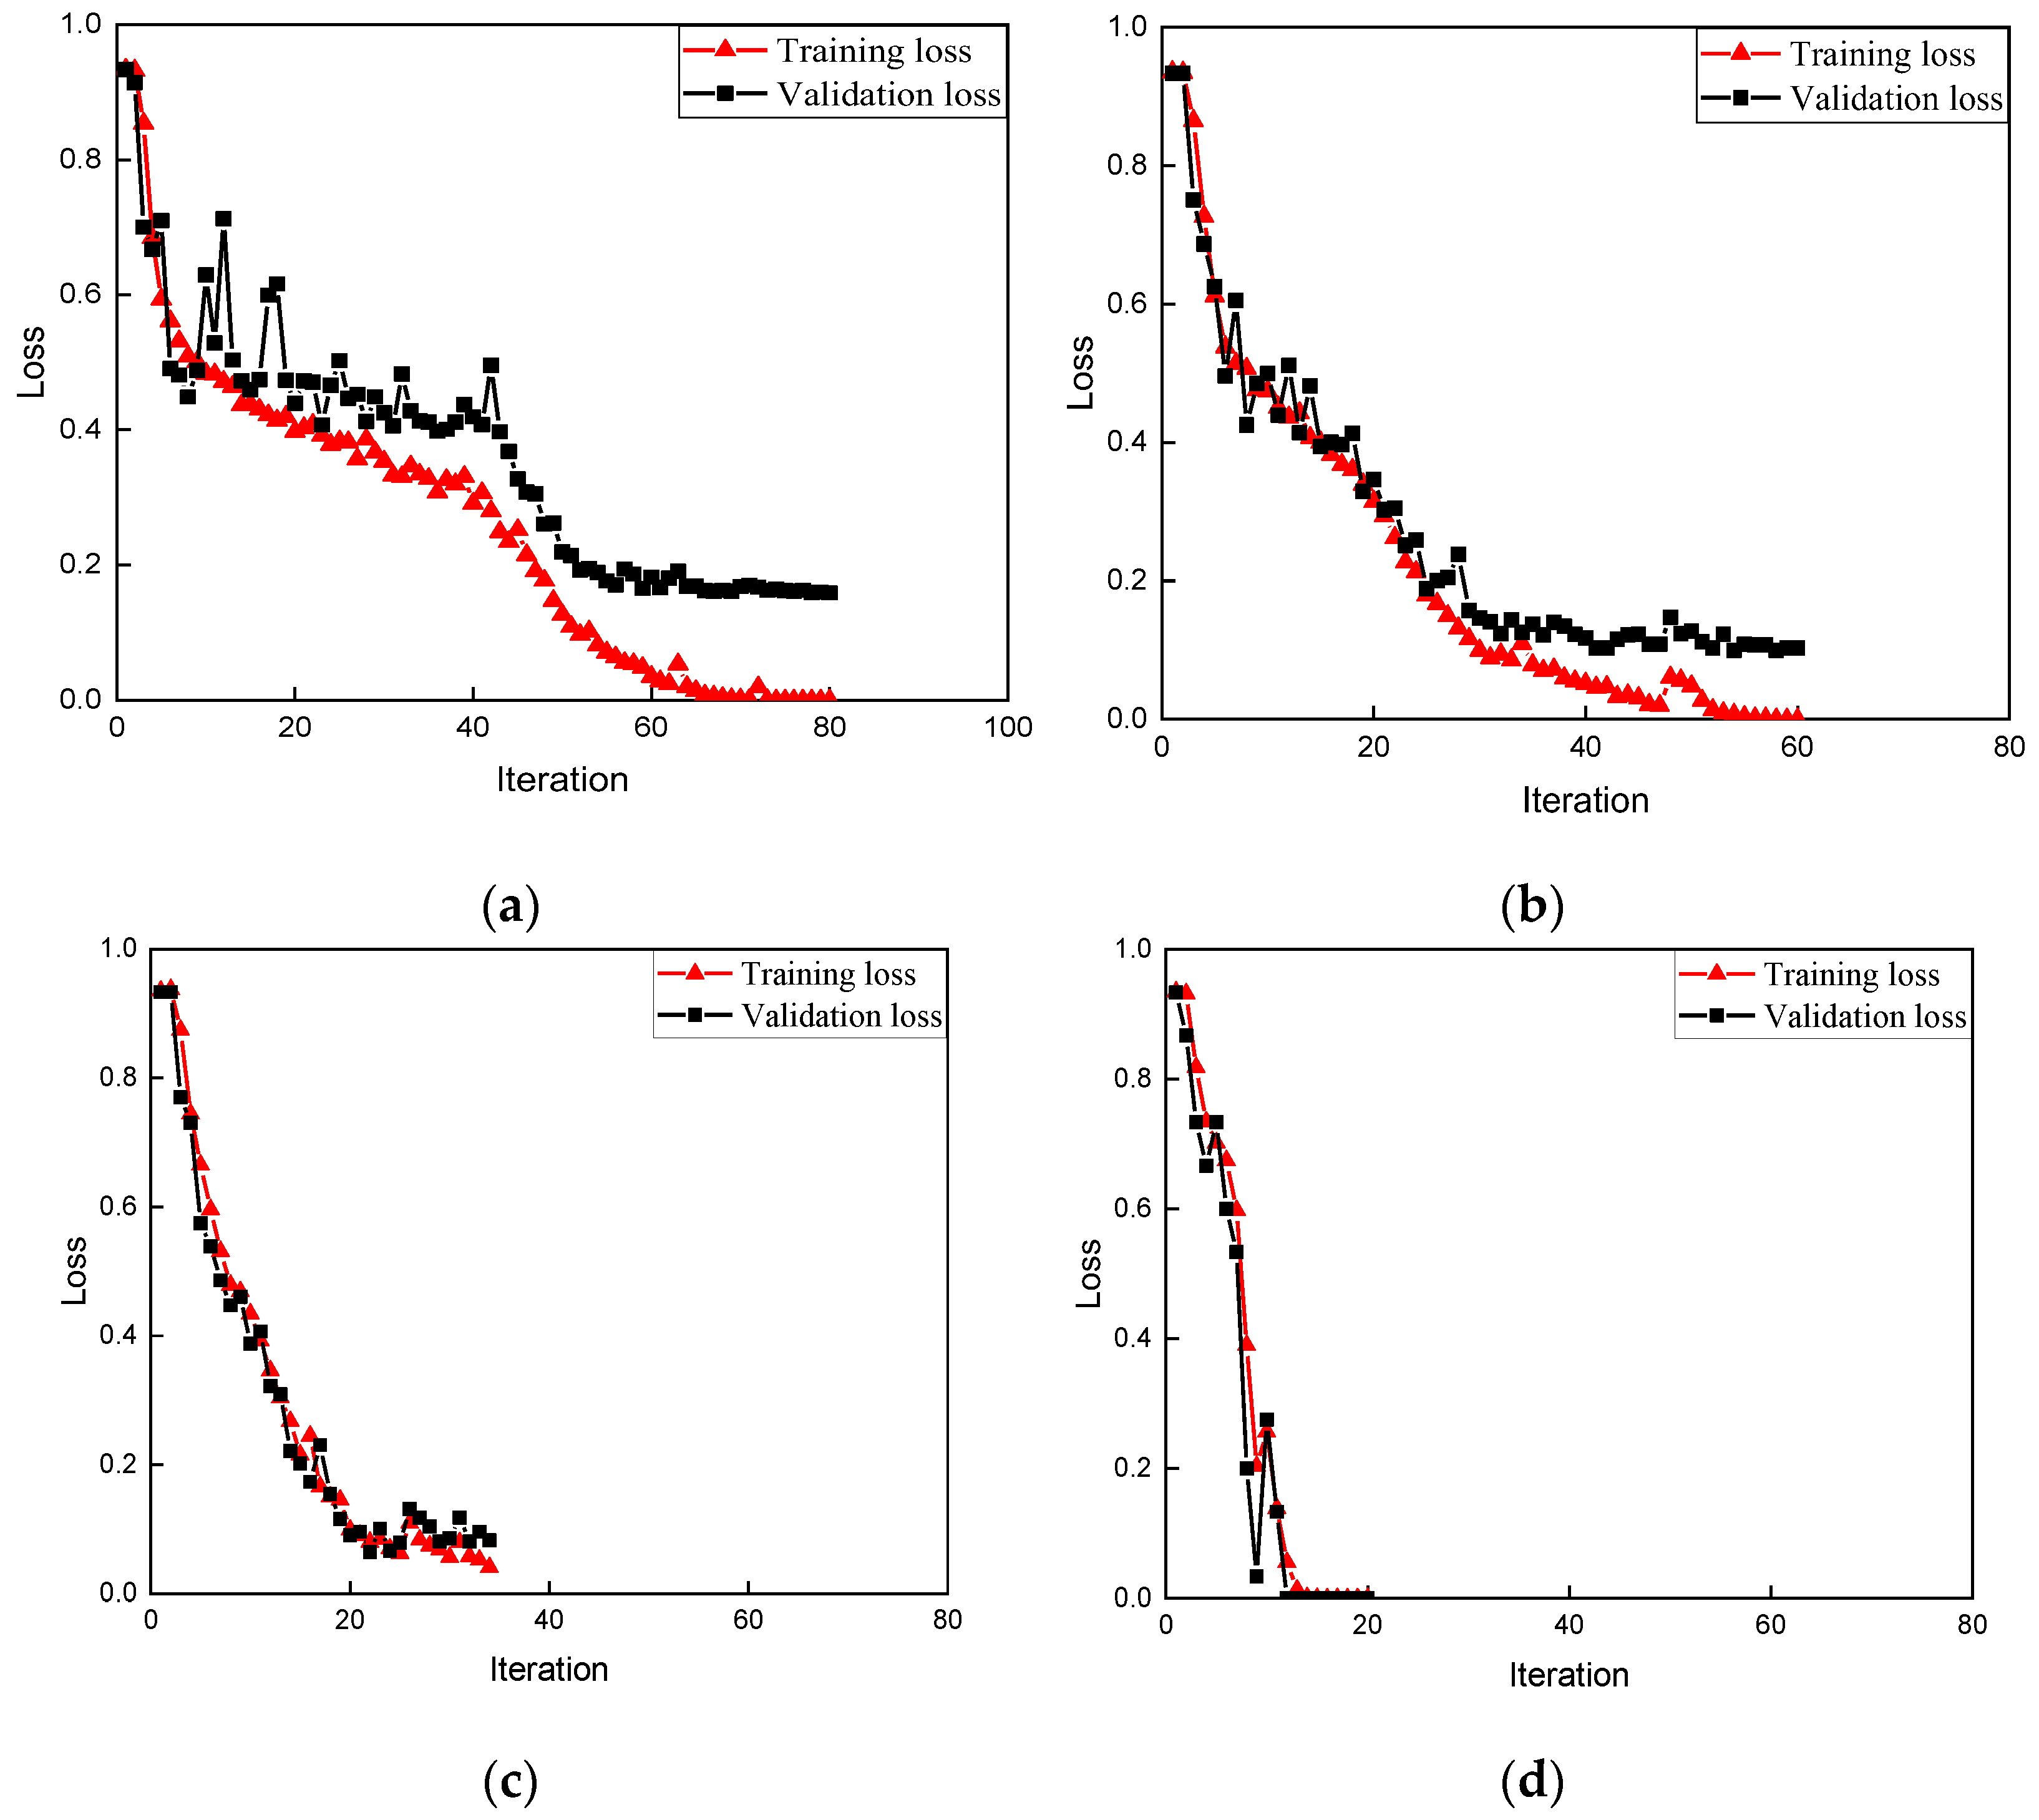
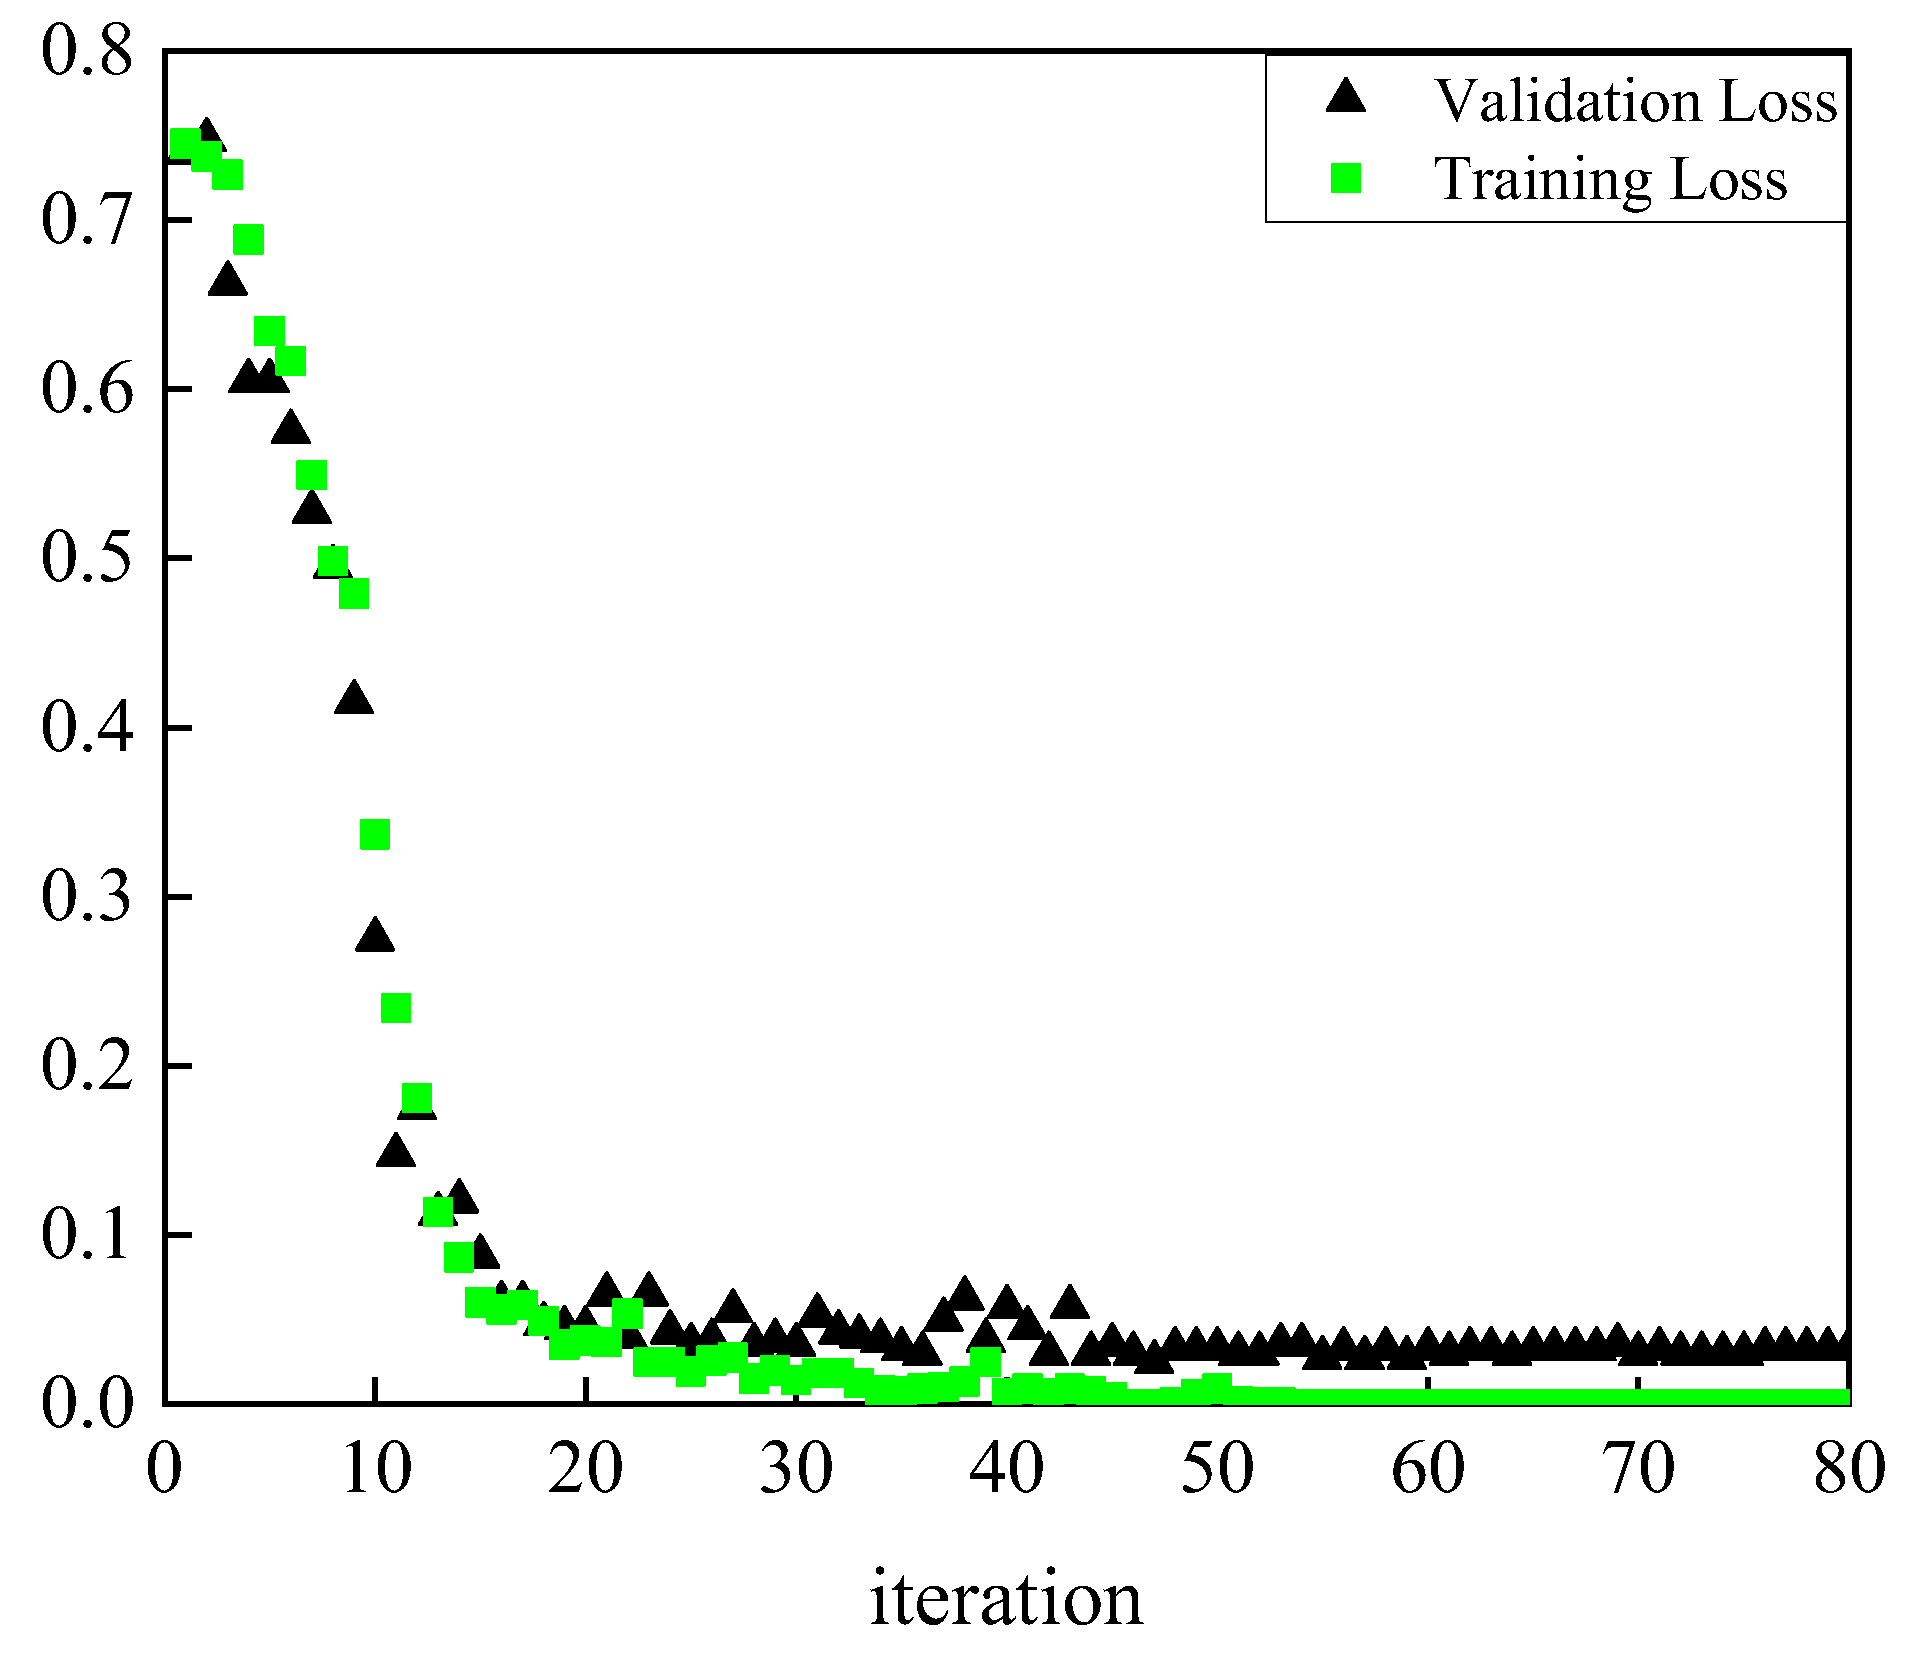
- The training processes of the beams in lab experiments decreased significantly at the beginning, which means the network worked very well and each group of vibrations obtained by the proposed image-based sensor contain unique characters.
Author Contributions
Funding
Data Availability Statement
Conflicts of Interest
References
- Nassif, H.H.; Gindy, M.; Davis, J. Comparison of laser doppler vibrometer with contact sensors for monitoring bridge deflection and vibration. NDT E Int. 2005, 38, 213–218. [Google Scholar] [CrossRef]
- Stephen, G.; Brownjohn, J.; Taylor, C.J.E.S. Measurements of static and dynamic displacement from visual monitoring of the Humber Bridge. Eng. Struct. 1993, 15, 197–208. [Google Scholar] [CrossRef]
- Olaszek, P. Investigation of the dynamic characteristic of bridge structures using a computer vision method. Measurement 1999, 25, 227–236. [Google Scholar] [CrossRef]
- Wahbeh, A.M.; Caffrey, J.P.; Masri, S.F. A vision-based approach for the direct measurement of displacements in vibrating systems. Smart Mater. Struct. 2003, 12, 785. [Google Scholar] [CrossRef]
- Lee, J.J.; Shinozuka, M. A vision-based system for remote sensing of bridge displacement. NDT E Int. 2006, 39, 425–431. [Google Scholar] [CrossRef]
- Lei, X.; Jin, Y.; Guo, J. Vibration extraction based on fast NCC algorithm and high-speed camera. Appl. Opt. 2015, 54, 8198–8206. [Google Scholar] [CrossRef]
- Lin, S.Y.; Mills, J.P.; Gosling, P.D. Videogrammetric monitoring of as-built membrane roof structures. Photogramm. Rec. 2008, 23, 128–147. [Google Scholar] [CrossRef]
- Jurjo, D.L.B.R.; Magluta, C.; Roitman, N.; Gonçalves, P.B. Analysis of the structural behavior of a membrane using digital image processing. Mech. Syst. Signal Process. 2015, 54, 394–404. [Google Scholar] [CrossRef]
- Deng, Z.; Huang, M.; Wan, N.; Zhang, J. The current development of structural health monitoring for bridges: A review. Buildings 2023, 13, 1360. [Google Scholar] [CrossRef]
- Adeli, H.; Jiang, X. Intelligent Infrastructure: Neural Networks, Wavelets, and Chaos Theory for Intelligent Transportation Systems and Smart Structures; CRC Press: Boca Raton, FL, USA, 2009; p. 440. [Google Scholar]
- Soto, M.G.; Adeli, H. Vibration control of smart base-isolated irregular buildings using neural dynamic optimization model and replicator dynamics. Eng. Struct. 2018, 156, 322–336. [Google Scholar] [CrossRef]
- Cawley, P.; Adams, R.D. The location of defects in structures from measurements of natural frequencies. J. Strain Anal. Eng. Des. 1979, 14, 49–57. [Google Scholar] [CrossRef]
- Chang, K.C.; Kim, C.W. Modal-parameter identification and vibration-based damage detection of a damaged steel truss bridge. Eng. Struct. 2016, 122, 156–173. [Google Scholar] [CrossRef]
- Reynders, E.; Wursten, G.; De Roeck, G. Output-only fault detection in structural engineering based on kernel PCA. In Proceedings of the BIL2014 Workshop on Data-Driven Modeling Methods and Applications, Leuven, Belgium, 14–15 July 2014. [Google Scholar]
- Yan, A.M.; Kerschen, G.; De Boe, P.; Golinval, J.C. Structural damage diagnosis under varying environmental conditions. Part I: A linear analysis. Mech. Syst. Signal Process. 2015, 19, 847–864. [Google Scholar] [CrossRef]
- Lin, Y.Z.; Nie, Z.H.; Ma, H.W. Structural damage detection with automatic feature extraction through deep learning. Comput.-Aided Civ. Infrastruct. Eng. 2017, 32, 1025–1046. [Google Scholar] [CrossRef]
- Avci, O.; Abdeljaber, O.; Kiranyaz, S.; Hussein, M.; Inman, D.J. Wireless and real-time structural damage detection: A novel decentralized method for wireless sensor networks. J. Sound Vib. 2018, 424, 158–172. [Google Scholar] [CrossRef]
- Tran, V.L.; Vo, T.C.; Nguyen, T.Q. One-dimensional convolutional neural network for damage detection of structures using time series data. Asian J. Civ. Eng. 2024, 25, 827–860. [Google Scholar] [CrossRef]
- Mai, S.H.; Nguyen, D.H.; Tran, V.-L.; Thai, D.-K. Development of hybrid machine learning models for predicting permanent transverse displacement of circular hollow section steel members under impact loads. Buildings 2024, 13, 1384. [Google Scholar] [CrossRef]
- Jiang, C.; Zhou, Q.; Lei, J.; Wang, X. A Two-stage structural damage detection method based on 1D-CNN and SVM. Appl. Sci. 2022, 12, 10394. [Google Scholar] [CrossRef]
- Lei, J.; Cui, Y.; Shi, W. Structural damage identification method based on vibration statistical indicators and support vector machine. Adv. Struct. Eng. 2022, 25, 1310–1322. [Google Scholar] [CrossRef]
- Wu, R.; Jahanshahi, M.R. Data fusion approaches for structural health monitoring and system identification: Past, present, and future. Struct. Health Monit. 2020, 19, 552–586. [Google Scholar] [CrossRef]
- Zhang, X.; Han, P.; Xu, L.; Zhang, F.; Wang, Y.; Gao, L. Research on bearing fault diagnosis of wind turbine gearbox based on 1dcnn-pso-svm. IEEE Access 2020, 8, 192248–192258. [Google Scholar] [CrossRef]
- Wang, X.; Zhang, X.; Shahzad, M.M. A novel structural damage identification scheme based on deep learning framework. Structures 2021, 29, 1537–1549. [Google Scholar] [CrossRef]
- Xiao, H.; Wang, W.; Dong, L.; Ogai, H. A novel bridge damage diagnosis algorithm based on deep learning with gray relational analysis for intelligent bridge monitoring system. IEEJ Trans. Electr. Electron. Eng. 2021, 16, 730–742. [Google Scholar] [CrossRef]
- Huang, L.; He, H.X.; Wang, W. Intelligent recognition of erosion damage to concrete based on improved YOLO-v3. Mater. Lett. 2021, 302, 130363. [Google Scholar]
- Mao, G.; Zhang, Z.; Qiao, B.; Li, Y. Fusion domain-adaptation CNN driven by images and vibration signals for fault diagnosis of gearbox cross-working conditions. Entropy 2022, 24, 119. [Google Scholar] [CrossRef] [PubMed]
- Tran, V.; Yang, B.; Gu, F.; Ball, A. Thermal image enhancement using bi-dimensional empirical mode decomposition in combination with relevance vector machine for rotating machinery fault diagnosis. Mech. Syst. Sig. Process. 2013, 38, 601–614. [Google Scholar] [CrossRef]
- Sadeghian, A.; Moradi Shaghaghi, T.; Mohammadi, Y.; Taghipoor, H. Performance Assessment of Hybrid Fibre-Reinforced Concrete (FRC) under Low-Speed Impact: Experimental Analysis and Optimized Mixture. Shock. Vib. 2023, 2023, 7110987. [Google Scholar] [CrossRef]
- Bai, X.; Yang, M.; Ajmera, B. An Advanced Edge-Detection Method for Noncontact Structural Displacement Monitoring. Sensors 2020, 20, 4941. [Google Scholar] [CrossRef]


| Case | 1 | 2 | 3 | 4 | 5 | 6 | 7 | 8 | 9 | 10 | 11 | 12 | 13 | 14 | 15 | 16 |
| Damage | Healthy | 1# | 2# | 3# | 4# | 5# | 6# | 7# | 8# | 9# | 10# | 1#,4# | 3#,6# | 1#,5# | 4#,8# | 5#,9# |
| Case | 0 | 1 | 2 | 3 | 4 | 5 | 6 | 7 | 8 | 9 | 10 | 11 | 12 | 13 | 14 |
| Damage | Healthy | S1 d | S1 c | S1 h | S2 b | S2 g | S3 e | S2 S9 b | S1 S4 b | S2 S4 f | S3 S4 f | S2 S8 d | S2 S7 S9 e | S3 S6 S9 c | S1 S4 S7 a |
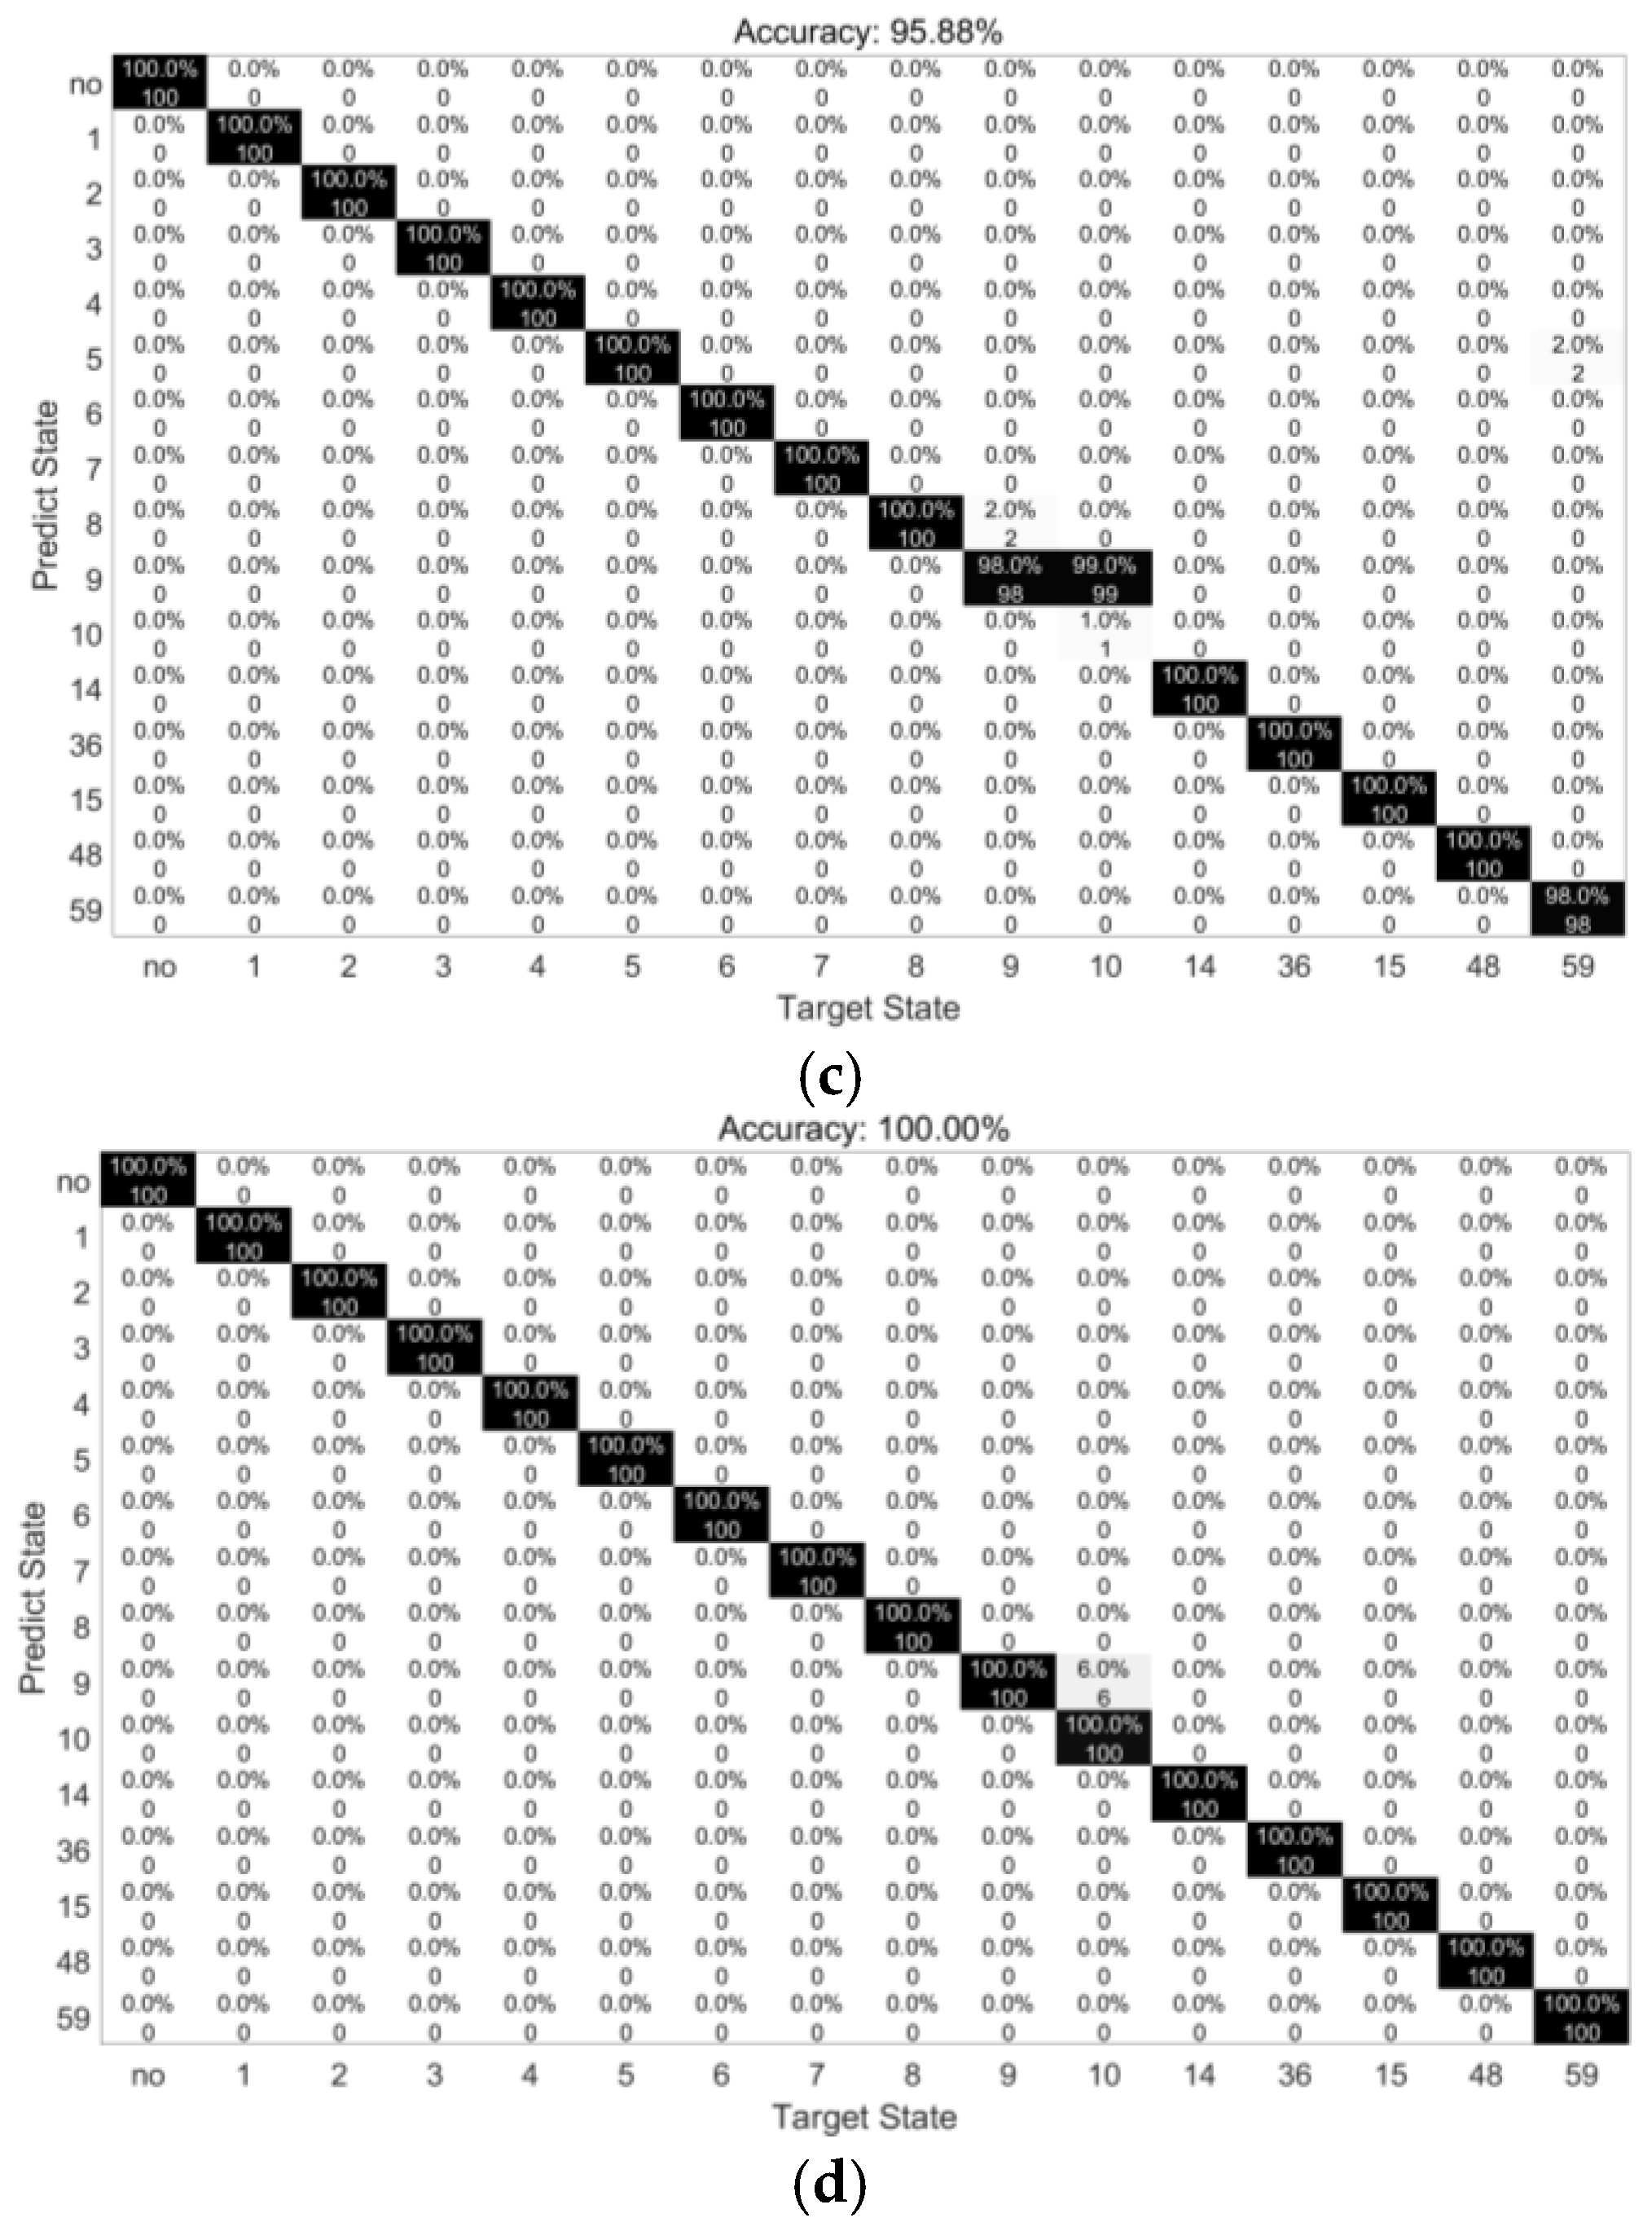
| Noise level | 90 | 100 | 110 | 120 |
| Accuracy | 74.36% | 87.88% | 95.88% | 100.00% |
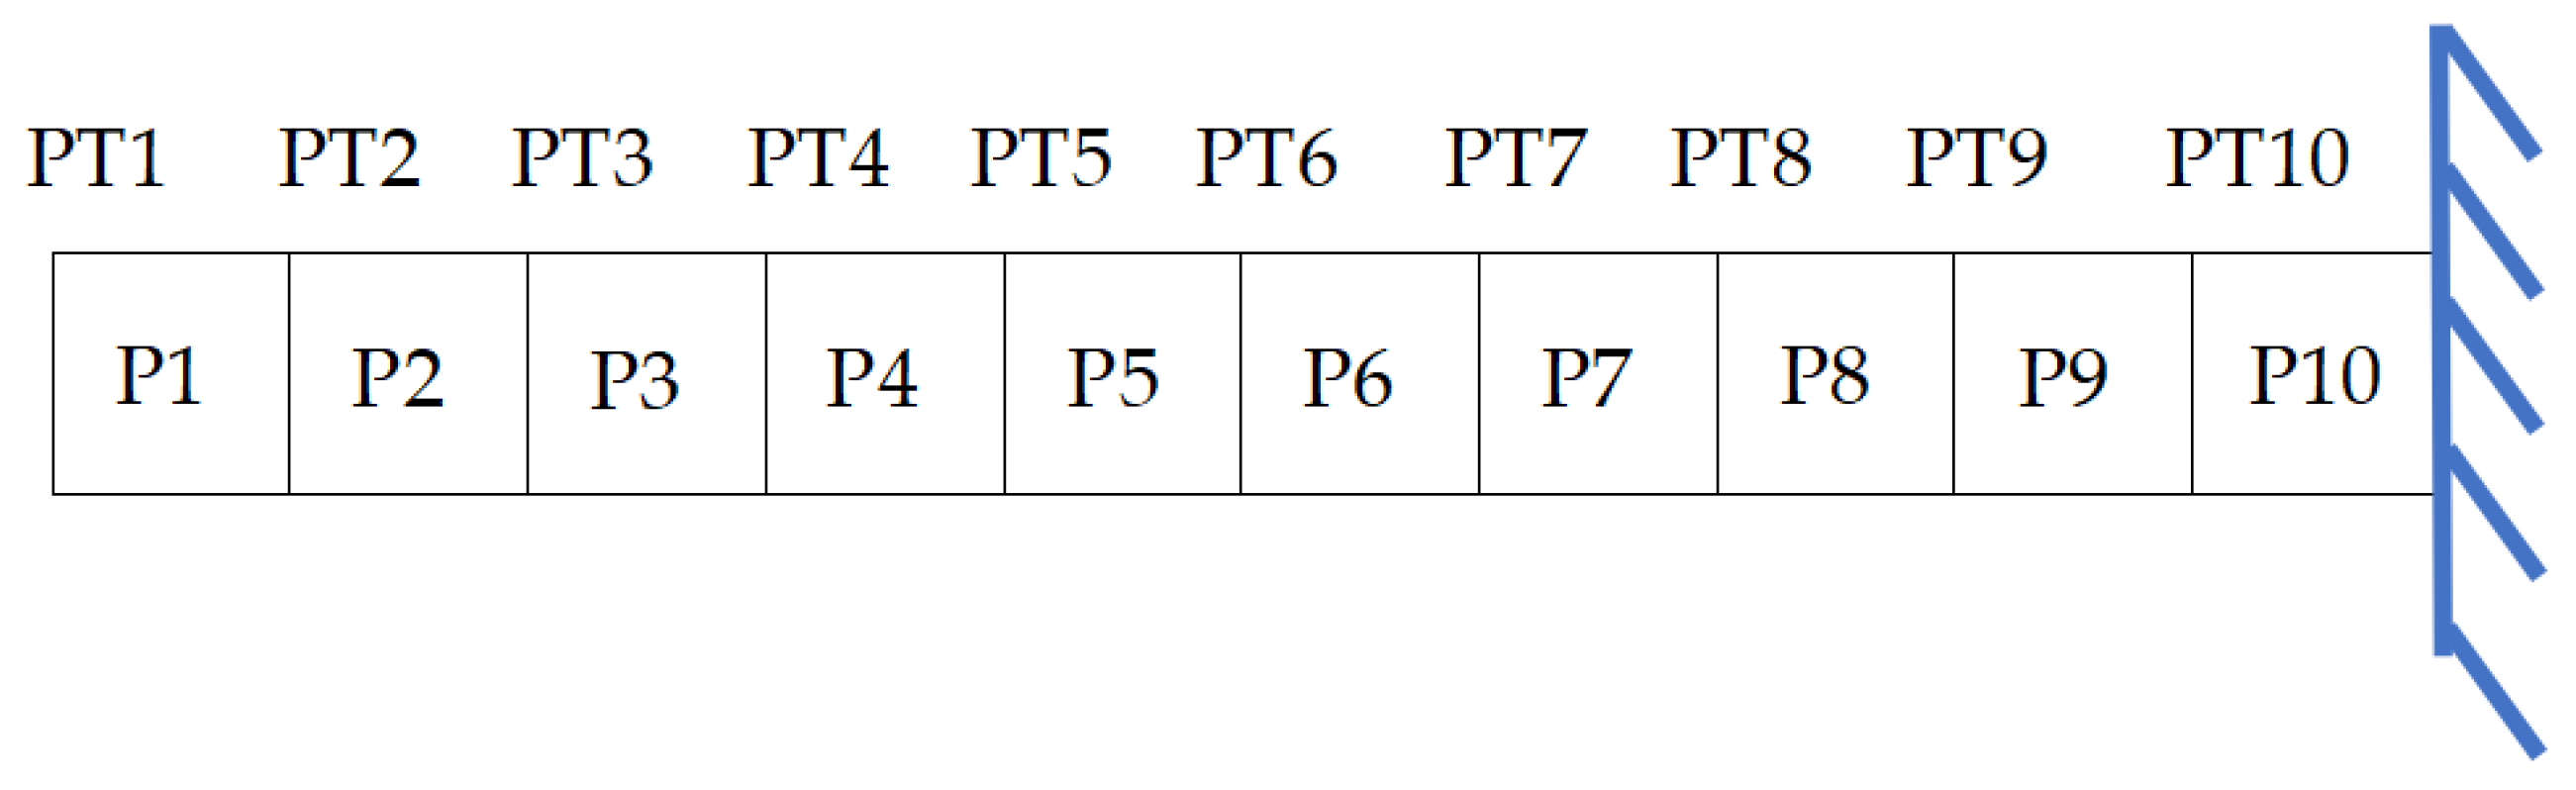
| Beam | 1 | 2 | 3 | 4 |
| Damage position | Healthy | P7, P2 | P3, P2 | P7, P2 |
| Damage type | \ | 6 cm cube | 3 cm cube | 3 cm cube |
Disclaimer/Publisher’s Note: The statements, opinions and data contained in all publications are solely those of the individual author(s) and contributor(s) and not of MDPI and/or the editor(s). MDPI and/or the editor(s) disclaim responsibility for any injury to people or property resulting from any ideas, methods, instructions or products referred to in the content. |
© 2025 by the authors. Licensee MDPI, Basel, Switzerland. This article is an open access article distributed under the terms and conditions of the Creative Commons Attribution (CC BY) license (https://creativecommons.org/licenses/by/4.0/).
Share and Cite
Bai, X.; Zhang, Z. Research on Concrete Beam Damage Detection Using Convolutional Neural Networks and Vibrations from ABAQUS Models and Computer Vision. Buildings 2025, 15, 220. https://doi.org/10.3390/buildings15020220
Bai X, Zhang Z. Research on Concrete Beam Damage Detection Using Convolutional Neural Networks and Vibrations from ABAQUS Models and Computer Vision. Buildings. 2025; 15(2):220. https://doi.org/10.3390/buildings15020220
Chicago/Turabian StyleBai, Xin, and Zi Zhang. 2025. "Research on Concrete Beam Damage Detection Using Convolutional Neural Networks and Vibrations from ABAQUS Models and Computer Vision" Buildings 15, no. 2: 220. https://doi.org/10.3390/buildings15020220
APA StyleBai, X., & Zhang, Z. (2025). Research on Concrete Beam Damage Detection Using Convolutional Neural Networks and Vibrations from ABAQUS Models and Computer Vision. Buildings, 15(2), 220. https://doi.org/10.3390/buildings15020220