Abstract
The construction industry faces significant challenges including a critical skill shortage and an aging workforce, threatening the industry’s productivity, resilience, and knowledge retention. To address this issue, it becomes critical to attract, hire, and retain younger generations, particularly Generation Z (Gen Z), who are projected to become a dominant workforce by 2030. To this end, this study explores the employer preferences of Gen Z students joining the USA construction industry, providing valuable insights into their priorities and expectations. The study evaluates 27 employer of choice (EOC) factors to identify key criteria influencing Gen Z’s choice of employers. Analyses were conducted across various demographic and experiential categories, including gender, racial/ethnic backgrounds, first-generation status, those with loans, family influence, prior industry experience, intimidation by macho culture, and shifts in perspectives due to the COVID-19 pandemic. The findings reveal that Gen Z prioritizes respect, work–life balance, and job security, and values flexibility in work schedules and hybrid work environments. The findings were also used to propose eight recommendations for employers to become EOCs. Insights from this research serve a dual purpose by offering a foundation for further academic exploration and equipping industry practitioners with the data needed to tailor their recruitment and retention strategies to Gen Z.
1. Introduction
Generation Z, or Gen Z, is the most communal term used to describe post-Millennials, with a common start-point of 1997 and end-point of 2012 [1]. A major distinction between Gen Z and previous generations is that Gen Z people are “digital natives”, meaning that they were born into an era dominated by technology, with definitive digital skills resulting from the ease of access to television, computers, mobile devices (especially smartphones), social media, and on-demand services [1]. In the USA, recent data indicate that Gen Z is the most racially diverse generation to enter adulthood, is on track to become the most educated generation, and has the highest percentage of people who identify as LGBTQIA+ [2]. Gen Z people desire more autonomy, have strong views on matters that they are passionate about, and are highly influenced by their parents but not afraid to be different from them [2]. Gen Z is also characterized by its self-confidence, ambition, adaptability, strong sense of individuality, desire for freedom, motivation to achieve goals, and openness to change, all shaped by its digital fluency and exposure to a rapidly evolving world [2,3].
Gen Z’s perception of careers and the workplace has been influenced by major events, particularly the digital revolution, the Great Recession, and the COVID-19 pandemic. First, Gen Z is a “digital native” generation that possesses a natural ”digital fluency” as they grew up immersed in a digital environment shaped by the internet, smart devices, and social media [4,5]. Second, Gen Z grew up during the Great Recession between 2007 and 2009 and witnessed its impact on their parents, observing how they navigated challenges related to credit, debt, mortgages, bills, and employment [6]. More recently, Gen Z witnessed the COVID-19 pandemic between 2020 and 2022 that reshaped education and industries by shifting them towards remote and hybrid environments, emphasizing mental health and well-being, and altering perspectives on job markets and security [7,8].
As Gen Z increasingly enters the labor market, the need to gain a deeper understanding of their unique characteristics becomes more pressing [9]. The research on Gen Z within the workforce and the workplace started gaining momentum in 2018 when research started to focus on multiple Gen Z topics including relationships with older generations, the workplace, management, attitudes, leadership, careers, and education [10]. Such research is crucial across industries as it helps organizations understand Gen Z’s unique characteristics, needs, and work styles, enabling employers to effectively recruit, motivate, and retain this emerging workforce to align strategies with their expectations and sustain growth [11].
1.1. Gen Z and the Construction Industry
Minimal research has been conducted on Gen Z and the construction industry landscape, where all relevant English-language studies that incorporate the terms “Generation Z” (or “Gen Z”) and the “construction industry” have been published in or after 2023. For instance, Borg et al. [12] highlighted the importance of “career resilience” to attract and retain Gen Z talent in the Australian construction industry, particularly after “career shocks” like the COVID-19 pandemic. To enhance career resilience among Gen Z, the study proposed implementing organizational strategies that prioritize employee well-being (such as fostering a healthy workplace, offering flexibility, and promoting work–life balance) and career advancement (such as providing mentoring, training, and recognition). These strategies can achieve key resilient benefits such as increased job satisfaction and motivation for employees while simultaneously reducing turnover and enhancing retention for organizations [12].
A study performed in Singapore interviewed and surveyed Gen Z students to identify strategies that can help the built environment sector recruit and retain students entering the job market [13]. The study highlighted the importance of compensation, career advancement, work–life balance, and hybrid working environments. The study also emphasized the importance of understanding the company’s culture and job opportunities in student recruitment. Moreover, the results showed that earned media, like employer reviews on independent platforms, has a greater influence on attracting students compared to owned media like employers’ social media branding [13].
Another Turkish-based study surveyed Gen Z construction workers to investigate the impact of Gen Z characteristics on the success of construction projects [14]. The study highlighted the importance of open communication channels for Gen Z workers to succeed in innovative, collaborative, less bureaucratic, and transparent project environments that encourage the safe sharing of knowledge and ideas. The study also emphasized the importance of psychological support and flexible work methods in boosting Gen Z workers’ productivity and job satisfaction [14].
In the USA, students in two construction management classes at two different universities were asked a series of discussion questions to understand their relationship with the industry [15]. Discussions revealed that Gen Z students are comfortable adopting technology, recognizing its ability to bridge stakeholder gaps and enhance efficiency. They also value professional growth and societal contributions and prefer working in respectful, hybrid environments with reasonable schedules that balance work–life needs while offering acceptable compensation and benefits [15]. Another study surveyed Gen Z undergraduate students enrolled in construction-related programs to understand the impact of school years on pursuing a career in the construction industry [16]. The results highlighted that STEM exposure during middle school and high school years serves as a significant motivator for pursuing a degree in the construction industry, with interest often building progressively from middle school into high school. The study also highlighted other major motivators such as family influences and the appeal of promising career prospects like job variety, hybrid environments, fats promotions, and high salaries [16].
A more specific study targeted the expectations of Gen Z quantity surveyors from consultant quantity surveyor firms in Malaysia [17]. The results showed that equal and fair treatment, job security, adequate pay leaves, and mentorship were highly expected by quantity surveyors. The results also showed differences among demographic variables, such as female surveyors who emphasized feedback and creativity, minority groups who emphasized fairness, and surveyors with a lower base income who emphasized feedback and training [17].
1.2. Employer Preferences for Gen Z in the Construction Industry
Each generation has different attitudes towards work and the workplace, and an individual’s career choice is heavily influenced by the dominant characteristics and values of their generation [11,18]. Thus, organizations must anticipate workplace expectations to develop tailored strategies to attract, hire, and retain Gen Z talent, and position themselves as an employer of choice (EOC) in a competitive labor market [11,19].
EOCs can be looked at from two perspectives—the perspective of the employer, which focuses on being recognized for leadership, culture, and best practices to attract and retain top talent while achieving organizational objectives; and the perspective of employees, which is based on selecting that employer over other employment opportunities, and deciding to stay with the chosen organization [20]. A review of EOC research reveals various criteria that organizations can investigate to become an EOC:
- Organizations can balance the strategic EOC options by integrating both tangible and intangible practices that align with short-term goals and long-term purposes [21];
- Organizations can focus on four main attributes that include economic perspectives like salaries and benefits, psychological perspectives like corporate culture and relationships among employees, function perspectives like career developments and utilization of skills, and organizational perspectives like reputation and management style and support [22];
- Organizations can brand themselves as an EOC by enhancing organizational attractiveness, aligning job and organizational characteristics to promote a person–organization fit, building a strong corporate image, fostering a positive employer image, and implementing effective employer branding strategies [23];
- Organizations can support employees by offering opportunities for self-development, recognizing achievements, fostering strong relationships, providing competitive remuneration packages, and promoting a robust commercial and social corporate image [24];
- Organizations can focus on four main dimensions—“bloom” representing their public perception, “live” encompassing the actual working environments where employees operate, “connect” emphasizing the relationship between employees and the organization, and “grow” focusing on employees’ long-term development and career progression within the organization [25].
EOC has effectively been used in construction industry research to understand the employer preferences for “Millennial” (or “Generation Y”) students who joined the construction market in Australia and the United Kingdom in 2013 [26]. The study surveyed 160 students to explore their preferred workplace characteristics, providing valuable insights for employers to develop strategies that attract, hire, and retain millennials, and address the gap between the demand for and supply of talented graduates in the construction industry [26]. EOC was also integrated into a conceptual framework designed to explore employment conditions in Australian construction organizations, providing insights into creating social value for workers in the post-COVID-19 era [27].
Upon reviewing the EOC research frameworks [20,21,22,23,24,25] and the construction-based EOC studies [26,27], a list of 27 comprehensive factors was consolidated as shown in Table 1. The 27 factors derived from existing research offer a holistic perspective on the key elements that influence young talent joining the labor market. These factors can be used to assess Gen Z’s perspectives when choosing employers, enabling construction employers to better understand how to attract, retain, and engage Gen Z in the workplace.

Table 1.
Comprehensive list of EOC factors.
2. Research Scope
2.1. Problem Statement
The construction industry operates in a VUCA environment—volatile and highly susceptible to sudden changes, uncertain in its markets and trends, complex in project nature, and ambiguous in its current and future directions [28]. The industry also faces critical workforce challenges including widespread skill shortages in almost all industry occupations [29,30], unsustainable recruitment strategies and ineffective labor acquisition methods [31,32], high workforce turnover [33,34], and difficulty attracting younger generations to pursue careers within the field [35,36]. Moreover, in the USA, the latest statistics from the Bureau of Labor Statistics (BLS) show that the median age of the construction workforce is 41.9 years, with the younger generation making up only 11% of the total workforce [37]. Additionally, more than one in four workers in construction is over the age of 50, and 40% of the workforce is expected to retire by 2031 [37]. This creates not only an issue of an aging workforce, but also the threat of knowledge loss, decreased productivity, skill gaps, and challenges to the industry’s resiliency [38,39].
The construction industry is also one of the most male-dominated sectors, characterized by traditional masculine beliefs and a culture that promotes self-reliance, stoicism, bullying, and stigma surrounding vulnerability and emotional expression [40]. This social construct, often referred to as “macho culture”, emphasizes traditional masculine norms and behaviors. It manifests through hierarchical power dynamics, resistance to inclusivity, and an emphasis on physical toughness and competitiveness over collaboration and emotional intelligence [41]. This also translates into construction management students who face significant challenges in their professional lives due to the industry’s high demands and male-dominated nature, such as high stress levels, long and irregular working hours, job insecurity, work–life conflict, and burnout [42].
One major solution to address these workforce challenges is to attract and integrate the younger generation, specifically Gen Z, into the construction industry. This approach is critical to balancing the anticipated mass exit of older workers, as Gen Z is projected to form a significant portion of the workforce by 2030 [43]. Beyond hiring, retaining this generation is equally vital through fostering a supportive environment that addresses challenges faced by young employees, resulting in a satisfied, motivated, and resilient workforce [12]. Retention efforts are also financially advantageous, as employee turnover costs are estimated to range from 33% to 200% of the departing employee’s annual salary [44].
2.2. Research Objective
To attract and retain Gen Z talent in the construction industry, and understand the extent of macho culture on the industry, it becomes critical to understand the values and needs that Gen Z students seek in organizations when entering the market [12,45]. Like any previous generation, Gen Z has varying attitudes, needs, and preferences regarding employment, which will influence the strategies employers use to ensure a strong “person–career fit” [12,17]. By understanding these needs, organizations can prioritize and implement human resource and management strategies that meet Gen Z’s needs and successfully retain them to foster the industry’s growth and sustainability [12,46].
Thus, the objective of this paper is to explore the employer preferences of Gen Z students studying to join the construction industry in the USA. The study utilizes the EOC factors to identify the most important criteria that influence Gen Z students when choosing employers. The study also provides the industry with eight recommendations that can help construction employers become an employer of choice for Gen Z.
Since no study has comprehensively investigated EOC in the construction industry for Gen Z, the findings of this paper will address the research gap and provide valuable insights for researchers and industry practitioners. These insights will expand knowledge on how the construction industry can effectively recruit talent, address the ongoing worker shortage, and equip employers with the data needed to tailor strategies for attracting, hiring, and retaining this new generation of workforce talent.
3. Materials and Methods
The methodology for this study is summarized in Figure 1. To explore Gen Z’s perspective on their preferences when choosing an employer, an online survey was first developed via Qualtrics. The survey asked respondents to do the following:

Figure 1.
Summary of the methodology.
- Provide consent for participating in the research;
- Rank the importance of every EOC factor (Table 1) using a three-point scale: “Not Important”, “Important”, or “Very Important”. A “No Opinion” option was also provided if respondents wanted to skip ranking a particular factor. The scale is well suited for studies focused on group behavior or averages across individuals [47], is relatively quick for respondents to complete [48], and does not necessarily impact the validity or reliability of the data [49].
The survey also asked respondents to select their opinions on different work aspects including the following:
- Four-day workweeks (choices: oppose, neutral, or support);
- Modality (choices: prefer fully remote, prefer fully in-person, prefer hybrid work, no preference);
- Environment (choices: prefer outdoors, prefer indoors, prefer indoors and outdoors, no preference);
- Mobility (choices: prefer no traveling, prefer limited traveling, prefer unrestricted traveling, no preference);
- Describe how their perspective of an ideal workplace shifted or remained the same after the COVID-19 pandemic;
- Answer demographic variable questions regarding their age, gender, race/ethnic group, and sexual orientation; specify whether they are first-generation, married, have dependents, are part of the LGBTQIA+ community, have work experience in the AECO industry, have family members working in the AECO industry; and share their beliefs on the “macho construction” reputation of the industry.
3.1. Data Sampling
Since official data on the number of Gen Z students majoring in civil engineering or enrolled in construction management courses in the USA are unavailable, the Cochran formula for an infinite population can be used to determine the required sample size () for the study, as shown in Equation (1) [50]:
where the following obtains:
- The is determined by the confidence level which represents the probability that the sample result will reflect the true population value. Confidence levels generally range between a minimum of 90% for studies that aim to detect general trends and patterns and a maximum of 99% for studies that require highly accurate and precise results that may have significant consequences [51,52]. As the aim of this study is to provide an overview of the Gen Z perspective in the construction industry, a 95% confidence level is sufficient, reflecting a ;
- The estimate proportion () represents the estimated proportion that exhibits a certain characteristic or behavior. With no prior knowledge of the proportion, a value of 0.5 is often used as the most conservative assumption to maximize the sample size and ensure that the formula accounts for the greatest variability in the population [51]. Thus, for this study, ;
- The margin of error () represents the error estimate or the range in which the true population value is likely to fall. It is typically expressed as percentages such as ±5%, ±7%, or ±10%. For this study, a value of was set to maintain a low margin of error within the selected confidence level [29,53].
According to Equation (1) and the set parameters, the minimum sample size required is responses.
After receiving approval from the Institutional Review Board (IRB), a purposeful sampling strategy was employed where the online survey was shared with civil engineering and construction management professors across the USA to collect responses from students registered in construction management classes. This approach ensures that the collected data represent students who plan to pursue a career in the construction sector after completing their studies [26]. Qualtrics was configured to automatically discard any submitted responses where less than 90% of the questions were completed.
As the data were gathered anonymously, 200 complete responses were compiled from students across Florida, Indiana, Kentucky, Oklahoma, Texas, and Washington. The data are comprehensively representative as they capture the perspective of students from three of the four primary USA geographic regions—the Midwest, South, and West.
To ensure that all participants belonged to Generation Z, responses with missing age information or indicating birth years before 1997 were excluded, resulting in a final sample size of 161. The sample size is deemed sufficient for analysis as it surpassed the minimum number of responses required by Equation (1). Moreover, the sample size is above the minimum of 30 observations recommended to enhance statistical power and precision [54], perform robust statistical tests to identify significant patterns [55], and approximate normal distribution trends even in non-normal datasets [51]. Additionally, the 161 responses exceed the sample sizes of previous EOC studies in construction which ranged from 107 to 160 responses [26,27] and surpass the sample sizes of recent studies examining Gen Z in the construction industry which range from 73 to 122 responses [13,14,15,16,17].
The breakdown of data across demographic and non-demographic categories is presented in the Results Section for each category.
3.2. Data Reliability and Normality
The Cronbach’s alpha test was performed to evaluate the internal consistency of the scale and assess the reliability (i.e., measurement accuracy) of the 27 ranked factors [56]. According to reliability benchmarks, a value between 0.8 and 0.9 signifies good reliability, while a value greater than 0.9 indicates excellent reliability [57]. The calculated Cronbach’s alpha coefficient for the dataset was 0.889, indicating a very reliable dataset.
The Herman’s one-factor test was used to test for common method bias (CMB). CMB can “occur when both the independent and dependent variables are measured within one survey, using the same (i.e., a common) response method (e.g., ordinal scales)” [58]. While CMB is less of a concern in this study due to its univariate analysis approach (i.e., analyzing factors among demographic and non-demographic groups rather than developing statistical models with dependent and independent variables), it can still pose a risk, particularly when the study’s methodology relies on self-administered data collection techniques such as surveys [59]. To mitigate the risk of CMB, several methodological approaches were implemented within the survey. These included clearly defining all factors using unambiguous terminology to provide clarity for respondents, obtaining measures at different time intervals, ensuring respondent anonymity, and emphasizing the importance of the research to increase respondent motivation [59,60]. As for the Herman test, it is commonly used to determine the presence of CMB if the factor analysis of all study variables results in a single factor that explains more than 50% of the variance [58]. In this study, the proportion of variance explained by the first factor is 26.94%, which is well below the 50% threshold, indicating that CMB is not a significant concern.
The Shapiro–Wilk test was employed to determine whether the dataset followed a normal distribution [61]. This test is widely regarded as a robust method for evaluating normality across various distributions and sample sizes [62], outperforming many alternative statistical tests in their sensitivity and reliability [63]. The results indicated a statistically significant deviation from normality for all 27 factors (p-value = 0, which is below the 0.05 threshold), confirming that the data are not normally distributed. Consequently, non-parametric tests were used for further data analysis.
3.3. Data Analysis
Three main non-parametric tests were used to analyze the data using Python 3.13.0 and determine significant differences among the demographic and non-demographic categories:
- Mann–Whitney U test: Known as the non-parametric version of the t-test, the Mann–Whitney U test is used to identify significant differences between two independent groups of equal or different size [64]. A significant p-value indicates that there is a significant difference between the two groups;
- Kruskal–Wallis test: Known as the nonparametric version of one-way ANOVA, the Kruskal–Wallis test is used to compare more than two groups of equal or different sizes and indicates that at least one sample stochastically dominates one other sample [65]. A significant p-value indicates that there are at least two groups that are significantly different from each other;
- Conover–Iman test: When the results of the Kruskal–Wallis test are significant, the Conover–Iman non-parametric post hoc test is used to compare all possible pairs and identify which pairs are statistically significant [66]. The pairwise comparisons between the studied groups indicate whether the difference is significant or not depending on the p-value.
Referencing the central limit theorem, a minimum sample size of 30 responses per demographic or non-demographic category is required as a prerequisite for the three non-parametric tests described above. Consequently, three categories were excluded from the analysis: being married (1%, n = 2), having dependents (1%, n = 2), and identifying as part of the LGBTQIA+ community (8%, n = 13), due to insufficient sample sizes. The application of the nonparametric tests across the remaining categories and their corresponding results are detailed in the Results Section below.
It is important to note that the methodology is limited to univariate analysis. Focusing on one category at a time allows for a clear and straightforward examination of each category’s perception of the EOC factors and provides the industry with meaningful comparisons without the complexities introduced by exploring relationships with other categories [67].
To analyze the qualitative data provided by students about whether their perspective on an ideal workplace changed due to the COVID-19 pandemic, thematic analysis was employed to identify key discussion points for both groups: students whose perspectives changed and those whose perspectives remained unchanged. A manual approach was utilized where each data point was reviewed to identify recurring themes, opinions, and patterns. This method allows for a deeper, more comprehensive understanding of the students’ perspectives, as it provides nuanced insights and ensures that important details are not overlooked during analysis [13,46,68].
4. Results
For each factor ranked by the students, Equation (2) was used to calculate an average weighted index (AWI) as follows:
where the following obtains:
- is the number of respondents who selected “Not Important”;
- is the number of respondents who selected “Important”;
- is the number of respondents who selected “Very Important”;
- is the total number of respondents who ranked the factor as “Not Important”, “Important”, or “Very Important” ();
- is the weight of every rank on the three-point scale: , , and .
The breakdown of the ranking for the 27 factors and the average weighted index for every factor are presented in Table 2.
Table 2.
Distribution of ranking the 27 factors (sorted by descending order of the AWI).
4.1. Gender
Students were asked to specify their genders. The results showed that 71% were male (n = 115), 27% were female (n = 45), and 2% selected other (n = 2). The top five highest-ranking factors (with an AWI greater than 2) and the five least important factors (with an AWI less than 2) for every group were as follows (note that the “other” category was excluded due to the low number of responses):
- Both male and female students prioritized respect and work–life balance as their highest-ranking factors;
- Both groups ranked recognition, education offerings, competition, and relocation as their least important factors;
- Male students prioritized compensation, benefits, and job security as important factors while also ranking diversity among their least important factors;
- Female students prioritized honesty, safety, and well-being as important factors.
The Mann–Whitney U test was performed on all 27 factors to test for significant differences between the male and female genders. The results are summarized in Table 3 where seven factors showed significant differences between both groups. All seven factors were consistently rated as more important by female students compared to their male counterparts. Moreover, the diversity factor was the only factor ranked within the five least important factors of one group (i.e., male students) while ranking significantly more important by the other group (i.e., female students). Work–life balance was also ranked significantly more important for female students than males despite ranking within the top five factors for both groups.
Table 3.
Statistical differences—gender (sorted by ascending order of p-value).
4.2. Ethnic/Racial Groups
Students were asked to specify their race. The results showed that 75% of respondents identified as White (n = 121), while 25% identified as belonging to historically underrepresented racial or ethnic groups (n = 40), including Asian, Black, Hispanic, Middle Eastern, and Pacific Islander students. The top five highest-ranking factors (with an AWI greater than 2) and the five least important factors (with an AWI less than 2) for every group were as follows:
- Both groups of students prioritize respect and work–life balance as their highest-ranking factors;
- Both groups ranked competition and relocation as their least important factors;
- Students who identify as White prioritize benefits, safety, and honesty as important factors while also ranking diversity, recognition, and education offerings within their least important factors;
- Students who identified as belonging to historically underrepresented racial or ethnic groups prioritize fairness, job security, and well-being as important factors.
The Mann–Whitney U test was performed on all 27 factors to test for significant differences between the two race groups. The results are summarized in Table 4 where six factors showed significant differences. The benefits factor was consistently rated as more important by students who identified as White while the other five factors were consistently rated as more important by historically underrepresented students. Moreover, diversity and education offerings were ranked among the five least important factors of one group (i.e., White) while ranking significantly more important by the other group (i.e., historically underrepresented).
Table 4.
Statistical differences—race (sorted by ascending order of p-value).
4.3. First Generation
Students were asked to indicate “Yes” or “No” to whether they were first-generation university students of which 21% responded “Yes” (n = 34) and 78% responded “No” (n = 125). The top five highest-ranking factors (with an AWI greater than 2) and the five least important factors (with an AWI less than 2) for every group were as follows:
- Both groups prioritize work–life balance and respect as their most important factors;
- Both groups ranked recognition, education offerings, relocation, and competition among the least important factors;
- First-generation students prioritize compensation, fairness, and honesty as important factors;
- Students who are not first-generation prioritize job security, benefits, and safety as important factors while ranking diversity among their least important factors.
The Mann–Whitney U test was performed on all 27 factors to test for significant differences between first-generation students and non-first-generation students. The results are summarized in Table 5 where collaboration was the only one that showed a significant difference and was consistently ranked as more important by students who are first-generation students versus students who are not.
Table 5.
Statistical differences—first generation (sorted by ascending order of p-value).
4.4. Student Loans and Educational Debt
Students were asked to indicate “Yes” or “No” to whether they have loans or debts to complete their education of which 37% responded “Yes” (n = 59) and 59% responded “No” (n = 95). The top five highest-ranking factors (with an AWI greater than 2) and the five least important factors (with an AWI less than 2) for every group were as follows:
- Both groups prioritize work–life balance, respect, and job security as their most important factors;
- Both groups ranked recognition, education offerings, relocation, and competition among their least important factors;
- Students who have student loans prioritize safety and benefits as important factors while ranking technology among their least important factors;
- Students who do not have student loans rank honesty and compensation as important factors.
The Mann–Whitney U test was performed on all 27 factors to test for significant differences between students who have loans versus students who are not in educational debt. The results are summarized in Table 6 where two factors showed significance and both factors were consistently ranked as less important by students who have loans versus students who do not.
Table 6.
Statistical differences—loans (sorted by ascending order of p-value).
4.5. Family Members in AECO Industry
Students were asked to indicate “Yes” or “No” to whether they had family members working in the Architecture, Engineering, Construction, and Operations (AECO) industry, of which 40% responded “Yes” (n = 64) and 58% responded “No” (n = 94). The top five highest-ranking factors (with an AWI greater than 2) and the five least important factors (with an AWI less than 2) for every group were as follows:
- Both groups prioritize respect and work–life balance as their most important factors;
- Both groups rank education offerings, recognition, competition, and relocation among the least important factors;
- Students with family members working in the AECO industry prioritize honesty, benefits, and growth as important factors while ranking location stability among their least important factors;
- Students with no family members working in the AECO industry prioritize safety, job security, and compensation as important factors while ranking diversity among their least important factors.
The Mann–Whitney U test was performed on all 27 factors to test for significant differences between students who have AECO experience versus students who have not worked in the industry. The results are summarized in Table 7 where flexibility was the only one that showed a significant difference and was consistently ranked as less important by students who have family members in the AECO industry versus students who do not.
Table 7.
Statistical differences—family in AECO industry (sorted by ascending order of p-value).
Students who indicated that they have family in the AECO industry were asked whether the family members inspired them to join the AECO industry. Out of the 64 students who have family members in the industry, 58% were inspired by the family members (n = 37) while 41% were not (n = 26). The top five highest-ranking factors (with an AWI greater than 2) and the five least important factors (with an AWI less than 2) for every group were as follows:
- Both groups prioritize respect, honesty, and benefits among their most important factors;
- Both groups rank location stability, education offerings, relocation, and competition among the least important factors;
- Students with family inspiration prioritize clarity and benefits as important factors while ranking recognition among their least important factors;
- Students who were not inspired by family members working in the AECO industry prioritize job security and compensation.
The Mann–Whitney U test was performed on all 27 factors to test for significant differences as shown in Table 8. All four factors with significant differences were consistently ranked as less important by students who were inspired by their family members versus students who were not. Compensation and job security stand out as significant factors that were also ranked among the top five most important factors for students with no family inspiration.
Table 8.
Statistical differences—family inspiration (sorted by ascending order of p-value).
4.6. Experience Within the AECO Industry
Students were asked to indicate “Yes” or “No” to whether they had work experience in the AECO industry, of which 70% responded “Yes” (n = 112) and 29% responded “No” (n = 47). The top five highest-ranking factors (with an AWI greater than 2) and the five least important factors (with an AWI less than 2) for every group were as follows:
- Both groups prioritize respect, work–life balance, and benefits as their most important factors;
- Both groups rank recognition, education offerings, relocation, and competition among the least important factors;
- Students with AECO experience prioritize job security and honesty as their most important factors while ranking diversity among their least important factors;
- Students with no AECO experience prioritize safety and compensation as their most important factors while ranking technology among their least important factors.
The Mann–Whitney U test was performed on all 27 factors to test for significant differences between students who have AECO experience versus students who have not worked in the industry. The results are summarized in Table 9 where three factors showed significant differences. All three factors were consistently rated as more important by students with AECO experience compared to students who have yet to work in the AECO industry. Moreover, the technology factor was the only factor ranked among the five least important factors of one group (i.e., students with no AECO experience) while ranking significantly more important by the other group (i.e., students with AECO experience).
Table 9.
Statistical differences—experience in the AECO industry (sorted by ascending order of p-value).
Follow-up questions with students who have experience in the AECO industry (n = 112) yielded the following insights:
- With regards to satisfaction: 29% of students who worked in the AECO industry indicated they were “Extremely Satisfied” with the experience (n = 56); 50% indicated they were “Satisfied” (n = 33); 13% indicated “Neutral” (n = 15); 6% indicated “Dissatisfied” (n = 7); and 1% indicated “Extremely Dissatisfied” (n = 1);
- With regards to negative experience: 75% (n = 84) of students who worked in the industry indicated they did not face any negative experience due to demographic variables (n = 84); 18% indicated they faced experience due to demographic variables including age, race, and identifying as LGBTQIA+ (n = 19); 3.5% indicated they faced negative experience due to non-demographic variables such as financial status, work–life balance, mental health, and toxic masculinity (n = 4); and 3.5% preferred not to share any feedback (n = 4).
4.7. Macho Culture Intimidation
Students were asked to indicate “Yes” or “No” to whether they believe that the construction industry has a “macho culture” of which 71% said “Yes” (n = 114), 14% said “No” (n = 22), and 16% indicated “No Opinion” (n = 25). Students were also to indicate whether they feel intimidated by the “macho culture” of which 22% said “Yes” (n = 36), 61% said “No” (n = 98), and 17% indicated “No Opinion” (n = 27). Both variables were combined to create three distinct groups:
- Group I: A group that believes that the industry has a “macho culture” and is intimidated by it. This group prioritizes work–life balance, safety, respect, job security, and clarity;
- Group II: A group that believes that the industry has a “macho culture” and is not intimidated by it. This group prioritizes respect, compensation, job security, benefits, and work–life balance;
- Group III: A group that believes that the industry does not have a “macho culture” and is not intimidated by it. This group prioritizes growth, honesty, safety, clarity, and respect.
The Kruskal–Wallis test was performed on all 27 factors to test for any significant differences between the three groups. If the test showed a significant p-value, the post hoc Conover–Iman test was performed to compare all possible pairwise groups and identify which comparisons are statistically significant. The results are summarized in Table 10 where 11 factors showed significant differences. Among these factors, diversity was the only factor that was significantly different among all three groups, ranking as significantly more important for Group I while being the least important factor for Group III. Technology and standardization are significantly more important for Group I compared to Group III (i.e., prioritized for students who are intimidated by the “macho culture” versus students who do not believe in the “macho culture”). Moreover, clarity is significantly more important for Group I compared to Group II (i.e., prioritized for students who are intimated by the “macho culture” versus students who are not). Safety, flexibility, and work–life balance are significantly more important for students who believe there is a “macho culture” versus students who do not believe in it, while well-being, job security, respect, and benefits are more significant for students who are intimidated by the “macho culture” versus students who are not intimidated by it.
Table 10.
Statistical differences—macho culture (sorted by ascending order of p-value of Kruskal–Wallis test).
As “macho culture” relates to the traditional notions of masculinity, a breakdown of the perspectives by gender is visualized in Figure 2. While most males believe the industry has a “macho culture” (78%), it intimates a minority of males (13%). In contrast, while most females believe the industry has a macho culture (98%), most females are intimidated by it (61%).

Figure 2.
Breakdown of the proportion of “Yes” responses to the macho culture results by gender (excluding students who indicated “No Opinion” on either question).
The z-test for proportions was conducted on both questions to understand whether the proportions of “Yes” answers between genders are statistically significant:
- Regarding believing in whether the industry has a “macho culture”, the z-statistic was (2.82) with a p-value of (0.0048) indicating statistical significance with 99% confidence;
- Regarding being intimidated by the “macho culture” reputation, the z-statistic was (−5.74) with a p-value of (0.0000) indicating statistical significance with 99% confidence.
The statistical significance between the proportions in both questions indicates a divergence in how different genders perceive the culture of the industry. While both genders acknowledge the existence of a “macho culture”, the results suggest that males tend to normalize and align with the industry’s “macho culture”, whereas females not only recognize but also feel more directly affected by this culture.
4.8. COVID-19 Perspective
Students were asked to indicate “Yes” or “No” to whether the COVID-19 pandemic shifted their perspective of the ideal workplace in the AECO industry, of which 48% responded “Yes” (n = 77) and 48% responded “No” (n = 78). The top five factors and bottom five factors for every group were as follows:
- Both groups prioritize respect, work–life balance, and job security as their most important factors;
- Both groups ranked competition and relocation among the least important factors;
- Students who shifted their perspective prioritized honesty and compensation while ranking recognition and location stability among their least important factors;
- Students who did not shift their perspective prioritized clarity and safety while ranking technology, diversity, and education offerings among their least important factors.
The Mann–Whitney U test was performed on all 27 factors to test for significant differences between students who had their perspective shifted because of the COVID-19 pandemic versus students who did not change their perspective. The results are summarized in Table 11 where ten factors showed significant differences. All ten factors were consistently rated as more important by students who had their perspective shift because of the COVID-19 pandemic versus students who did not change their perspective. Moreover, technology, diversity, and education offerings were ranked among the five least important factors of one group (i.e., did not change perspective) while ranking significantly more important by the other group (i.e., changed perspective).
Table 11.
Statistical differences—COVID-19 perspective (sorted by ascending order of p-value).
Moreover, students were asked to elaborate in their own words on how their perspective of the ideal workplace in the industry shifted or why their perspective remained the same. The major points of their discussions are presented in Table 12. In summary, the following obtained:
Table 12.
Major points of discussion regarding the COVID-19 perspective.
- Students who changed their perspective due to the COVID-19 pandemic highlighted the flexibility of feasibility of remote work, increased efficiency and productivity, reduced commute time, improved work–life balance, greater emphasis on mental health and well-being, technological advancement particularly in adopting tools for virtual meetings and cloud platforms, and recognition of compensation and employee rights;
- Students who did not change their perspective due to the COVID-19 pandemic highlighted the preference for in-person and on-site work, which they felt allowed for more effective communication, productivity, professional growth, and well-being, particularly for junior positions. They pointed out the hands-on nature of fieldwork that requires physical presence, the minimal effect of COVID-19 on the construction industry that inherently requires physical presence, and the clear division between work and personal life;
- Common perspectives across both groups include a consensus on the importance of safety and health regulations, the resilience of the construction industry during the pandemic, the flexibility of hybrid models with the freedom to choose between physical and remote environments, and the distinction between tasks that can be performed remotely versus those that require physical presence on-site.
4.9. Work Preferences
Students were also asked to select their opinions on different work preferences as shown in Figure 3. The data show the following:
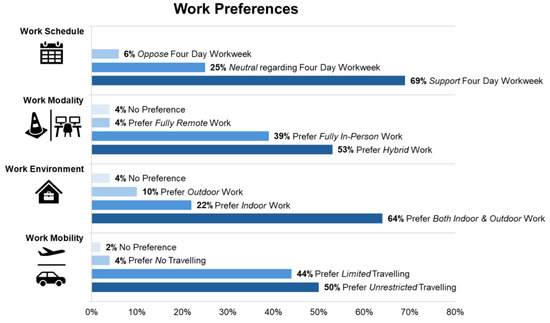
Figure 3.
Work preferences regarding schedule, modality, environment, and mobility.
- Most students support a four-day workweek (69%);
- Most students prefer a hybrid format with a mix of remote and in-person tasks (53%);
- Most students prefer a mix of indoor and outdoor work (64%);
- Half the students do not mind traveling (50%).
5. Discussion
Based on the different Gen Z perceptions detected in the survey results, the study proposes eight recommendations that can help construction employers become the employers of choice for young talent.
5.1. Recommendation 1: Prioritize Respect and Work–Life Balance
Respect and work–life balance emerged as the most significant factors across nearly every analysis category, reflecting a generational shift in Gen Z’s workplace priorities. This generation places high value on employers who respect personal boundaries and foster environments that acknowledge both their professional contributions and personal lives.
Research on Gen Z suggests that satisfaction with interpersonal relationships, leadership, and management often has a greater impact on job satisfaction than salary or benefits [33]. Work–life balance, in particular, has been shown to significantly reduce employee turnover by fostering loyalty and engagement [69]. Organizations should encourage open communication, allowing employees to voice suggestions and feedback freely [70]. Promoting autonomy by trusting and supporting employees in decision-making empowers them to take ownership of projects and manage their time effectively [71]. Managers should serve as coaches, sharing their own learning experiences and presenting skills as continuously developable [72]. Establishing a culture that values feedback, celebrates experimentation, and frames challenges as learning opportunities can further enhance job satisfaction [72,73]. Stories of overcoming failures and setting developmental goals collaboratively can build stronger relationships between managers and employees, improving work quality and attitudes [72]. These strategies align with Gen Z’s emphasis on personal growth, balance, and meaningful connections in their professional lives.
5.2. Recommendation 2: Foster Diversity and Inclusion
Diversity is a critical factor for non-traditional construction students, including females, historically underrepresented groups, and those intimidated by the industry’s macho culture. It also holds significance for students whose views on workplace culture shifted post-COVID-19, underscoring the need for inclusive environments that embrace equity and fairness.
Most of Gen Z believes that everyone is equal and should be treated as such [72]. However, research highlights that one of the key challenges in civil engineering is attracting and retaining a structurally diverse student population [74]. Thus, organizations should provide equitable opportunities and access to resources that can help historically underrepresented groups overcome systemic barriers, and foster inclusive environments that can address discrimination, navigate bias, and promote fairness while supporting career satisfaction [74].
To implement lasting change, organizations must move beyond seeing diversity as a mere “business need” [75]. Policies should be gender-aware and culturally sensitive as they address the root causes of inequality, with a structured plan that includes goal setting, monitoring, and outcome measurement to ensure effectiveness [75]. Other actions include conducting workshops and training that highlight the benefits of diversity for both individuals and organizations and promote personal valuing of equality while fostering an inclusive culture, designing programs to encourage teamwork and appreciation of unique perspectives, and providing pathways for all employees to succeed [72]. Training should also be effective and efficient so it can improve job satisfaction by supporting employees rather than becoming a burden that requires overtime work to complete [33].
Findings also indicate that first-generation students view collaboration as vital for building networks, learning from peers, and navigating new professional environments. Research highlights that first-generation students often face challenges due to cultural mismatches, hindering their ability to shift from interdependence to a subjective sense of fitness in college and the workplace [76]. Organizations can support these students by fostering collaboration through team-building and professional development initiatives, helping them overcome the lack of prior professional exposure and improve their sense of belonging in the workplace.
5.3. Recommendation 3: Emphasize Physical Safety and Mental Health Support to Attract and Retain Female Groups
To attract and retain females in the construction industry, companies must prioritize both physical safety and mental health, as females remain an underrepresented demographic in this sector. The findings show a clear distinction in priorities: males typically value financial security (e.g., compensation and benefits), while females place a higher emphasis on physical and mental safety (e.g., workplace safety, well-being, and honesty).
Actions that can help include increasing female visibility through mentoring programs led by female role models and addressing barriers such as sexual harassment, wage disparities, and discrimination in hiring [77]. Research also shows that female employees without prior experience are more than likely to lack confidence in making decisions and face socialization difficulties, necessitating targeted support systems [77]. Organizations should also implement stress management programs to address mental health challenges and promote well-being. This can include offering workshops on financial management, suicide prevention training, encouraging the use of paid time off (PTO) for mental health, and providing access to confidential mental health resources when needed [40].
5.4. Recommendation 4: Balance Compensation and Benefits to Address Different Financial Priorities
The findings from the study indicate that financial obligations, such as student loans, can influence career-related values. Students with loans prioritize stability and benefits such as healthcare and retirement plans to mitigate future uncertainties, while those without loans focus more on immediate earnings due to fewer financial pressures. As a result, companies should balance compensation (short-term earnings) with benefits (long-term security).
Suggestions from the research include adopting attractive remuneration strategies, offering monthly benefits instead of annual bonuses, and using appreciation and recognition to motivate employees [78,79,80]. This can be achieved through rewards like vacations and field trips, and/or a combination of tangible rewards (e.g., extra leave days or travel incentives) and intangible rewards (e.g., flexible working practices or training and development opportunities) [12,78].
5.5. Recommendation 5: Embrace the Digital Transformation
The results show a connection between innovative organizations that have a tech-savvy reputation and financial stability. Innovative companies are often associated with better career advancement opportunities, higher-paying roles, and greater financial security [81,82]. This dynamic may appeal especially to individuals with loans, as such roles promise stability and growth. Similarly, among certain racial and ethnic groups, technology-driven companies are perceived as modern and innovative, often aligning with progressive values and promoting a more inclusive and diverse environment [83].
The results also highlight that technology becomes a differentiating factor when considering experience levels. Digital tools and resources empower Gen Z to navigate tasks with minimal supervision, fostering a sense of independence and capability [18]. Organizations are encouraged to adopt technologies such as cloud computing [84], augmented reality [85], drones [86], robotics [87], and artificial intelligence [88] strategically to enhance employee capabilities rather than posing risks to their job security or autonomy [89]. To build a tech-savvy workforce, organizations can design skilling and re-skilling programs that combine self-paced learning with guided instruction to accommodate diverse learning styles, leverage Gen Z talent and resources, establish clear career paths and development plans for each employee, and promote a culture of continuous improvement through a lifelong learning culture [90]. Organizations can adopt digital recruitment strategies to streamline hiring and onboarding, replace conventional workflow processes, and provide digital tools and resources to enhance operational efficiency and employee engagement [70].
5.6. Recommendation 6: Promote Industry Benefits and Opportunities for Newcomers
Organizations should prioritize engaging students who have limited exposure to the industry, such as those without family connections or prior work experience in construction. The findings show a clear difference in priorities between these students and those with industry exposure, particularly in their understanding of the benefits that come with working in the industry.
Research shows that students can benefit from personalized onboarding processes where expectations about work relationships are clearly communicated and managed [72]. Moreover, organizations should adopt a structured onboarding experience that includes shared expectations, question-and-answer (Q&A) sessions with senior leaders and human resources (HR), and introductions to coworkers to facilitate communication [72]. Organizations should also foster early trust and engagement by highlighting the importance of their roles, sharing personalized success stories, emphasizing growth opportunities to reinforce their decision to join, and providing uninterrupted feedback channels to ensure employees feel heard and valued [71,72].
Communicating the different aspects of professional development is also important. Students who have industry exposure prioritize professional development as they understand the importance of evolving roles and fostering long-term growth. Organizations can provide pathways such as tuition reimbursement, mentorship programs, online courses, and accessible educational materials to provide employees with the certifications and licenses they need to advance their careers [70].
5.7. Recommendation 7: Encourage Feedback and Safe-Space Communications
The results highlight that the construction industry continues to have a macho culture reputation. While both genders acknowledge the existence of the macho culture, the results clearly show that females are disproportionately affected.
An effective method to address intimidation in the industry is for organizations to document the employees’ perceptions, particularly regarding the overwhelming intimidation some of them experience. As these issues are not openly communicated, utilizing anonymous feedback platforms can help organizations collect information about the workplace culture and environment, as it allows employees to feel safe in reporting their concerns while employed [91].
Effective exit interviews, conducted by a third party to remove bias, can provide valuable insights into employee turnover and help inform strategies to improve retention. Exit interviews can have a mixed-methods approach by asking open-ended questions to gather detailed and actionable reasons for an employee’s departure after they leave the organization and use these details to create actions that translate to specific interventions [92].
Other practices include advocating for cultural change initiatives to create a more inclusive and supportive environment and developing mentorship programs for diverse groups [81,93,94].
5.8. Recommendation 8: Offer Flexibility, Career Growth, and Stability
While there is no fundamental shift in industry norms due to the COVID-19 pandemic, the results show that Gen Z seeks flexibility and growth opportunities, preferring hybrid environments that balance traditional on-site experiences with the option to work remotely when physical presence is not required. They value the hands-on learning and accelerated development offered by site visits particularly in the early stages of their career, while at the same time they appreciate flexibility in schedules, work locations, and benefit programs to align with their diverse needs and lifestyles. The results also show that Gen Z prioritizes roles that allow it to expand its skill sets across various areas, valuing job tasks that encourage growth and adaptability. While Gen Z is open to relocation for new opportunities, its members prefer stability once settled, favoring long-term placement over frequent moves throughout their careers.
Research further highlights these findings, where Gen Z favors a clear career progression and visible opportunities for advancement that increase its members’ likelihood to stay working with the organization [70]. Companies can offer flex times, enhance career development opportunities, offer adaptable work locations, and introduce customizable benefits programs [19].
6. Conclusions
The construction industry is facing major challenges regarding its workforce. Recent studies show that most employers report difficulties in attracting and recruiting new talent, an issue that worsens as the median age of workers crosses 41 years while the industry expects 40% of its workforce to retire by 2030. So, what do organizations need to attract, hire, and retain new graduates? Additionally, what changes should these companies make to create a supportive working environment?
To answer these two questions, the authors surveyed more than 160 Gen Z students across the USA. The survey asked students to evaluate 27 distinct factors that graduates care about when choosing employers, all of which were identified and defined from the existing research corpus. Students were also asked to explain how the COVID-19 pandemic shifted their perspective on working environments, as well as what their thoughts are on post-pandemic trends including remote work and four-day workweeks. Additionally, the survey asked students to indicate different socio-demographic variables to investigate differences in gender, race, sexual orientation, marital status, first/non-first-generation status, with/without AECO experience, having/not having student loans, and having/not having family members in the AECO industry. The results from the survey were analyzed using quantitative and qualitative methods, and eight recommendations were presented for construction employers to prepare for the new generation of Gen Z students joining the industry. The results from the analysis showed the following:
- Regarding gender: Both male and female students prioritized respect and work–life balance. Males valued compensation, benefits, and job security, while females emphasized honesty, safety, well-being, and diversity. Moreover, while both genders acknowledge the existence of a “macho culture”, the results suggest that males tend to normalize and align with the industry’s “macho culture”, whereas females not only recognize but also feel more directly affected by this culture;
- Regarding ethnic/racial groups: White students prioritized benefits, safety, and honesty, while underrepresented groups emphasized fairness, job security, and well-being, and ranked diversity significantly higher. Both groups prioritized respect and work–life balance;
- Regarding first-generation status: First-generation students valued compensation, fairness, and honesty, while non-first-generation students prioritized job security, benefits, and safety. First-generation students also ranked collaboration significantly higher. Both groups prioritized respect and work–life balance;
- Regarding loans and educational debt: Students with loans prioritized safety and benefits, while those without loans valued honesty and compensation, with both groups emphasizing work–life balance, respect, and job security;
- Regarding family in AECO industry: Students with family in the AECO industry prioritized honesty, benefits, and growth, while those without family in the AECO industry emphasized safety, job security, and compensation. Both groups prioritized respect and work–life balance;
- Regarding experience in AECO industry: Students with AECO industry experience prioritized job security, honesty, and professional development, while those without experience valued safety and compensation, with both groups emphasizing respect, work–life balance, and benefits;
- Regarding macho culture: Students intimidated by macho culture prioritized work–life balance, safety, respect, job security, and clarity, while those not intimidated focused on growth, honesty, safety, clarity, and respect. Moreover, diversity, well-being, and job security were ranked significantly higher by students intimidated by macho culture versus those who do not believe in it;
- Regarding COVID-19 impact: Students who shifted their perspective due to COVID-19 prioritized honesty and compensation while those who did not shift emphasized clarity and safety, with both groups emphasizing respect, work–life balance, and job security. Students who shifted their perspective also highlighted the importance of technology, well-being, flexibility, diversity, and education offerings;
- Regarding work preferences: Most students supported a four-day workweek, preferred a hybrid work format, favored a mix of indoor and outdoor tasks, and half were open to traveling.
The results of this study align with previous global research on Gen Z and emphasize the importance of work–life balance, flexibility, and hybrid work environments. Key motivators for Gen Z include competitive compensation, career advancement, mentoring, and fostering inclusive and transparent workplace cultures. Additionally, psychological support, open communication, and addressing diverse needs—such as fair treatment and constructive feedback—are consistently highlighted. Technology adoption, societal contributions, and opportunities for professional growth also resonate strongly with this generation. These findings suggest that attracting and retaining Gen Z talent in the construction industry requires prioritizing well-being, career development, and respect for individuality while creating environments that balance innovation and inclusivity.
The value of this study is two-fold. First, the study can lay the foundation for future construction research as it is the first study that provides insights on construction management students, particularly Gen Z students, to understand their perspective on their employer of choice notably after the COVID-19 pandemic and the changes it brought to the workplace. Second, the study provides employers with the data needed for them to enhance their recruitment retention policies and make decisions that enhance the working environment and prepare for attracting, hiring, and retaining new graduates.
As with any other study that is based on a survey, the findings of this study are based on the data gathered from the surveyed Gen Z students. The dataset did not have enough responses to investigate categories such as marriage, having dependents, and being part of the LGBTQIA+ community. Further studies should aim to address this gap. Additionally, the data were collected from three of the four main USA regions, suggesting an opportunity for future research to include the fourth region for a more comprehensive understanding. Moreover, studies conducted outside the USA can expand on this research by comparing findings across various cultural and industrial contexts, especially in regions where research has yet to be published. To deepen understanding beyond survey results, future research should incorporate focus groups and interviews to provide richer, qualitative insights into Gen Z perspectives. Beyond the scope of construction management, future studies might also investigate technical skills and programs across other fields within the broader construction and engineering industries. Finally, only univariate analysis was utilized in this paper and the objective was limited to presenting the data for the construction industry. Upcoming studies will dive into bivariate analysis to uncover possible trends among the different demographic and non-demographic variables.
Author Contributions
Conceptualization, M.B.H. and H.N.; methodology, M.B.H. and H.N.; software, M.B.H.; validation, M.B.H.; formal analysis, M.B.H.; investigation, M.B.H. and H.N.; resources, H.N.; data curation, M.B.H.; writing—original draft preparation, M.B.H.; writing—review and editing, H.N.; visualization, M.B.H.; supervision, M.B.H. and H.N.; project administration, M.B.H. and H.N.; funding acquisition, H.N. All authors have read and agreed to the published version of the manuscript.
Funding
This research received no external funding.
Institutional Review Board Statement
This research was approved by the University of Kentucky International Review Board (IRB)—protocol #76068. All findings and opinions expressed in this paper are those of the authors and do not necessarily reflect the authors’ affiliations.
Informed Consent Statement
Informed consent was obtained from all participants in this research.
Data Availability Statement
The data that support the findings of this study are available from the corresponding author upon reasonable request.
Acknowledgments
The authors extend their gratitude to the professors who facilitated the dissemination of the survey among their students and to all the students who generously took the time to participate in the survey.
Conflicts of Interest
Author Makram Bou Hatoum was employed by the company Pyrovio. The remaining authors declare that the research was conducted in the absence of any commercial or financial relationships that could be construed as a potential conflict of interest.
References
- Dimock, M. Defining Generations: Where Millennials End and Generation Z Begins. Pew Res. Cent. 2019, 17, 1–7. [Google Scholar]
- Horton, A. Marketing to Generation Z (US, May 2021); Mintel: Chicago, IL, USA, 2021. [Google Scholar]
- Becer, T. The Influence of Generations Y and Z on Career Future. Int. J. Manag. Soc. Res. 2021, 8, 15–91. [Google Scholar]
- Tyacke, V.-L.; Howell, J. Digital Literacy and Gen Z. The Unpacking of Expectations. In Proceedings of the Australian Council for Computers in Education 2018 Conference Proceedings, Sydney, Australia, 2–5 October 2018; Bourne, D., Cameron, L., Eds.; ICT Educators NSW: Randwick, Australia, 2018. [Google Scholar]
- Cornu, B. Digital Natives: How Do They Learn? How to Teach Them? IITE Policy Brief; UNESCO Institute for Information Technologies in Education: Moscow, Russia, 2011; p. 12. [Google Scholar]
- Ebrahimi, M.; Granitz, N.; Kohli, C.; Nugroho, N. Gen Z Rising: Emerging Implications for Business Education. J. Acad. Bus. Educ. 2023, 23, 75–101. [Google Scholar]
- Harari, T.T.; Sela, Y.; Bareket-Bojmel, L. Gen Z during the COVID-19 Crisis: A Comparative Analysis of the Differences Between Gen Z and Gen X in Resilience, Values and Attitudes. Curr. Psychol. 2023, 42, 24223–24232. [Google Scholar] [CrossRef]
- McKee-Ryan, F.M. Coming of Age in a Global Pandemic: HRM Perspectives on Generation Z’s Workforce Entry. In Research in Personnel and Human Resources Management; Buckley, M.R., Wheeler, A.R., Baur, J.E., Halbesleben, J.R.B., Eds.; Emerald Publishing Limited: Bingley, UK, 2021; Volume 39, pp. 99–128. ISBN 978-1-80117-430-5. [Google Scholar]
- Iorgulescu, M.-C. Generation Z and Its Perception of Work. Cross-Cult. Manag. J. 2016, 18, 47–54. [Google Scholar]
- Benítez-Márquez, M.D.; Sánchez-Teba, E.M.; Bermúdez-González, G.; Núñez-Rydman, E.S. Generation Z Within the Workforce and in the Workplace: A Bibliometric Analysis. Front. Psychol. 2022, 12, 736820. [Google Scholar] [CrossRef] [PubMed]
- Singh, A.P.; Dangmei, J. Understanding the Generation Z: The Future Workforce. South-Asian J. Multidiscip. Stud. (SAJMS) 2016, 3, 1–5. [Google Scholar]
- Borg, N.; Scott-Young, C.; Naderpajouh, N. Managing to Retain Generation Z in the Construction Industry. In Proceedings of the Australasian Universities Building Education Association Conference, Virtual, 27–29 October 2021; Construction Education: Live the Future. Deakin University: Geelong, Australia, 2021; pp. 109–119. [Google Scholar]
- Ling, F.Y.Y.; Lew, E.J.Y. Strategies to Recruit and Retain Generation Z in the Built Environment Sector. Eng. Constr. Archit. Manag. 2024; ahead-of-print. [Google Scholar] [CrossRef]
- Özen, A.E.; Demirdöğen, G.; Demirbağ, A.T.; Aladağ, H.; Işık, Z. Generational Transformation and Its Reflection on Project Success: The Gen-Z. Turk. J. Civ. Eng. 2024, 35, 65–86. [Google Scholar] [CrossRef]
- Shwiyyat, H.; Lewis, A.; Cournia, J. Generation Z and the Construction Industry. In Proceedings of the 60th Annual Associated Schools of Construction International Conference, Auburn, AL, USA, 3–5 April 2024; Leathem, T., Collins, W., Perrenoud, A., Eds.; EasyChair: Stockport, UK, 2024; Volume 5, pp. 768–776. [Google Scholar]
- Bharadwaj, B. Factors That Influenced Current Gen Z Undergraduate Students Enrolled in Construction-Related Programs to Pursue a Career in Construction. Master’s Thesis, Clemson University, Clemson, SC, USA, 2023. [Google Scholar]
- Wen, L.J. Understanding the Workplace Expectations of Generation Z Quantity Surveyors in Consultancy Services Within the Malaysian Construction Industry. Bachelor’s Thesis, Universiti Tunku Abdul Rahman, Petaling Jaya, Malaysia, 2024. [Google Scholar]
- Prawitasari, G. The Influence of Generations on Career Choice (Social Cognitive Career Theory Perspective). Konselor 2018, 7, 15–20. [Google Scholar] [CrossRef]
- Crandall, P.G.; Houser, R.H.; O’Bryan, C.A. Becoming the Employer of Choice: Anticipating and Preparing for a Graying Workforce in Industry. SN Soc. Sci. 2022, 2, 173. [Google Scholar] [CrossRef] [PubMed]
- Herman, R.E.; Gioia, J.L. How to Become an Employer of Choice, 1st ed.; Oakhill Press: Winchester, VA, USA, 2000. [Google Scholar]
- Branham, L. Planning to Become an Employer of Choice. J. Organ. Excell. 2005, 24, 57–68. [Google Scholar] [CrossRef]
- Kucherov, D.; Zavyalova, E. HRD Practices and Talent Management in the Companies with the Employer Brand. Eur. J. Train. Dev. 2012, 36, 86–104. [Google Scholar] [CrossRef]
- Elving, W.J.L.; Westhoff, J.J.C.; Meeusen, K.; Schoonderbeek, J.-W. The War for Talent? The Relevance of Employer Branding in Job Advertisements for Becoming an Employer of Choice. J. Brand Manag. 2013, 20, 355–373. [Google Scholar] [CrossRef]
- Bellou, V.; Chaniotakis, I.; Kehagias, I.; Rigopoulou, I. Employer Brand of Choice: An Employee Perspective. J. Bus. Econ. Manag. 2015, 16, 1201–1215. [Google Scholar] [CrossRef]
- Aboul-Ela, G.M.B.E. Employer Branding: What Constitutes “An Employer of Choice? J. Bus. Retail. Manag. Res. (JBRMR) 2016, 11, 154–166. [Google Scholar]
- Sedighi, F.; Loosemore, M. Employer-of-Choice Characteristics in the Construction Industry. Constr. Manag. Econ. 2012, 30, 941–950. [Google Scholar] [CrossRef]
- Denny-Smith, G.; Sunindijo, R.Y.; Loosemore, M.; Williams, M.; Piggott, L. How Construction Employment Can Create Social Value and Assist Recovery from COVID-19. Sustainability 2021, 13, 988. [Google Scholar] [CrossRef]
- Li, J.; Yu, H.; Deng, X. A Systematic Review of the Evolution of the Concept of Resilience in the Construction Industry. Buildings 2024, 14, 2643. [Google Scholar] [CrossRef]
- Elbashbishy, T.; El-Adaway, I.H. Skilled Worker Shortage across Key Labor-Intensive Construction Trades in Union Versus Nonunion Environments. J. Manag. Eng. 2024, 40, 04023063. [Google Scholar] [CrossRef]
- Maqbool, R.; Rashid, Y.; Altuwaim, A.; Shafiq, M.T.; Oldfield, L. Coping with Skill Shortage within the UK Construction Industry: Scaling up Training and Development Systems. Ain Shams Eng. J. 2024, 15, 102396. [Google Scholar] [CrossRef]
- Cappelli, P. Your Approach to Hiring Is All Wrong. Harv. Bus. Rev. 2019, 97, 48–58. [Google Scholar]
- Jadidoleslami, S.; Saghatforoush, E.; Zare Ravasan, A. Constructability Obstacles: An Exploratory Factor Analysis Approach. Int. J. Constr. Manag. 2021, 21, 312–325. [Google Scholar] [CrossRef]
- Zhang, S.; Wang, J.; Ke, Y.; Li, N.; Su, Z. Exploring the Impact of Job Satisfaction on Turnover Intention among Professionals in the Construction Industry. Eng. Constr. Archit. Manag. 2024; ahead-of-print. [Google Scholar] [CrossRef]
- Abdolmaleki, G.; Naismith, N.; Ghodrati, N.; Poshdar, M.; Jelodar, M.B. An Analysis of the Literature on Construction Employee Turnover: Drivers, Consequences, and Future Direction. Constr. Manag. Econ. 2024, 42, 822–846. [Google Scholar] [CrossRef]
- Muñoz-La Rivera, F.; Mora-Serrano, J.; Valero, I.; Oñate, E. Methodological-Technological Framework for Construction 4.0. Arch. Comput. Methods Eng. 2021, 28, 689–711. [Google Scholar] [CrossRef]
- Yap, J.B.H.; Goay, P.L.; Woon, Y.B.; Skitmore, M. Revisiting Critical Delay Factors for Construction: Analysing Projects in Malaysia. Alex. Eng. J. 2021, 60, 1717–1729. [Google Scholar] [CrossRef]
- BLS. Employed Persons by Detailed Industry and Age. In Labor Force Statistics from the Current Population Survey; BLS: Washington, DC, USA, 2023. [Google Scholar]
- Bou Hatoum, M.; Nassereddine, H.; Musick, S.; El-Jazzar, M. Investigation of PESTEL Factors Driving Change in Capital Project Organizations. Front. Built Environ. 2023, 9, 1207564. [Google Scholar] [CrossRef]
- Nassereddine, H.; Seo, K.W.; Rybkowski, Z.K.; Schranz, C.; Urban, H. Propositions for a Resilient, Post-COVID-19 Future for the AEC Industry. Front. Built Environ. 2021, 7, 687021. [Google Scholar] [CrossRef]
- Ross, V.; Mathieu, S.L.; Wardhani, R.; Gullestrup, J.; Kõlves, K. Factors Associated with Workplace Bullying and the Mental Health of Construction Industry Apprentices: A Mixed Methods Study. Front. Psychiatry 2021, 12, 629262. [Google Scholar] [CrossRef] [PubMed]
- Nuñez, A.; González, P.; Talavera, G.A.; Sanchez-Johnsen, L.; Roesch, S.C.; Davis, S.M.; Arguelles, W.; Womack, V.Y.; Ostrovsky, N.W.; Ojeda, L.; et al. Machismo, Marianismo, and Negative Cognitive-Emotional Factors: Findings From the Hispanic Community Health Study/Study of Latinos Sociocultural Ancillary Study. J. Lat. Psychol. 2016, 4, 202–2017. [Google Scholar] [CrossRef] [PubMed]
- Turner, M.; Scott-Young, C.; Holdsworth, S. Resilience and Well-Being: A Multi-Country Exploration of Construction Management Students. Int. J. Constr. Manag. 2021, 21, 858–869. [Google Scholar] [CrossRef]
- Yamane, T.; Kaneko, S. Is the Younger Generation a Driving Force toward Achieving the Sustainable Development Goals? Survey Experiments. J. Clean. Prod. 2021, 292, 125932. [Google Scholar] [CrossRef]
- Mahan, W. Employee Retention: The Actual Cost of Losing an Employee. Work Institute Blog, 20 August 2022. [Google Scholar]
- Scholz, C.; Rennig, A. (Eds.) Generations Z in Europe: Inputs, Insights and Implications; The Changing Context of Managing People; Emerald Publishing: Bingley, UK, 2019; ISBN 978-1-78973-491-1. [Google Scholar]
- Hatoum, M.B.; Ammar, A.; Nassereddine, H.; Dadi, G. Preparing Construction Employers for the Gen-Z Workforce: A Case Study. In Proceedings of the 30th Annual Conference of the International Group for Lean Construction (IGLC30), Edmonton, AB, Canada, 25–31 July 2022; pp. 808–819. [Google Scholar]
- Lehmann, D.R.; Hulbert, J. Are Three-Point Scales Always Good Enough? J. Mark. Res. 1972, 9, 444–446. [Google Scholar] [CrossRef]
- Preston, C.C.; Colman, A.M. Optimal Number of Response Categories in Rating Scales: Reliability, Validity, Discriminating Power, and Respondent Preferences. Acta Psychol. 2000, 104, 1–15. [Google Scholar] [CrossRef]
- Jacoby, J.; Matell, M.S. Three-Point Likert Scales Are Good Enough. J. Mark. Res. 1971, 8, 495–500. [Google Scholar] [CrossRef]
- Cochran, W.G. Sampling Techniques, 3rd ed.; John Wiley & Sons: Hoboken, NJ, USA, 1977; ISBN 978-0-471-16240-7. [Google Scholar]
- Islam, M.R. Sample Size and Its Role in Central Limit Theorem (CLT). Comput. Appl. Math. J. 2018, 4, 1–7. [Google Scholar]
- Yamane, T. Statistics, An Introductory Analysis, 2nd ed.; Harper and Row: New York, NY, USA, 1967. [Google Scholar]
- Garg, S.; Misra, S. Distribution of Rework Issues in Various Reinforced Concrete Building Components. J. Perform. Constr. Facil. 2021, 35, 04021033. [Google Scholar] [CrossRef]
- Tabachnick, B.G.; Fidell, L.S. Using Multivariate Statistics, 7th ed.; Pearson: London, UK, 2019; ISBN 978-0-13-752654-3. [Google Scholar]
- Wilson Van Voorhis, C.R.; Morgan, B.L. Understanding Power and Rules of Thumb for Determining Sample Sizes. Tutor. Quant. Methods Psychol. 2007, 3, 43–50. [Google Scholar] [CrossRef]
- Taber, K.S. The Use of Cronbach’s Alpha When Developing and Reporting Research Instruments in Science Education. Res. Sci. Educ. 2018, 48, 1273–1296. [Google Scholar] [CrossRef]
- George, D.; Mallery, P. IBM SPSS Statistics 26 Step by Step: A Simple Guide and Reference, 6th ed.; Routledge: London, UK, 2019. [Google Scholar]
- Kock, F.; Berbekova, A.; Assaf, A.G. Understanding and Managing the Threat of Common Method Bias: Detection, Prevention and Control. Tour. Manag. 2021, 86, 104330. [Google Scholar] [CrossRef]
- Podsakoff, P.M.; Podsakoff, N.P.; Williams, L.J.; Huang, C.; Yang, J. Common Method Bias: It’s Bad, It’s Complex, It’s Widespread, and It’s Not Easy to Fix. Annu. Rev. Organ. Psychol. Organ. Behav. 2024, 11, 17–61. [Google Scholar] [CrossRef]
- Howard, M.C.; Boudreaux, M.; Oglesby, M. Can Harman’s Single-Factor Test Reliably Distinguish Between Research Designs? Not in Published Management Studies. Eur. J. Work. Organ. Psychol. 2024, 33, 790–804. [Google Scholar] [CrossRef]
- Shapiro, S.S.; Wilk, M.B. An Analysis of Variance Test for Normality (Complete Samples). Biometrika 1965, 52, 591–611. [Google Scholar] [CrossRef]
- Razali, N.M.; Wah, Y.B. Power Comparisons of Shapiro-Wilk, Kolmogorov-Smirnov, Lilliefors and Anderson-Darling Tests. J. Stat. Model. Anal. 2011, 2, 21–33. [Google Scholar]
- Monter-Pozos, A.; González-Estrada, E. On Testing the Skew Normal Distribution by Using Shapiro–Wilk Test. J. Comput. Appl. Math. 2024, 440, 115649. [Google Scholar] [CrossRef]
- McKnight, P.E.; Najab, J. Mann-Whitney U Test. In The Corsini Encyclopedia of Psychology; John Wiley & Sons, Ltd.: Hoboken, NJ, USA, 2010; pp. 1–10. ISBN 978-0-470-47921-6. [Google Scholar]
- Kruskal, W.H.; Wallis, W.A. Use of Ranks in One-Criterion Variance Analysis. J. Am. Stat. Assoc. 1952, 47, 583–621. [Google Scholar] [CrossRef]
- Conover, W.J.; Iman, R.L. On Multiple-Comparisons Procedures; Los Alamos Scientific Laboratory: Los Alamos, NM, USA, 1979; pp. 1–14. [Google Scholar]
- Bryman, A.; Bell, E.; Reck, J.; Fields, J. Social Research Methods; Oxford University Press: Oxford, UK, 2021; ISBN 978-0-19-085366-2. [Google Scholar]
- Hatoum, M.B.; Jazzar, M.E.; Nassereddine, H. Exploring Essential Change Practices for the Successful Execution of Organizational Change Efforts in Capital Project Organizations. In Proceedings of the Creative Construction Conference 2023, Keszthely, Hungary, 20–23 June 2023; Skibniewski, M.J., Hajdu, M., Eds.; Budapest University of Technology and Economics: Keszthely, Hungary, 2023; pp. 293–302. [Google Scholar]
- Waworuntu, E.C.; Kainde, S.J.R.; Mandagi, D.W. Work-Life Balance, Job Satisfaction and Performance Among Millennial and Gen Z Employees: A Systematic Review. Society 2022, 10, 384–398. [Google Scholar] [CrossRef]
- Hamid, S.I. The Importance of Generation Z Work Culture and Its Effects on Employee Retention. Internship Report. Bachelor’s Thesis, Brac University, Dhaka, Bangladesh, 2022. [Google Scholar]
- Hatoum, M.B.; Nassereddine, H. Proposing a House for Lean Construction 4.0. In Lean Construction 4.0: Driving a Digital Revolution of Production Management in the AEC Industry; Routledge: London, UK, 2022; pp. 50–67. ISBN 978-1-00-315093-0. [Google Scholar]
- Schroth, H. Are You Ready for Gen Z in the Workplace? Calif. Manag. Rev. 2019, 61, 5–18. [Google Scholar] [CrossRef]
- Bou Hatoum, M.; Nassereddine, H.; Badurdeen, F. Towards a Canvas for Construction 4.0 Implementation in AECO Organizations. In Proceedings of the Creative Construction e-Conference 2022, Virtual, 9–11 July 2022; Budapest University of Technology and Economics: Budapest, Hungary, 2022; pp. 214–220. [Google Scholar]
- Keku, D.; Paige, F.; Shealy, T.; Godwin, A. Recognizing Differences in Underrepresented Civil Engineering Students’ Career Satisfaction Expectations and College Experiences. J. Manag. Eng. 2021, 37, 04021034. [Google Scholar] [CrossRef]
- Baker, M.; French, E.; Ali, M. Insights into Ineffectiveness of Gender Equality and Diversity Initiatives in Project-Based Organizations. J. Manag. Eng. 2021, 37, 04021013. [Google Scholar] [CrossRef]
- Phillips, L.T.; Stephens, N.M.; Townsend, S.S.M.; Goudea, S. Access Is Not Enough: Cultural Mismatch Persists to Limit First-Generation Students’ Opportunities for Achievement Throughout College. J. Personal. Soc. Psychol. Interpers. Relat. Group Process. 2020, 119, 1112–1131. [Google Scholar] [CrossRef]
- Infante-Perea, M.; Navarro-Astor, E.; Román-Onsalo, M. Sex, Age, Work Experience, and Relatives in Building Engineering Career Development. J. Manag. Eng. 2021, 37, 04021041. [Google Scholar] [CrossRef]
- Sharma, P.; Pandit, R. A Study on Expectations of Gen-Z Towards Compensation Practices in Organizations. Rabindra Bharati J. Philos. 2021, 23, 56–63. [Google Scholar]
- Acheampong, N.A.A. Reward Preferences of the Youngest Generation: Attracting, Recruiting, and Retaining Generation Z into Public Sector Organizations. Compens. Benefits Rev. 2021, 53, 75–97. [Google Scholar] [CrossRef]
- Kupczyk, T.; Rupa, P.; Gross-Gołacka, E.; Urbańska, K.; Parkitna, A. Expectations and Requirements of Generation Z Towards Salary. Eur. Res. Stud. J. 2021, 24, 85–96. [Google Scholar] [CrossRef]
- Østergaard, C.R.; Timmermans, B.; Kristinsson, K. Does a Different View Create Something New? The Effect of Employee Diversity on Innovation. Res. Policy 2011, 40, 500–509. [Google Scholar] [CrossRef]
- Pan, X.; Wan, X.; Wang, H.; Li, Y. The Correlation Analysis Between Salary Gap and Enterprise Innovation Efficiency Based on the Entrepreneur Psychology. Front. Psychol. 2020, 11, 1749. [Google Scholar] [CrossRef]
- Moody, J.W.; Beise, C.M.; Woszczynski, A.B.; Myers, M.E. Diversity and the Information Technology Workforce: Barriers and Opportunities. J. Comput. Inf. Syst. 2003, 43, 63–71. [Google Scholar] [CrossRef]
- Avram, M.G. Advantages and Challenges of Adopting Cloud Computing from an Enterprise Perspective. Procedia Technol. 2014, 12, 529–534. [Google Scholar] [CrossRef]
- Nassereddine, H.; Schranz, C.; Bou Hatoum, M.; Urban, H. A Comprehensive Map for Integrating Augmented Reality During the Construction Phase. In Proceedings of the Creative Construction e-Conference 2020, Virtual, 28 June–1 July 2020; Budapest University of Technology and Economics: Budapest, Hungary, 2020; pp. 56–64. [Google Scholar]
- Hatoum, M.B.; Nassereddine, H. The Use of Drones in the Construction Industry: Applications and Implementation. In Proceedings of the 39th International Symposium on Automation and Robotics in Construction, Bogota, Colombia, 13–15 July 2022; Linner, T., García de Soto, B., Hu, R., Brilakis, I., Bock, T., Pan, W., Carbonari, A., Castro, D., Mesa, H., Feng, C., et al., Eds.; International Association for Automation and Robotics in Construction (IAARC): Edinburgh, UK, 2022; pp. 542–549. [Google Scholar]
- Hatoum, M.B.; Nassereddine, H. Developing a Framework for the Implementation of Robotics in Construction Enterprises. In Proceedings of the EG-ICE 2020 Proceedings: Workshop on Intelligent Computing in Engineering, Virtual, 1–4 July 2020; Volume 27, pp. 453–462. [Google Scholar]
- Hatoum, M.B.; Nassereddine, H. Unleashing the Power of ChatGPT for Lean Construction: An Early Outlook. In Proceedings of the 31st Annual Conference of the International Group for Lean Construction (IGLC), Lille, France, 26 June–2 July 2023; pp. 208–219. [Google Scholar]
- Hatoum, M.B.; Nassereddine, H. Determining Decision-Making Factors for Technology Adoption in the Construction Industry. In Industry 4.0 Transformation Towards Industry 5.0 Paradigm; Yitmen, I., Almusaed, A., Eds.; IntechOpen: Rijeka, Croatia, 2024. [Google Scholar]
- Vetrivel, S.C.; Mohanasundaram, T. Building a Tech-Savvy Workforce: Re-Skilling Strategies for Success. In Reskilling the Workforce for Technological Advancement; Meçik, O., Ed.; IGI Global: Hershey, PA, USA, 2024; pp. 18–40. [Google Scholar]
- Mao, C.M.; DeAndrea, D.C. How Anonymity and Visibility Affordances Influence Employees’ Decisions About Voicing Workplace Concerns. Manag. Commun. Q. 2019, 33, 160–188. [Google Scholar] [CrossRef]
- Mahan, W. Why Exit Interviews Are Essential for Employee Retention. Work Institute Blog, 24 August 2022. [Google Scholar]
- Stockbridge, C.M.; Siddiqi, K.; Jollay, T. Best Practices for Attracting and Retaining Female Construction Project Managers. In Proceedings of the 54th ASC Annual International Conference Proceedings, Minneapolis, MN, USA, 18–21 April 2018; pp. 496–503. [Google Scholar]
- Stroh, L.K.; Brett, J.M.; Reilly, A.H. All the Right Stuff: A Comparison of Female and Male Managers’ Career Progression. J. Appl. Psychol. 1992, 77, 251–260. [Google Scholar] [CrossRef]
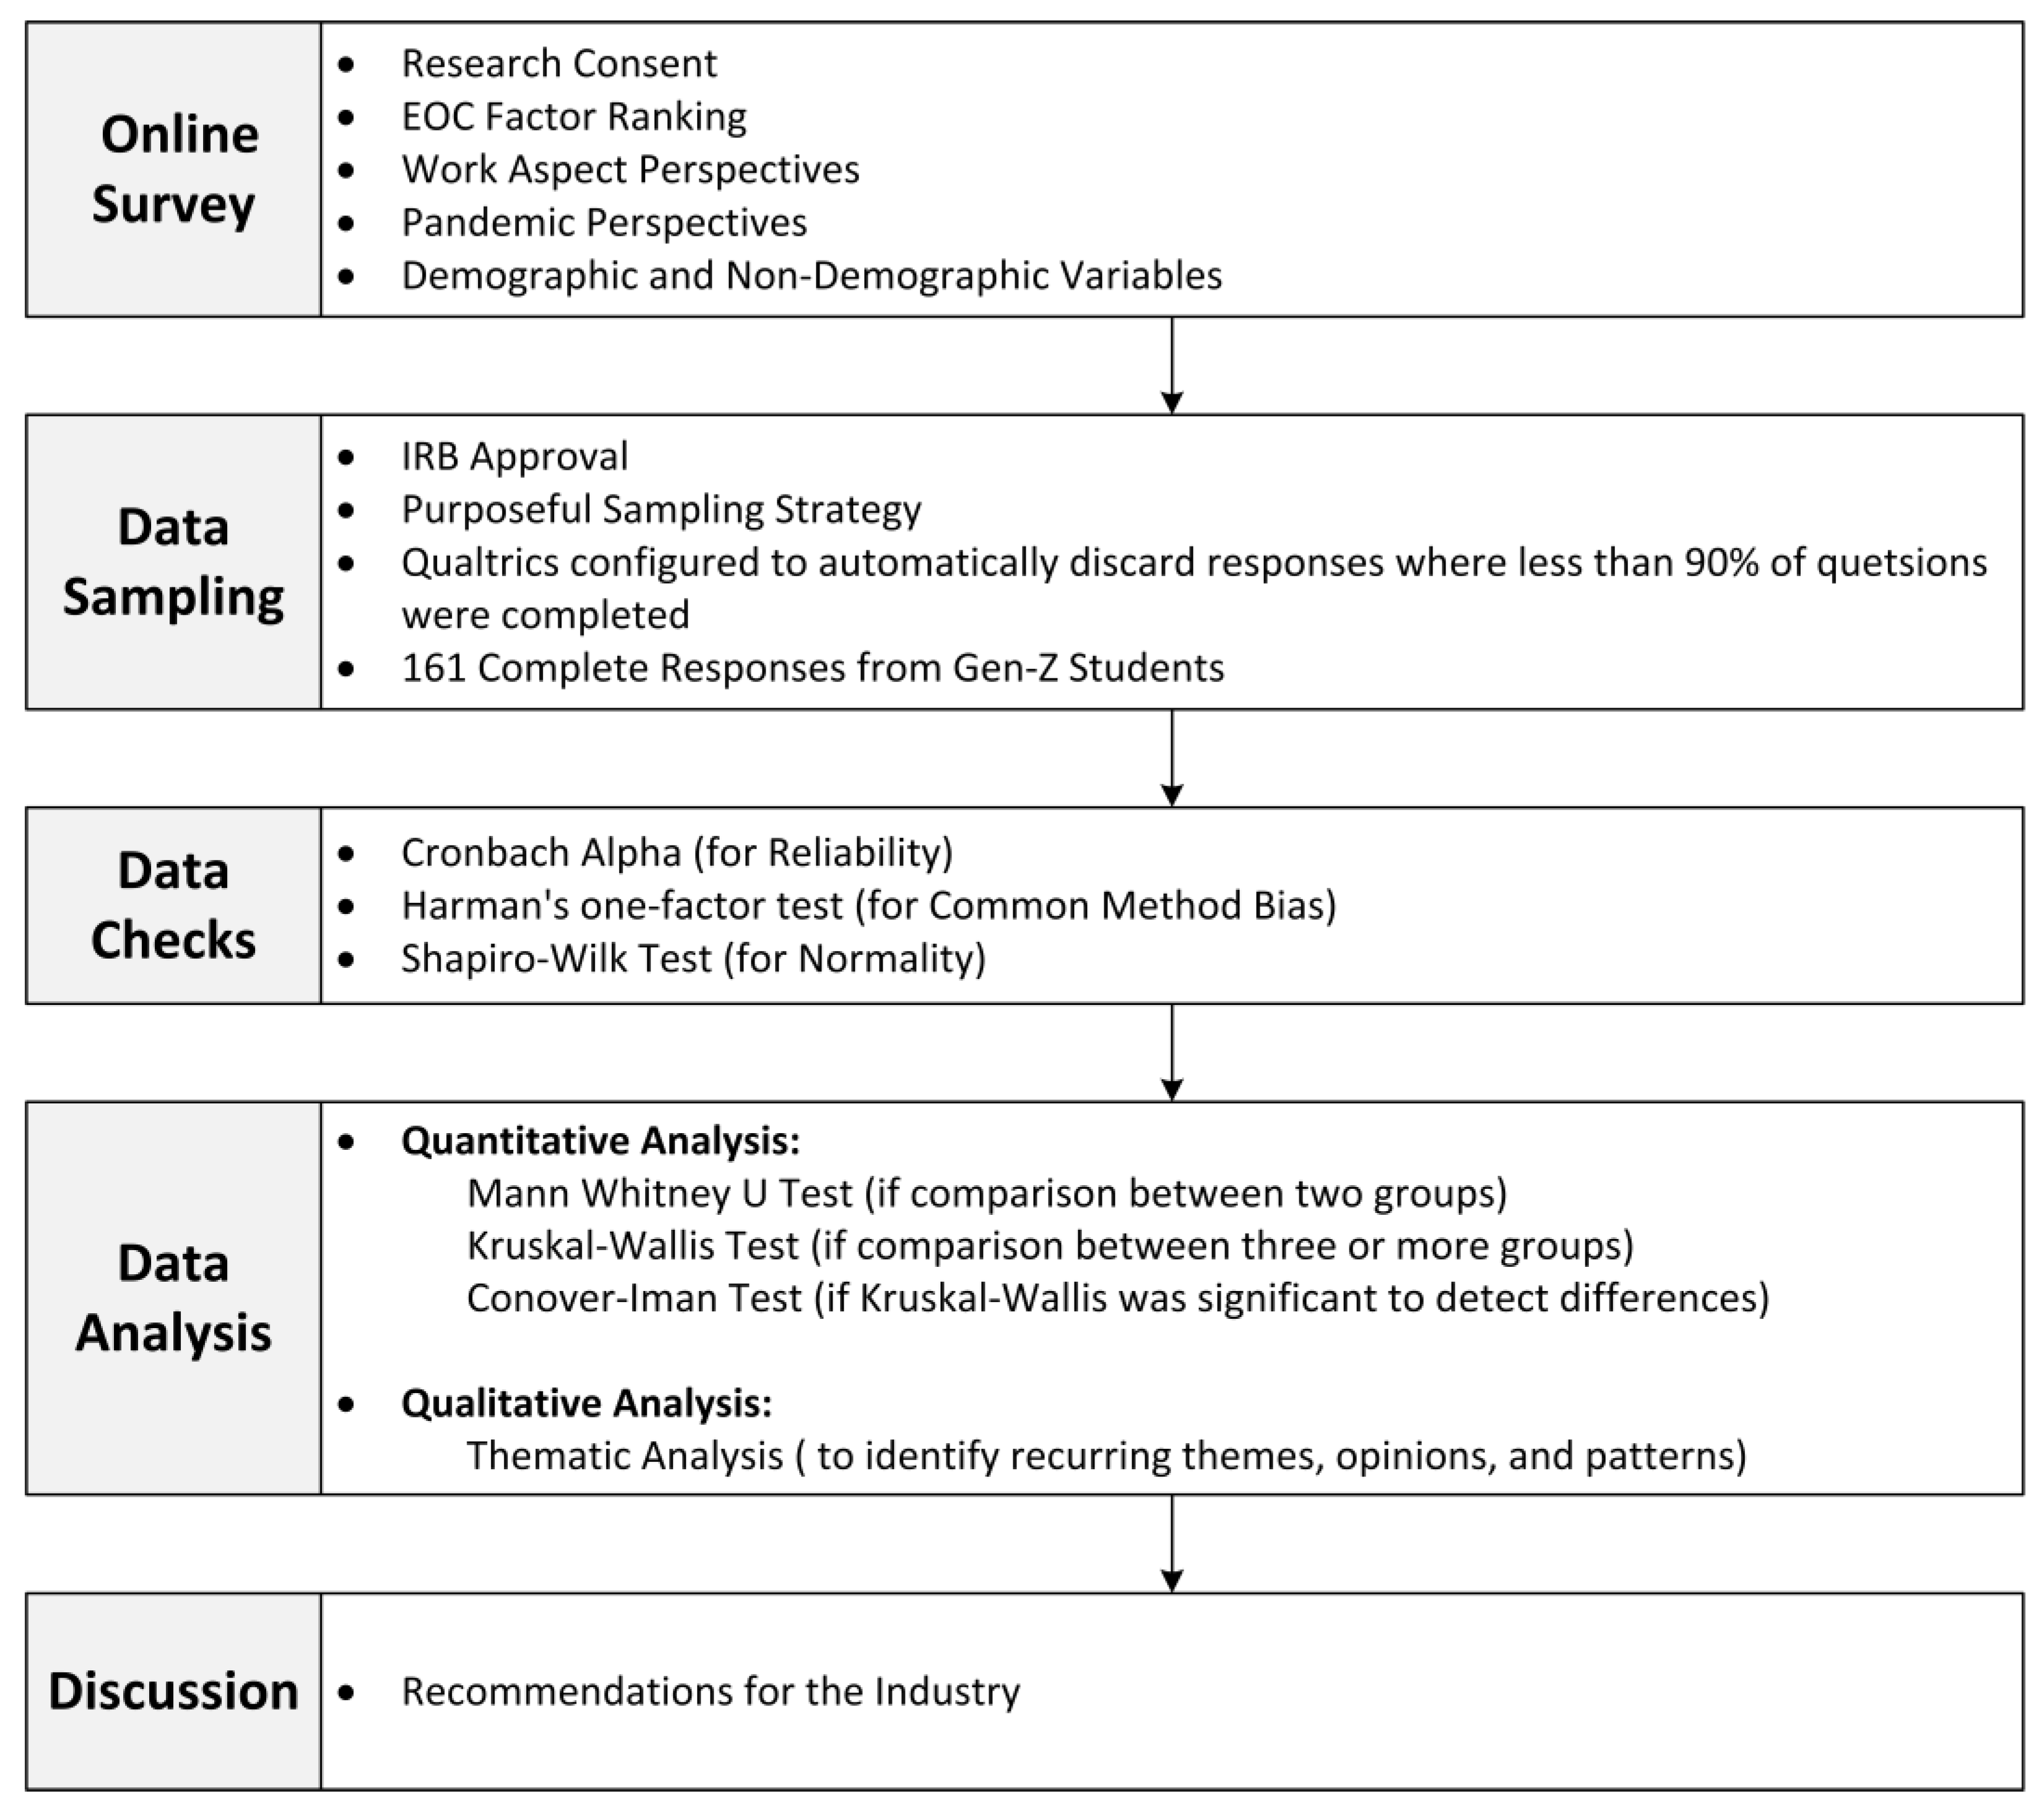
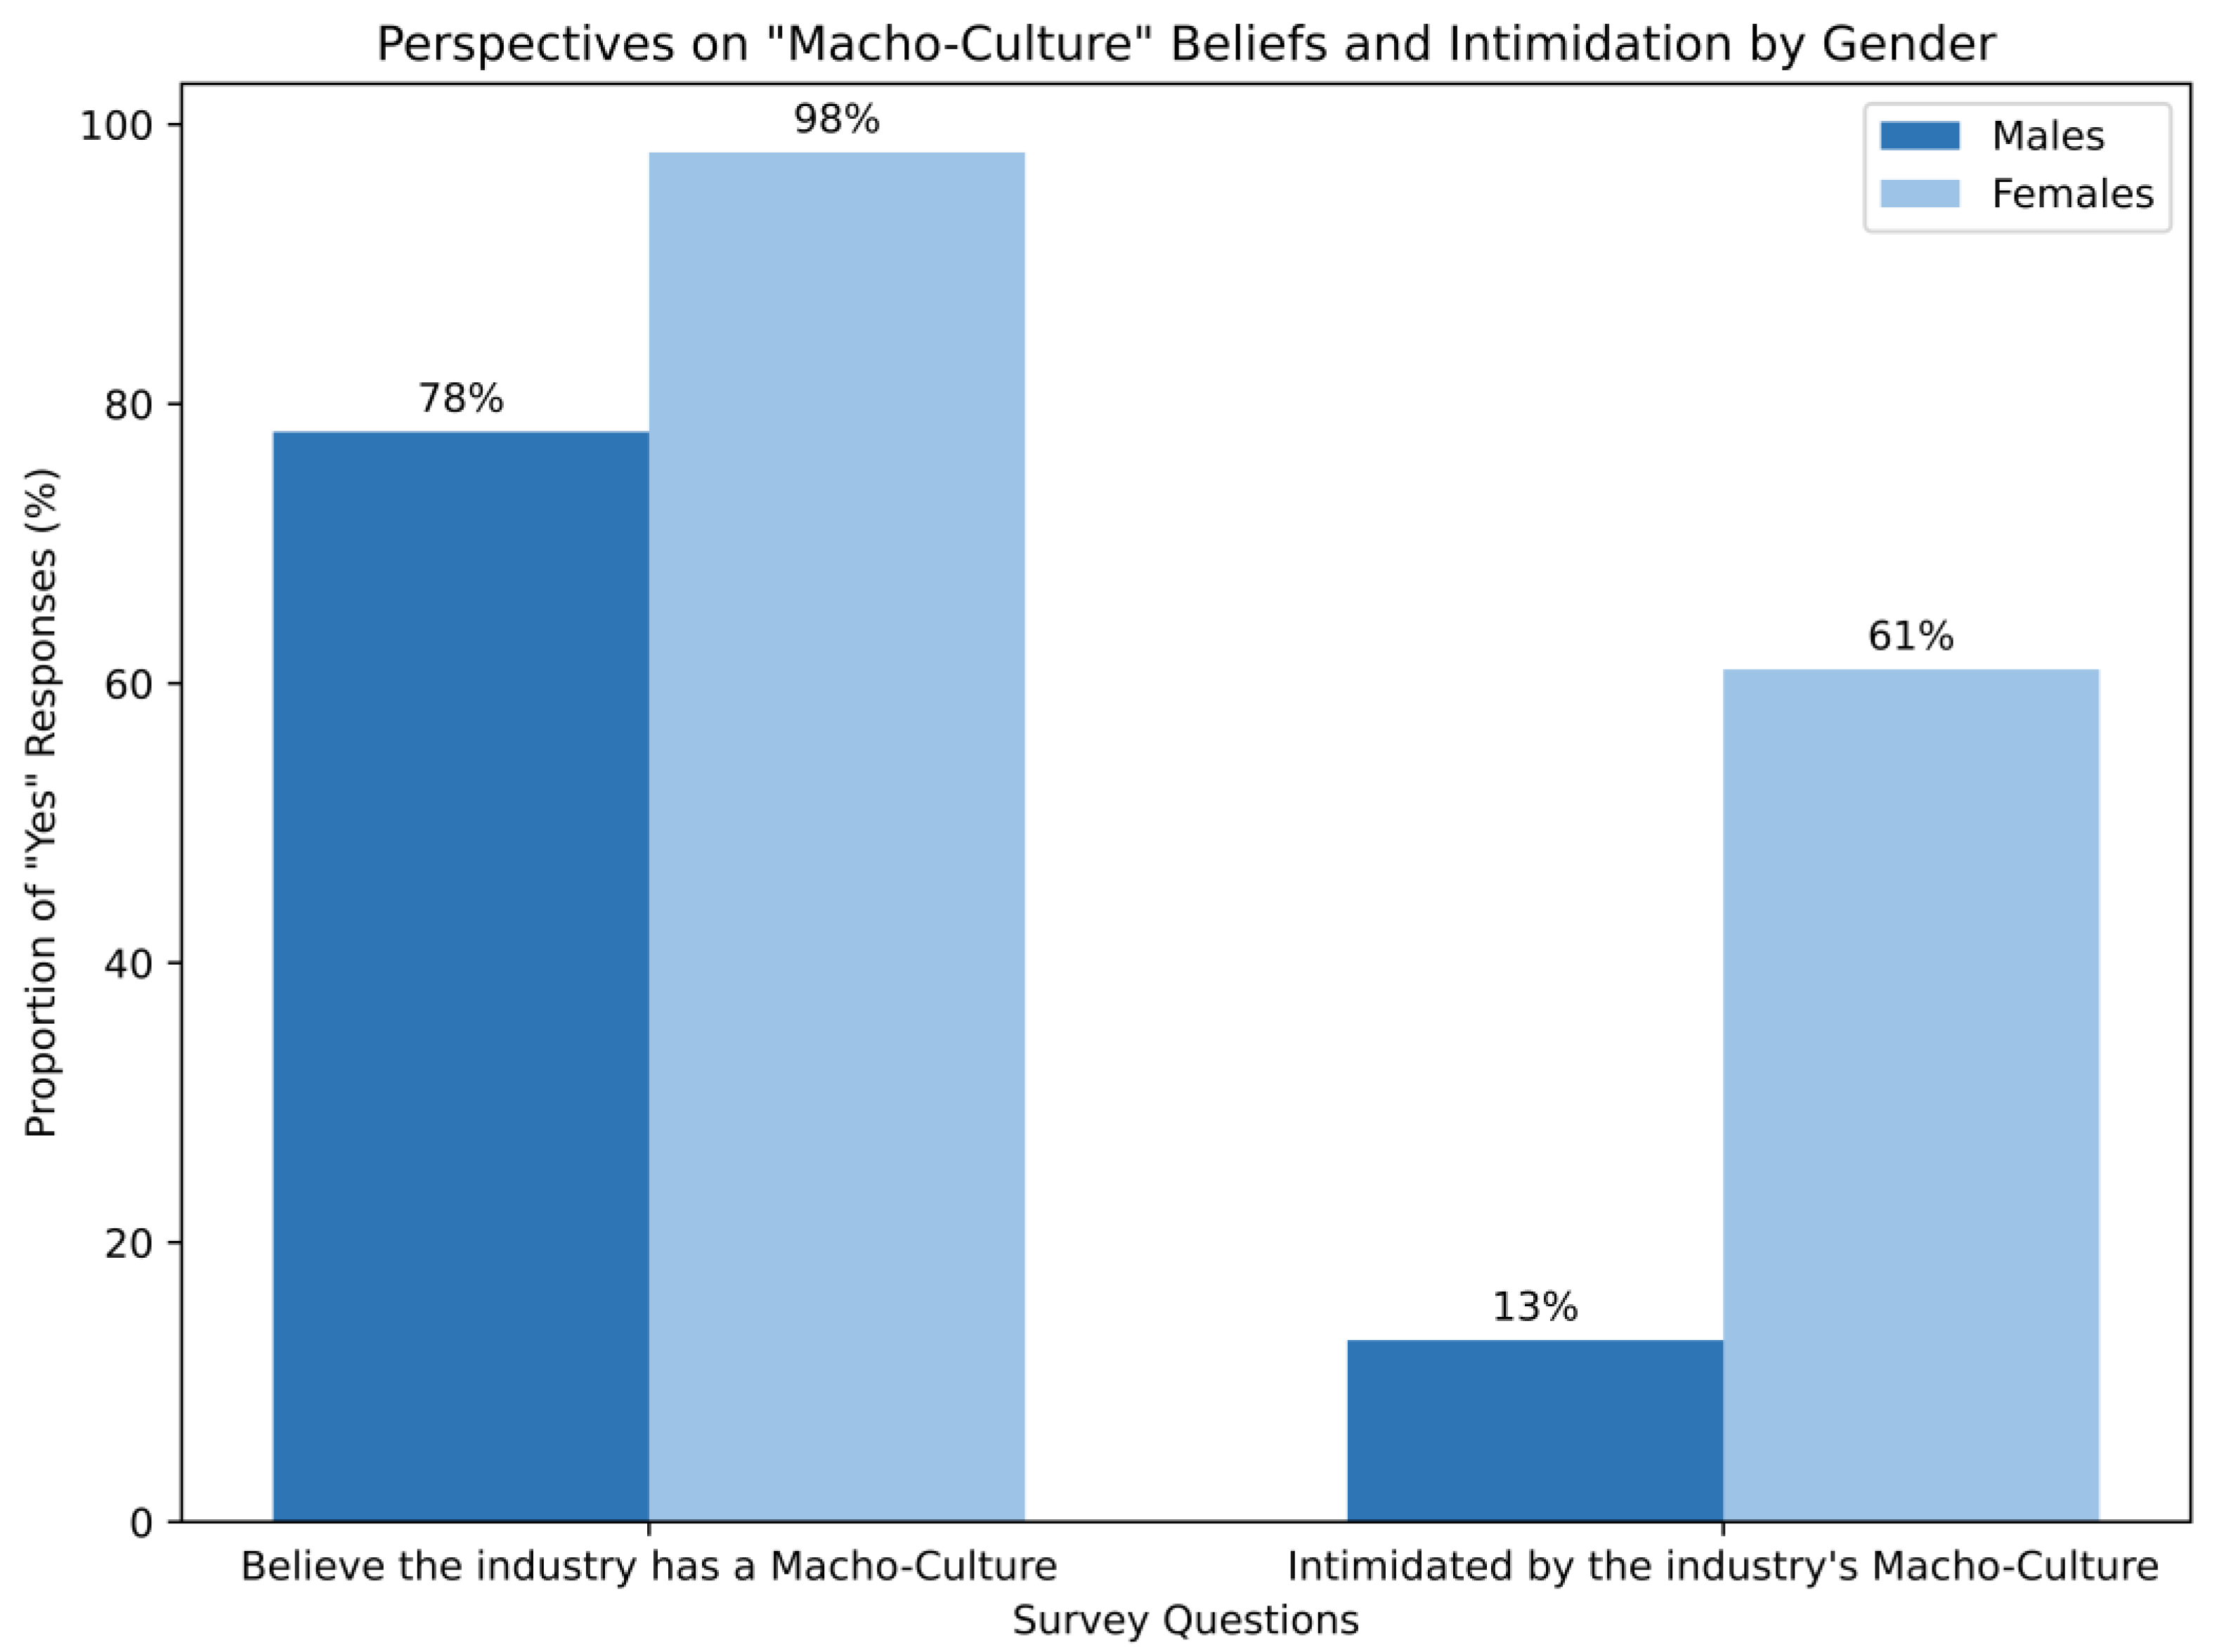
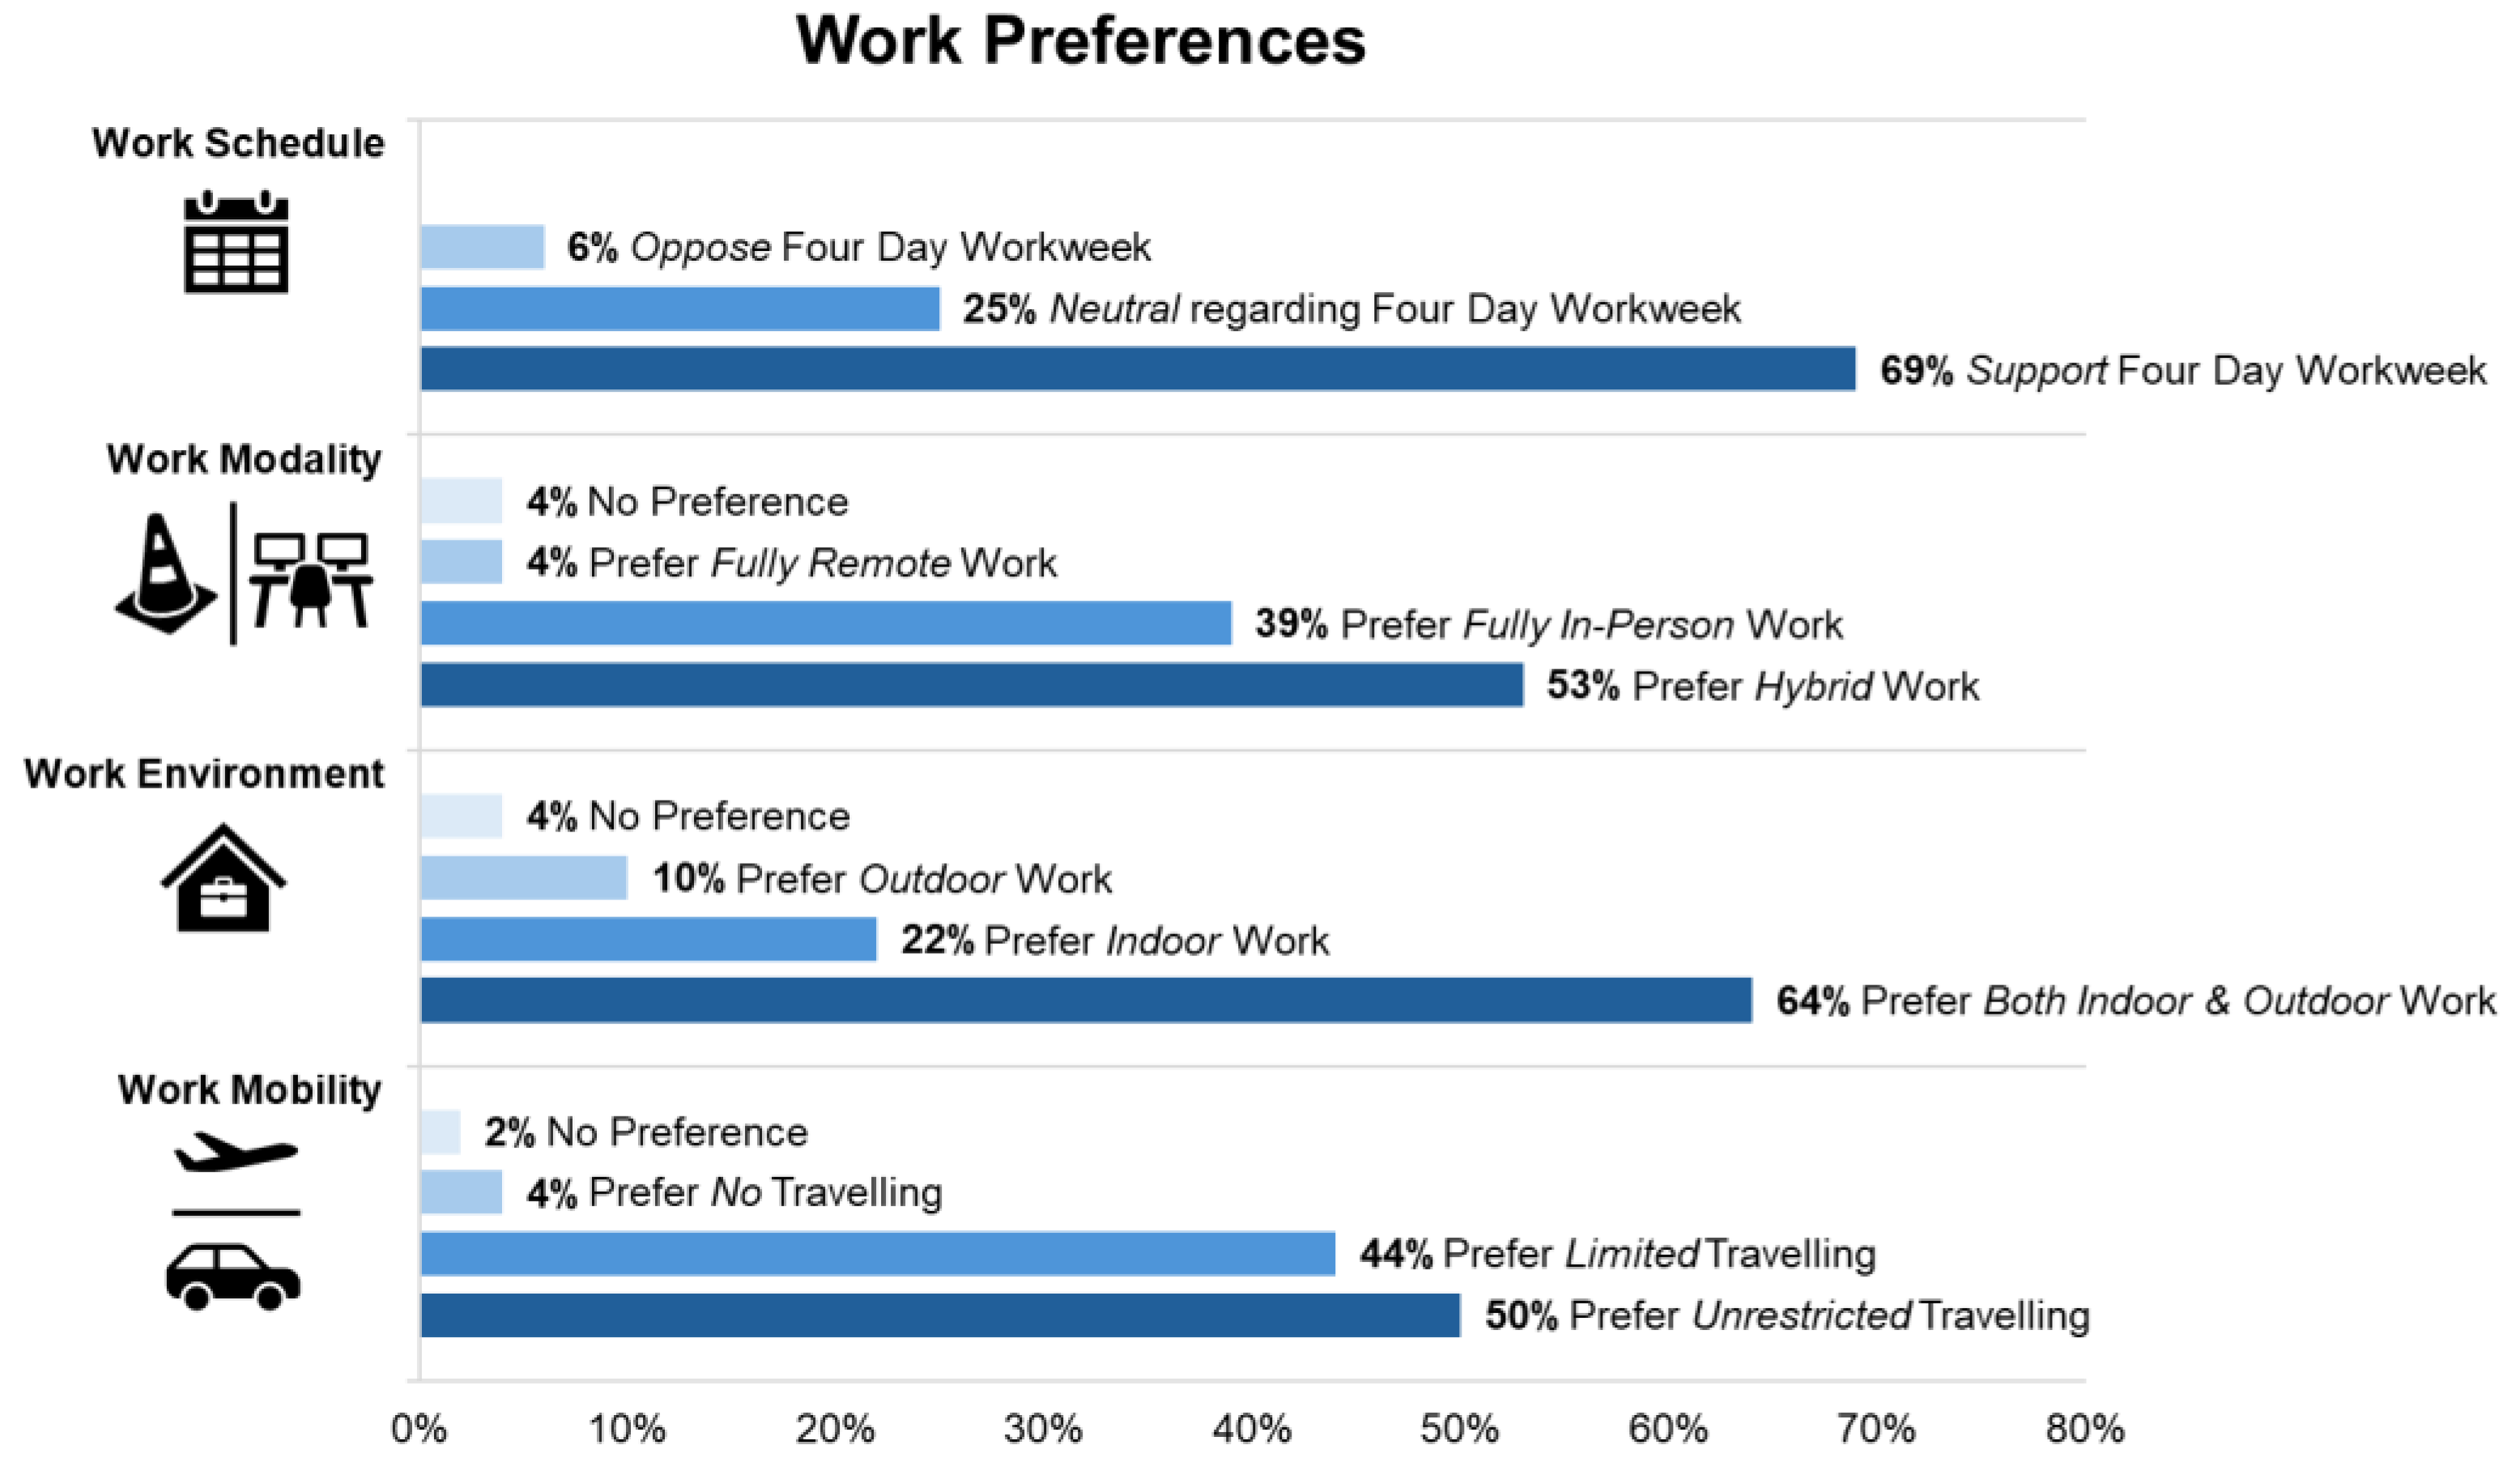
Disclaimer/Publisher’s Note: The statements, opinions and data contained in all publications are solely those of the individual author(s) and contributor(s) and not of MDPI and/or the editor(s). MDPI and/or the editor(s) disclaim responsibility for any injury to people or property resulting from any ideas, methods, instructions or products referred to in the content. |
© 2025 by the authors. Licensee MDPI, Basel, Switzerland. This article is an open access article distributed under the terms and conditions of the Creative Commons Attribution (CC BY) license (https://creativecommons.org/licenses/by/4.0/).