Article

Experimental Investigation and Analysis of the Influence of Depth and Moisture Content on the Relationship Between Subgrade California Bearing Ratio Tests and Cone Penetration Tests for Pavement Design

by
Ricardo Moffat
1,*,
Felipe Faundez
2 and
Felipe A. Villalobos
3
1
School of Civil Engineering, Universidad Adolfo Ibáñez, Santiago 7941169, Chile
2
RyV Engineers, Santiago 7790821, Chile
3
School of Civil Engineering, Universidad Católica de la Santísima Concepción, Concepción 4090541, Chile
*
Author to whom correspondence should be addressed.
Buildings 2025, 15(3), 345; https://doi.org/10.3390/buildings15030345
Submission received: 2 December 2024 / Revised: 15 January 2025 / Accepted: 17 January 2025 / Published: 23 January 2025

Abstract

:
Evaluation of soil properties in highway design is an important but time-consuming task that does not always provide the necessary information to detect issues associated with changes in soil properties along the road project. California Bearing Ratio (CBR) tests are commonly used to identify soil properties and as an input in pavement design; however, it could be considered a slow test and, therefore, not always performed to the extent that it may be desired on the field. A comparison between CPT and CBR is performed in this work to obtain a correlation between them to be used in design. The effects of moisture content are also investigated in CPT and CBR to determine which conditions should be tested to obtain representative or design conditions for the pavement. A good correlation is found between CPT tip resistance and in situ CBR. It is observed that CBR and cone tip resistance change significantly for moisture contents up to 30 to 40%. It was found that tip resistance should be evaluated at a depth of 20 cm inside the subgrade to estimate adequate CBR values.

1. Introduction

Engineers have always had to choose the most appropriate tool to evaluate the strength and stiffness of soils. Especially in highway design, it is frequently necessary to locate a new road over poor soils and to perform the design and construction every year faster than before. For these reasons, today, it is more important than ever to establish quick and affordable tests to determine the soil properties where these projects are being constructed.
The current pavement design process involves several steps to ensure an adequate and cost-effective pavement structure. This process requires traffic analysis to anticipate loads, evaluation of subgrade properties, pavement type selection, structural design, and drainage design [1]. Subgrade evaluation consists of assessing the geotechnical properties, including the strength of the subgrade soil. Soil exploration and laboratory tests are conducted with this objective. California Bearing Ratio CBR testing is commonly used to determine subgrade soils’ strength and load-bearing capacity. CBR testing can be performed in soils reconstituted in the laboratory or the field. In the laboratory, a soil sample is reconstituted in a cylindrical mold and is subject to a standardized load. The load is applied, and the CBR piston’s displacement is measured simultaneously. CBR is the calculated stress penetration curve using corrected stress values from this curve at 0.1 and 0.2 in (2.54 and 5.08 mm) penetration and dividing these stresses by standard stresses of (6.9 and 10.3 MPa). These standard stresses refer to the required load penetrating a standard crushed stone material. This ratio is multiplied by 100 to express the CBR as a percentage. A similar process is performed on the field, but the CBR piston with the load is applied directly to the intact soil.
The suitability of natural soil at the construction site plays a crucial role in pavement design, with the choice between asphalt and concrete pavements guiding the approach. Evaluation of the load capacity of the soil at the subgrade is a crucial aspect of pavement design. In situ evaluation is always preferred as it keeps the soil properties intact. However, it is also known that moisture content changes over time, and it must be considered the worst-case scenario for the evaluation of pavement design.
Asphalt pavement design may employ either empirical methods or mechanistic-empirical methods. Practical methods often rely on the California Bearing Ratio (CBR) value, where charts depict the necessary pavement thickness concerning soil strength determined by CBR testing. These tests are typically conducted under the most challenging conditions anticipated for pavement performance, as discussed in [1]. Another approach, the American Association of State Highway and Transportation Officials method [2], is based on comprehensive road tests involving various pavement sections subjected to trucks with varying loads and axles until failure occurs. Resilient modulus (Mr) is a critical parameter in this method, often derived from CBR values obtained through laboratory or field CBR tests.
In contrast, mechanistic-empirical methods involve comparing predicted traffic loads with allowable loads. Material properties such as Elastic Modulus (E) and Poisson’s Ratio (μ) are considered, and these can be determined through in situ loading plate tests or, in some cases, inferred from CBR testing as illustrated in [3].
Similarly, concrete pavement structural design, as outlined in [2], draws from the AASHTO road test experience. The contribution of subgrade soil is assessed using the effective modulus of subgrade reaction (k), which can be determined from the resilient modulus (Mr). This value of k is then corrected by subbase type and thickness, loss of support due to erosion, and proximity to rigid foundation or bedrock and adjusted to the seasonally annual average k-value. There is no direct equation between CBR and Mr due to their different nature and the many factors that influence them. However, empirical correlations have been established to estimate Mr from CBR tests. However, they tend to be material-specific and not universally applicable; see references [4,5].
CBR values, derived from testing, play a pivotal role in pavement design, specifically in establishing the appropriate thickness and types of pavement layers required to support anticipated traffic loads. These CBR values are a crucial reference point for deciding layer thickness, material characteristics, and compaction requirements. This information is instrumental in distributing loads effectively and preventing excessive deformation or pavement failure.
In situ CBR testing entails several key steps, including site preparation, setting up the test apparatus, potential water saturation (if needed), and the controlled load application at a rate specified by testing ASTM International standards or project requirements [6]. The speed of this process depends on various factors, including the project’s nature, size, and the variability of subgrade conditions. In parking lots, CBR tests are typically conducted at intervals ranging from 15 to 30 m. On highways, CBR test locations are usually spaced further apart, ranging from 30 to 90 m. The spacing between test locations is influenced by the pavement design specifications for the project, local regulations or guidelines, and budget and schedule considerations. Consequently, although evaluating subgrade properties or examining the characteristics of base and subbase layers is essential, performing this type of in situ test can be time-consuming and costly for lengthy highway projects. As a result, only a limited number of road authorities utilize strength tests like this to assess road subgrades. Therefore, there has been a longstanding pursuit in pavement design and geotechnical practice to find faster and more cost-effective methods, as pointed out by [7].
It was evident at the time of [7] that any tool employed to measure stability should adhere to specific criteria:
(a) It should provide a straightforward and quick method for assessing the in situ strength of materials. (b) It should be suitable for a wide range of materials. (c) It should have a sound theoretical foundation. (d) It should be substantiated by practical experience.
Under this pursuit, several substitutes and alternatives to in situ CBR testing offer the potential for greater economy and speed. Some of these alternatives include:
Laboratory CBR Testing: When representative soil samples can be obtained, laboratory CBR testing can be performed. This method can provide CBR values without the need for extensive in situ testing. It could be difficult or even impossible to obtain representative samples of natural soil to be tested in the laboratory.
Plate Load Test: Although it is an in situ test, it can be used to determine the subgrade modulus, which is valuable for designing flexible pavements. While it can be time-consuming, it offers specific insights into subgrade behavior.
Dynamic Cone Penetrometer (DCP): The DCP is a portable device that measures the penetration resistance of subgrade soil. Correlations exist between DCP measurements and CBR values (for example, [8,9]). This test is faster and more cost-effective, making it suitable for preliminary assessments of subgrade strength.
Falling Weight Deflectometer (FWD): The FWD measures the deflection response of a pavement under dynamic loading. It provides valuable data for assessing pavement structural integrity.
Non-Destructive Testing (NDT) Techniques: NDT methods like Ground Penetration Radar (GPR), seismic methods, and electrical resistivity are noninvasive techniques that can assess large volumes of soil without causing damage. However, their accuracy may not be as high as that of traditional testing methods.
These alternatives offer various advantages depending on the project’s requirements, site conditions, and budget constraints. Selecting the most appropriate testing method often involves considering factors such as accuracy, cost, speed, and the specific information needed for the pavement design.
In particular, penetrometers have evolved from simple devices to sophisticated electrical devices that simultaneously measure data that can represent or deduce soil behavior parameters. A penetrometer history began in France in 1846 with a method developed by Collin using a Vicat-type needle of 1 mm in diameter to estimate the cohesion of different clays. Many other dynamic penetrometers were proposed over the years, such as the Swedish railroad’s method (1917), the Danish or Swedish pocket penetrometer (1931), and the Geonor cone apparatus (1957), among others. Details of the development of cones can be found in [10].
On the other hand, the first static penetrometers consisted of pushing metal rods into the ground, as developed by Barentsen between 1932 and 1936. Initially, the penetration rate was between 0.5 to 1 cm/s according to the tentative A.S.T.M. standard for deep quasi static-cone penetration test of 1971 (According to [11]) to a current value of 2 cm/s used in CPT testing today. These have been designed to measure point resistance qc and lateral friction measured on a moveable sleeve above the cone point. In 1946 and 1948, commercially available static penetrometers of 2500 to 10,000 kg, respectively, were started to be sold (Dutch static penetrometers; see details in reference [10]).
An in situ soil testing method has been proposed as a potential replacement for CBR tests. In 1956, Scala conducted dynamic cone tests and established a correlation between the number of blows needed to penetrate the soil to 30 inches (762 mm) and the CBR value measured at a penetration depth of 0.1 inches (see Figure 1). In this test, a 20 lb. (9.07 kg) weight was dropped from 20 inches (508 mm) onto the soil surface to perform the blows. Compared to traditional CBR testing, this correlation can offer a quicker and more efficient way to assess subgrade strength. It is a valuable alternative for preliminary evaluations of soil properties in the field.
In [7], a static cone penetrometer was shown to replace CBR testing. This penetrometer featured a 60° cone with a base area of 10 cm2 (diameter 3.57 cm), similar to modern Cone Penetration Test (CPT) cones, but with a significantly lower load capacity. The relationship between the cone tip pressure and the CBR value was found to be CBR = 4.51 times the tip pressure (see Figure 2). This correlation provides a practical and efficient means of estimating CBR values based on cone penetrometer data, offering an alternative method for assessing subgrade strength in the field. [12] carried out dynamic cone tests, including the moisture content effect. However, they did not make a correlation with CBR. Previous research that correlates CPT with CBR does not provide details of what value or depth of CPT data should be used to correlate with CBR. CPT data is often measured at depth intervals of 1 to 5 cm, and therefore, the depth used to correlate CPT data and CBR may be significant, as will be studied in this work. Also, these correlations have not considered changes in the soil type or moisture content that could be important in the field.

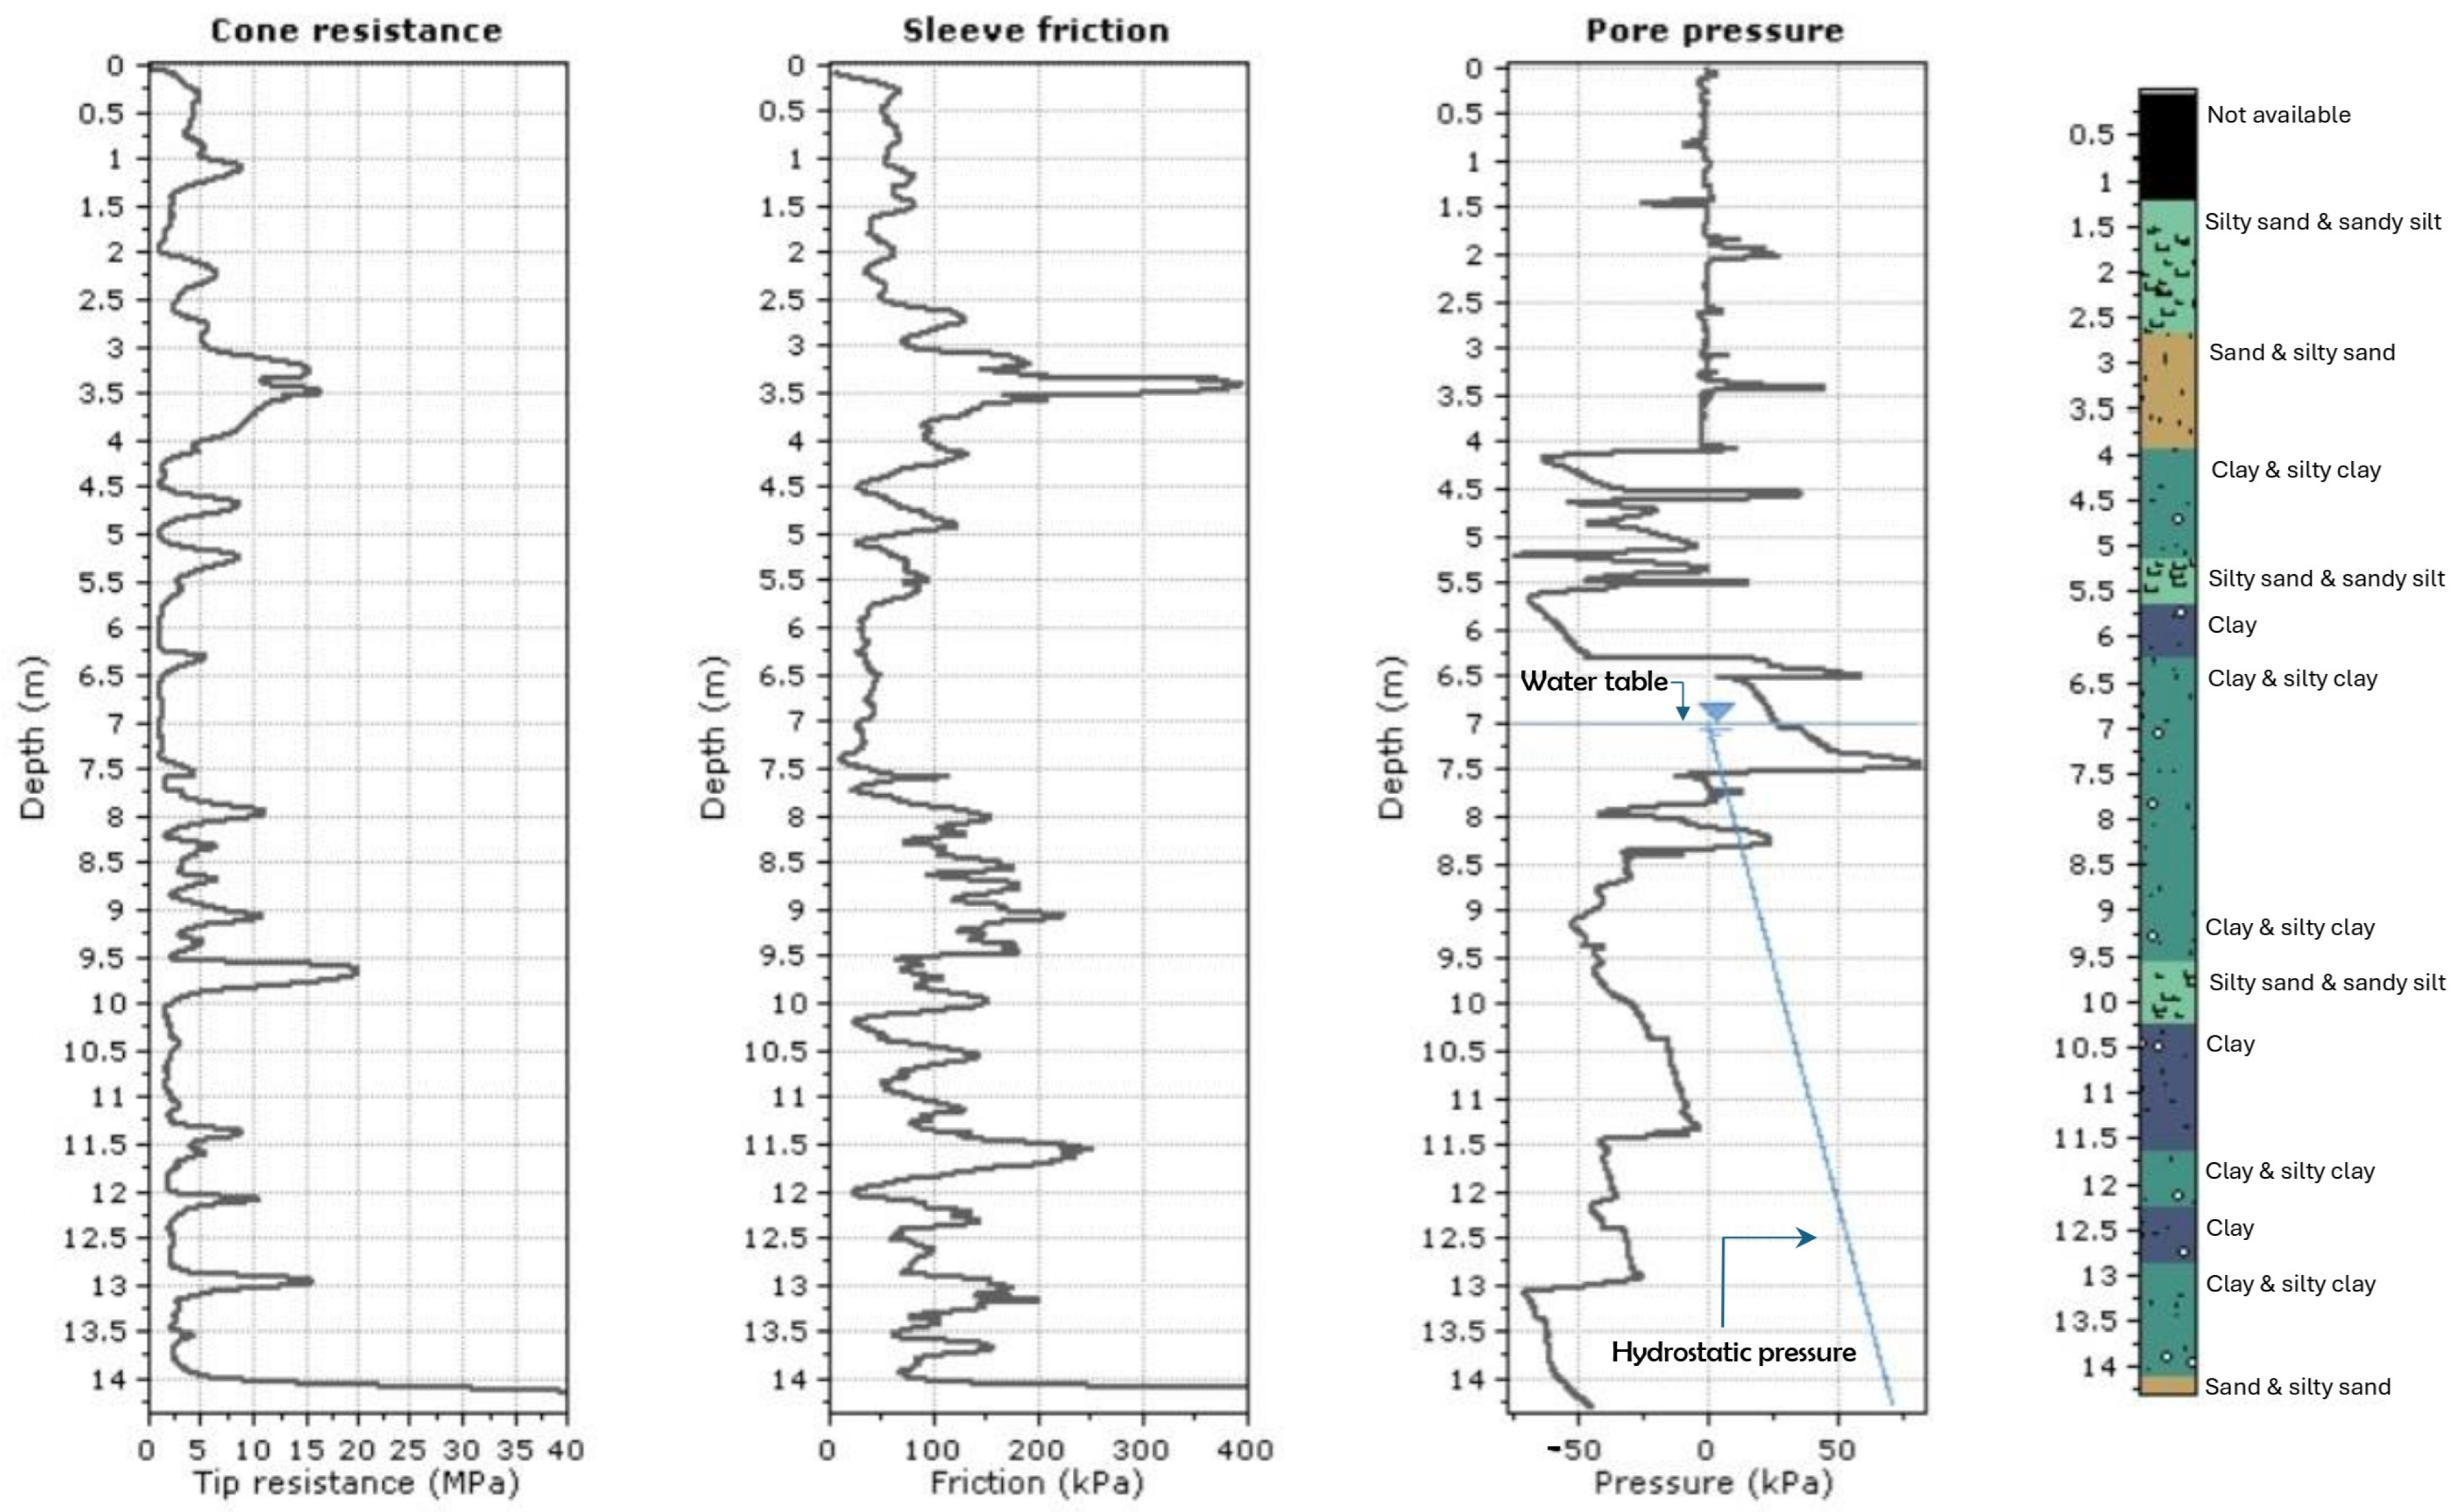
1.1. Cone Penetration Test (CPT)

CPT tests consist of a cone-shaped probe made of steel that possesses a series of sensors to measure tip, shaft, and pore water pressure (u2). The cone is attached to a series of steel rods and pushed into the ground by a hydraulic pushing system at a 2 cm/s constant speed. Data is collected from the test, typically every 2 or 5 cm of soil penetration. Critical data collected are cone tip resistance (qc), sleeve friction (fs), and pore water pressure (u2), as shown in Figure 3. These data may be used to deduce a behavior soil profile and soil properties such as strength and deformation characteristics. Some advantages of CPT are efficiency, accuracy, versatility, and minimal soil disturbance. CPT tests are often used for site investigation in geotechnical engineering projects related to foundation design, slope stability analysis, tailings design, and environmental assessments. CPT testing equipment (CPT trucks) could be expensive, which is one of the main reasons why this technology has not been fully adopted in highway design. However, in recent years, many companies have acquired this type of equipment that can also be used in mining and other projects, and therefore, this could start to be used more often in these projects. More details on CPT testing can be found at [13].

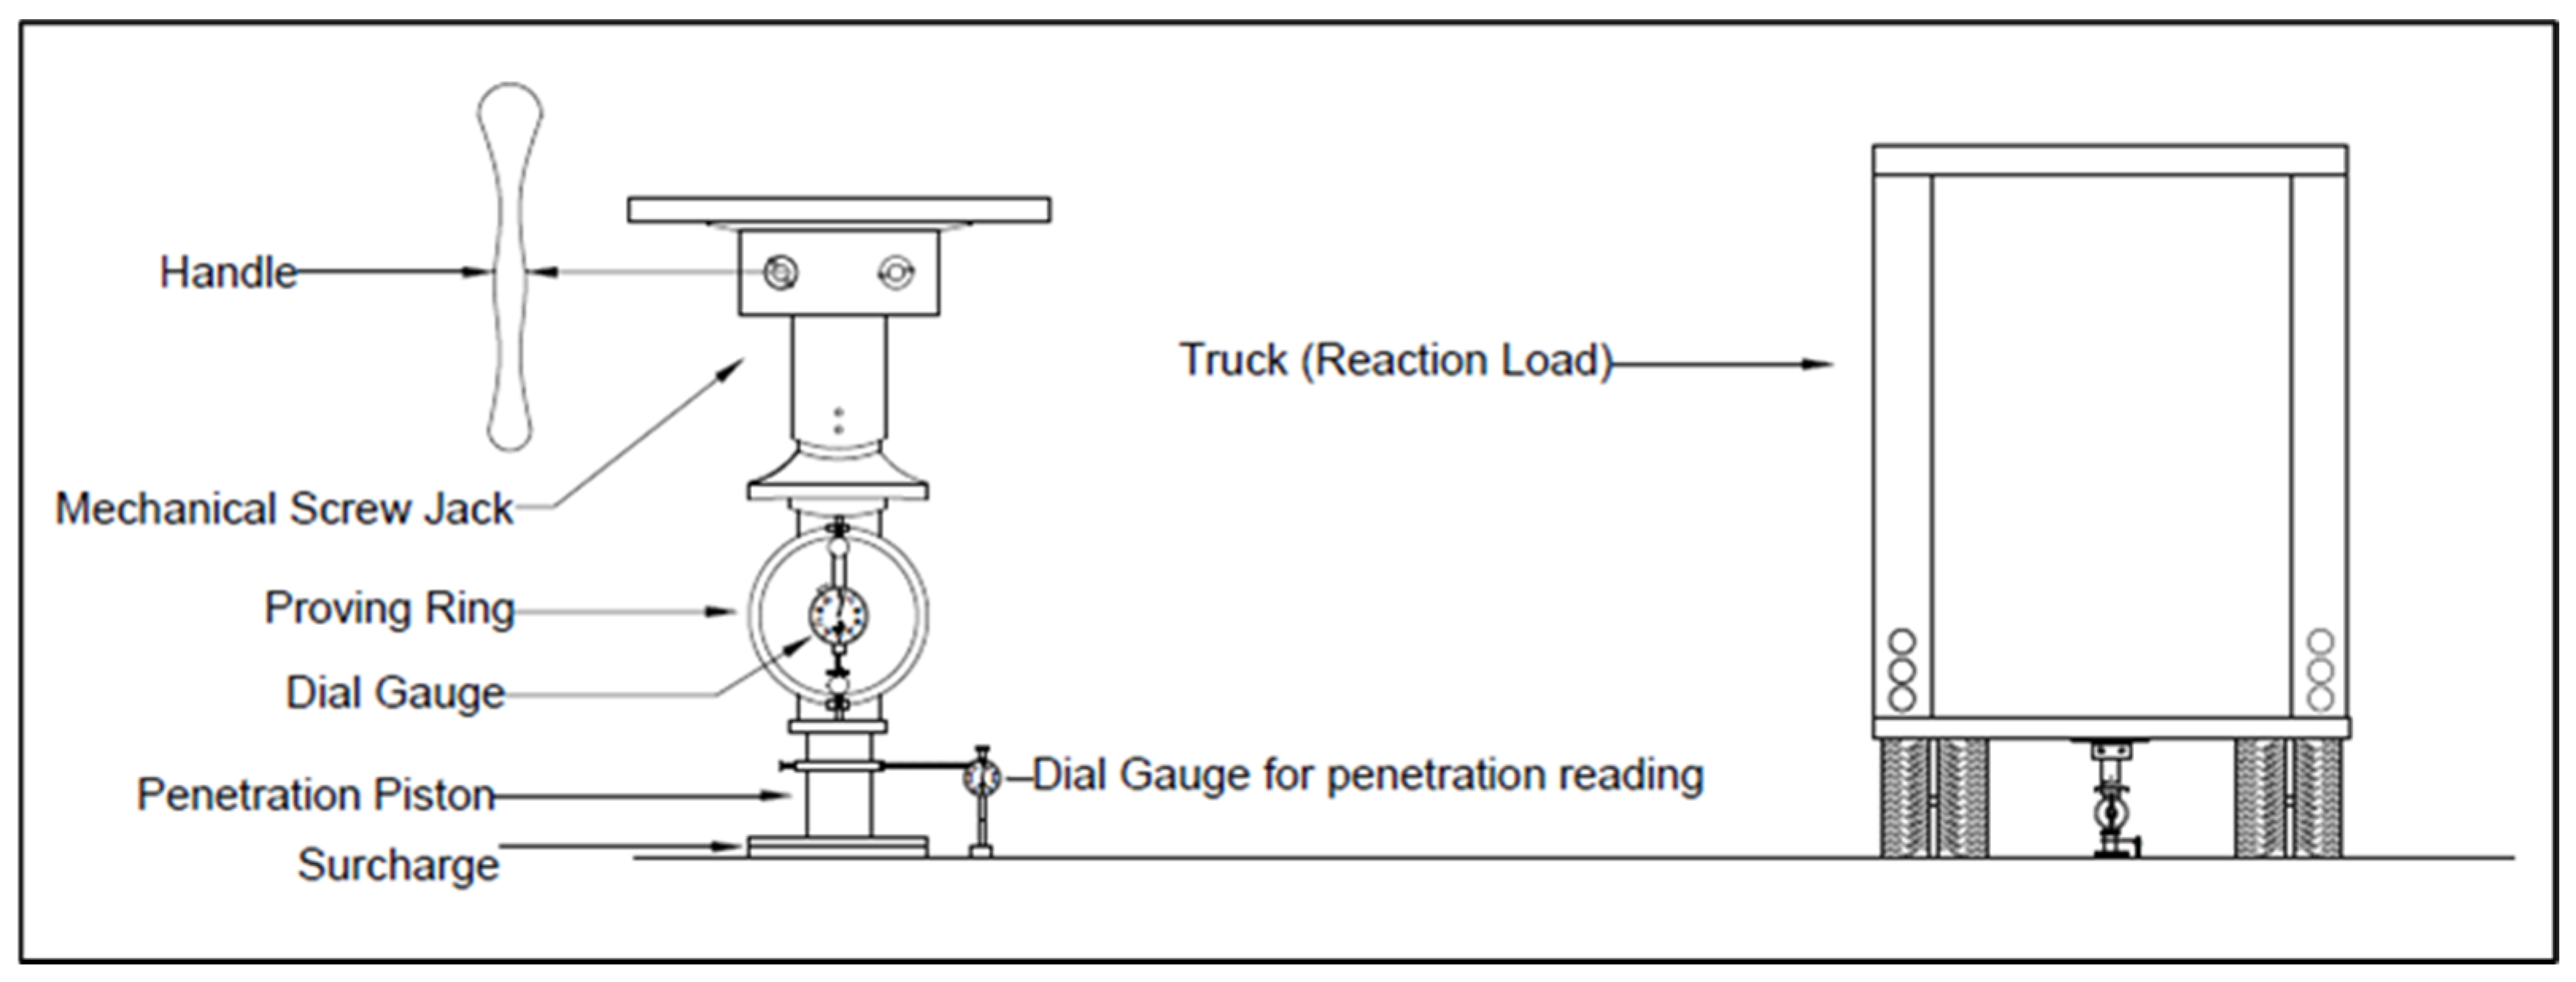
1.2. CBR Testing Details

In situ California Bearing Ratio (CBR) testing involves a CBR piston directly placed into intact soil (see Figure 4). In some instances, the soil may be saturated with water to simulate worst-case scenarios and account for potential changes in moisture content over time. The CBR piston is subjected to a controlled load at a specific rate according to standards or project requirements.
CBR testing follows ASTM International standards [6,15]. Testing curves are saved for later analysis. Stress measurements at 0.1 in. (2.54 mm) and 0.2 in. (5.08 mm) penetration are divided by the standard stresses of 6.9 MPa and 10 MPa, respectively, and then multiplied by 100 to obtain CBR ratios. The CBR ratio is typically calculated for 0.1 inches of penetration unless the CBR value for 0.2 inches is greater after repeating the test at least one more time, with the CBR at 0.2 inches being larger on both occasions.
Correlations between CPT and CBR are designed to leverage the efficiency of CPT to predict the CBR values critical for pavement design. The ability to derive CBR values from CPT data enables engineers to reduce the need for extensive laboratory or field CBR testing, particularly in large-scale projects or regions with limited testing facilities. Such correlations are valuable for providing preliminary design inputs and cost-effectively assessing the subgrade strength of pavements.

2. Materials and Methods

An in situ testing program was designed to enable CBR and CPT testing under the same soil and moisture content. A detailed description of the CBR and CPT testing is shown in Figure 3, Figure 4 and Figure 5. A CPT truck is used to react to the CBR and CPT testing. Pits 25 cm deep were excavated to remove the superficial layer of soil and to pour water for testing the soil under different moisture content conditions, as shown in Figure 5. Each one of the ten small pits (80 cm × 80 cm) is inundated with additional water to change the soil’s moisture content. At the bottom of each pit, a CBR test or CPT sounding was carried out. Results from different depths of CPT and CBR tests (depth measured from the bottom of the pit) are compared to check which one gives a better correlation between CPT tip resistance and CBR ratio. In each zone, 5 CBR and 5 CPT tests were carried out, each in one independent pit. Soil heterogeneity was not considered as CBR and CPT tests are considered sufficiently close to avoid changes in soil characteristics and parameters.
CPT testing followed the ASTM International [14] using 15 cm2 cones. Tip, sleeve, and u2 pore pressure data were obtained at every 5 cm depth. Soil samples were obtained at the bottom of each pit (depth z = 0 cm) and at depths z = 0.3 m and z = 1.1 m to determine moisture content. These samples were then taken to the laboratory for moisture content tests and soil classification.
Six different zones were tested during this research. Figure 6 shows a typical CPT-sounding profile and the corresponding soil behavior type of the soil in this zone. Different colluvial and alluvial events forming soil layers form this soil profile. Pore water pressure also shows the water table position and hydrostatic pressure. The following table summarizes all the soil samples obtained, their Atterberg limits, and soil classification according to USCS. All tested zones correspond to sedimentary soils. Table 1 summarizes classification tests from samples obtained at different zones.

3. Analyses and Discussions

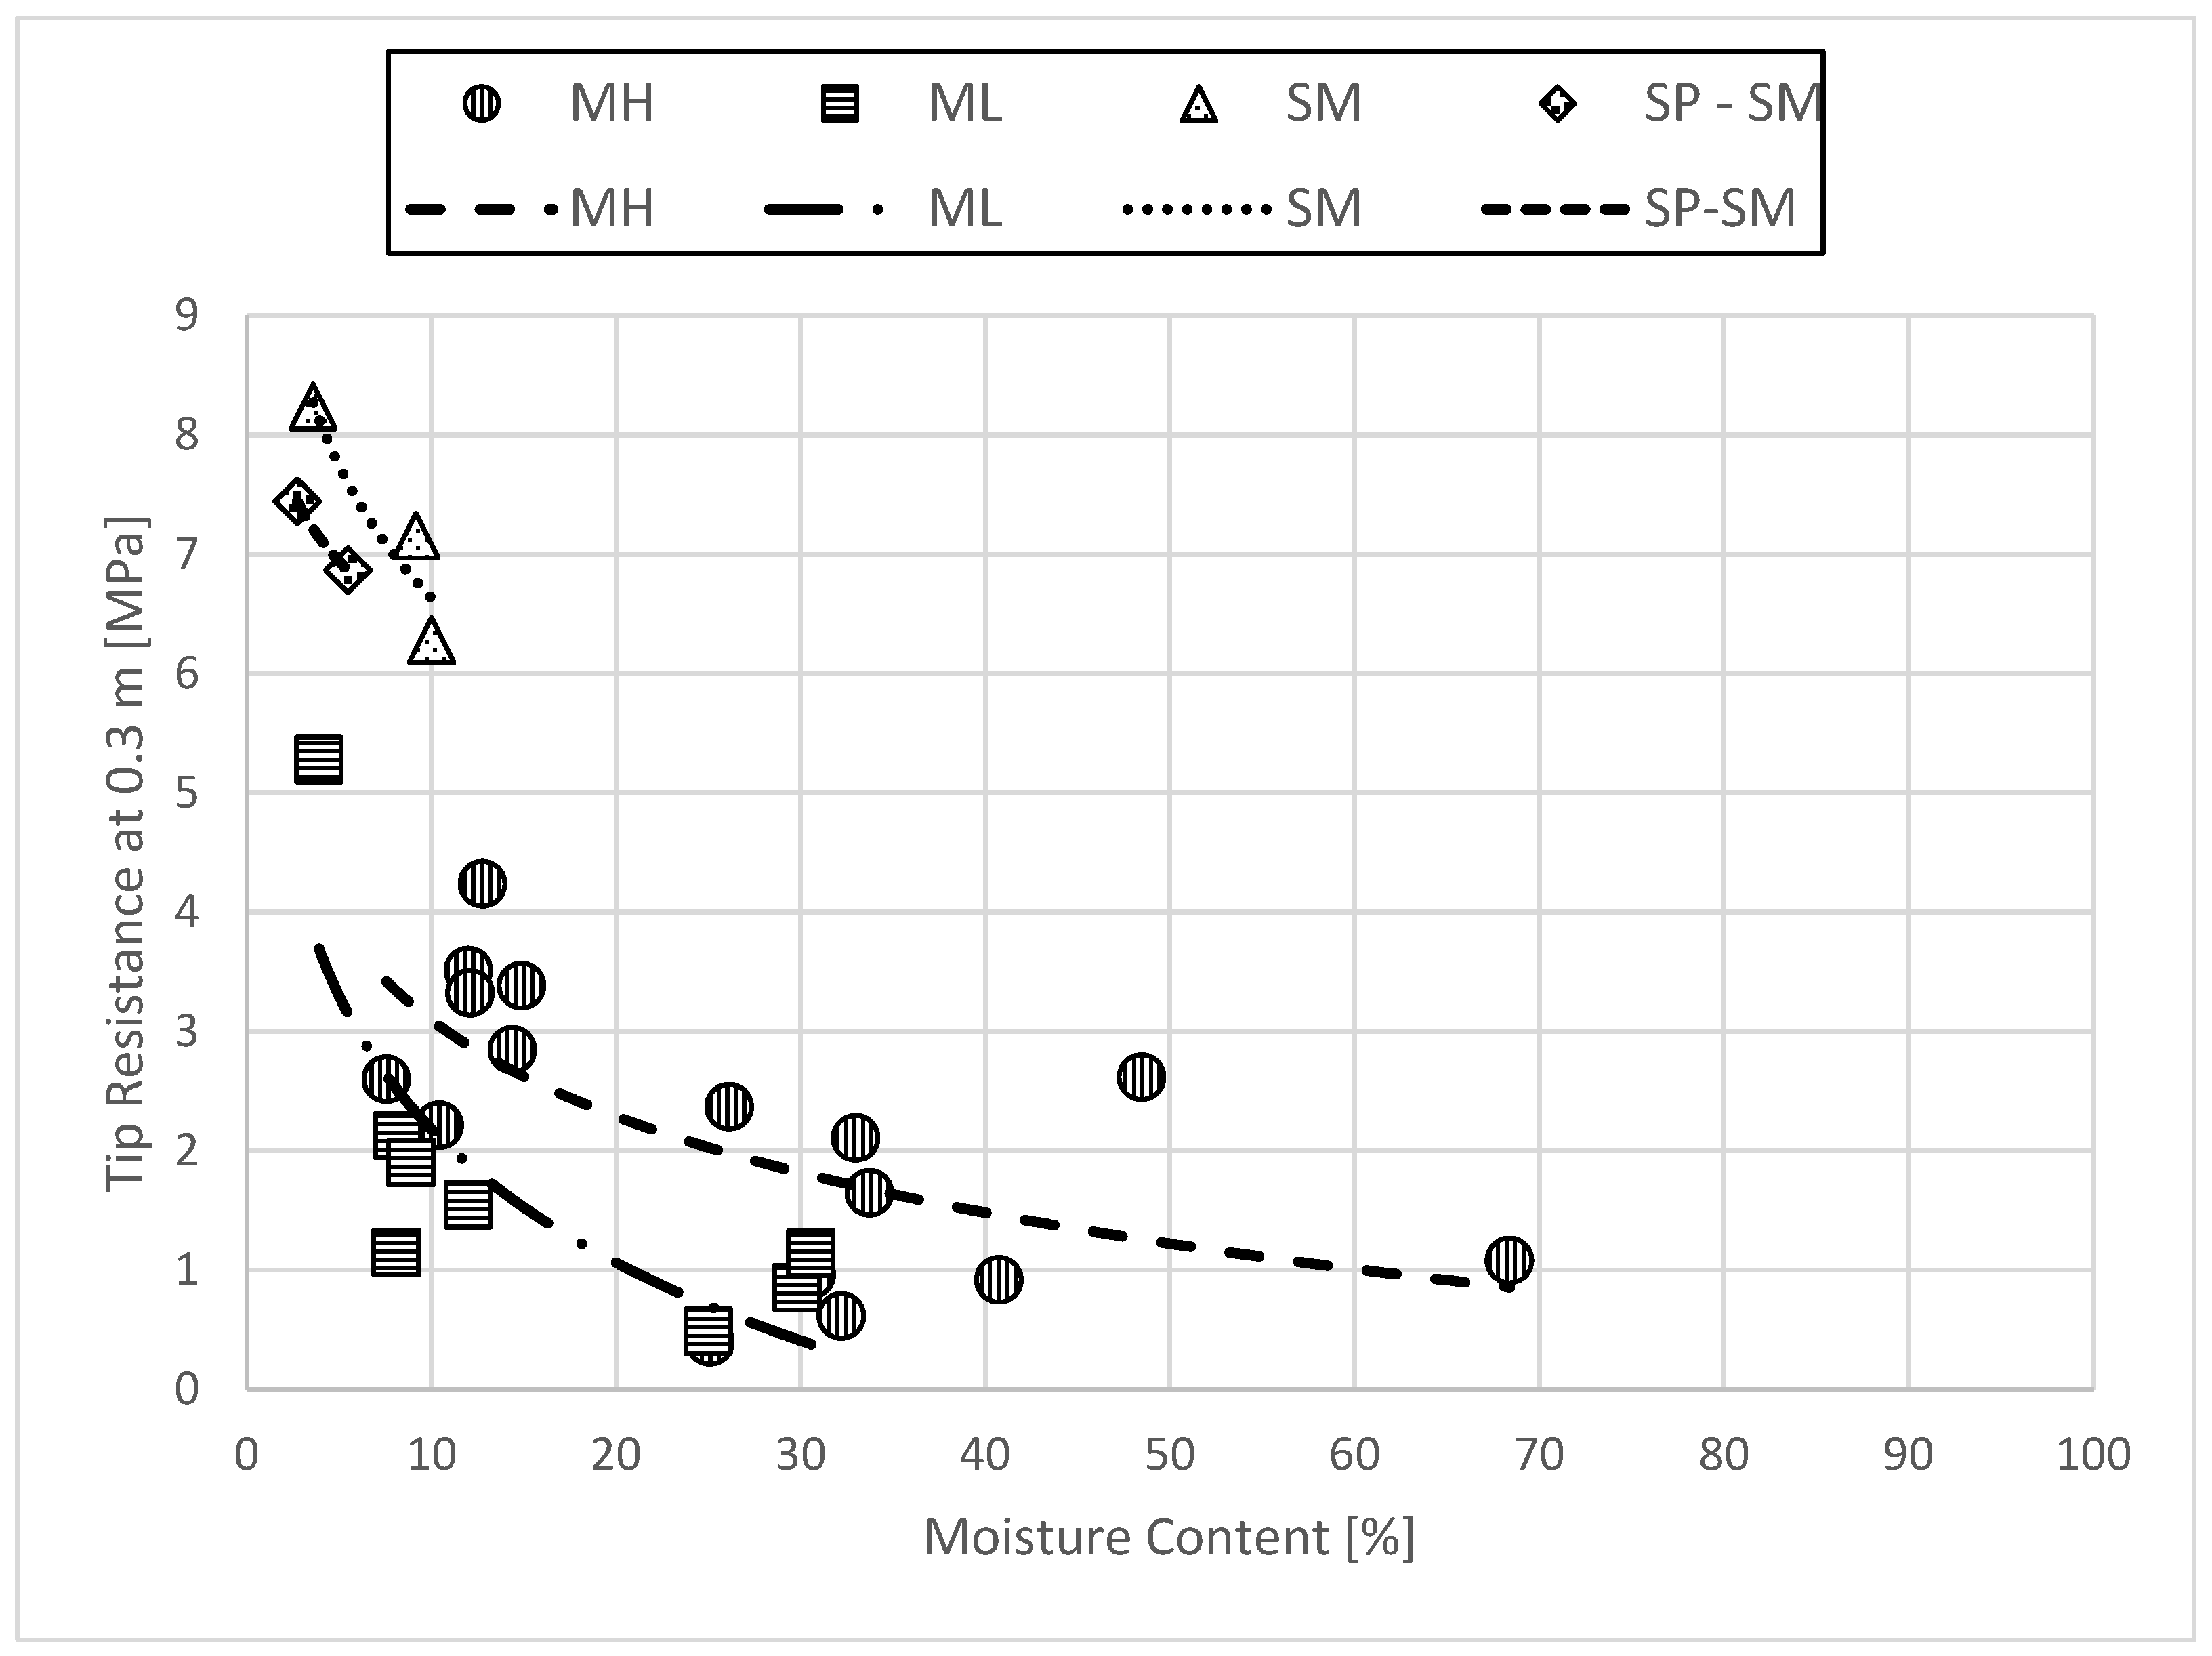
3.1. Influence of Moisture Content

The soil’s moisture content influences CBR values during specimen preparation and testing. For CBR laboratory testing, it is crucial to verify whether the moisture content during specimen reconstitution is on the dry or wet side of the optimal moisture content, as noted by [16,17]. On the other hand, when the moisture content is changed post-compaction, there is a decrease in the CBR values, as shown by [18,19]. Moisture content changes after compaction better represent the changes that will have the soil on the field due mainly to climate, such as rain or dry periods.
Changes in moisture content on a soil sample have also been found to change the matric and total suction within the soil. Figure 7 shows results from [20,21]. These changes depend on the soil type, and the effect is more substantial for lower moisture content. With a moisture content above 30% (and sometimes before), the changes in moisture content seem to have a negligible effect on suction on most types of soils. This suction effect on the soil may explain the differences in CBR values due to changes in moisture content after compaction. Soil suction is the force exerted by water held in the soil’s pores; as suction increases, it reduces the pore water pressure, which leads to an increase in the effective stress within the soil mass. Changes in effective stress are significant in geotechnical engineering because they produce changes in soil strength and other mechanical properties of the soil.
Many authors have observed the influence of moisture content or degree of saturation on CPT testing [22,23,24,25]. Seasonal variations in CPT soundings were noted by [24], where significant effects on the tip resistance and sleeve friction were observed above the water table. These effects, attributed to soil suction, can complicate the interpretation of CPT data. Similar observations were made in laboratory centrifuge tests using miniature CPT cones [25], where it was found that stress normalization due to suction does not reliably produce accurate data interpretations, highlighting the need for further investigation.
In the characterization of mine waste, particularly tailings, it has been demonstrated that cone penetration resistance depends on the soil’s degree of saturation [22,23]. For instance, ref. [22] reported that suction hardening may increase small-strain stiffness, but this effect is not captured by cone resistance measurements, which reflect large-strain behavior. Consequently, CPT measurements appear to be insensitive to the unsaturated in situ behavior of soil and may instead capture the saturated behavior once suction is removed. In unsaturated silty tailings, cone penetration resistance increased with respect to saturated values [23]. Based on these findings, it is proposed that the influence of suction on mean effective stress and suction hardening should be considered in the analysis.
This work’s in situ tests also found a decrease in CBR value depending on the in situ moisture content during testing. Additionally, from Figure 8, it is also possible to check that the degree of change in CBR value with moisture content depends on the soil type.
Variations in CBR values found during field testing also seem primarily influenced by moisture content values lower than 30%.
A similar trend to the one shown for soil suction was observed between CPT tip resistance and moisture content, as depicted in Figure 9 and Figure 10. Figure 9 illustrates the variation in tip resistance at a depth of 0.3 m, displaying its dependence on soil type. Figure 10 plots the CPT tip resistance at different depths (0.1, 0.3, and 1.1 m); other depths were studied but not shown. Later, it will be discussed what depth for CPT data works better in correlation with CBR test results.
The moisture content range measured becomes smaller with increasing depth. This is due to limitations in water and time during the surface pit inundation, preventing deeper saturation. Notably, most data for depths of 0.1 and 0.3 m corresponds to silty soils (MH and ML). At a depth of 1.1 m, most soil samples are classified as sands. Consequently, the field-measured moisture content is narrower for sandy soils than for silty soils.
Figure 10 and Figure 11 indicate a significant change in tip resistance for moisture content up to 30%. Beyond this value, changes in tip resistance become less pronounced. This suggests that both CBR and CPT tip resistance exhibit similar responses to variations in moisture content. To accurately represent the weakest field conditions, it is important that either CBR or CPT testing be conducted with moisture contents exceeding 30% unless it can be demonstrated that the soil in the field cannot reach higher moisture levels under actual conditions.
Figure 11 shows the same data displayed in Figure 10 but separates the data according to soil type instead of depth. Variation of tip resistance for the same moisture content and soil type is believed to be due to differences in soil density in heterogeneous natural deposits.
Similarly, in Figure 12, the data from Figure 11 are presented using normalized tip resistance to assess the potential impact of effective stress on the variations observed in Figure 11. Nevertheless, no significant changes are noted when comparing the two figures. Consequently, the differences observed in the tip and normalized tip resistance are primarily attributed to soil type alterations and state conditions.
Furthermore, Figure 12 illustrates the average change in Qt versus moisture content. The dotted lines show the general trend observed in the data. The data indicates that more substantial changes occur for moisture contents up to 30 to 35%. Beyond this range, no significant changes can be attributed to increased soil moisture. This is similar to what was observed previously in Figure 7 regarding soil suction and Figure 9 and Figure 10 for CBR and CPT tip resistance, respectively.
As a result, it is inferred that if moisture content measured during CPT (or CBR) testing is higher than 35%, no corrections are deemed necessary for design purposes. However, adjustments can be recommended below this threshold using the slope from the relationship between CBR, tip CPT resistance, and moisture content.
From Figure 9, Figure 10, Figure 11 and Figure 12, it is possible to see how tip resistance qc and CBR value decrease with moisture content. This decrease in qc and CBR is believed to be due to the reduction of soil suction when the moisture content increases. As the suction decreases, the effective stress of the soil will decrease, decreasing the strength of the soil. Similarly, when soil suction decreases (for example, after saturation during a rainy season), it lends to a decrease in effective stress. As a result, the strength of the soil also decreases. It is essential, therefore, in soils to evaluate whether the soil is in its worst moisture condition or saturated if expected.
Figure 9, Figure 10, Figure 11 and Figure 12 show that the effect of moisture content on qc and CBR is significant, up to about 30 to 40% of moisture content. Similarly, soil suction changes significantly up to 30 to 40% of moisture content, as shown in previous research in Figure 5.
On the other hand, CPT sleeve resistance does not show the same consistency between changes in sleeve resistance with moisture content, as shown for two depths in Figure 13 and Figure 14.

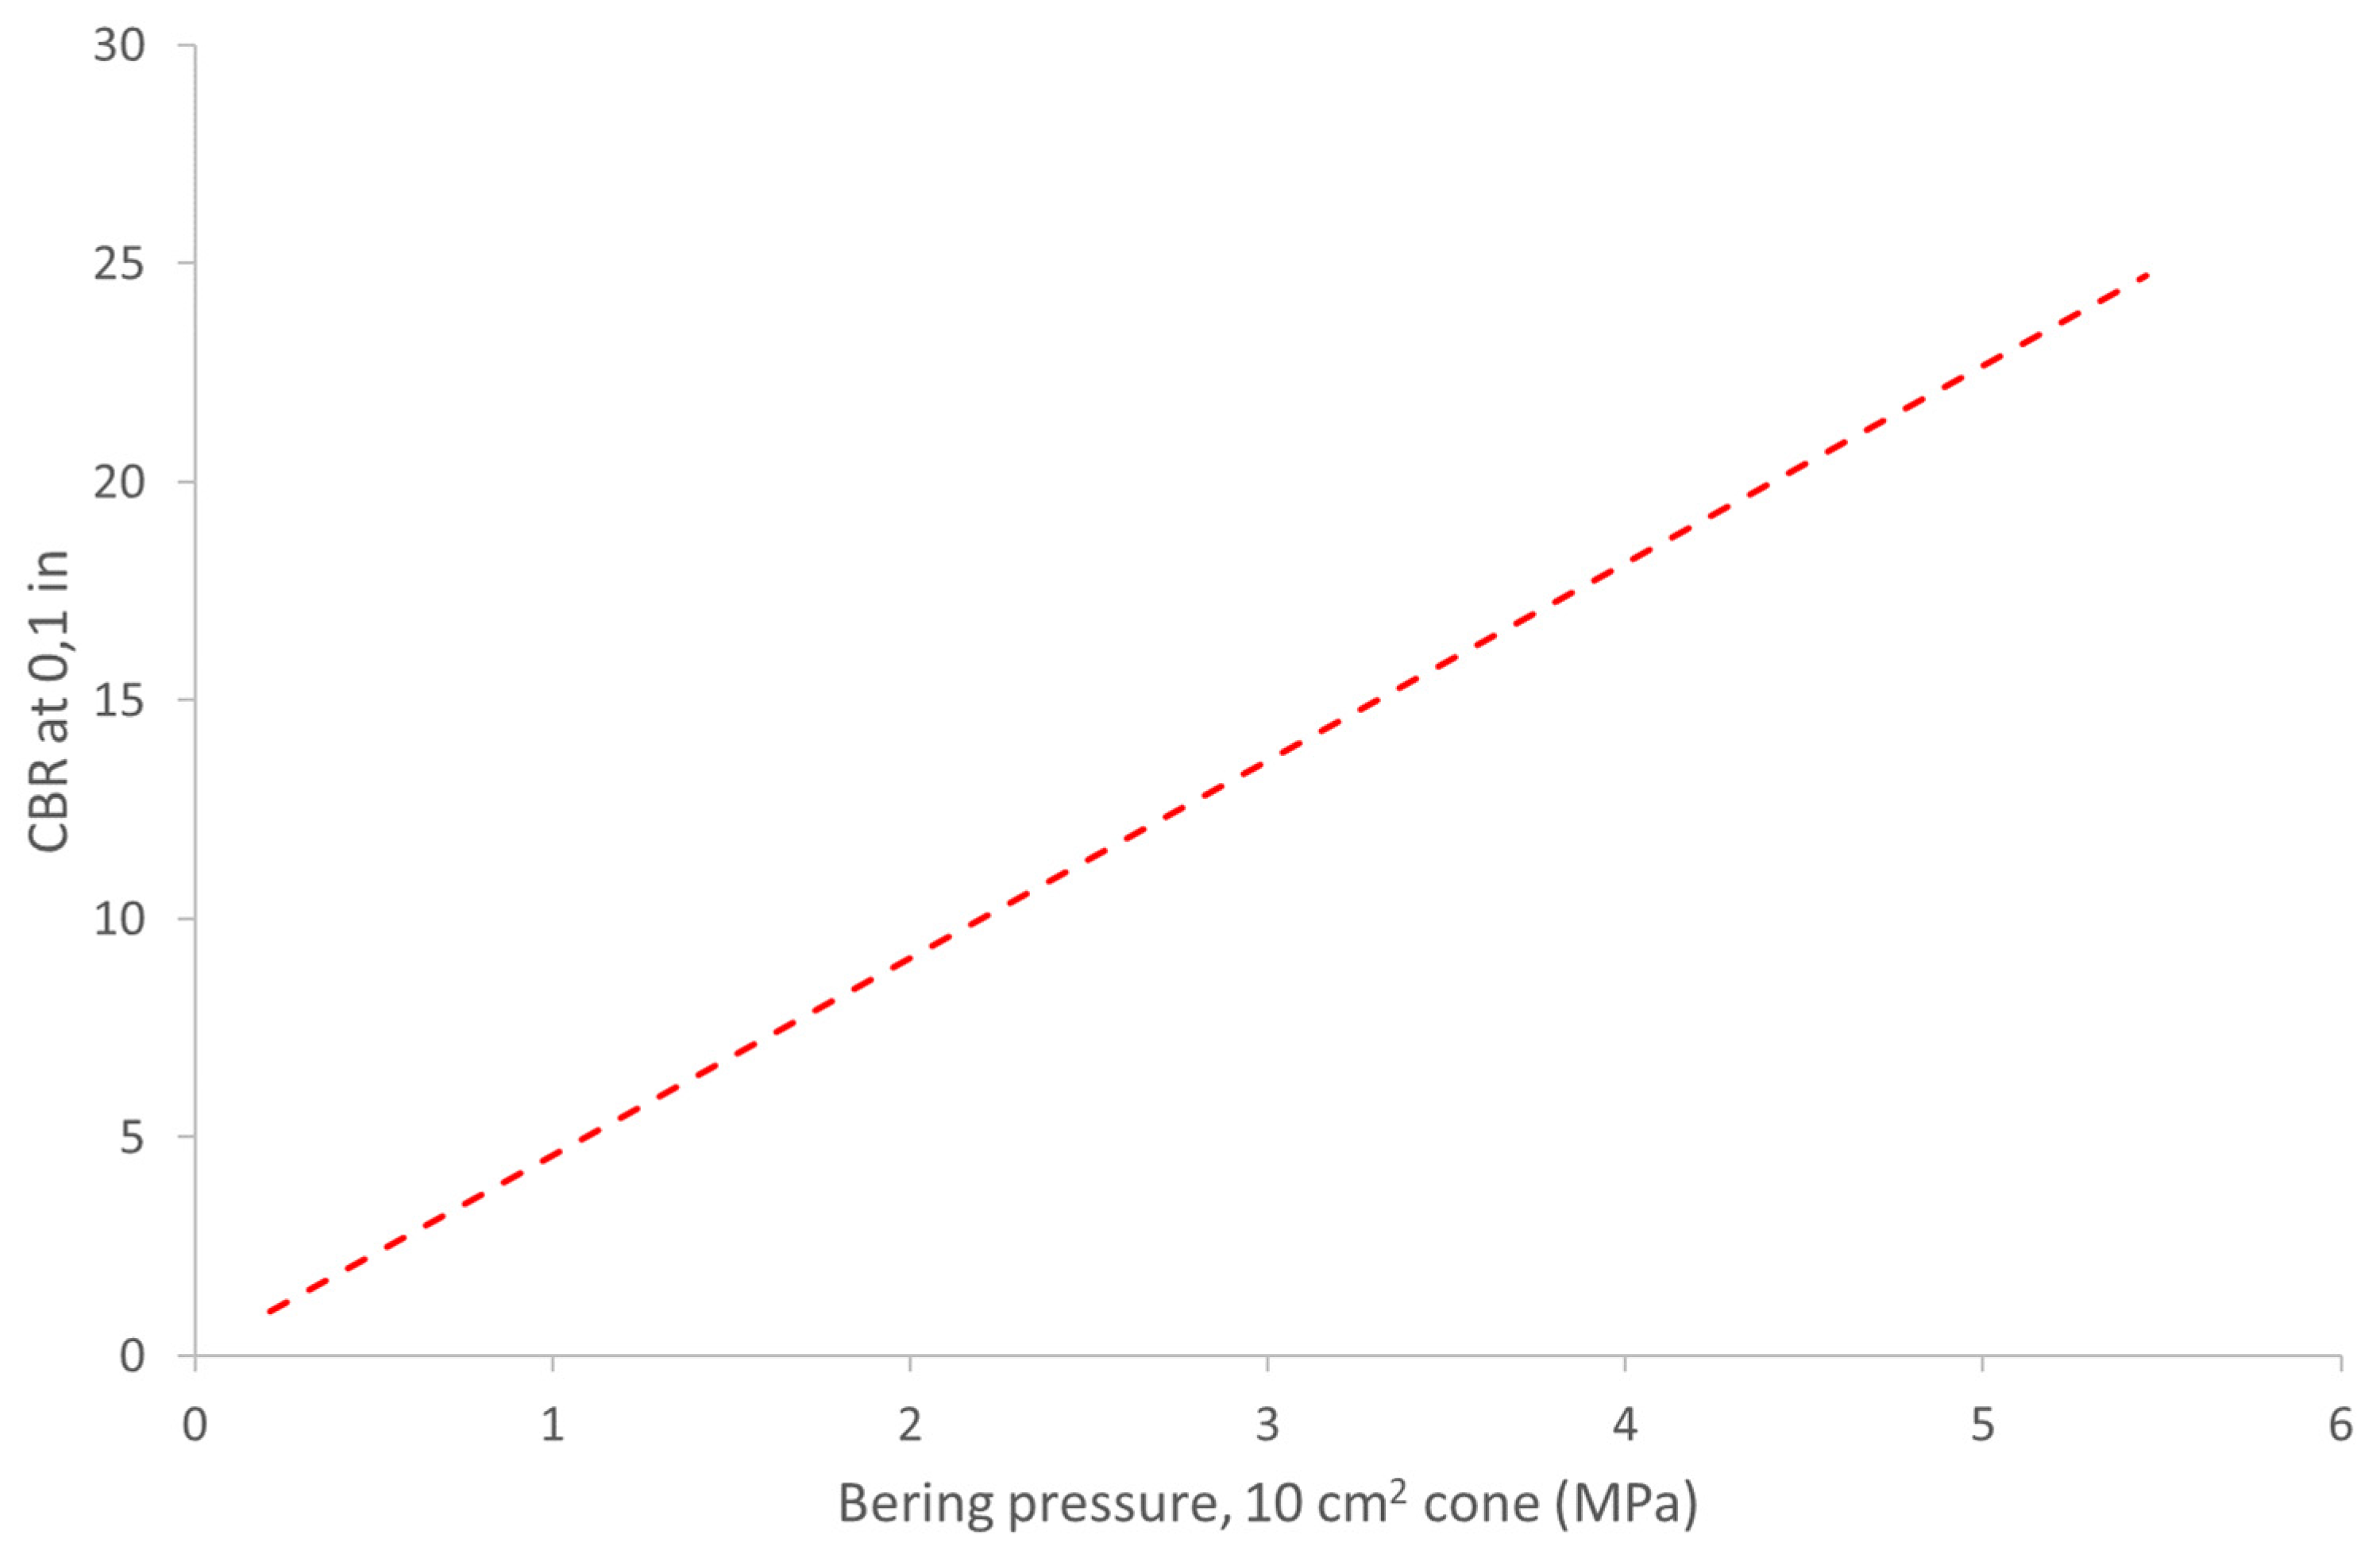
3.2. Correlation Between CPTu and CBR Test Results

The similar patterns found in the results from the in situ tests performed under different soil moisture content demonstrate that a correlation between CBR values and CPT tip resistance can be defined. The results show that this correlation remains robust across varying soil moisture content levels. Also, the correlation seems valid independently of the type of soil tested.
When trying to get a correlation between CBR and CPT tip resistance, it is essential to consider the depth at which the value of tip resistance will be measured. As CPT data is expected to be read 2 or 5 cm deep, it has to be clear which depths better correlate with CBR value. This has not been mentioned before in previous research and correlations, as the one mentioned in Scala [26,27], where CBR = 4.51 qc, may be essential to consider if CPT can be used as an appropriate CBR value. In this research, data from CPT and qc are compared for values of qc taken at 0.05, 0.1, 0.15, 0.2, 0.25, and 0.3 m of depth. Figure 15 shows different slope values between CBR and qc depending on the depth where qc is obtained from the field. The best correlation obtained was for qc at 0.2 m, which also corresponds to the lower value of the constant m in:
C B R = m · q c
According to the results, values of m vary between an approximate value of 7 and about 3.5. Still, the correlation between CBR and qc is very poor for high values of m or, in another way, if qc values are obtained at low depths such as lower than 10 cm. According to [22], a previous correlation was also found between CBR and qc, with a value of m = 4.54. However, there is no mention of the depth at which the value of qc has to be obtained from the CPT test.
Figure 16 shows the correlation between CBR and CPT tip resistance at 0.2 m depth (CPT cone tip area of 15 cm2). In this figure, all data shown in previous figures and additional data where no moisture content was measured, or soil classification was obtained to complement the data. As observed, a clear correlation between CBR and CPT tip resistance is independent of moisture content on the field. Figure 14 also shows correlations obtained from different studies [7,23], but no information about testing depth is available in any of these reports.
The correlation between CBR and CPT tip resistance offers a valuable alternative to traditional CBR testing in assessing subgrade strength. CPT provides efficiency and accuracy, and the correlation analysis supports its applicability in pavement design.
On the other hand, a good correlation was not observed between the CPT sleeve friction (fs) and the CBR value. As shown in Figure 17 for fs measured at 0.2 m, this value has no apparent correlation with CBR values. The same was observed at 0.25, 0.3, 0.35, and 0.45 m deep. Therefore, fs is ruled out as an alternative to obtaining a CBR value of the subbase soil.
The results shown in this work were obtained in natural soils. A similar study with reconstituted soils would be recommended to control possible soil variation in the horizontal and vertical direction that may occur in natural soil. Also, moisture content could be controlled more precisely in laboratory tests.

4. Summary Remarks and Conclusions

Having reliable tools to evaluate soil strength and stiffness is crucial, particularly in highway projects where in situ subgrade evaluation is essential for successful pavement design, especially in soft soils. Cone Penetration Testing (CPT) presents an attractive alternative for this purpose, as it can be performed more quickly, enabling the testing of longer stretches of soil—potentially several kilometers—within a single day.
This study reports on California Bearing Ratio (CBR) and CPT testing conducted in the field using a 20-ton truck on various soils across a range of moisture contents. Results were analyzed for six different zones, where a grid of pits was excavated and tested using both CBR and CPT. This allowed for comparison under similar conditions and the development of correlations between CPT tip resistance (qc) and CBR values.
The following specific conclusions are drawn from this on-site investigation:
  • The efficiency of CPT Testing: CPT testing is significantly faster than CBR testing. The rate of CPT testing is approximately 20 to 30 times faster than in situ CBR tests for subgrade evaluation. Testing every 100 m of highway could allow a CPT truck to test 10 to 15 km of subgrade daily.
  • CBR Dependence on Moisture Content: CBR test results show a significant dependence on moisture content up to approximately 30–40%. Beyond this range, the soil’s density or state has a more substantial influence than moisture content.
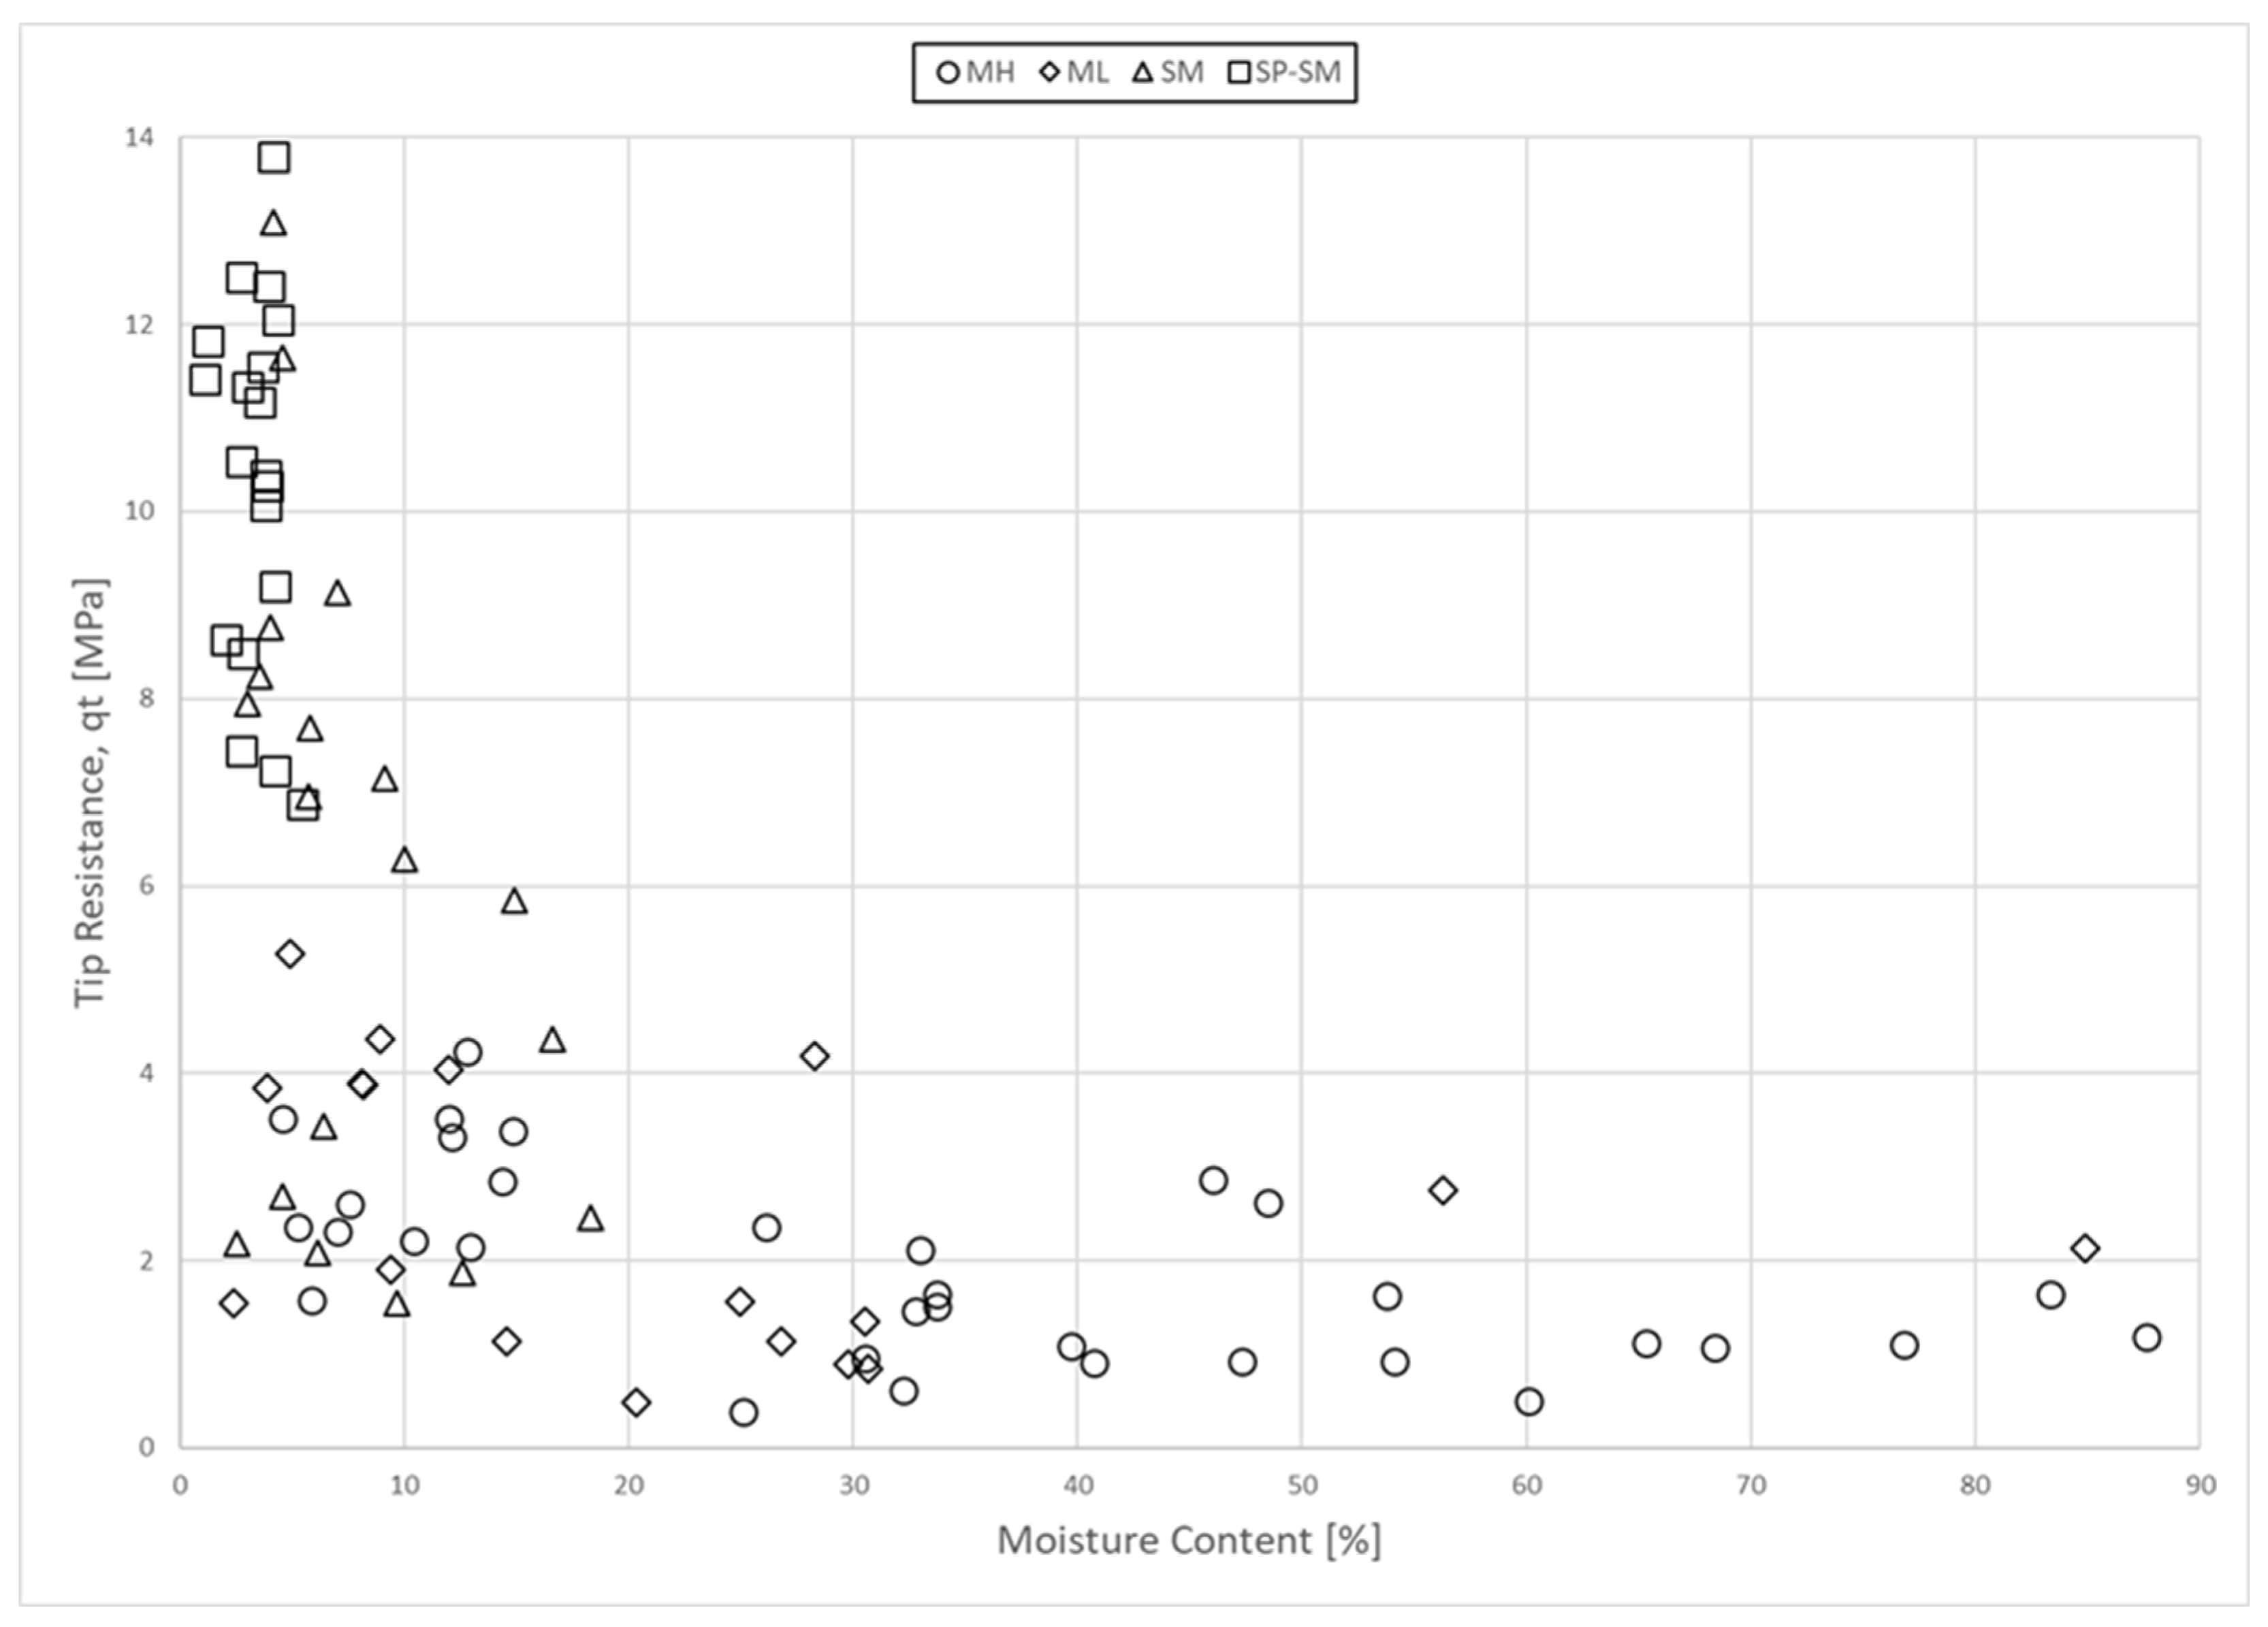
  • CPT Tip Resistance and Moisture Content: CPT tip resistance (qc) also depends on moisture content up to 30–40%. Above this range, changes in moisture content are primarily associated with variations in soil density or consolidation.
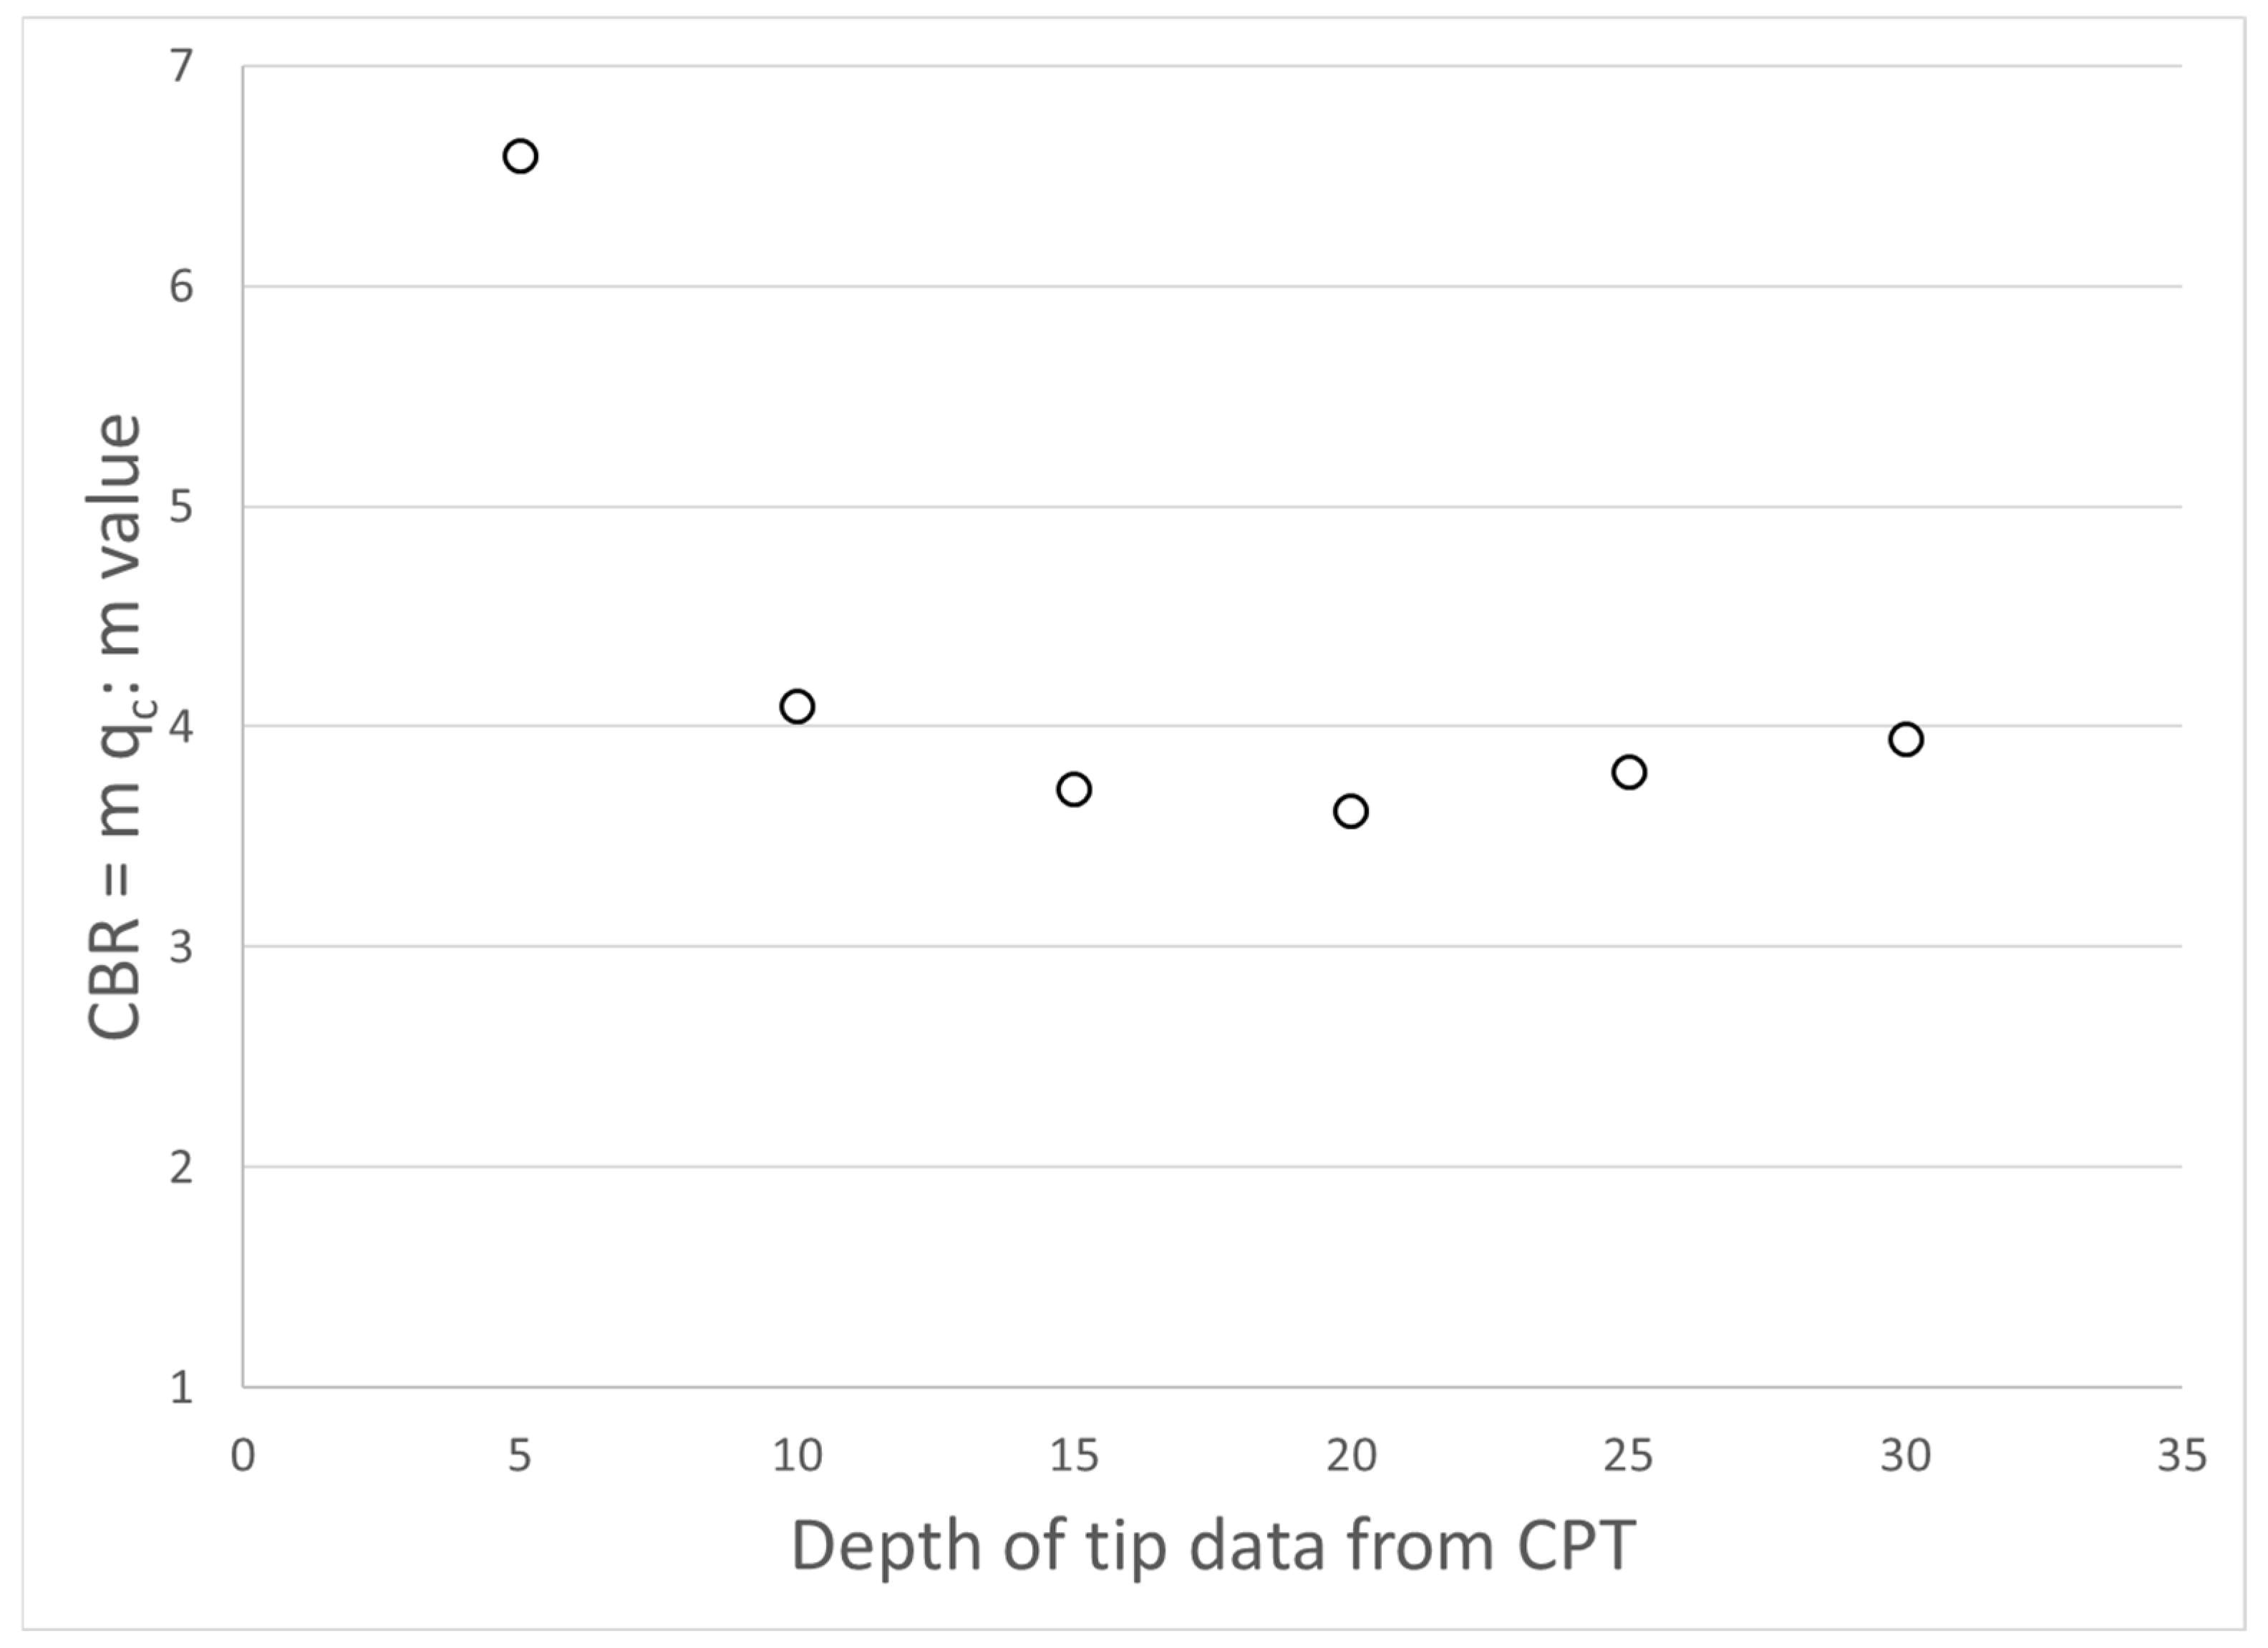
  • Correlation Between CPT and CBR: Data collected at a depth of 0.2 m showed a stronger correlation between CPT tip resistance (qc) and CBR values. This finding, not previously highlighted, is critical for optimizing correlations between CBR and qc.
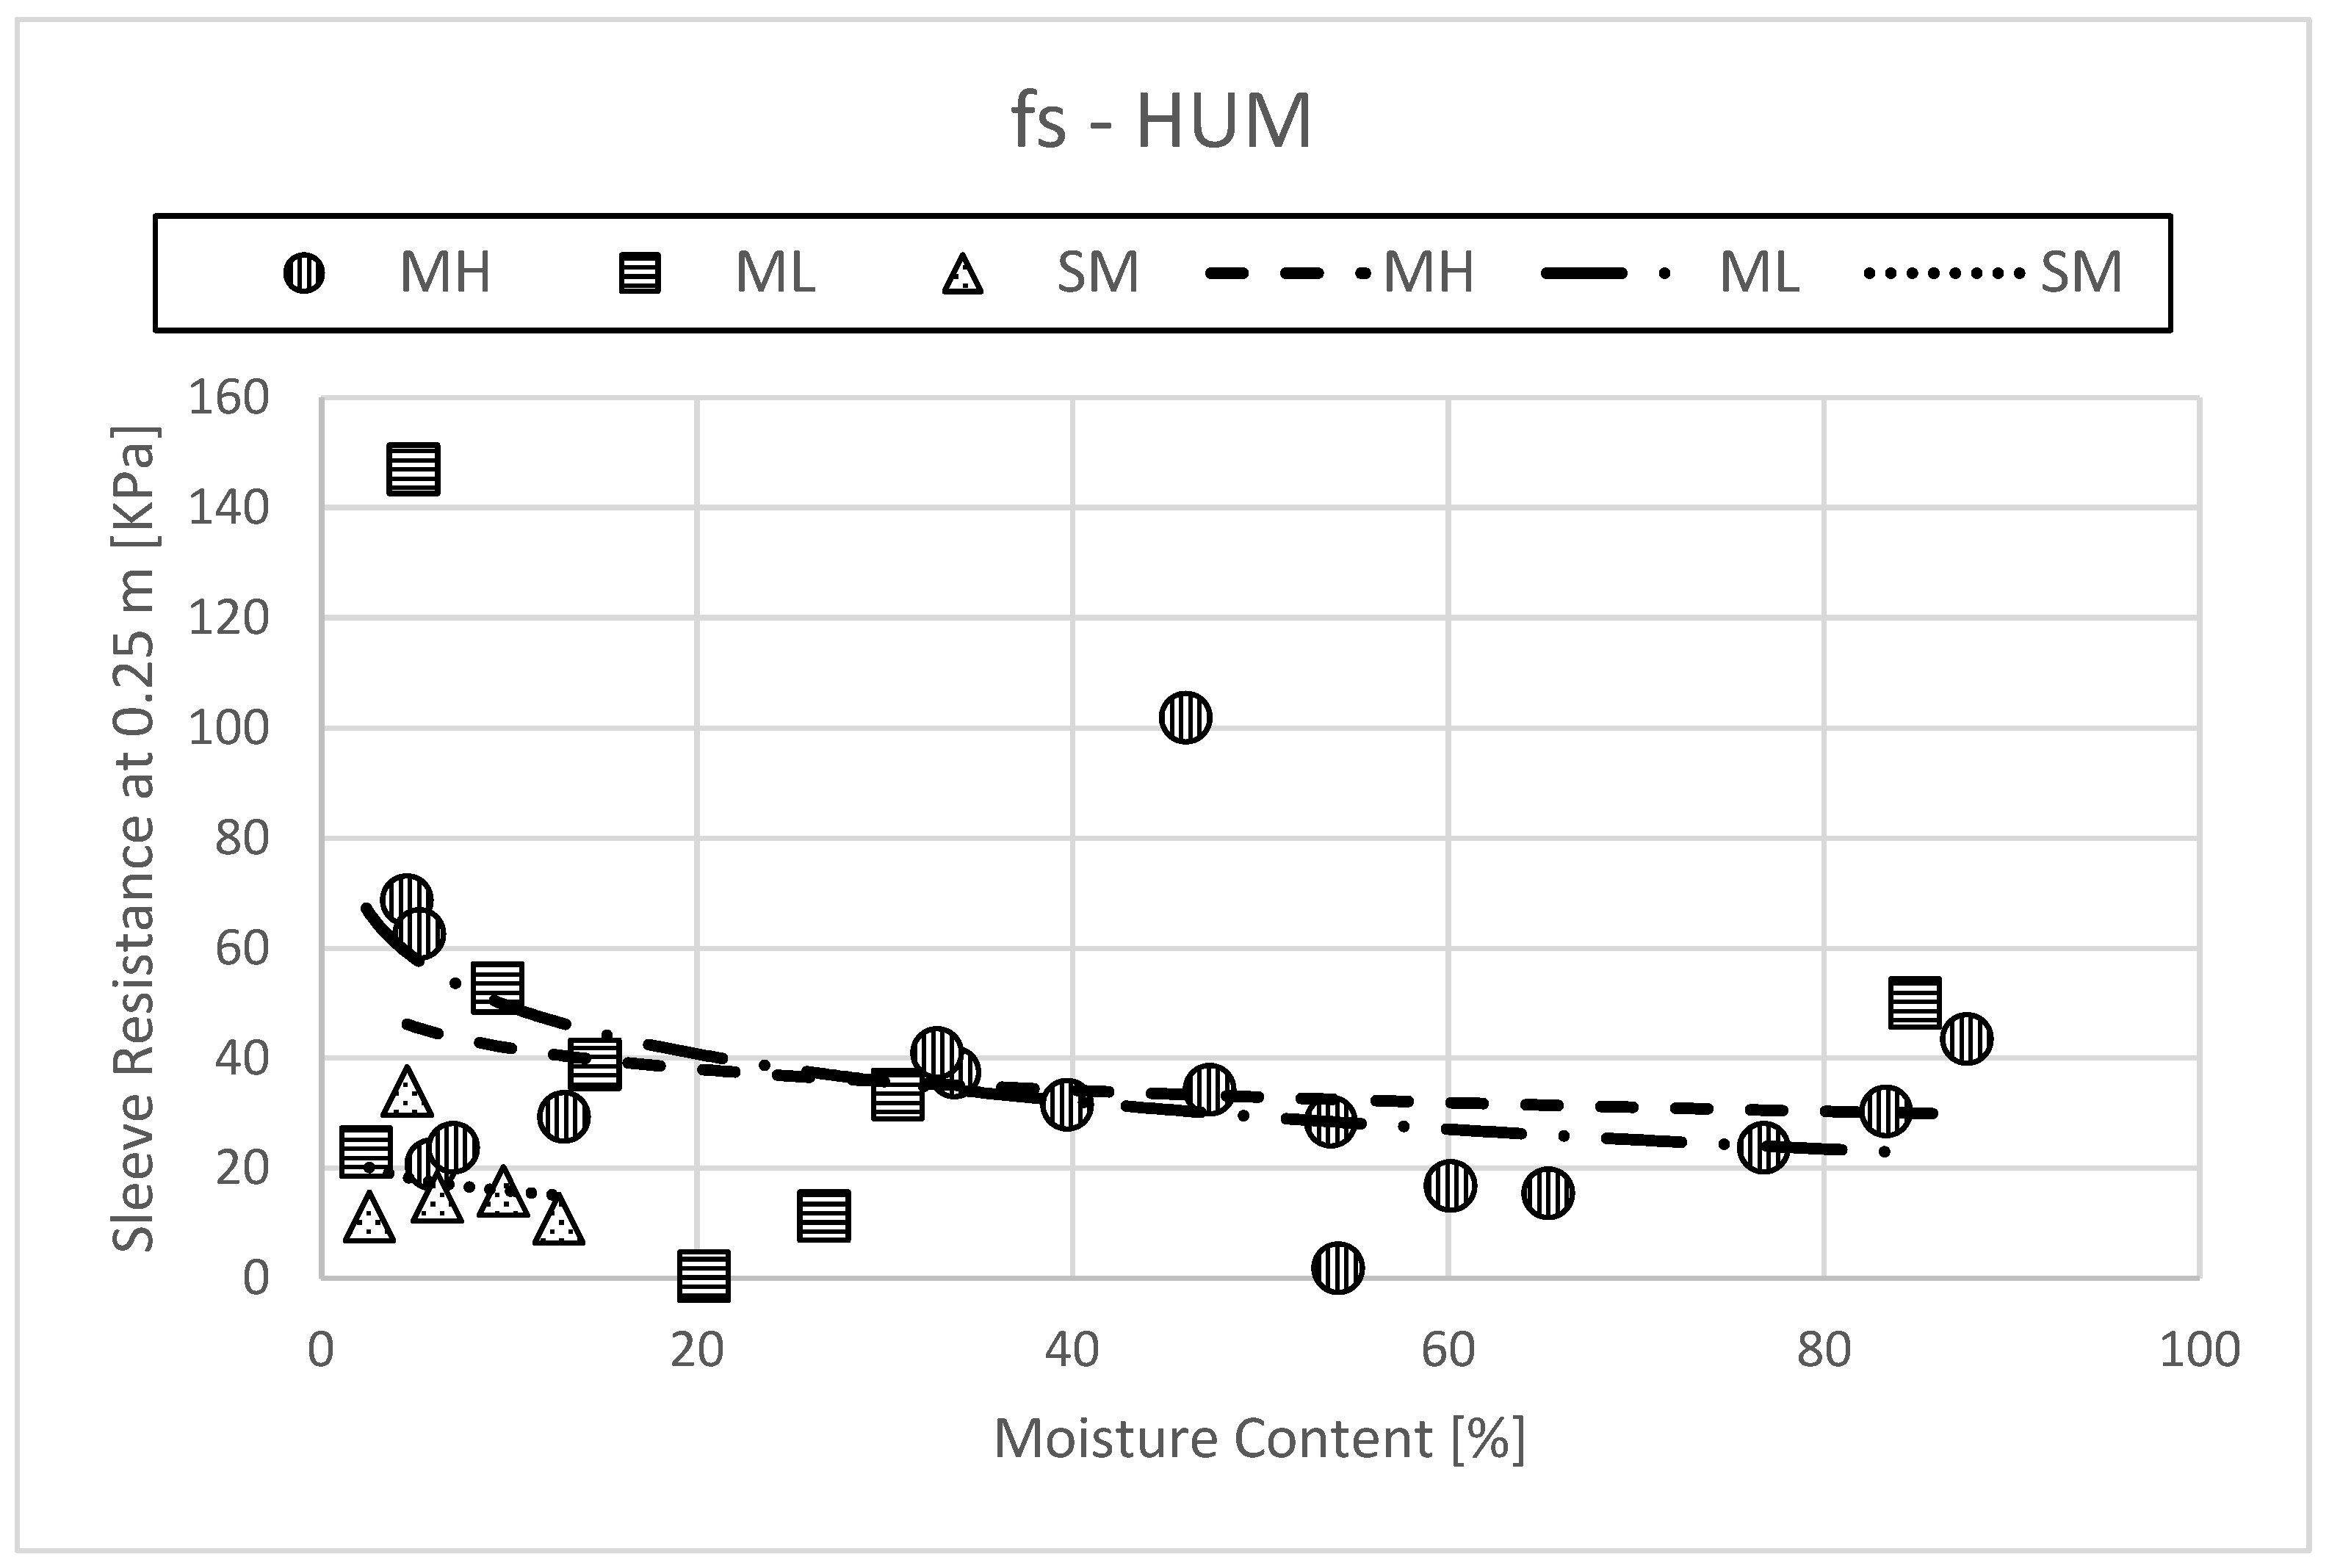
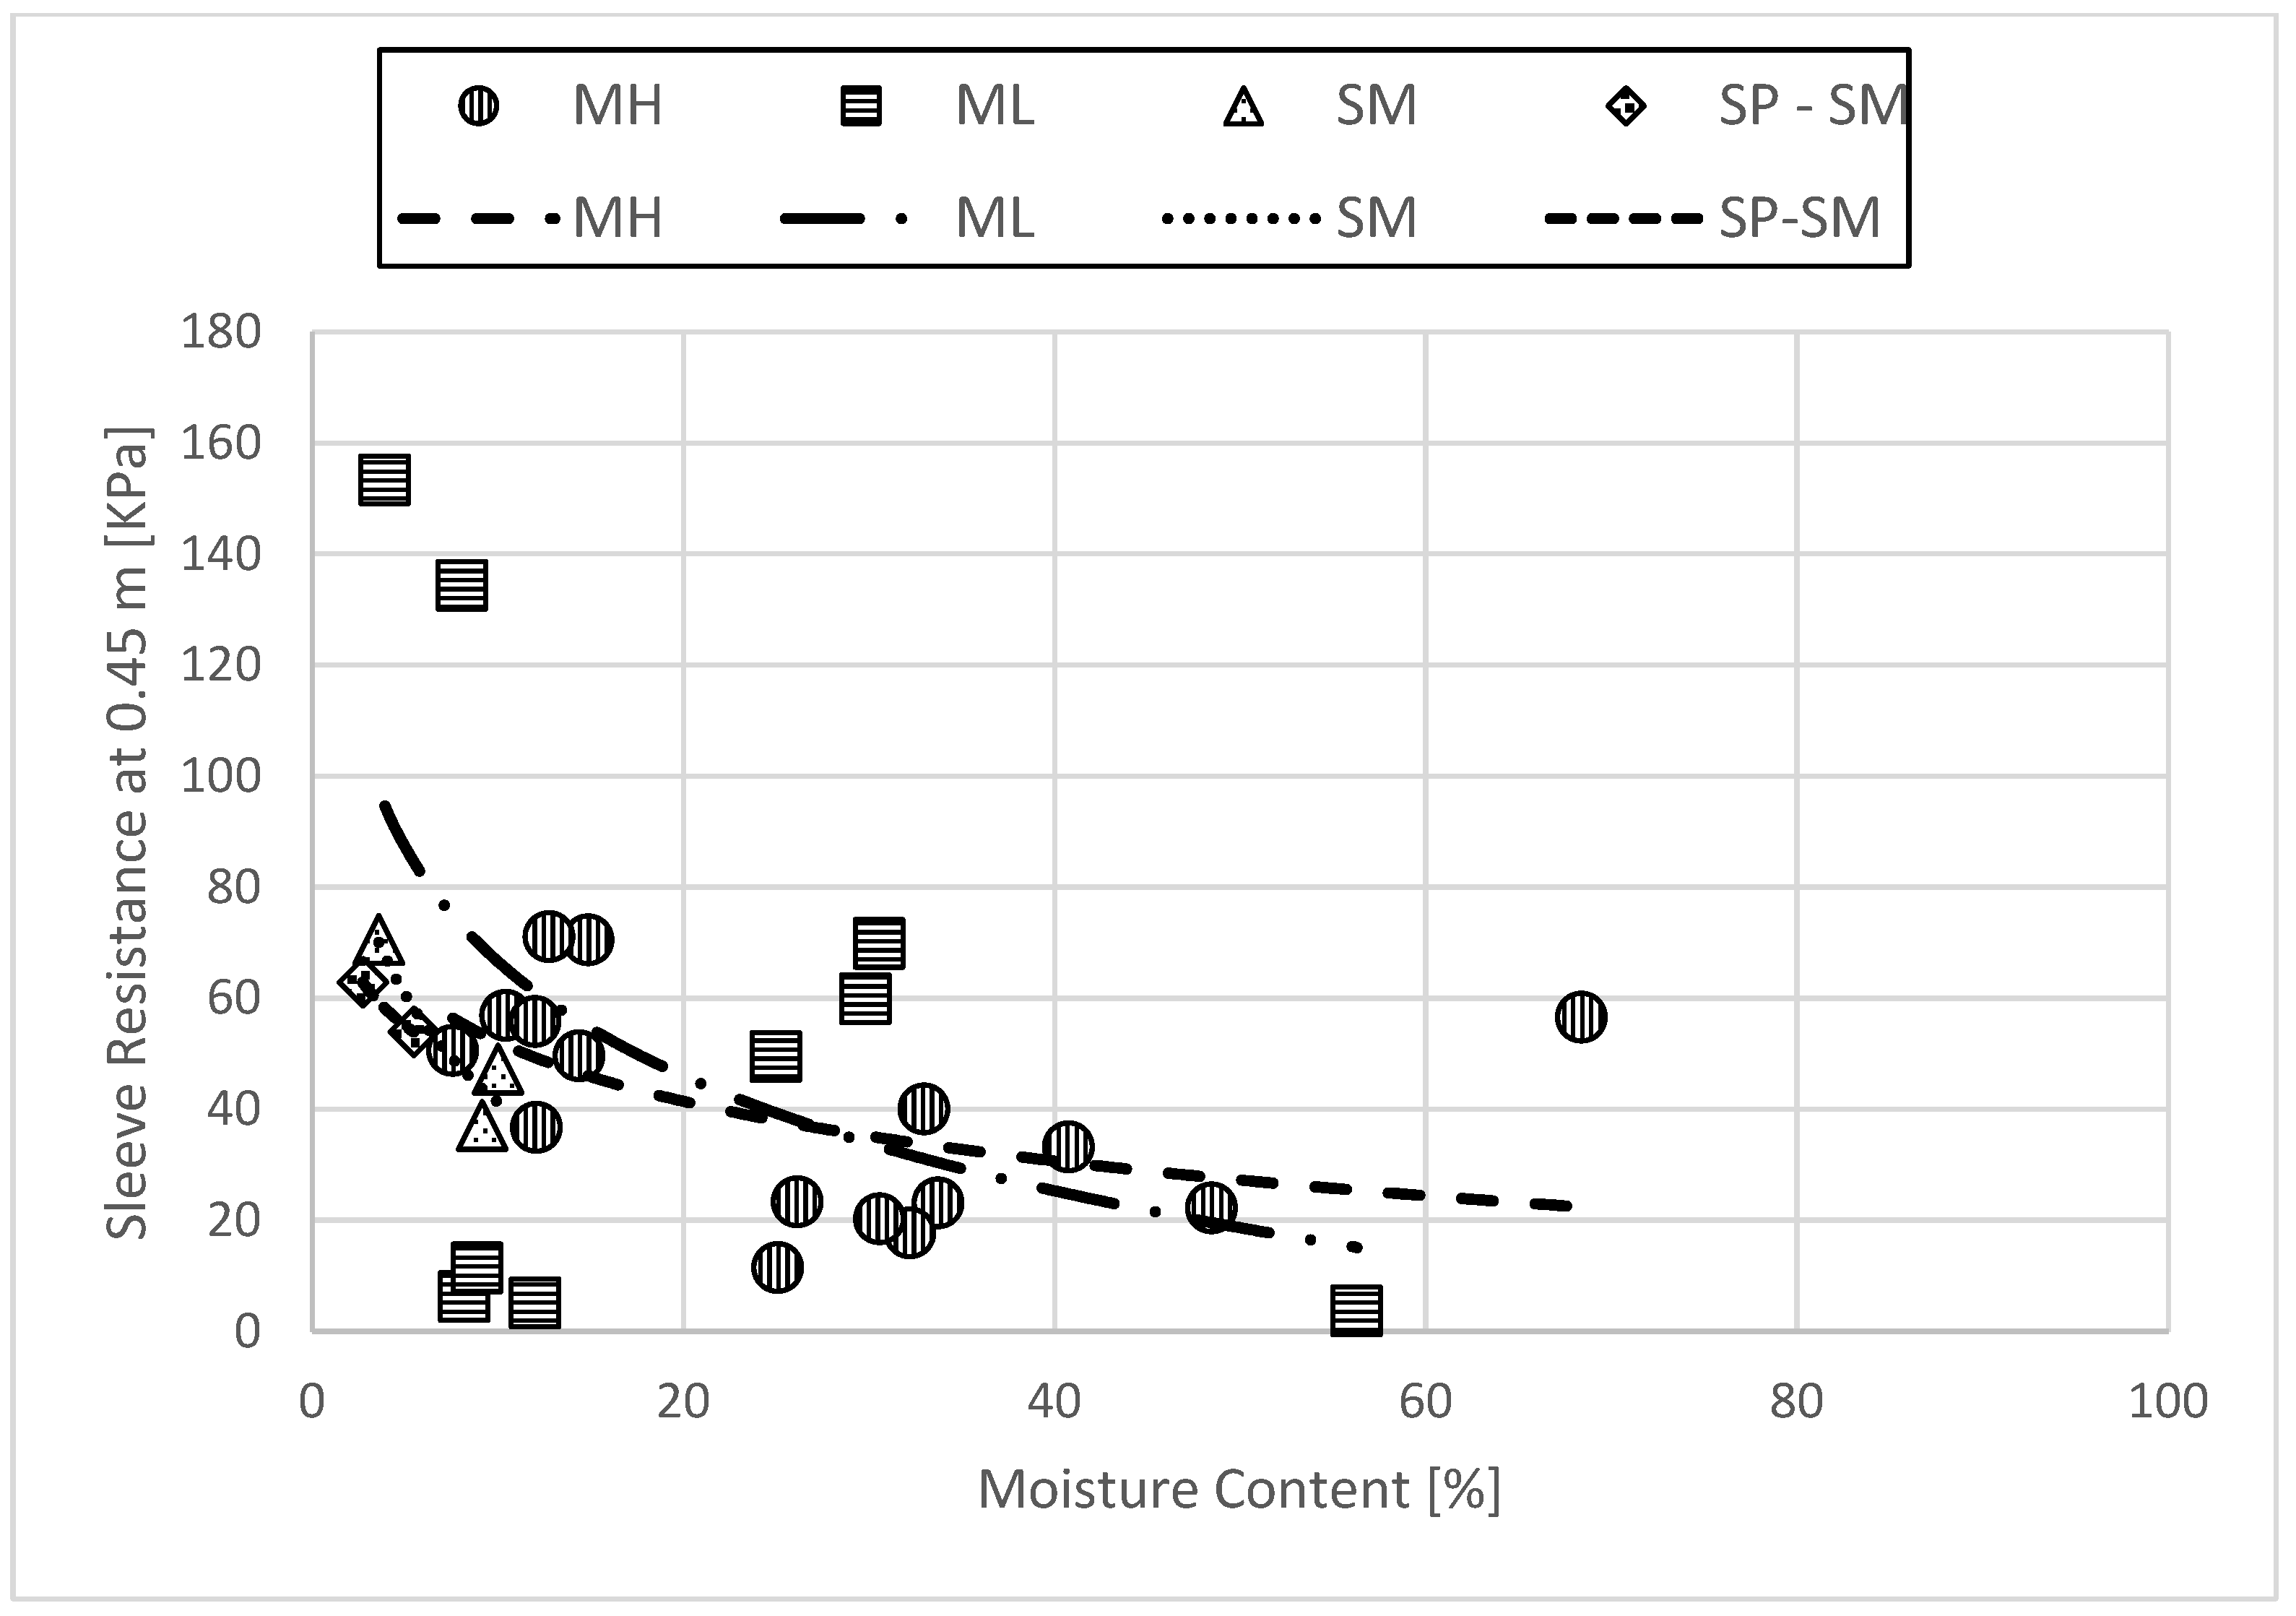
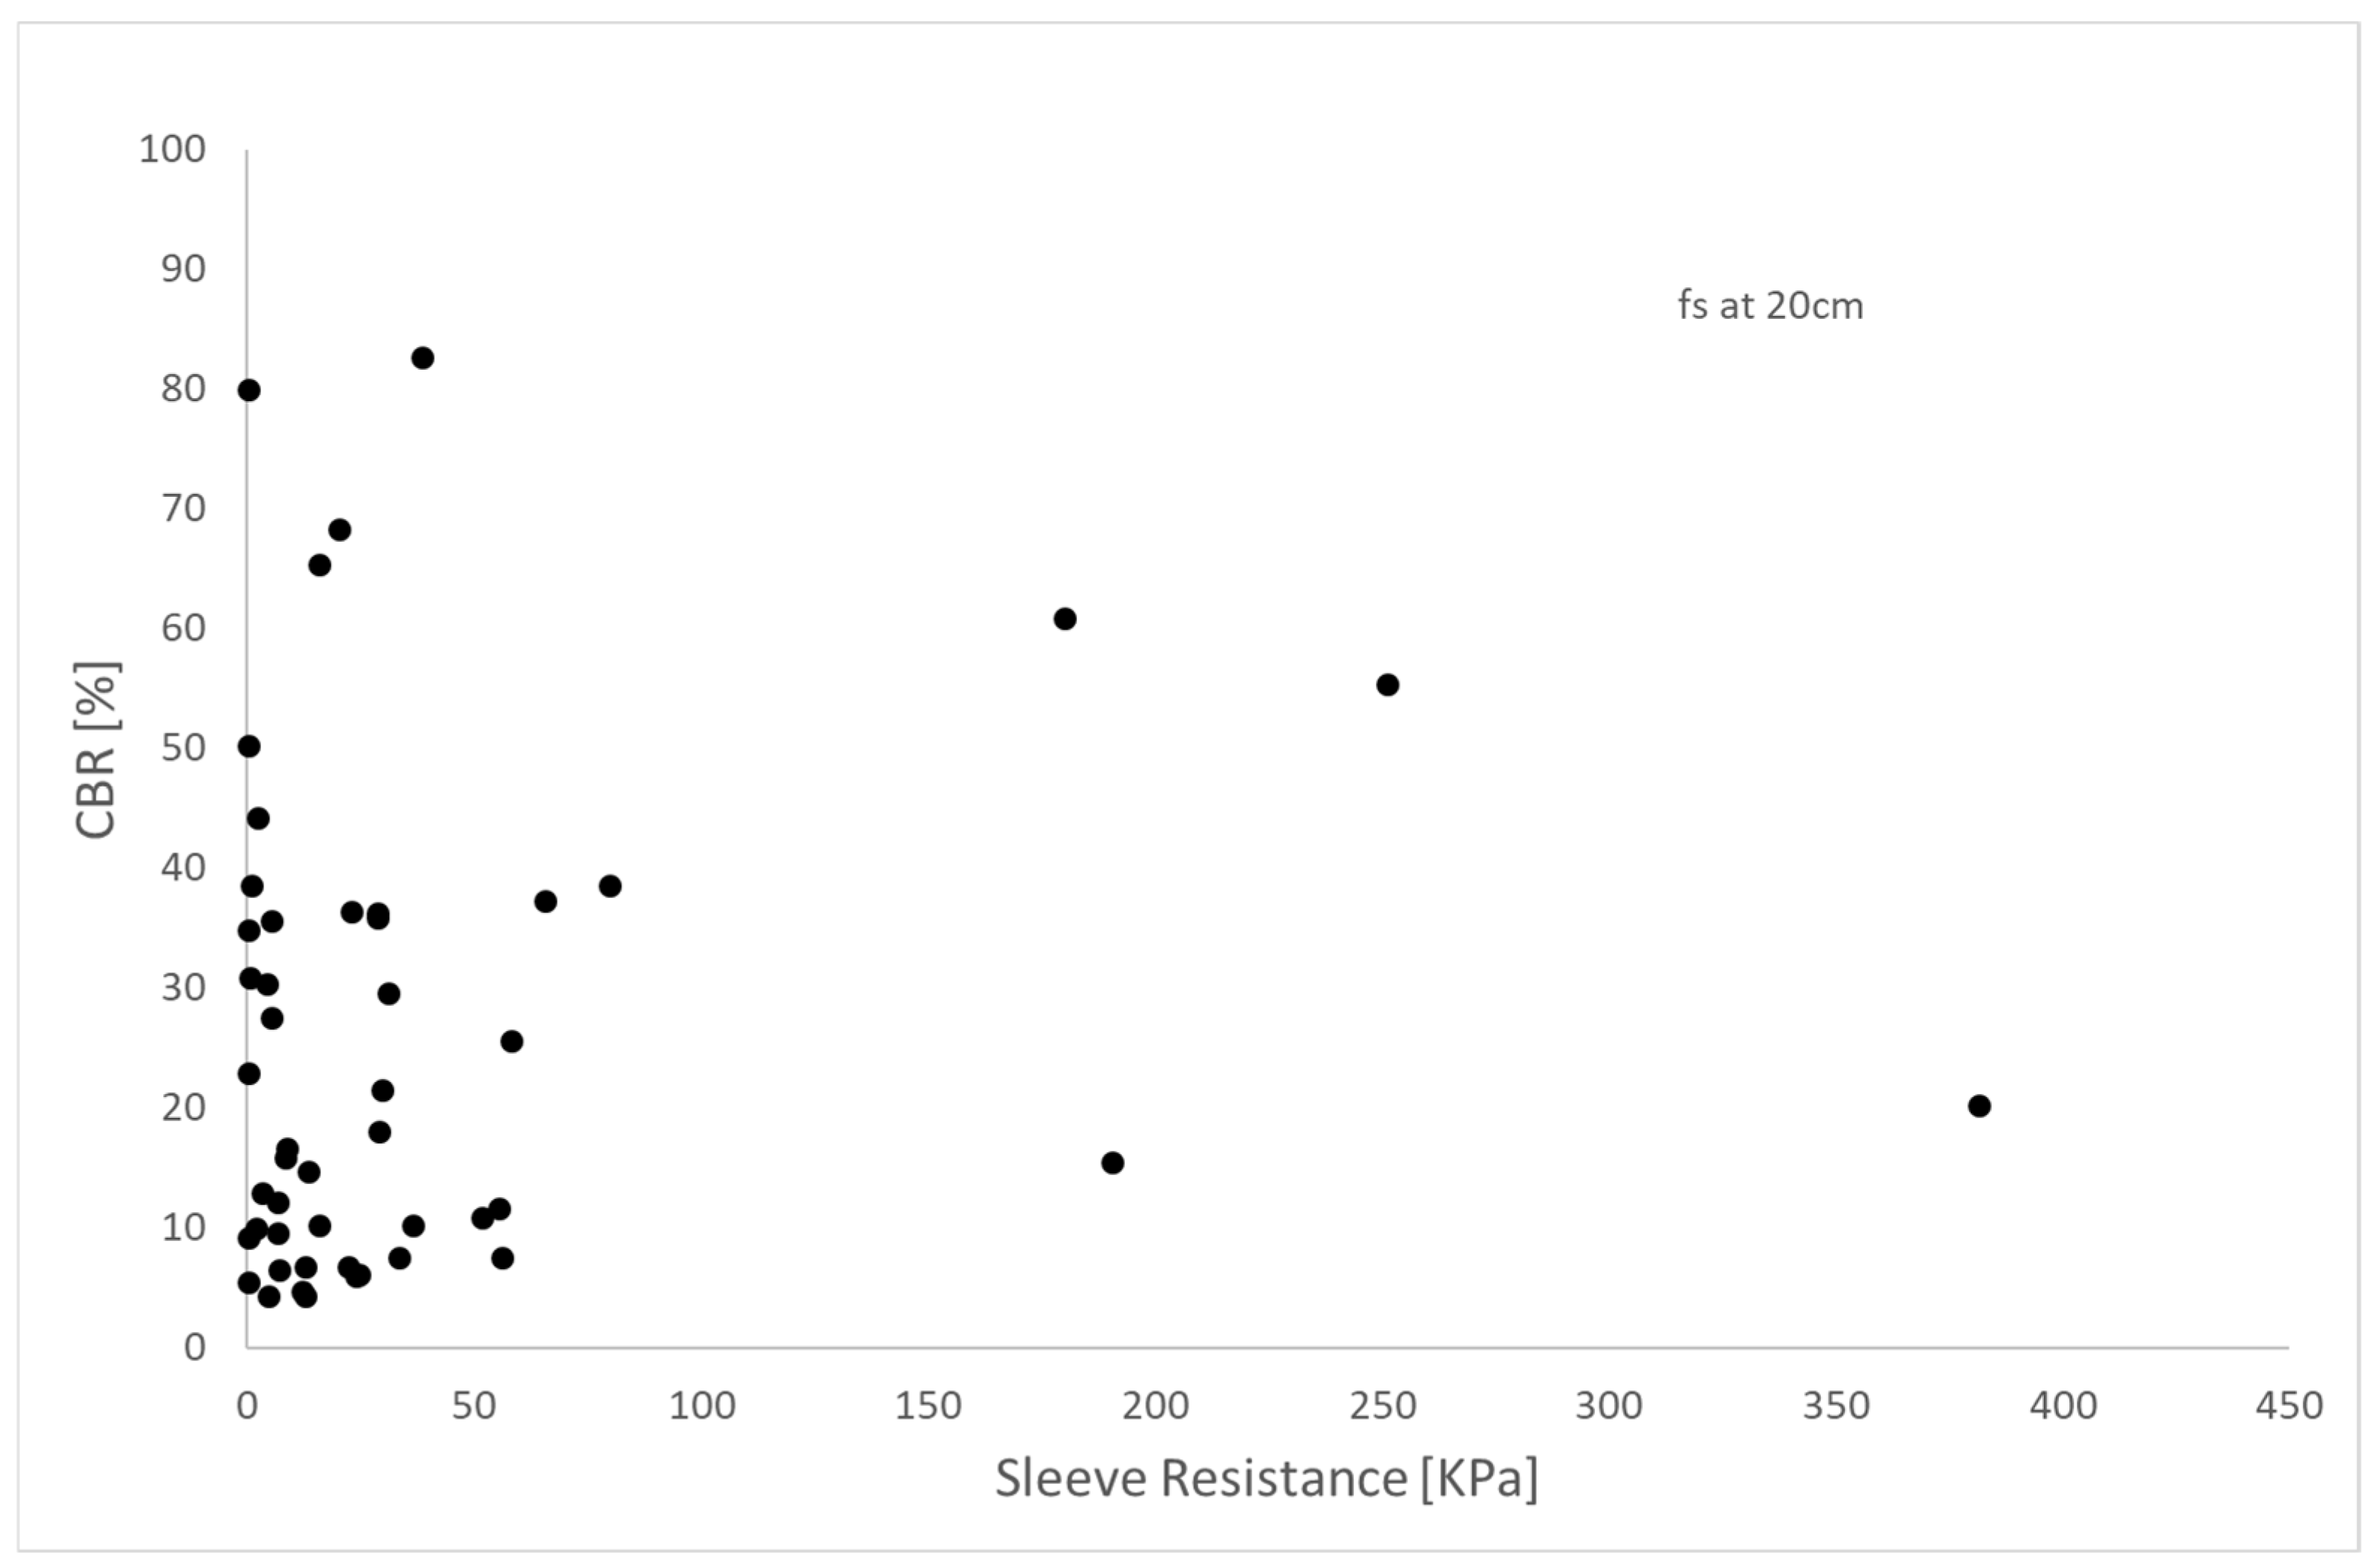
  • Sleeve Friction and Correlation: No significant relationship was observed between CPT sleeve friction (fs) and moisture content, nor was there any correlation between sleeve resistance (fs)_and CBR values. This agrees with prior research indicating that sleeve friction is less critical in CPT-derived geotechnical parameters than tip resistance.
  • Critical Moisture Content: CPT and CBR testing should be conducted at moisture contents above 30%, as no significant decrease in strength is expected at higher soil saturation levels. Testing this moisture content provides a representative measure of the soil’s critical strength.

Author Contributions

Conceptualization, R.M.; methodology, R.M.; software, R.M. and F.F.; validation, R.M., F.F. and F.A.V.; formal analysis, R.M. and F.F.; investigation, F.F.; resources, R.M.; data curation, F.F.; writing—original draft preparation, R.M. and F.A.V.; writing—review and editing, R.M. and F.A.V. All authors have read and agreed to the published version of the manuscript.

Funding

This research received no external funding.

Data Availability Statement

The dataset is available upon request from the authors.

Conflicts of Interest

Author Felipe Faundez is employed by RyV Engineers. The remaining authors declare that the research was conducted in the absence of any commercial or financial relationships that could be construed as a potential conflict of interest.

References

  1. Mallick, R.B.; Tahar, E. Pavement Engineering. Principles and Practice, 4th ed.; CRC Press: Abingdon, UK, 2023. [Google Scholar]
  2. American Association of State Highway and Transportation Officials (AASHTO). AASHTO Guide for Design of Pavement Structures; AASHTO: Washington, DC, USA, 1993. [Google Scholar]
  3. Putri, E.E.; Rao, N.S.V.; Mannan, M.A. Evaluation of modulus of elasticity and modulus of subgrade reaction of soils using CBR test. J. Civil Eng. Res. 2012, 2, 34–40. [Google Scholar] [CrossRef]
  4. Witczak, M.W.; Qi, X.; Mirza, M.W. Use of nonlinear subgrade modulus in AASHTO design procedure. J. Transp. Eng. 1995, 121, 273–282. [Google Scholar] [CrossRef]
  5. Erlingsson, S. On forecasting the resilient modulus from the CBR value of granular bases. Road Mater. Pavement Des. 2007, 8, 783–797. [Google Scholar] [CrossRef]
  6. ASTM D4429-18; Standard Test Method for CBR (California Bearing Ratio) of Soils in Place. ASTM: West Coshohocken, PA, USA, 2018.
  7. Scala, A.J. The use of cone penetration in determining the bearing capacity of soils: Simple methods of flexible pavement design using cone penetrometers. In Proceedings of the Australia-New Zealand Conference on Soil Mechanics and Foundation Engineering, Canterbury University, Christchurch, New Zealand, January 1954; pp. 73–84. [Google Scholar]
  8. Misra, A.; Supadhayaya, S.; Horn, C.; Kondagari, S.; Gustin, F. CBR and DCP correlation for class C Fly Ash-stabilized soil. Geotech. Test. J. 2006, 29, 1–7. [Google Scholar] [CrossRef]
  9. Neupane, M.; Parsons, R.L.; Han, J. Rapid estimation of fouled railroad ballast mechanical properties. Geotech. Test. J. 2018, 41, 777–786. [Google Scholar] [CrossRef]
  10. Wesley, L.; Dobie, M. Early development of the Dutch cone penetrometer test (CPT). Proc. Inst. Civ. Eng. Eng. Hist. Herit. 2022, 175, 145–152. [Google Scholar] [CrossRef]
  11. Sanglerat, G. Developments in Geotechnical Engineering. In The Penetrometer and Soil Exploration; Elsevier Science: Amsterdam, The Netherlands, 1982; Volume 1. [Google Scholar]
  12. Ampadu, S.I.K.; Fiadjoe, G.J.Y. The influence of water content on the Dynamic Cone Penetration Index of a lateritic soil stabilized with various percentages of a quarry by-product. Transp. Geotech. 2015, 5, 68–85. [Google Scholar] [CrossRef]
  13. Robertson, P.K.; Cabal, K. Guide to Cone Penetration Testing, 7th ed.; Gregg: Los Angeles, CA, USA, 2022; 164p. [Google Scholar]
  14. ASTM D5778-20; Standard Test Method for Electronic Friction Cone and Piezocone Penetration Testing of Soils. ASTM: West Coshohocken, PA, USA, 2020.
  15. ASTM D1883-21; Standard Test Method for California Bearing Ratio (CBR) of Laboratory-Compacted Soils. ASTM: West Coshohocken, PA, USA, 2021.
  16. Rahman, M.M.; Gassman, S.L.; Islam, K.M. Effect of moisture content on subgrade soils resilient modulus for predicting pavement rutting. Geosciences 2023, 13, 103. [Google Scholar] [CrossRef]
  17. Lim, S.; Indraratna, B.; Heitor, A.; Yao, K.I.; Jin, D.; Albadro, W.M.; Liu, X. Influence of matric suction on resilient modulus and CBR of compacted Ballina clay. Constr. Build. Mater. 2022, 359, 129482. [Google Scholar] [CrossRef]
  18. Wu, X.R.; Shen, J.M. Research on the Impact of Moisture Content on the CBR Value of Shanxi Loess. Adv. Mater. Res. 2013, 838–841, 80–83. [Google Scholar] [CrossRef]
  19. Purwana, Y.M.; Nikraz, H.; Jitsangiam, P. Experimental study of suction-monitored CBR test on sand-Kaolin clay mixture. Int. J. Geomate 2012, 3, 419–422. [Google Scholar]
  20. Krahn, J.; Fredlund, D.G. On total, matric and osmotic suction. Soil Sci. 1972, 114, 339–348. [Google Scholar] [CrossRef]
  21. Tang, G.X.; Graham, J.; Blatz, J.; Gray, M.; Rajapakse, R.K.N.D. Suctions, stresses and strengths in unsaturated sand-betonite. Eng. Geol. 2002, 64, 147–156. [Google Scholar] [CrossRef]
  22. Robertson, P.K.; da Fonseca, A.V.; Ulrich, B.; Coffin, J. Characterization of unsaturated mine waste: A case history. Can. Geotech. J. 2017, 54, 1752–1761. [Google Scholar] [CrossRef]
  23. Russell, A.R.; Vo, T.; Ayala, J.; Wang, Y.; Reid, D.; Fourie, A.B. Cone penetration tests in saturated and unsaturated silty tailings. Geotechnique 2024, 74, 281–295. [Google Scholar] [CrossRef]
  24. Heraldo Luiz Giacheti, H.L.; Cravera, R.; Padovezi, B.; Rodrigues, R. Seasonal influence on cone penetration test: An unsaturated soil site example. J. Rock Mech. Geotech. Eng. 2019, 11, 361–368. [Google Scholar] [CrossRef]
  25. Fioravante, V.; Giretti, D.; Dodaro, E.; Gragnano, C.G.; Gottardi, G. CPT Calibration in Centrifuge: Effect of Partial Saturation on Cone Resistance; Cone Penetration Testing: Bologna, Italy, 2022. [Google Scholar]
  26. Scala, A.J. Simple methods of flexible pavement design using cone penetrometers. In Golden Jubilee of the International Society for Soil Mechanics and Foundation Engineering: Commemorative Volume; Institution of Engineers: Barton, Australia, 1956. [Google Scholar]
  27. Arbianto, R.; Yuono, T.; Gunarso, G. Comparison of California Bearing Ratio (CBR) value based on Cone Penetration Test (CPT) and Dynamic Cone Penetrometer (DCP). J. Adv. Civ. Environ. Eng. 2021, 4, 70–78. [Google Scholar] [CrossRef]
Figure 1. The relationship between CBR and dynamic cone proposed by [8].
Buildings 15 00345 g001
Figure 2. The relationship proposed by [8] between static cone and CBR.
Buildings 15 00345 g002
Figure 3. CPT testing [14].
Buildings 15 00345 g003
Figure 4. Arrangement of CBR testing on the field.
Buildings 15 00345 g004
Figure 5. CPT and CRB in situ testing in each zone.
Buildings 15 00345 g005
Figure 6. Characteristic CPT sounding on the tested zone.
Buildings 15 00345 g006
Figure 7. Examples of suction versus moisture content (extracted from different authors [20,21]).
Buildings 15 00345 g007
Figure 8. CBR [%] vs. moisture content [%].
Buildings 15 00345 g008
Figure 9. Tip resistance [MPa] at 0.3 m depth vs. moisture content [%].
Buildings 15 00345 g009
Figure 10. Tip resistance [MPa] at different depths vs. moisture content [%].
Buildings 15 00345 g010
Figure 11. Tip resistance at depths of 0.1, 0.3, and 1.1 m, according to soil type.
Buildings 15 00345 g011
Figure 12. Normalized tip resistance, Qt = (qt − σv0)/σ’v0 versus moisture content.
Buildings 15 00345 g012
Figure 13. Sleeve resistance [kPa] at 0.25 m depth vs. moisture content [%].
Buildings 15 00345 g013
Figure 14. Sleeve resistance [kPa] at 0.45 m depth vs. moisture content [%].
Buildings 15 00345 g014
Figure 15. The slope between CBR and qc value at different depths in cm.
Buildings 15 00345 g015
Figure 16. Correlation between CBR [%] and tip resistance [MPa] at 0.2 m (data from [7,27]).
Buildings 15 00345 g016
Figure 17. CPT sleeve resistance, fs at 0.2 m., versus CBR value.
Buildings 15 00345 g017
Table 1. Soil classification of samples from the field tests.
ZONESampleDepth [m] Atterberg LimitsUSCS Class.
Fines %CuCcLLPLPI
0101-CBR-010.099.0-- NP ML
01-CBR-020.099.0--35.926.19.9ML
01-CBR-030.098.4--32.627.35.4ML
01-CBR-040.098.5--37.229.18.1ML
01-CBR-050.098.4--37.829.28.5ML
01-CPT-010.096.5--36.729.57.1ML
01-CPT-010.384.6--42.428.613.8ML
01-CPT-011.19.24.70.8NPSP-SM
01-CPT-020.098.8--37.831.06.9ML
01-CPT-020.386.0--43.728.515.3ML
01-CPT-021.16.65.30.8NPSP-SM
01-CPT-030.098.2--37.027.59.5ML
01-CPT-030.371.9--33.923.710.1ML
01-CPT-031.16.64.20.8NPSP-SM
01-CPT-040.094.3--37.333.53.8ML
01-CPT-040.389.0--45.131.713.5ML
01-CPT-041.17.94.60.8NPSP-SM
01-CPT-050.094.5--34.426.18.4ML
01-CPT-050.391.7--46.830.616.3ML
01-CPT-051.17.06.30.8NPSP-SM
0202-CBR-010.089.4--71.357.014.3MH
02-CBR-020.089.5--74.051.023.0MH
02-CBR-030.081.1--73.363.79.6MH
02-CBR-040.083.7--78.363.714.6MH
02-CBR-050.088.5--86.270.715.5MH
02-CPT-010.096.1--69.352.217.1MH
02-CPT-010.398.8--42.628.014.6ML
02-CPT-011.161.2--30.424.85.6ML
02-CPT-020.093.7--76.865.910.9MH
02-CPT-020.397.4--48.331.017.3ML
02-CPT-021.124.0--NPSM
02-CPT-030.096.0--62.446.515.9MH
02-CPT-030.398.0--44.129.214.9ML
02-CPT-031.145.9--NPSM
02-CPT-040.097.7--77.355.721.6MH
02-CPT-040.398.1--51.935.816.1MH
02-CPT-041.121.6--NPSM
02-CPT-050.098.1--86.464.022.4MH
02-CPT-050.398.6--48.932.316.6ML
02-CPT-051.112.2--NPSM
0303-CBR-010.096.5--77.266.310.9MH
03-CBR-020.098.0--80.762.218.5MH
03-CBR-030.099.2--60.738.821.9MH
03-CBR-040.098.7--72.159.312.8MH
03-CBR-050.098.8--79.957.322.6MH
03-CPT-010.097.6--79.675.24.4MH
03-CPT-010.399.0--78.456.721.7MH
03-CPT-011.17.85.10.8NPSP-SM
03-CPT-020.098.6--95.577.418.1MH
03-CPT-020.399.6--86.154.631.5MH
03-CPT-021.17.55.80.8NPSP-SM
03-CPT-030.098.5--NPML
03-CPT-030.399.2--71.144.127.1MH
03-CPT-031.16.37.20.8NPSP-SM
03-CPT-040.097.8--NPML
03-CPT-040.399.4--82.761.221.5MH
03-CPT-041.18.03.90.8NPSP-SM
03-CPT-050.099.1--77.558.818.6MH
03-CPT-050.398.7--98.066.431.6MH
03-CPT-051.19.53.60.9NPSP-SM
Cu: uniformity coefficient; Cc: curvature coefficient; LL: liquid limit; PL: plastic limit; NP: non-plastic. ML: silt; MH: elastic silt; SM: silty sand; SP: poorly graded sand.
Disclaimer/Publisher’s Note: The statements, opinions and data contained in all publications are solely those of the individual author(s) and contributor(s) and not of MDPI and/or the editor(s). MDPI and/or the editor(s) disclaim responsibility for any injury to people or property resulting from any ideas, methods, instructions or products referred to in the content.

