Abstract
This research explored the application of cotton straw fiber in asphalt mixtures, aiming to optimize the asphalt mixtures’ performance. Firstly, 17 experiments were designed using Response Surface Methodology (RSM). Subsequently, the Box–Behnken Design (BBD) was used to examine how the asphalt content, fiber length, and cotton straw fiber content interacted to affect the modified asphalt mixes’ pavement performance. Based on the experimental findings, performance prediction models were created to direct optimization. The optimized design was then validated through pavement performance tests and bending fatigue tests. The findings revealed that cotton straw fiber content, length, and asphalt content significantly influence the performance of modified asphalt mixtures. The inclusion of cotton straw fibers enhanced various properties of the mixtures. When the fiber content was set at 0.3%, fiber length at 6 mm, and asphalt content at 5.3%, the response indicators, including Marshall stability, dynamic stability, flexural strength, and freeze–thaw strength ratio, were measured at 12.246 kN, 2452.396 times/mm, 12.30 MPa, and 92.76%, respectively. These results indicate that the cotton-straw-fiber-modified asphalt mixture achieved optimal performance while meeting regulatory requirements. Additionally, fatigue tests showed that the cotton-straw-fiber-modified asphalt mixture exhibited superior fatigue resistance compared with the SBS-modified asphalt mixture. The maximum error between the RSM predictions and the experimental measurements was within 10%, demonstrating the accuracy of the predictive models in estimating the impact of different factors on asphalt mixture performance. The application of RSM in designing and optimizing cotton-straw-fiber-modified asphalt mixtures proved to be highly effective, offering valuable insights for utilizing cotton straw fibers in road construction.
1. Introduction
Large-scale cotton cultivation produces a substantial amount of cotton straw in addition to meeting the demand for textile raw materials on the global market as planting areas and yields grow [1]. This straw has the potential to seriously harm the environment if it is not used appropriately. Even though cotton straw is mostly employed in the paper and textile sectors these days, a huge amount of it is still burned, which causes serious pollution in the environment [2,3]. Cotton straw may be recycled by using it in modified asphalt mixes, which not only efficiently uses this resource but also lowers pollutants. Under the effects of load and temperature, traditional asphalt mixes frequently experience problems such as rutting and cracking [4,5]. According to research, cotton straw fiber may increase a road’s resilience to rutting, cracking, and high temperatures, thereby prolonging its useful life [6,7]. Additionally, using cotton straw fiber as a modifying material can reduce costs and decrease reliance on expensive materials, yielding economic benefits. Therefore, studying the performance of cotton-straw-fiber-modified asphalt mixtures is not only beneficial for improving road performance but also for promoting sustainable resource utilization, offering significant environmental and economic advantages.
Fiber materials improve the properties of asphalt binders by absorbing them, which also enhances the engineering performance of asphalt mixtures, including viscoelasticity, rutting resistance, freeze–thaw resistance, and shear deformation resistance. Consequently, fiber-modified asphalt mixtures have found widespread use in pavement engineering. In the 1960s, researchers such as Tamburor D.A. introduced asbestos fibers into asphalt mixtures, resulting in mixtures with superior performance [8]. However, asbestos fibers pose significant environmental and health hazards [9,10]. The multifunctional roles of fibers in asphalt mixtures, such as adsorption, tackifying, stabilization, dispersion, and toughening, enable substantial improvements in overall mixture performance. Commonly used modern fibers include basalt fiber, polyester fiber, plant fiber, and lignin fiber, all of which have shown effective modification results when used in asphalt mixtures [11,12,13,14]. The basic technical properties of cotton straw fiber are similar to those of lignin fiber, but cotton straw fiber offers additional advantages, such as a larger specific surface area and higher temperature resistance. Studies have demonstrated the feasibility of using cotton fiber to modify asphalt [15,16,17]. For instance, with a 0.5% fiber concentration and a 1 mm fiber length, Qiang et al. examined the road performance of asphalt mixes treated with cotton straw fiber and discovered that they performed better than mixtures modified with lignin [18]. The impact of fiber length and orientation distributions on matrix strength was examined by Fu et al. [19]. At small mean fiber lengths, the data demonstrate that the strength grows quickly with the length of the fiber; at high mean fiber lengths, however, the strength approaches a plateau level. However, few studies have examined the relationship between fiber length and content and their combined effects on asphalt mixture performance; instead, most current research focuses on investigating the influence of fiber content on mixture performance using controlled variable approaches [20].
In order to study the effect of fibers on the properties of asphalt mixtures, Marshall stability, dynamic stability, flexural tensile strength, and the ratio of freeze–thaw strength are used as response variables, concentrating on the important variables of cotton straw fiber content, fiber length, and asphalt content. The study investigates the optimum way to use cotton straw fiber in asphalt modification by using the response surface approach. It also creates a performance prediction model to determine the ideal ratio of fiber length, fiber content, and asphalt content. The optimized cotton straw fiber asphalt mixture was also subjected to road performance and fatigue performance testing in an effort to offer a technological and scientific foundation for the use of cotton straw fiber in asphalt mixes. This study provides a new method for optimizing the performance of fiber-modified asphalt mixtures and provides a reference for its application and promotion in road engineering.
2. Materials and Test Methods
2.1. Raw Materials
In this investigation, 70# neat asphalt was utilized. The essential characteristics of asphalt and aggregate are displayed in Table 1 and Table 2, and limestone was utilized as the aggregate. The cotton straw was first crushed using a high-speed multifunctional grinder and then soaked in sodium nitrate and sodium hydroxide solutions. Cotton straw fibers of various lengths were obtained by drying and sieving the straw after it had been soaked. Table 3 displays the fundamental characteristics of the cotton straw fiber. The grading is AC-13. The grading design curve is shown in Figure 1.

Table 1.
The characteristics of the 70# neat asphalt.
Table 2.
The characteristics of the aggregate.
Table 3.
The characteristics of the cotton straw fiber.
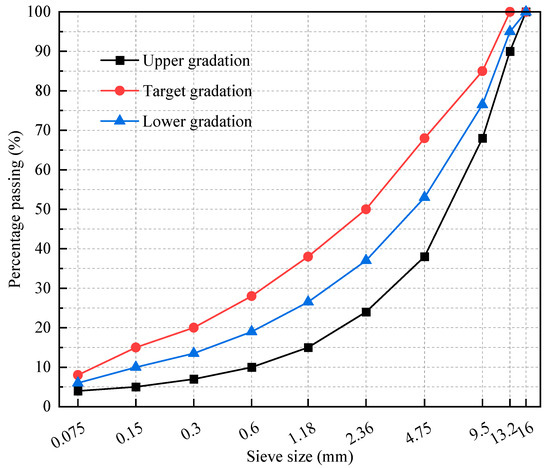
Figure 1.
AC-13 gradation curve.
2.2. Test Methods
Laboratory experiments were performed in accordance with the “Standard Test Methods of Bitumen and Bituminous Mixtures for Highway Engineering” (JTG E20-2011) [21] to assess the performance of asphalt mixes treated with cotton straw fiber. To determine the mix percentage and confirm its viability, the Marshall stability test was first conducted. Using the Marshall compaction technique, specimens measuring 101.6 mm in diameter and 63.5 mm in height were created. To find the stability value, or maximum load, the specimens were loaded at a rate of 50 mm/min after being conditioned at 60 °C for about 30 min. A rutting test was performed to evaluate the mixture’s performance at high temperatures. A rolling compactor was used to create the rutting specimens, which had dimensions of 300 mm × 300 mm × 50 mm. Using a rutting tester, the test was conducted at 60 °C to determine the mixture’s dynamic stability under several circumstances. A beam bending experiment was used to assess the mixture’s resistance to fracture at low temperatures. From the rutting plates, little beams were cut into specimens that were 250 mm by 30 mm by 35 mm. The test was carried out utilizing a single-point loading technique on a UTM-100 testing machine at −10 °C and a loading rate of 50 mm/min. A freeze–thaw splitting test was used to evaluate the mixture’s water stability. Using a loading rate of 50 mm/min, specimens measuring 101.6 mm in diameter and 63.5 mm in height were evaluated in both ambient (25 °C) and frozen (−18 °C) conditions. By measuring the mixture’s splitting tensile strength both before and after freeze–thaw cycles and computing the freeze–thaw splitting tensile strength ratio, the water stability was assessed. Figure 2 is the test specimen preparation schema.
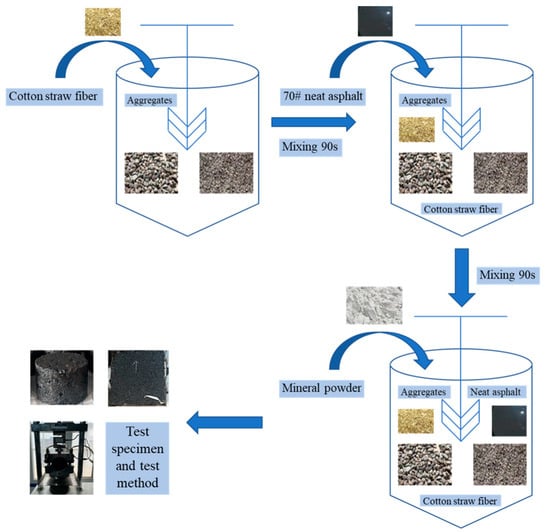
Figure 2.
Test specimen preparation schema.
2.3. Test Design
Response Surface Methodology (RSM) is a statistical technique used for optimization and modeling [22,23]. Box–Behnken Design (BBD), a type of RSM, was employed to design the experiments. In this research, the Design-Expert 13 was used for RSM design. This study chose cotton straw fiber content, fiber length, and asphalt content as the main influencing factors because of the impact of these variables on the dispersion and uniformity of fibers within the asphalt mixture, as well as the impact of the asphalt content on mixture performance. Specifically, the range for cotton straw fiber content was set between 0.2% and 0.4%, fiber length between 3 mm and 9 mm, and asphalt content between 4.5% and 5.5% [6,24]. The performance of asphalt mixes treated with cotton straw fiber under varied circumstances was thoroughly examined using the experimental procedures described in Section 2.2. Flexural tensile strength, stability, dynamic stability, and freeze–thaw strength ratio were among the assessment parameters. Table 4 provides a summary of the experimental setup and findings.
Table 4.
The experimental design and results.
3. Results and Analysis
3.1. Statistical Analysis
According to the experimental results, variance analysis was conducted using the BBD method to explore the interaction between influencing factors and response variables. This allows for an assessment of the model’s validity and the significance of each variable, ultimately leading to the determination of the regression equations between the influencing factors and the response variables. A quadratic model was selected based on the experimental results, with the relationships between each response variable and the independent variables shown in Equations (1) to (4). Table 5 presents the variance analysis results for the response variables.
Here: Strength is the low-temperature flexural tensile strength; TSR is the freeze–thaw strength ratio; A, B, C is the fiber content, fiber length, and asphalt content, respectively.
Table 5.
Results of model ANOVA and fitting statistics.
Table 5.
Results of model ANOVA and fitting statistics.
| Source | Sum of Squares | Df | Mean Square | F-Value | p-Value | |
|---|---|---|---|---|---|---|
| Stability | ||||||
| Model | 6.55 | 9 | 0.7278 | 42.11 | <0.0001 | Significant |
| A | 1.61 | 1 | 1.61 | 93.20 | <0.0001 | Significant |
| B | 0.1568 | 1 | 0.1568 | 9.07 | 0.0196 | Significant |
| C | 0.1128 | 1 | 0.1128 | 6.53 | 0.0378 | Significant |
| AB | 0.0025 | 1 | 0.0025 | 0.1446 | 0.7150 | |
| AC | 0.0012 | 1 | 0.0012 | 0.0709 | 0.7978 | |
| BC | 0.0016 | 1 | 0.0016 | 0.0926 | 0.7698 | |
| A2 | 0.2089 | 1 | 0.2089 | 12.09 | 0.0103 | Significant |
| B2 | 0.0466 | 1 | 0.0466 | 2.70 | 0.1445 | |
| C2 | 4.53 | 1 | 4.53 | 262.06 | <0.0001 | Significant |
| Residual | 0.1210 | 7 | 0.0173 | |||
| Lack of Fit | 0.0339 | 3 | 0.0113 | 0.5194 | 0.6913 | Not significant |
| Pure Error | 0.0871 | 4 | 0.0218 | |||
| Cor Total | 6.67 | 16 | ||||
| Std. Dev. | 0.1315 | C.V. % | 1.06 | Adeq Precision | 23.2177 | |
| R2 | 0.9819 | Adjusted R2 | 0.9585 | Predicted R2 | 0.8982 | |
| Dynamic Stability | ||||||
| Model | 2.75 × 10⁶ | 9 | 3.056 × 10⁵ | 58.75 | <0.0001 | Significant |
| A | 85,822.25 | 1 | 85,822.25 | 16.50 | 0.0048 | Significant |
| B | 2.113 × 10⁵ | 1 | 2.113 × 10⁵ | 40.63 | 0.0004 | Significant |
| C | 4455.68 | 1 | 4455.68 | 0.8566 | 0.3855 | |
| AB | 5184.00 | 1 | 5184.00 | 0.9966 | 0.3514 | |
| AC | 98,219.56 | 1 | 98,219.56 | 18.88 | 0.0034 | Significant |
| BC | 7191.04 | 1 | 7191.04 | 1.38 | 0.2781 | |
| A2 | 5.390 × 10⁵ | 1 | 5.390 × 10⁵ | 103.63 | <0.0001 | Significant |
| B2 | 1.236 × 10⁶ | 1 | 1.236 × 10⁶ | 237.66 | <0.0001 | Significant |
| C2 | 3.390 × 10⁵ | 1 | 3.390 × 10⁵ | 65.17 | <0.0001 | Significant |
| Residual | 36,410.69 | 7 | 5201.53 | |||
| Lack of Fit | 11,897.17 | 3 | 3965.72 | 0.6471 | 0.6246 | Not significant |
| Pure Error | 24,513.52 | 4 | 6128.38 | |||
| Cor Total | 2.787 × 10⁶ | 16 | ||||
| Std. Dev. | 72.12 | C.V. % | 3.51 | Adeq Precision | 21.7257 | |
| R2 | 0.9869 | Adjusted R2 | 0.9701 | Predicted R2 | 0.9179 | |
| Low-Temperature Tensile Strength | ||||||
| Model | 8.82 | 9 | 0.9801 | 20.39 | 0.0003 | |
| A | 1.01 | 1 | 1.01 | 20.97 | 0.0025 | Significant |
| B | 0.1800 | 1 | 0.1800 | 3.74 | 0.0942 | |
| C | 0.0098 | 1 | 0.0098 | 0.2039 | 0.6653 | |
| AB | 0.0025 | 1 | 0.0025 | 0.0520 | 0.8261 | |
| AC | 0.0144 | 1 | 0.0144 | 0.2995 | 0.6012 | |
| BC | 0.0529 | 1 | 0.0529 | 1.10 | 0.3290 | |
| A2 | 2.45 | 1 | 2.45 | 50.99 | 0.0002 | Significant |
| B2 | 4.24 | 1 | 4.24 | 88.11 | <0.0001 | Significant |
| C2 | 0.2590 | 1 | 0.2590 | 5.39 | 0.0533 | |
| Residual | 0.3365 | 7 | 0.0481 | |||
| Lack of Fit | 0.0220 | 3 | 0.0073 | 0.0933 | 0.9599 | |
| Pure Error | 0.3145 | 4 | 0.0786 | |||
| Cor Total | 9.16 | 16 | ||||
| Std. Dev. | 0.2193 | C.V. % | 1.90 | Adeq Precision | 13.3560 | |
| R2 | 0.9633 | Adjusted R2 | 0.9160 | Predicted R2 | 0.9079 | |
| Freeze–Thaw Strength Ratio | ||||||
| Model | 241.45 | 9 | 26.83 | 67.20 | <0.0001 | Significant |
| A | 3.25 | 1 | 3.25 | 8.14 | 0.0246 | Significant |
| B | 8.41 | 1 | 8.41 | 21.05 | 0.0025 | Significant |
| C | 15.40 | 1 | 15.40 | 38.58 | 0.0004 | Significant |
| AB | 0.7225 | 1 | 0.7225 | 1.81 | 0.2205 | |
| AC | 0.3600 | 1 | 0.3600 | 0.9018 | 0.3739 | |
| BC | 1.56 | 1 | 1.56 | 3.91 | 0.0884 | |
| A2 | 52.91 | 1 | 52.91 | 132.54 | <0.0001 | Significant |
| B2 | 95.80 | 1 | 95.80 | 239.98 | <0.0001 | Significant |
| C2 | 41.65 | 1 | 41.65 | 104.32 | <0.0001 | Significant |
| Residual | 2.79 | 7 | 0.3992 | |||
| Lack of Fit | 0.1425 | 3 | 0.0475 | 0.0716 | 0.9721 | Not significant |
| Pure Error | 2.65 | 4 | 0.6630 | |||
| Cor Total | 244.24 | 16 | ||||
| Std. Dev. | 0.6318 | C.V. % | 0.7176 | Adeq Precision | 21.4664 | |
| R2 | 0.9886 | Adjusted R2 | 0.9738 | Predicted R2 | 0.9737 | |
In this section, only the results of the model’s analysis of variance were explored. The effects of influencing factors on the response variables will be explored in more detail in subsequent sections. In Table 5, the F-value is a statistical measure used to evaluate the significance of the model or each factor, representing the ratio of the model variance to the error variance. A larger F-value typically indicates a significant impact of the model or factor on the response variable. The p-value represents the probability of obtaining the current F-value under the assumption that the factor or model has no significant effect on the response variable. If the p-value is less than the predefined significance level, the factor or model is considered to have a significant influence on the response variable. R2 is a measure of the goodness of fit of the model, indicating the proportion of the total variability in the response variable that can be explained by the model. Adjusted R2 accounts for the complexity of the model and provides a fairer evaluation of the model’s fit compared with R2. Lack of Fit indicates whether the model fails to capture the true variation pattern in the response variable, leading to discrepancies between the predicted values and the observed experimental data. The Lack of Fit test assesses whether the model sufficiently describes the variability in the data. A non-significant Lack of Fit is desirable, as it suggests that the selected model fits the data well. Adeq Precision is the ratio of signal to noise and is used to evaluate whether the model is suitable for predicting new design points. A high Adeq Precision value indicates that the model has good predictive capability, effectively distinguishing between signal and noise within the design space.
The variance analysis results for the models differ across the various response variables. Specifically, the model F-values for stability, dynamic stability, flexural tensile strength, and freeze–thaw strength ratio are 42.11, 58.75, 20.39, and 67.20, respectively. These F-values indicate that the model has a significant impact on the response variables. For these four metrics, the probability that such large F-values could be due to noise is 0.01%, 0.01%, 0.03%, and 0.01%, respectively. The p-values for the stability, dynamic stability, and freeze–thaw strength ratio models are all less than 0.0001, while the p-value for the flexural tensile strength model is 0.0003. These results show that all four models have p-values below 0.0500, indicating that the model terms are significant. For the stability, dynamic stability, flexural tensile strength, and freeze–thaw strength ratio models, the Lack of Fit F-values are 0.5194, 0.6471, 0.0933, and 0.0716, respectively. This suggests that the Lack of Fit is not significant relative to the pure error, with a 69.13%, 62.46%, 95.99%, and 97.21% chance, respectively, that such large Lack of Fit F-values could arise due to noise. A non-significant Lack of Fit is desirable. The R2 values for the models of stability, dynamic stability, flexural tensile strength, and freeze–thaw strength ratio are 0.9819, 0.9869, 0.9633, and 0.9886, respectively. This indicates that the models exhibit an exceptionally high degree of fit for all response variables, explaining the vast majority of variability and demonstrating strong predictive power. The models also show good robustness and reliability across different conditions. For all four models, the difference between Adjusted R2 and Predicted R2 is less than 0.2. For example, in the stability model, the Adjusted R2 is 0.9585, and the Predicted R2 is 0.8982, with a difference of 0.06. This result suggests that the models’ fit quality and predictive capability are relatively consistent, indicating that the models are neither overfitting nor underfitting and can reliably make predictions within the design space. This consistency is a positive signal for the model’s suitability for prediction and optimization. Regarding the Adeq Precision metric, the models for stability, dynamic stability, flexural tensile strength, and freeze–thaw strength ratio have Adeq Precision values of 23.217, 21.7257, 13.3560, and 21.4664, respectively. Typically, an Adeq Precision value greater than 4 indicates that the model has an adequate signal-to-noise ratio for reliable predictions. All the indicators have Adeq Precision values well above this threshold, especially stability and dynamic stability, which suggests that these models have very strong predictive capability and robustness within the design space. Although the Adeq Precision for low-temperature tensile strength is relatively lower, it is still significantly above 4, indicating that the model remains reliable for predictions under low-temperature conditions. Overall, these models demonstrate strong predictive performance across all response variables, indicating that these models can be effectively used to navigate the design space.
3.2. Stability Analysis
The effect of different factors on stability is shown in Figure 3. The findings show that as the fiber concentration and length of the cotton-straw-fiber-modified asphalt mixture increase, so does its stability. This implies that adding fibers considerably improves the mixture’s stability. Specifically, when the fiber content increases from 0.2% to 0.3%, the improvement in stability is gradual, indicating that the reinforcing effect of the fibers starts to become more evident within this range. However, when the amount of fiber is raised to 0.4%, the rate of stability improvement accelerates notably, implying that the reinforcing effect of fibers becomes more pronounced at higher contents. This may be related to the uniform distribution of fibers within the mixture and the strength characteristics of the fibers. Further analysis reveals that when the fiber content is 0.3% and the asphalt content is 5%, fiber length also significantly affects the stability of the mixture. For example, when the fiber length is 3 mm, the stability is 12.70 kN, whereas increasing the fiber length to 9 mm raises the stability to 12.98 kN. This indicates that longer fibers have a positive impact on stability, though the improvement tends to level off. This could be because longer fibers are better at distributing stress and enhancing the structural integrity of the mixture, but beyond a certain length, additional fiber length contributes less to stability. Additionally, the stability of the mixture is influenced by the asphalt content. As the asphalt content increases, the stability first rises and then gradually decreases. This suggests that increasing the asphalt content enhances the bonding and overall stability of the mixture up to a point, but excessive asphalt content may make the mixture too soft, thereby reducing its stability. This phenomenon is probably connected to the viscoelastic characteristics of the asphalt as well as the interaction between the asphalt and aggregate.
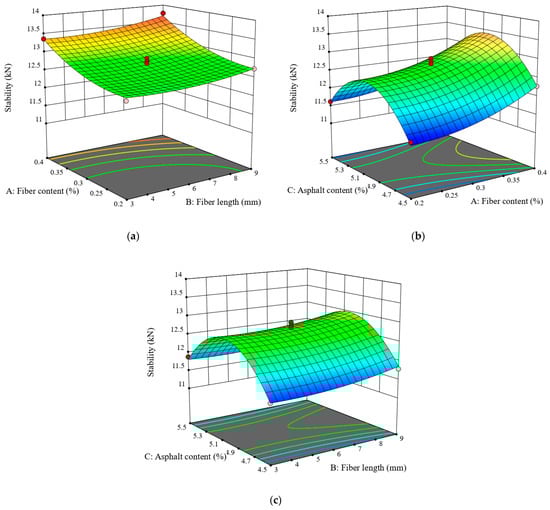
Figure 3.
Effect of different factors on stability (a) fiber content and length (b) fiber and asphalt content (c) fiber length and asphalt content.
3.3. High-Temperature Performance Analysis
Figure 4 displays the impact of several parameters on dynamic stability. The study’s findings show that, although their impacts and trends vary, the dynamic stability of the cotton-straw-fiber-modified asphalt mixture is greatly impacted by the fiber content, fiber length, and asphalt content. As fiber content increases from 0.2% to 0.3%, dynamic stability improves, suggesting that an optimal fiber amount enhances the mixture’s shear resistance. This improvement is likely due to the increased internal cohesion from the fibers. However, further increasing fiber content to 0.4% results in decreased dynamic stability, possibly due to an uneven internal structure or negative interactions between fibers, which can weaken overall performance. Notably, the improvement in dynamic stability at lower fiber contents is more substantial than the subsequent decrease, highlighting the significant positive effect of lower fiber levels. Similarly, the impact of fiber length on dynamic stability follows a comparable trend. Increasing fiber length from 3 mm to 6 mm enhances dynamic stability, indicating that a moderate increase in fiber length bolsters the material’s structural integrity. However, extending the fiber length to 9 mm reduces dynamic stability, likely due to difficulties in even distribution within the mixture, leading to localized stress concentrations or issues with the fiber network. Asphalt content also affects dynamic stability, but its impact is relatively smaller compared with fiber content and fiber length. Increasing asphalt content initially improves dynamic stability but eventually leads to a decrease. This is because an optimal amount of asphalt enhances cohesion and flexibility, improving dynamic stability. Conversely, excessive asphalt content can make the mixture too soft, reducing shear resistance and ultimately decreasing dynamic stability [25,26].
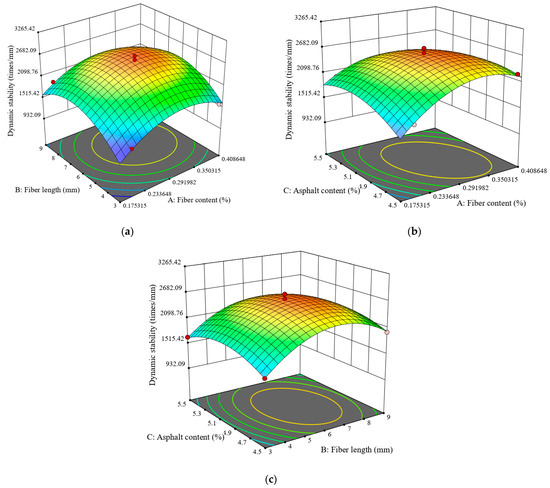
Figure 4.
Effect of different factors on dynamic stability (a) fiber content and length (b) fiber and asphalt content (c) fiber length and asphalt content.
3.4. Low-Temperature Performance Analysis
The effect of different factors on flexural tensile strength is shown in Figure 5. The figure illustrates that the flexural tensile strength initially increases and then decreases as fiber length, fiber content, and asphalt content rise. The effects of these factors on tensile strength vary, as detailed below: when fiber content is 0.3% and asphalt content is 5%, increasing fiber length from 3 mm to 6 mm significantly enhances flexural tensile strength by 10.16%. This suggests that, at these levels of fiber and asphalt content, a moderate increase in fiber length effectively improves tensile performance. However, further extending the fiber length to 9 mm results in a 6.81% decrease in tensile strength, likely due to uneven internal structure caused by excessive fiber length, which reduces its reinforcing effect. Similarly, when fiber content is increased to 0.4%, and with the same asphalt content, increasing fiber length from 3 mm to 6 mm yields a 10.74% improvement in flexural tensile strength. This result is consistent with the previous finding, indicating that a suitable fiber length remains effective even at a higher fiber content [27]. Nevertheless, increasing the fiber length to 9 mm again reduces tensile strength by 6.79%, confirming that overly long fibers may have detrimental effects. For a fixed fiber length of 6 mm and asphalt content of 5%, increasing fiber content from 0.2% to 0.3% improves flexural tensile strength by 9.86%. This demonstrates that within an appropriate range, fiber content positively influences tensile properties. However, further increasing fiber content to 0.4% decreases tensile strength by 3.28%, likely due to interference between fibers at higher content levels, which compromises overall material performance. Finally, with a fiber content of 0.3% and fiber length of 6 mm, increasing asphalt content from 4.5% to 5.5% results in only a slight increase in flexural tensile strength by 0.57%. This indicates that, with these specific fiber content and length, asphalt content has a relatively minor effect on tensile strength. However, when fiber content is increased to 0.4%, the same change in asphalt content leads to a 0.42% decrease in tensile strength. Furthermore, with fiber length extended to 9 mm, tensile strength decreases by an additional 1.39%. This suggests that, at a higher fiber content and longer fiber length, increasing asphalt content may negatively impact tensile performance.
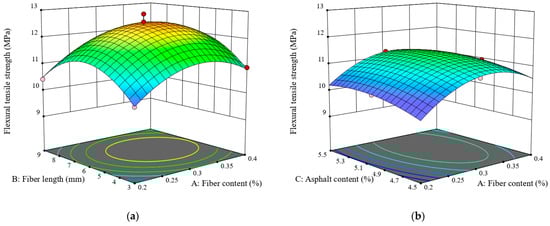
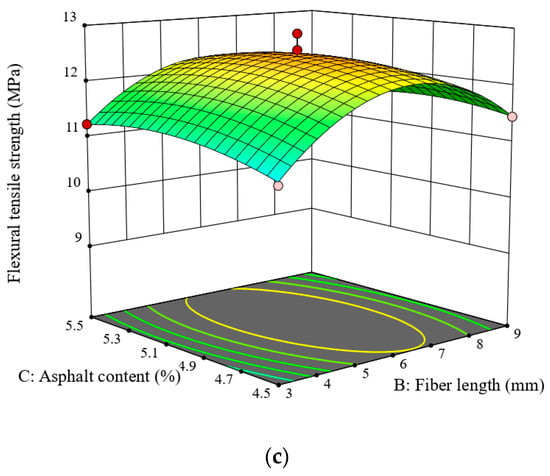
Figure 5.
Effect of different factors on flexural tensile strength (a) fiber content and length (b) fiber and asphalt content (c) fiber length and asphalt content.
3.5. Water Stability Performance Analysis
The effect of different factors on freeze–thaw strength ratio is shown in Figure 6. The figure illustrates that the freeze–thaw strength ratio initially increases and then decreases as fiber length, fiber content, and asphalt content rise, reflecting a complex interaction among these factors. Firstly, with a fiber content of 0.3% and asphalt content of 5%, extending the fiber length from 3 mm to 6 mm significantly enhances the freeze–thaw strength ratio by 6.60%. This improvement suggests that a moderate increase in fiber length improves the material’s freeze–thaw resistance, likely due to the uniform distribution of shorter fibers enhancing structural stability [25]. However, increasing the fiber length to 9 mm results in a 4.0% reduction in freeze–thaw strength ratio, possibly due to uneven fiber distribution or clustering that reduces the fibers’ reinforcing effect. Similarly, at a fiber content of 0.4%, with asphalt content at 5%, increasing fiber length from 3 mm to 6 mm boosts the freeze–thaw strength ratio by 6.31%. This reinforces the benefit of moderate fiber length. Yet, extending the fiber length to 9 mm leads to a 4.60% decrease in the freeze–thaw strength ratio, indicating that excessive fiber length at higher contents can still have detrimental effects, possibly due to fiber interference or excessive bridging, which causes structural non-uniformity. For a fixed fiber length of 6 mm and asphalt content of 5%, increasing fiber content from 0.2% to 0.3% improves the freeze–thaw strength ratio by 4.69%. This demonstrates that within an optimal range, increased fiber content can significantly enhance freeze–thaw performance [28]. However, increasing fiber content further to 0.4% results in a 3.11% decrease in the ratio, likely due to reduced material density from excess fibers affecting overall freeze–thaw resistance. With fiber content at 0.3% and fiber length at 6 mm, increasing asphalt content from 4.5% to 5% results in a 5.10% increase in freeze–thaw strength ratio, indicating that moderate asphalt content improves toughness and adhesion, thus enhancing freeze–thaw resistance. However, increasing asphalt content to 5.5% leads to a 1.88% decrease, likely due to increased brittleness from excessive asphalt affecting performance. When fiber content is 0.4% and fiber length is 6 mm, increasing asphalt content from 4.5% to 5% results in a 4.91% increase in freeze–thaw strength ratio. Further increasing asphalt content to 5.5% results in a 2.27% decrease, supporting the idea that moderate asphalt content benefits freeze–thaw resistance, but excessive amounts may have negative effects. Finally, with fiber content at 0.3% and fiber length extended to 9 mm, increasing asphalt content from 4.5% to 5% improves freeze–thaw strength ratio by 6.10%. This suggests that a combination of longer fibers and moderate asphalt content enhances freeze–thaw resistance. However, increasing asphalt content to 5.5% results in a 1.26% decrease, indicating that too much asphalt may weaken overall stability.
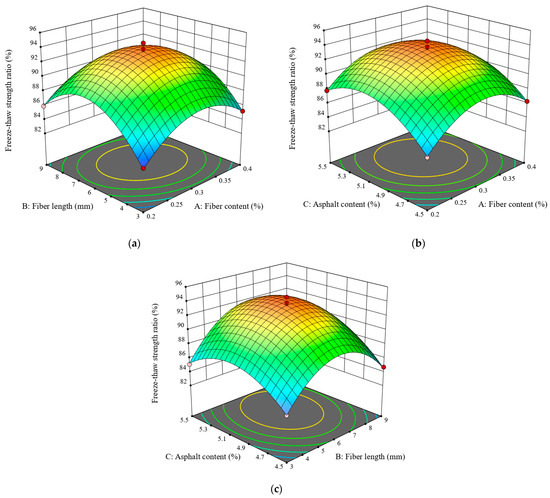
Figure 6.
Effect of different factors on freeze–thaw strength ratio (a) fiber content and length (b) fiber and asphalt content (c) fiber length and asphalt content.
4. Model Validation and Performance Comparison
4.1. Model Validation
The analysis indicates that fiber content, fiber length, and asphalt content significantly impact the performance of cotton-straw-fiber-modified asphalt mixtures. Traditional Marshall design methods for determining the optimal combination of multiple factors often require substantial resources and time. However, this study utilized a predictive model to perform multi-factor parameter optimization, aiming to enhance design efficiency and meet specification requirements. In the optimization process, the minimum values were set as follows: stability at 8 kN, dynamic stability at 2000 times/mm, and freeze–thaw strength ratio at 80%, with flexural tensile strength adjusted within the experimental data range. In practical applications, weights for each response value can be adjusted based on regional climate characteristics to fit specific environmental conditions. In this study, equal weights were assigned to each indicator, and the optimal parameter combination derived from the predictive model was as follows: 0.28% fiber content, 6.26 mm fiber length, and 5.35% asphalt content. Under this combination, the optimal Marshall stability was 12.246 kN, dynamic stability was 2452.396 times/mm, flexural tensile strength was 12.30 MPa, and the freeze–thaw strength ratio was 92.76%. To verify the reliability of the predictive model, experimental validation was conducted with a fiber content of 0.3%, a fiber length of 6 mm, and an asphalt content of 5.3%. Five specimens were prepared for each experiment, and the average values were recorded. The actual results and predicted values are shown in Table 6. The results demonstrate that the relative error between the model predictions and actual test values is within 10%. This indicates that RSM is effective for mixture design and accurately predicts the optimal combination of fiber content, fiber length, and asphalt content. Furthermore, the study shows that Response Surface Methodology not only offers high reliability but also allows for adjustments in the weighting of performance indicators based on regional needs, thus enabling more precise and targeted design. This provides a powerful tool for optimizing asphalt mixture performance in various regions, significantly improving design efficiency and accuracy.
Table 6.
Comparative analysis of predicted and experimental results.
4.2. Performance Comparison
Indirect tensile fatigue tests were used in this work to assess the fatigue resistance of asphalt mixes treated with cotton straw fiber. Following the optimized design parameters, cotton-straw-fiber-modified asphalt mixtures were prepared alongside unmodified and SBS-modified asphalt mixtures as control groups. The mixes used in the testing were graded as AC-13, with the SBS-modified asphalt being SBS I-D polymer-modified asphalt. Fatigue testing was conducted using a UTM-25 fatigue testing machine on the three types of mixtures to assess their fatigue resistance under repeated loading. Tests were carried out using beam specimens of 380 mm × 50 mm × 63 mm under stress control settings. With a loading frequency of 10 Hz and a continuous half-sine waveform, the testing temperature was set at 20 °C. In order to provide a realistic evaluation of the material’s fatigue performance, this setup attempts to replicate the dynamic stresses that asphalt mixes encounter during road usage. Figure 7 displays the results of the fatigue test.
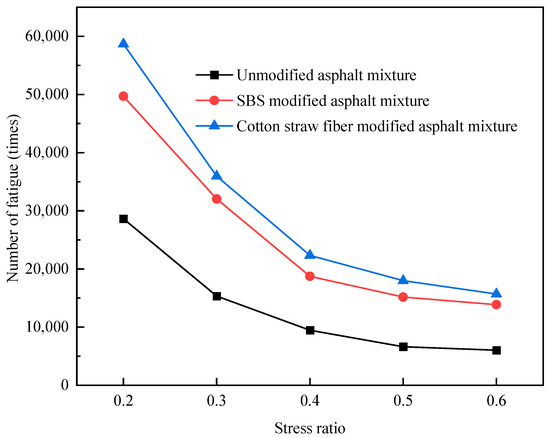
Figure 7.
Fatigue test results of different asphalt mixtures.
According to the test results, the fatigue life of all asphalt mixes reduces as the stress ratio rises. However, the rate of decline varies among different mixtures, with the reduction slowing at higher stress ratios. At the same stress ratio, asphalt mixes treated with cotton straw fiber have the longest fatigue life, followed by asphalt mixtures modified with SBS. At the same stress ratio, unmodified asphalt mixtures have the shortest fatigue life. These findings suggest that the fatigue performance of asphalt mixes is considerably enhanced by the addition of cotton straw fibers. This enhancement is likely due to the fibers’ ability to bridge microcracks and delay their propagation, owing to their uniform distribution in the mixture. Additionally, the fibers enhance the mixture’s adhesion and internal structure, helping to better dissipate stress during repeated loading and thus extending fatigue life [12,29]. In contrast, unmodified asphalt mixtures, which lack this reinforcing effect, exhibit poorer fatigue performance, with cracks forming and spreading more rapidly under stress, resulting in a shorter fatigue life compared to modified mixtures. Although SBS-modified asphalt mixtures also show good fatigue resistance, they are outperformed by those with cotton straw fibers. This highlights the significant advantage of cotton straw fibers in improving the fatigue performance of asphalt mixes. Overall, the indirect tensile fatigue tests confirm the effectiveness of cotton straw fiber modification, demonstrating its substantial improvement in fatigue resistance, especially under high-stress conditions.
5. Conclusions
The application of cotton straw fiber to asphalt mixture modification was investigated in this study. The primary influencing factors, including fiber content, fiber length, and asphalt content, were analyzed to understand their combined effects on the performance of the cotton-straw-fiber-modified asphalt mixes. The key conclusions are as follows.
- Performance gains are noticeable when cotton straw fibers are added to asphalt mixes. The optimal parameter combination derived from the predictive model was as follows: 0.28% fiber content, 6.26 mm fiber length, and 5.35% asphalt content. Under this combination, the optimal Marshall stability was 12.246 kN, dynamic stability was 2452.396 times/mm, flexural tensile strength was 12.30 MPa, and the freeze–thaw strength ratio was 92.76%.
- The variance analysis reveals that the models for stability, dynamic stability, flexural tensile strength, and freeze–thaw strength ratio exhibit high F-values and low p-values (all < 0.05), indicating significant impacts and reliable model terms. The models show high R2 values (all > 0.95), minimal differences between Adjusted R2 and Predicted R2, and Adeq Precision values well above 4, demonstrating strong predictive power and robustness across all metrics. These results confirm the models’ reliability for effective predictions and optimization.
- Based on the optimization results, errors across all responses were less than 10%. This demonstrates that Response Surface Methodology (RSM) is highly effective and provides reliable predictions for designing and optimizing high-performance asphalt mixtures.
- When compared with both SBS-modified and untreated asphalt mixes, the cotton-straw-fiber-modified asphalt mixtures show better fatigue resistance. As the stress ratio increases, fatigue life declines for all mixtures, but cotton straw fibers significantly enhance performance by bridging microcracks and improving stress dissipation. This modification extends fatigue life more effectively than SBS, underscoring the substantial benefits of cotton straw fibers in enhancing asphalt mixture durability, especially under high-stress conditions.
- In this study, the performance of cotton-straw-fiber-modified asphalt mixtures was evaluated by experimental design. A method used to optimize the performance of modified asphalt mixtures was proposed for its popularization and application. The modification mechanism can be further investigated by carrying out microstructural analysis in subsequent studies.
Author Contributions
Conceptualization, G.H., X.C., and Z.C.; methodology, Z.C.; software, L.Y.; validation, X.C.; investigation, Z.C. and L.Y.; data curation, G.H., X.C., and Z.C.; writing—original draft preparation, G.H. and X.C.; writing—review and editing, Z.C. and L.Y. All authors have read and agreed to the published version of the manuscript.
Funding
This research received no external funding.
Data Availability Statement
The original contributions presented in the study are included in the article. Further inquiries can be directed to the corresponding author.
Conflicts of Interest
Zhonglu Cao was employed by the company Tianjin Port Engineering Institute Co., Ltd. of CCCC First Harbor Engineering Co., Ltd. The remaining authors declare that the research was conducted in the absence of any commercial or financial relationships that could be construed as a potential conflict of interest.
References
- Radhakrishnan, S. Sustainable cotton production. In Sustainable Fibres and Textiles; Elsevier: Amsterdam, The Netherlands, 2017; pp. 21–67. [Google Scholar]
- Abd El-Sayed, E.S.; El-Sakhawy, M.; El-Sakhawy, M.A.-M. Non-wood fibers as raw material for pulp and paper industry. Nord. Pulp Pap. Res. J. 2020, 35, 215–230. [Google Scholar] [CrossRef]
- Hamawand, I.; Sandell, G.; Pittaway, P.; Chakrabarty, S.; Yusaf, T.; Chen, G.; Seneweera, S.; Al-Lwayzy, S.; Bennett, J.; Hopf, J. Bioenergy from cotton industry wastes: A review and potential. Renew. Sustain. Energy Rev. 2016, 66, 435–448. [Google Scholar] [CrossRef]
- Canestrari, F.; Ingrassia, L.P. A review of top-down cracking in asphalt pavements: Causes, models, experimental tools and future challenges. J. Traffic Transp. Eng. 2020, 7, 541–572. [Google Scholar] [CrossRef]
- Du, Y.; Chen, J.; Han, Z.; Liu, W. A review on solutions for improving rutting resistance of asphalt pavement and test methods. Constr. Build. Mater. 2018, 168, 893–905. [Google Scholar] [CrossRef]
- Li, W. Study on Performance of Asphalt Mixture with Cotton Stalk Fiber. Master’s Thesis, Chang’an University, Xi’an, China, 2015. [Google Scholar]
- Lei, T.; Li, Z.; Liu, K.; Zhao, H.; Li, W. Cotton straw fiber asphalt mixture road performance. Highway 2016, 7, 59–63. [Google Scholar]
- Tamburro, D.A. The effect of short chrysotile asbestos fibers on the structural properties of asphaltic pavenents. Proc. Ass. Asph. Pav. Technol 1962, 31, 151–175. [Google Scholar]
- Bernstein, D.M. The health effects of short fiber chrysotile and amphibole asbestos. Crit. Rev. Toxicol. 2022, 52, 89–112. [Google Scholar] [CrossRef]
- Osinubi, O.; Gochfeld, M.; Kipen, H.M. Health effects of asbestos and nonasbestos fibers. Environ. Health Perspect. 2000, 108, 665–674. [Google Scholar]
- Zhang, J.; Dong, X. Comparative study on the properties of different fiber-modified asphalts. Asian J. Adv. Res. Rep. 2024, 18 (Suppl. S4), 148–154. [Google Scholar] [CrossRef]
- Luo, D.; Khater, A.; Yue, Y.; Abdelsalam, M.; Zhang, Z.; Li, Y.; Li, J.; Iseley, D.T. The performance of asphalt mixtures modified with lignin fiber and glass fiber: A review. Constr. Build. Mater. 2019, 209, 377–387. [Google Scholar] [CrossRef]
- Li, Z.; Li, K.; Chen, W.; Liu, W.; Yin, Y.; Cong, P. Investigation on the characteristics and effect of plant fibers on the properties of asphalt binders. Constr. Build. Mater. 2022, 338, 127652. [Google Scholar] [CrossRef]
- Guo, Y.; Tataranni, P.; Sangiorgi, C. The use of fibres in asphalt mixtures: A state of the art review. Constr. Build. Mate.R 2023, 390, 131754. [Google Scholar] [CrossRef]
- Li, Z.; Guo, T.; Chen, Y.; Liu, J.; Ma, J.; Wang, J.; Jin, L. Study on pavement performance of cotton straw cellulose modified asphalt. Mater. Res. Express 2022, 9, 025508. [Google Scholar] [CrossRef]
- Yu, X.; Li, G.; Zhao, H.; Ma, Y.; Li, Q.; Chen, Y.; Li, W. Influence of chemically-modified cotton straw fibers on the properties of asphalt mortar. Case Stud. Constr. Mater. 2023, 18, e01787. [Google Scholar] [CrossRef]
- Zhao, H.; Li, G.; Ma, Y.; Yu, X.; Chen, Y.; Li, W. Long-term performance of chemically modified cotton straw fibers in micro-surfacing asphalt mixtures. Case Stud. Constr. Mater. 2024, 20, e03294. [Google Scholar] [CrossRef]
- Qiang, X.; Lei, L.; Yi-jun, C. Study on the action effect of pavement straw composite fiber material in asphalt mixture. Constr. Build. Mater. 2013, 43, 293–299. [Google Scholar] [CrossRef]
- Fu, S.-Y.; Lauke, B. Effects of fiber length and fiber orientation distributions on the tensile strength of short-fiber-reinforced polymers. Compos. Sci. Technol. 1996, 56, 1179–1190. [Google Scholar] [CrossRef]
- Liu, J.; Li, Z.; Chen, H.; Guan, B.; Liu, K. Investigation of cotton straw fibers for asphalt mixtures. J. Mater. Civil. Eng. 2020, 32, 04020105. [Google Scholar] [CrossRef]
- JTG E20-2011; Standard Test Methods of Bitumen and Bituminous Mixtures for Highway Engineering. People’s Transportation Press: Beijing, China, 2011.
- Bezerra, M.A.; Santelli, R.E.; Oliveira, E.P.; Villar, L.S.; Escaleira, L.A. Response surface methodology (RSM) as a tool for optimization in analytical chemistry. Talanta 2008, 76, 965–977. [Google Scholar] [CrossRef]
- Lapian, F.E.; Ramli, M.I.; Pasra, M.; Arsyad, A. The performance modeling of modified asbuton and polyethylene terephthalate (PET) mixture using response surface methodology (RSM). Appl. Sci. 2021, 11, 6144. [Google Scholar] [CrossRef]
- Guo, F.; Li, R.; Lu, S.; Bi, Y.; He, H. Evaluation of the Effect of Fiber Type, Length, and Content on Asphalt Properties and Asphalt Mixture Performance. Materials 2020, 13, 1556. [Google Scholar] [CrossRef] [PubMed]
- Fang, B.; Chang, D.; Xu, Z.; Gao, C. A review on graphene fibers: Expectations, advances, and prospects. Adv. Mater. 2020, 32, 1902664. [Google Scholar] [CrossRef] [PubMed]
- Zhang, M.; Hu, Z.; Zhao, J.; Li, H.; Zhang, J.; Lyu, L.; Wang, X.; Niu, Z.; Cai, J.; Pei, J. Components optimization of polyurethane-modified asphalt binder towards compatibility: Insight from molecular dynamics simulations. Constr. Build. Mater. 2024, 448, 138229. [Google Scholar] [CrossRef]
- Capela, C.; Oliveira, S.; Pestana, J.; Ferreira, J. Effect of fiber length on the mechanical properties of high dosage carbon reinforced. Procedia Struct. Integr. 2017, 5, 539–546. [Google Scholar] [CrossRef]
- Roustaei, M.; Eslami, A.; Ghazavi, M. Effects of freeze–thaw cycles on a fiber reinforced fine grained soil in relation to geotechnical parameters. Cold Reg. Sci. Technol. 2015, 120, 127–137. [Google Scholar] [CrossRef]
- Ye, Q.; Wu, S.; Li, N. Investigation of the dynamic and fatigue properties of fiber-modified asphalt mixtures. Int. J. Fatigue 2009, 31, 1598–1602. [Google Scholar] [CrossRef]


Disclaimer/Publisher’s Note: The statements, opinions and data contained in all publications are solely those of the individual author(s) and contributor(s) and not of MDPI and/or the editor(s). MDPI and/or the editor(s) disclaim responsibility for any injury to people or property resulting from any ideas, methods, instructions or products referred to in the content. |
© 2024 by the authors. Licensee MDPI, Basel, Switzerland. This article is an open access article distributed under the terms and conditions of the Creative Commons Attribution (CC BY) license (https://creativecommons.org/licenses/by/4.0/).