Article

Integration of Finite Element Analysis and Machine Learning for Assessing the Spatial-Temporal Conditions of Reinforced Concrete

1
School of Construction Management Technology, Purdue University, West Lafayette, IN 47907, USA
2
Department of Civil, Construction and Environmental Engineering, North Dakota State University, Fargo, ND 58105, USA
3
School of Civil Engineering, Shanghai Normal University, Shanghai 201418, China
*
Author to whom correspondence should be addressed.
Buildings 2025, 15(3), 435; https://doi.org/10.3390/buildings15030435
Submission received: 16 December 2024 / Revised: 25 January 2025 / Accepted: 28 January 2025 / Published: 30 January 2025

Abstract

:
Composite reinforcements are attracting attention in the reinforced concrete (RC) field for their high corrosion resistance, low thermal conductivity, and low electromagnetic interference behavior. However, compared to metallic reinforcements, composites are less ductile and may lead to brittle failure. Three-point flexural tests provide information on the mechanical behavior of metal- and composite-reinforced concrete beams with distinct crack patterns. The structural conditions and failure mechanisms can be defined based on stress change and crack propagation. This study employs finite element analysis (FEA) to simulate the mechanical responses of composite- and metal-reinforced concrete beans under three-point flexural tests and predict the crack propagation in the beams. Machine learning-based algorithms are trained using FEA data to assess the spatial–temporal conditions of the RC beams. The findings indicate that composite rebars provide better reinforcement than metallic rebars in terms of stress fields (30.27% less stress in composite rebars) and crack propagation (fewer cracks in composite RC beams), with the initiation of shear cracks and maximum von Mises stress in rebars being correlated. The findings highlight the effectiveness of the Random Forest Regression (RFR) algorithm ( R 2 = 0.96 ) in assessing RC beam conditions under flexural loads, offering insights for efficient industry applications.

1. Introduction

Concrete is a composite material primarily composed of coarse aggregates, fine aggregates, and cement which, when mixed with water, undergoes hydration to form a hardened mass. It is extensively utilized in various infrastructures due to its versatility in being molded into diverse shapes and forms, making it suitable for various structural components [1]. Because of its high compressive strength and durability, concrete is one of the most widely used construction materials [2]. However, its low tensile strength and brittleness necessitate the incorporation of reinforcement to mitigate these deficiencies. Reinforced concrete (RC) integrates concrete and reinforcement elements by leveraging the compressive strength of concrete and the tensile strength of the reinforcement. This synergistic combination effectively addresses the inherent weaknesses of concrete in terms of tension [3]. In terms of reinforcements, two primary types, metallic and composite, are mainly employed in concrete structural components. Metallic rebars, typically made of steel, are widely favored for their high tensile strength and ductility, which help to enhance the structural integrity of concrete elements, including their the load-bearing capacity and overall resilience. These characteristics make steel rebars suitable for earthquake-prone areas, due to their ability to yield and redistribute stress to help dissipate seismic energy. However, there are also disadvantages associated with the use of steel rebars. One significant disadvantage is their vulnerability to corrosion, especially in aggressive environments with high moisture or chloride levels. The corrosion of steel rebars can lead to structural deterioration, cracking, and reduced service life of the concrete elements [4]. Another disadvantage of steel rebars is their limitations in terms of environmental impact. The production of steel contributes to intensive energy consumption and carbon footprint [5].
As an alternative, composite rebars, such as fiber-reinforced polymer (FRP) rebars, have been widely used as the complement of metallic reinforcement. For example, FRP rebars exhibit high corrosion resistance compared to metallic rebars, making them ideal for structures exposed to aggressive environmental conditions. In such conditions, metallic rebars are vulnerable to corrosion, especially in urban areas with an polluted atmosphere containing sulfur dioxide and nitrogen oxides, as well as in marine conditions with chloride ion attack and carbonation [6,7]. The use of composite materials as reinforcements in concrete structures is increasingly viewed as a viable alternative to steel, particularly in environments where corrosion is a concern [8]. The adoption of FRP rebars can significantly reduce the risk of corrosion-related deterioration, thereby extending the service life of RC structures [9]. Furthermore, composite rebars are non-conductive and non-magnetic, effectively addressing the issues related to thermal conductivity and electromagnetic interference associated with steel rebars [10]. Nevertheless, compared to steel, most composite rebars are more susceptible to brittle failure, which may compromise the overall structural integrity and safety of RC structures [11]. Brittle failure can occur suddenly without significant deformation, which limits the potential of composite rebars in enhancing structural seismic resilience. Consequently, it is imperative to investigate the mechanical performance of both metallic and composite reinforcements, as well as the implications for metallic and composite RC structures.
The flexural test is a basic method used for evaluating the flexural strength and modulus of concrete structures [12]. It provides direct information on cracking and failure modes within concrete structures [13]. During a flexural test, concrete typically exhibits distinct crack propagation over time, offering information about its tensile behaviors and failure mechanisms. Rahman et al. [14] employed image processing techniques to identify and measure crack widths in concrete under flexural loading, comparing the results with conventional strain gauge and linear variable differential transformer measurements. Fischer et al. [15] used distributed fiber optic sensing technology to detect elastic strain, crack formation, and decisive shear cracks in the fracture state. However, these experimental investigations require significant resources regarding materials, labor, and time. Therefore, there is an urgent need to employ a more efficient method to simulate structural behavior and analyze crack propagation.
Computational modeling such as finite element analysis (FEA) is an efficient way to understand the performance of concrete structures with high flexibility. Halahla [16] employed FEA to investigate the behavior of RC beams, focusing on flexural performance and crack propagation patterns. Their study highlighted the effectiveness of FEA in analyzing the response of concrete structures under varying loading conditions. Although FEA generates substantial amounts of numerical and image data, few studies process these data for the purposes of quantitively assessing the crack propagation conditions over time. To perform a comprehensive evaluation of the structural conditions, this paper aims to analyze and predict the spatial–temporal conditions of beams during a three-point flexural test. The spatial aspect considers beam conditions at different locations along the RC beam, and the temporal part represents the beam conditions at different time points. Researchers have applied the term DAMAGET, short for “damage in tension”, to describe the level to which a material experiences damage due to cracking [17]. Each element in the structure has a DAMAGET value ranging from 0 to 1. Higher DAMAGET values indicate greater tensile damage in the elements. When DAMAGET reaches a value of 1, the element is considered as having fully failed. Lv et al. [18] utilized DAMAGET as an index to characterize the damage to a concrete beam under seismic loading. Kujawa et al. [19] modeled a masonry structure and analyzed its crack conditions with the DAMAGET function. Moreover, Mehra et al. [20] predicted the structural response of FRP–concrete composite beams under flexural loading. They visualized and assessed the tensile damage in concrete based on the values of DAMAGET. In this way, DAMAGET could be a useful metric for spatial–temporal condition assessment of RC beams, reflecting the conditions at specific locations and time points. However, FEA simulation requires fine meshes and nonlinear setups to achieve the desired accuracy, which may result in a large computational cost. In addition, whenever results are needed for the flexural test under specific conditions, parameters need to be adjusted and the models need to be rerun. Therefore, machine learning (ML) could be a potentially efficient tool to solve this problem.
Machine learning, an important branch of artificial intelligence, has become integral to digitalization solutions, attracting significant attention in the digital era. This field encompasses a diverse range of algorithms, including supervised, unsupervised, semi-supervised, and reinforcement learning, reflecting the versatility and depth of various algorithms in addressing complex problems across various domains [21]. The main advantage of machine learning is its ability to automatically process information once a model learns how to interpret data [22]. Some researchers have combined ML algorithms with flexural test datasets. Kang et al. [23] developed an optimal ML algorithm based on datasets obtained through extensive literature searches, which can help to predict the compressive and flexural strengths of steel fiber-reinforced concrete (SFRC). Smolnicki et al. [24] used K-means algorithms to analyze the main causes of composite rebar damage during flexural testing. Their work demonstrates the potential of ML in flexural test prediction. However, these authors also mentioned the limitations encountered in their study, where the quality of the algorithms was affected by uneven data distribution and information noise, especially the complexity of the data and lack of additional information. FEA provides a great solution to these data challenges, as validated simulations can generate abundant high-quality data free from noise, addressing issues of uneven data distribution and information complexity. The integration of FEA and ML has been extensively studied and applied in the engineering field, such as in wind turbines, underground pipelines, and shear walls [25,26,27]. This not only helps engineering professionals to reproduce experiments, predict failure modes, and identify sensitive zones, but also deals with the high demand for labor, high costs, and high consumption of materials faced by the traditional civil and construction industry. However, such integrated studies on structural spatial–temporal condition assessment have rarely been undertaken.
Furthermore, researchers usually choose one algorithm for their study, without conducting a comprehensive comparison among various machine learning algorithms. This can lead to more efficient and accurate algorithms being missed. For example, the Gaussian mixture model (GMM) was used for the damage detection of bridge structures under different operational and environmental conditions [28]. Capuano [29] utilized polynomial regression to generate comprehensive relationships between the element state and its forces, which reduced the computational cost of finding the internal displacement field. Therefore, we generate a database from FEA and apply it to train and validate various ML algorithms in this study. Given that FEA provides a comprehensive physics-informed database by accounting for various scenarios such as geometry, materials, loading conditions, and rebar configurations, these data can be used in the supervised learning field. Supervised ML involves developing algorithms capable of generating patterns and hypotheses based on externally provided instances. These algorithms use these patterns to predict the outcomes of future instances. To be more specific, this approach relies on labeled data to train the model, enabling it to make accurate predictions when presented with new, unseen data [30]. Depending on the purpose and data type, supervised learning can be divided into classification tasks and regression tasks. In classification tasks, the target data are generally discrete, such as different labels and colors, while the regression tasks usually aim at fitting the continuous data. With the dataset from the FEA simulations, we can use supervised learning algorithms to address the regression task related to the flexural test. In other words, we can predict the simulation results of any element and at any time step on the beam instead of running the finite element model again.
Thus, this paper proposes an efficient method that combines the advantages of FEA and ML for the spatial–temporal condition assessment of metal- and composite-reinforced concrete beams under three-point flexural tests. This integrated approach not only enhances the precision and efficiency of spatial–temporal condition assessments for metal- and composite-reinforced concrete beams but also offers valuable insights into their performance under critical loading conditions. This adaptable approach can be extended to enhance concrete infrastructure safety, such as bridges and dams, for real-time health condition monitoring. By improving our ability to monitor and predict potential failures in structural components, this research directly supports safer infrastructure design and maintenance practices, ultimately benefiting society by reducing risks and ensuring the longevity of essential structures. In Section 2, the detailed setup of the finite element model, including the geometry, materials, contact, loading, boundary condition, and mesh, is presented. We also illustrate some useful ML regression algorithms and summarize their advantages and disadvantages, as well as the parameters we set when applying these models for the condition assessment. In Section 3, the computational investigation results for composite and metallic RC beams are presented. FEA stress nephograms illustrate the stress distribution on beams and reinforcements. Moreover, we train and compare various ML algorithms using FEA data and select the best one for spatial–temporal condition assessment. The condition assessment results from the selected ML model are compared with simulation results to verify the effectiveness of this method. Furthermore, we discuss the findings from finite element analysis and spatial–temporal condition assessment in detail. The conclusions are presented in Section 4, in which the implications and limitations of the integrated framework are summarized, together with future research directions.

2. Materials and Methods

2.1. Finite Element Modeling
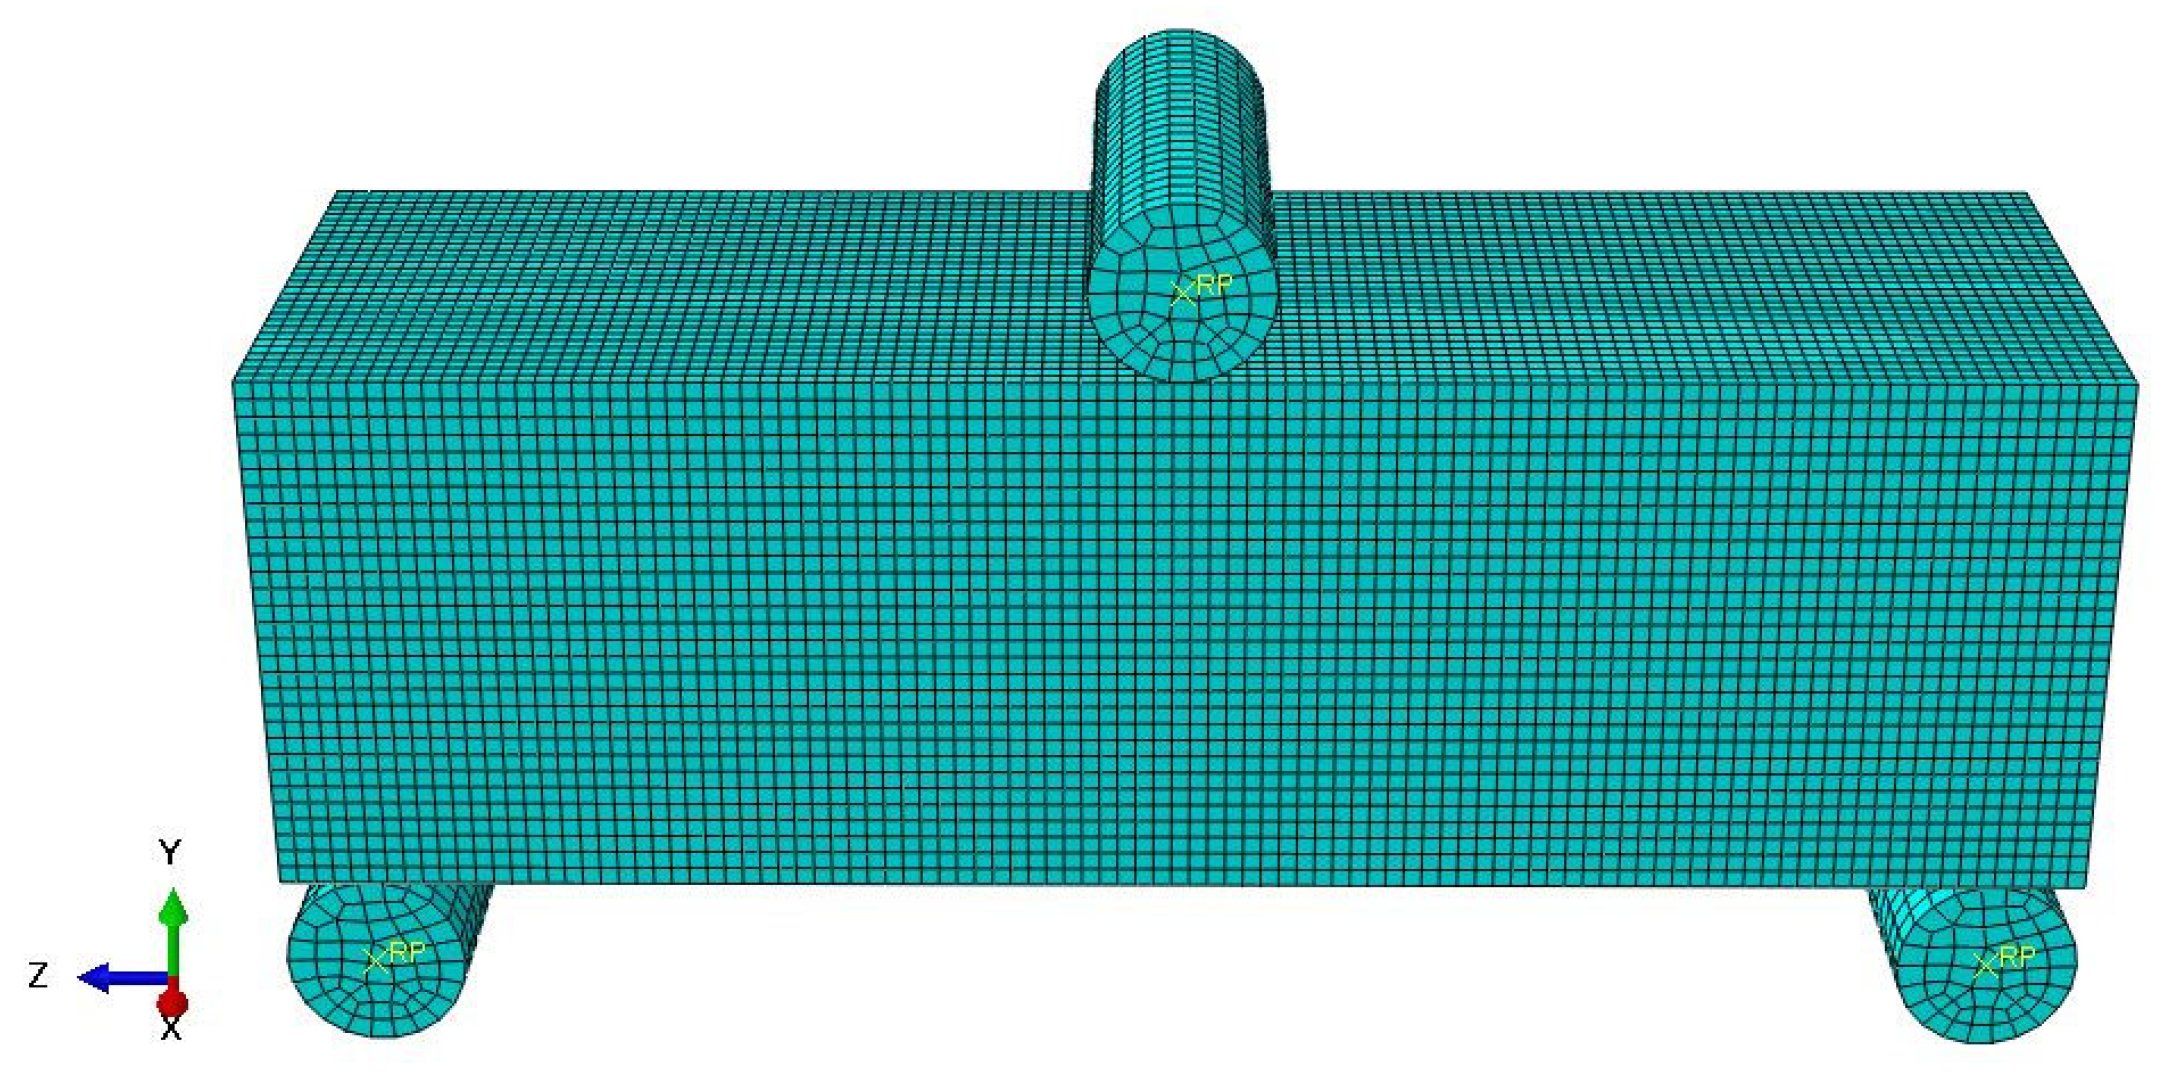
The physical testing of materials is a common way of studying concrete components under various loading conditions. This method can provide the actual structural response. However, physical testing requires substantial amounts of time, labor, and resources. To expedite the analysis process, finite element modeling is a widely used alternative in the analysis of concrete structures. This method enables the detailed numerical simulation of concrete elements and provides accurate predictions of structural behaviors. Additionally, concrete structures exhibit nonlinear responses, particularly in the flexural test, where factors such as cracking, material nonlinearity, and large deformations significantly influence structural performance. Therefore, nonlinear FEA was employed to investigate the mechanical performance of two types of RC beams in this study. We created three-dimensional (3D) finite element models of metallic RC and composite RC beams and conducted three-point flexural strength tests in ABAQUS commercial software. DAMAGET is an output result in ABAQUS, which represents the degree of damage in tension. Specifically, when the tensile stress of the material reaches the threshold defined by DAMAGET, ABAQUS starts to calculate the damage variables and simulate the damage behavior of the material. This approach provided a comprehensive understanding of the structural integrity and failure mechanisms of RC beams under tensile stress.

2.1.1. Geometry

The front view of geometry of the RC beam is shown in Figure 1a. The dimensions of the RC beams followed the requirements of the Standard Test Method for Flexural Strength of Concrete ASTM C293 [31], consisting of a 152.4 mm × 152.4 mm × 508 mm concrete beam and two #3 reinforcements. The rebar span was set as 457.2 mm. The top loading block was positioned at the center, and two bottom rigid supports were placed 25.4 mm away from the edges. The loading head and two bottom supports were 5 mm in radius. ACI 440.11 [32] and ACI 440.1R [33] were used for the configuration design of the composite reinforcement. For studies of composite reinforcements, numerous studies on RC members excluded the presence of transverse reinforcement in order to study shear strength and more brittle failure [34,35]. Therefore, only longitudinal reinforcements were placed in the concrete beam. We employed the same configuration design for metallic and composite reinforcements to evaluate and compare the mechanical performance. The reinforcements had a bottom cover depth of 25.4 mm and were evenly separated with a spacing of 50.8 mm, as shown in Figure 1b. Through the monotonic downward movement of the top loading block, the concrete beam underwent flexural bending, experiencing compression at the top and tension at the bottom.

2.1.2. Materials

Proper material selection in FEA modeling is a vital step which ensures accurate simulation results, realistic material behavior, and effective model design. The concrete damage plasticity (CDP) model in ABAQUS utilizes the concept of isotropic damaged elasticity in combination with isotropic tensile and compressive plasticity to illustrate the inelastic behavior of concrete. The elasto-plasticity model describes how a material initially deforms elastically and then plastically when the stress exceeds yield stress, causing irreversible deformations. Therefore, we applied the CDP model for concrete and the elasto-plasticity model for the reinforcements in the nonlinear analysis.

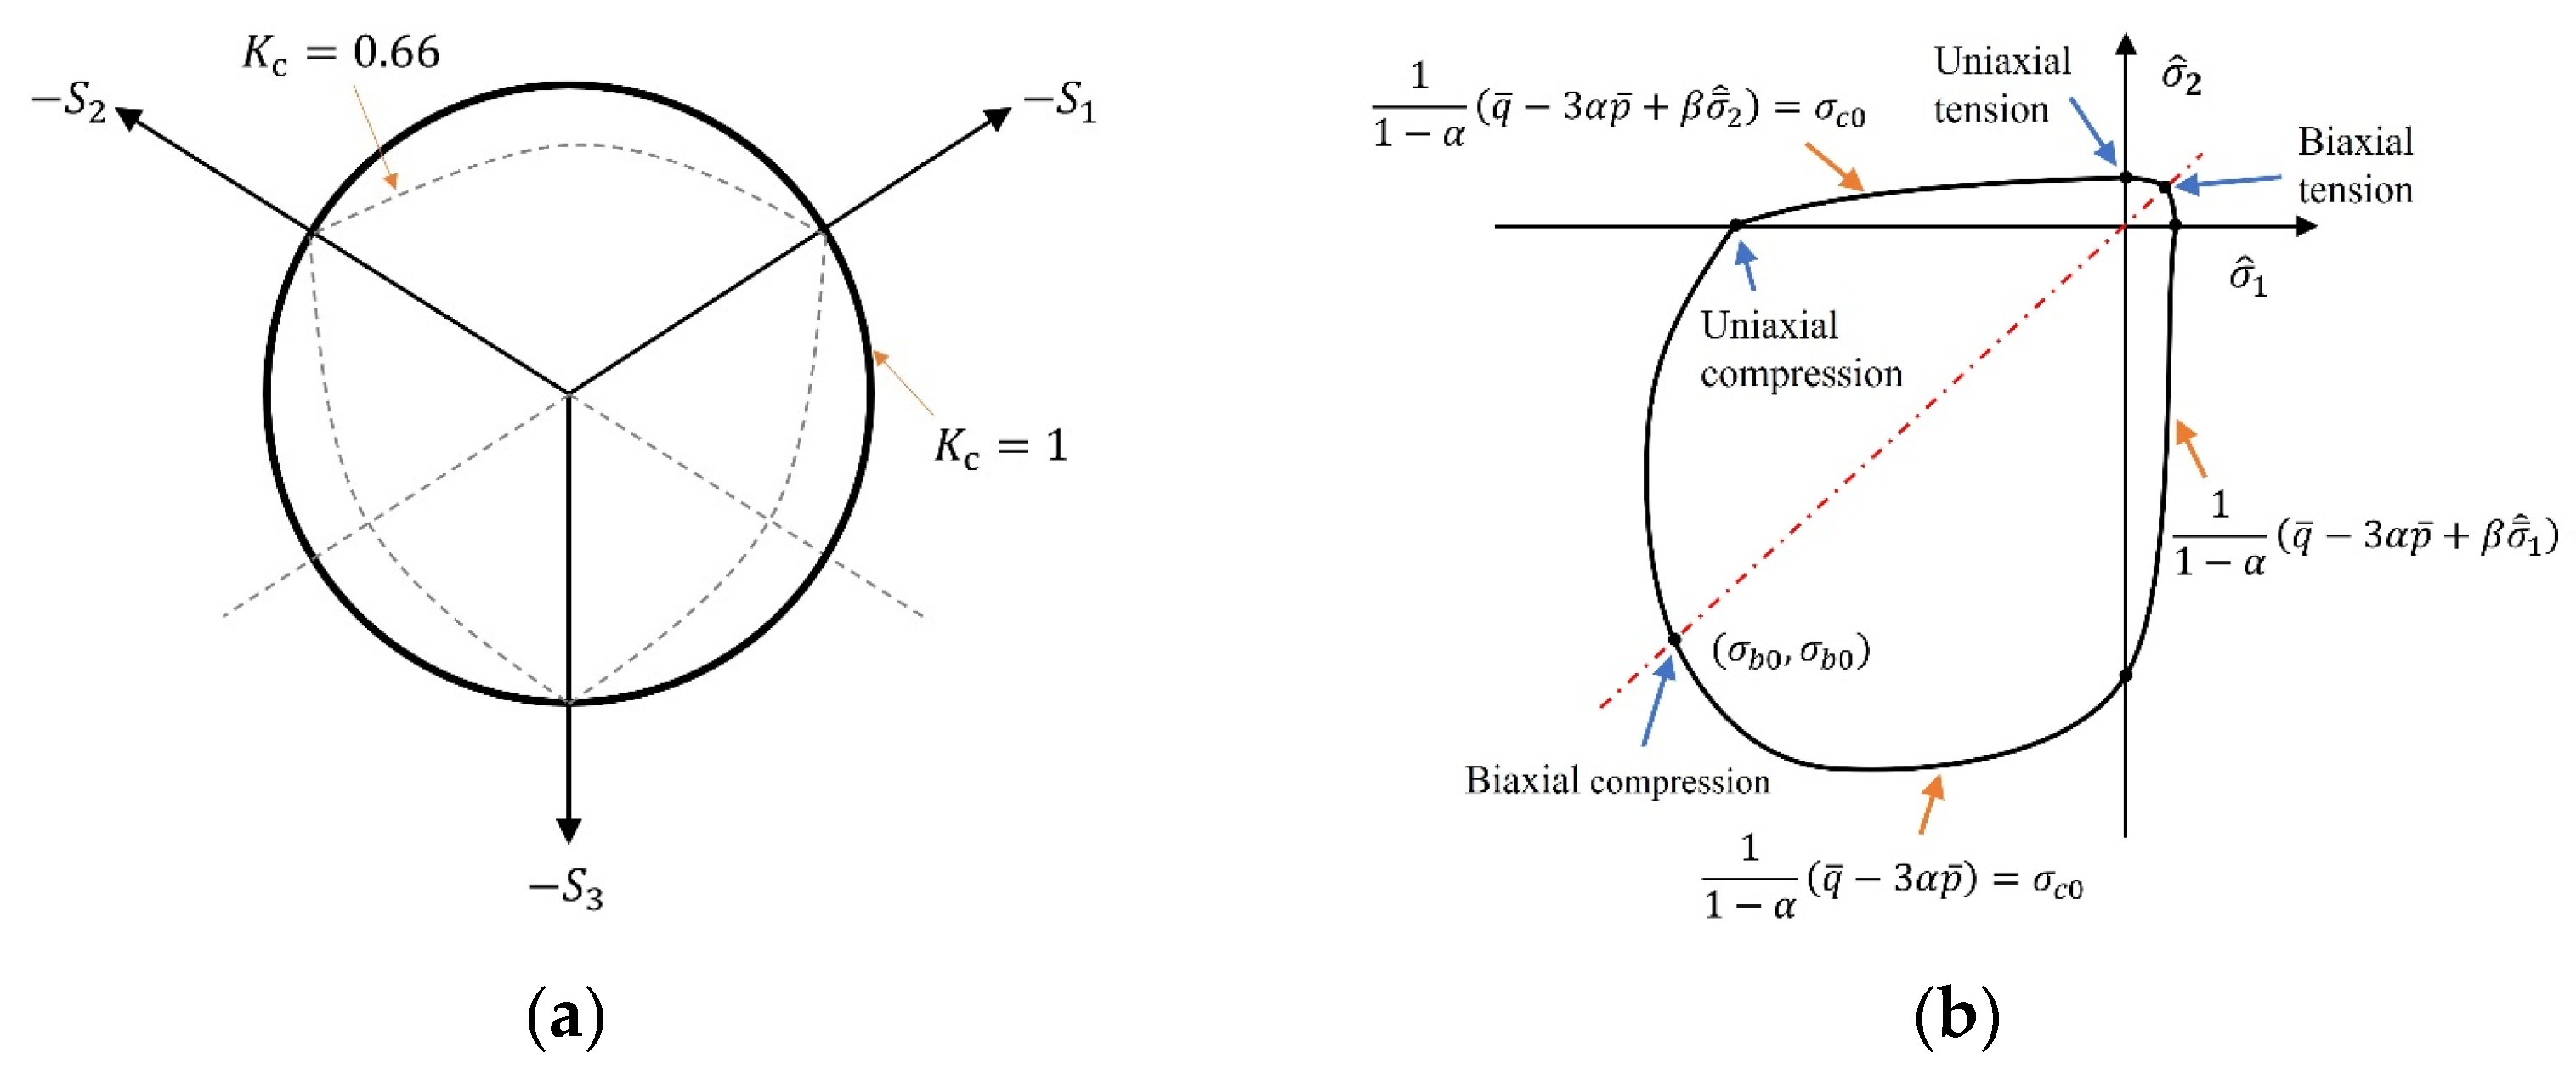
Concrete Material Modeling

The CDP model is an intrinsic tool provided by ABAQUS that specializes in modeling concrete. It is widely used for concrete modeling and is appropriate for concrete structures subjected to monotonic loading, like the three-point flexural test [36,37]. The CDP model applies the yield function to account for different evolutions of strength under compression and tension, as shown in Figure 2. The plasticity parameters for the CDP model include a dilation angle of 30°, an eccentricity of 0.1, a ratio of biaxial compressive strength to uniaxial compressive strength ( σ b 0 / σ c 0 ) of 1.16, and a ratio of the second stress invariant on the tensile meridian (K) of 0.66 [38].

Reinforcement Material Modeling

A commercial type of glass fiber-reinforced polymer (GFRP) composite rebar, PINKBAR [40], was simulated as the composite rebar in this study. Compared to steel reinforcement, it has a two-fold higher tensile strength and a four-fold lower weight. According to the manufacturing test, the following material properties were adopted: Young’s modulus = 46.88 GPa, Poisson’s ratio = 0.3, and ultimate strength = 1003 MPa. Since they have a high brittleness, plastic deformation is rare in composite rebars. Therefore, in the ABAQUS setting, the yield strength of the composite rebar was assumed to be equal to its ultimate strength at zero plastic strain.
The mechanical strength of a steel reinforcement is characterized by its yield strength and ultimate tensile strength. The yield strength denotes the stress level at which steel undergoes significant plastic deformation and the ultimate tensile strength represents the maximum stress that steel can withstand before failure. The material properties of the steel reinforcement used in this study refer to the experiments conducted by Kartheek and Das [41], who tested the tensile properties of an 8 mm diameter steel reinforcement. The material properties employed in the models are listed in Table 1.

2.1.3. Contact, Loading, and Boundary Conditions

The interfacial contact between concrete and reinforcements was assumed to be fully bonded. Therefore, the embedded element option was selected [42]. In addition, three contact pairs, the contacts between the beam and one loading head and two bottom supports, were defined using Coulomb’s law. The tangential contact behaviors were set as the penalty mode with a friction coefficient of 0.2.
Nonlinear analysis was conducted by controlling the displacement of the top loading head, which monotonically moved downwards at a uniform velocity. In this study, the displacement was set as 5 mm in a normalized step time of 1. For boundary conditions, therefore, the loading head was set to be moved vertically, and two bottom supports were constrained in all directions by the middle reference points.

2.1.4. Mesh and Convergence Analysis

The loading head and bottom supports were simulated using discrete rigid parts, as they are much stiffer than RC beams, meaning that their deformations can be considered negligible. The beam was discretized using three-dimensional eight-node linear hexahedral solid elements (C3D8R). These reduced integration elements can enhance computational efficiency and are widely utilized for concrete modeling [43]. Through convergence studies, we tested the models with mesh sizes of 2.5 mm, 5 mm, 10 mm, and 15 mm. As shown in Figure 3, a uniform mesh size of 5 mm was adopted for the concrete beam with a total of 90,900 elements, with a trade-off between accuracy and computational cost. The relatively finer meshes with the size 2.5 mm were used for rebars, considering their relatively smaller sizes compared to the concrete beam.

2.2. Machine Learning Algorithms for Condition Assessment

As mentioned before, FEA is a more effective method for data collection compared to experiments. However, it is cumbersome to simulate all possible situations when assessing the structural conditions. For the three-point flexural test, three failure models are commonly observed: concrete crushing in the compression zone, concrete cracking in the tension zone, and rebar yielding. Since our FEA simulation was based on a tensile failure model, the concrete cracking and rebar yielding needed to be considered. These can be measured using two indicators: DAMAGET and maximum principal stress, respectively. Thus, the dataset, including DAMAGET values of the beam and maximum principal stress of the rebar under different conditions, was generated by ABAQUS. Since the DAMAGET and stress values are continuous variables, we used regression ML algorithms to predict their values. Seven regression algorithms were chosen in this paper to compare their performance. These included linear algorithms such as linear regression (LR), ridge regression (RR), and linear support vector regression (Linear SVR), as well as treelike algorithms such as decision tree regression (DTR), random forest regression (RFR), extreme gradient boosting (XG Boost), and light gradient boost machine (Light GBM). The following is a brief introduction to their principles, advantages, and disadvantages. The parameter settings of different algorithm models are also exhibited, reflecting the relatively good results obtained after several attempts. Due to space limitations, not all parameter combinations are listed.

2.2.1. Linear Algorithms

This section aims to evaluate whether linear algorithms can be used for DAMAGET prediction. LR is a fundamental technique used to model the regression function as a linear combination of predictors [44]. This method simplifies the dependent variable by expressing it as a linear combination of the independent variables. One of the primary benefits of LR is its simplicity and ease of interpretation. Additionally, regularization techniques can be applied to prevent overfitting. This approach is particularly useful for gaining insights into the data analysis process. However, LR is not well suited to capturing nonlinear relationships, and incorporating appropriate polynomials into the model can be quite challenging. Overall, while LR is a recommended method for straightforward tasks, it often oversimplifies real-world problems [45].
RR is a widely utilized parameter estimation method designed to mitigate the collinearity issue often encountered in multiple LR [46]. Recognized for its robustness, RR is particularly effective for constructing learning models in scenarios with numerous features, as it helps to prevent overfitting and reduces model complexity. This technique employs L2 regularization, which penalizes the squared magnitude of the coefficients. RR produces non-sparse solutions by constraining the weight, which is especially beneficial when dealing with datasets exhibiting multicollinearity [21]. The alpha parameter in the RR model controls the strength of the regularization, with higher values leading to more regularization. For this training model, we used an alpha value of 100. The ‘tol’ parameter sets a threshold for the difference in the objective function’s value or the parameter updates between iterations. We set tol = 10−4 here, since this is a reasonable balance between precision and computational cost.
Linear SVR extends the Support Vector Machine (SVM) classification algorithm to regression tasks. It formulates an optimization problem by defining a convex ε-insensitive loss function to minimize and identify the flattest tube that encompasses most of the training instances [47]. This approach enables the learning of a regression function that maps input predictor variables to output observed response values. By utilizing a kernel, Linear SVR efficiently addresses nonlinear regression problems by projecting the original features into a kernel space where the data can be linearly separated [48]. For the linear SVR model, we chose the regularization parameters C = 10, ε-insensitive area = 0.1, and maximum iterations = 1000.

2.2.2. Treelike Algorithms

Different from linear algorithms, tree-based algorithms offer robust solutions for regression problems by employing hierarchical decision schemes for continuous data splitting. The most representative of these treelike algorithms is DTR. A decision tree consists of a root node (initial dataset), internal nodes (recursive splits), and leaf nodes (outcomes) [49]. Each node splits based on specific algorithms such as CART (Classification and Regression Trees) [50], which calculates errors against actual values using predefined fitness functions [51]. The process follows a top-down approach, moving from root to leaf nodes to simplify complex decisions into interpretable steps. For the DTR model, we just used the default parameters, because this setting can generally achieve a good result. However, DTR might encounter the problem of over-fitting, and may yield locally optimal rather than globally optimal solutions. RFR addresses these issues by employing an ensemble modeling approach that combines multiple decision trees to predict continuous target variables [30], as illustrated in Figure 4. In this paper, we set the parameter ‘n_estimators’ to 5, representing the random forest model consisting of five decision trees.
In addition to RFR, XG Boost operates by sequentially adding the results of weak classifiers to predict values and subsequently adjusting for prediction errors. This iterative process optimizes the loss function using second-order Taylor expansion in its objective function, enhancing performance [52]. XG Boost exhibits resilience to outliers and, like many boosting techniques, effectively combats overfitting, thus streamlining model selection processes [53]. The parameters used here included a learning rate of 0.08 and a subsample rate of 0.75. The learning rate represents the step for the iterative process, while the subsample rate indicates that each tree is trained using 75% of data to prevent overfitting.
Light GBM addresses challenges like overfitting and managing large datasets efficiently [54] by employing some distinctive strategies, such as exclusive feature bundling (EFB) and gradient-based one-side sampling (GOSS). Unlike traditional approaches, Light GBM, as a decision tree-based method, is particularly sensitive to multicollinearity, which enhances its effectiveness in handling complex data structures [55]. Similarly to XG Boost, we set the same learning rate and the subsample rate here. However, in the Light GBM model, the parameter ‘feature_fraction’ controls the subsample size, which means the fraction of features needs to be considered when building each tree. Here, we chose ‘feature_fraction’ to equal 0.9. By randomly selecting 90% of the features for each tree, this reduces overfitting and speeds up training. It should be mentioned that the rest of the parameters in these ML models were the default, and we also set the ‘random_state’ to equal 42 to allow reproducibility.

2.2.3. Model Evaluation Metrics

In this study, three parameters were chosen for regression analysis evaluation. These were the mean absolute error (MAE), mean square error (MSE) and coefficient of determination ( R 2 ). MAE and MSE are used to measure the difference between the predicted value and the actual value of the model to a certain degree, as shown in Equations (1) and (2).
MAE = 1 m i = i m | X i Y i |
MSE = 1 m i = i m ( X i Y i ) 2
where m is the size of the test dataset, X i is the ith predicted value, and Y i is the ith actual value. MAE is easy to interpret because it directly represents the average magnitude of errors in the same units as the target variable. By squaring the errors, MSE gives more weight to large errors. This makes it useful when large deviations from true values are particularly undesirable. The closer the MAE and MSE values are to zero, the more accurate the prediction is. However, since these values can range from zero to positive infinity, a single value does not provide a comprehensive assessment of the performance of the regression model with respect to the distribution of the ground truth elements. Therefore, we used another parameter R 2 to indicate the goodness of fit. R 2 can be obtained by Equation (3).
R 2 = 1 i = i m ( X i Y i ) 2 i = i m ( Y ¯ Y i ) 2
The value of R 2 ranges from negative infinity to 1. R 2 can be negative whenever the best-fit model (given the chosen equation, and its constraints, if any) fits the data worse than a horizontal line. When R 2 > 0 , it can be interpreted as the proportion of the variance in the dependent variable that is predictable from the independent variables. In this way, R 2 yields a high score only if the majority of the elements of a ground truth group are correctly predicted [56].

3. Results and Discussion

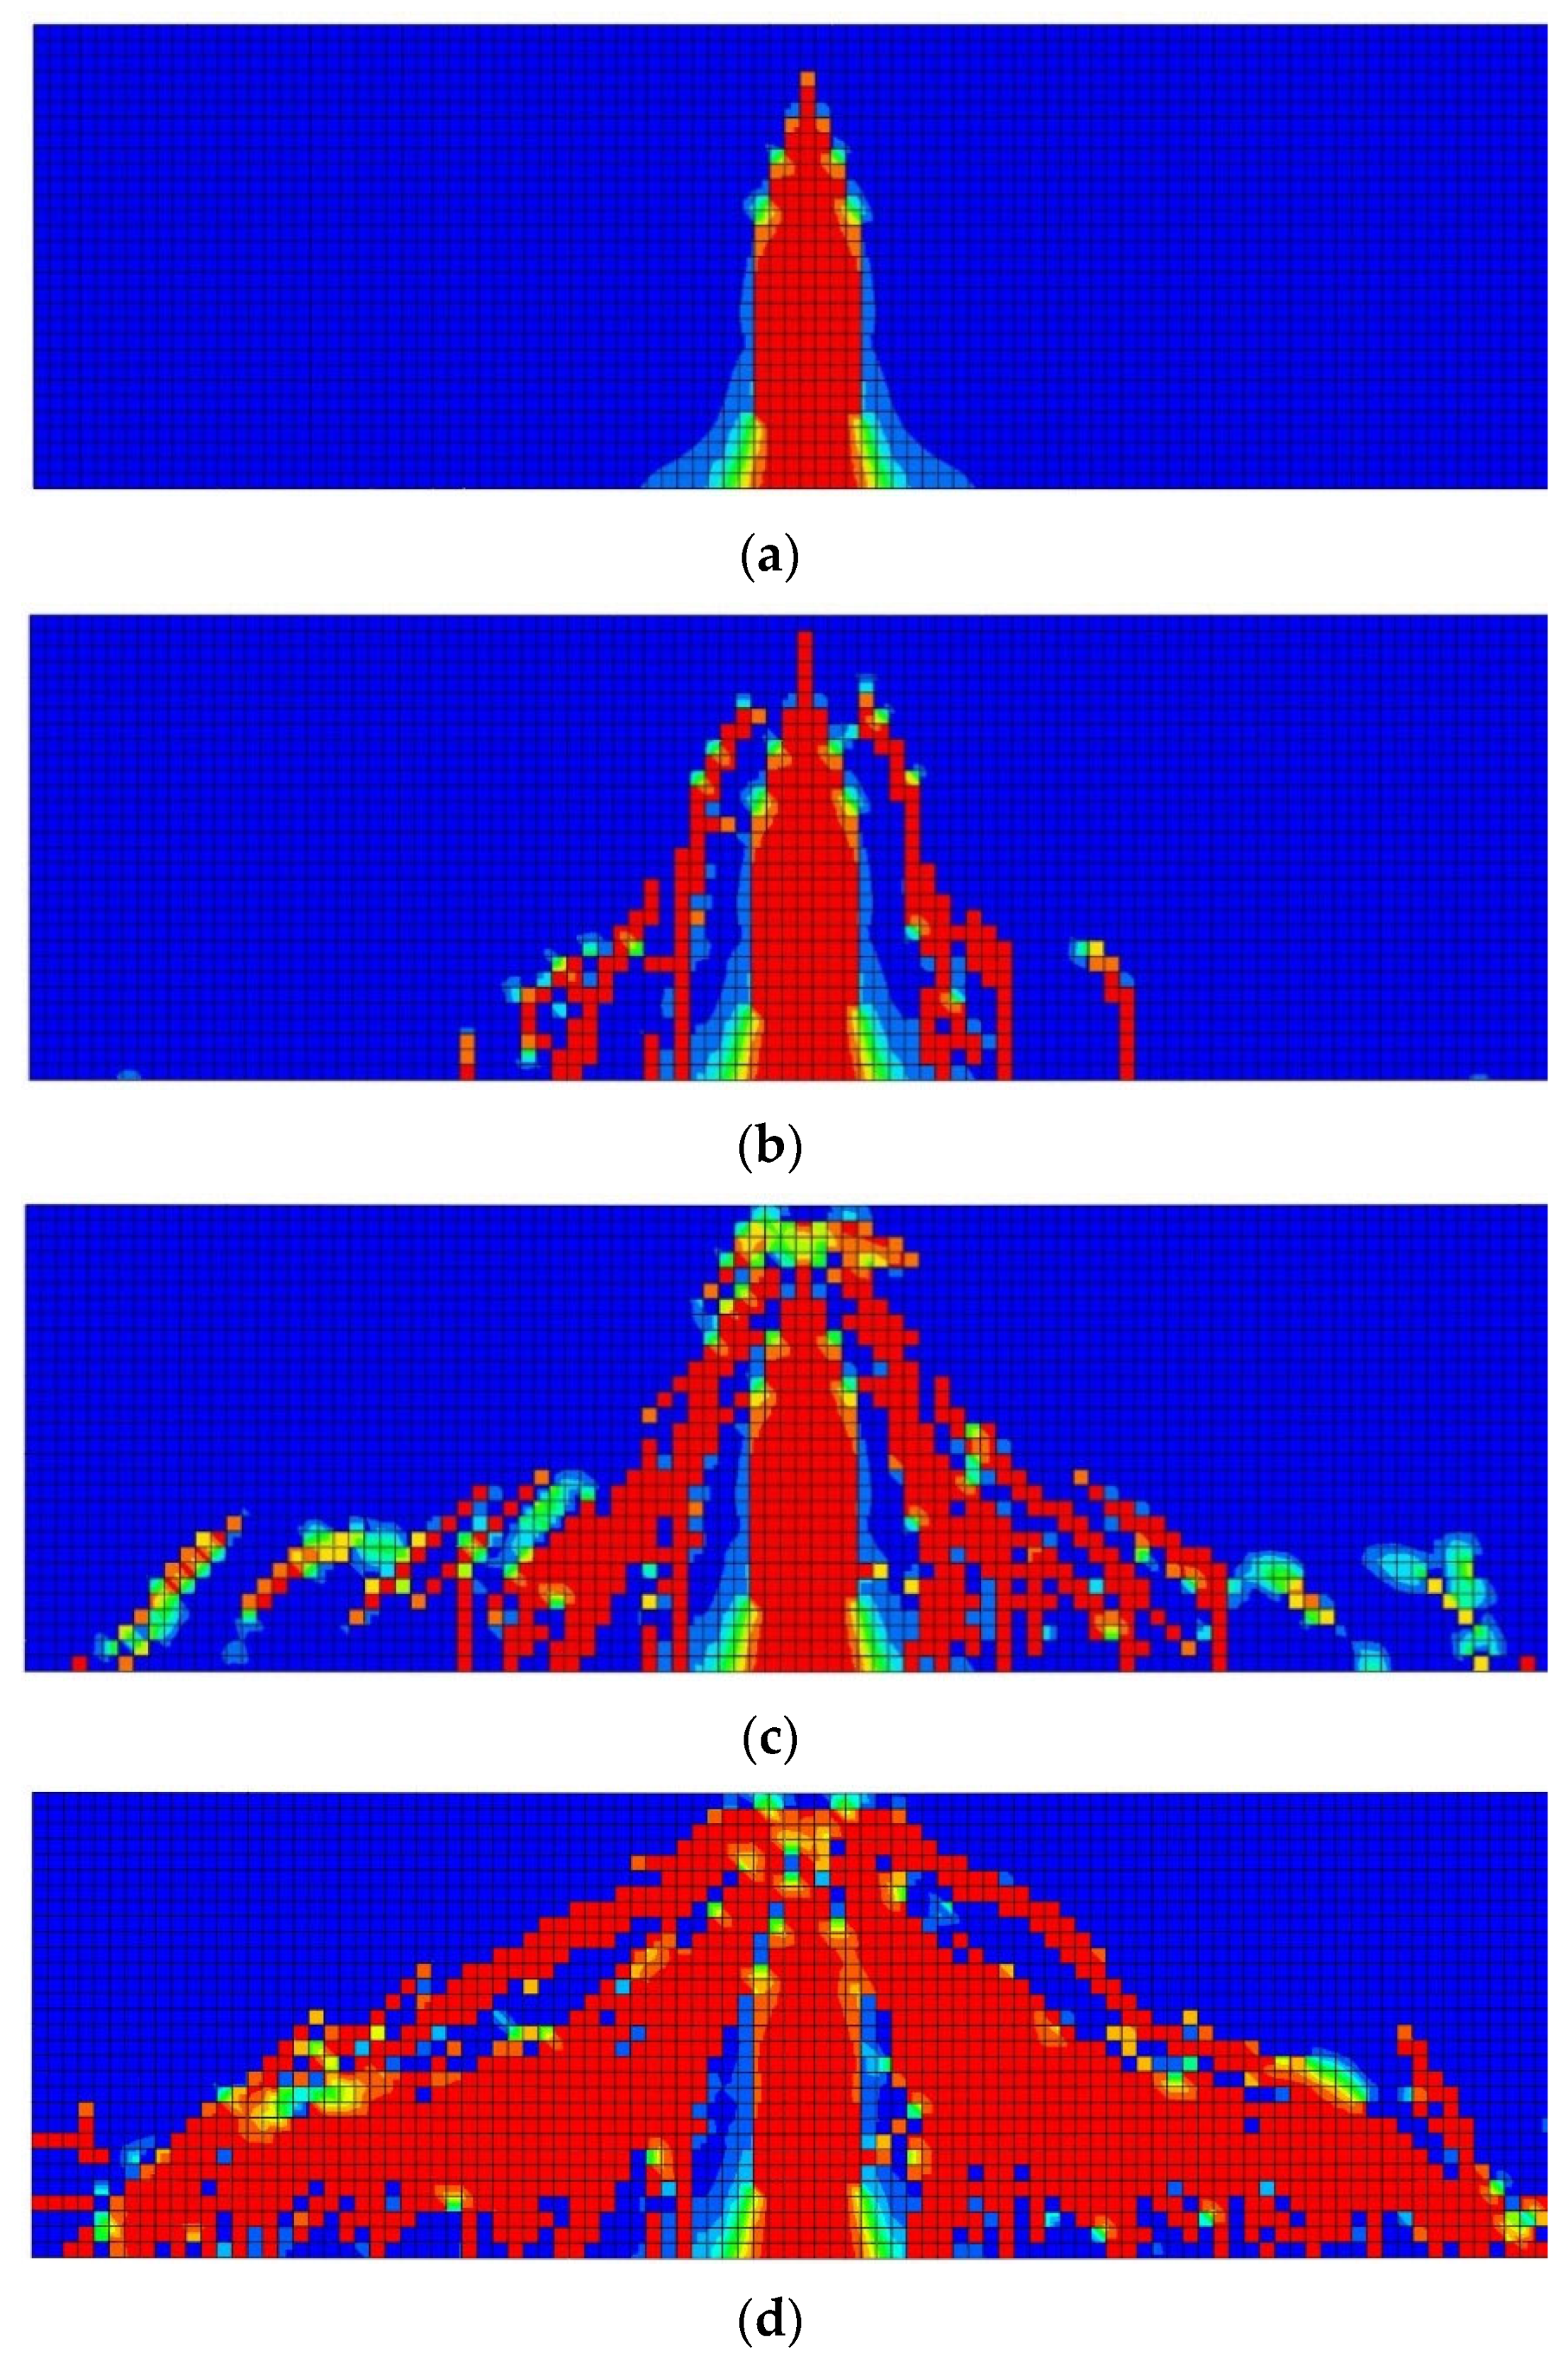
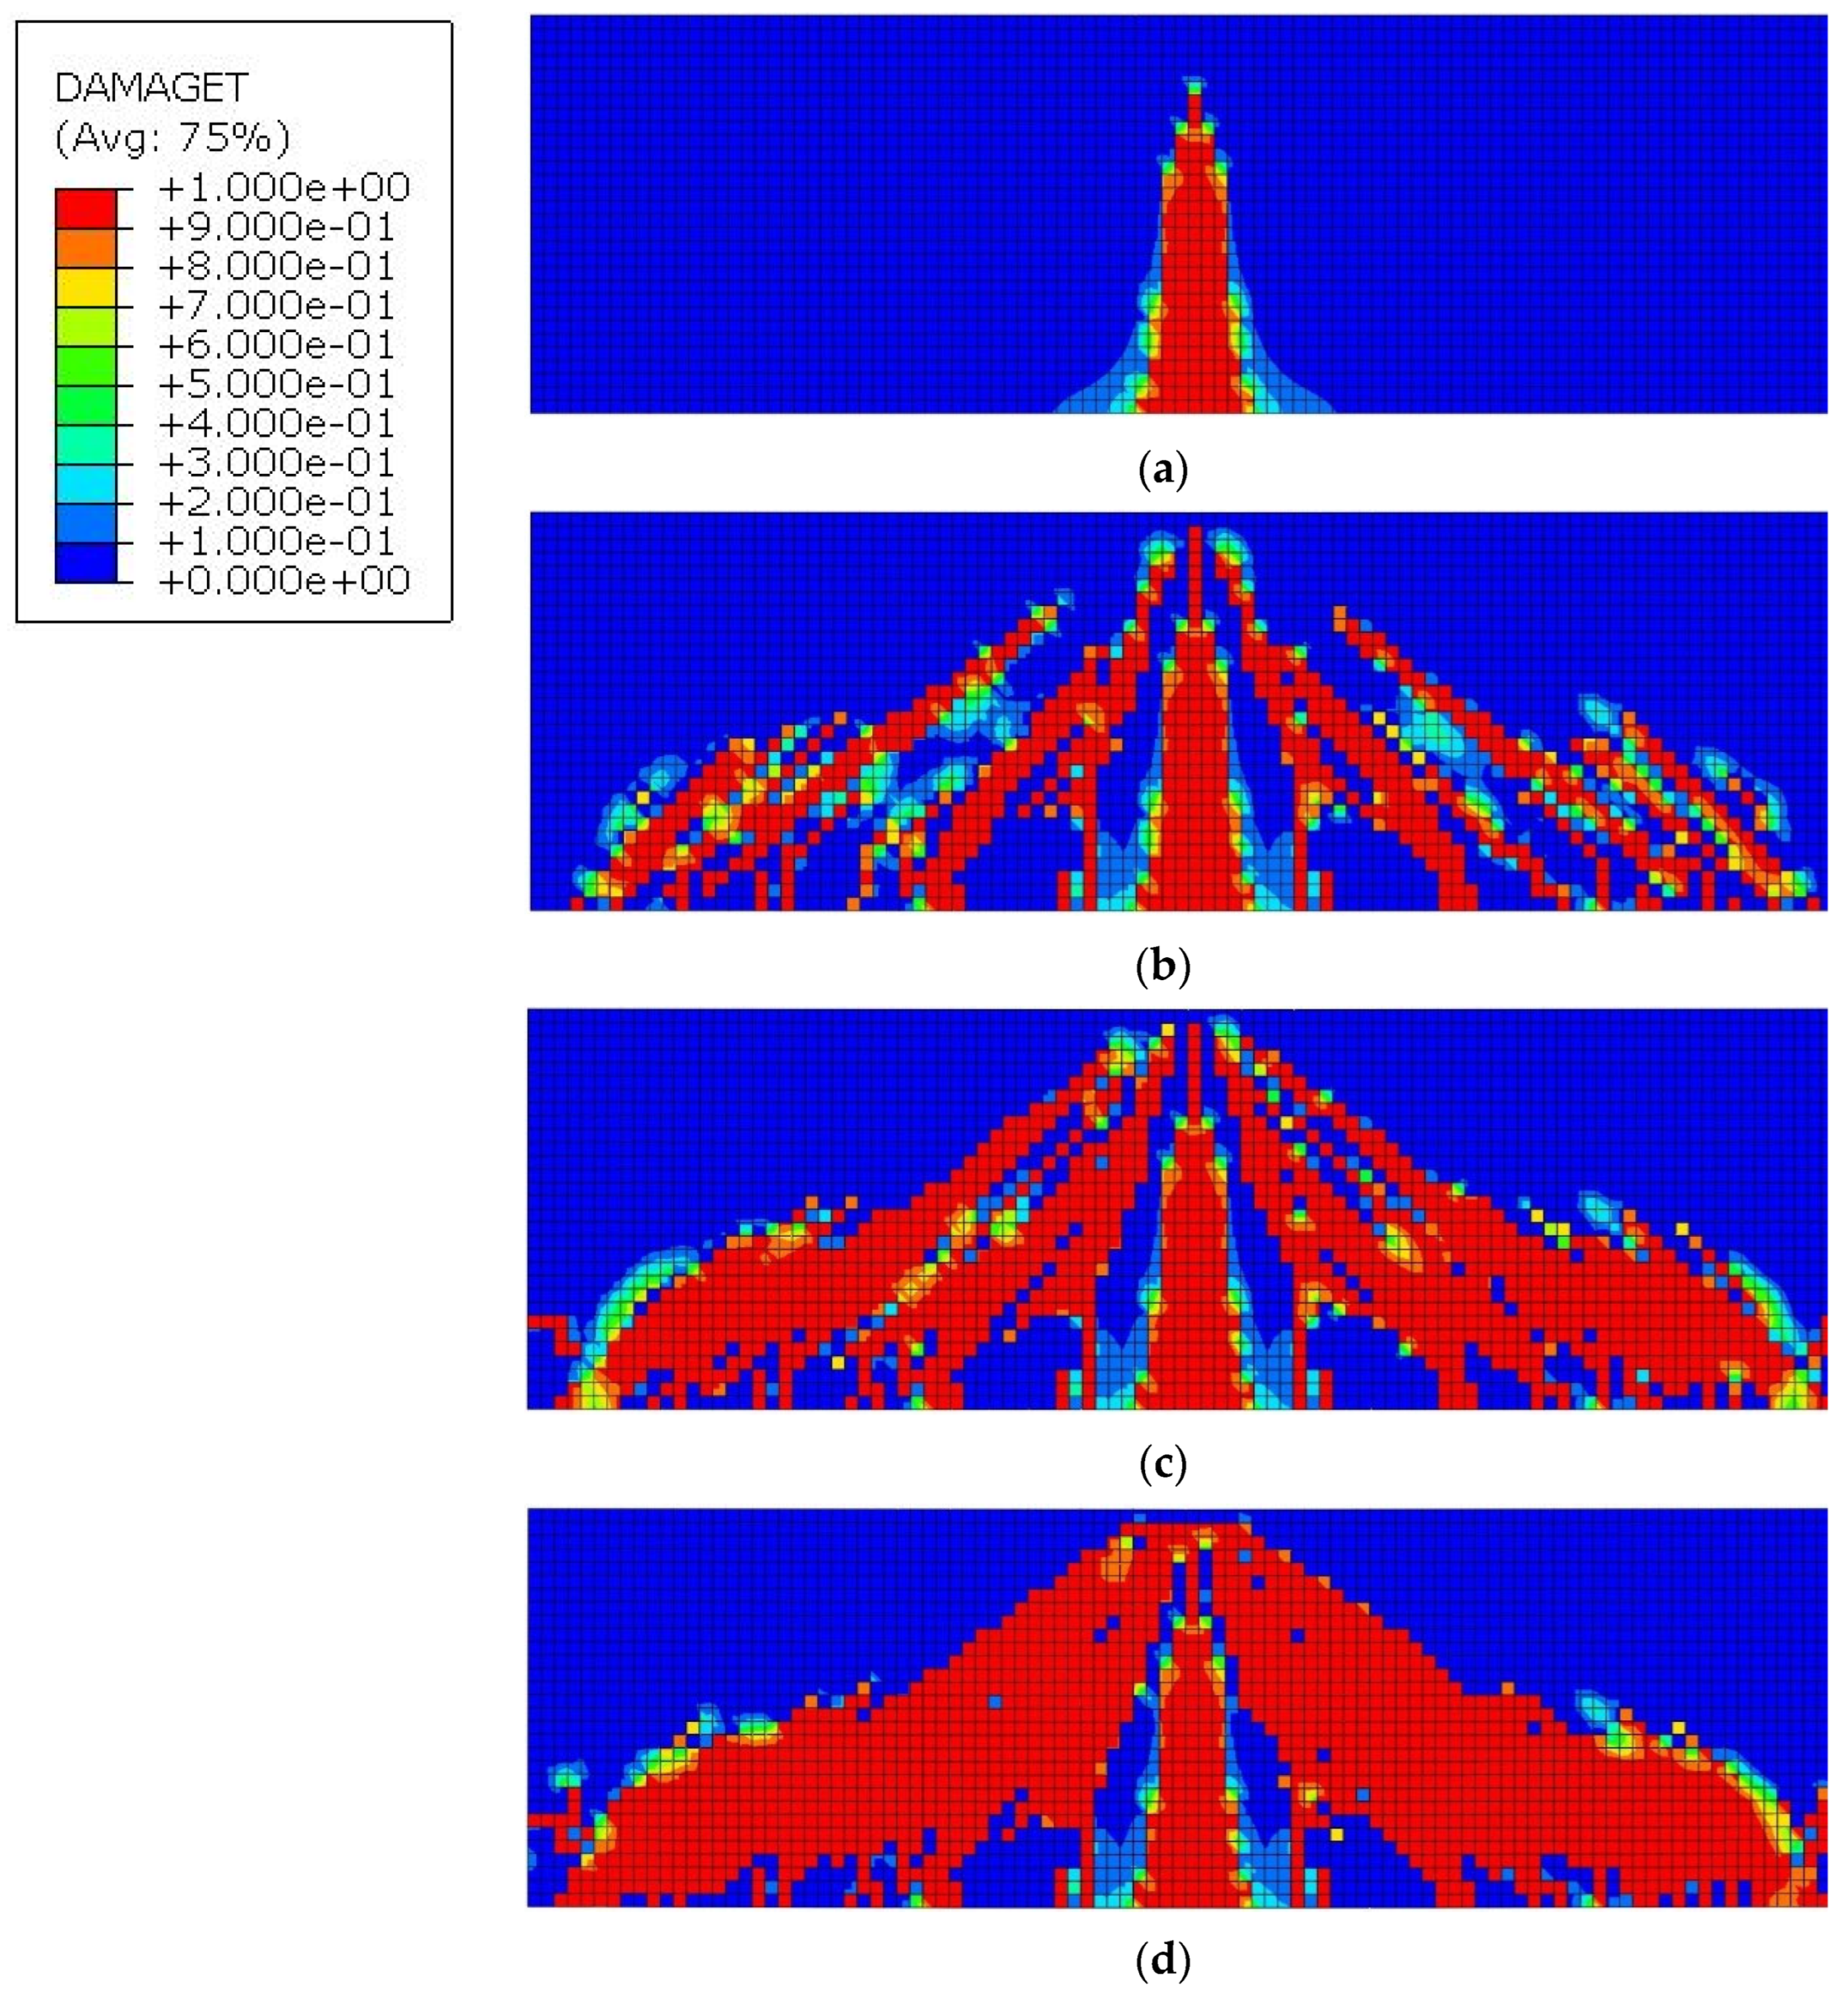
3.1. Finite Element Analysis of Reinforced Concrete Beam

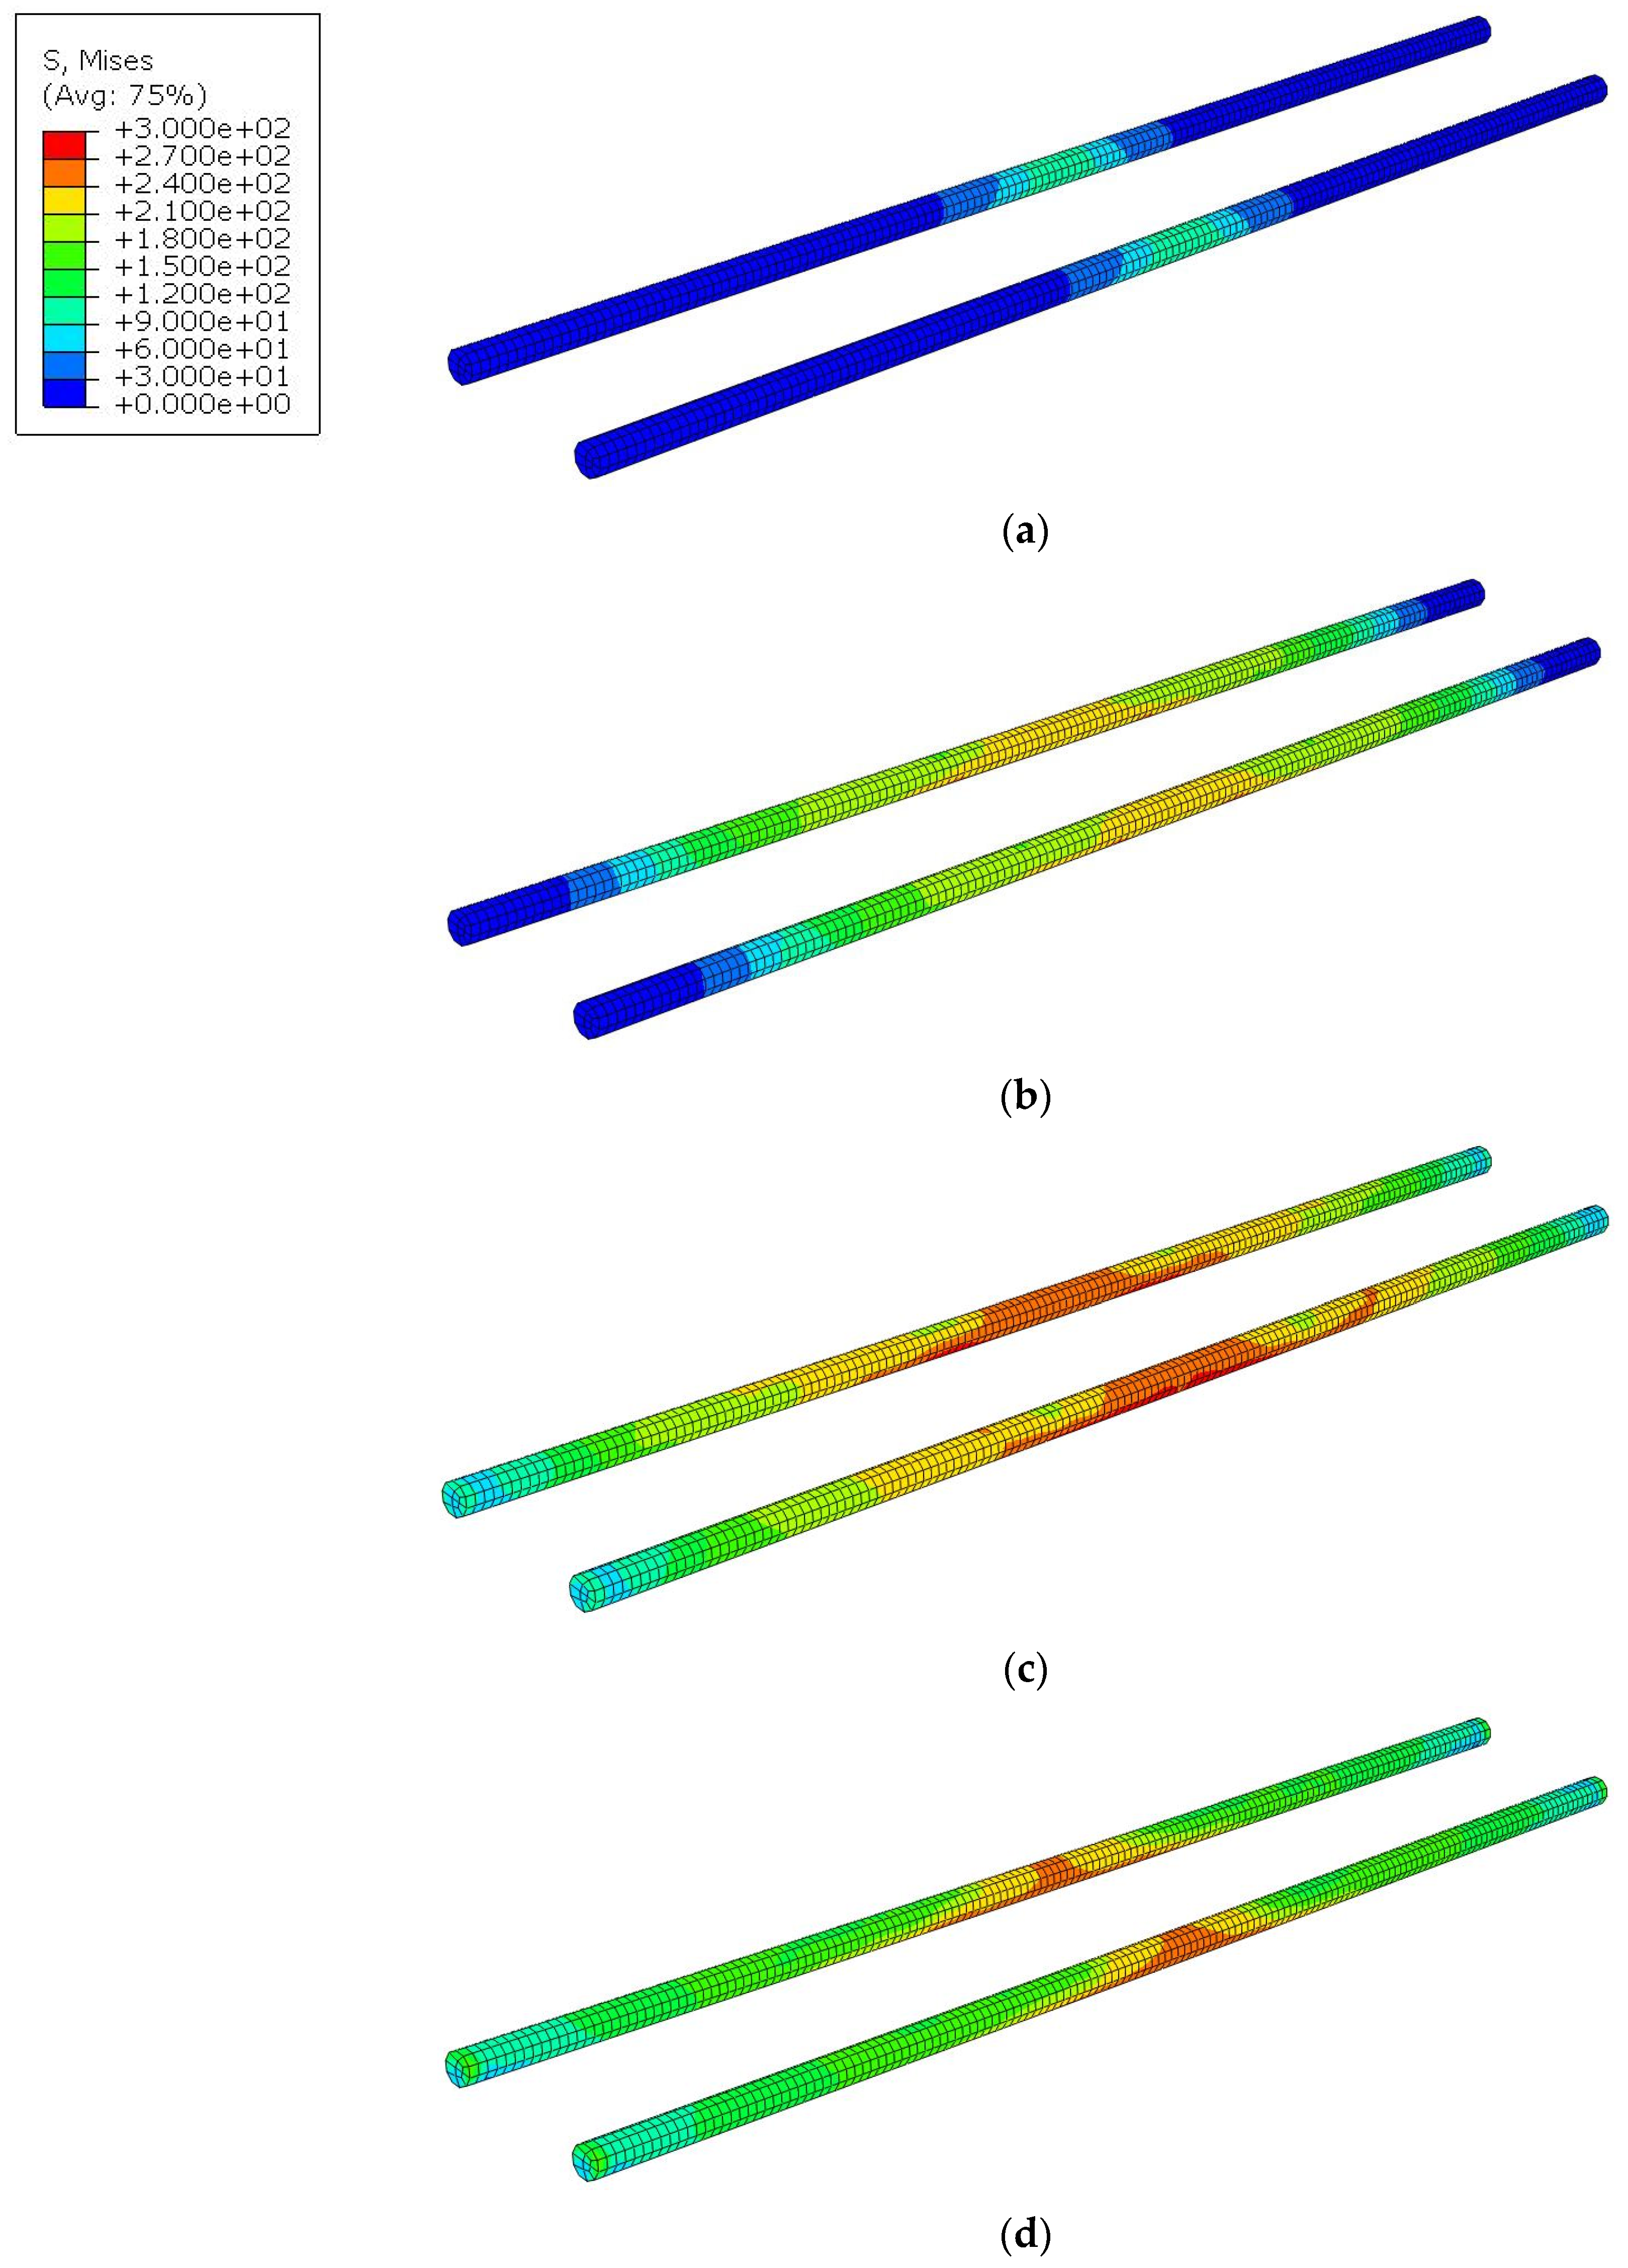
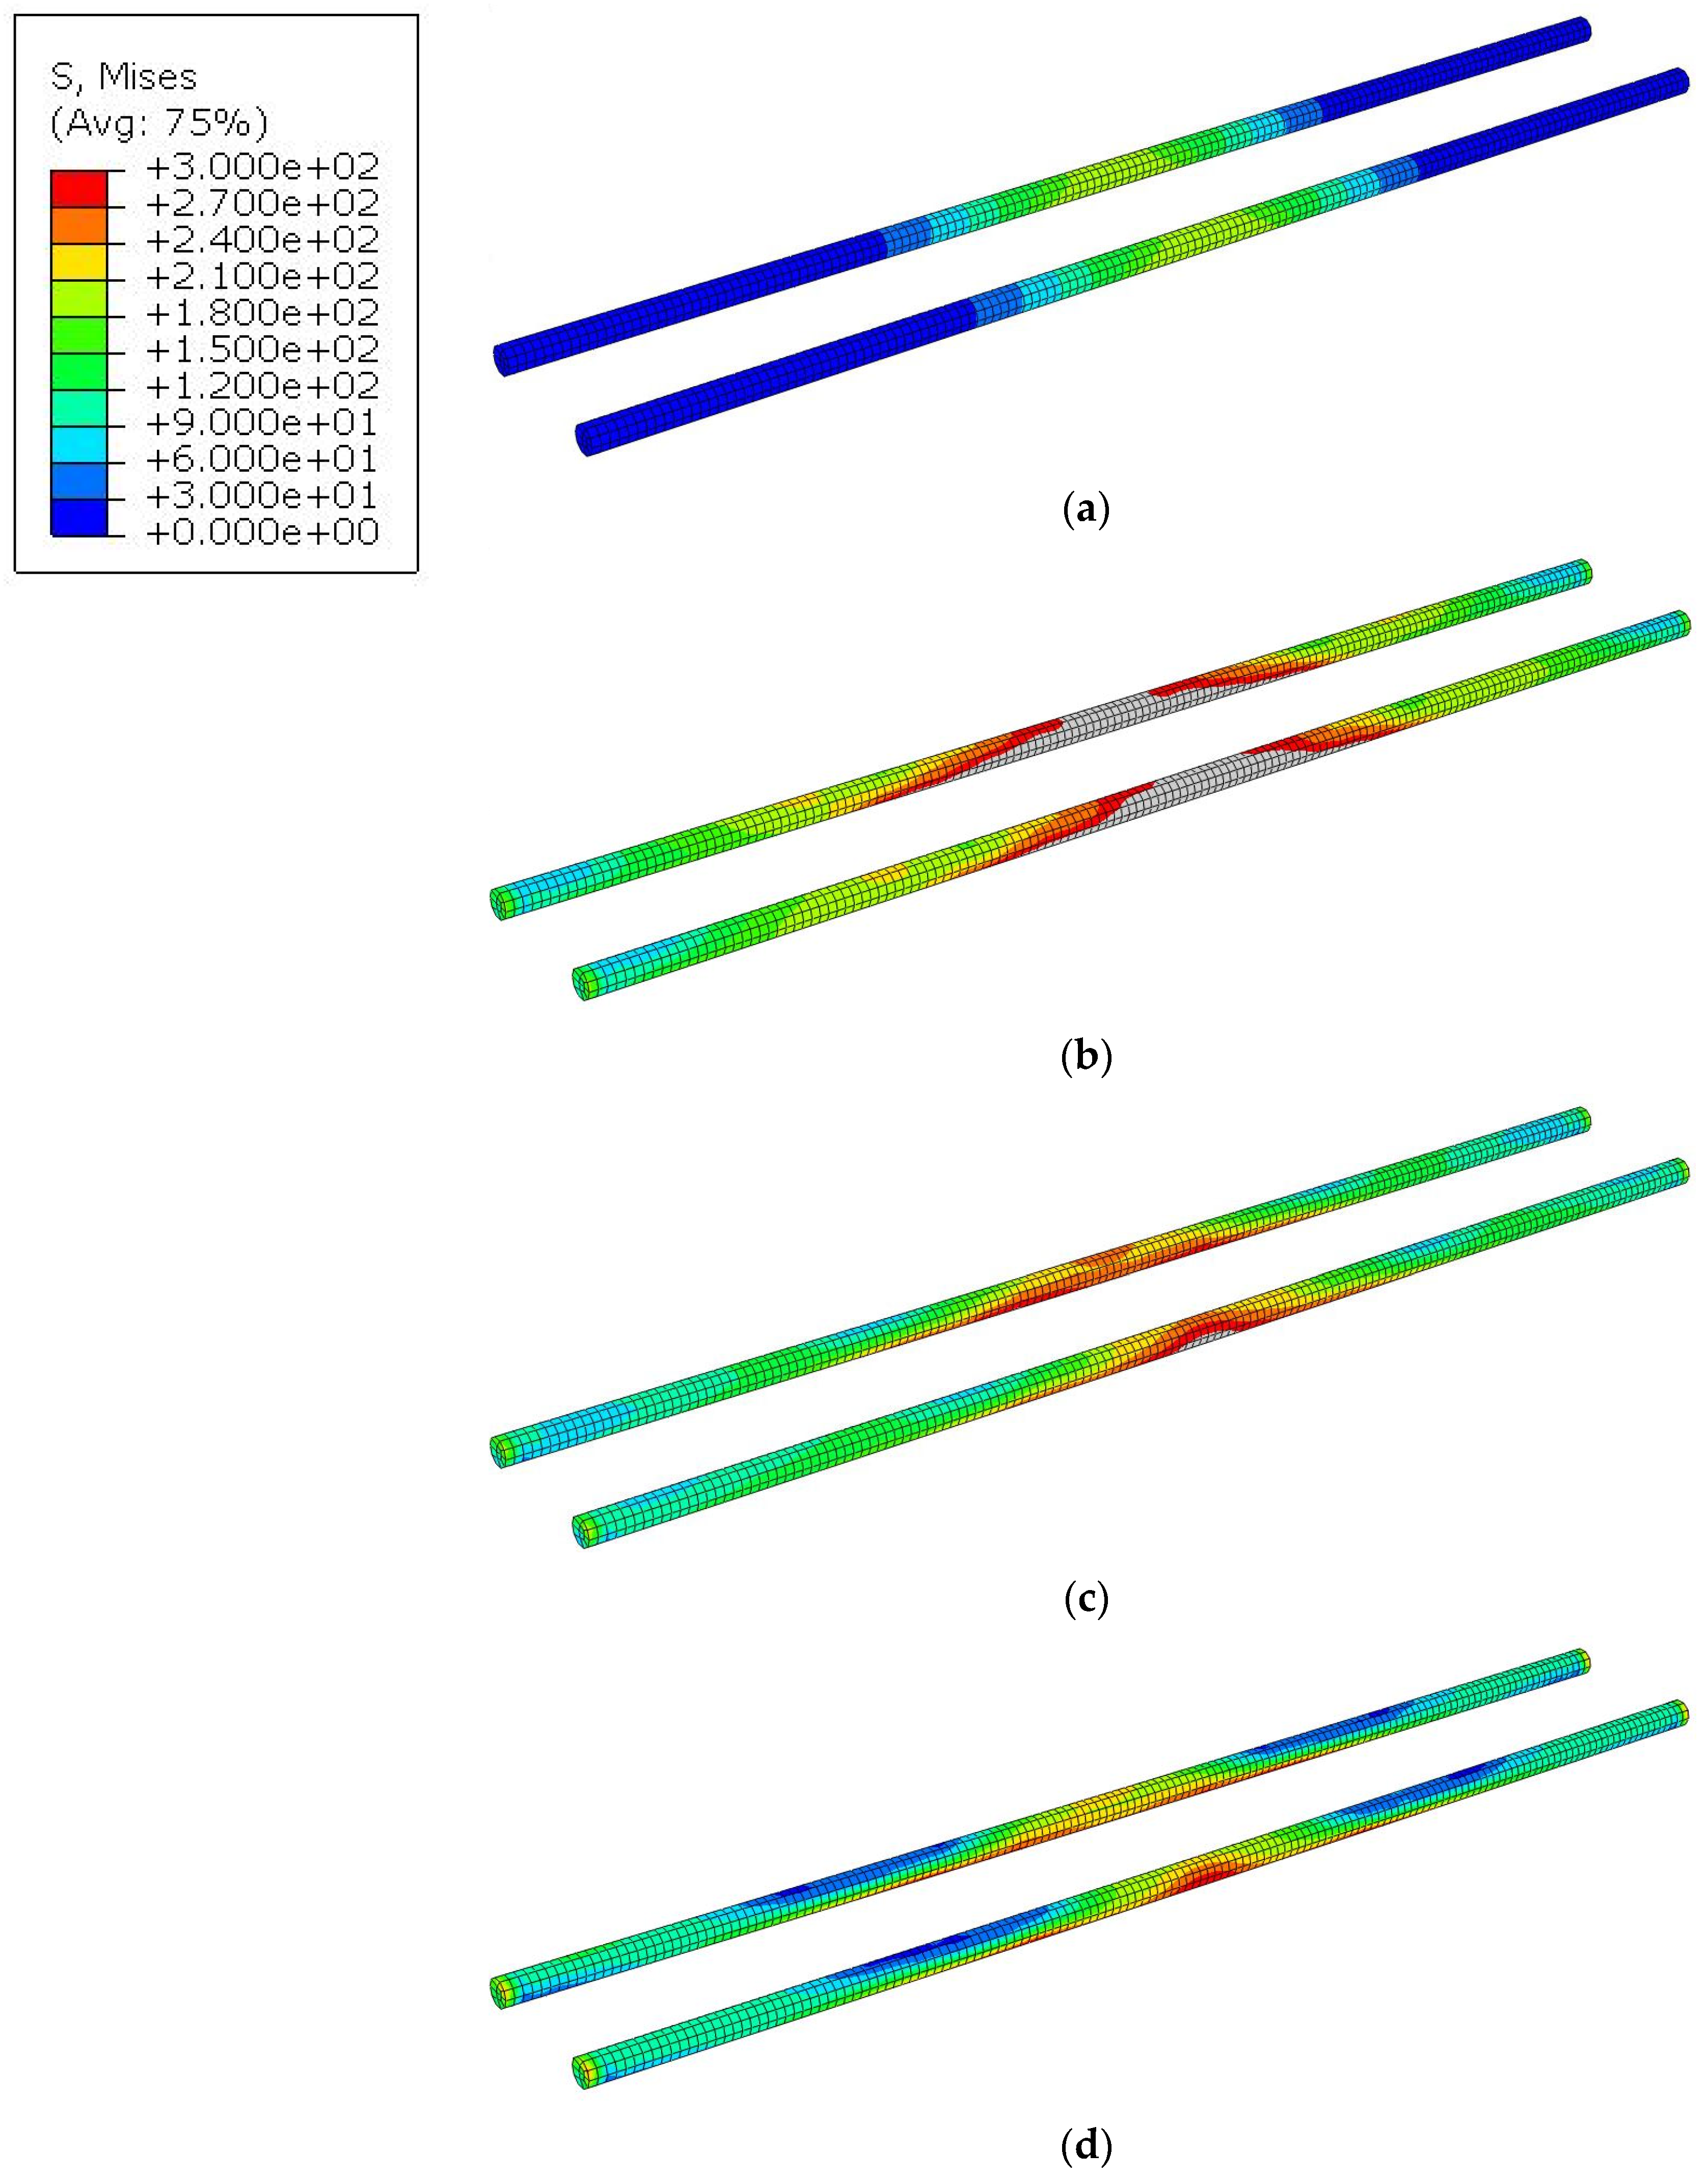
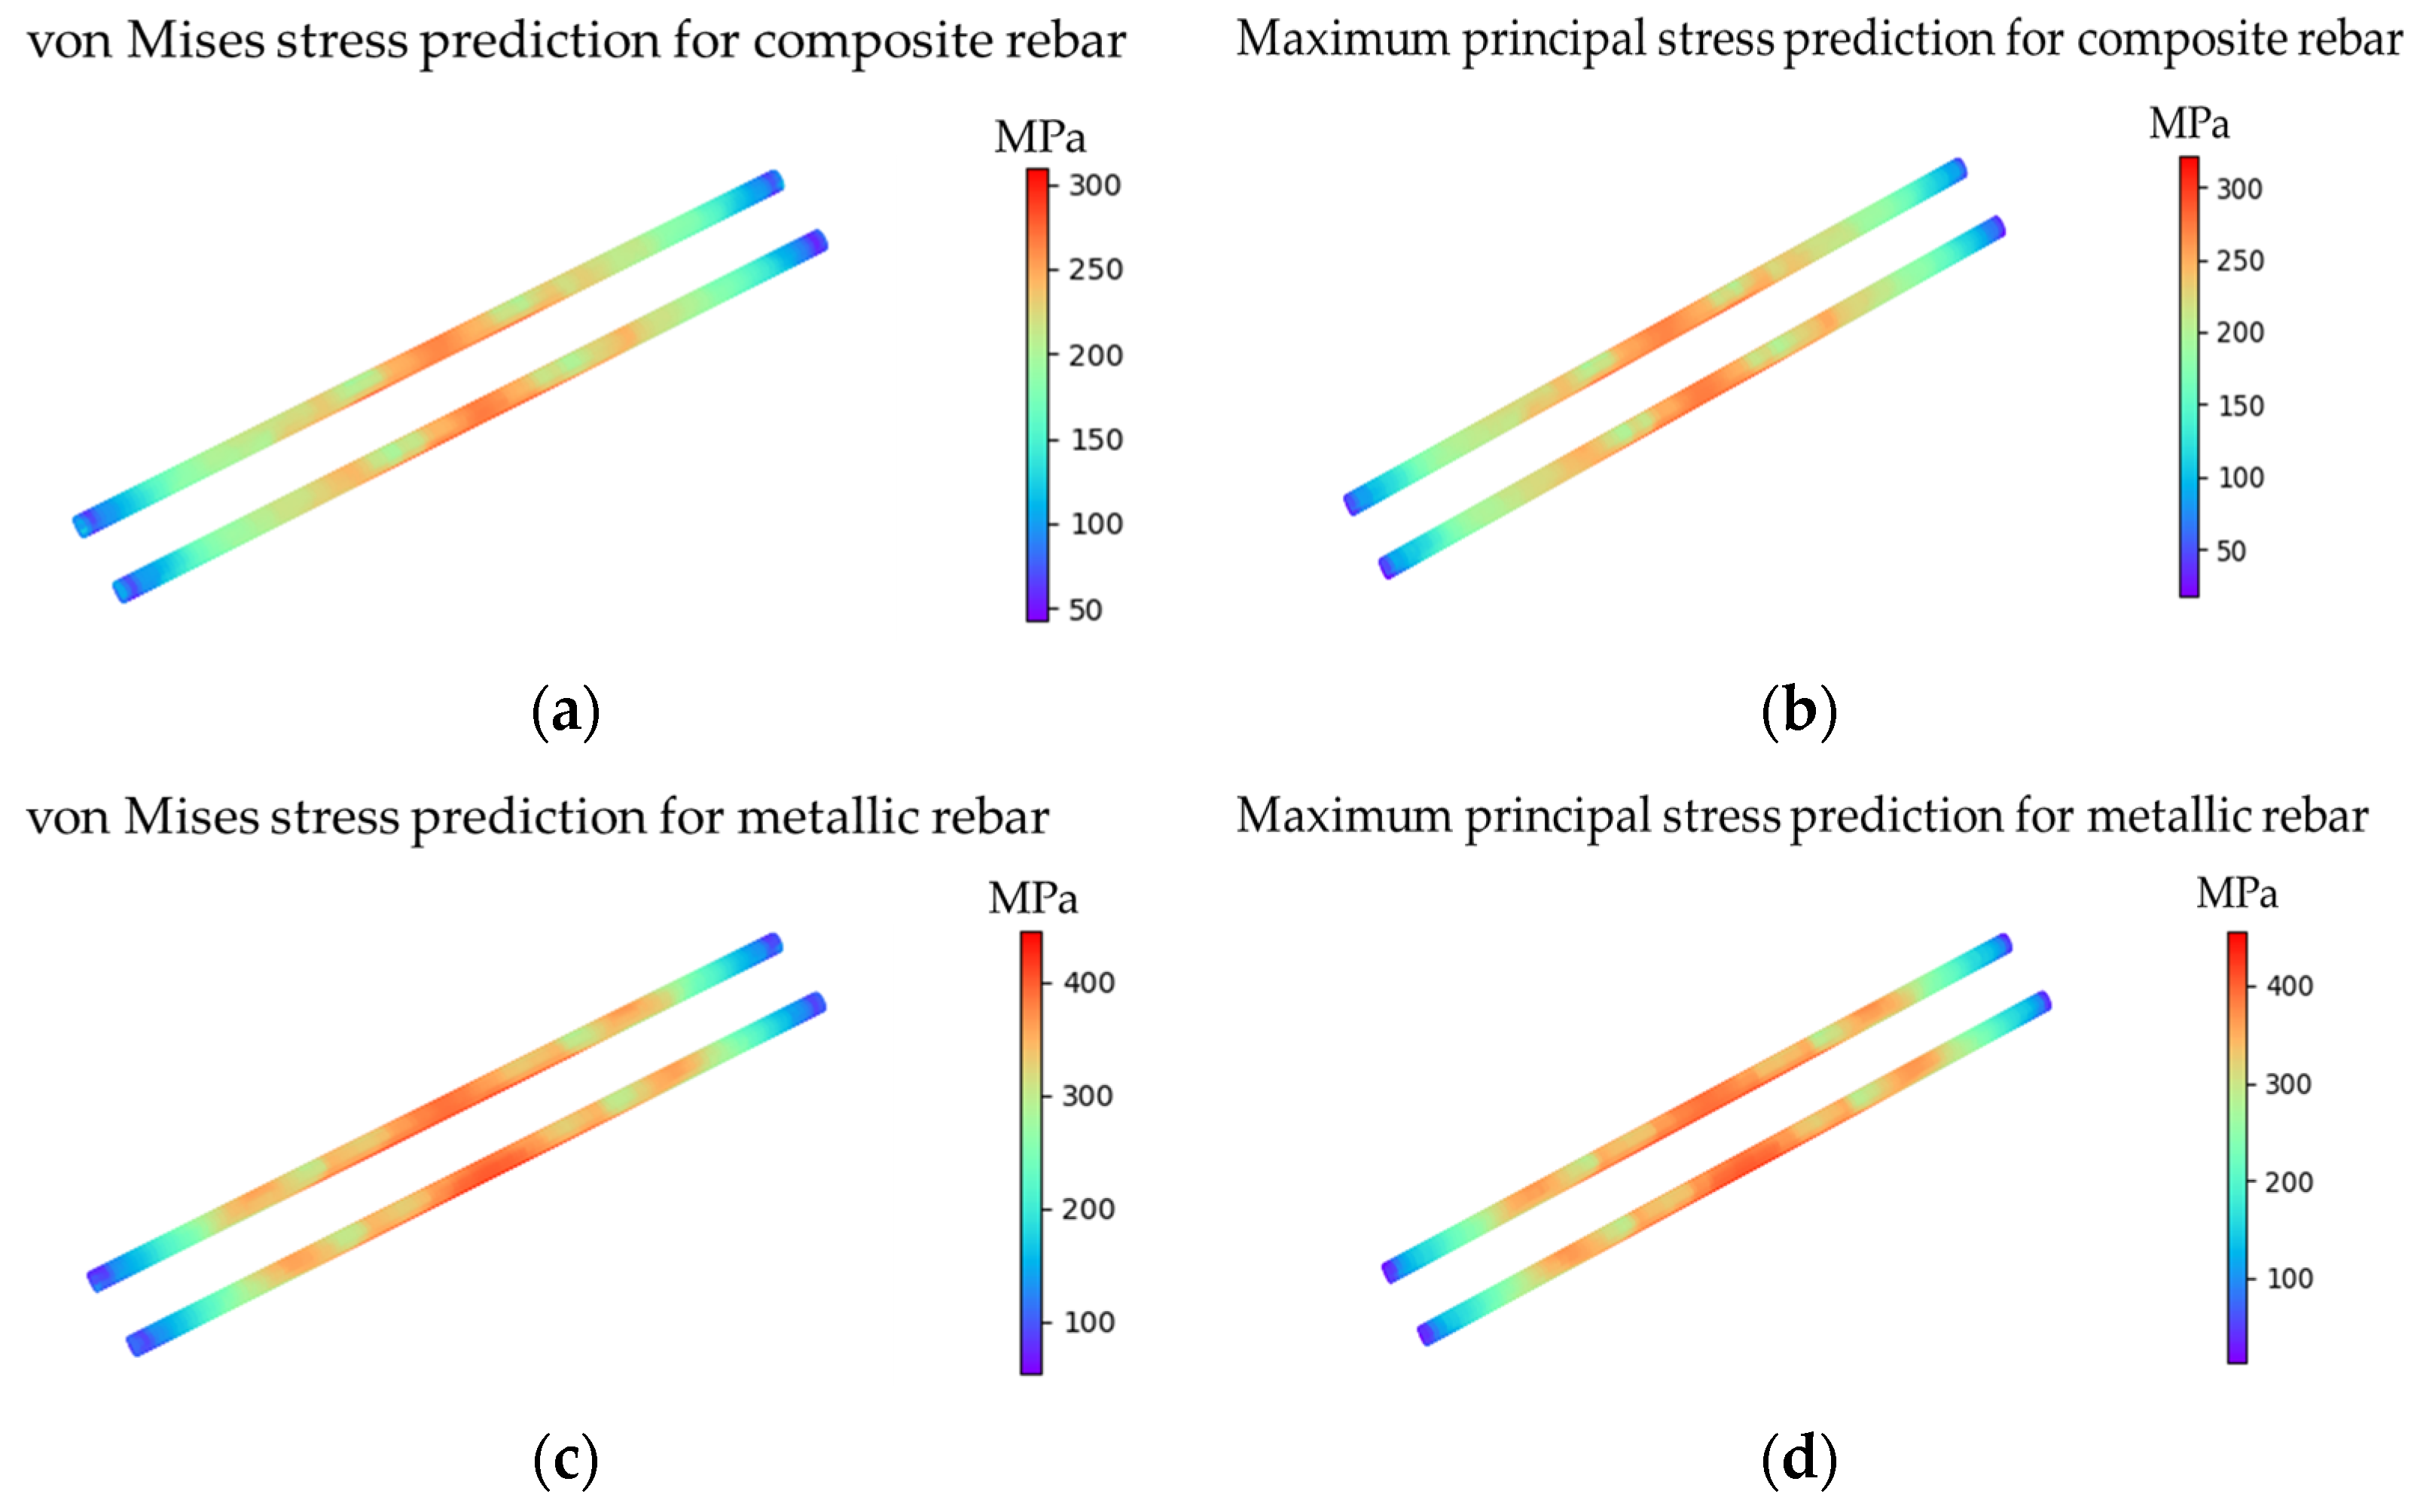
3.1.1. Composite Reinforced Concrete Beam

We conducted finite element analysis for the flexural strength test in ABAQUS for RC beams. When subjected to flexural loading, the composite RC beam experiences tensile stresses on the bottom face, leading to the formation and propagation of cracks. Figure 5 shows the crack propagation process from the vertical flexural cracks at the bottom center to the 45° shear crack that connects the top load head and two bottom supports. Larger damage in tension (DAMAGET) values indicate a higher damage level. The cracks in the concrete beam propagate from vertical flexural cracks at the bottom center. As the loading head moves downwards, inclined cracks appear around the vertical cracks. Afterward, 45° shear cracks towards the loading and supporting areas start to develop. At the final stage, shear cracks dominate and lead to the structural failure of the concrete beam. The modeling results align well with the experimental data presented by Maranan et al. [57]. The simulation results generate a physics-informed database to train ML-based condition assessment algorithms in the next chapter.
In addition to concrete, the mechanical responses of composite reinforcement were also investigated over time. The von Mises stress on reinforcements can provide a comprehensive indicator of the overall stress state. As shown in Figure 6, stress initially increases with time, but experiences a drop after a time of 0.6 (or a displacement of 3 mm). These findings are found to coincide with crack development. Before that, stress in the reinforcement increases with the propagation of vertical flexural cracks. The highest and lowest tensile stress levels are found at the bottom center and the end of the reinforcement, respectively. With the increasing displacement of the loading head, the 45° shear cracks start to initiate, and the von Mises stress on reinforcements slightly decreases.

3.1.2. Metallic Reinforced Concrete Beam

Figure 7 shows the crack patterns of the metallic RC beams, including crack initiation and propagation. At the start of loading, cracks on the metallic RC beam exhibit a similar pattern to the composite RC beam, which only has vertical flexural cracks propagating from the bottom center. As the load increases, 45° shear cracks grow significantly on metallic RC beams at a time of 0.4 (or a displacement of 2 mm), which is unlike composite RC beams, where only minor inclined cracks appear. With further loading, the crack width expands as minor cracks connect and form wider cracks. Eventually, shear cracks dominate and lead to a more severe structural failure compared to composite RC beams.
Additionally, FEA results for the von Mises stress of the steel reinforcement are presented in Figure 8. The same color bar is adopted to compare the difference between composite and steel reinforcements. The gray color in Figure 8b,c indicates the stress locations greater than 300 MPa. From the stress distribution results, it can be seen that in addition to more cracks on metallic RC beams, higher von Mises stress levels are also present on steel reinforcements compared to composite RC beams. Additionally, the stress distribution patterns are similar. Unlike the initiation of 45° shear cracks and maximum von Mises stress in composite reinforcements at the normalized time of 0.6 (or a displacement of 3 mm), it was found that, at the normalized time of 0.4 (or a displacement of 2 mm) in metallic RC beams, 45° shear cracks and maximum von Mises stress appear simultaneously. This also indicates earlier deterioration in the metallic RC beam. It can be concluded that the DAMAGET results reflecting crack formation can be used to assess the conditions of interior reinforcements.

3.2. Machine Learning-Based Spatial–Temporal Condition Assessment

3.2.1. Accuracy Comparison of Different Machine Learning Algorithms

In this section, we train an ML-based condition assessment model using the finite element results from the three-point flexural test. We choose the uniform mesh to discretize the finite element model, as described in Section 2.1.4. In addition, the RC beams are loaded at a constant speed, and DAMAGET results are exported at regular intervals. Thus, our dataset is uniformly distributed across different spatial–temporal ranges without any biases.
Two datasets are generated from the FEA simulation for the condition assessment of the rebar and concrete, respectively. We first investigate the condition model of concrete cracking (represented by DAMAGET) during the flexural test. The DAMAGET values at the surface of the beam under varying loading conditions are compiled into a dataset, which is divided into the training (80% of the total dataset) and the test (20% of the total dataset) datasets. Seven ML regression models are applied for training data, and their prediction results are compared with the test dataset. Table 2 summarizes the prediction performance of the algorithms through error analysis. As mentioned in Section 2.2.3, MAE measures the difference between the predicted values and the true values, MSE highlights the situation where larger errors occur, and R 2 indicates how much of the dependent variable’s variance can be explained by the independent variables.
As shown in Table 2, all the linear algorithms show a poor performance. Their MAE values are all close to 0.2. According to the FEA results, the maximum DAMAGET value is 1, the mean of all DAMAGET values is 0.131, and the standard deviation is 0.314. Given this background of DAMAGET, an average prediction error of 0.2 is inadequate because it cannot capture the trend of data. Consequently, linear algorithms are unsuitable for prediction. In contrast, treelike algorithms show a good performance, as their coefficient of determination is almost always above 0.9, except for Light GBM. In addition, their MSE is much smaller than the results from linear algorithms, which indicates they are less likely to have large errors. Figure 9 summarizes the data to provide a more intuitive view of the performance of these algorithms. A smaller MAE (blue) and MSE (salmon) and a larger R 2   (green) indicate a better result. In this case, the treelike models outperform linear models for DAMAGET prediction. As mentioned earlier, treelike models can learn complex nonlinear patterns better than linear models by splitting feature spaces. In addition, treelike algorithms are more robust to deal with outliers, meaning that the overall performance of treelike algorithms is not as easily affected by local outliers compared to linear algorithms. Therefore, in general, without considering computational efficiency, treelike models can better adapt to real data distribution. It should be noted that this situation also occurs for the stress prediction of the rebar. Therefore, RFR, with the highest R 2 , is chosen for the following condition prediction process.

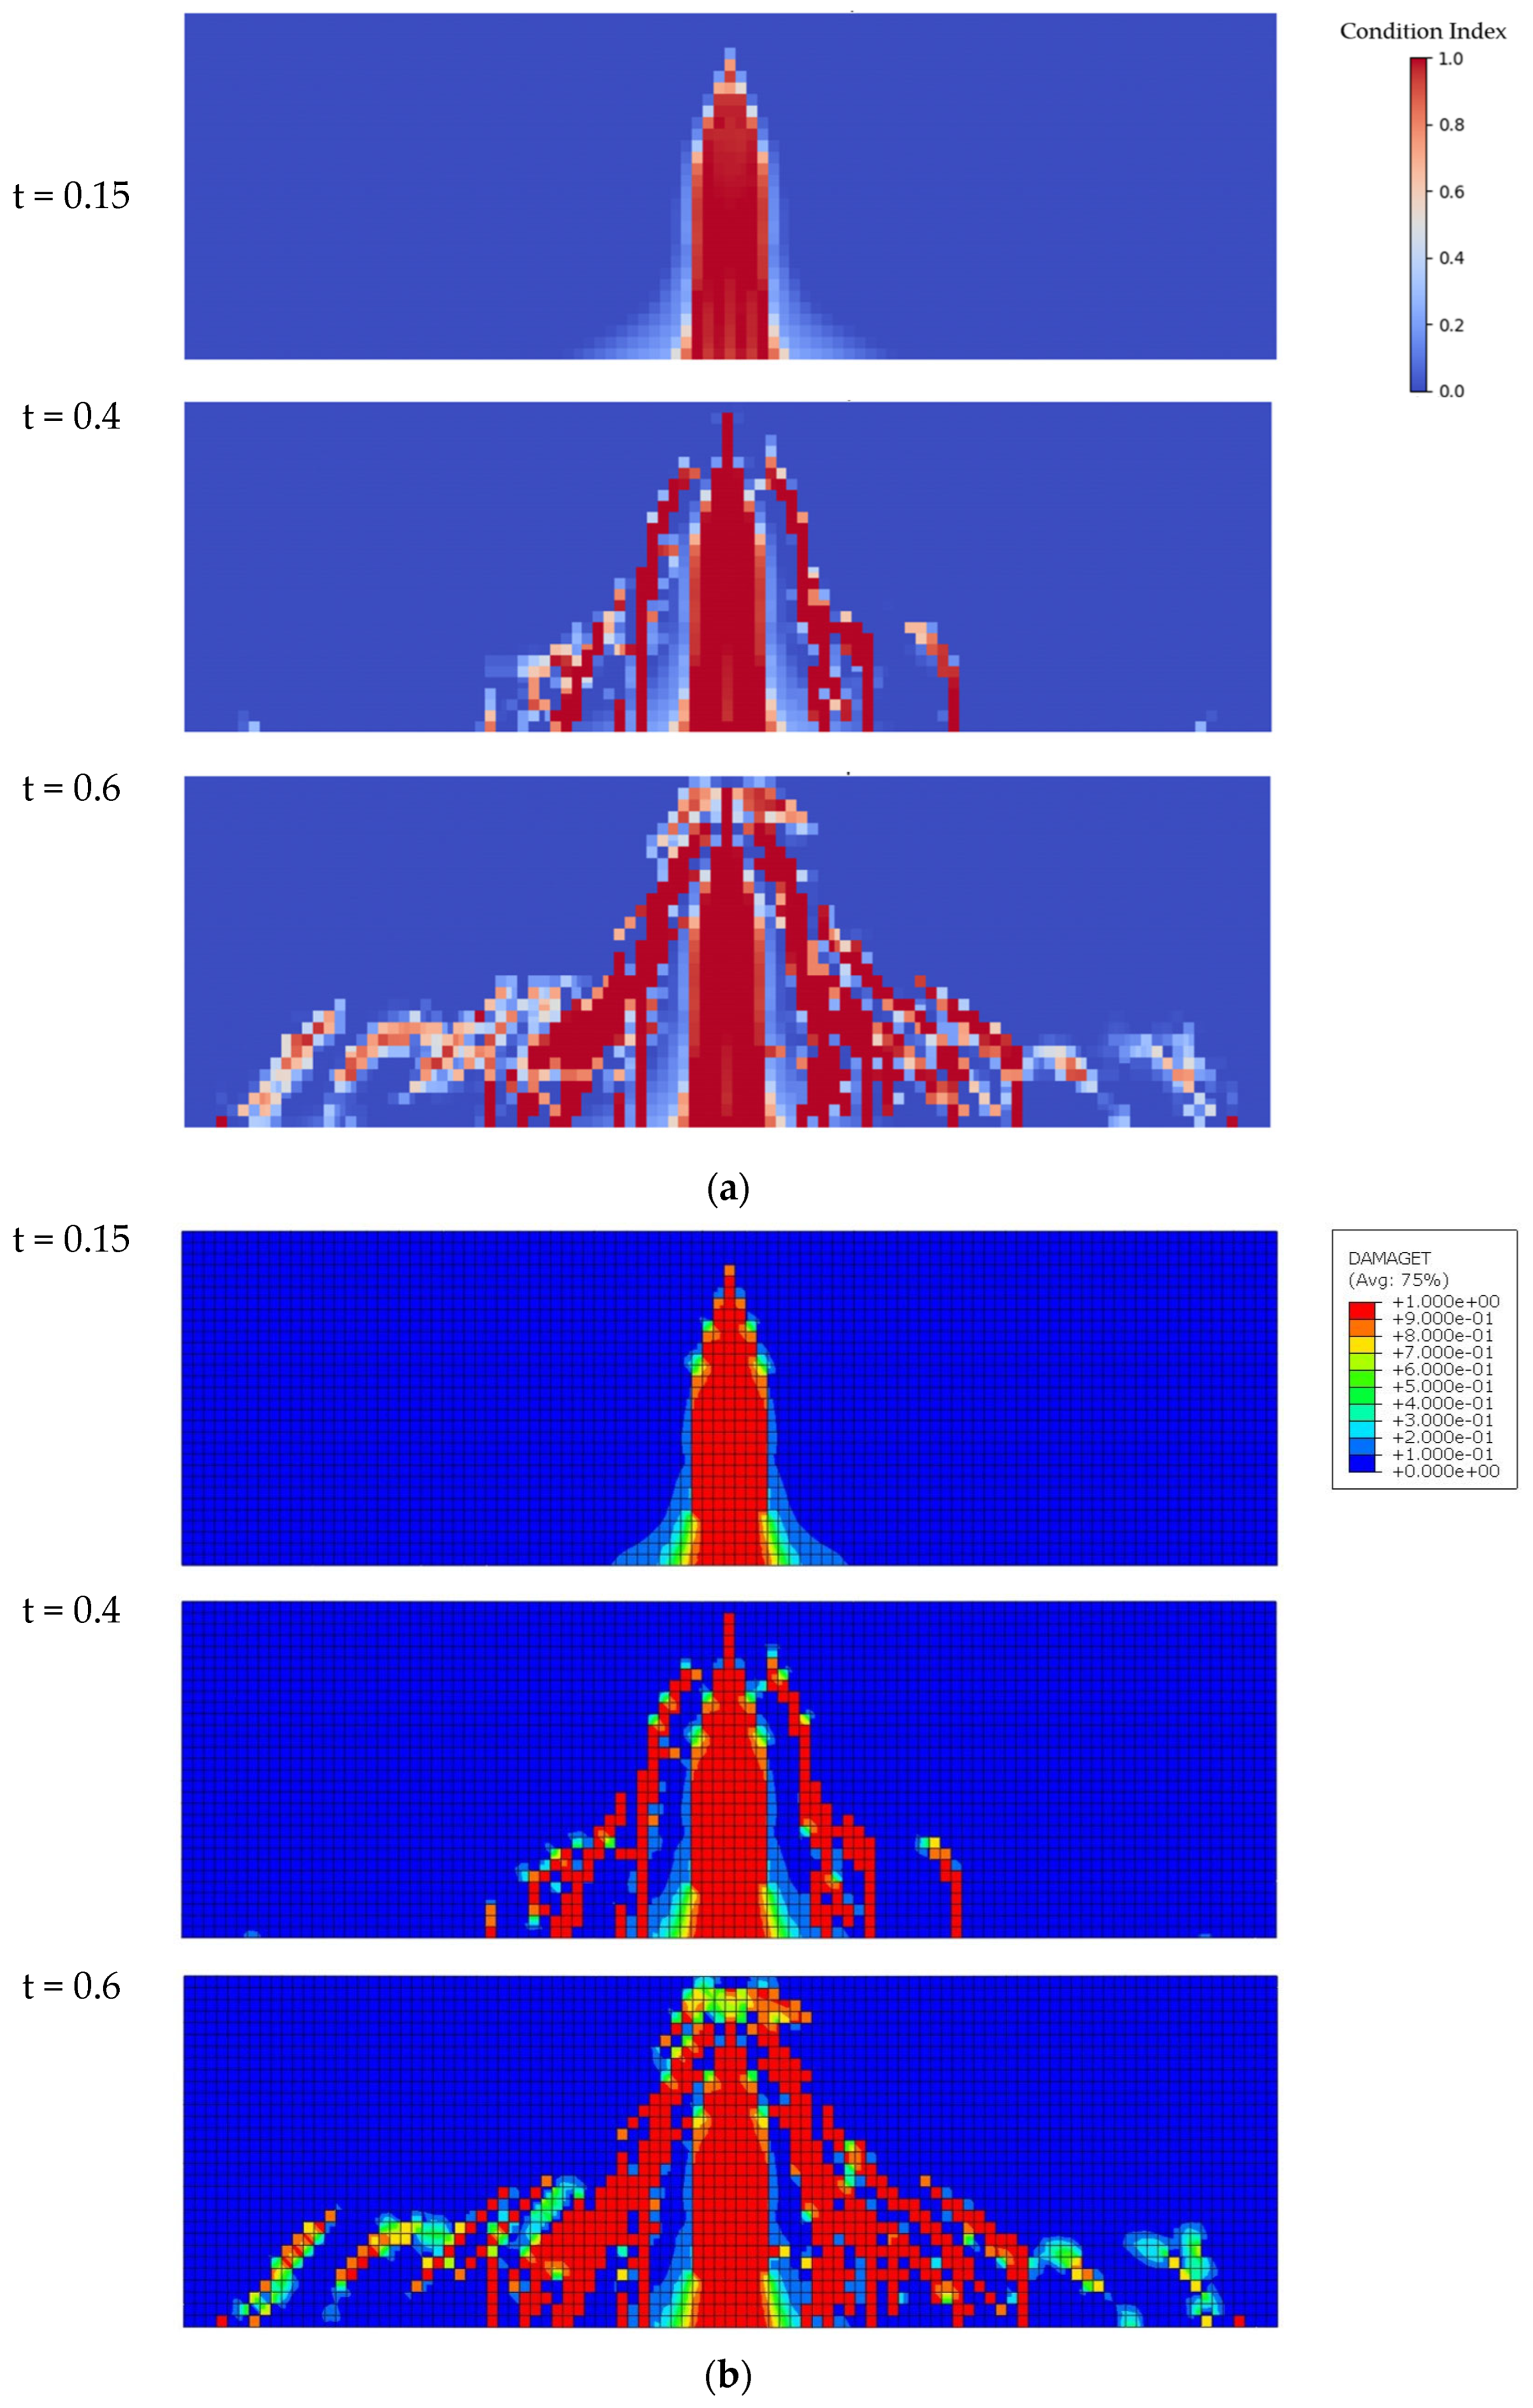
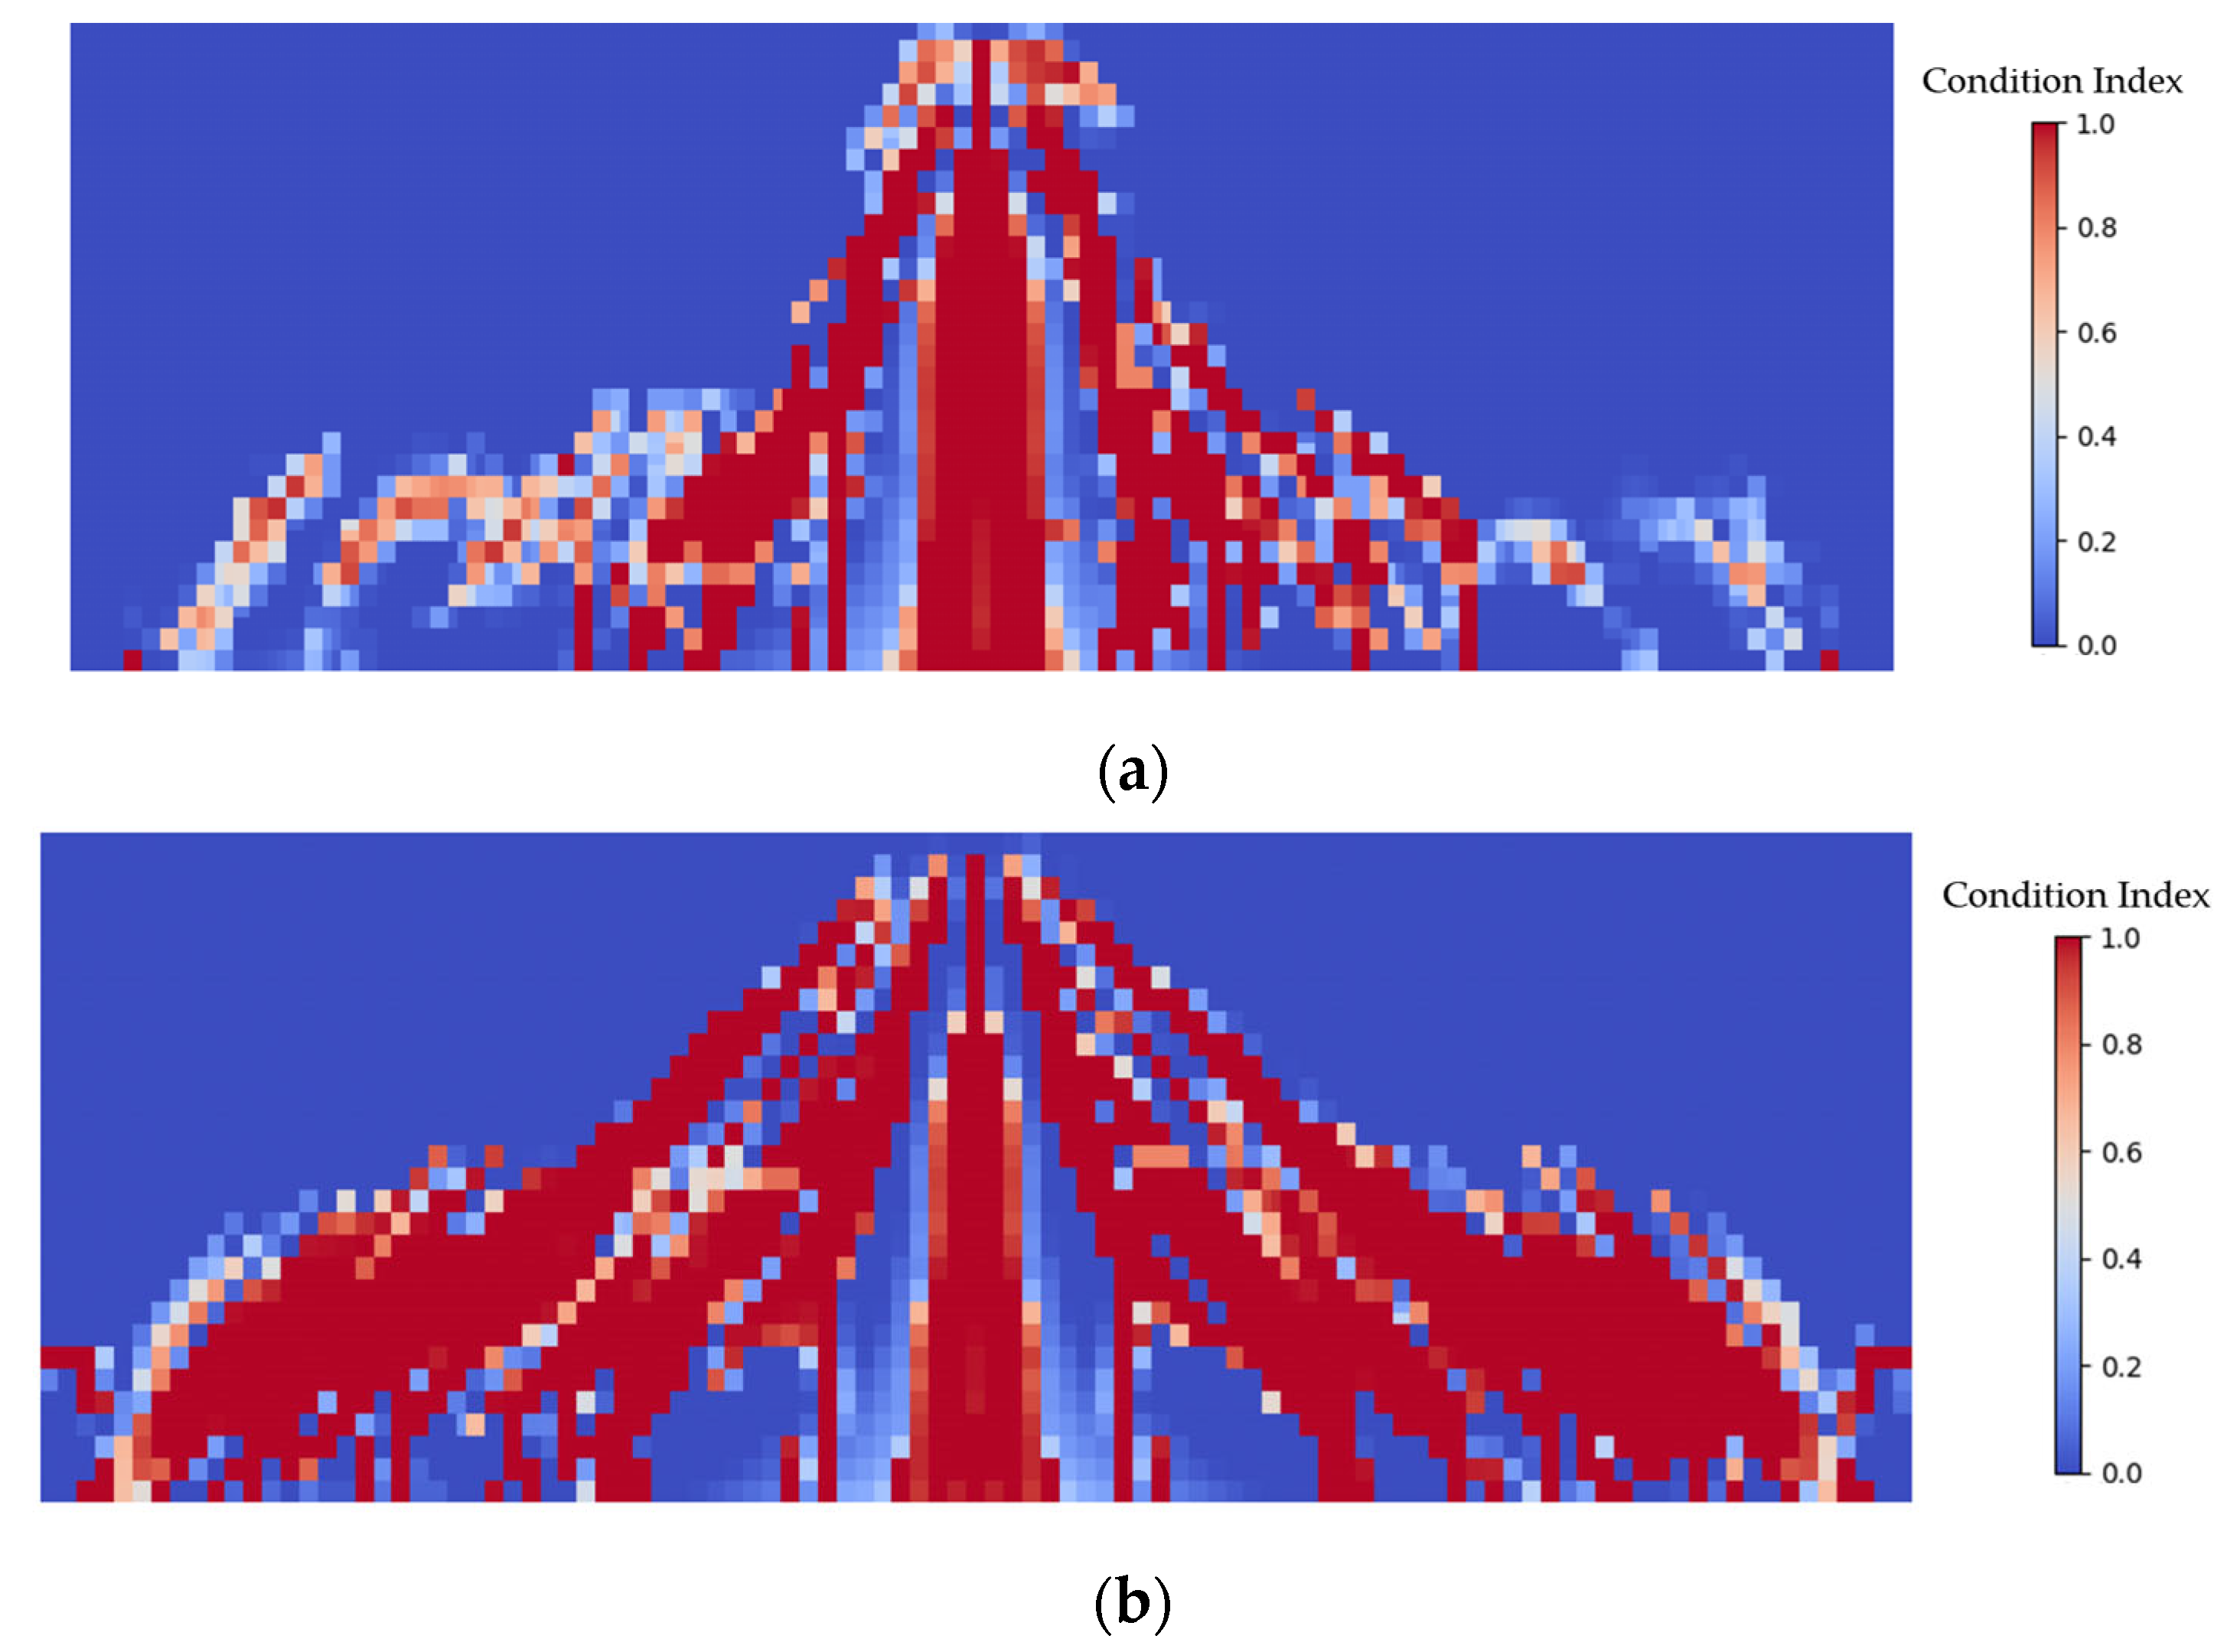
3.2.2. Condition Assessment of Rebar

As mentioned previously, two failure models are considered for the flexural test. This section starts with the failure of rebar yielding. The RC beams are embedded with composite and metallic reinforcements to compare their mechanical performance. The von Mises stress and maximum principal stress of the reinforcement are collected at specific time steps. Using the RFR algorithm, 80% of the dataset is used for training, and the rest is used for testing. The R 2 of the result is 0.99, which indicates that the prediction is of high accuracy. For the composite rebar, the maximum von Mises stress is 311.28 MPa at the normalized time of 0.56, and the highest maximum principal stress, 323.94 MPa, occurs at t = 0.57. For the metallic rebar, the maximum von Mises stress is 446.43 MPa, and the highest maximum principal stress is 456.83 MPa, both occurring at t = 0.31. The ML algorithm predictions are not only consistent with the previous FEA results but also provide precise timing for peak stress occurrences. Figure 10a,b show the predicted distribution of von Mises stress at t = 0.56 (or displacement = 2.81 mm) and maximum principal stress at t = 0.57 (or displacement = 2.86 mm) of the composite rebar. Figure 10c,d exhibit the distribution of von Mises stress and maximum principal stress of the metallic rebar at t = 0.31 (or displacement = 1.53 mm).
As observed, the highest stress concentrations in both composite and metallic rebars occur in the middle section, making this area the most critical for potential yielding failure. Under these conditions, comparing the predicted von Mises stress and maximum principal stress at the midsection with their respective strengths could help to determine structural condition. Comparisons between the maximum stresses and strengths of the two types of rebar are presented in Table 3. For the composite rebar, the maximum von Mises stress is 311.28 MPa and the maximum principal stress is 323.94 MPa, both well below its ultimate strength of 1003 MPa. For the metallic rebar, the maximum von Mises stress is 446.43 MPa and the maximum principal stress is 456.83 MPa, both lower than its yield strength of 500 MPa. This indicates that the reinforcements remain in safe conditions during the three-point flexural test. Thus, the primary focus should be on the condition of concrete in the tensile zone.

3.2.3. Condition Assessment of Concrete Beam

Since DAMAGET describes the damage level of elements under tensile stress, it can serve as a metric to measure the structure condition. Therefore, the condition index predicted from the ML model can be obtained by normalizing the DAMAGET values to a range of 0 to 1. Figure 11 compares the ML predictions and FEA results at normalized time points of 0.15, 0.4, and 0.6 (or displacement of 0.75, 2, and 3 mm, respectively). RFR provides a prediction with an R2 of 0.96, MSE of 0.004, and MAE of 0.012, indicating a high degree of precision.
As shown in Figure 11, the damage in tension starts at the bottom center of the concrete, generating a main vertical damaged area. As the displacement load on the upper part increases, the danger zone gradually approaches the supports and generates many small, inclined cracks, but the damage level decreases as it moves away from the center. In addition, the vertical damaged zone will gradually extend upward until the beam completely fails. Both the error analysis coefficients and DAMAGET distribution comparison illustrate that the ML model can accurately predict the spatial–temporal condition. This reduces the time and effort required to predict conditions through experiments or FEA simulation. In addition, the comparison of crack-resistant performance between composite and metallic reinforcement is also discussed in this paper. We choose the predicted condition index pattern at the time point of 0.6, since it is a representative situation, as shown in Figure 12. Similarly to the results for the FEA simulation, the composite rebar shows better performance for concrete protection in the tensile zone. Compared with the metallic rebar, the composite one can significantly reduce the high-DAMAGET area under the same load, especially near the supports, which helps to control the crack generation and propagation.

3.3. Discussion

This paper proposes an integrated approach that employs FEA and ML to computationally investigate and assess the spatial–temporal condition of RC beams under flexural loading. Two types of longitudinal reinforcements, metallic and composite, are embedded to study their mechanical behaviors. First, the FEA simulation results of the three-point flexural test are validated against experimental results, from which we can conclude that composite rebars perform better than metallic rebars in terms of stress fields (with 30.27% less stress in composite rebars than metallic rebars). Consequently, the composite RC beam exhibits fewer cracks compared to the metallic RC beams, indicating that the composite rebar has a better capacity for limiting crack propagation, making it promising for concrete components under flexural loading. We find that cracks in the RC beam propagate from the vertical flexural cracks to the 45° shear crack, continually growing until ultimate failure occurs. The shear capacity was found to be proportional to the flexural cracking load [58]. A delayed appearance of shear cracks corresponds to a higher loading capacity. Therefore, based on numerical results, the composite RC beam has a higher loading capacity compared to the metallic RC beam, since the shear cracks on the composite RC beam appear significantly later. The FEA method presented in this study accurately simulates both flexural and shear crack propagation, aligning well with reference results. FEA allows for high-precision physical modeling, which saves time and costs compared with experiments. The large reliable database generated from FEA can be beneficial for ML algorithms. In addition, unlike empirical models that may oversimplify crack behavior, the FEA approach in this study incorporates the damage parameter, DAMAGET, providing a detailed spatial–temporal condition assessment of structural performance.
The spatial–temporal condition dataset is then obtained by collecting the contexts of damage in tension of elements on RC beams over time. Seven regression algorithms are chosen for the prediction of damage in tension. Here, 20% of the dataset is designated as test data to measure the performance of these algorithms. The result indicates that compared with linear algorithms, the treelike algorithms consistently yield better results. Among these, the RFR shows the best performance, with an R 2   = 0.96 in the prediction of DAMAGET. In addition, the spatial–temporal condition result reveals a correlation between the initiation of shear cracks and maximum von Mises stress in rebars. Shear cracks are always detected alongside the appearance of maximum von Mises stress in the reinforcements. The ML results align well with the FEA simulation. The prediction of von Mises stress and maximum principal stress of the rebars indicates that the rebar yielding risk is not a concern. For crack propagation on RC beams, the predictions of ML closely match the simulation results, demonstrating the accuracy and effectiveness of ML algorithms for spatial–temporal condition prediction. In addition, compared to traditional models based on physical equations, the ML approach in this paper provides novel and efficient predictive models that can be used for real-time monitoring and decision-making processes, having significant advantages in time-sensitive engineering scenarios.

4. Conclusions

This study provides an integrated computational framework that combines FEA and ML to advance the spatial–temporal condition assessment of RC beams under flexural loading. By comparing the performance of metallic and composite reinforcements, it highlights the better crack resistance of composite rebars, offering promising implications for the development of more resilient and durable civil infrastructure. This research also establishes correlations between rebar stress states and concrete crack propagation patterns, providing critical insights that can inform safer and more cost-effective design and maintenance strategies for reinforced concrete structures. Furthermore, the use of ML for accurate spatial–temporal condition prediction showcases its potential to revolutionize structural monitoring and condition management, establishing a method for performing predictive maintenance and extending the lifespan of key infrastructure components. The integrated framework of ML and FEA significantly reduces the time, labor, and material requirements of physical testing. This novel computational investigation approach can be applied to drive smart and autonomous infrastructure design and manufacturing with real-time prediction and adjustment. For instance, the integrated framework has the potential to be applied to real-world reinforced concrete applications, where in-field crack propagation patterns can be used to predict the conditions of the invisible reinforcements. Additionally, the framework has further potential for designing crack-resistant concrete structures in environments subject to different nature hazards, due to its versatility in simulating different conditions. Future work will focus on expanding this framework to analyze a wider range of structural scenarios, including dynamic loading conditions, reinforcement materials, and environmental factors, such as temperature and corrosion. Additionally, there are some limitations to FEA in terms of predicting larger structural systems in practice. We plan to conduct physical testing in the lab and field to validate our FEA results. We will also integrate experimental data with FEA data to train the ML models and enhance the robustness and applicability of predictions. We will also leverage smart sensor technology for the real-time monitoring and condition assessment of reinforced concrete systems, thereby improving infrastructure safety.

Author Contributions

C.T. developed the framework of this paper; J.D. and H.Y. performed the numerical simulations and machine learning modeling. All authors contributed to the writing of this paper. All authors have read and agreed to the published version of the manuscript.

Funding

The authors express their gratitude for the funding provided to support this study from U.S. Department of Transportation—Transportation Infrastructure Precast Innovation Center (TRANS-IPIC) through Award Number PU-23-RP-05. The findings and opinions expressed in this article are those of the authors only and do not necessarily reflect the views of the sponsor.

Data Availability Statement

Data are contained within the article.

Conflicts of Interest

The authors declare no conflicts of interest.

References

  1. Cui, J.; Hao, H.; Shi, Y. Discussion on the Suitability of Concrete Constitutive Models for High-Rate Response Predictions of RC Structures. Int. J. Impact Eng. 2017, 106, 202–216. [Google Scholar] [CrossRef]
  2. Senin, M.S.; Shahidan, S.; Leman, A.S.; Othman, N.; Shamsuddin, S.; Ibrahim, M.H.W.; Zuki, S.M. The Durability of Concrete Containing Recycled Tyres as a Partial Replacement of Fine Aggregate. In Proceedings of the IOP Conference Series: Materials Science and Engineering, Busan, Republic of Korea, 25–27 August 2017; Volume 271, p. 012075. [Google Scholar]
  3. Chemrouk, M. The Deteriorations of Reinforced Concrete and the Option of High Performances Reinforced Concrete. Procedia Eng. 2015, 125, 713–724. [Google Scholar] [CrossRef]
  4. Imperatore, S.; Rinaldi, Z.; Drago, C. Degradation Relationships for the Mechanical Properties of Corroded Steel Rebars. Constr. Build. Mater. 2017, 148, 219–230. [Google Scholar] [CrossRef]
  5. Nässén, J.; Holmberg, J.; Wadeskog, A.; Nyman, M. Direct and Indirect Energy Use and Carbon Emissions in the Production Phase of Buildings: An Input–Output Analysis. Energy 2007, 32, 1593–1602. [Google Scholar] [CrossRef]
  6. Betancourt, N.; Corvo, F.; Cuesta, O.; Labrador, R.; González, M.L.; Pérez, J.; León, Y.; Cruz, P. Influence of SO2 and NOx on Atmospheric Corrosion of Steel. Rev. CENIC. Cienc. Químicas 2002, 33, 71–75. [Google Scholar]
  7. James, A.; Bazarchi, E.; Chiniforush, A.A.; Aghdam, P.P.; Hosseini, M.R.; Akbarnezhad, A.; Martek, I.; Ghodoosi, F. Rebar Corrosion Detection, Protection, and Rehabilitation of Reinforced Concrete Structures in Coastal Environments: A Review. Constr. Build. Mater. 2019, 224, 1026–1039. [Google Scholar] [CrossRef]
  8. Baena, M.; Torres, L.; Turon, A.; Barris, C. Experimental Study of Bond Behaviour between Concrete and FRP Bars Using a Pull-out Test. Compos. Part B Eng. 2009, 40, 784–797. [Google Scholar] [CrossRef]
  9. Emparanza, A.R.; Kampmann, R.; De Caso, F.; Morales, C.; Nanni, A. Durability Assessment of GFRP Rebars in Marine Environments. Constr. Build. Mater. 2022, 329, 127028. [Google Scholar] [CrossRef]
  10. Kalaiselvi, M.; Sivagamasundari, R. Study of Geopolymer Concrete Beam with Glass Fibre Reinforced Polymer Rebars–A Review. Civ. Eng. Archit. 2022, 10, 45–54. [Google Scholar] [CrossRef]
  11. Renić, T.; Kišiček, T. Ductility of Concrete Beams Reinforced with FRP Rebars. Buildings 2021, 11, 424. [Google Scholar] [CrossRef]
  12. Lee, J.-H.; Cho, B.; Choi, E. Flexural Capacity of Fiber Reinforced Concrete with a Consideration of Concrete Strength and Fiber Content. Constr. Build. Mater. 2017, 138, 222–231. [Google Scholar] [CrossRef]
  13. Hamrat, M.; Boulekbache, B.; Chemrouk, M.; Amziane, S. Flexural Cracking Behavior of Normal Strength, High Strength and High Strength Fiber Concrete Beams, Using Digital Image Correlation Technique. Constr. Build. Mater. 2016, 106, 678–692. [Google Scholar] [CrossRef]
  14. Rahman, M.; Saifullah, I.; Ghosh, S.K. Detection and Measurements of Cracks in Axially Loaded Tension RC Members by Image Processing Technique. Am. J. Civ. Eng. Arch. 2019, 7, 115–120. [Google Scholar]
  15. Fischer, O.; Thoma, S.; Crepaz, S. Distributed Fiber Optic Sensing for Crack Detection in Concrete Structures. Civ. Eng. Des. 2019, 1, 97–105. [Google Scholar] [CrossRef]
  16. Halahla, A. Study the Behavior of Reinforced Concrete Beam Using Finite Element Analysis. In Proceedings of the 3rd World Congress on Civil, Structural, and Environmental Engineering (April 2018), Budapest, Hungary, 8–10 April 2018; Volume 10. [Google Scholar]
  17. Drygala, I.; Dulinska, J.; Jasienko, J. Numerical Evaluation of Seismic-Induced Damages in Masonry Elements of Historical Arch Viaduct. In Proceedings of the IOP Conference Series: Materials Science and Engineering, Melbourne, Australia, 15–16 September 2018; Volume 364, p. 012006. [Google Scholar]
  18. Lv, X.; Yu, Z.; Shan, Z. Seismic Behaviour of Frame Structures with Assembly of Prefabricated Concrete Beam. J. Build. Eng. 2021, 40, 102765. [Google Scholar] [CrossRef]
  19. Kujawa, M.; Lubowiecka, I.; Szymczak, C. Finite Element Modelling of a Historic Church Structure in the Context of a Masonry Damage Analysis. Eng. Fail. Anal. 2020, 107, 104233. [Google Scholar] [CrossRef]
  20. Mehra, A.S.; Singh, S.B.; Kodur, V.K.R. Methodology for Predicting the Structural Response of FRP-Concrete Composite Beams Using Abaqus/CAE Software Package. In Stability and Failure of High Performance Composite Structures; Singh, S.B., Barai, S.V., Eds.; Composites Science and Technology; Springer: Singapore, 2022; pp. 417–452. ISBN 978-981-19242-3-1. [Google Scholar]
  21. Sarker, I.H. Machine Learning: Algorithms, Real-World Applications and Research Directions. SN Comput. Sci. 2021, 2, 160. [Google Scholar] [CrossRef] [PubMed]
  22. Mahesh, B. Machine Learning Algorithms-a Review. Int. J. Sci. Res. (IJSR) 2020, 9, 381–386. [Google Scholar] [CrossRef]
  23. Kang, M.-C.; Yoo, D.-Y.; Gupta, R. Machine Learning-Based Prediction for Compressive and Flexural Strengths of Steel Fiber-Reinforced Concrete. Constr. Build. Mater. 2021, 266, 121117. [Google Scholar] [CrossRef]
  24. Smolnicki, M.; Lesiuk, G.; Stabla, P.; Pedrosa, B.; Duda, S.; Zielonka, P.; Lopes, C.C.C. Investigation of Flexural Behaviour of Composite Rebars for Concrete Reinforcement with Experimental, Numerical and Machine Learning Approaches. Phil. Trans. R. Soc. A 2023, 381, 20220394. [Google Scholar] [CrossRef]
  25. Ogaili, A.A.F.; Hamzah, M.N.; Jaber, A.A. Integration of Machine Learning (ML) and Finite Element Analysis (FEA) for Predicting the Failure Modes of a Small Horizontal Composite Blade. Int. J. Renew. Energy Res. (IJRER) 2022, 12, 2168–2179. [Google Scholar]
  26. Alrsai, M.; Karampour, H.; Alhawamdeh, M.; Alajarmeh, O. Integrated Finite Element Analysis and Machine Learning Approach for Propagation Pressure Prediction in Hybrid Steel-CFRP Subsea Pipelines. Ocean Eng. 2024, 311, 118808. [Google Scholar] [CrossRef]
  27. Bypour, M.; Mahmoudian, A.; Tajik, N.; Taleshi, M.M.; Mirghaderi, S.R.; Yekrangnia, M. Shear Capacity Assessment of Perforated Steel Plate Shear Wall Based on the Combination of Verified Finite Element Analysis, Machine Learning, and Gene Expression Programming. Asian J. Civ. Eng. 2024, 25, 5317–5333. [Google Scholar] [CrossRef]
  28. Figueiredo, E.; Moldovan, I.; Santos, A.; Campos, P.; Costa, J.C.W.A. Finite Element–Based Machine-Learning Approach to Detect Damage in Bridges under Operational and Environmental Variations. J. Bridge Eng. 2019, 24, 04019061. [Google Scholar] [CrossRef]
  29. Capuano, G.; Rimoli, J.J. Smart Finite Elements: A Novel Machine Learning Application. Comput. Methods Appl. Mech. Eng. 2019, 345, 363–381. [Google Scholar] [CrossRef]
  30. Singh, A.; Thakur, N.; Sharma, A. A Review of Supervised Machine Learning Algorithms. In Proceedings of the 2016 3rd international conference on computing for sustainable global development (INDIACom), New Delhi, India, 16–18 March 2016; pp. 1310–1315. [Google Scholar]
  31. ASTM C293/C293M-16; Standard Test Method for Flexural Strength of Concrete (Using Simple Beam with Center-Point Loading). American Society for Testing and Materials: West Conshohocken, PA, USA, 2016.
  32. ACI Committee 440. Building Code Requirements for Structural Concrete Reinforced with Glass Fiber-Reinforced Polymer (GFRP) Bars—Code and Commentary (ACI CODE-440.11-22); American Concrete Institute: Framington Hills, MI, USA, 2023. [Google Scholar]
  33. ACI-440.1R-15 Committee. Guide for the Design and Construction of Structural Concrete Reinforced with FRP Bars; American Concrete Institute: Framington Hills, MI, USA, 2015. [Google Scholar]
  34. Marí, A.; Cladera, A.; Oller, E.; Bairán, J. Shear Design of FRP Reinforced Concrete Beams without Transverse Reinforcement. Compos. Part B Eng. 2014, 57, 228–241. [Google Scholar] [CrossRef]
  35. Mak, M.W.T.; Lees, J.M. Shear Design in Concrete Beams without Transverse Reinforcement-A Comparative Study; International Association for Bridge and Structural Engineering (IABSE): Zürich, Switzerland, 2022. [Google Scholar]
  36. George, J.; Rama, J.K.; Kumar, M.S.; Vasan, A. Behavior of Plain Concrete Beam Subjected to Three Point Bending Using Concrete Damaged Plasticity (CDP) Model. Mater. Today Proc. 2017, 4, 9742–9746. [Google Scholar] [CrossRef]
  37. Yang, X.; Liu, L.; Wang, Y. Experimental Test and Numerical Simulation of the Initial Crack Reinforced Concrete Beam in Bending. In Proceedings of the IOP Conference Series: Earth and Environmental Science, Barcelona, Spain, 11–12March 2018; Volume 186, p. 012056. [Google Scholar]
  38. Seok, S.; Haikal, G.; Ramirez, J.A.; Lowes, L.N.; Lim, J. Finite Element Simulation of Bond-Zone Behavior of Pullout Test of Reinforcement Embedded in Concrete Using Concrete Damage-Plasticity Model 2 (CDPM2). Eng. Struct. 2020, 221, 110984. [Google Scholar] [CrossRef]
  39. Systemes, D. ABAQUS/CAE User’s Manual, version 6.14; Dassault Systemes Simulia Corp: Providence, RI, USA, 2014.
  40. Owens Corning Composites. Available online: https://www.owenscorning.com/en-us/composites/product/pinkbar-plus-fiberglass-rebar (accessed on 24 July 2024).
  41. Kartheek, T.; Das, T.V. 3D Modelling and Analysis of Encased Steel-Concrete Composite Column Using ABAQUS. Mater. Today Proc. 2020, 27, 1545–1554. [Google Scholar] [CrossRef]
  42. Sinaei, H.; Shariati, M.; Abna, A.H.; Aghaei, M.; Shariati, A. Evaluation of Reinforced Concrete Beam Behaviour Using Finite Element Analysis by ABAQUS. Sci. Res. Essays 2012, 7, 2002–2009. [Google Scholar]
  43. Zheng, J.; Li, J.; Chen, J. Study on Bearing Capacity of Reinforced Sleeve Grouting Connected Concrete Shear Wall after Fire. In Advances in Urban Engineering and Management Science Volume 1; CRC Press: Boca Raton, FL, USA, 2022; pp. 300–311. [Google Scholar]
  44. Linear Regression—Su—2012—WIREs Computational Statistics—Wiley Online Library. Available online: https://wires.onlinelibrary.wiley.com/doi/full/10.1002/wics.1198?casa_token=23loujCnBQEAAAAA%3Aq9iDuMTHieGPsXgVN2C7xFFrguKftqg-cinOfDvIA_Np6ZiPLhB_EmjNJQEFoFu22nQ7KmjEkL4q5zaMRQ (accessed on 12 July 2024).
  45. Ray, S. A Quick Review of Machine Learning Algorithms. In Proceedings of the 2019 International Conference on Machine Learning, Big Data, Cloud and Parallel Computing (COMITCon), Faridabad, India, 14–16 February 2019; pp. 35–39. [Google Scholar]
  46. McDonald, G.C. Ridge Regression. WIREs Comput. Stats 2009, 1, 93–100. [Google Scholar] [CrossRef]
  47. Awad, M.; Khanna, R. Efficient Learning Machines: Theories, Concepts, and Applications for Engineers and System Designers; Springer: Berlin/Heidelberg, Germany, 2015. [Google Scholar]
  48. Zhang, F.; O’Donnell, L.J. Support Vector Regression. In Machine learning; Elsevier: Amsterdam, The Netherlands, 2020; pp. 123–140. [Google Scholar]
  49. Xu, M.; Watanachaturaporn, P.; Varshney, P.K.; Arora, M.K. Decision Tree Regression for Soft Classification of Remote Sensing Data. Remote Sens. Environ. 2005, 97, 322–336. [Google Scholar] [CrossRef]
  50. Loh, W. Classification and Regression Trees. WIREs Data Min. Knowl. 2011, 1, 14–23. [Google Scholar] [CrossRef]
  51. Pekel, E. Estimation of Soil Moisture Using Decision Tree Regression. Theor. Appl. Climatol. 2020, 139, 1111–1119. [Google Scholar] [CrossRef]
  52. Dong, J.; Chen, Y.; Yao, B.; Zhang, X.; Zeng, N. A Neural Network Boosting Regression Model Based on XGBoost. Appl. Soft Comput. 2022, 125, 109067. [Google Scholar] [CrossRef]
  53. Zhang, X.; Yan, C.; Gao, C.; Malin, B.A.; Chen, Y. Predicting Missing Values in Medical Data via XGBoost Regression. J. Healthc. Inform. Res. 2020, 4, 383–394. [Google Scholar] [CrossRef] [PubMed]
  54. Amin, M.N.; Salami, B.A.; Zahid, M.; Iqbal, M.; Khan, K.; Abu-Arab, A.M.; Alabdullah, A.A.; Jalal, F.E. Investigating the Bond Strength of FRP Laminates with Concrete Using LIGHT GBM and SHAPASH Analysis. Polymers 2022, 14, 4717. [Google Scholar] [CrossRef] [PubMed]
  55. Ke, G.; Meng, Q.; Finley, T.; Wang, T.; Chen, W.; Ma, W.; Ye, Q.; Liu, T.-Y. Lightgbm: A Highly Efficient Gradient Boosting Decision Tree. Adv. Neural Inf. Process. Syst. 2017, 30, 3146–3154. [Google Scholar]
  56. Chicco, D.; Warrens, M.J.; Jurman, G. The Coefficient of Determination R-Squared Is More Informative than SMAPE, MAE, MAPE, MSE and RMSE in Regression Analysis Evaluation. Peerj Comput. Sci. 2021, 7, e623. [Google Scholar] [CrossRef]
  57. Maranan, G.B.; Manalo, A.C.; Benmokrane, B.; Karunasena, W.; Mendis, P. Evaluation of the Flexural Strength and Serviceability of Geopolymer Concrete Beams Reinforced with Glass-Fibre-Reinforced Polymer (GFRP) Bars. Eng. Struct. 2015, 101, 529–541. [Google Scholar] [CrossRef]
  58. Alam, M.S.; Hussein, A. Relationship between the Shear Capacity and the Flexural Cracking Load of FRP Reinforced Concrete Beams. Constr. Build. Mater. 2017, 154, 819–828. [Google Scholar] [CrossRef]
Figure 1. Geometry of RC beam. (a) Front view; (b) side view.
Buildings 15 00435 g001
Figure 2. Concrete yield surfaces on (a) the deviatoric plane and (b) for plane stress conditions [39].
Buildings 15 00435 g002
Figure 3. Meshes of the RC beam.
Buildings 15 00435 g003
Figure 4. Typical structure of treelike algorithms. (a) Decision tree; (b) random forest.
Buildings 15 00435 g004
Figure 5. FEA results for the crack patterns of the composite RC beam under the flexural strength test: (a) t = 0.15; (b) t = 0.4; (c) t = 0.6; (d) t = 1.
Buildings 15 00435 g005
Figure 6. FEA results for the von Mises stress of the composite reinforcement under the flexural strength test: (a) t = 0.15; (b) t = 0.4; (c) t = 0.6; (d) t = 1.
Buildings 15 00435 g006
Figure 7. FEA results for the crack patterns of the metallic RC beam under the flexural strength test: (a) t = 0.15; (b) t = 0.4; (c) t = 0.6; (d) t = 1.
Buildings 15 00435 g007
Figure 8. FEA results for the von Mises stress of the steel reinforcement under the flexural strength test: (a) t = 0.15; (b) t = 0.4; (c) t = 0.6; (d) t = 1.
Buildings 15 00435 g008
Figure 9. Performance comparison among different algorithms. (a) Three metrics (MAE, MSE, and R 2 ) are used for evaluation. (b) The comprehensive performance of different algorithms.
Buildings 15 00435 g009
Figure 10. Rebar condition assessment through stress prediction along the rebar using RFR. (a) von Mises stress of the composite rebar; (b) maximum principal stress of the composite rebar; (c) von Mises stress of the metallic rebar; (d) maximum principal stress of the metallic rebar.
Buildings 15 00435 g010
Figure 11. Comparison between (a) ML and (b) FEA results at different time steps.
Buildings 15 00435 g011
Figure 12. Comparison of condition indices between (a) composite and (b) metallic RC beams at t = 0.6.
Buildings 15 00435 g012
Table 1. Material properties used in finite element models.
MaterialParameterValue
ConcreteYoung’s modulus (GPa)
Poisson’s ratio
Dilation angle (°)
Eccentricity
σ b 0 / σ c 0
K
Viscosity parameter
32.1
0.2
30
0.1
1.16
0.66
0.001
Steel ReinforcementYoung’s modulus (GPa)
Poisson’s ratio
Yield strength (MPa)
Yield strain (mm/mm)
Ultimate strength (MPa)
Ultimate strain (mm/mm)
200
0.3
500
0.00317
635
0.14559
Composite ReinforcementYoung’s modulus (GPa)
Poisson’s ratio
Ultimate strength (MPa)
46.88
0.3
1003
Table 2. Prediction performance of DAMAGET with different ML algorithms.
ML MethodsAlgorithmsMAEMSER2
Linear algorithmsLinear regression0.2030.0890.109
Ridge regression0.2010.0880.110
Linear support vector regression0.1930.101−0.007
Treelike algorithmsDecision tree regression0.0080.0040.953
Random Forest regression0.0120.0040.960
XG Boost0.0310.0060.945
Light GBM0.0880.0310.717
Table 3. Comparisons between maximum stresses and strengths.
Rebar TypeMaximum von Mises Stress (MPa)Maximum Principal Stress (MPa)Strength (MPa)
Composite rebar311.28323.941003
Metallic rebar446.43456.83500
Disclaimer/Publisher’s Note: The statements, opinions and data contained in all publications are solely those of the individual author(s) and contributor(s) and not of MDPI and/or the editor(s). MDPI and/or the editor(s) disclaim responsibility for any injury to people or property resulting from any ideas, methods, instructions or products referred to in the content.

