
Analyzing Cost Overrun Risks in Construction Projects: A Multi-Stakeholder Perspective Using Fuzzy Group Decision-Making and K-Means Clustering

 ,
, 
 , and
, and
Abstract
:1. Introduction
- Provides new insights into managing over-budget risks in Egypt by systematically identifying 48 critical factors.
- Develops an innovative methodological framework that integrates K-means clustering and FGDMA, combining quantitative analysis for clustering risks with qualitative prioritization based on stakeholder perspectives.
- Employs sensitivity analysis and Tornado charts to highlight differences and alignments among the priorities of stakeholders, enabling the design of more effective and targeted risk mitigation strategies.
2. Research Background
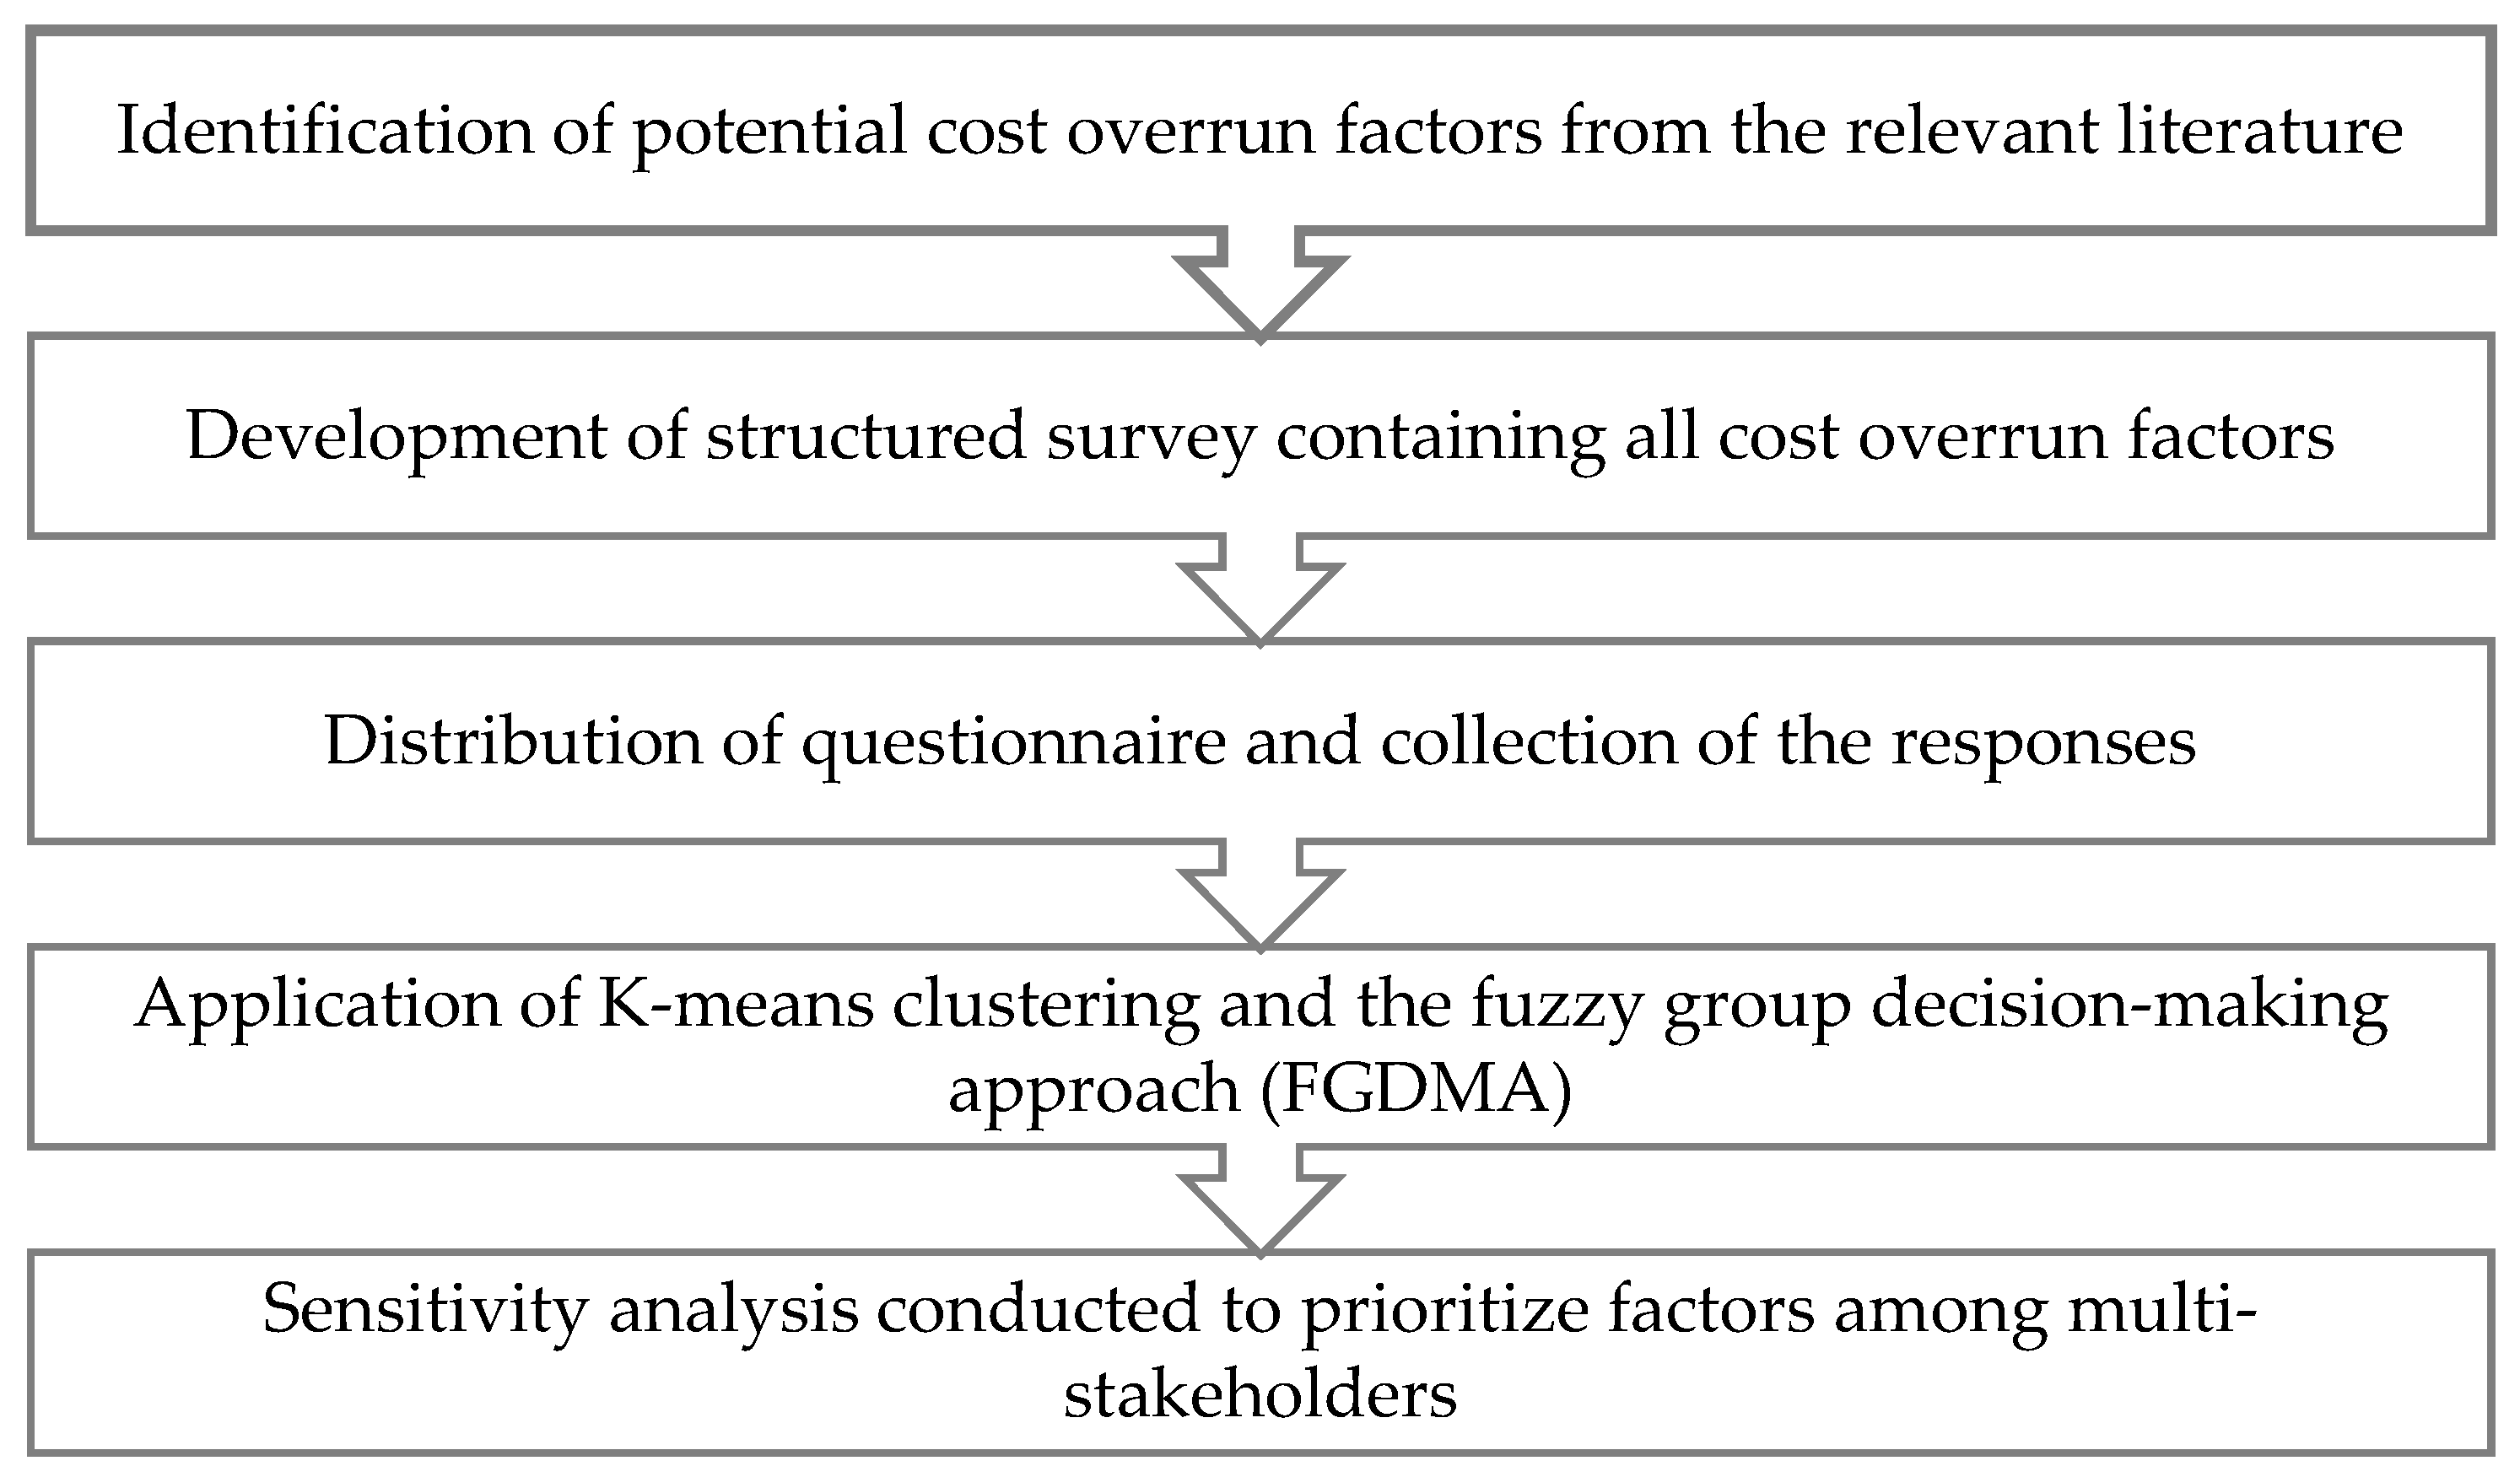
3. Research Methodology
4. Factor Identification
5. Questionnaire Design
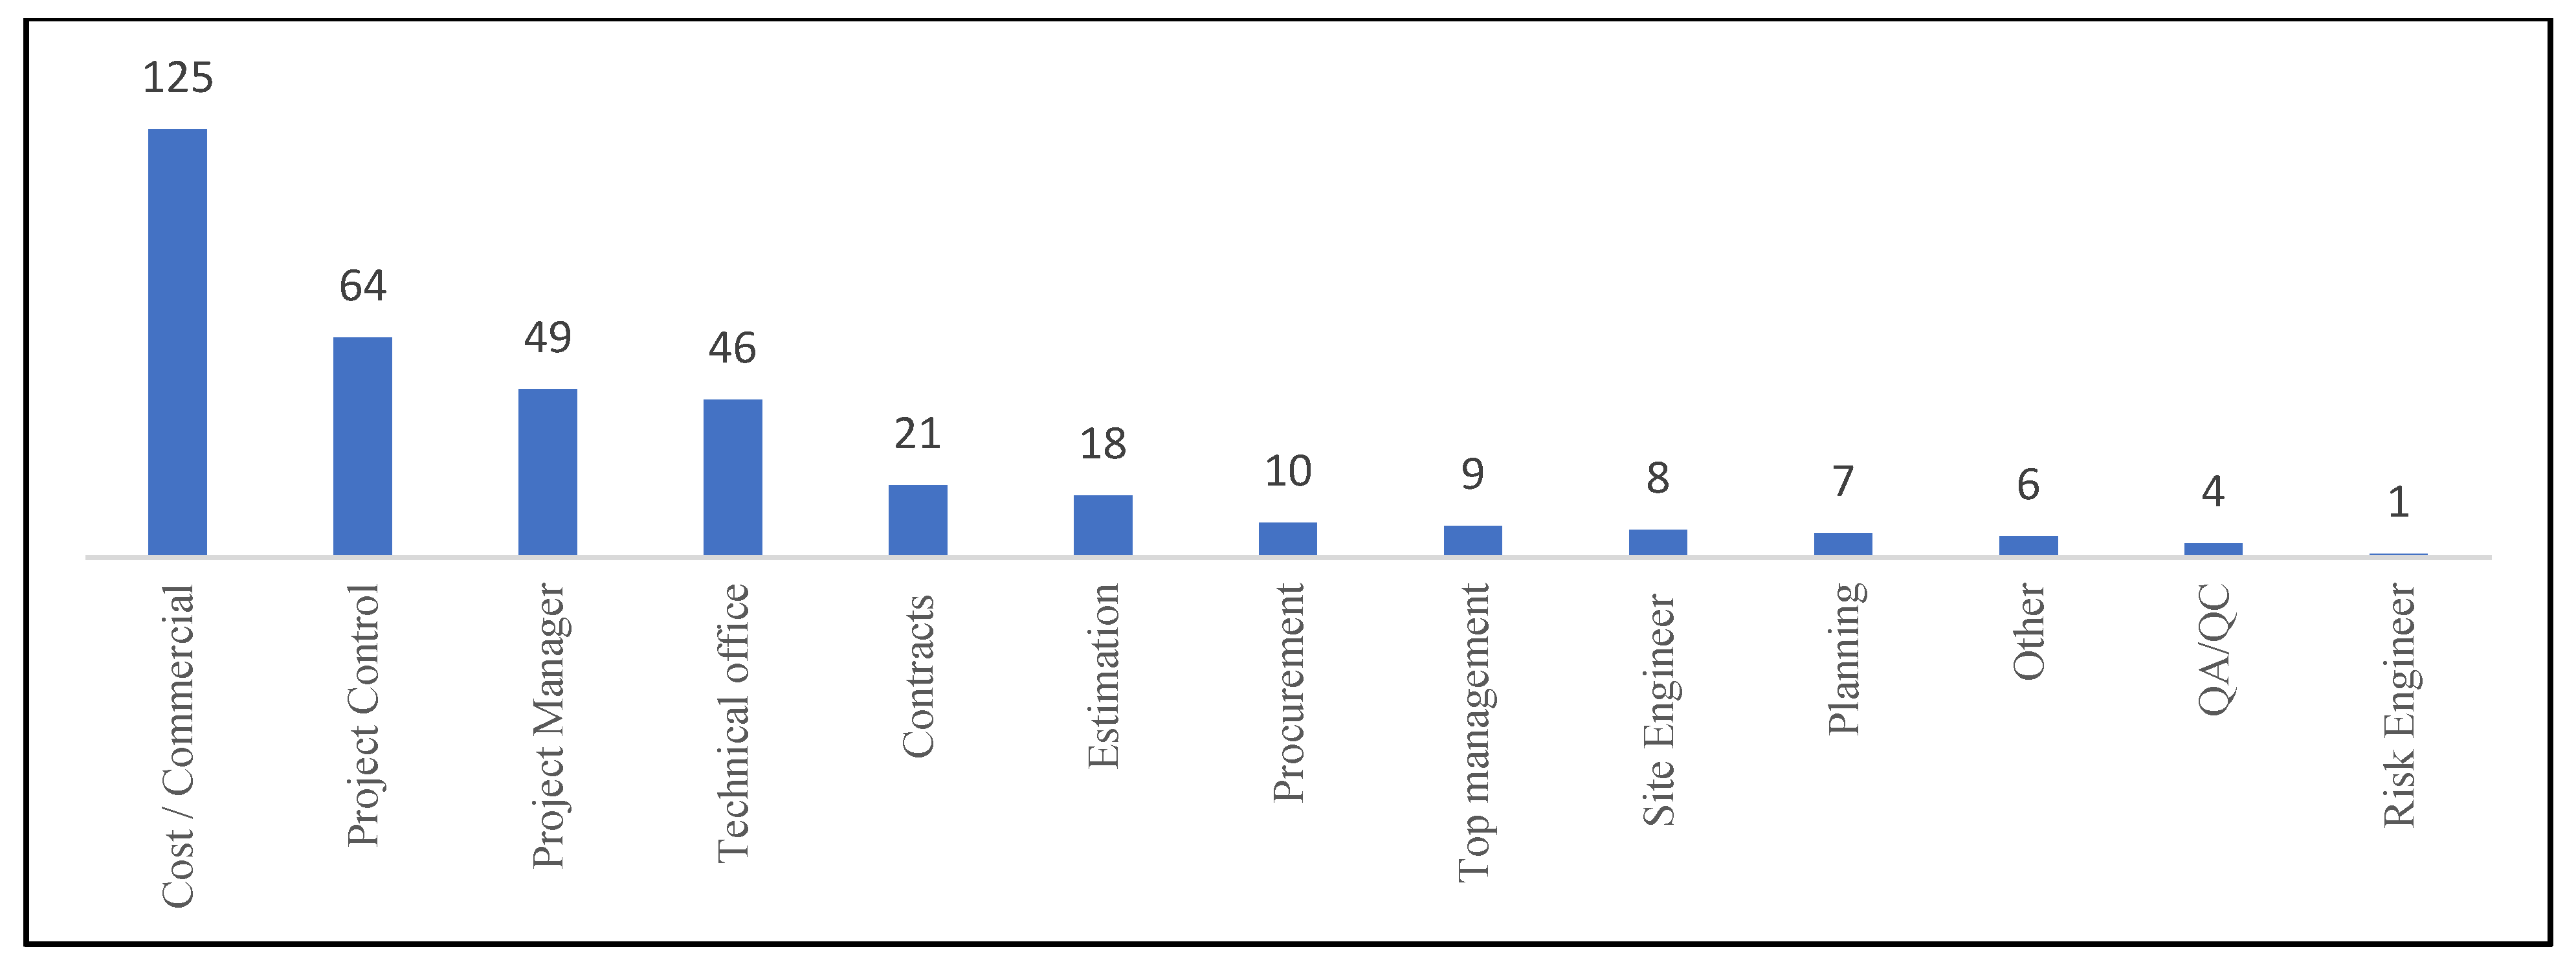
5.1. Section One: Demographic Information
5.2. Section Two: Survey Questions
6. Distribution and Collection of Questionnaire
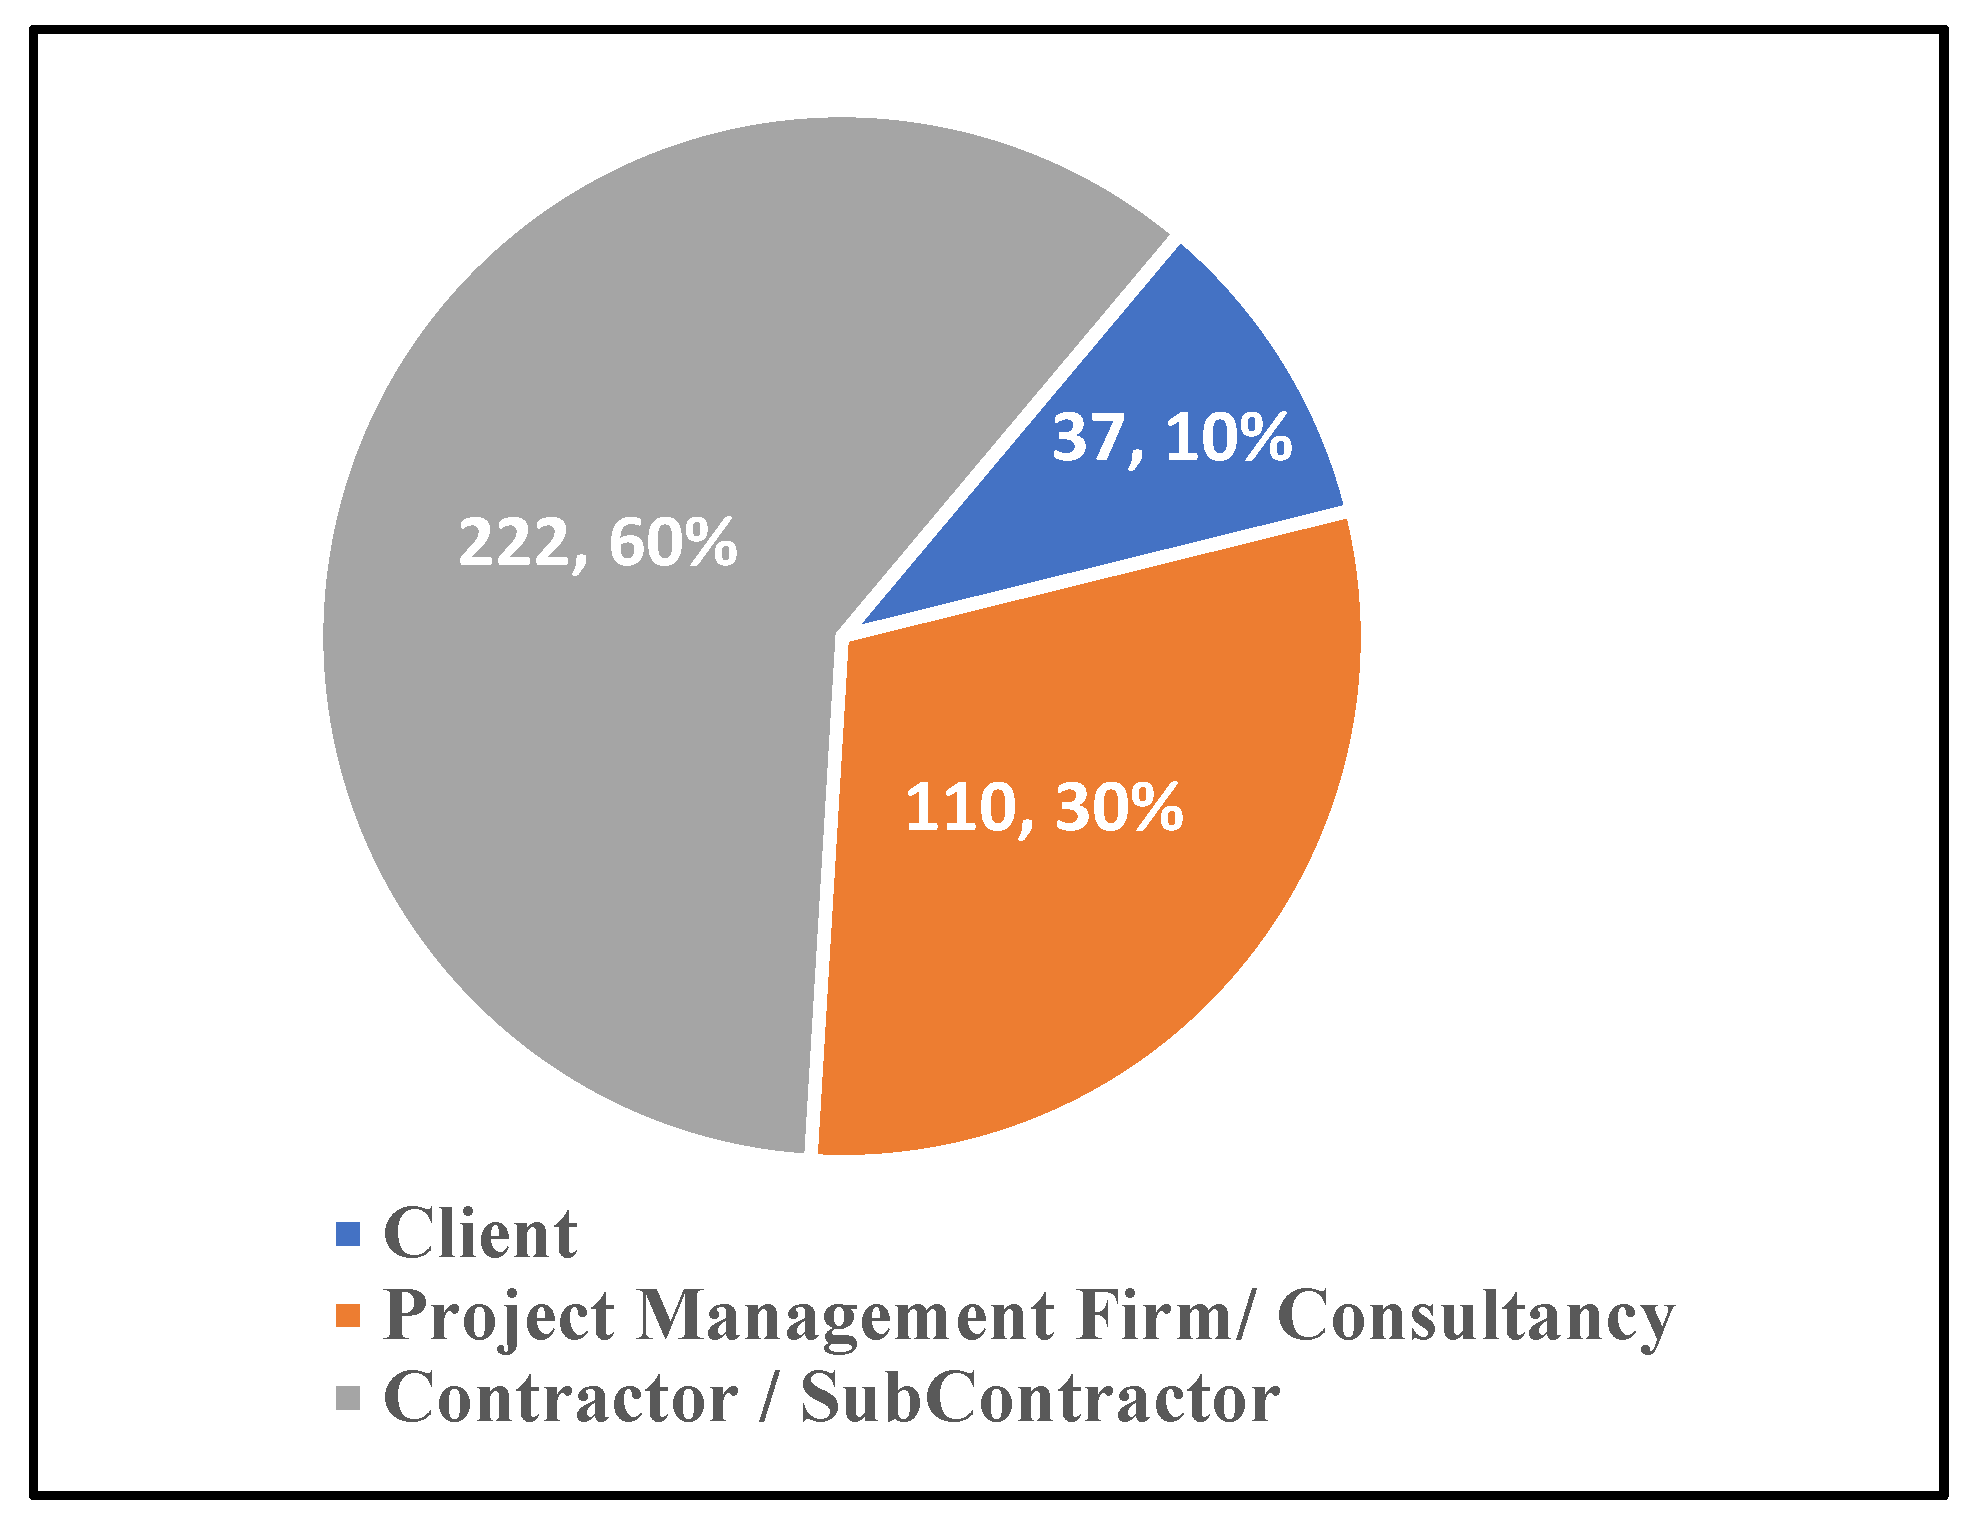
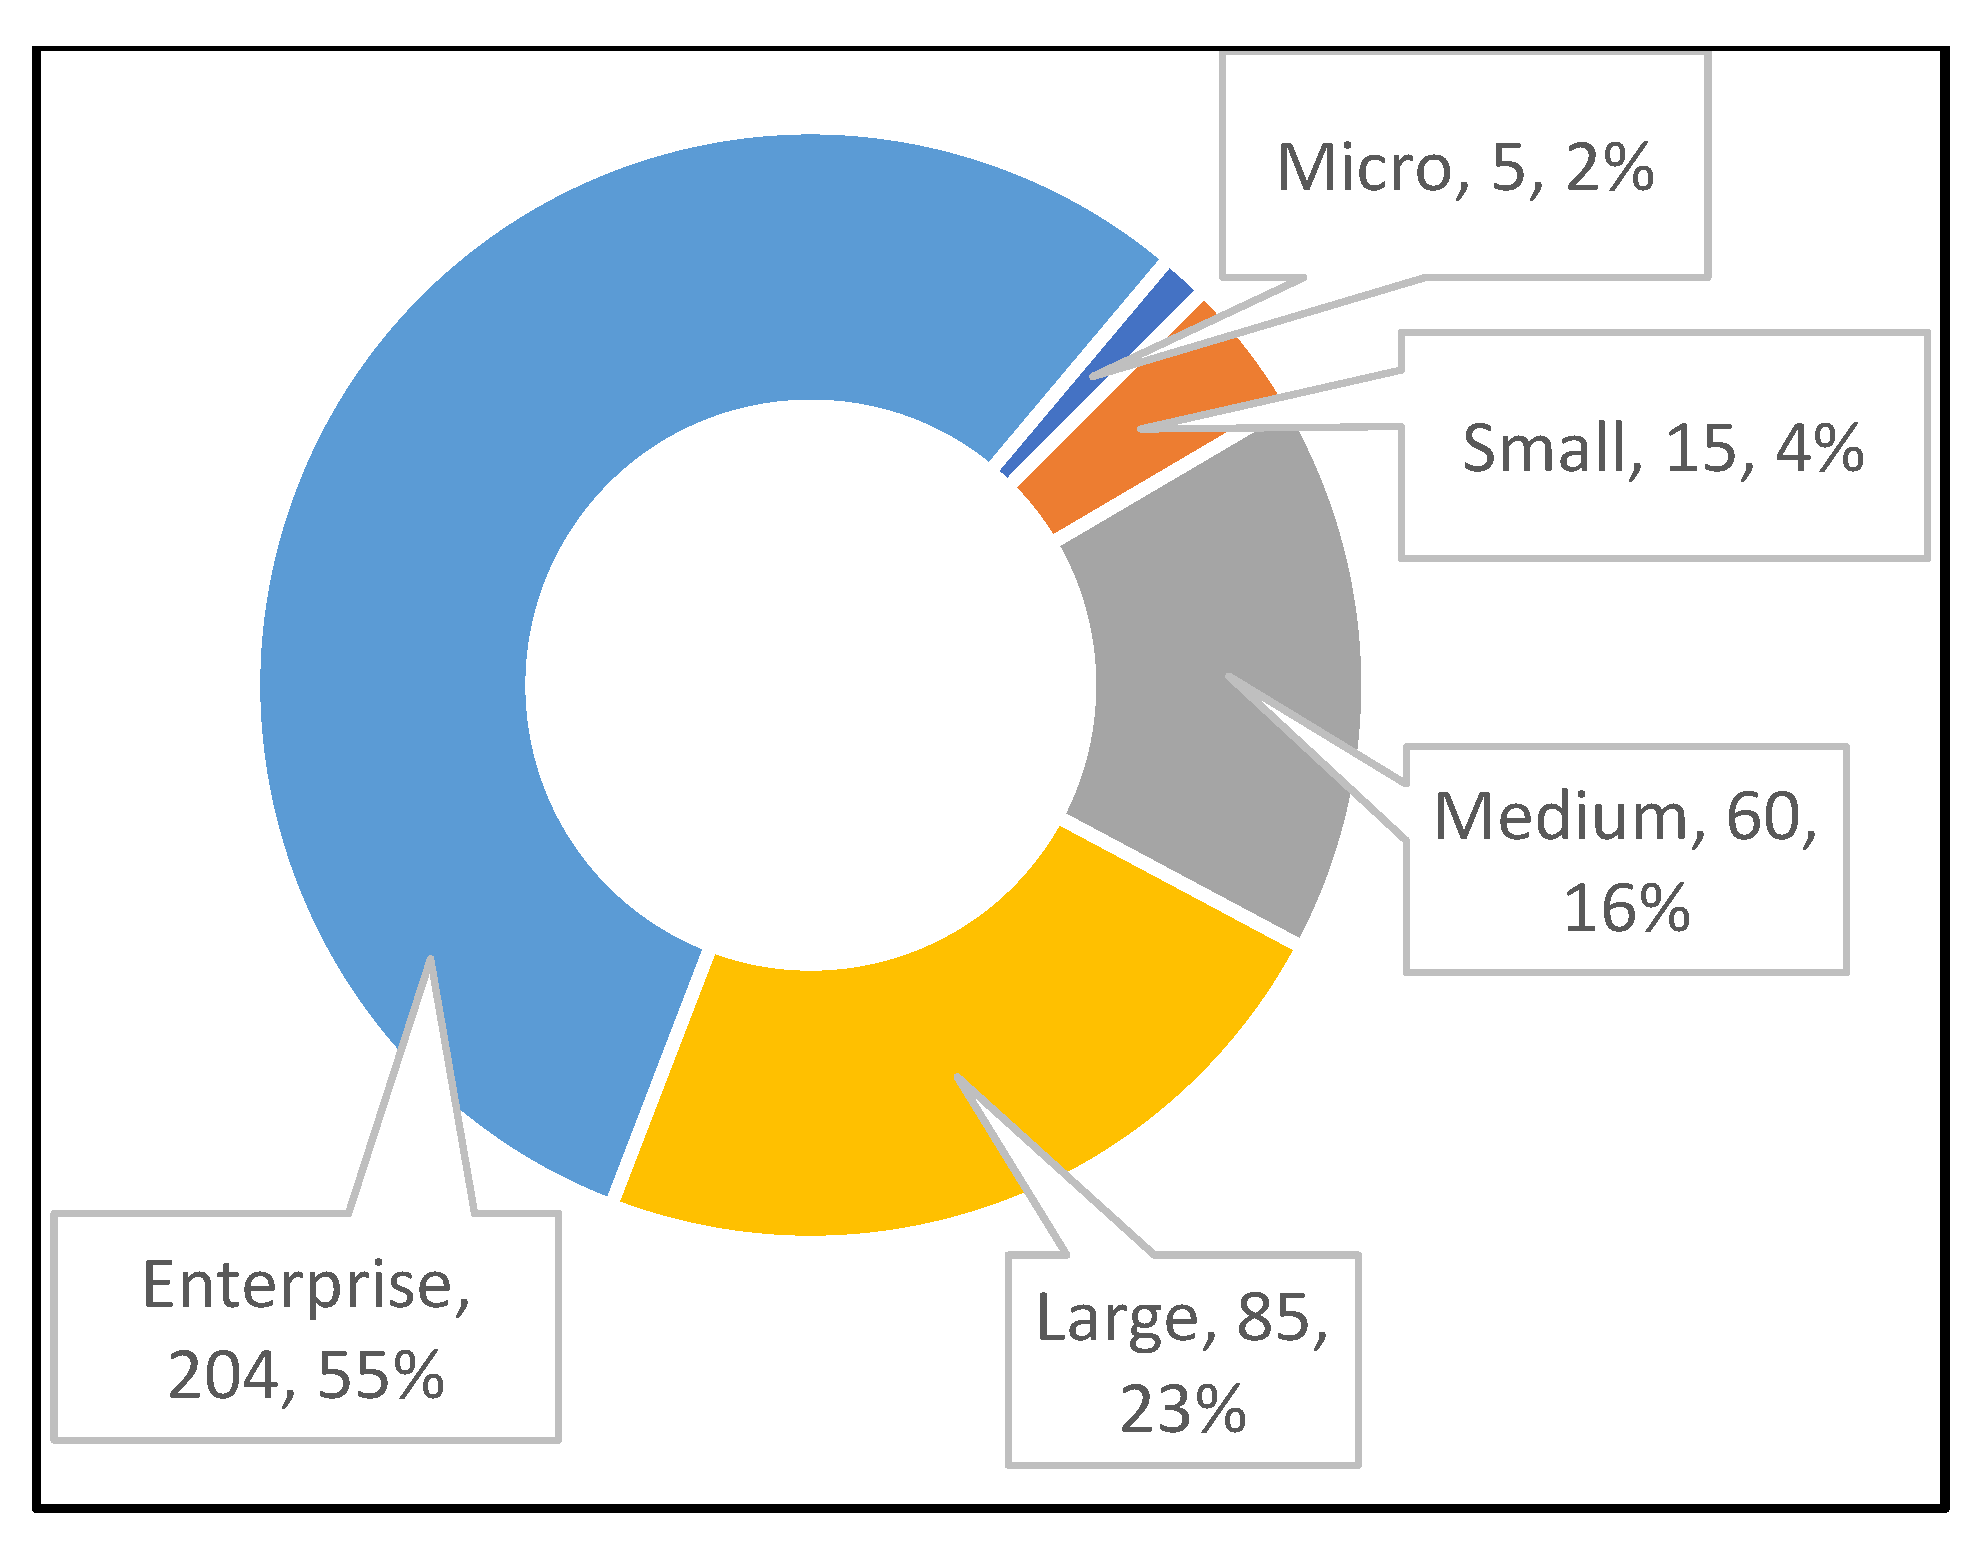
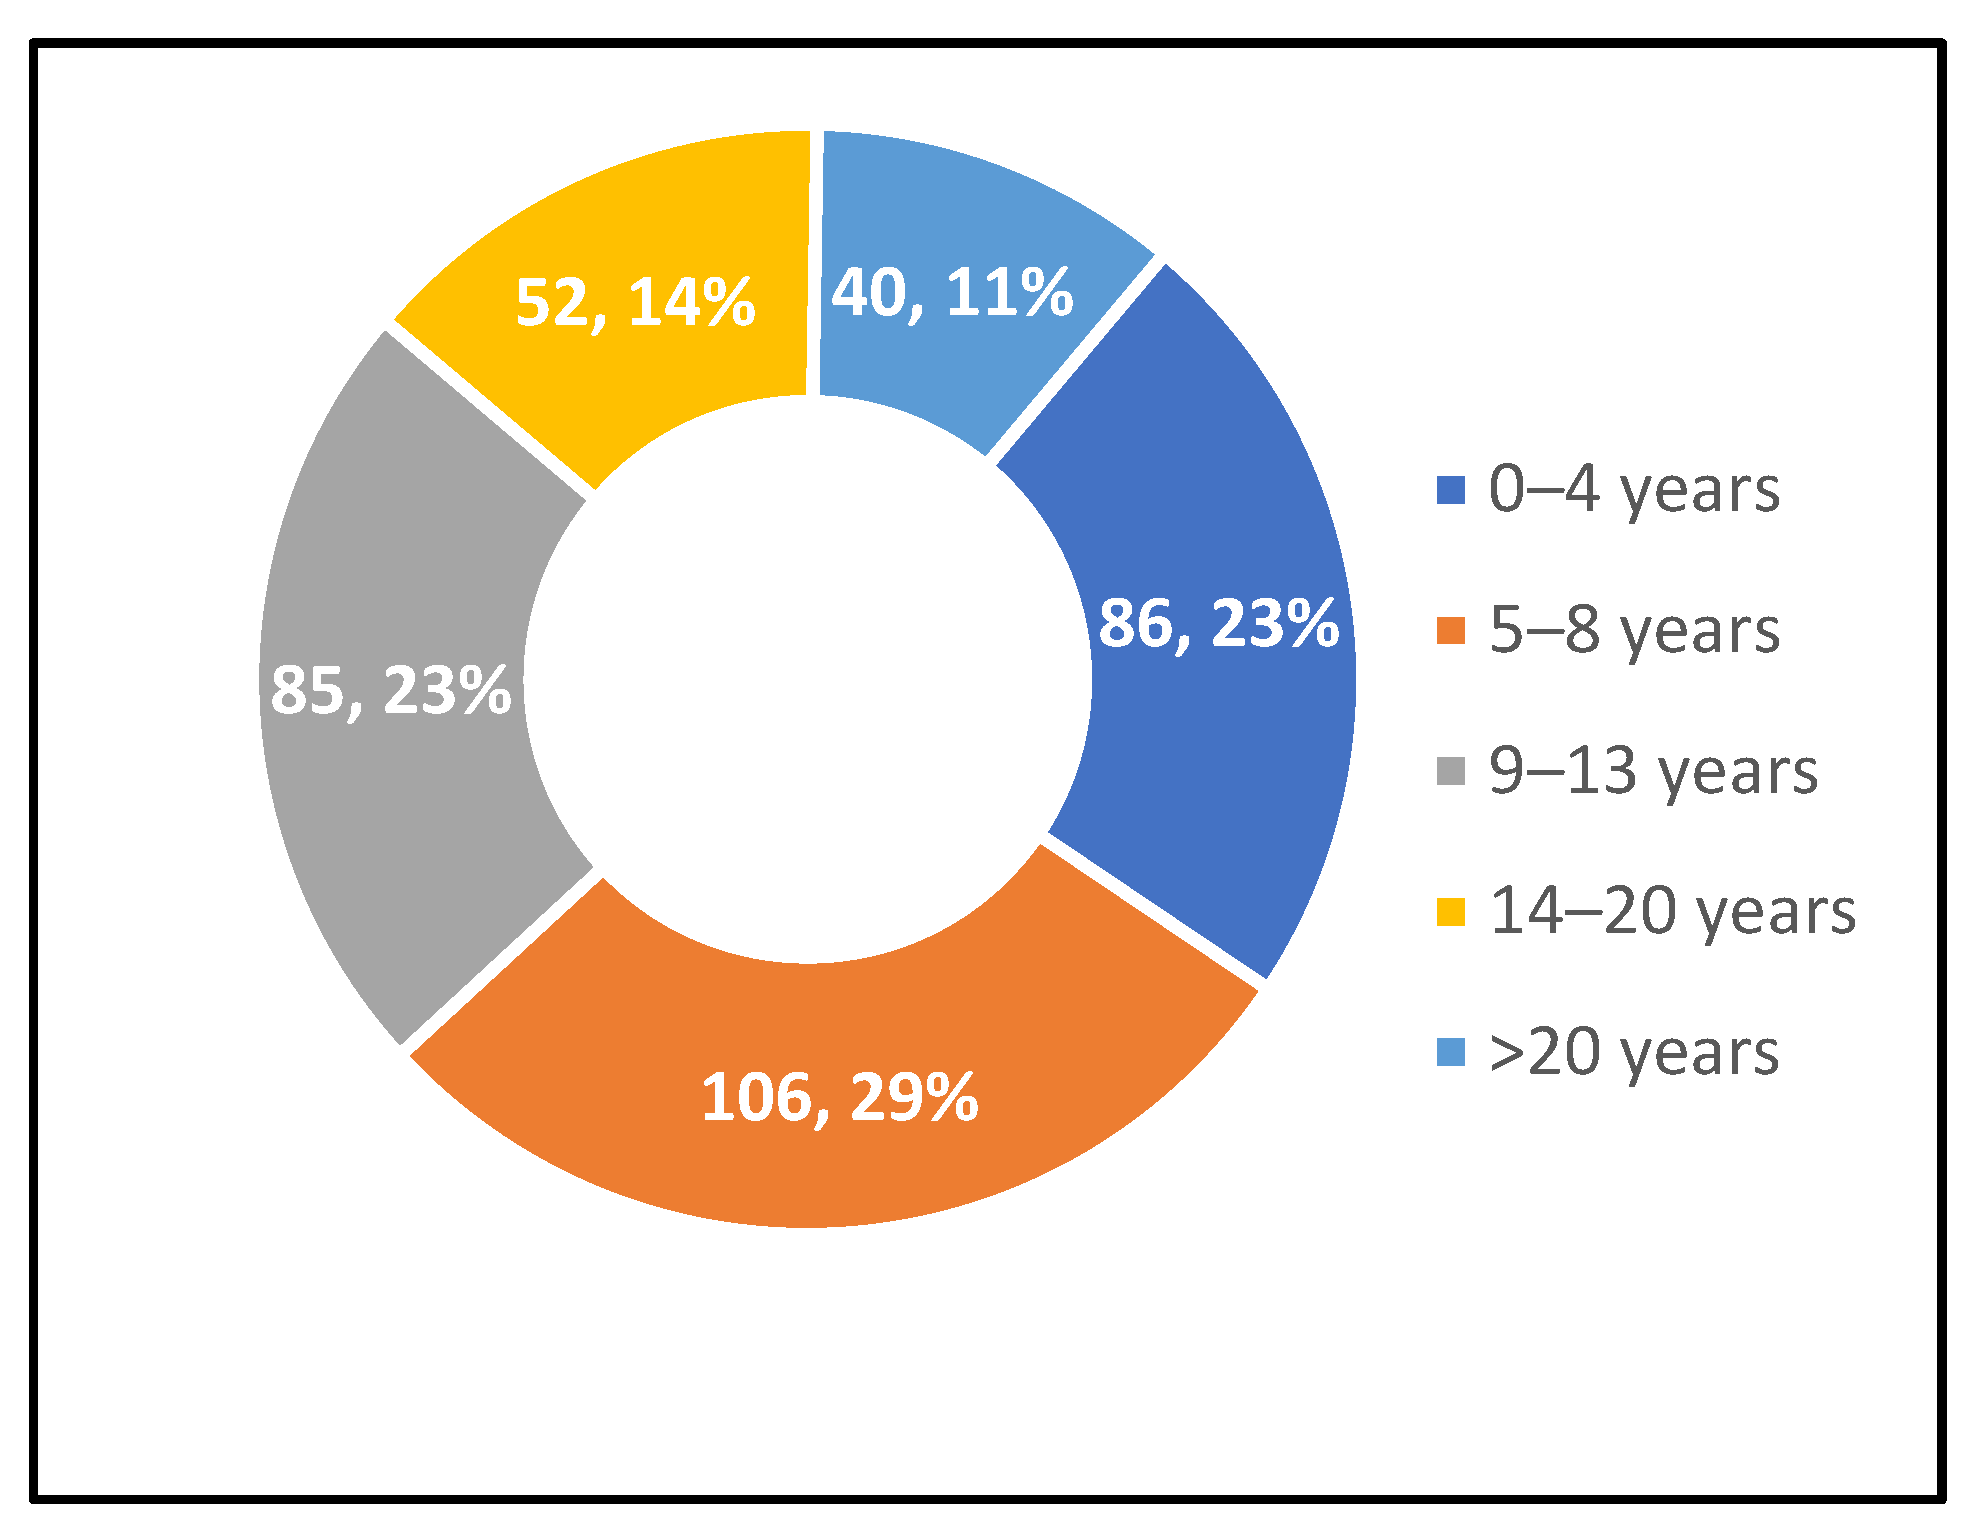
6.1. Questionnaire Distribution
6.2. Data Collected
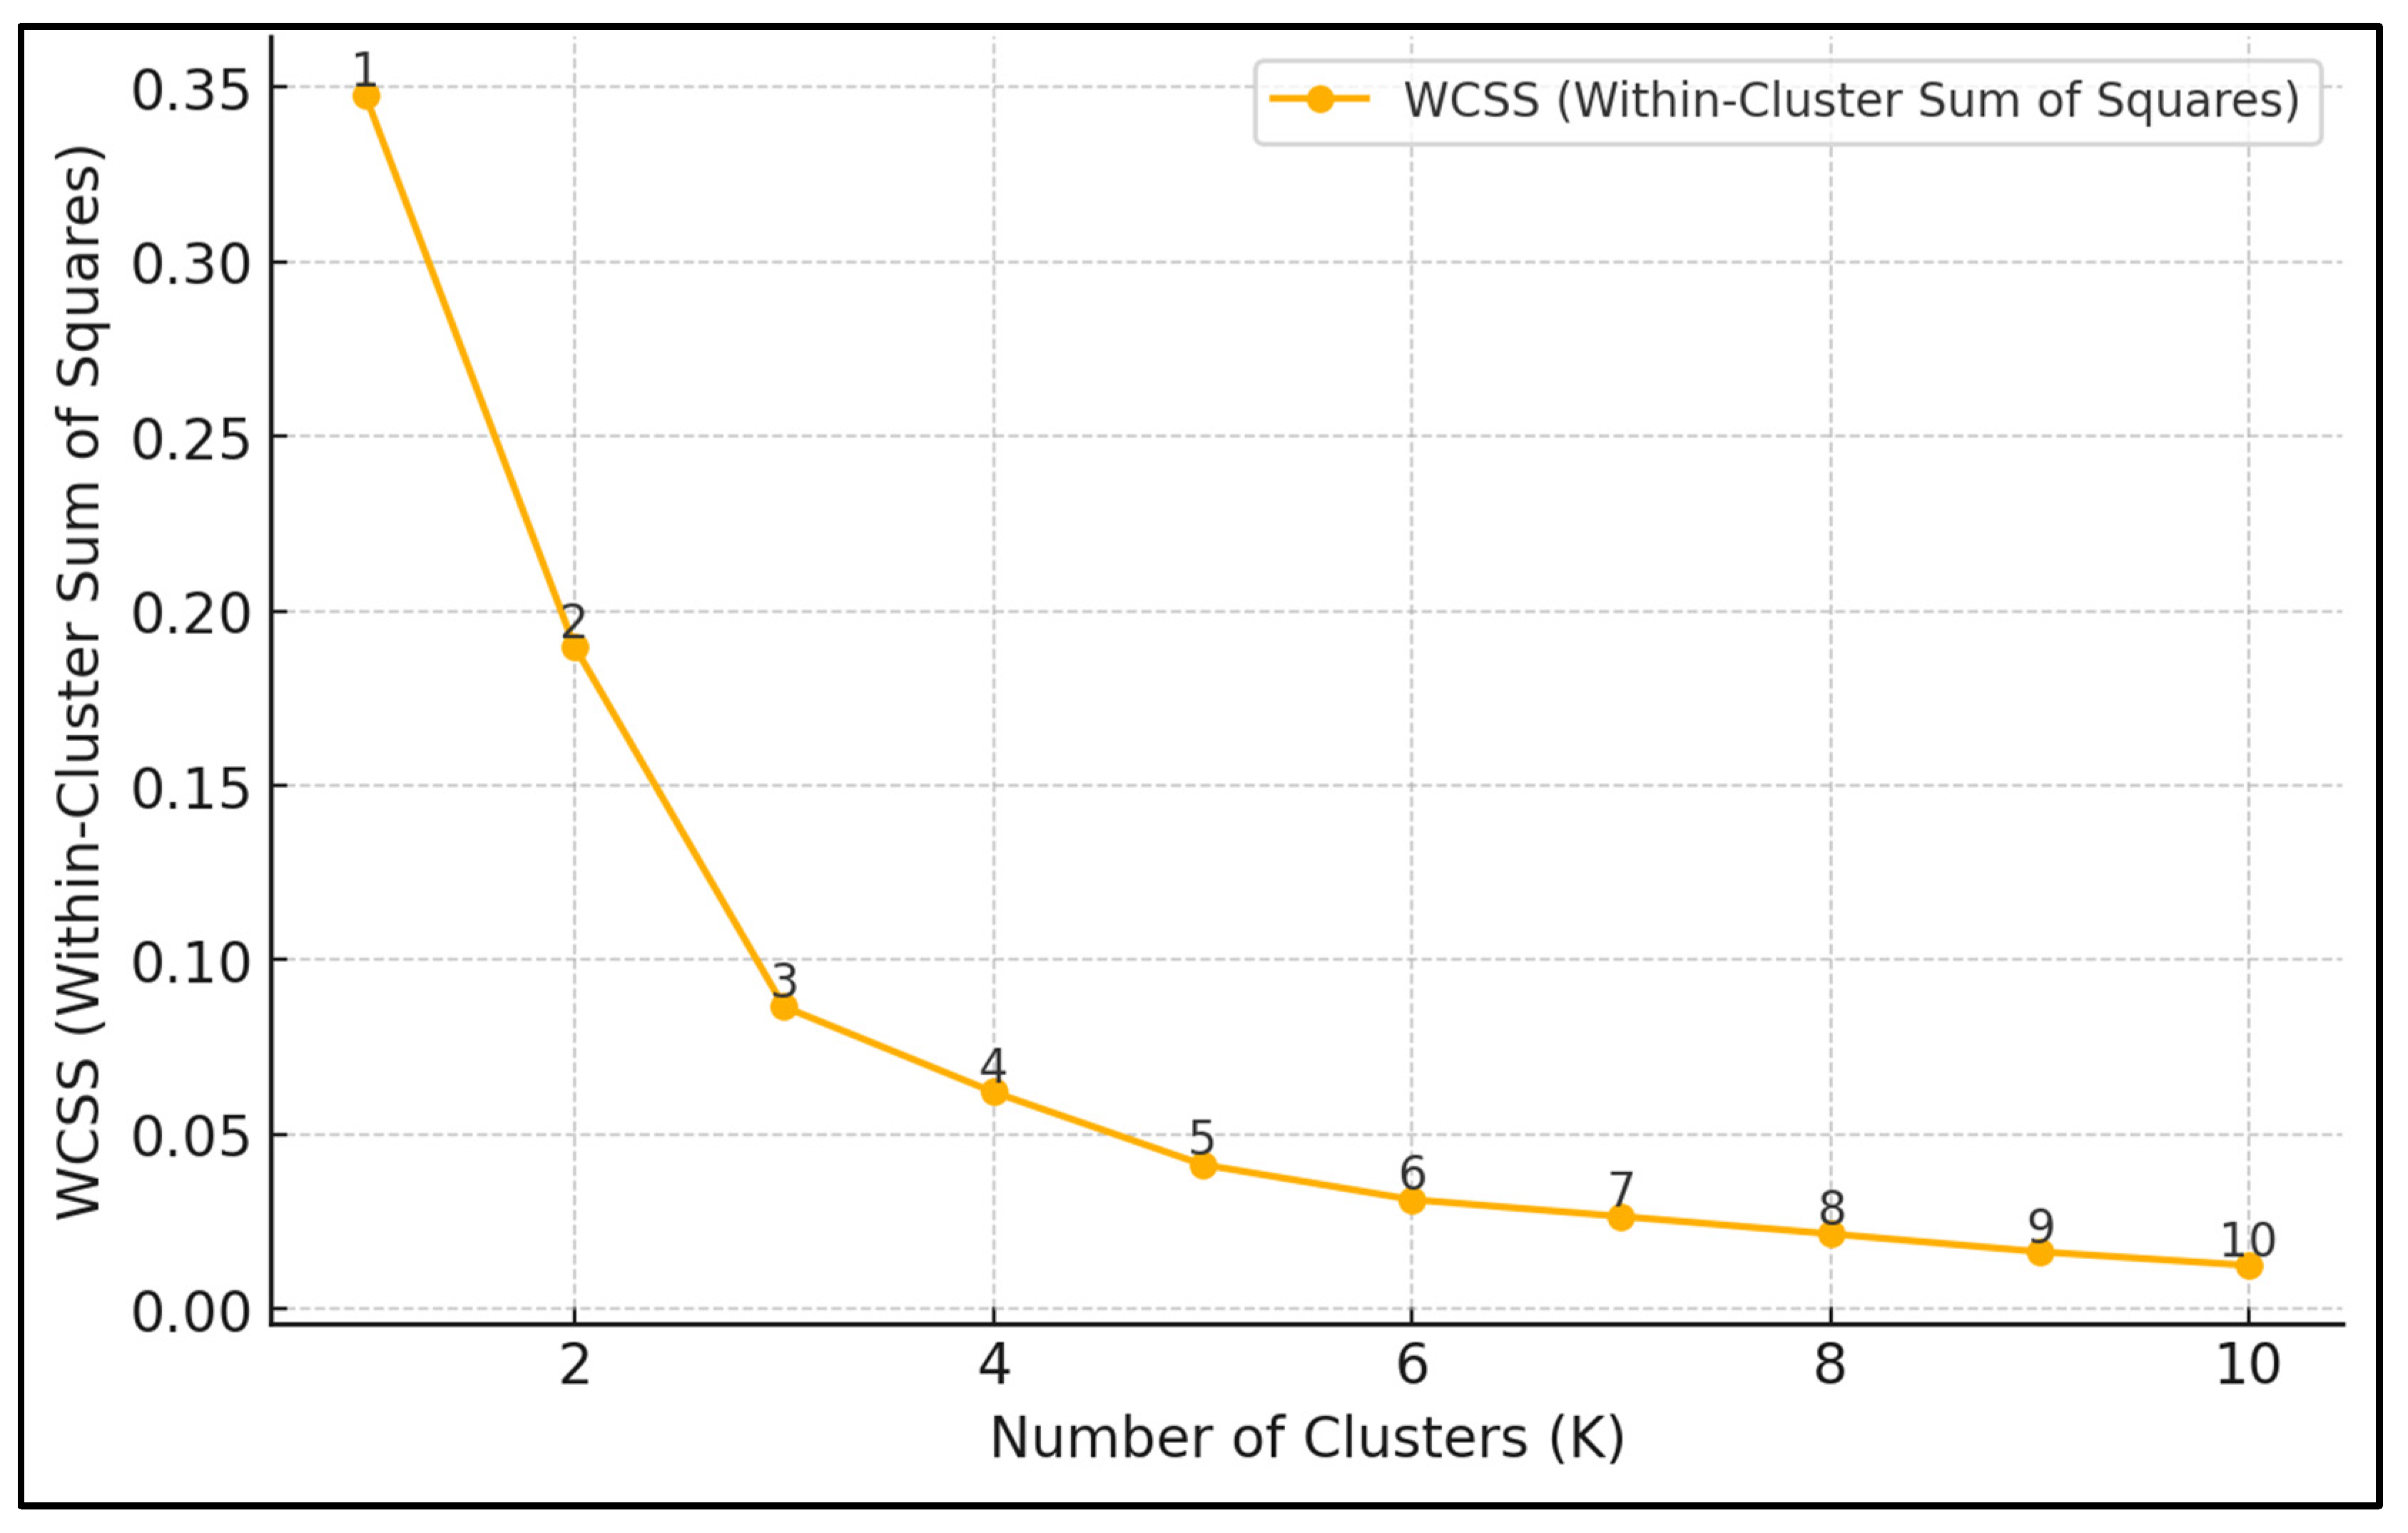
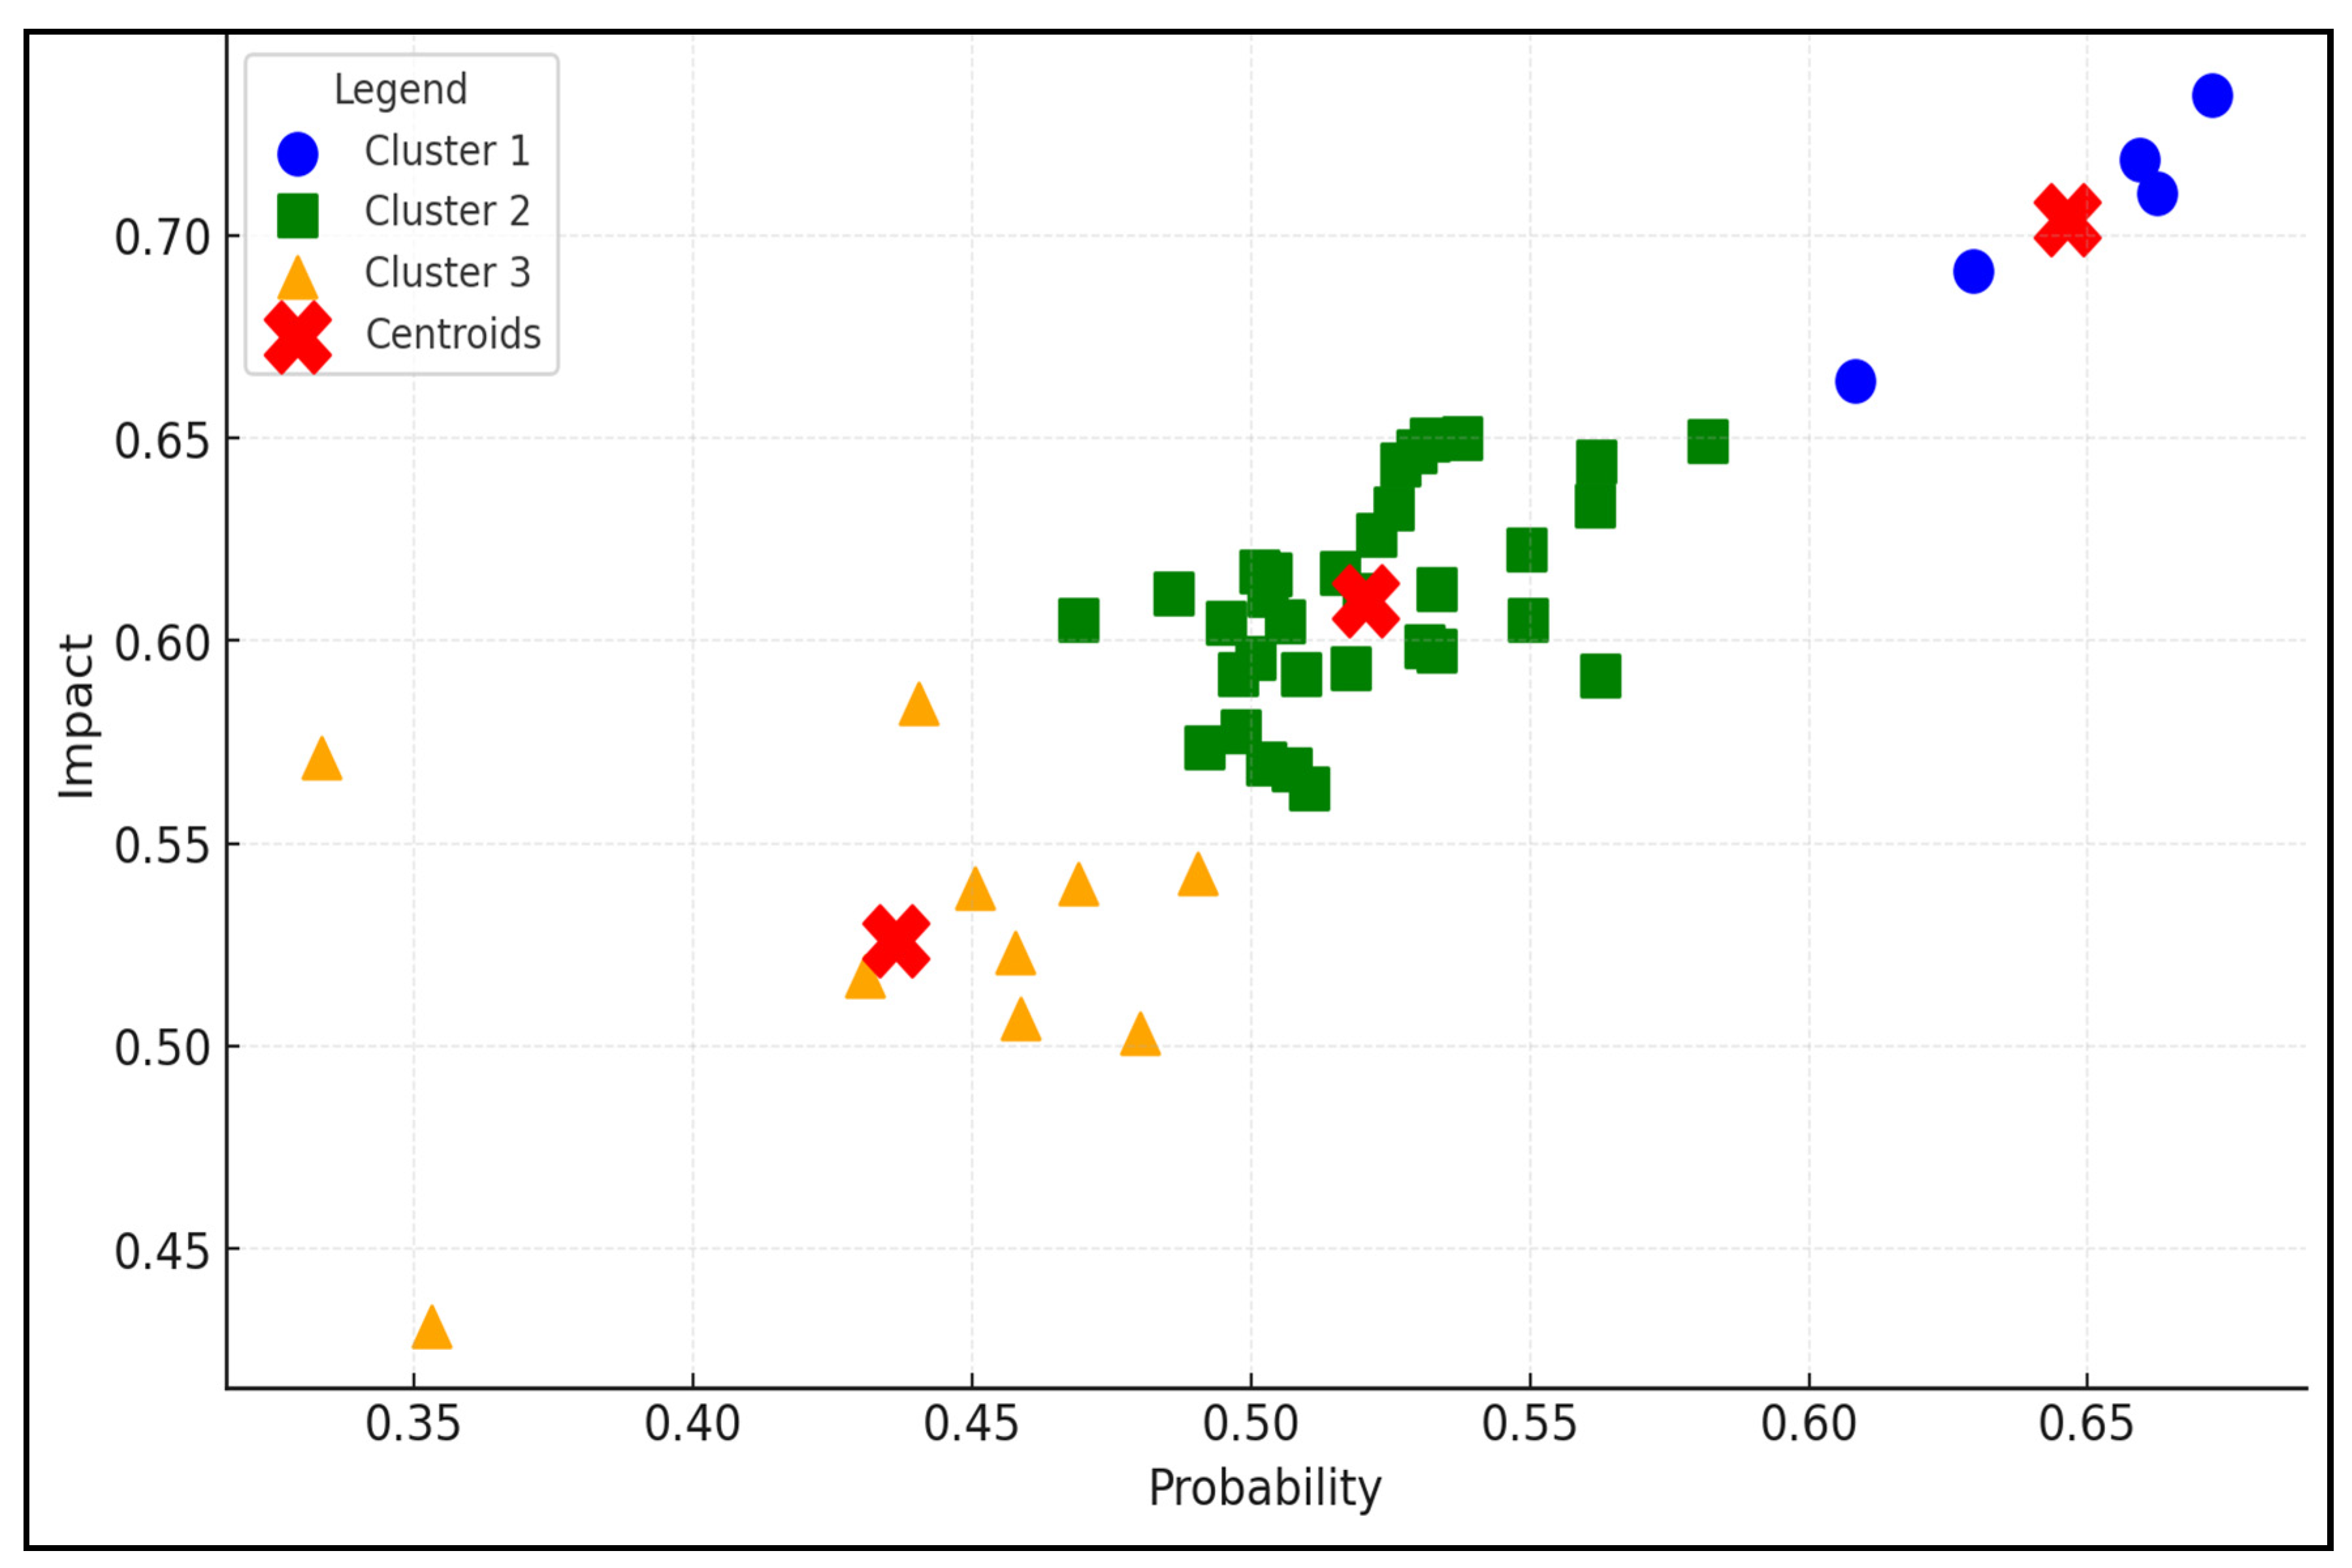
7. K-Means Clustering
8. Model Set and Analysis (Fuzzy Group Decision-Making Approach)
- 1.
- The fuzzy triangular number (FTN) for the associated linguistic term is extracted following the scenarios and descriptions shown in Table 3. Triangular fuzzy numbers, which provide a three-point estimate (e.g., 0.5, 0.7, and 0.9, which represents high severity) rather than an exact value. This three-point estimate for each factor allows the flexibility to carry out appropriate decision-making to manage cost-increase risks in the project.
- 2.
- Using the FTN, the following Equation (2) provides a fuzzy decision matrix (FDM) for risk probability (p) or impact (i) of cost overrun for each risk factor (f):where L = lower, M = medium, and U = upper values of a risk’s probability or impact cost, and n = means the number of participants evaluating the risks.
- 3.
- Participants’ skills and the validity of their assessments might differ for a variety of reasons in a given situation; thus, they must be weighted accordingly. This is a function of their participant position (PP), experience years (EY), and education level (EL) [49]. The weighted judgment of each participant is included in the evaluation of crucial criteria to improve decision reliability [37]. Aboshady, Elbarkouky et al. [50] calculate the weight of each participant ( as follows:where , , and = each participant’s weights for PP, EY, and EL, respectively. Then, to evaluate the participant’s weights, each criterion (i.e., , , and ) is assumed to be equal. The global weight of a participant () is calculated as follows [51]:According to Jung et al. [49], to meet the principle aggregated fuzzy score, the global weights of all participants must equal unity.
- 4.
- A weighted FDM (WFDM) for each factor (f) is transformed from the FDM by the following equation:
- 5.
- The fuzzy score () for each cost factor is the sum of each column of the Equation (5) matrix.
- 6.
- The fuzzy risk score, which is derived by likelihood and consequences on cost, can be calculated using the fuzzy synthetic evaluation approach [52] as follows:where and are fuzzy scores for probability and impact on cost for each factor, respectively. Despite traditional fuzzy if–then rules being typically utilized to draw conclusions about the significance of critical factors, they have been criticized for their incapacity to address subjective biases [36]; as a result, an alternate method proposed by Xu et al. [52] is employed.
- 7.
- The level of each factor (i.e., low to very high) is defined by the defuzzification, which is calculated as follows [53]:
9. Fuzzy Results
10. Sensitivity Analysis
11. Stakeholder Perspective Discussion
11.1. Contractor/Subcontractor vs. Owner Perspectives
11.2. Contractor/Subcontractor vs. Management Firm/Consultant Perspectives
11.3. Owner vs. Management Firm/Consultant Perspectives
12. Limitations and Future Directions
13. Conclusions
Supplementary Materials
Author Contributions
Funding
Data Availability Statement
Conflicts of Interest
Appendix A

References
- Mohamed, A.G.; Alqahtani, F.K.; Sherif, M.; El-Shamie, S.M. Scrutinizing the adoption of smart contracts in the MENA Region’s Construction Industry. J. Asian Archit. Build. Eng. 2024. [Google Scholar] [CrossRef]
- Ertuğrul, H.M.; Pirgaip, B. The nexus between construction investment and economic development: Evidence from MENA countries. Constr. Manag. Econ. 2021, 39, 932–947. [Google Scholar] [CrossRef]
- Cama, F.A.R.; Emara, N. Financial inclusion and gross capital formation: A sectoral analysis approach for the MENA region and EMs. Int. Rev. Financ. Anal. 2022, 79, 101993. [Google Scholar] [CrossRef]
- World Bank: Middle East and North Africa Economic Update—October 2024. Available online: https://www.worldbank.org/en/region/mena/publication/middle-east-and-north-africa-economic-update (accessed on 31 December 2024).
- Amini, S.; Rezvani, A.; Tabassi, M.; Malek Sadati, S.S. Causes of cost overruns in building construction projects in Asian countries; Iran as a case study. Eng. Constr. Archit. Manag. 2023, 30, 2739–2766. [Google Scholar] [CrossRef]
- Melaku Belay, S.; Tilahun, S.; Yehualaw, M.; Matos, J.; Sousa, H.; Workneh, E.T. Analysis of Cost Overrun and Schedule Delays of Infrastructure Projects in Low Income Economies: Case Studies in Ethiopia. Adv. Civ. Eng. 2021, 2021, 4991204. [Google Scholar] [CrossRef]
- Enrica, M.; Purba, H.; Purba, A. Risks Leading to Cost Overrun in Construction Projects: A Systematic Literature Review. Adv. Res. Civ. Eng. 2021, 3, 43–60. [Google Scholar] [CrossRef]
- Kamaruddeen, A.M.; Sung, C.F.; Wahi, W. A study on factors causing cost overrun of construction projects in Sarawak, Malaysia. Civ. Eng. Archit. 2020, 8, 191–199. [Google Scholar] [CrossRef]
- Islam, M.S.; Salem, M.; Tantawy, M.; Salah, M. Cost Overrun Risk Assessment for Healthcare Projects: A Modified Fuzzy Group Decision-Making Approach. J. Constr. Eng. Manag. 2024, 150, 04024168. [Google Scholar] [CrossRef]
- Arif, F.; Lodi, S.H.; Azhar, N. Factors influencing accuracy of construction project cost estimates in Pakistan: Perception and reality. Int. J. Constr. Manag. 2015, 15, 59–70. [Google Scholar] [CrossRef]
- Abdelalim, A.M.; Essawy, A.; Alnaser, A.A.; Shibeika, A.; Sherif, A. Digital Trio: Integration of BIM–EIR–IoT for Facilities Management of Mega Construction Projects. Sustainability 2024, 16, 6348. [Google Scholar] [CrossRef]
- Abdel-Monem, M.; Alshaer, K.T.; El-Dash, K. Assessing Risk Factors Affecting the Accuracy of Conceptual Cost Estimation in the Middle East. Buildings 2022, 12, 950. [Google Scholar] [CrossRef]
- PMBOK Guide|Project Management Institute. Available online: https://www.pmi.org/standards/pmbok (accessed on 31 December 2024).
- Abdelalim, A.M.; Abdel, M.; Hassanen, H. Risk Identification and Assessment of Mega Industrial Projects in Egypt. Int. J. Manag. Commer. Innov. 2022, 10, 187–199. [Google Scholar] [CrossRef]
- Abd El-Karim, M.S.B.A.; Mosa El Nawawy, O.A.; Abdel-Alim, A.M. Identification and assessment of risk factors affecting construction projects. HBRC J. 2017, 13, 202–216. [Google Scholar] [CrossRef]
- Sepasgozar, S.M.E.; Costin, A.M.; Karimi, R.; Shirowzhan, S.; Abbasian, E.; Li, J. BIM and Digital Tools for State-of-the-Art Construction Cost Management. Buildings 2022, 12, 396. [Google Scholar] [CrossRef]
- Abdelalim, A.M.; Abdel, M.; Hassanen, H. A Proposed Approach for a Balanced Construction Contract for Mega Industrial Projects in Egypt. Int. J. Manag. Commer. Innov. 2022, 10, 217–229. [Google Scholar] [CrossRef]
- Ashtari, M.A.; Ansari, R.; Hassannayebi, E.; Jeong, J. Cost Overrun Risk Assessment and Prediction in Construction Projects: A Bayesian Network Classifier Approach. Buildings 2022, 12, 1660. [Google Scholar] [CrossRef]
- Xie, W.; Deng, B.; Yin, Y.; Lv, X.; Deng, Z. Critical Factors Influencing Cost Overrun in Construction Projects: A Fuzzy Synthetic Evaluation. Buildings 2022, 12, 11. [Google Scholar] [CrossRef]
- Chadee, A.A.; Chadee, X.T.; Ray, I.; Mwasha, A.; Martin, H.H. When Parallel Schools of Thought Fail to Converge: The Case of Cost Overruns in Project Management. Buildings 2021, 11, 321. [Google Scholar] [CrossRef]
- Abdelalim, A.M.; Al-Sabah, R.; Salem, M.; Said, S.O.; Tantawy, M.; Ezz Al-Regal, M.R. Variations and Claims in International Construction Projects in the MENA Region from the Last Decade. Buildings 2024, 14, 2496. [Google Scholar] [CrossRef]
- Alsuliman, J.A. Causes of delay in Saudi public construction projects. Alex. Eng. J. 2019, 58, 801–808. [Google Scholar] [CrossRef]
- Bekr, G. Causes of Delay in Public Construction Project in Iraq. Jordon J. Civil. Eng. 2024, 9, 149–162. Available online: https://platform.almanhal.com/Files/Articles/83746 (accessed on 8 November 2024).
- Al-Hazim, N.; Salem, Z.A.; Ahmad, H. Delay and Cost Overrun in Infrastructure Projects in Jordan. Procedia Eng. 2017, 182, 18–24. [Google Scholar] [CrossRef]
- Koushki, P.A.; Al-Rashid, K.; Kartam, N. Delays and cost increases in the construction of private residential projects in Kuwait. Constr. Manag. Econ. 2005, 23, 285–294. [Google Scholar] [CrossRef]
- Daoud, A.O.; El Hefnawy, M.; Wefki, H. Investigation of critical factors affecting cost overruns and delays in Egyptian mega construction projects. Alex. Eng. J. 2023, 83, 326–334. [Google Scholar] [CrossRef]
- Yousri, E.; Sayed, A.E.B.; Farag, M.; Abdelalim, A.M. Risk Identification of Building Construction Projects in Egypt. Buildings 2023, 13, 1084. [Google Scholar] [CrossRef]
- Khedr, R.; Abdelalim, A.M. The Impact of Strategic Management on Project’s Performance of Construction Firms in Egypt. Int. J. Manag. Commer. Innov. 2021, 9, 202–211. Available online: www.researchpublish.com (accessed on 10 October 2024).
- Khedr, R.; Abdelalim, A.M. Predictors for the Success and Survival of Construction Firms in Egypt. Int. J. Manag. Commer. Innov. 2021, 9, 192–201. [Google Scholar]
- Abd Al-Wahab, S.; Abdelalim, A.M.; Abd El-Hamid, M. Construction Contracts’ Pricing According to Contractual Provisions and Risk Allocation. Int. J. Civ. Struct. Eng. Res. 2023, 11, 8–31. [Google Scholar] [CrossRef]
- Carr, V.; Tah, J.H.M. A fuzzy approach to construction project risk assessment and analysis: Construction project risk management system. Adv. Eng. Softw. 2001, 32, 847–857. [Google Scholar] [CrossRef]
- Islam, M.S.; Nepal, M.P.; Skitmore, M.; Attarzadeh, M. Current research trends and application areas of fuzzy and hybrid methods to the risk assessment of construction projects. Adv. Eng. Inform. 2017, 33, 112–131. [Google Scholar] [CrossRef]
- Fayek, A.R. Fuzzy Logic and Fuzzy Hybrid Techniques for Construction Engineering and Management. J. Constr. Eng. Manag. 2020, 146, 04020064. [Google Scholar] [CrossRef]
- Ebrahimnejad, S.; Mousavi, S.M.; Tavakkoli-Moghaddam, R.; Hashemi, H.; Vahdani, B. A novel two-phase group decision making approach for construction project selection in a fuzzy environment. Appl. Math. Model. 2012, 36, 4197–4217. [Google Scholar] [CrossRef]
- Velasquez, M.; Hester, P.T. An Analysis of Multi-Criteria Decision Making Methods. Int. J. Oper. Res. 2013, 10, 56–66. [Google Scholar]
- Novák, V. Reasoning about mathematical fuzzy logic and its future. Fuzzy Sets Syst. 2012, 192, 25–44. [Google Scholar] [CrossRef]
- Kabir, G.; Sadiq, R.; Tesfamariam, S. A fuzzy Bayesian belief network for safety assessment of oil and gas pipelines. Struct. Infrastruct. Eng. 2016, 12, 874–889. [Google Scholar] [CrossRef]
- Taroun, A. Towards a better modelling and assessment of construction risk: Insights from a literature review. Int. J. Proj. Manag. 2014, 32, 101–115. [Google Scholar] [CrossRef]
- Abdelalim, A.M.; Salem, M.; Salem, M.; Al-Adwani, M.; Tantawy, M. An Analysis of Factors Contributing to Cost Overruns in the Global Construction Industry. Buildings 2025, 15, 18. [Google Scholar] [CrossRef]
- Karthick, S.; Kermanshachi, S.; Loganathan, K. Impact of Construction Workers’ Physical Health and Respiratory Issues in Hot Weather: A Pilot Study. In Proceedings of the Tran-SET 2022-Proceedings of the Tran-SET Conference 2022, San Antonio, TX, USA, 31 August–2 September 2022; pp. 135–145. [Google Scholar] [CrossRef]
- Li, Y.; Wang, X. Risk assessment for public–private partnership projects: Using a fuzzy analytic hierarchical process method and expert opinion in China. J. Risk Res. 2018, 21, 952–973. [Google Scholar] [CrossRef]
- Ostrovsky, R.; Rabani, Y.; Schulman, L.J.; Swamy, C. The effectiveness of lloyd-type methods for the k-means problem. J. ACM 2013, 59, 1–22. [Google Scholar] [CrossRef]
- Pai, S.G.S.; Sanayei, M.; Smith, I.F.C. Model-Class Selection Using Clustering and Classification for Structural Identification and Prediction. J. Comput. Civ. Eng. 2020, 35, 04020051. [Google Scholar] [CrossRef]
- Yuan, C.; Yang, H. Research on K-Value Selection Method of K-Means Clustering Algorithm. J. 2019, 2, 226–235. [Google Scholar] [CrossRef]
- Medhat, W.; Abdelkhalek, H.; Abdelalim, A.M. A Comparative Study of the International Construction Contract (FIDIC Red Book 1999) and the Domestic Contract in Egypt (the Administrative Law 182 for the year 2018). Int. J. Manag. Commer. Innov. 2023, 11, 10–23. [Google Scholar] [CrossRef]
- Islam, M.S.; Nepal, M.P.; Skitmore, M. Modified Fuzzy Group Decision-Making Approach to Cost Overrun Risk Assessment of Power Plant Projects. J. Constr. Eng. Manag. 2019, 145, 04018126. [Google Scholar] [CrossRef]
- Wang, Y.M.; Elhag, T.M.S. A fuzzy group decision making approach for bridge risk assessment. Comput. Ind. Eng. 2007, 53, 137–148. [Google Scholar] [CrossRef]
- Boran, F.E.; Genç, S.; Kurt, M.; Akay, D. A multi-criteria intuitionistic fuzzy group decision making for supplier selection with TOPSIS method. Expert. Syst. Appl. 2009, 36, 11363–11368. [Google Scholar] [CrossRef]
- Jung, J.H.; Kim, D.Y.; Lee, H.K. The computer-based contingency estimation through analysis cost overrun risk of public construction project. KSCE J. Civ. Eng. 2016, 20, 1119–1130. [Google Scholar] [CrossRef]
- Aboshady, A.M.; Elbarkouky, M.M.G.; Marzouk, M.M. A fuzzy risk management framework for the egyptian real estate development projects. In AEI 2013: Building Solutions for Architectural Engineering—Proceedings of the 2013 Architectural Engineering National Conference; ASCE: Hong Kong, China, 2013; pp. 343–352. [Google Scholar] [CrossRef]
- Ameyaw, E.E.; Chan, A.P.C.; Owusu-Manu, D.G.; Coleman, E. A fuzzy model for evaluating risk impacts on variability between contract sum and final account in government-funded construction projects. J. Facil. Manag. 2015, 13, 45–69. [Google Scholar] [CrossRef]
- Xu, Y.; Yeung, J.F.Y.; Chan, A.P.C.; Chan, D.W.M.; Wang, S.Q.; Ke, Y. Developing a risk assessment model for PPP projects in China—A fuzzy synthetic evaluation approach. Autom. Constr. 2010, 19, 929–943. [Google Scholar] [CrossRef]
- Abdelgawad, M.; Fayek, A.R. Risk Management in the Construction Industry Using Combined Fuzzy FMEA and Fuzzy AHP. J. Constr. Eng. Manag. 2010, 136, 1028–1036. [Google Scholar] [CrossRef]


| Code | Factor | Code | Factor |
|---|---|---|---|
| F01 | Define the Scope | F25 | Delayed Decision-Making by Owners |
| F02 | Frequent Changes in Design | F26 | Political Interference |
| F03 | Increase in Additional Work Orders | F27 | Contractual Claims and Disputes |
| F04 | Project Specifications and Feasibility | F28 | Bureaucratic and Unethical Behavior |
| F05 | Labor Availability and Skills | F29 | Lack of Communication between Parties |
| F06 | Labor Productivity | F30 | Lack of Coordination and Cooperation |
| F07 | Contractor Experience | F31 | Delay in Materials |
| F08 | Subcontractor Experience and Performance | F32 | Planning and Scheduling Issues |
| F09 | Poor Site Management Supervision | F33 | Cost of Labor |
| F10 | Availability of Materials | F34 | Cost of Equipment |
| F11 | Equipment Suitability and Availability | F35 | Market and Supply Conditions |
| F12 | Resource Planning and Allocation | F36 | Delays in the Design Stage |
| F13 | Contractual Ambiguity and Contradiction | F37 | Economic Challenges |
| F14 | Bidding and Tendering Difficulties | F38 | Currency Issues |
| F15 | Cost of Materials | F39 | Market Fluctuations |
| F16 | Inflation | F40 | Owner Interference |
| F17 | Financial Impediments by Owner | F41 | Force Majeure |
| F18 | Delayed Payments by Owner for Contractors | F42 | Unclear or Changes in Specification |
| F19 | Financial Issues by Contractor | F43 | Mistakes/Deficiency in BOQ |
| F20 | Bad Execution Problems | F44 | Cash Flow During Construction |
| F21 | Unforeseeable Site and Soil Conditions | F45 | Poor Monitoring/Controlling of Costs |
| F22 | Project Estimation Problems | F46 | Poor Project Management |
| F23 | Design Inefficiencies | F47 | Adverse Weather Conditions |
| F24 | Wastage of Materials on Site | F48 | HSE Management |
| Cluster | Factor IDs | Characteristics | Probability Range | Impact Range | Number of Factors |
|---|---|---|---|---|---|
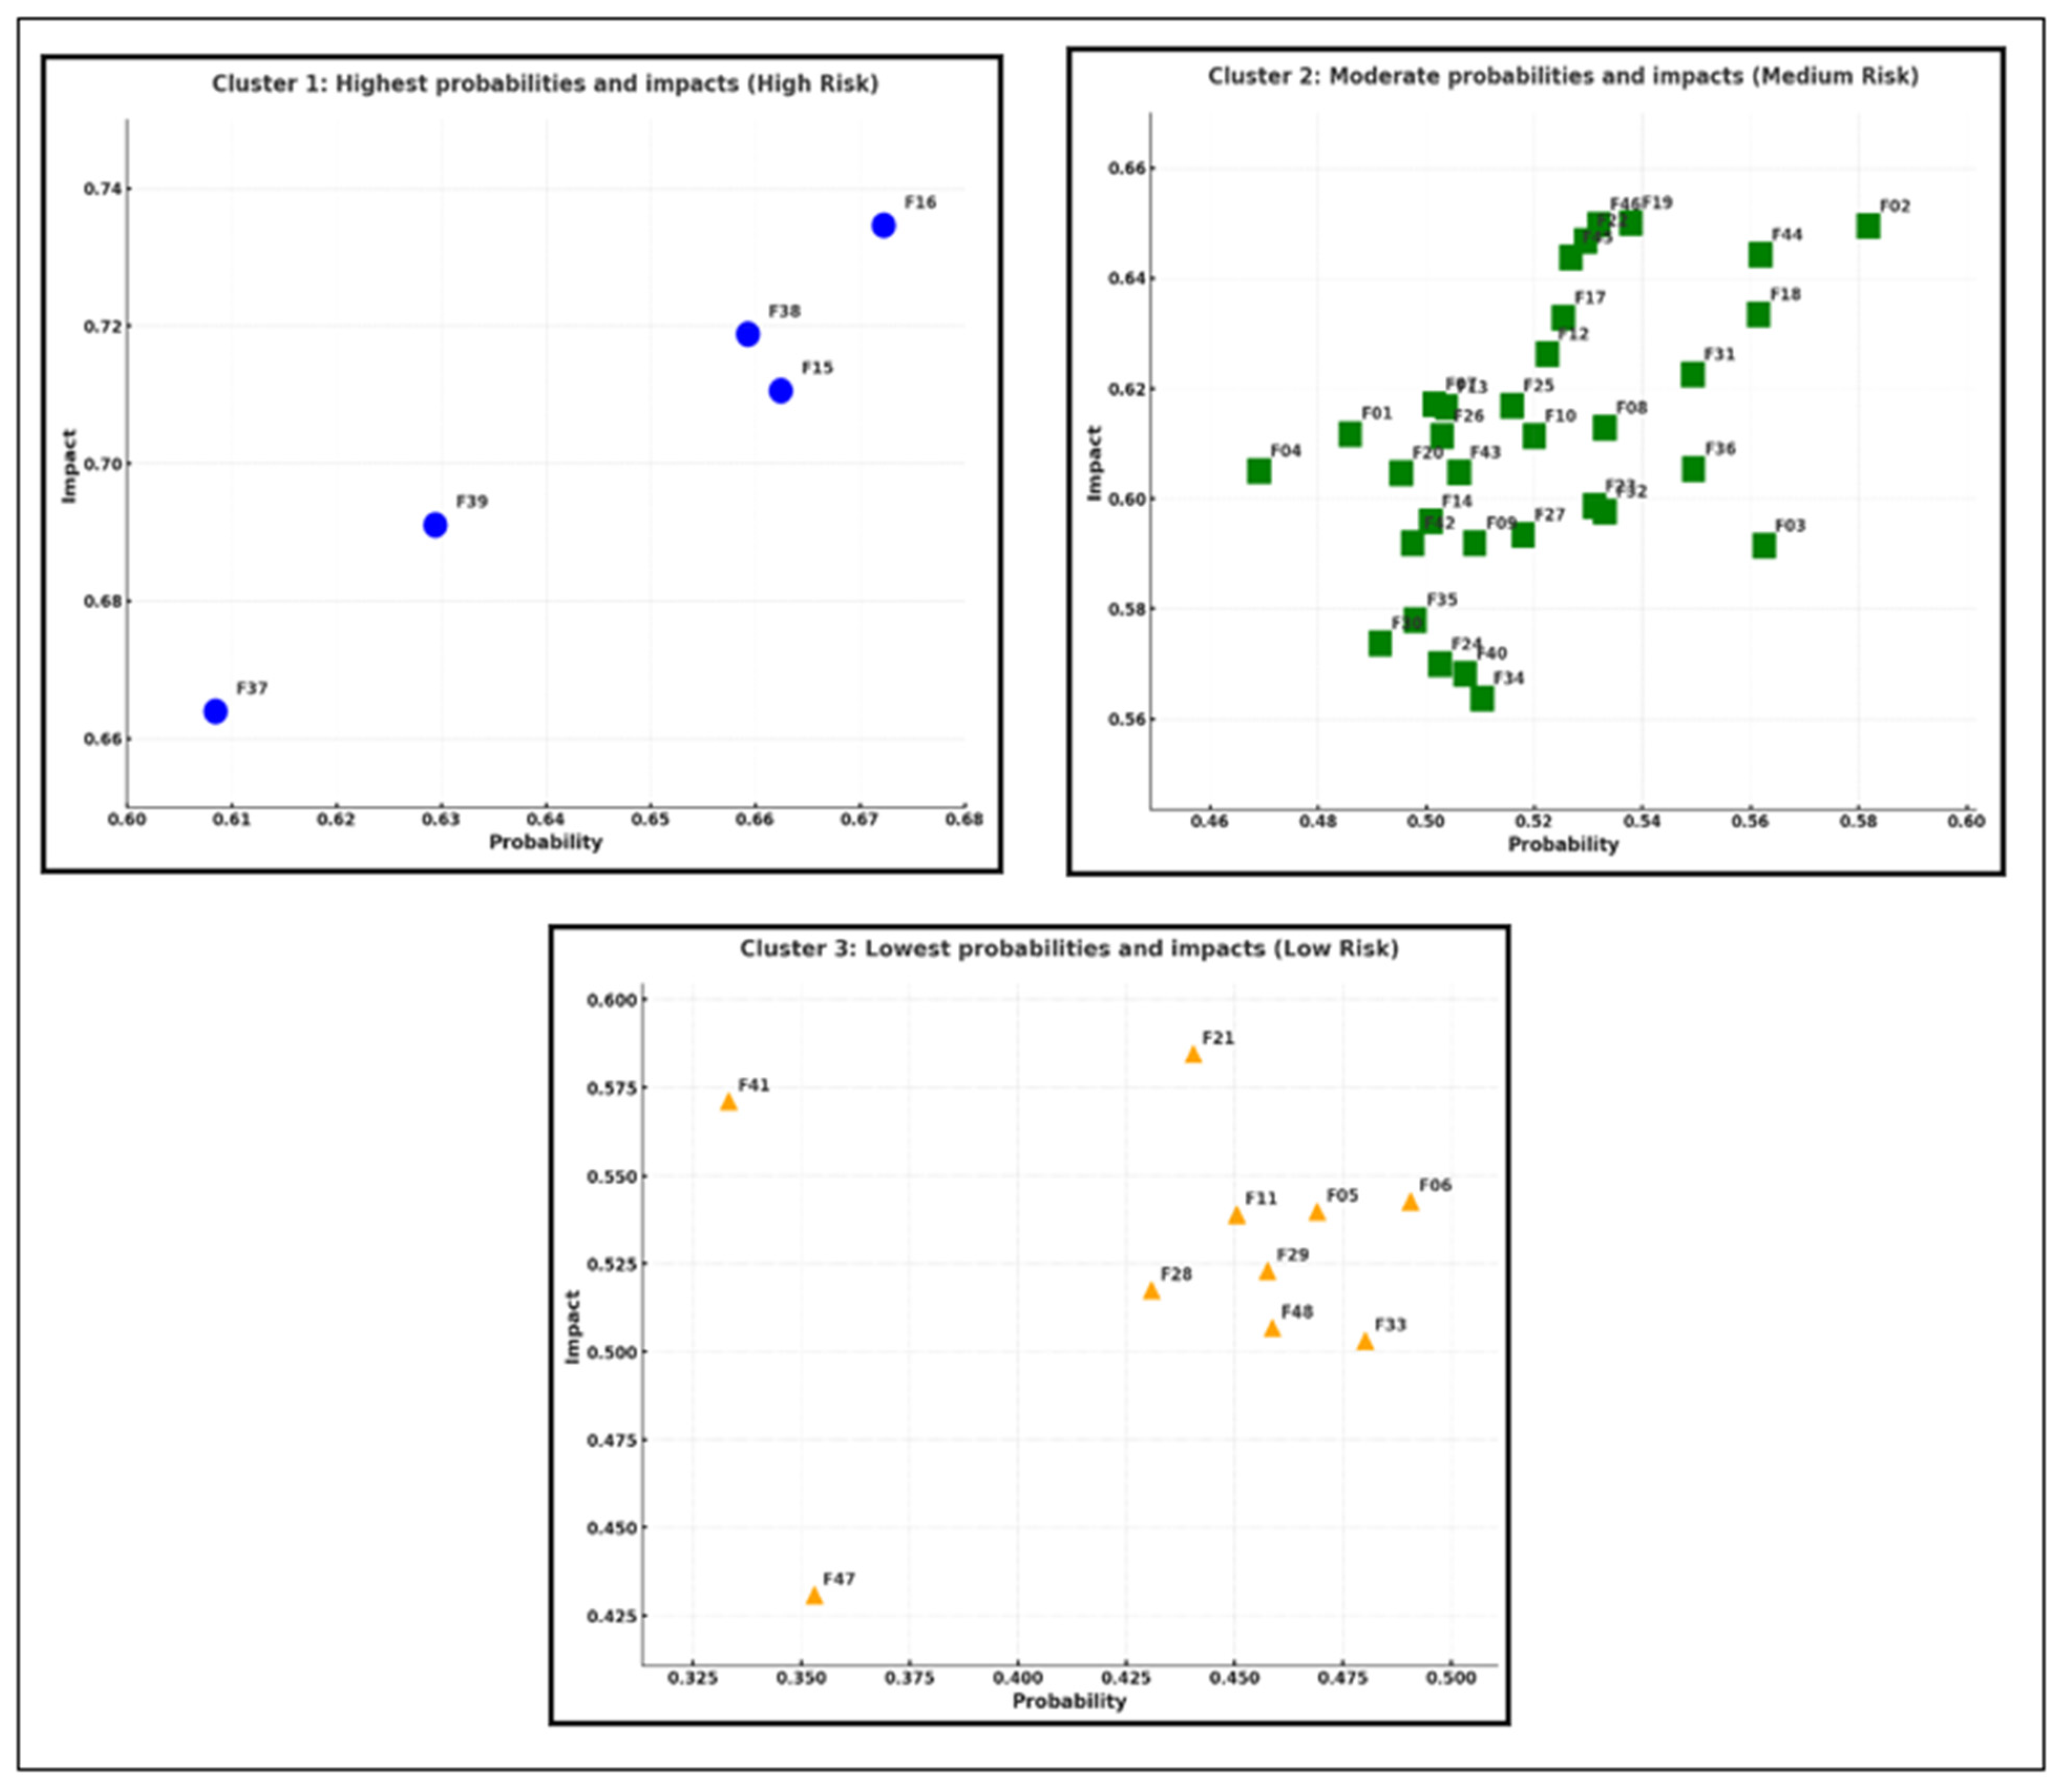
| 1 | F15, F16, F37, F38, F39 | Highest probabilities and impacts (High Risk) | 0.61–0.67 | 0.66–0.73 | 5 |
| 2 | F01, F02, F03, F04, F07, F08, F09, F10, F12, F13, F14, F17, F18, F19, F20, F22, F23, F24, F25, F26, F27, F30, F31, F32, F34, F35, F36, F40, F42, F43, F44, F45, F46 | Moderate probabilities and impacts (Medium Risk) | 0.47–0.58 | 0.56–0.65 | 33 |
| 3 | F05, F06, F11, F21, F28, F29, F33, F41, F47, F48 | Lowest probabilities and impacts (Low Risk) | 0.33–0.49 | 0.43–0.58 | 10 |
| Level of Risk Probability or Impact | Fuzzy Triangular Number (FTN) | Defuzzified Number Range | Description |
|---|---|---|---|
| Very High | 0.7, 0.9, 1 | 0.7 to <0.9 | Extremely high probability of event occurrence, with catastrophic impact on cost. |
| High | 0.5, 0.7, 0.9 | 0.5 to <0.7 | High probability of event occurrence, with a significant impact on cost. |
| Medium | 0.3, 0.5, 0.7 | 0.3 to <0.5 | Moderate probability of event occurrence, with notable impact on cost. |
| Low | 0.1, 0.3, 0.5 | 0.1 to <0.3 | Low probability of event occurrence, with a minor impact on cost. |
| Very Low | 0, 0.1, 0.3 | 0.025 to <0.1 | Very low probability of event occurrence, with negligible impact on cost. |
| Code | Factor | Probability Score | Impact Score | Risk Score | Rank |
|---|---|---|---|---|---|
| F16 | Inflation | 0.672 | 0.735 | 0.703 | 1 |
| F38 | Currency Issues | 0.659 | 0.719 | 0.688 | 2 |
| F15 | Cost of Materials | 0.662 | 0.711 | 0.686 | 3 |
| F39 | Market Fluctuations | 0.629 | 0.691 | 0.660 | 4 |
| F37 | Economic Challenges | 0.608 | 0.664 | 0.636 | 5 |
| F02 | Frequent Changes in Design | 0.582 | 0.649 | 0.615 | 6 |
| F44 | Cash Flow During Construction | 0.562 | 0.644 | 0.602 | 7 |
| F18 | Delayed Payments by Owner for Contractors | 0.562 | 0.633 | 0.596 | 8 |
| F19 | Financial Issues by Contractor | 0.538 | 0.650 | 0.591 | 9 |
| F46 | Poor Project Management | 0.532 | 0.650 | 0.588 | 10 |
| F22 | Project Estimation Problems | 0.530 | 0.647 | 0.585 | 11 |
| F31 | Delay in Materials | 0.549 | 0.622 | 0.585 | 12 |
| F45 | Poor Monitoring/Controlling of Costs | 0.527 | 0.644 | 0.582 | 13 |
| F03 | Increase in Additional Work Orders | 0.563 | 0.591 | 0.577 | 14 |
| F36 | Delays in the Design Stage | 0.550 | 0.605 | 0.577 | 15 |
| F17 | Financial Impediments by Owner | 0.525 | 0.633 | 0.577 | 16 |
| F12 | Resource Planning and Allocation | 0.522 | 0.626 | 0.572 | 17 |
| F08 | Subcontractor Experience and Performance | 0.533 | 0.613 | 0.572 | 18 |
| F32 | Planning and Scheduling Issues | 0.533 | 0.598 | 0.564 | 19 |
| F25 | Delayed Decision-Making by Owners | 0.516 | 0.617 | 0.564 | 20 |
| F23 | Design Inefficiencies | 0.5311 | 0.5987 | 0.5639 | 21 |
| F10 | Availability of Materials | 0.5200 | 0.6113 | 0.5638 | 22 |
| F13 | Contractual Ambiguity and Contradiction | 0.5037 | 0.6165 | 0.5572 | 23 |
| F07 | Contractor Experience | 0.5015 | 0.6172 | 0.5564 | 24 |
| F26 | Political Interference | 0.5030 | 0.6113 | 0.5545 | 25 |
| F27 | Contractual Claims and Disputes | 0.5179 | 0.5934 | 0.5544 | 26 |
| F43 | Mistakes/Deficiency in BOQ | 0.5061 | 0.6048 | 0.5532 | 27 |
| F09 | Poor Site Management Supervision | 0.5090 | 0.5918 | 0.5489 | 28 |
| F20 | Bad Execution Problems | 0.4954 | 0.6046 | 0.5472 | 29 |
| F14 | Bidding and Tendering Difficulties | 0.5008 | 0.5958 | 0.5463 | 30 |
| F01 | Define the Scope | 0.4860 | 0.6118 | 0.5453 | 31 |
| F42 | Unclear or Changes in Specification | 0.4976 | 0.5919 | 0.5427 | 32 |
| F40 | Owner Interference | 0.5072 | 0.5682 | 0.5368 | 33 |
| F35 | Market and Supply Conditions | 0.4980 | 0.5779 | 0.5365 | 34 |
| F34 | Cost of Equipment | 0.5104 | 0.5636 | 0.5363 | 35 |
| F24 | Wastage of Materials on Site | 0.5026 | 0.5699 | 0.5352 | 36 |
| F04 | Project Specifications and Feasibility | 0.4691 | 0.6050 | 0.5327 | 37 |
| F30 | Lack of Coordination and Cooperation | 0.4915 | 0.5737 | 0.5310 | 38 |
| F06 | Labor Productivity | 0.4905 | 0.5427 | 0.5160 | 39 |
| F21 | Unforeseeable Site and Soil Conditions | 0.4404 | 0.5845 | 0.5074 | 40 |
| F05 | Labor Availability and Skills | 0.4690 | 0.5399 | 0.5032 | 41 |
| F11 | Equipment Suitability and Availability | 0.4504 | 0.5391 | 0.4927 | 42 |
| F33 | Cost of Labor | 0.4801 | 0.5031 | 0.4915 | 43 |
| F29 | Lack of Communication Between Parties | 0.4576 | 0.5231 | 0.4892 | 44 |
| F48 | HSE Management | 0.4586 | 0.5067 | 0.4821 | 45 |
| F28 | Bureaucratic and Unethical Behavior | 0.4308 | 0.5175 | 0.4721 | 46 |
| F41 | Force Majeure | 0.3332 | 0.5711 | 0.4363 | 47 |
| F47 | Adverse Weather Conditions | 0.3530 | 0.4308 | 0.3900 | 48 |
| ID | Factor | GE Score | Rank | CS Score | Rank | MC Score | Rank | OW Score | Rank |
|---|---|---|---|---|---|---|---|---|---|
| F16 | Inflation | 0.703 | 1 | 0.694 | 1 | 0.714 | 1 | 0.717 | 1 |
| F38 | Currency Issues | 0.688 | 2 | 0.674 | 3 | 0.710 | 2 | 0.709 | 2 |
| F15 | Cost of Materials | 0.686 | 3 | 0.683 | 2 | 0.695 | 3 | 0.676 | 3 |
| F39 | Market Fluctuations | 0.660 | 4 | 0.648 | 4 | 0.679 | 4 | 0.667 | 5 |
| F37 | Economic Challenges | 0.636 | 5 | 0.628 | 5 | 0.648 | 5 | 0.645 | 7 |
| F02 | Frequent Changes in Design | 0.615 | 6 | 0.591 | 9 | 0.641 | 6 | 0.668 | 4 |
| F44 | Cash Flow During Construction | 0.602 | 7 | 0.604 | 7 | 0.592 | 9 | 0.618 | 13 |
| F18 | Delayed Payments by Owner for Contractors | 0.596 | 8 | 0.607 | 6 | 0.584 | 11 | 0.576 | 28 |
| F19 | Financial Issues by Contractor | 0.591 | 9 | 0.576 | 13 | 0.607 | 7 | 0.627 | 10 |
| F46 | Poor Project Management | 0.588 | 10 | 0.594 | 8 | 0.565 | 20 | 0.623 | 11 |
| F22 | Project Estimation Problems | 0.585 | 11 | 0.591 | 10 | 0.570 | 17 | 0.599 | 18 |
| F31 | Delay in Materials | 0.585 | 12 | 0.570 | 16 | 0.601 | 8 | 0.621 | 12 |
| F45 | Poor Monitoring/Controlling of Costs | 0.582 | 13 | 0.582 | 11 | 0.566 | 19 | 0.629 | 9 |
| F03 | Increase in Additional Work Orders | 0.577 | 14 | 0.575 | 14 | 0.576 | 15 | 0.590 | 22 |
| F36 | Delays in the Design Stage | 0.577 | 15 | 0.562 | 20 | 0.581 | 12 | 0.648 | 6 |
| F17 | Financial Impediments by Owner | 0.577 | 16 | 0.580 | 12 | 0.560 | 23 | 0.606 | 17 |
| F12 | Resource Planning and Allocation | 0.572 | 17 | 0.565 | 18 | 0.580 | 13 | 0.586 | 23 |
| F08 | Subcontractor Experience and Performance | 0.572 | 18 | 0.563 | 19 | 0.573 | 16 | 0.615 | 14 |
| F32 | Planning and Scheduling Issues | 0.564 | 19 | 0.566 | 17 | 0.561 | 22 | 0.568 | 33 |
| F25 | Delayed Decision-Making by Owners | 0.564 | 20 | 0.549 | 26 | 0.577 | 14 | 0.608 | 16 |
| F23 | Design Inefficiencies | 0.564 | 21 | 0.548 | 28 | 0.568 | 18 | 0.639 | 8 |
| F10 | Availability of Materials | 0.564 | 22 | 0.544 | 32 | 0.586 | 10 | 0.610 | 15 |
| F13 | Contractual Ambiguity and Contradiction | 0.557 | 23 | 0.551 | 24 | 0.557 | 24 | 0.596 | 19 |
| F07 | Contractor Experience | 0.556 | 24 | 0.547 | 30 | 0.563 | 21 | 0.592 | 20 |
| F24 | Wastage of Materials on Site | 0.535 | 36 | 0.572 | 15 | 0.470 | 44 | 0.525 | 40 |
Disclaimer/Publisher’s Note: The statements, opinions and data contained in all publications are solely those of the individual author(s) and contributor(s) and not of MDPI and/or the editor(s). MDPI and/or the editor(s) disclaim responsibility for any injury to people or property resulting from any ideas, methods, instructions or products referred to in the content. |
© 2025 by the authors. Licensee MDPI, Basel, Switzerland. This article is an open access article distributed under the terms and conditions of the Creative Commons Attribution (CC BY) license (https://creativecommons.org/licenses/by/4.0/).
Share and Cite
Abdelalim, A.M.; Salem, M.; Salem, M.; Al-Adwani, M.; Tantawy, M. Analyzing Cost Overrun Risks in Construction Projects: A Multi-Stakeholder Perspective Using Fuzzy Group Decision-Making and K-Means Clustering. Buildings 2025, 15, 447. https://doi.org/10.3390/buildings15030447
Abdelalim AM, Salem M, Salem M, Al-Adwani M, Tantawy M. Analyzing Cost Overrun Risks in Construction Projects: A Multi-Stakeholder Perspective Using Fuzzy Group Decision-Making and K-Means Clustering. Buildings. 2025; 15(3):447. https://doi.org/10.3390/buildings15030447
Chicago/Turabian StyleAbdelalim, Ahmed Mohammed, Maram Salem, Mohamed Salem, Manal Al-Adwani, and Mohamed Tantawy. 2025. "Analyzing Cost Overrun Risks in Construction Projects: A Multi-Stakeholder Perspective Using Fuzzy Group Decision-Making and K-Means Clustering" Buildings 15, no. 3: 447. https://doi.org/10.3390/buildings15030447
APA StyleAbdelalim, A. M., Salem, M., Salem, M., Al-Adwani, M., & Tantawy, M. (2025). Analyzing Cost Overrun Risks in Construction Projects: A Multi-Stakeholder Perspective Using Fuzzy Group Decision-Making and K-Means Clustering. Buildings, 15(3), 447. https://doi.org/10.3390/buildings15030447