
Numerical Simulation of a Shear Wall Model in Interlocking Masonry with Dry Vertical and Horizontal Joints in Compressed Earth Blocks

Abstract
:1. Introduction
- -
- Validate the experimental results obtained by Moussi et al.
- -
- Develop a representative model for dry-joint masonry systems.
- -
- Explore the implications of using micro- and macro-scale modeling approaches.
- -
- Evaluate the system’s performance under various static and dynamic loading conditions.
2. Materials and Methods
2.1. Principles and Field of Use of the Wall
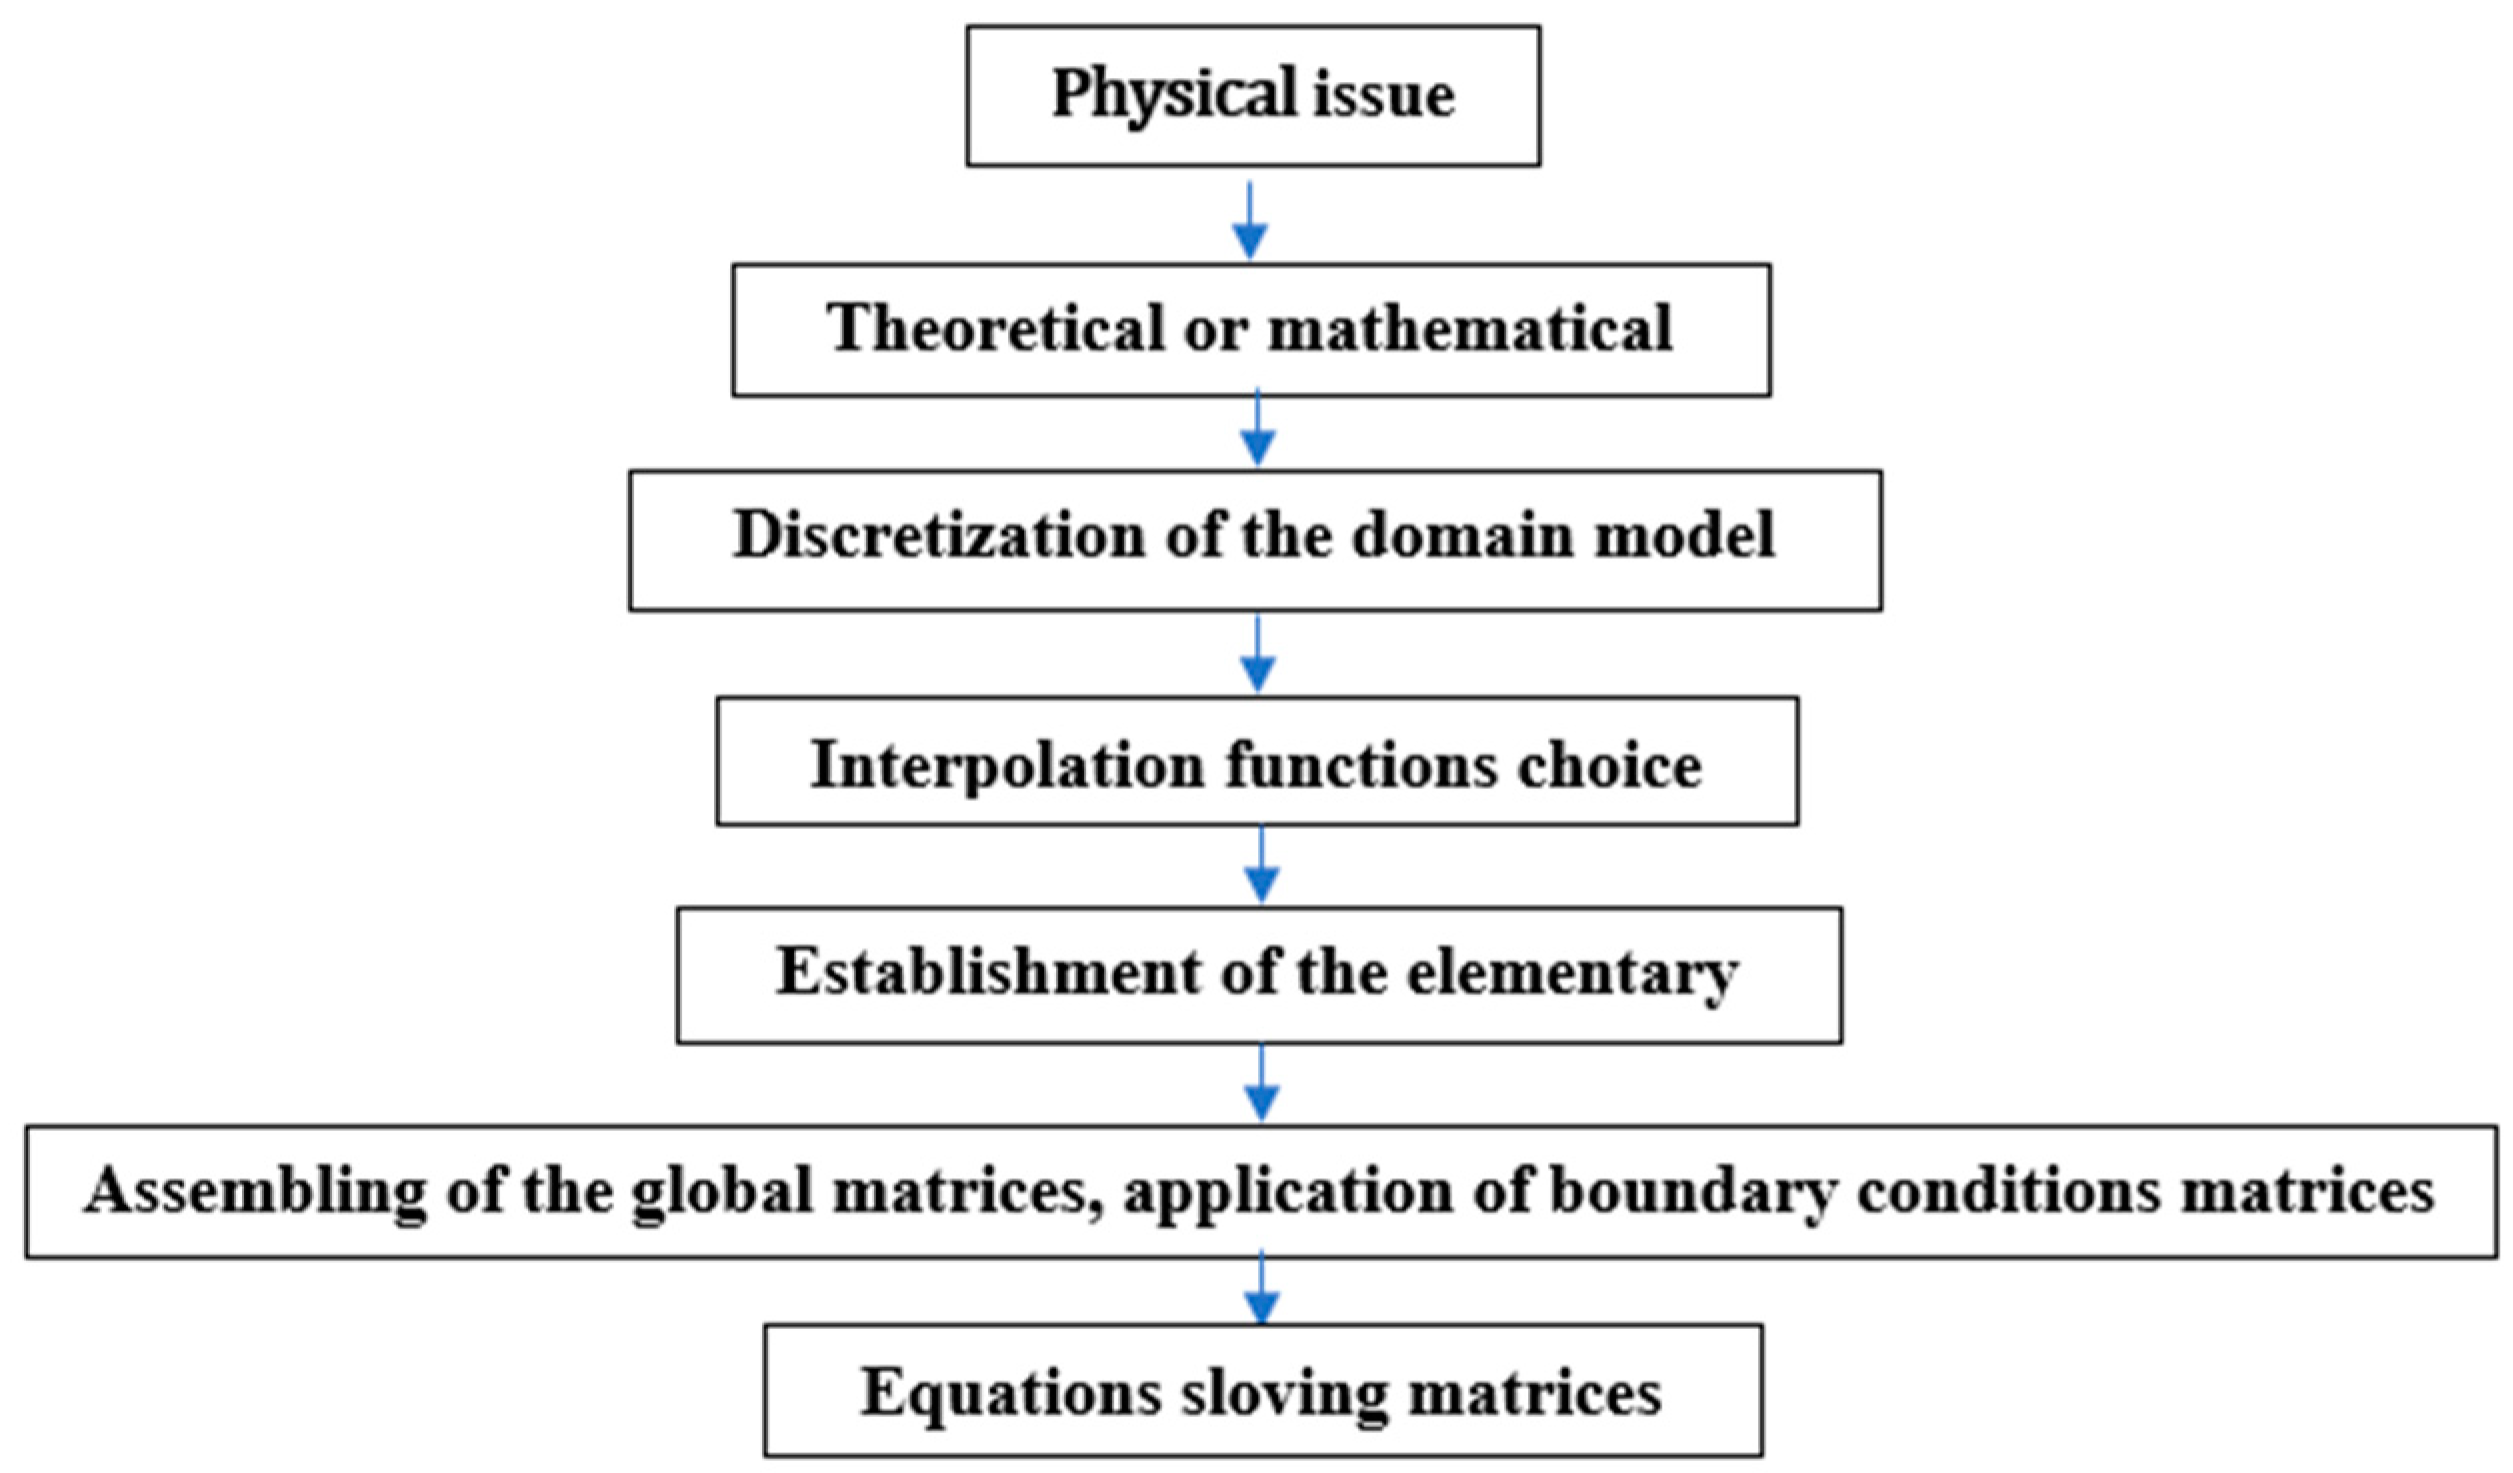
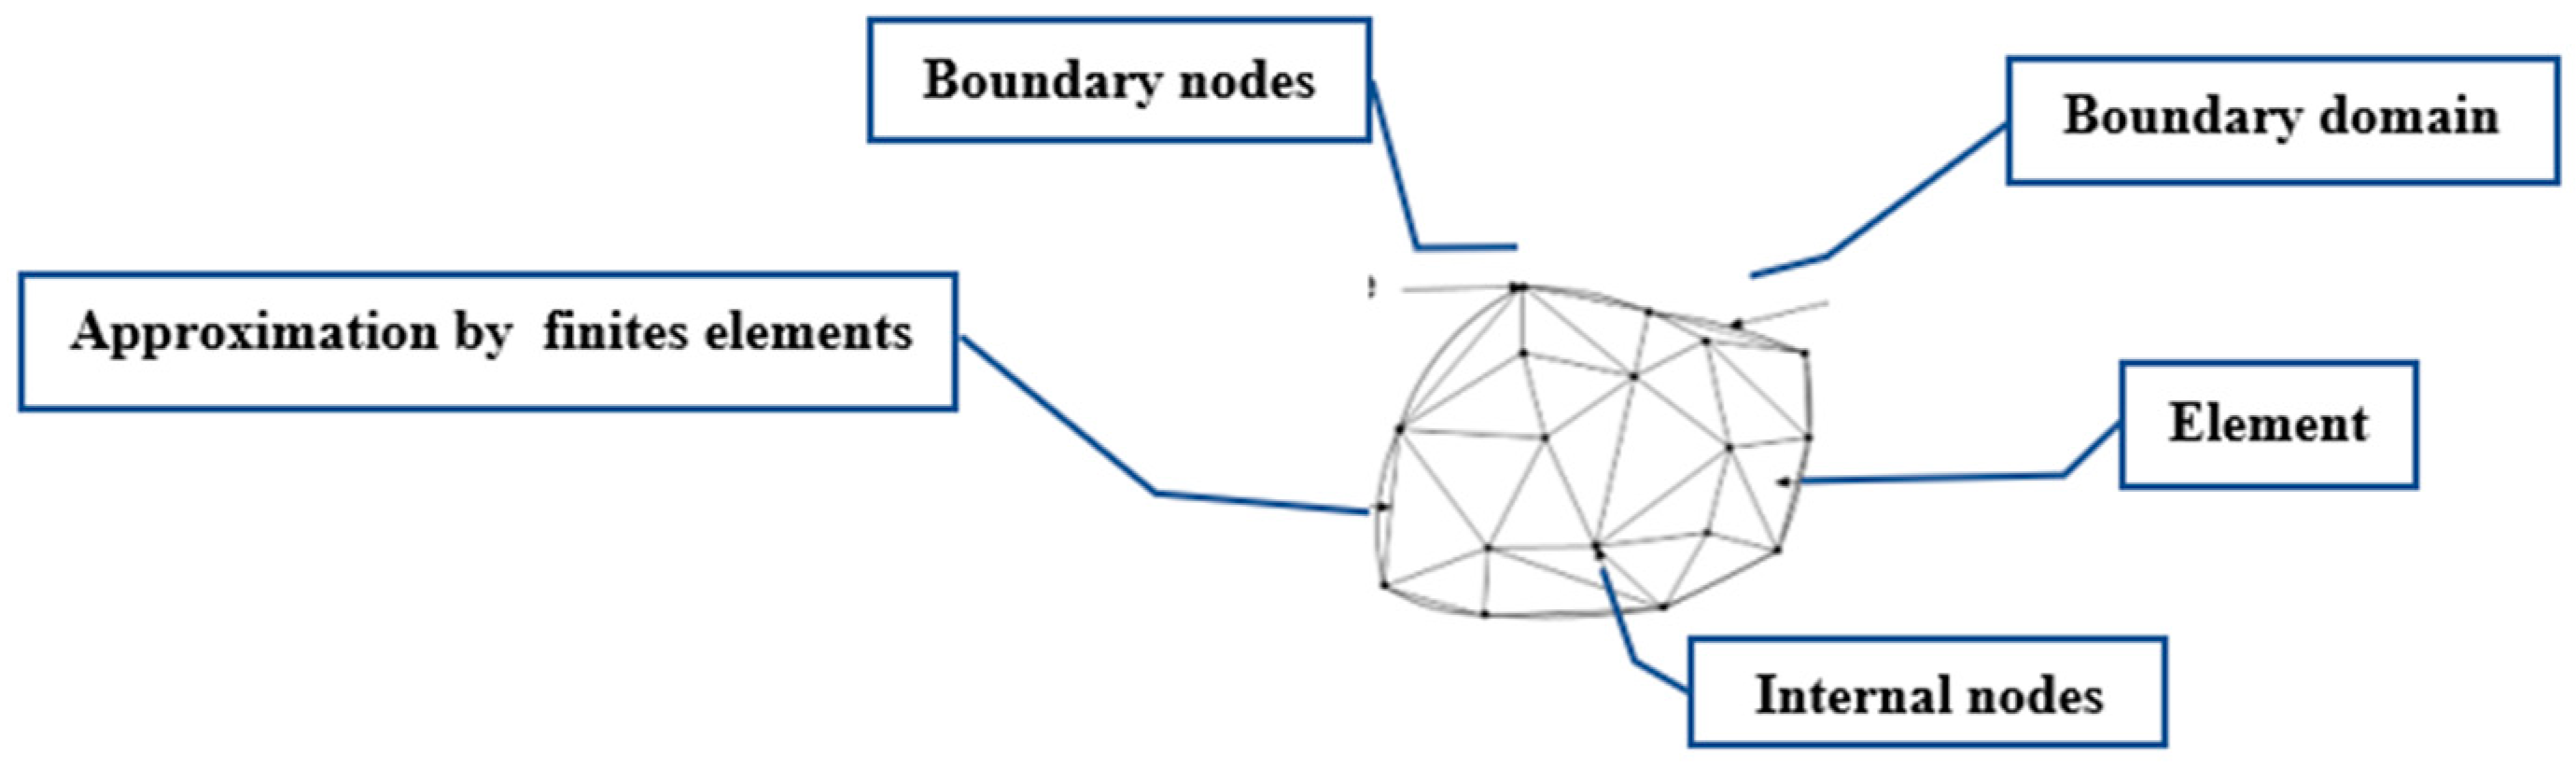
2.2. General Information on the Simulation Method Used (Finite Element Method)
2.3. Software Used
2.4. Simplifying Assumptions
- Young’s Modulus (longitudinal elasticity): E = 2500 MN/m2
- Coulomb’s Modulus: G = 1000 MN/m2
- Poisson’s Ratio: ν = 0.25
- Density: ρ = 2100 kg/m3
- Elastic Limit: Eo = 0.0003 MN
- Tensile Strength: ft = 0.35 MPa
- Compressive Strength: fc = 4 MPa
2.5. Steps Leading to the Simulation
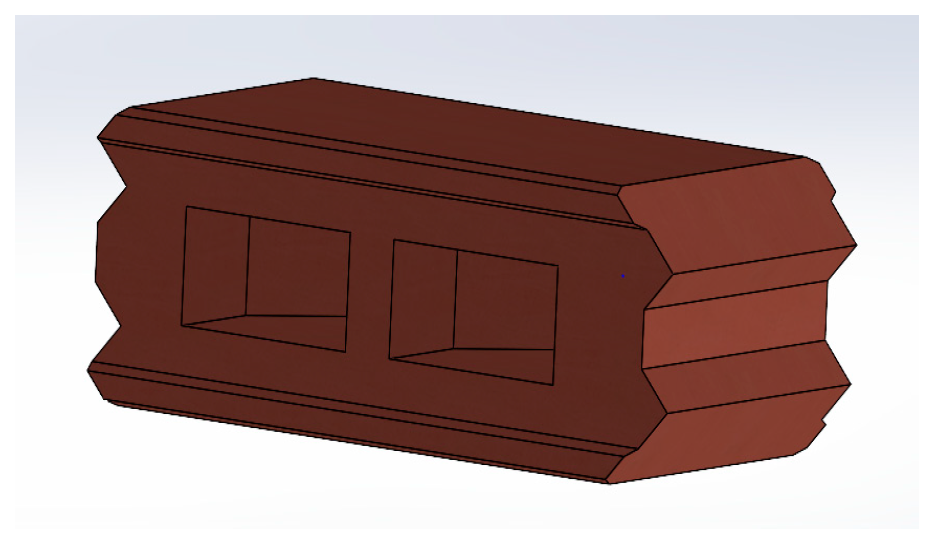
- Model Part Design: The first step was to model the different geometric parts representing the compressed earth blocks, following the dimensions of 10 × 20 × 15 cm3, 20 × 20 × 15 cm3, and 40 × 20 × 15 cm3. These dimensions were chosen based on common practices in compressed earth block construction [50,51].
- Material Property Definition: At this stage, the mechanical properties of the materials were assigned to each geometric part. These properties include Young’s modulus, Coulomb’s modulus, Poisson’s ratio, and other critical mechanical parameters for simulating the resistance and deformation behavior of compressed earth blocks.
- Model Assembly: The model was assembled using surface-to-surface contact constraints. This approach simulates realistic interactions between parts without allowing surface interpenetration. This method is commonly used in finite element analyses to ensure the consistency of the model while maintaining result precision [38,52,53].
- Static Study: A static study was defined to analyze the mechanical behavior of the model under loading conditions. A static study is the standard method for evaluating forces, deformations, and displacements in structures and is frequently used in civil engineering for material analysis [54]. This type of analysis assumes linear elastic behavior, where deformations are proportional to applied forces.
- Element Interactions: We defined a solid interaction between the model elements with a discontinuity range of 0.01%, or 0.30 mm. This interaction models the deformations at the contact points and allows for the simulation of phenomena such as slip or shear within the joints.
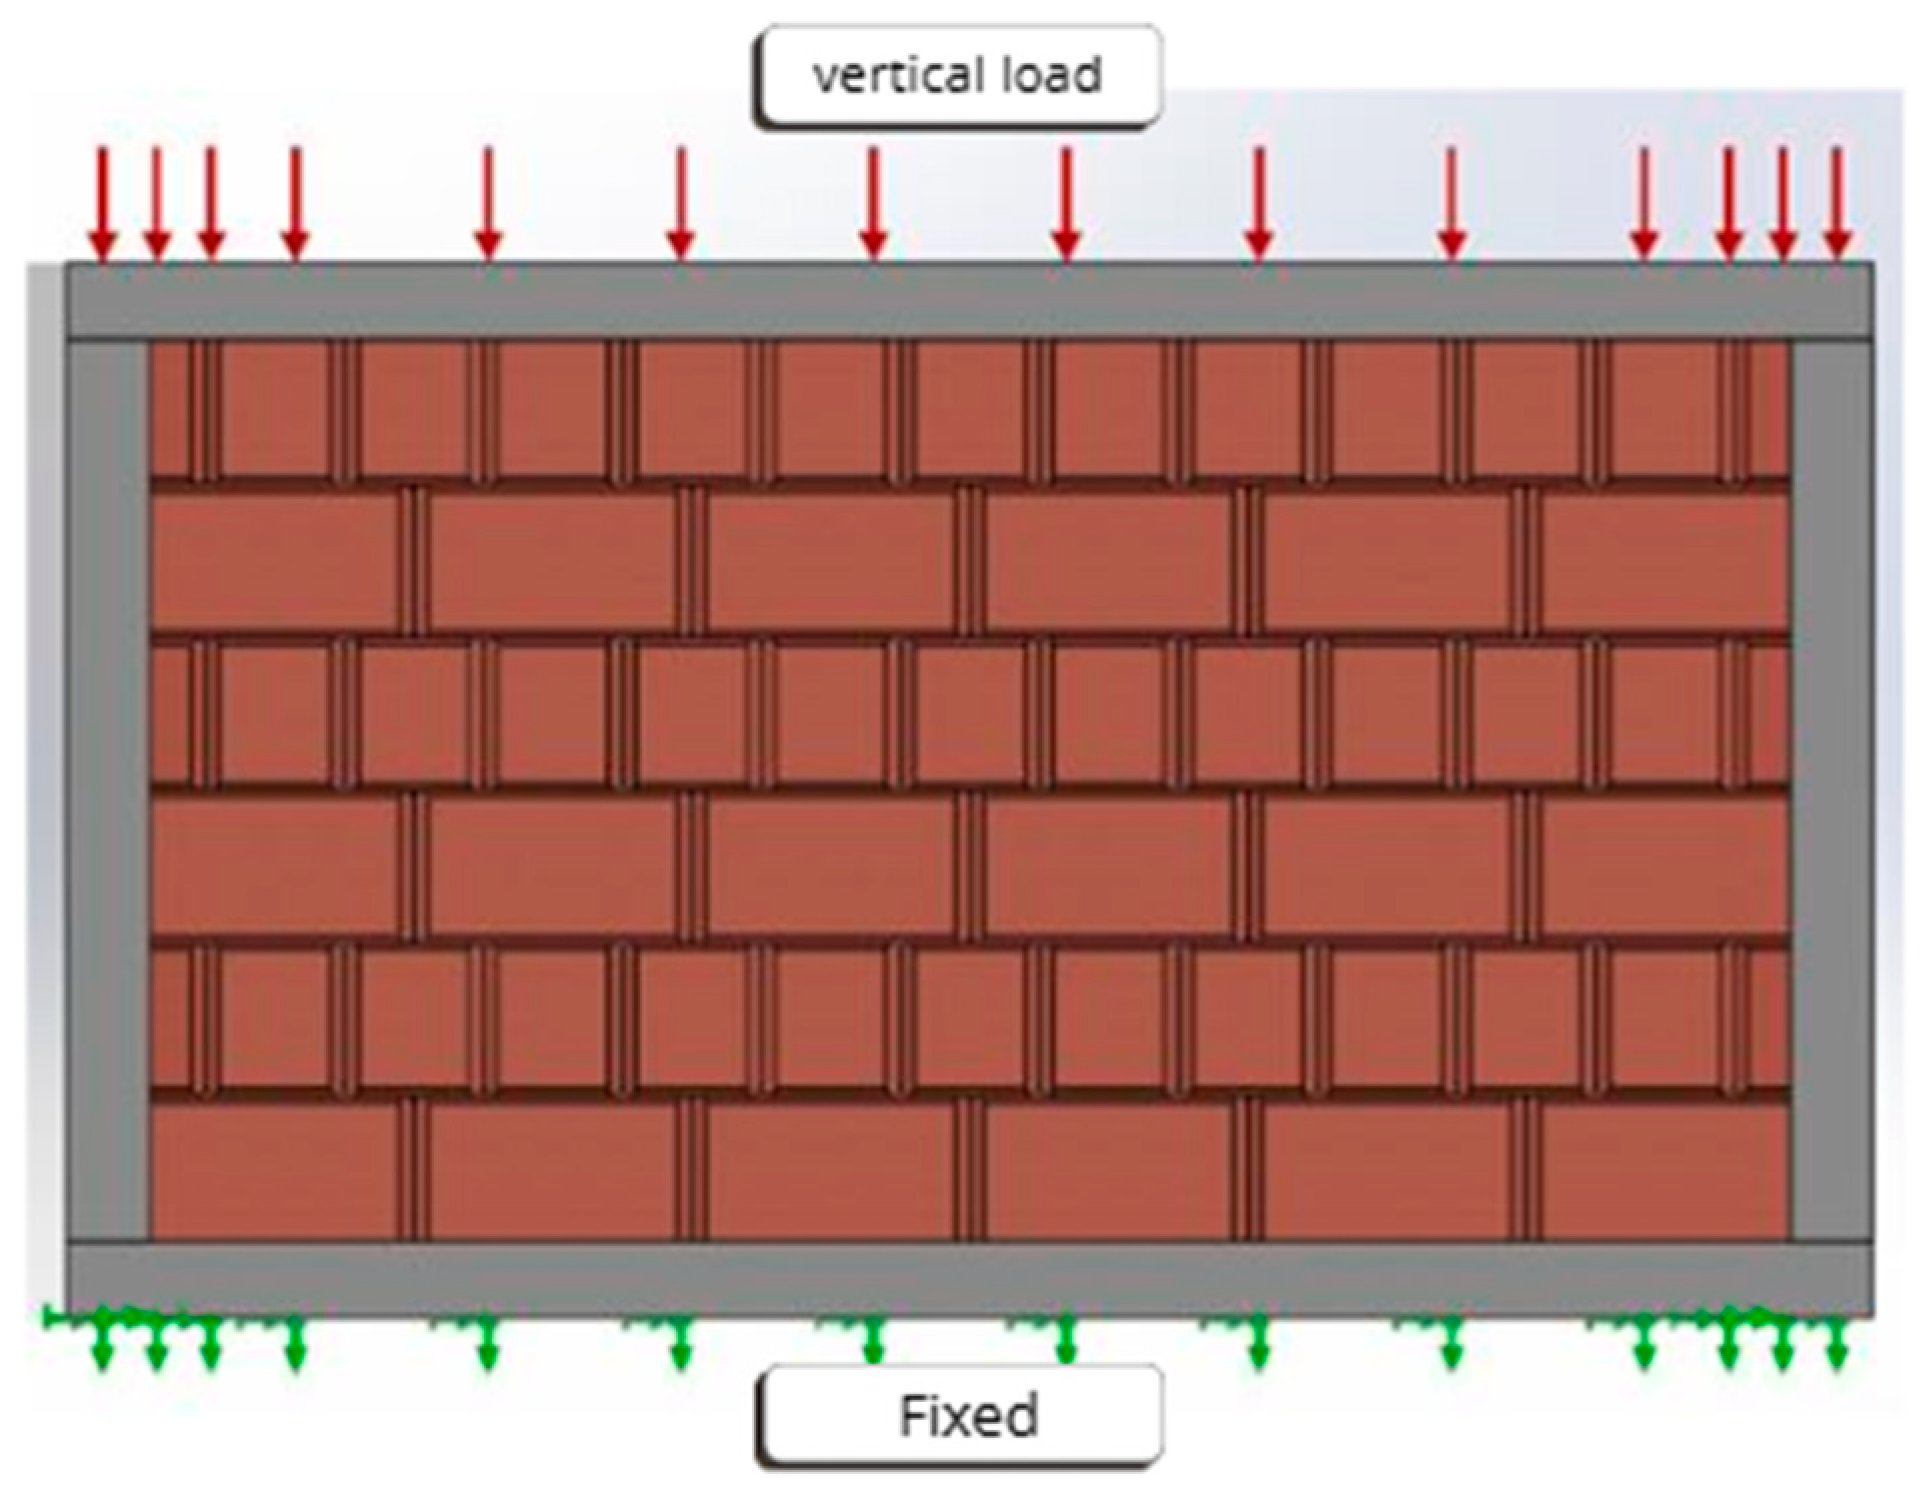
- Loading Conditions and Imposed Displacements: Loading conditions were defined to simulate a variable pressure on the surface of the wall, reflecting realistic loadings to which a compressed earth wall might be subjected in real-world conditions [55,56,57]. Imposed displacements were applied to evaluate the deformations of the model under various load configurations.
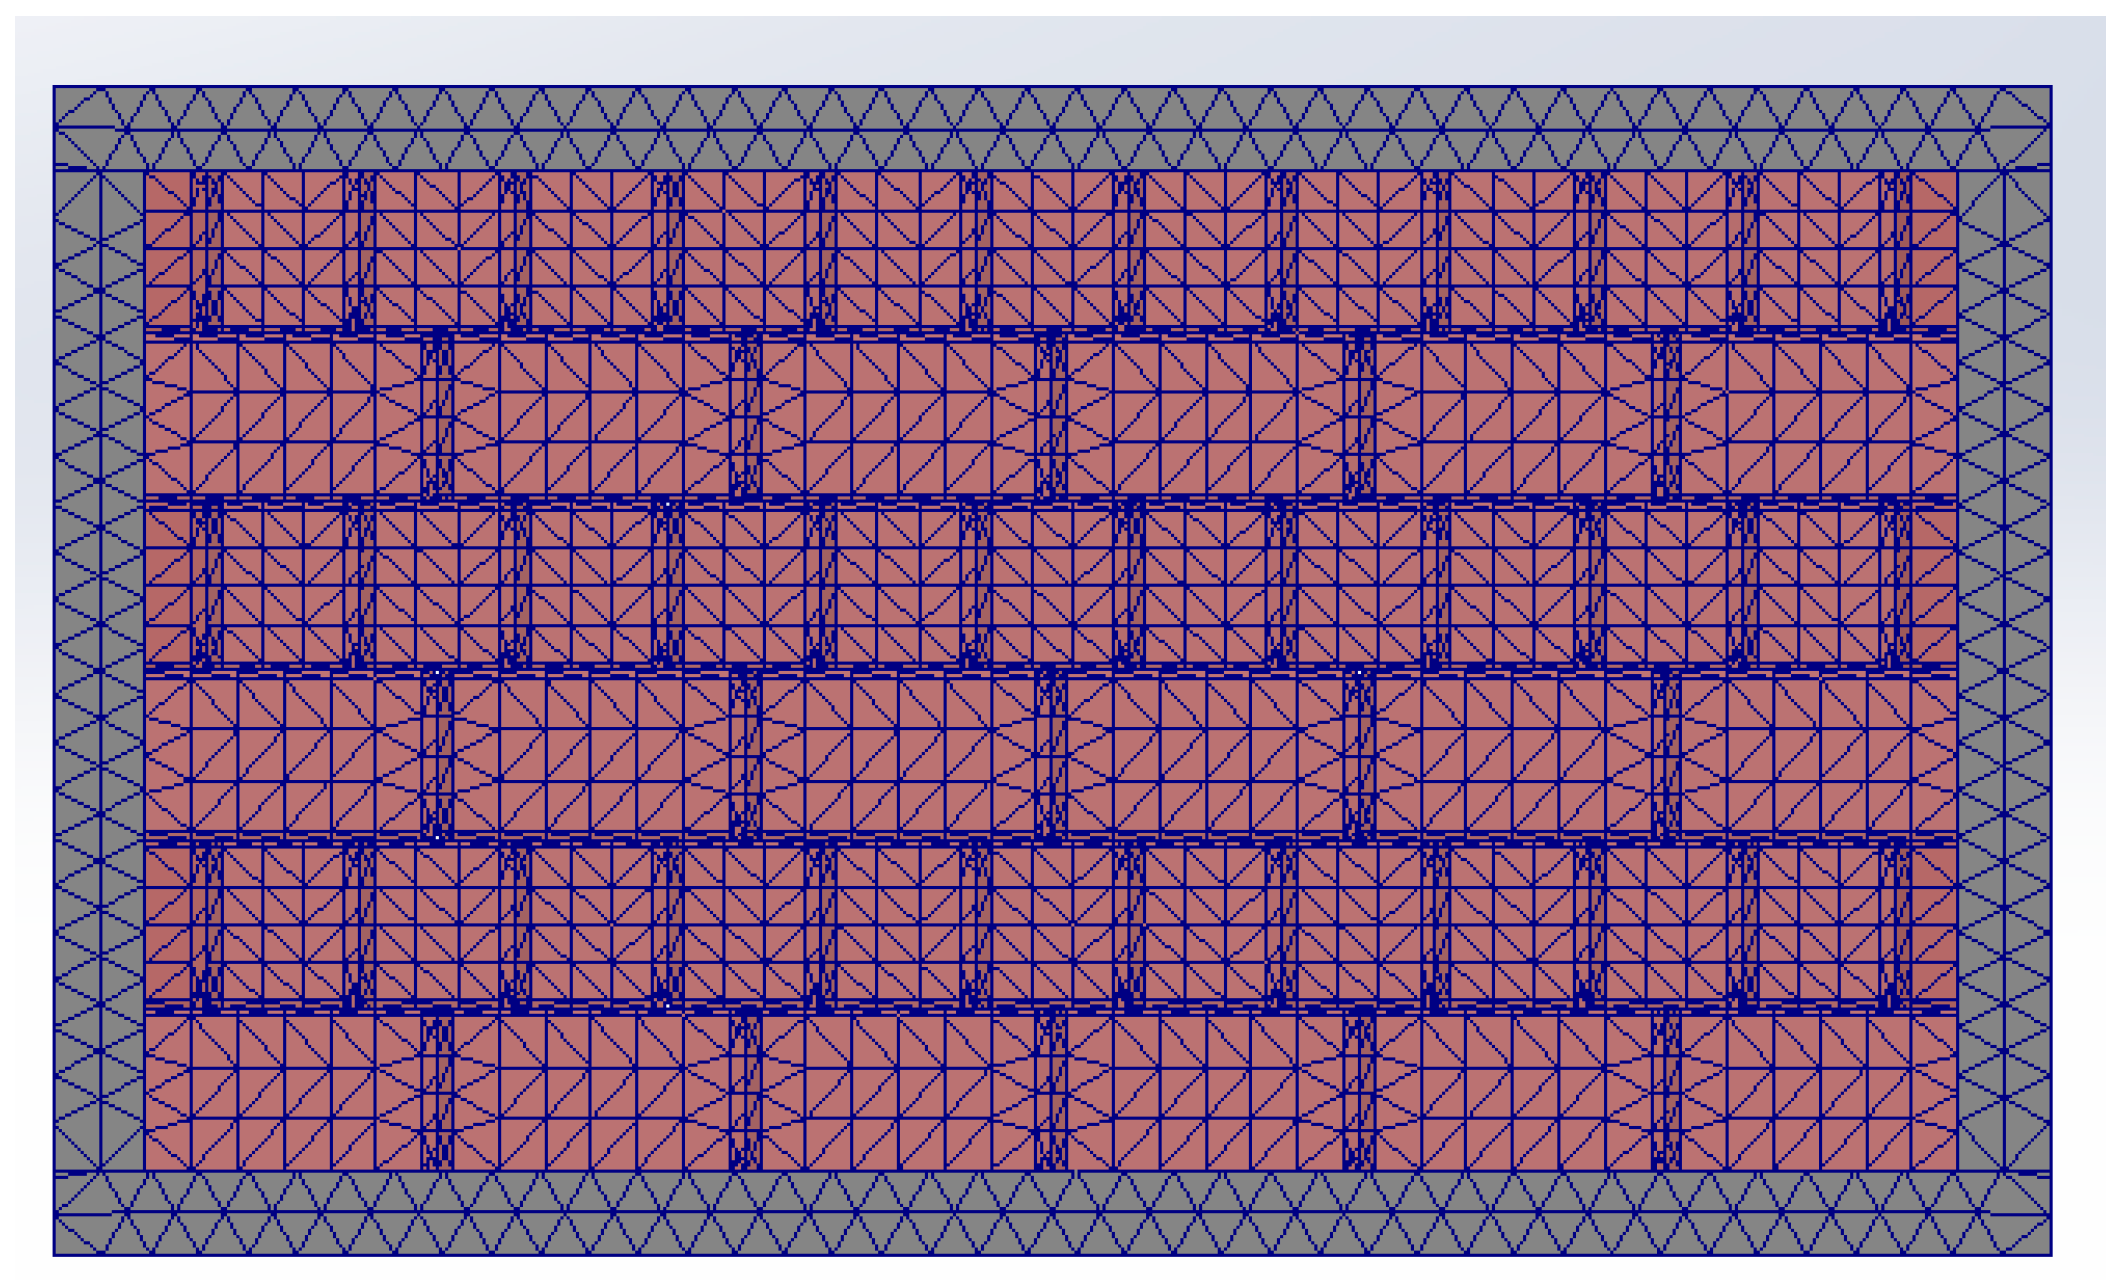
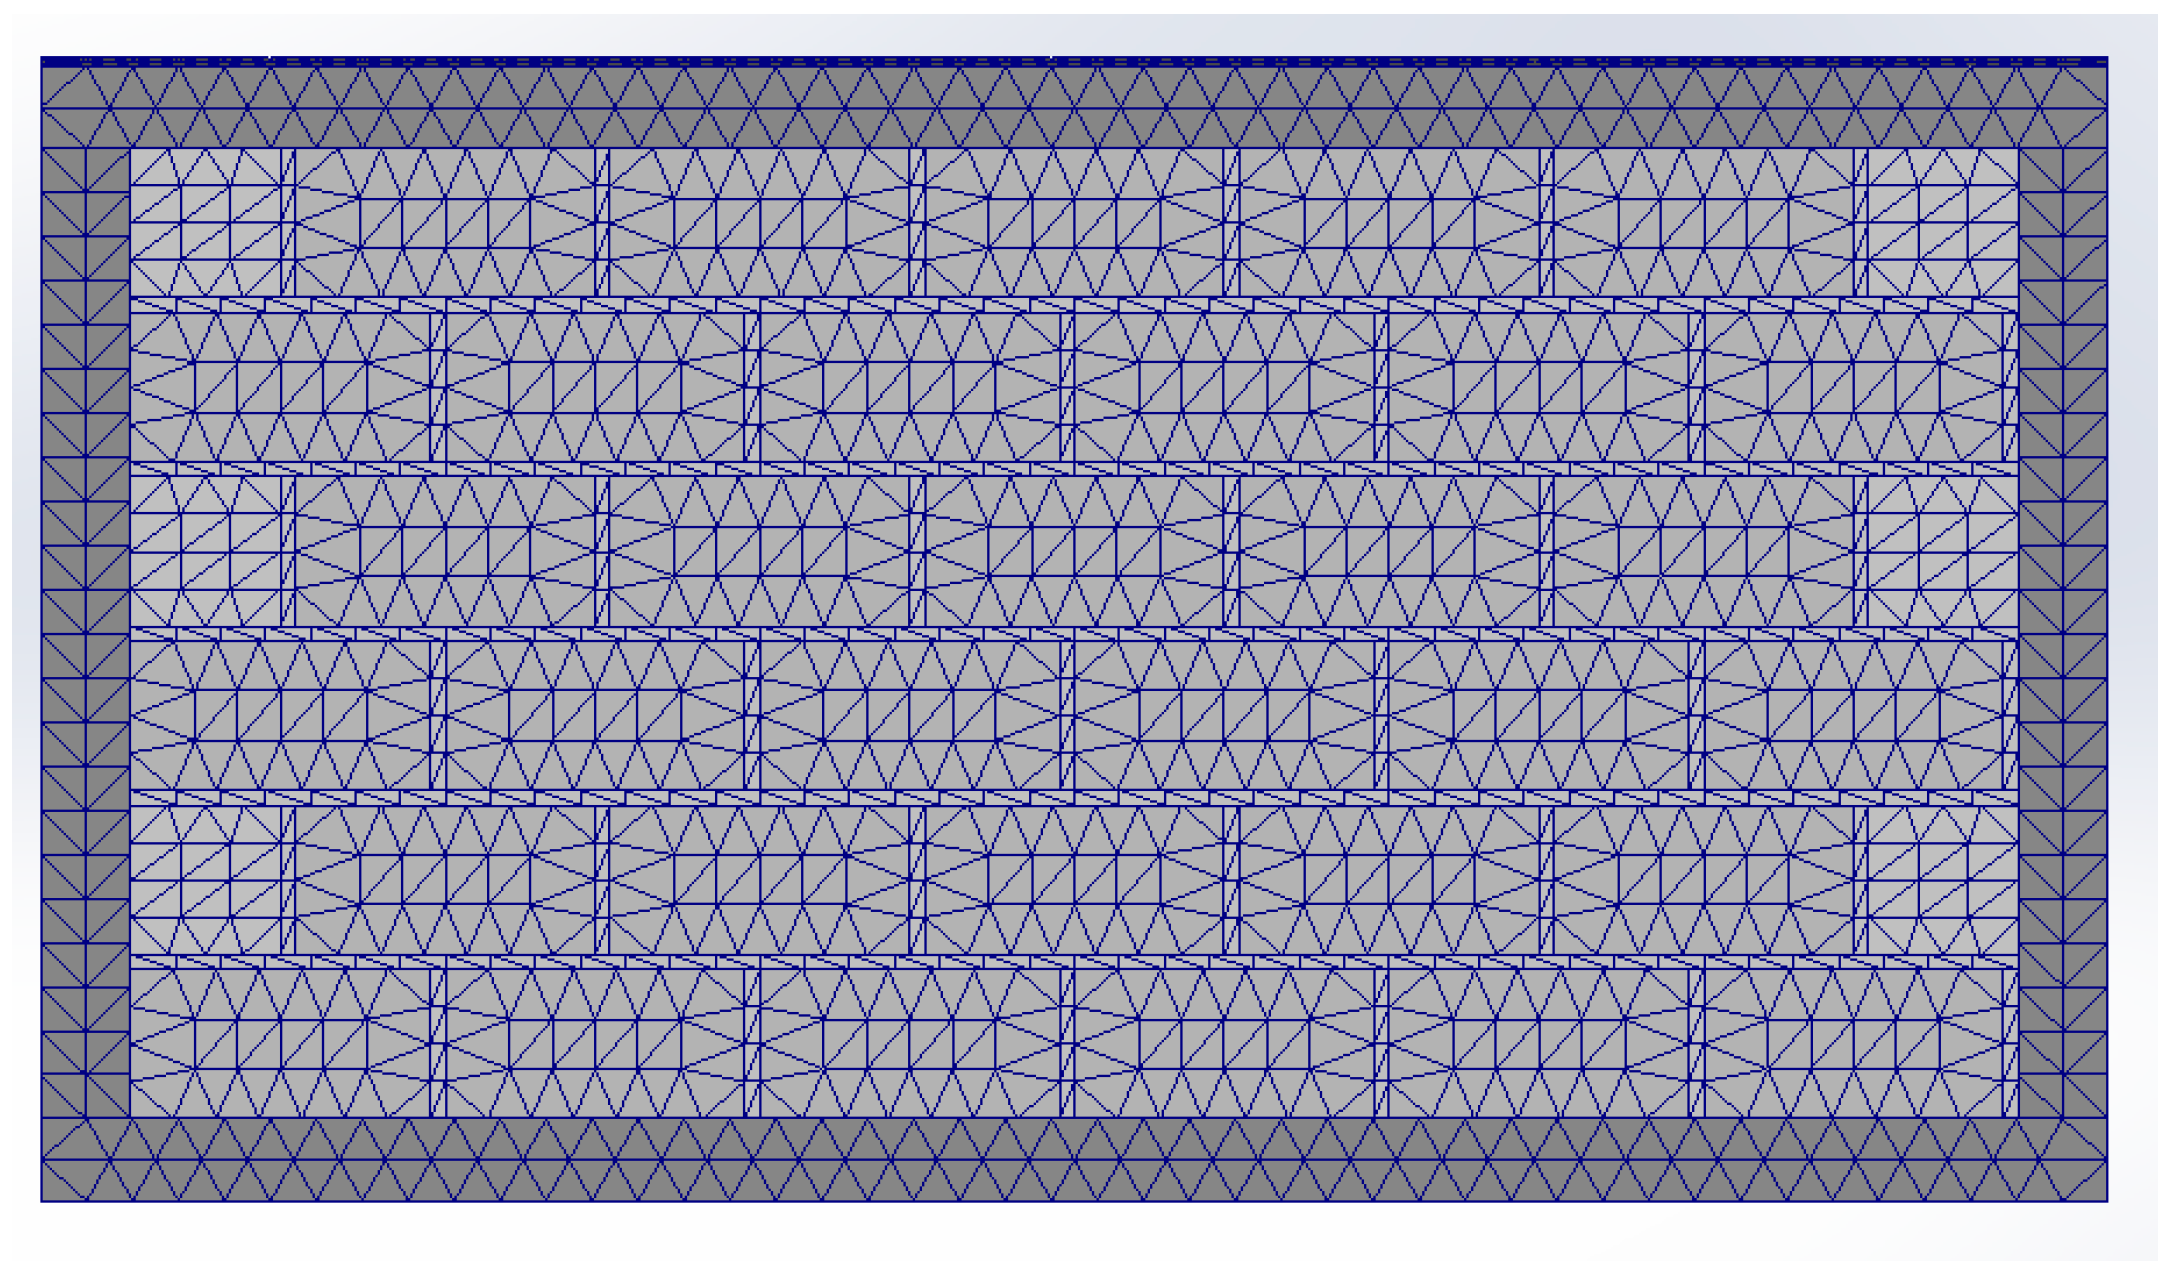
- Model Meshing: The model was meshed using three-node volumetric elements, a common technique for simulating complex solid deformations in structural analyses. The mesh was designed with an overall element size of 46.364 mm and a tolerance of 2.318 mm to ensure good precision while avoiding excessive computational resources. Mesh quality is critical in finite element analysis, where a balance between accuracy and computation time is essential [58].
- Results: The results were extracted in both graphical and numerical form and analyzed using curves to establish relationships between applied forces and maximum stresses, displacements, and equivalent deformations.
2.6. Simplifying Assumptions
- Young’s modulus or longitudinal elasticity: E = 2500 MN/m2
- Coulomb’s modulus: G = 1000 MN/m2
- Poisson’s ratio: ν = 0.25
- Density: ρ = 2100 kg/m3
- Elastic limit: Eo = 0.0003 MN
- Tensile limit: ft = 0.35 MPa
- Compression limit: fc = 4 MPa
2.7. Steps Culminating in the Simulation
- Design of model parts
- Definition of the properties and mechanical characteristics of materials:
- Using the SolidWorks Assembly module to perform model assembly:
- Definition of a static study
- Definition of interactions:
- Definition of loading conditions and imposed displacements:
- Defining a mesh quality plot:
- Execution of the study:
- Results obtained:
3. Results
3.1. Different Loading Situations for Masonry Walls
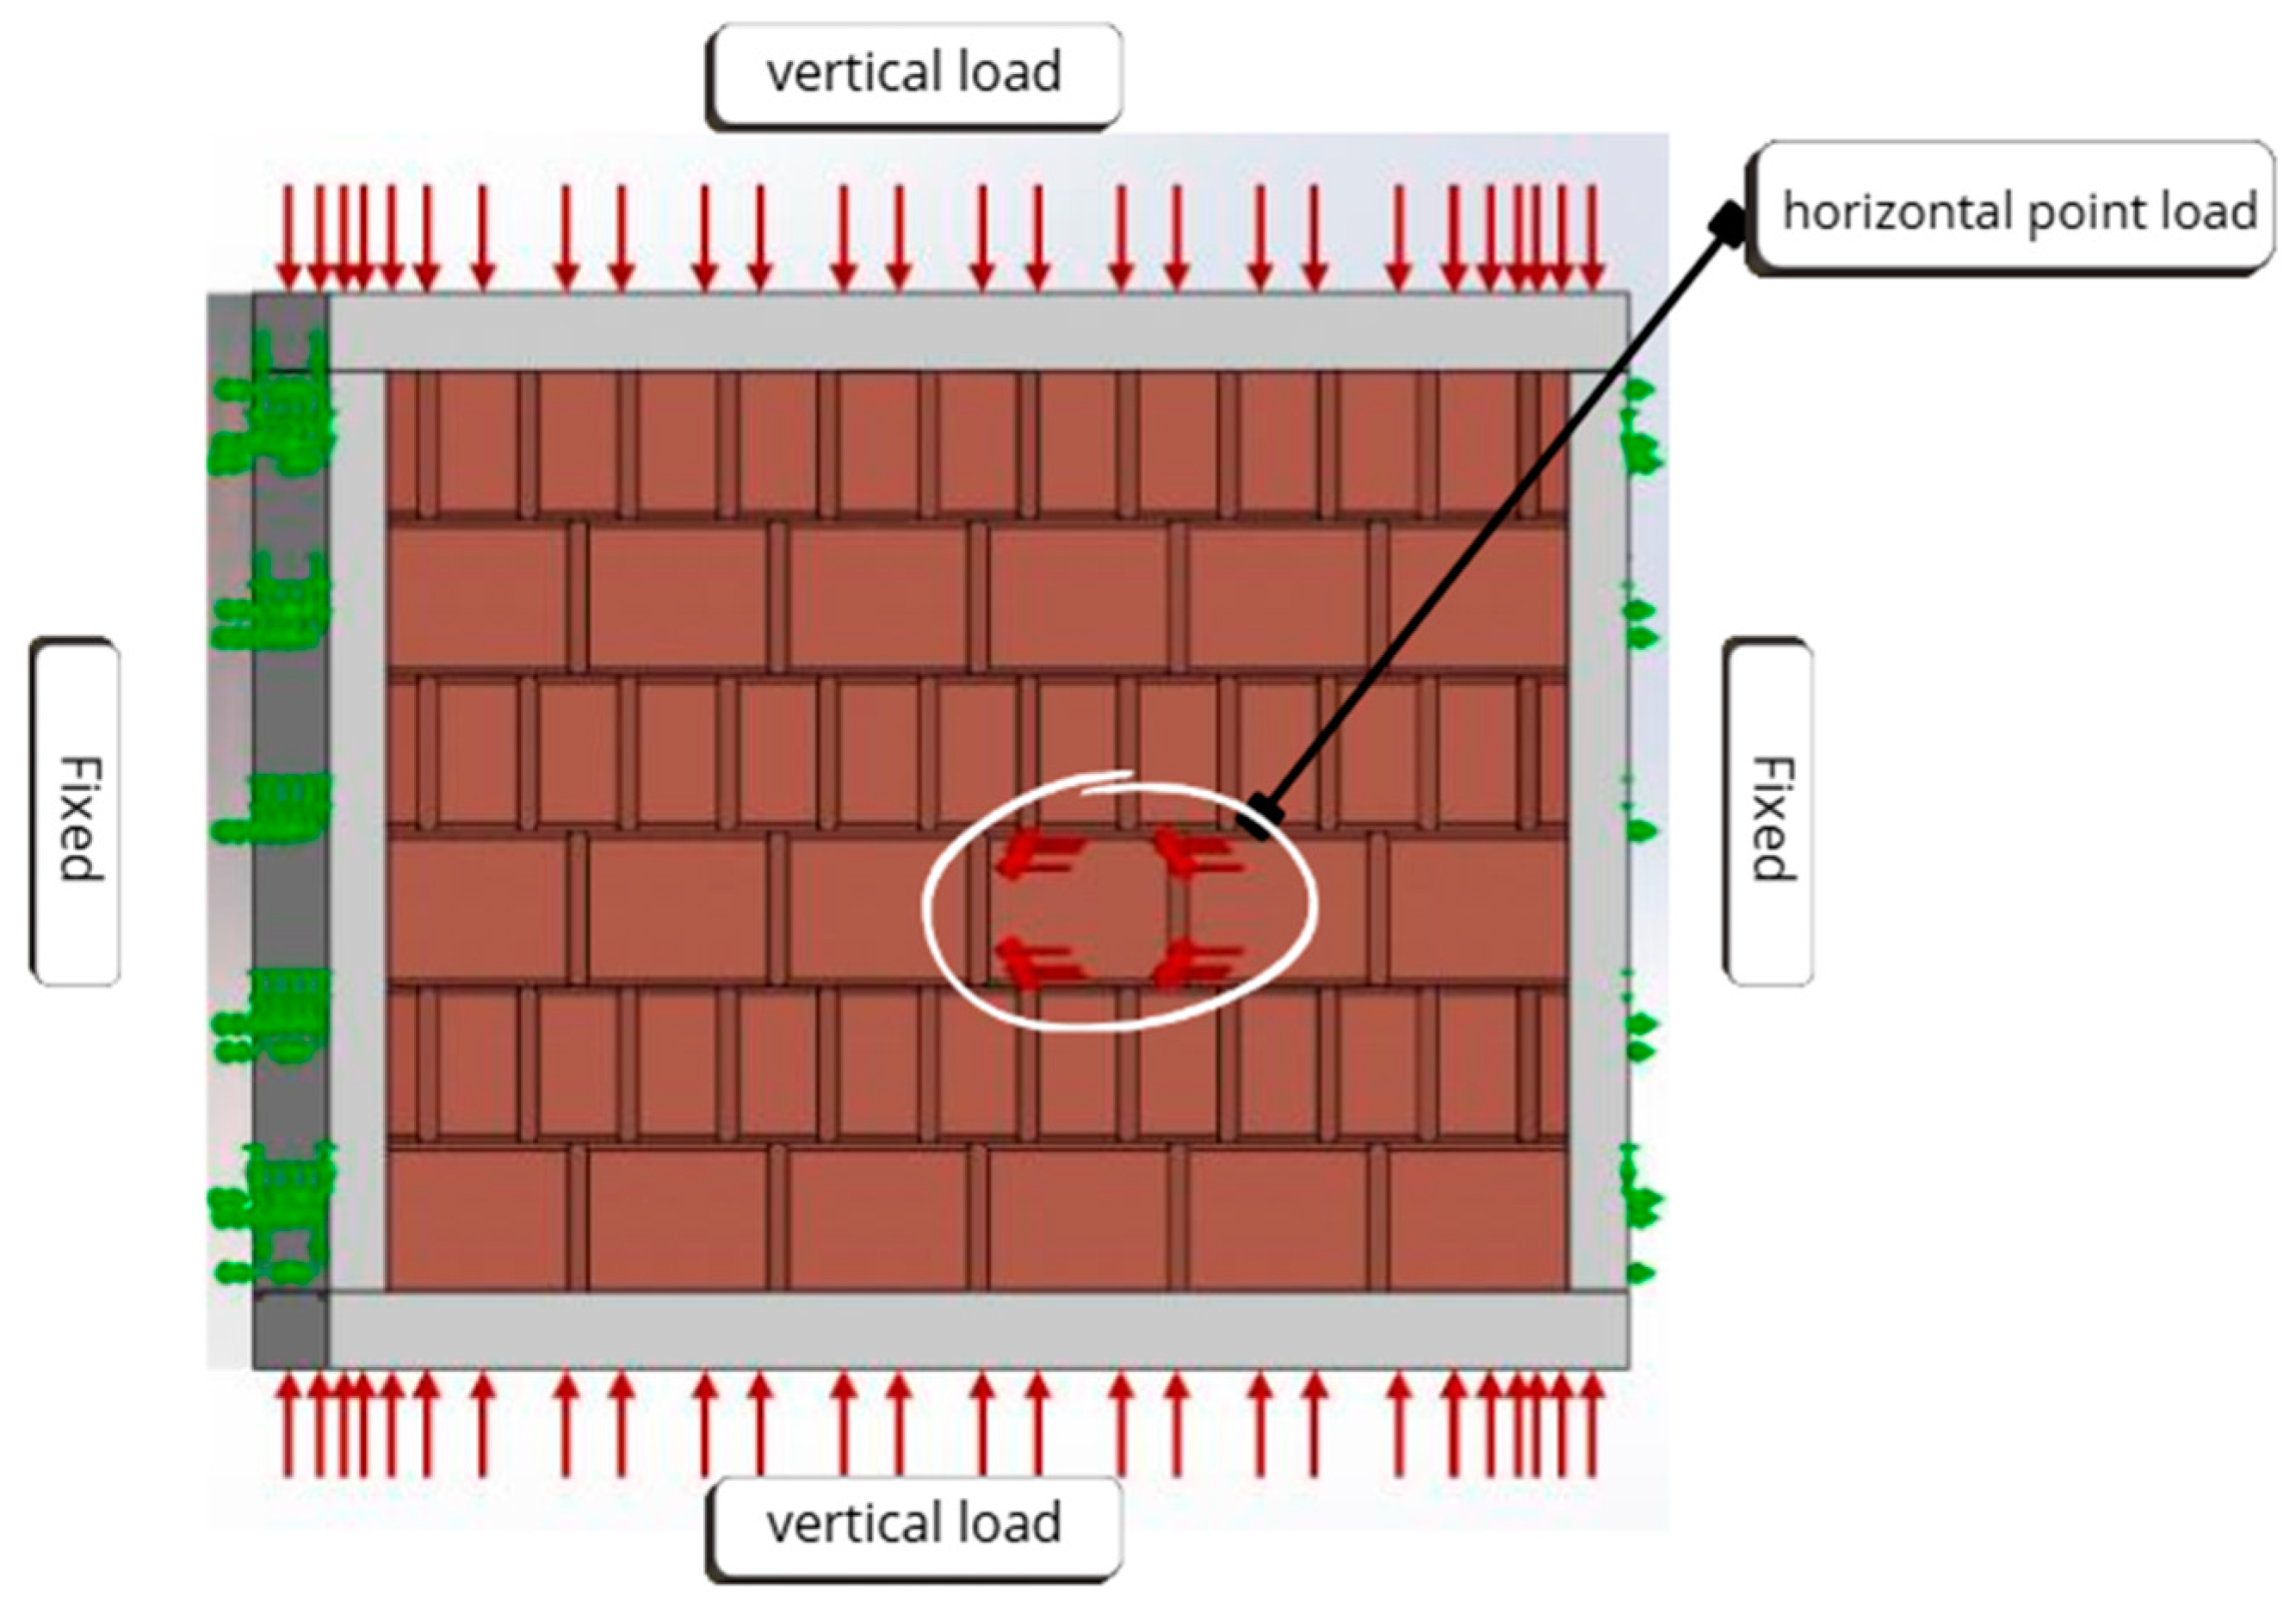
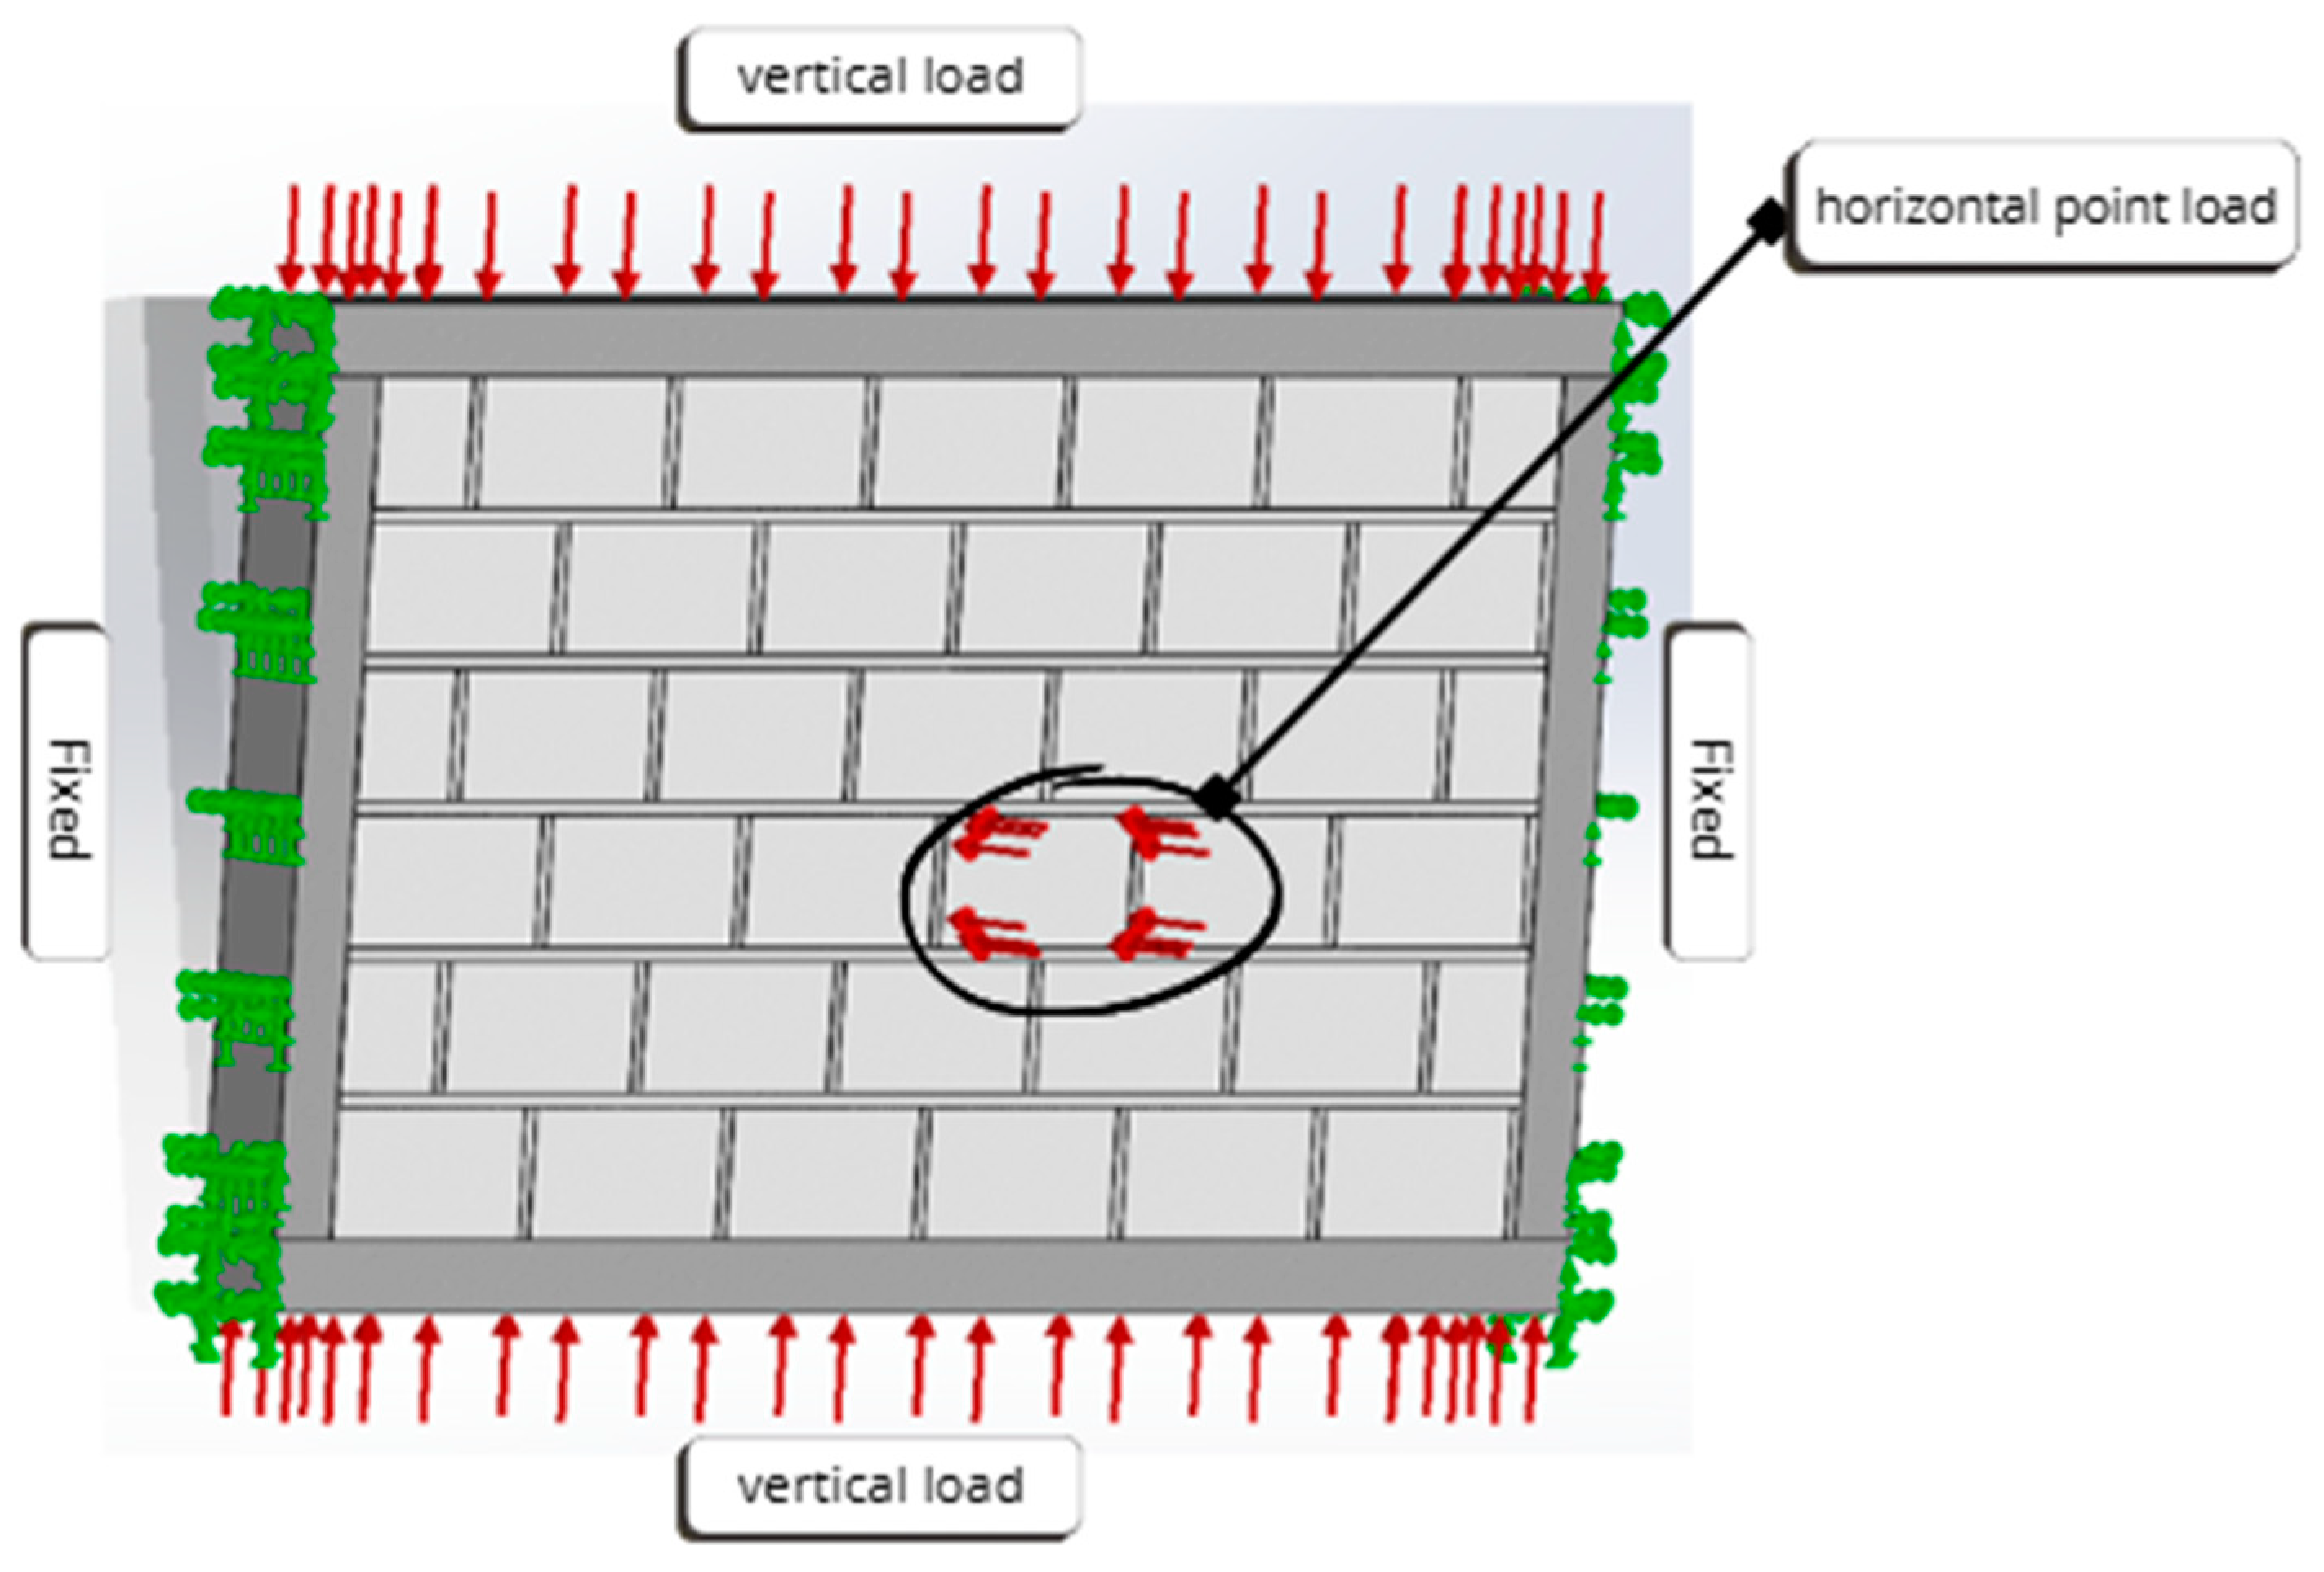
3.1.1. Simulation of Walls Under Normal Loading
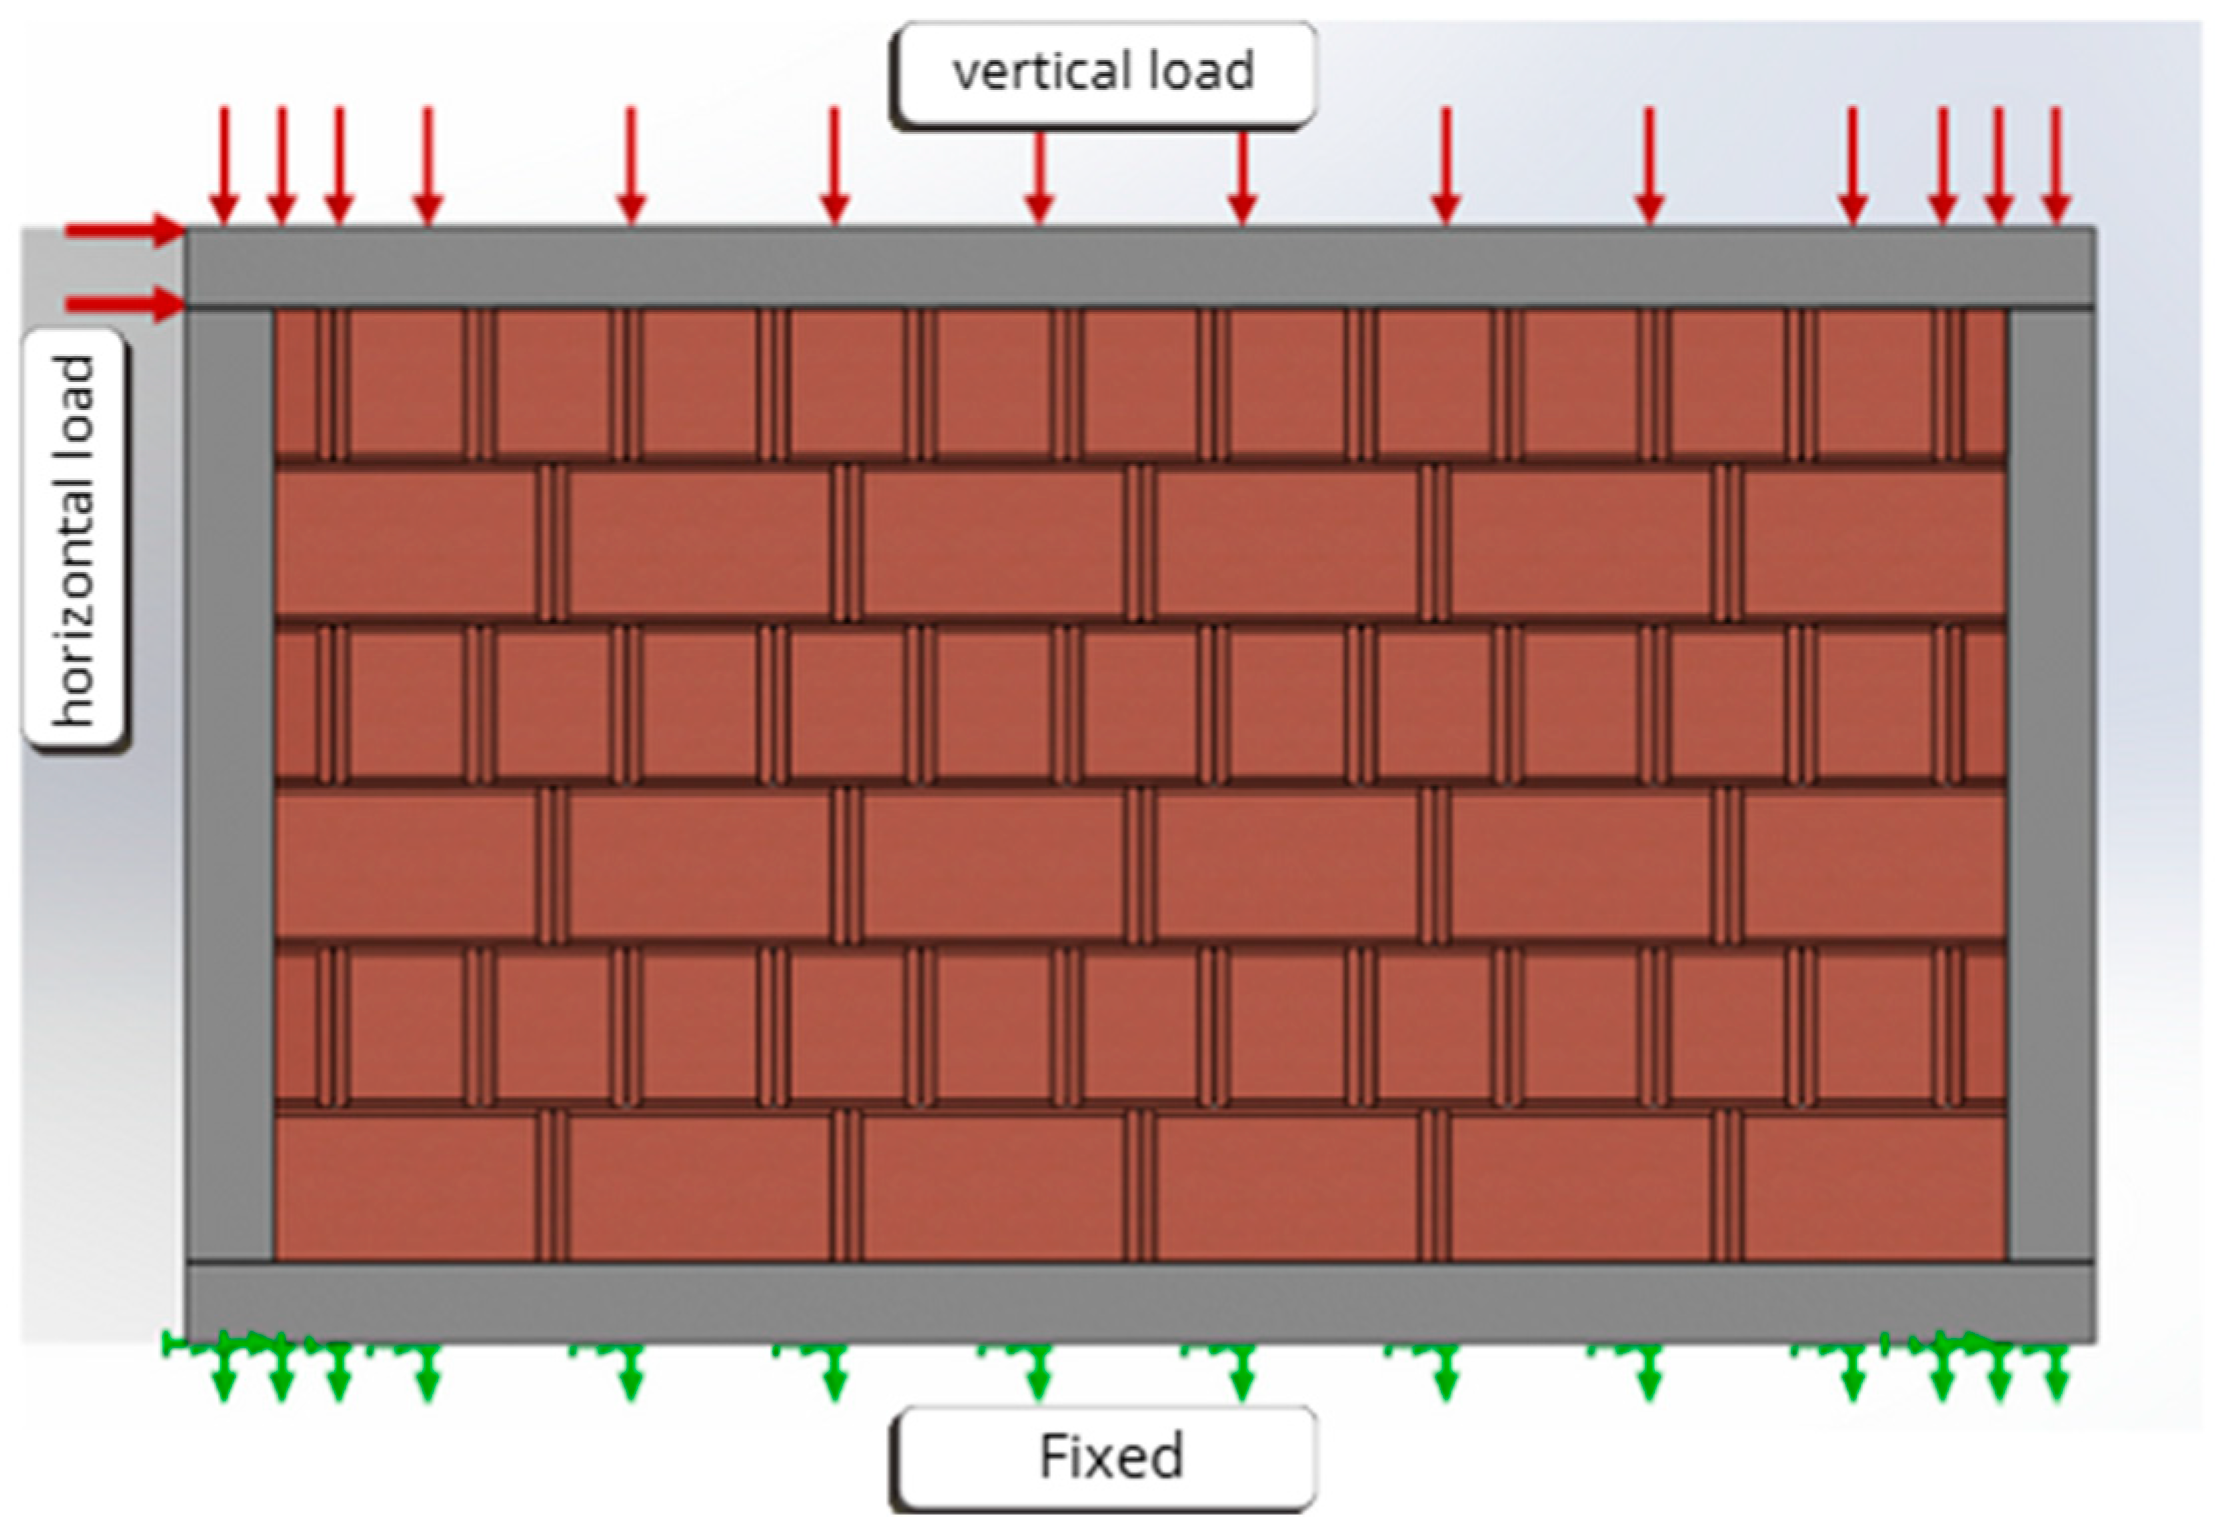
- Case of the new wall model
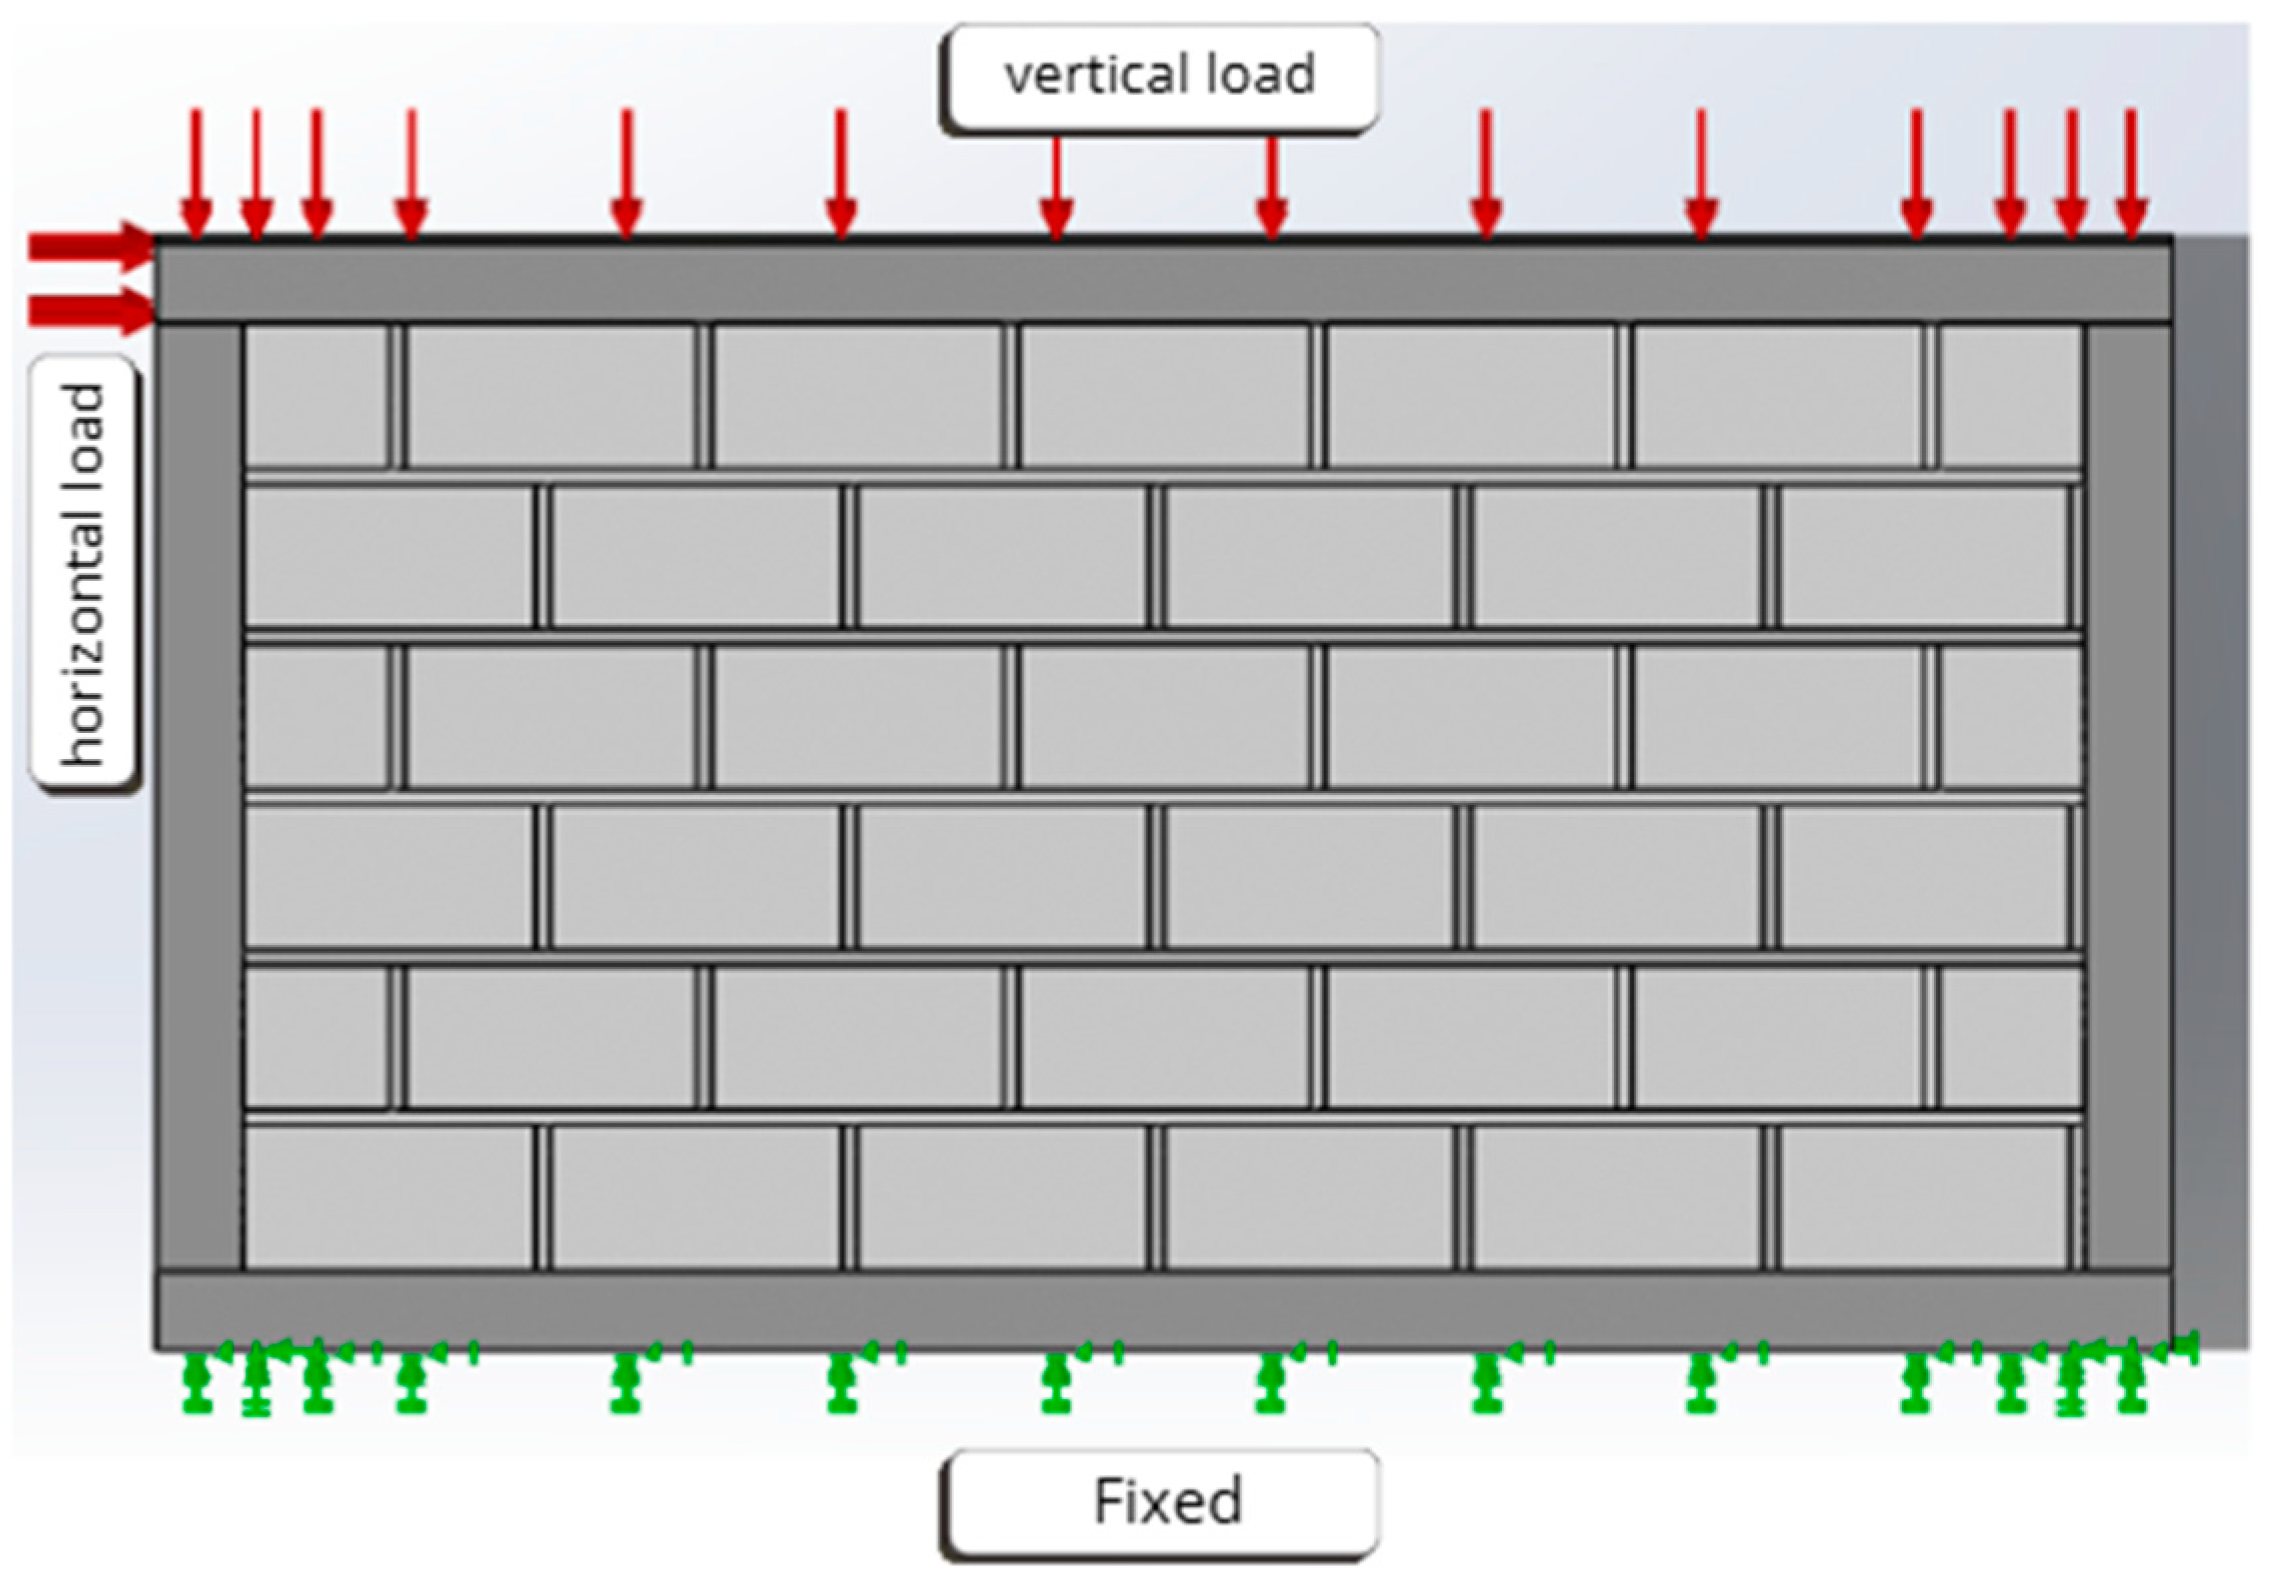
- Case of the traditional wall
- Case of the new wall model
- Case of the traditional wall
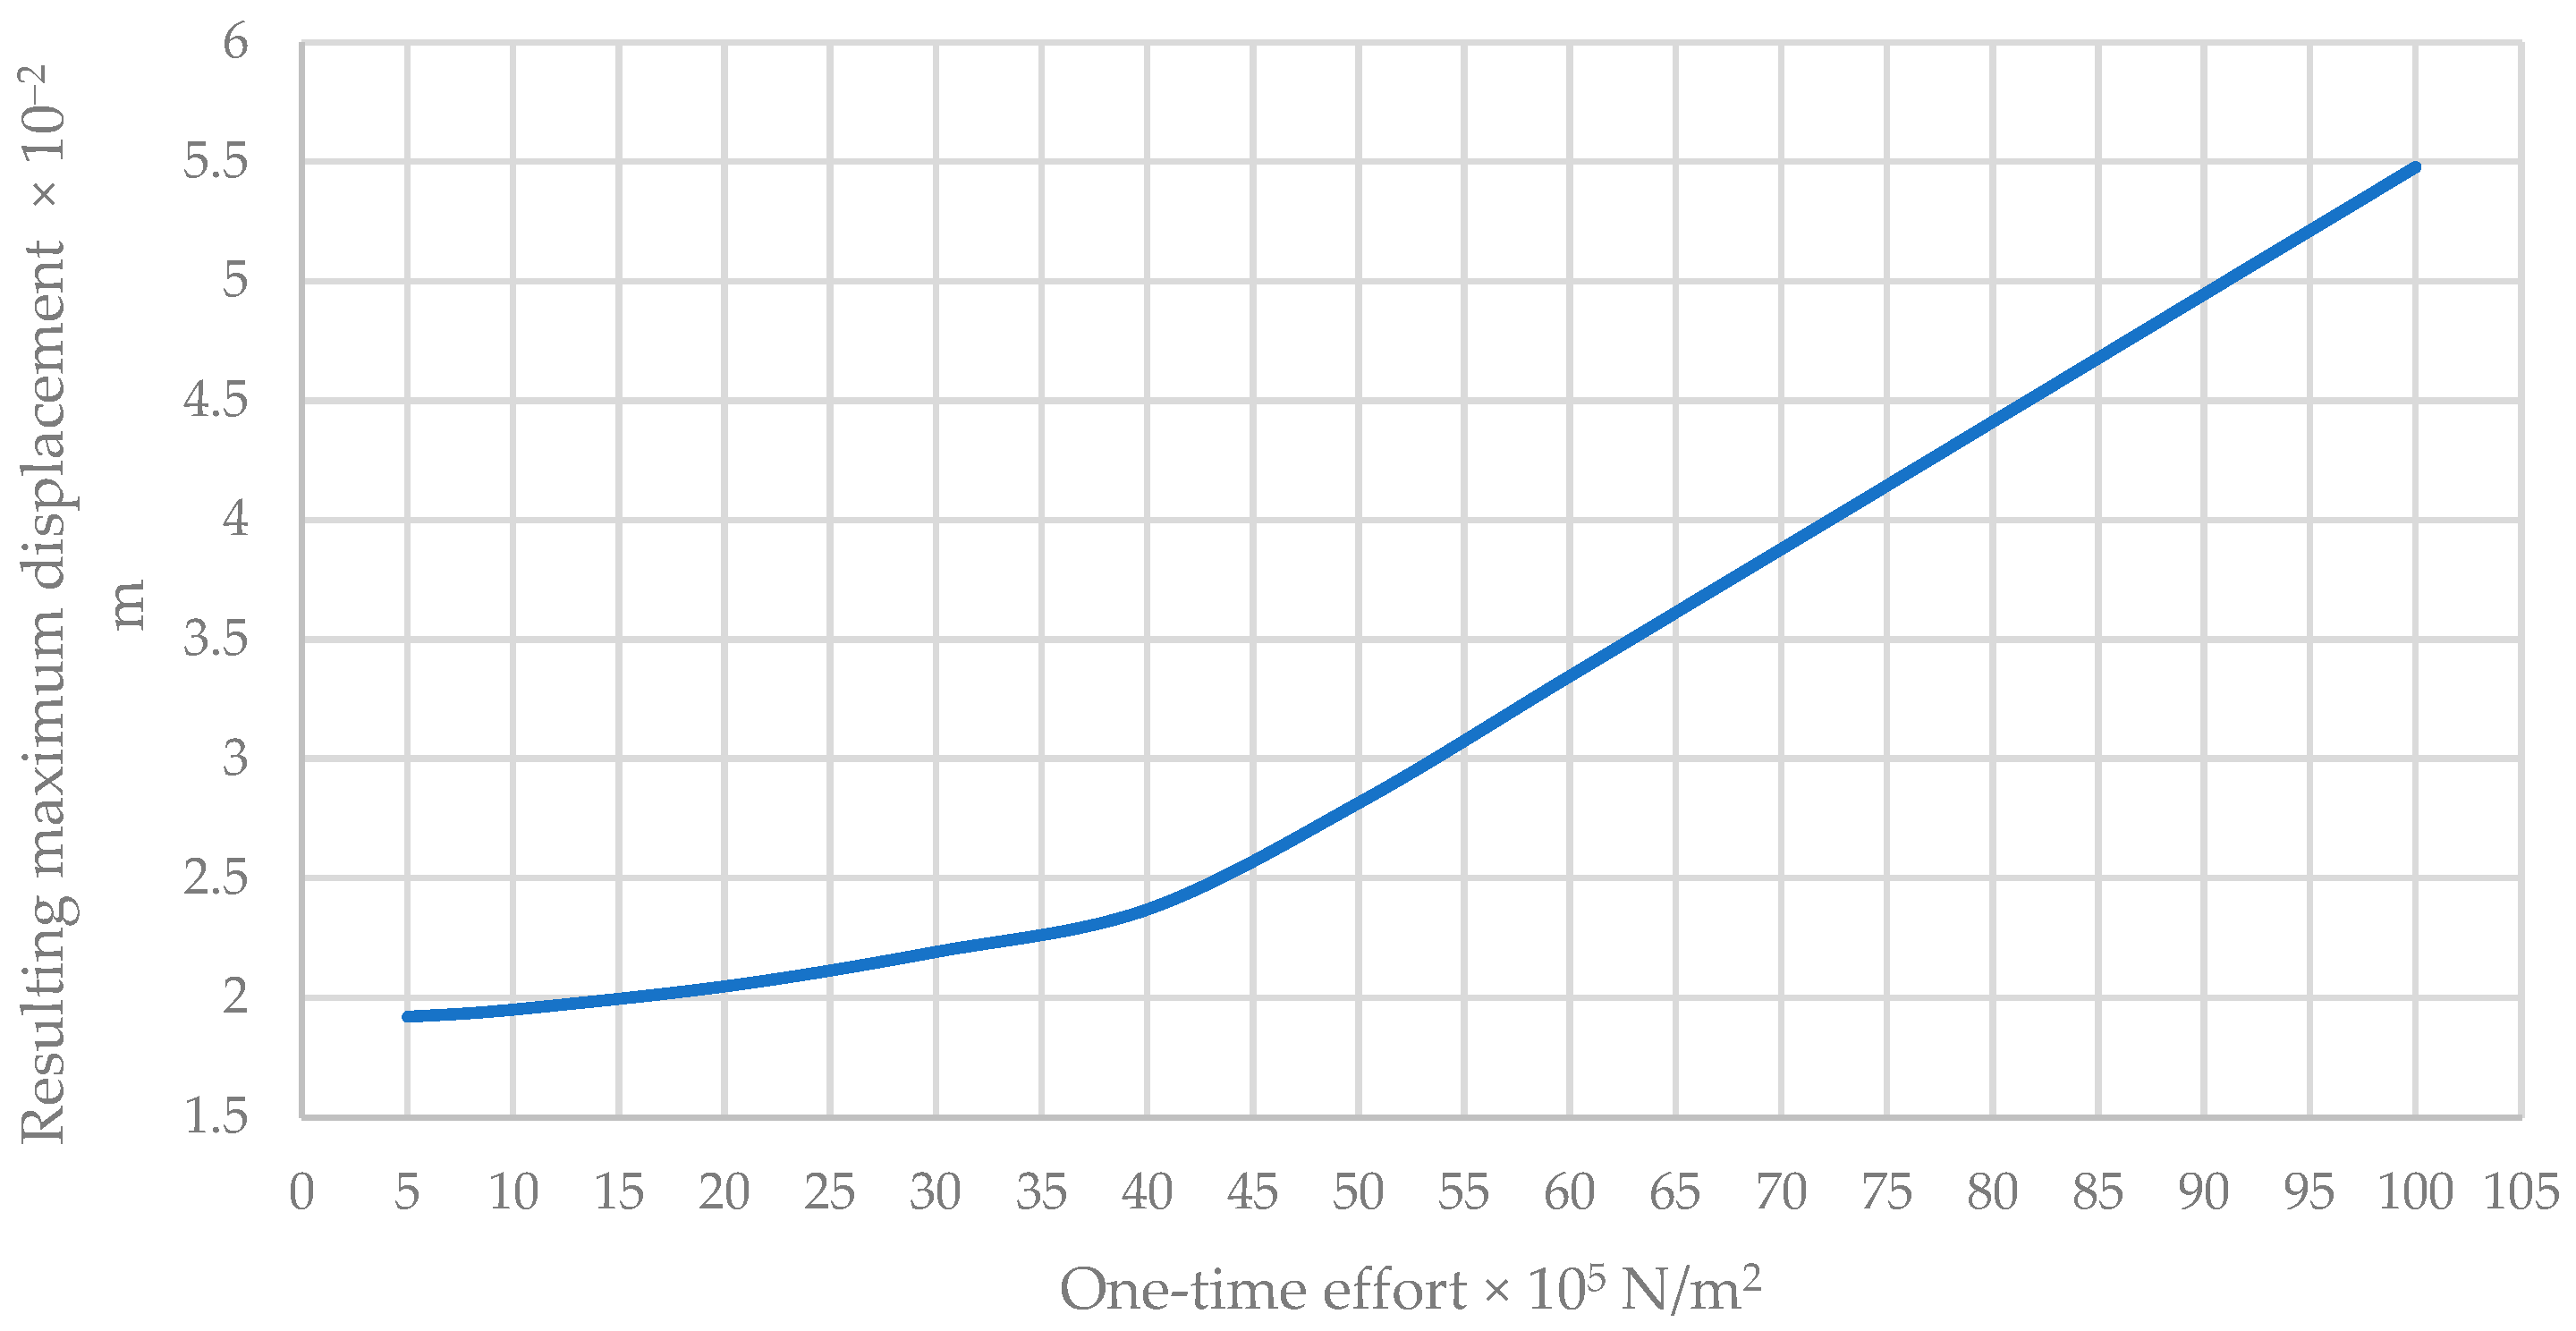
Maximum Resulting Displacement of the New Wall Model
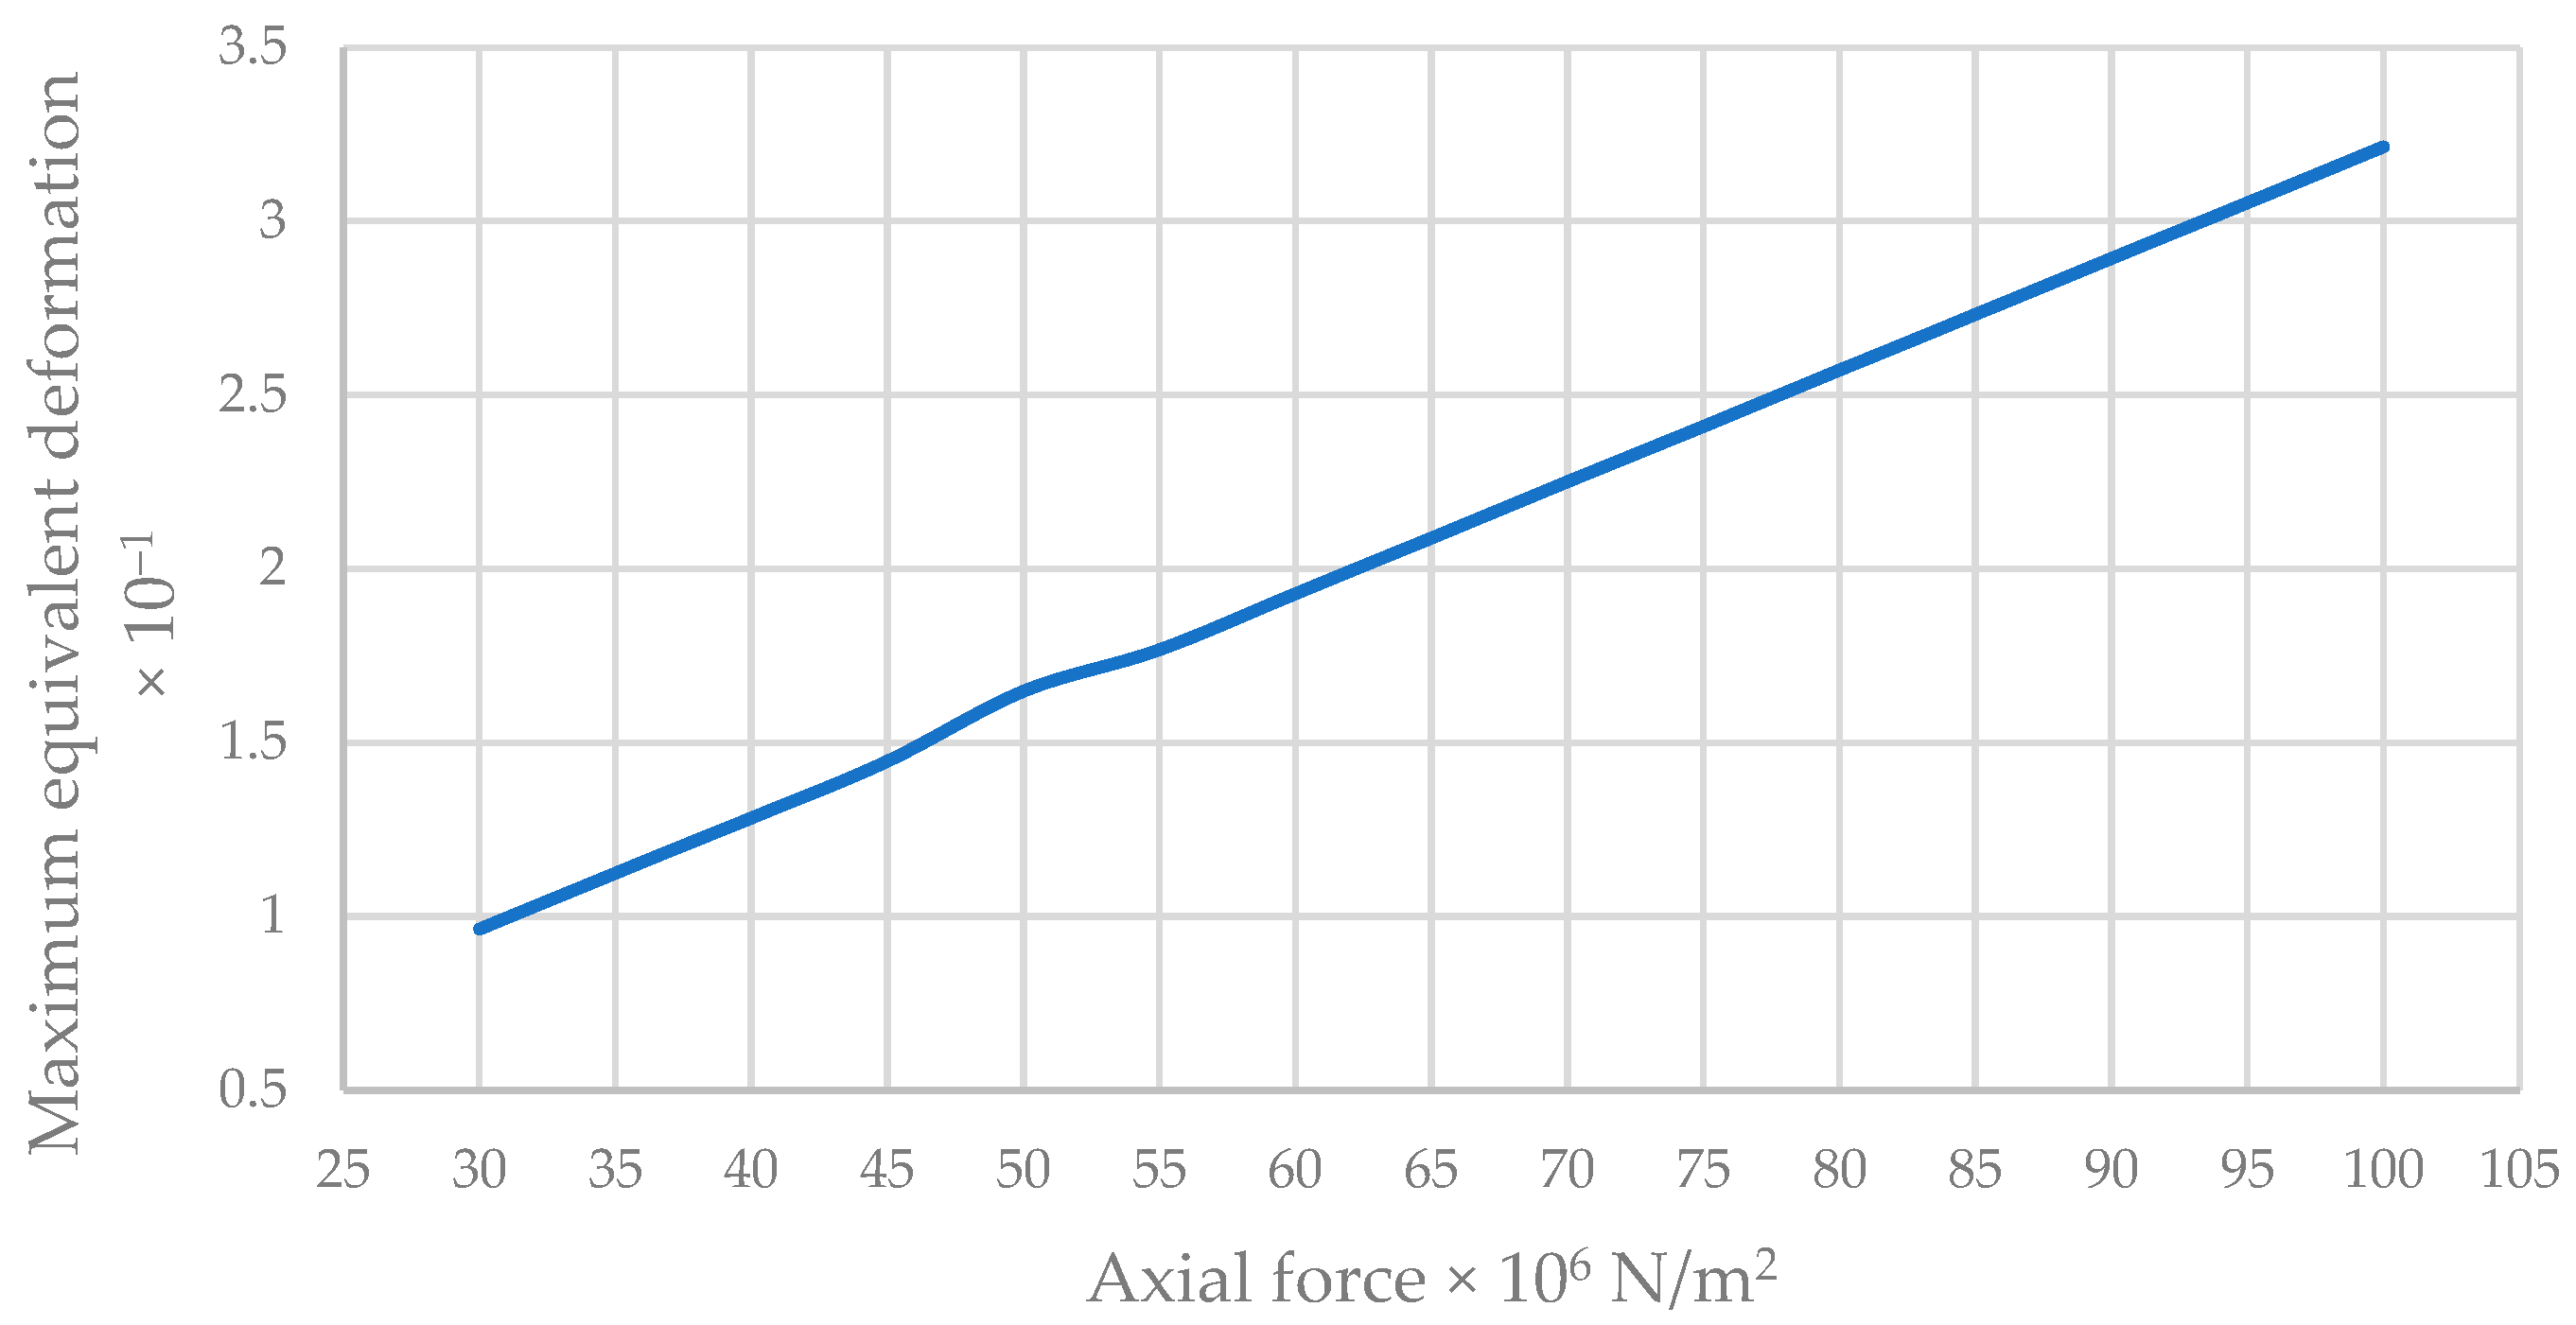
Maximum Equivalent Deformation of the New Wall Model
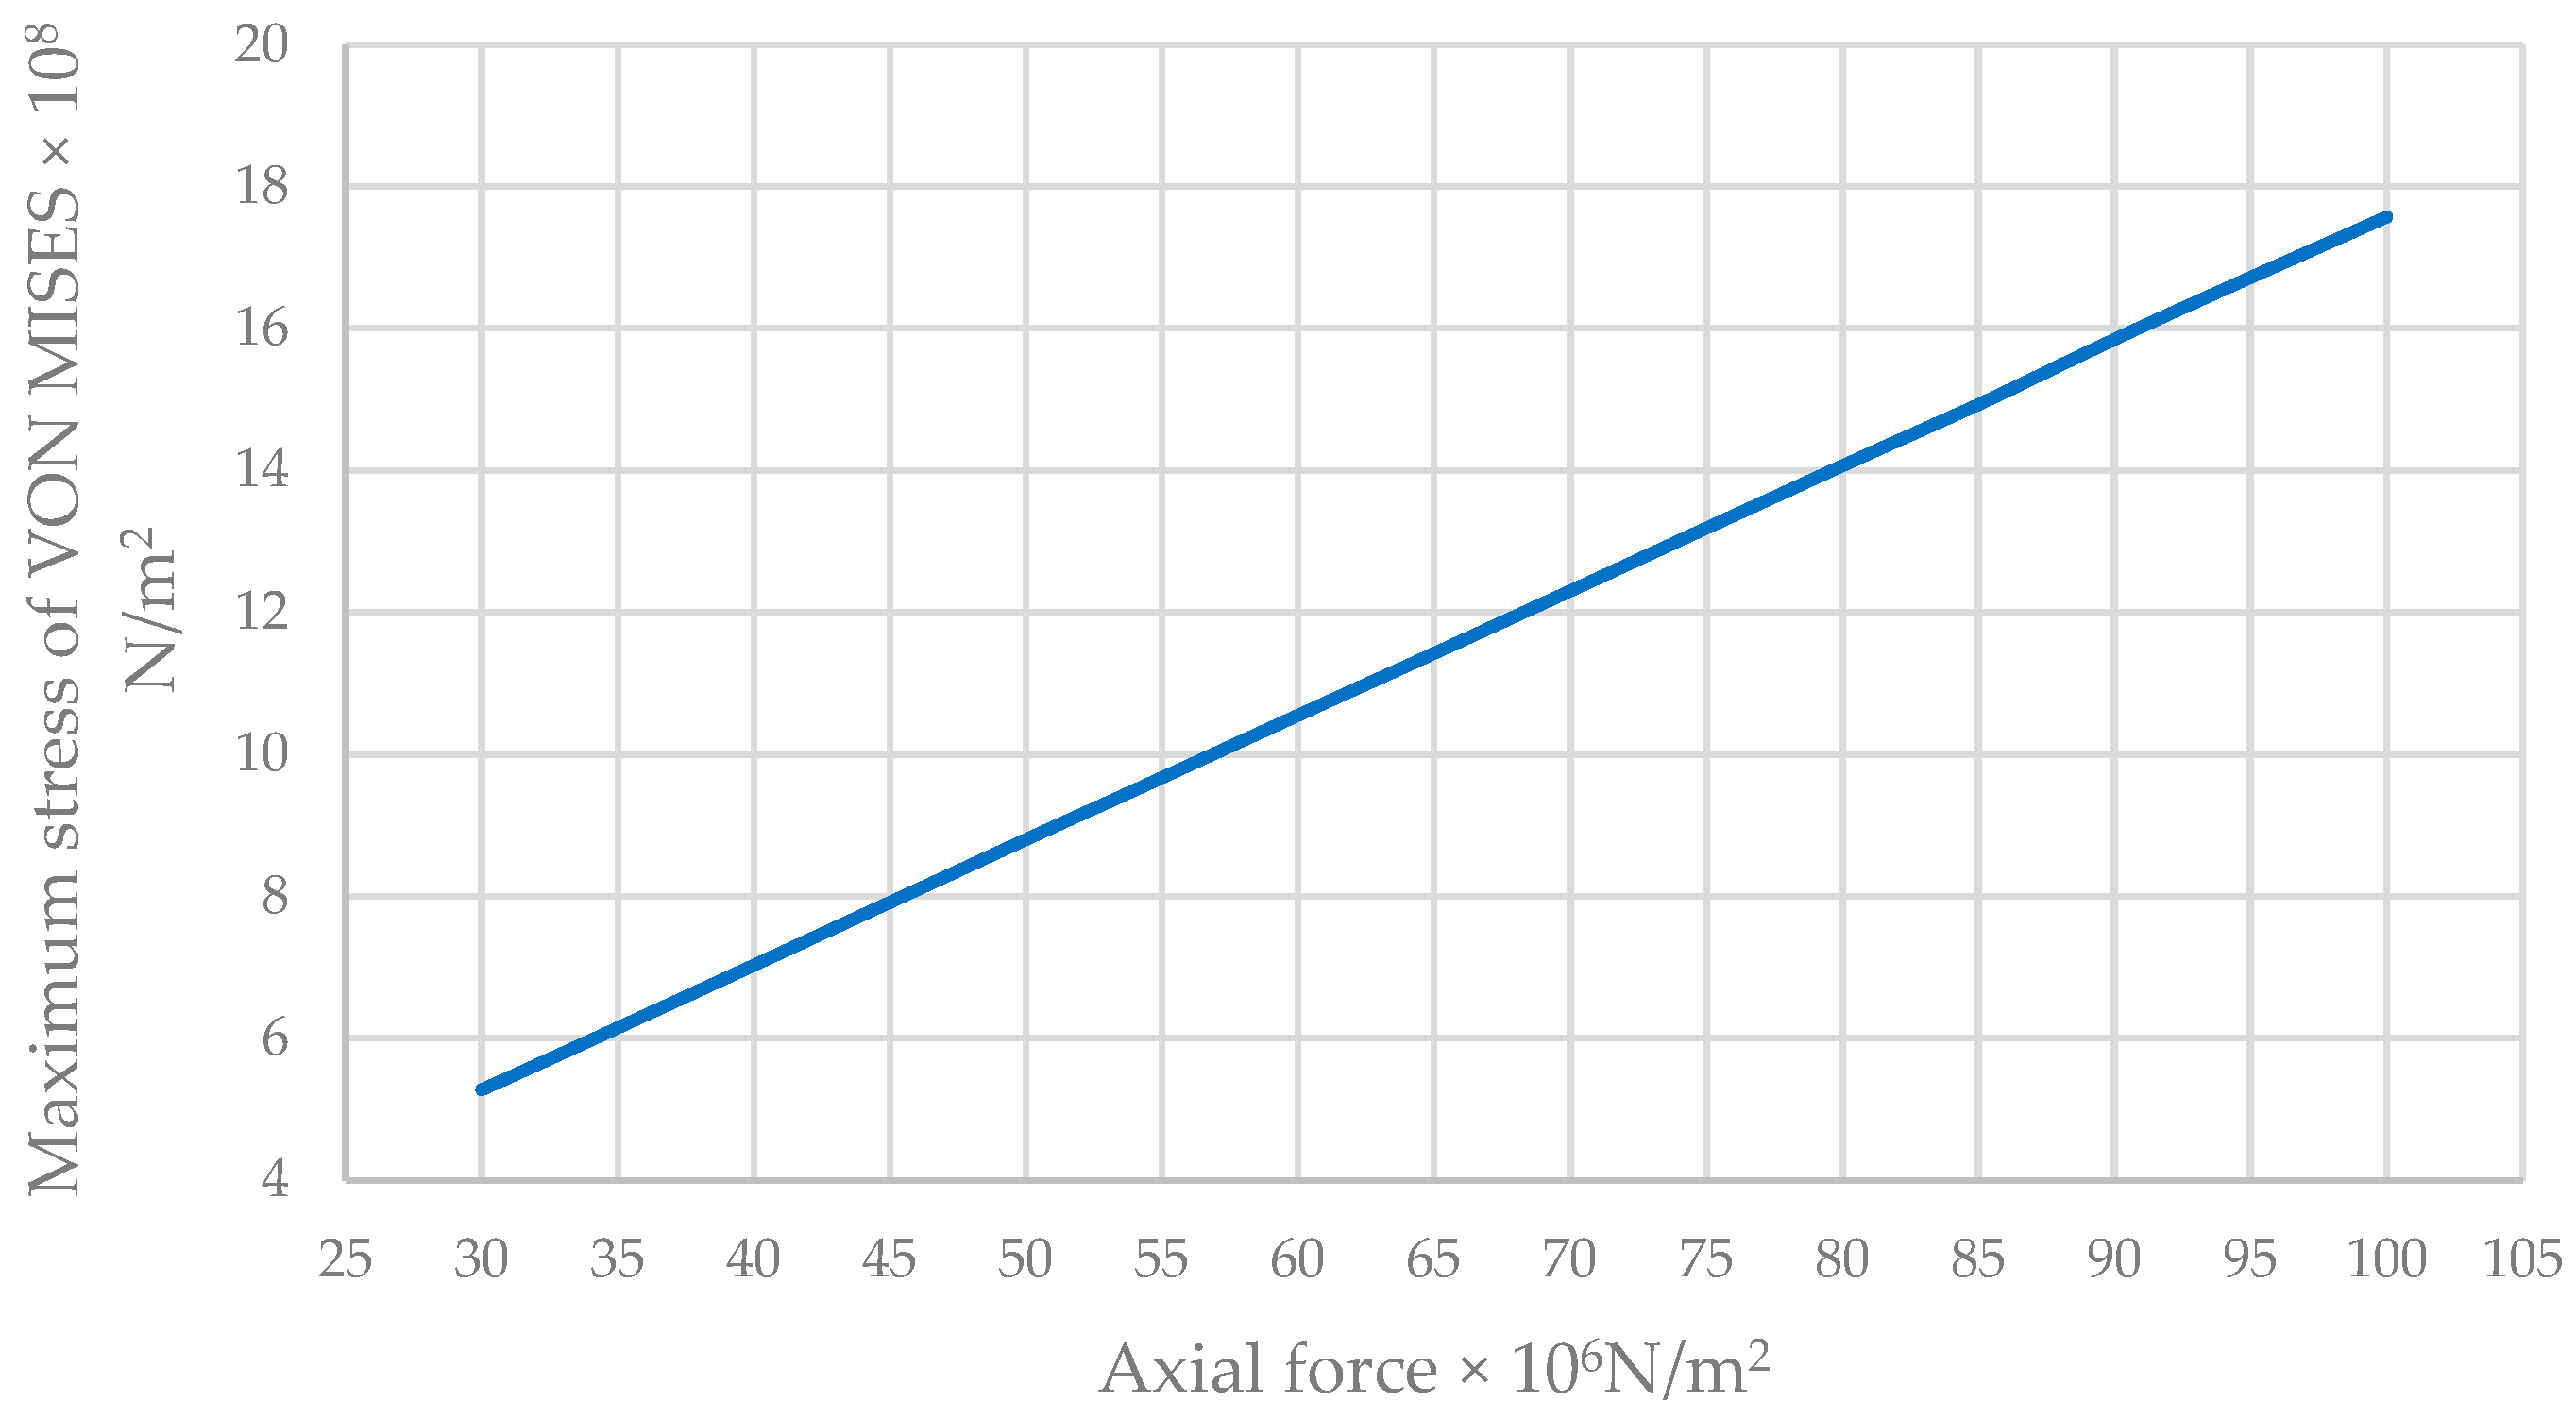
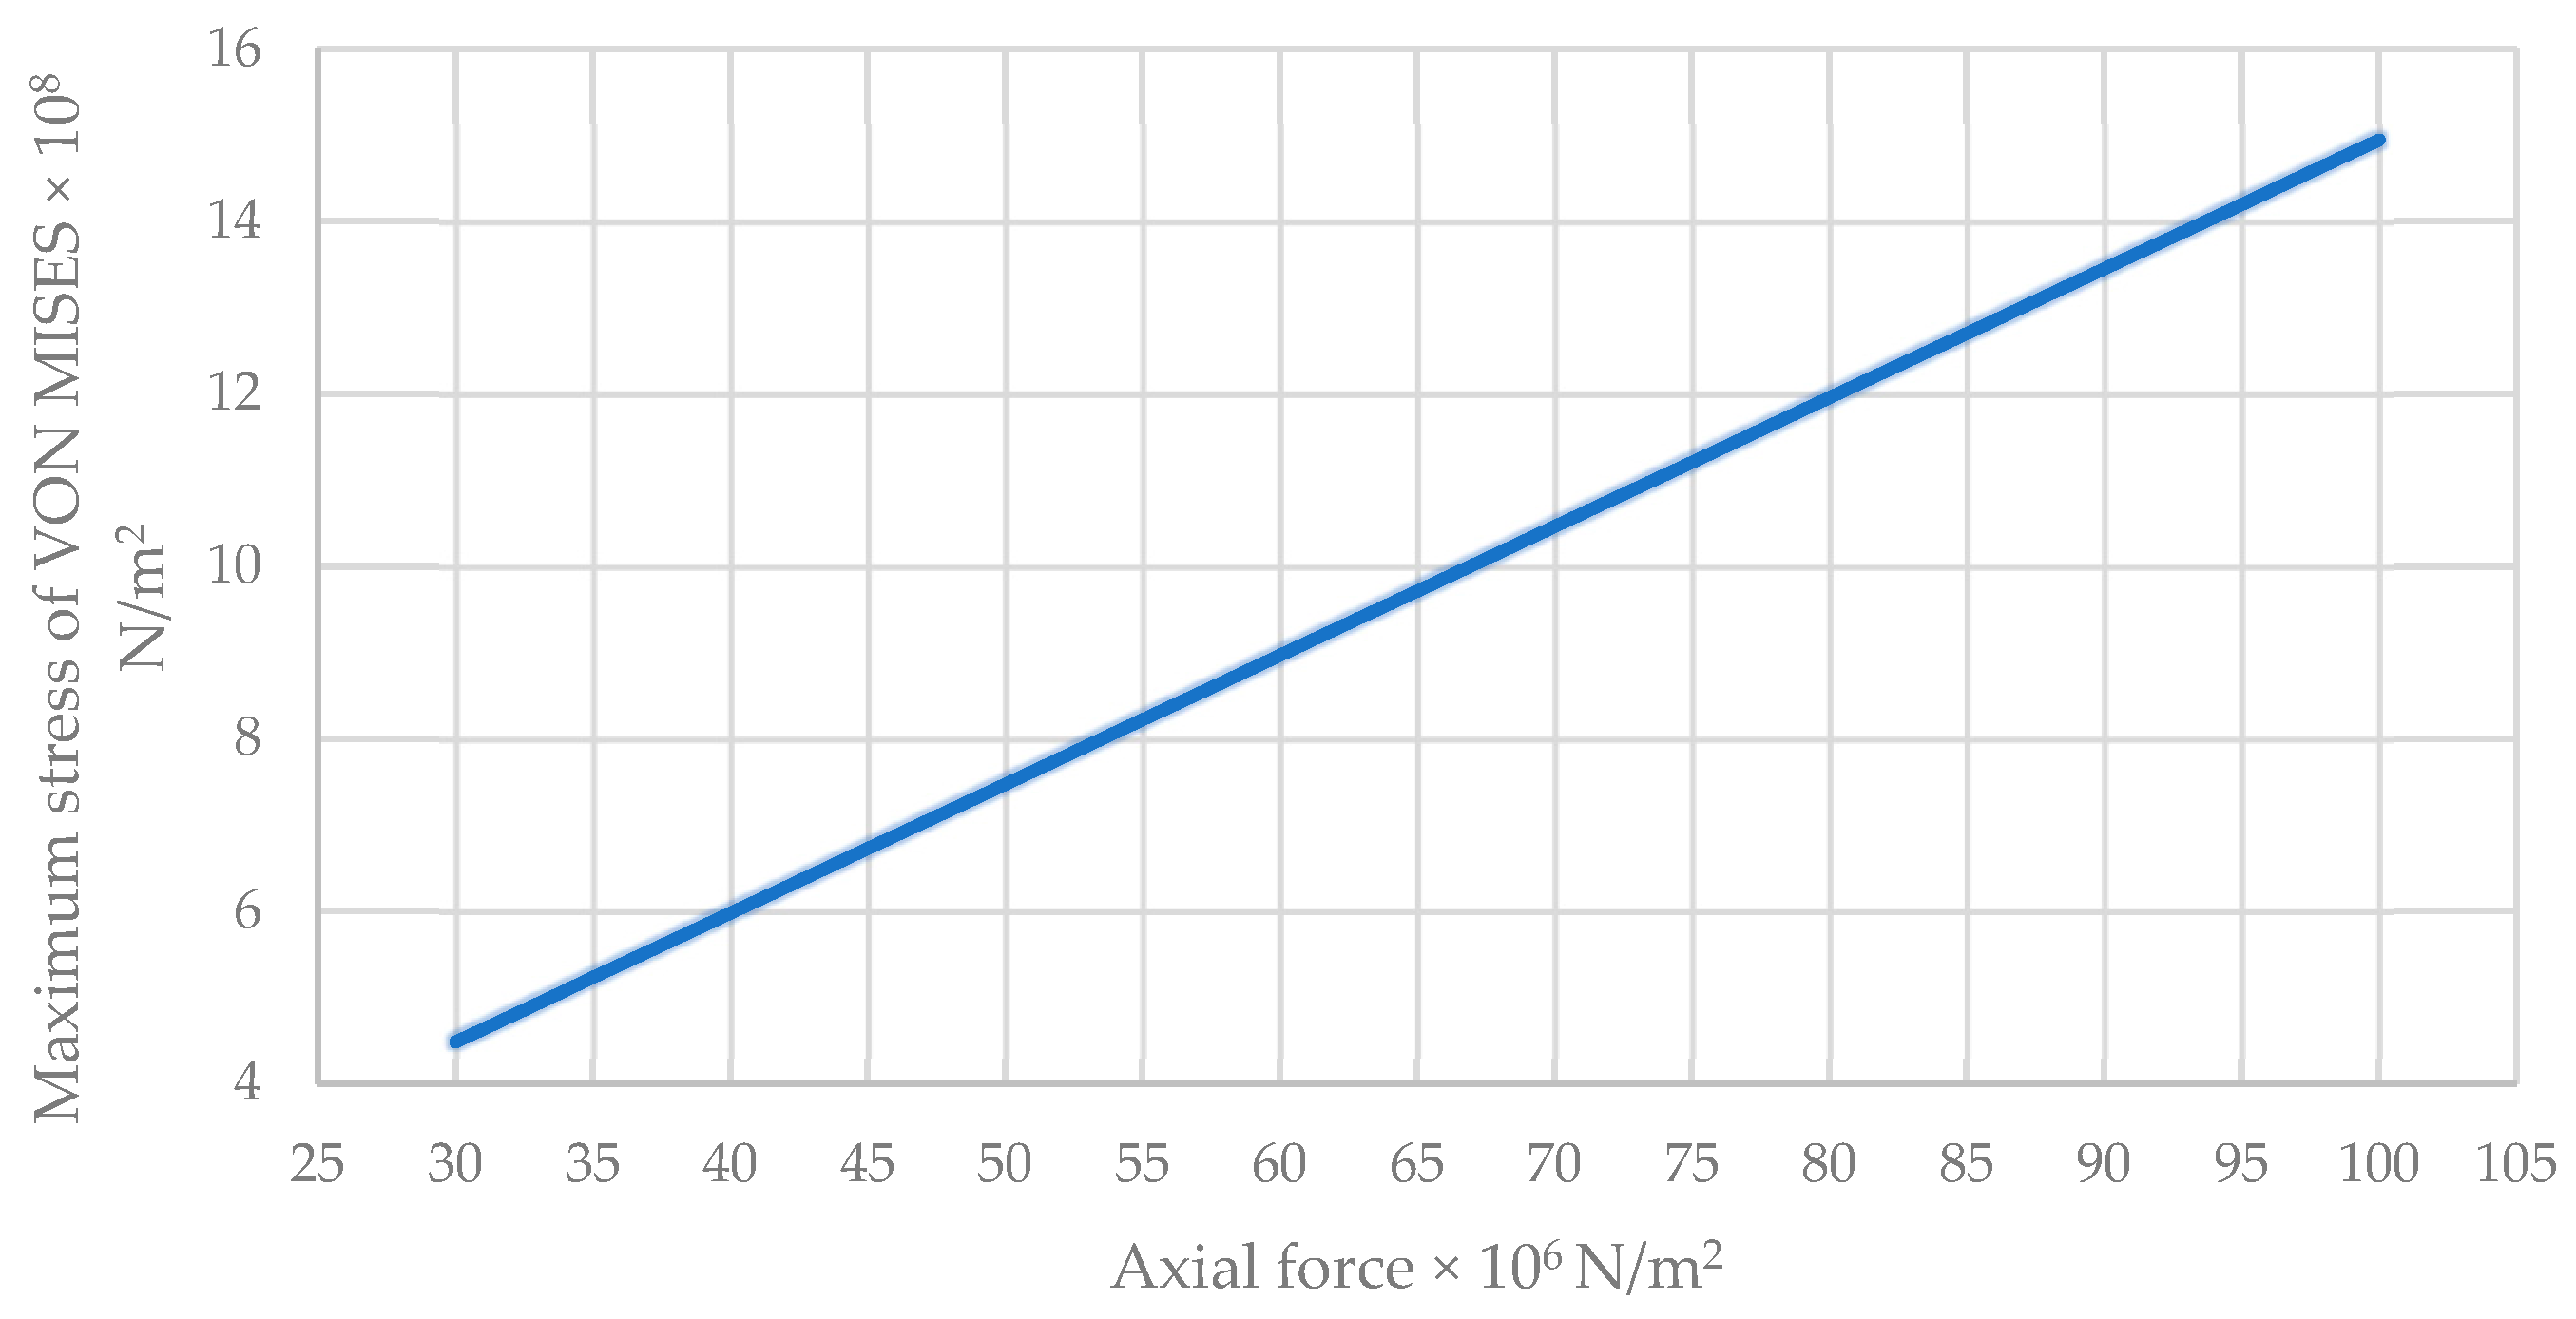
Maximum VON MISES Stress of the Traditional Wall
Maximum Resulting Displacement of the Traditional Wall
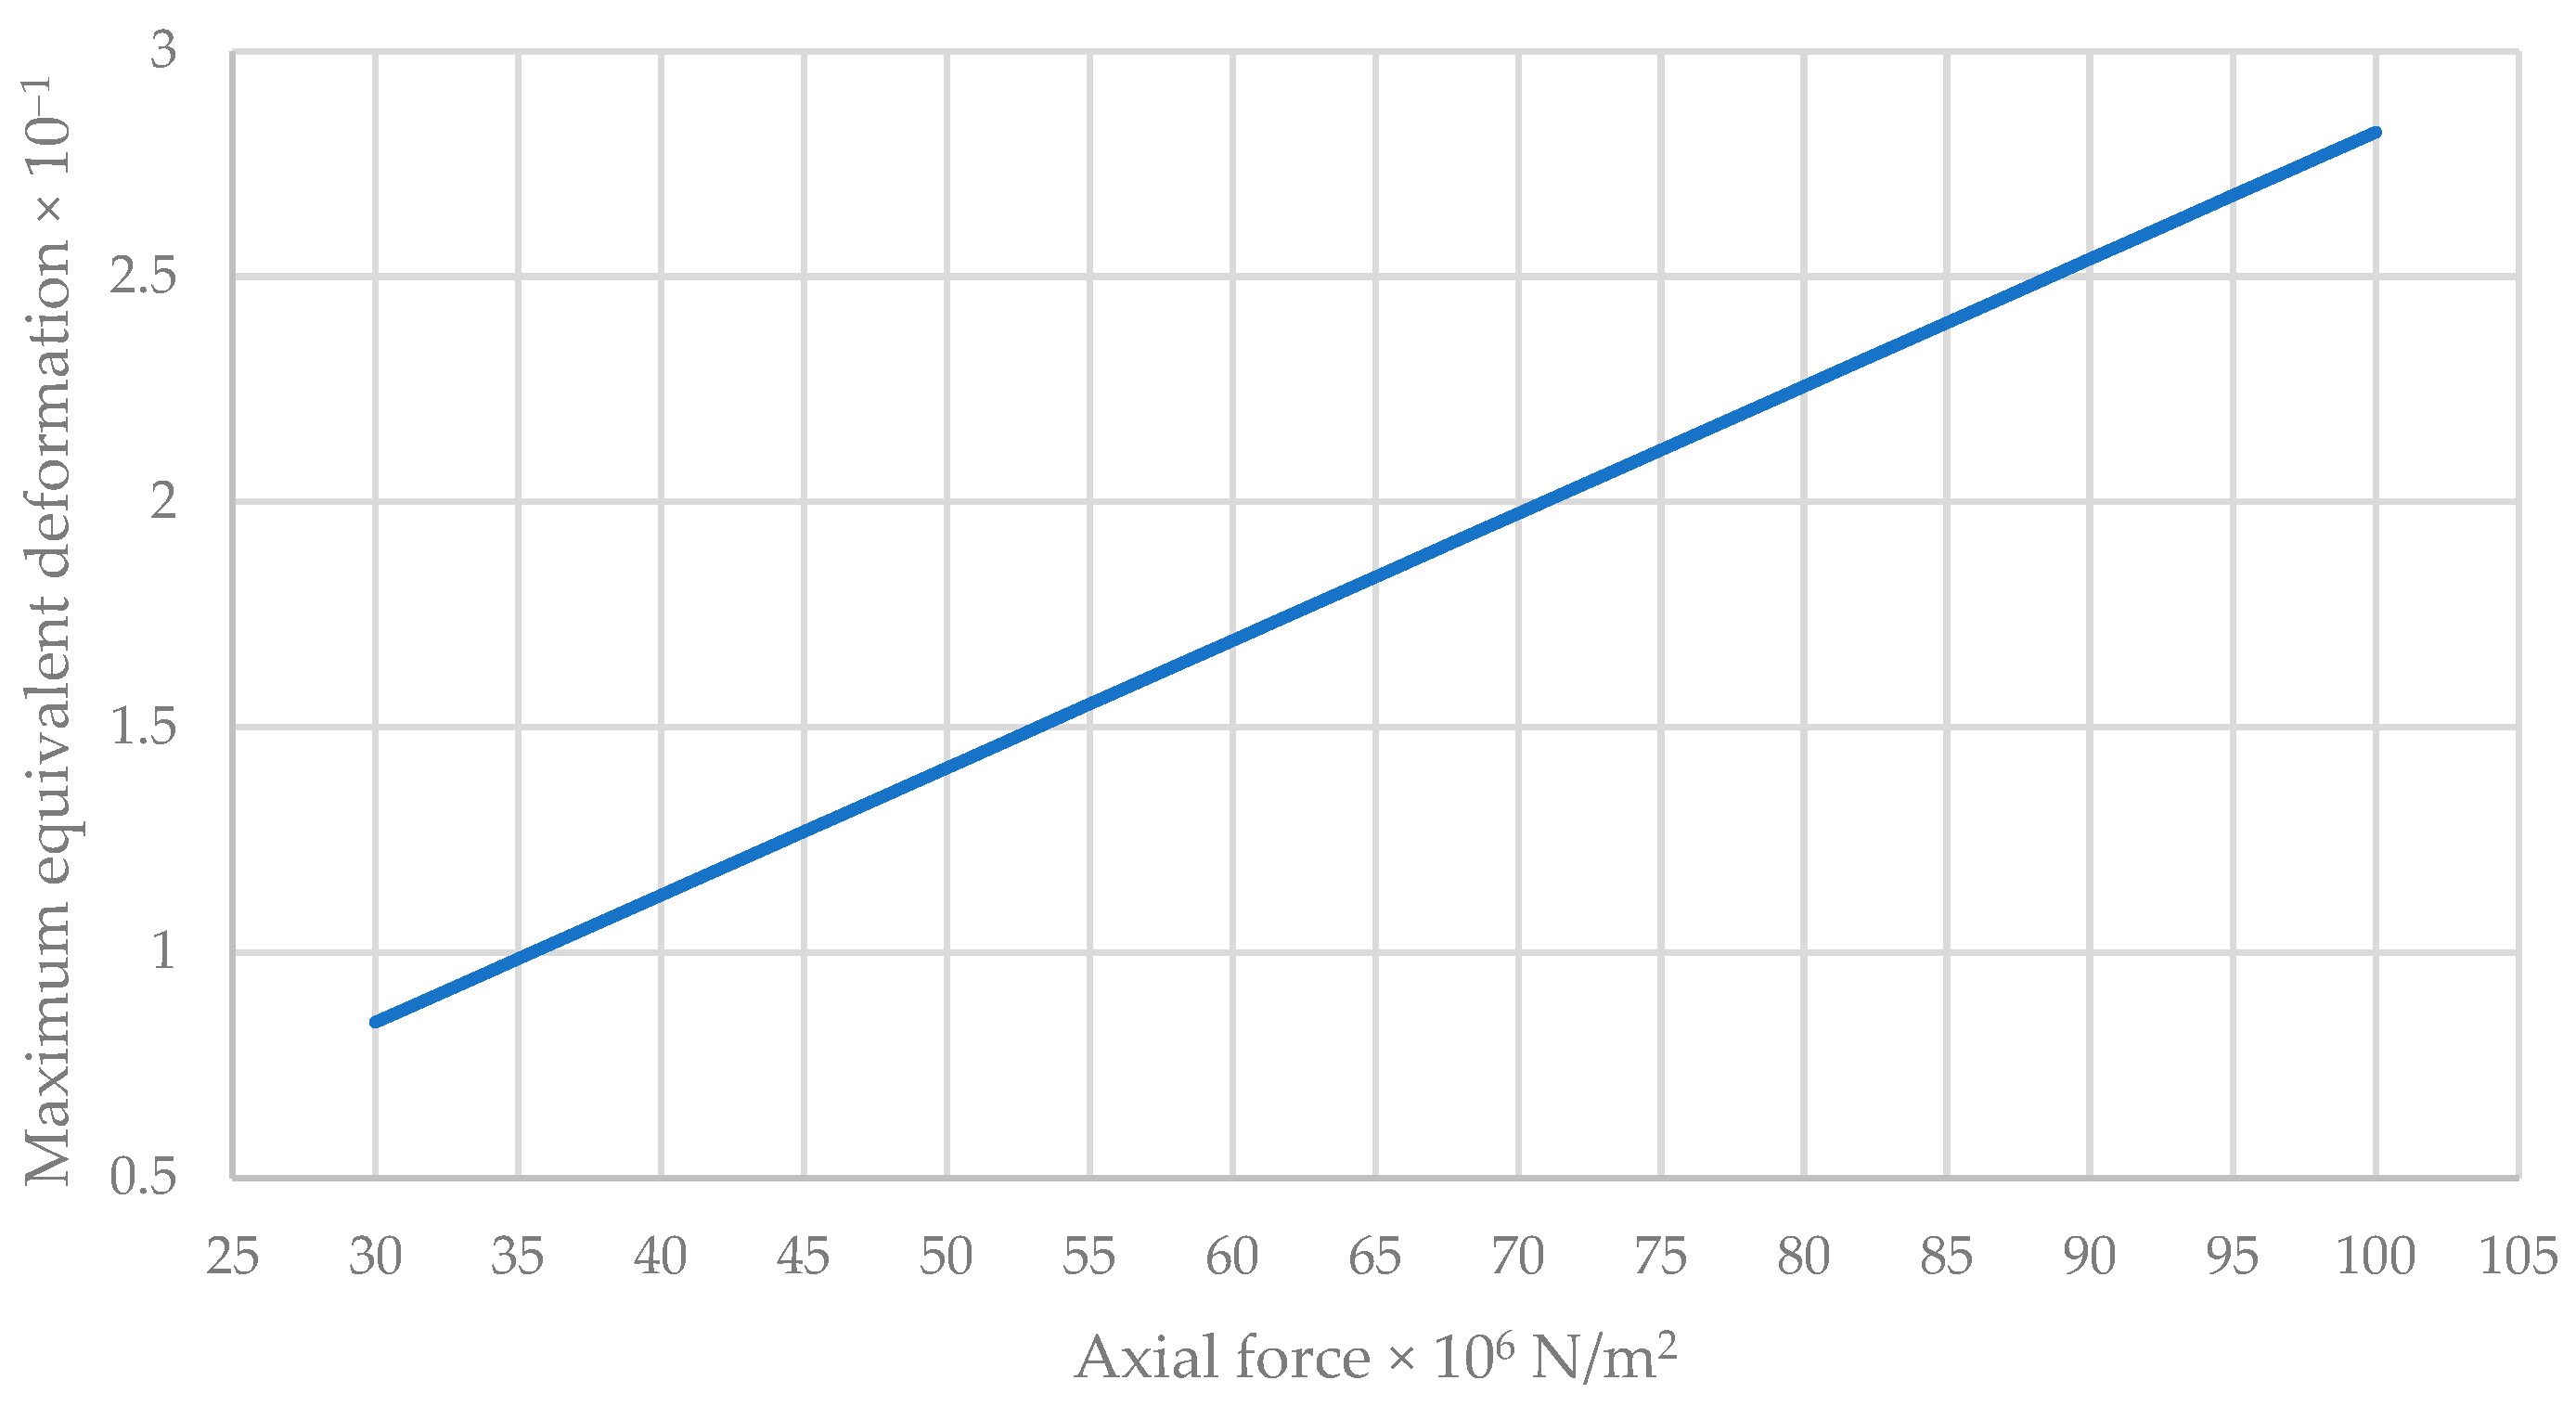
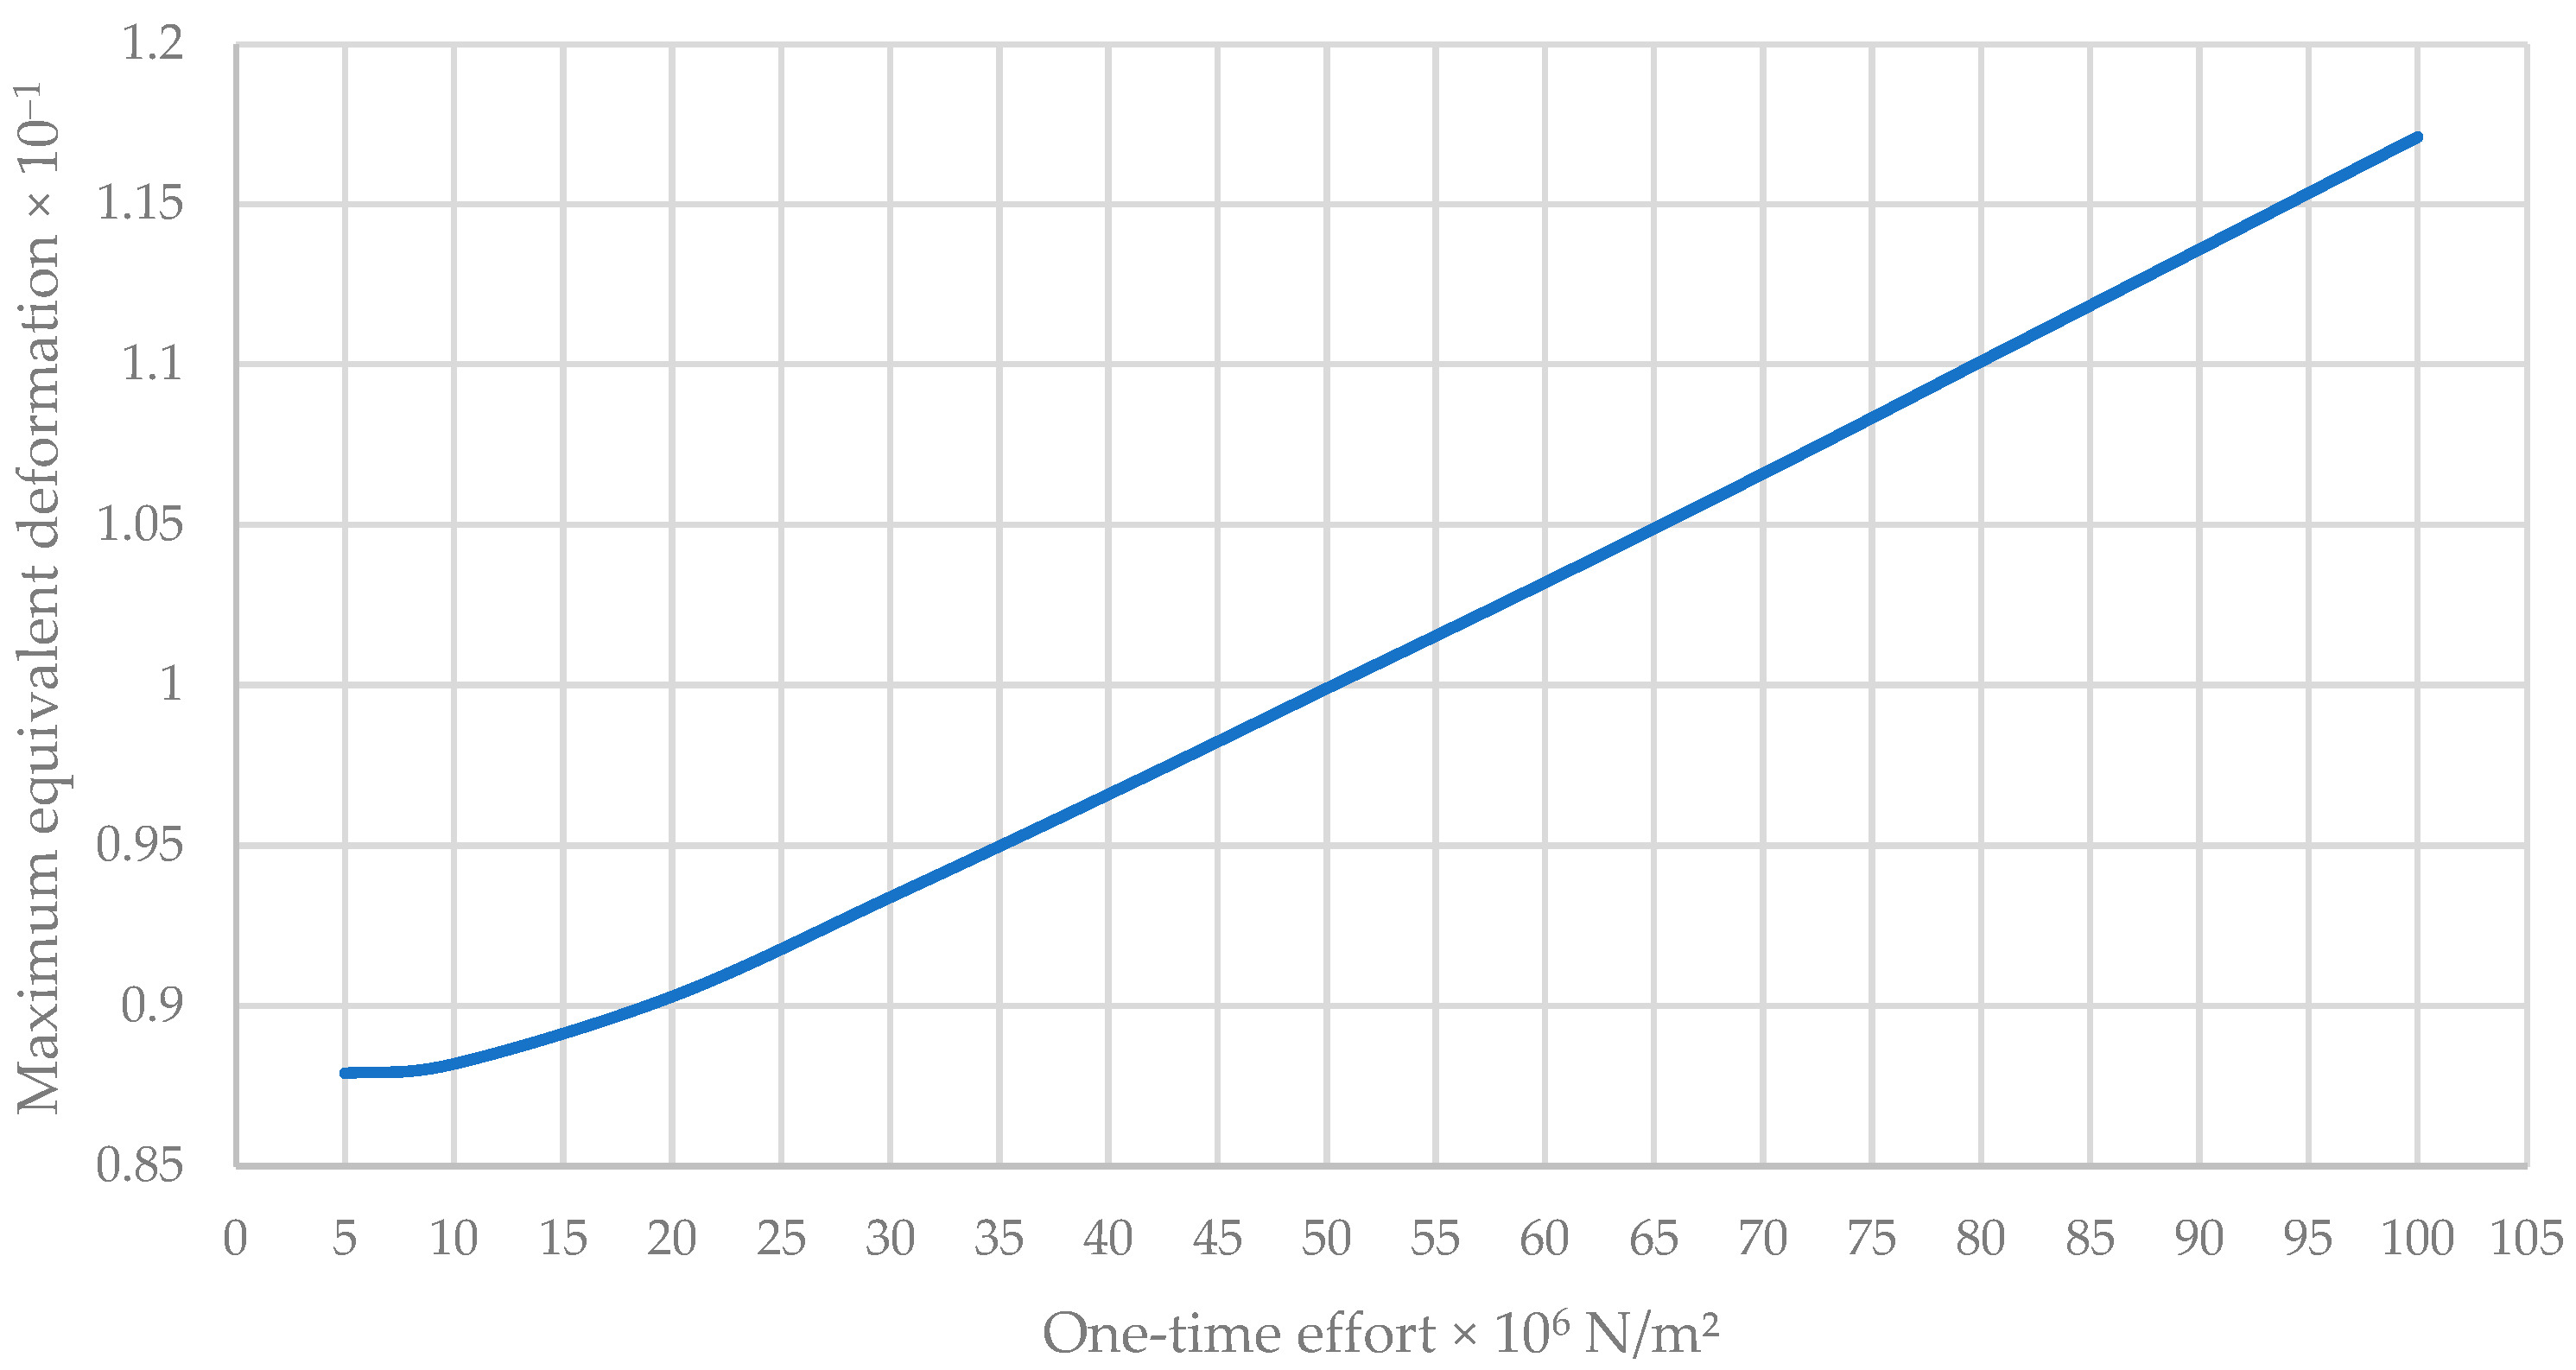
Maximum Equivalent Deformation of the Traditional Wall
3.1.2. Simulation of the Walls Under a Vertical Load and a Horizontal Point Load Applied on an Agglomerate
- Case of the new wall model
- Case of the traditional wall
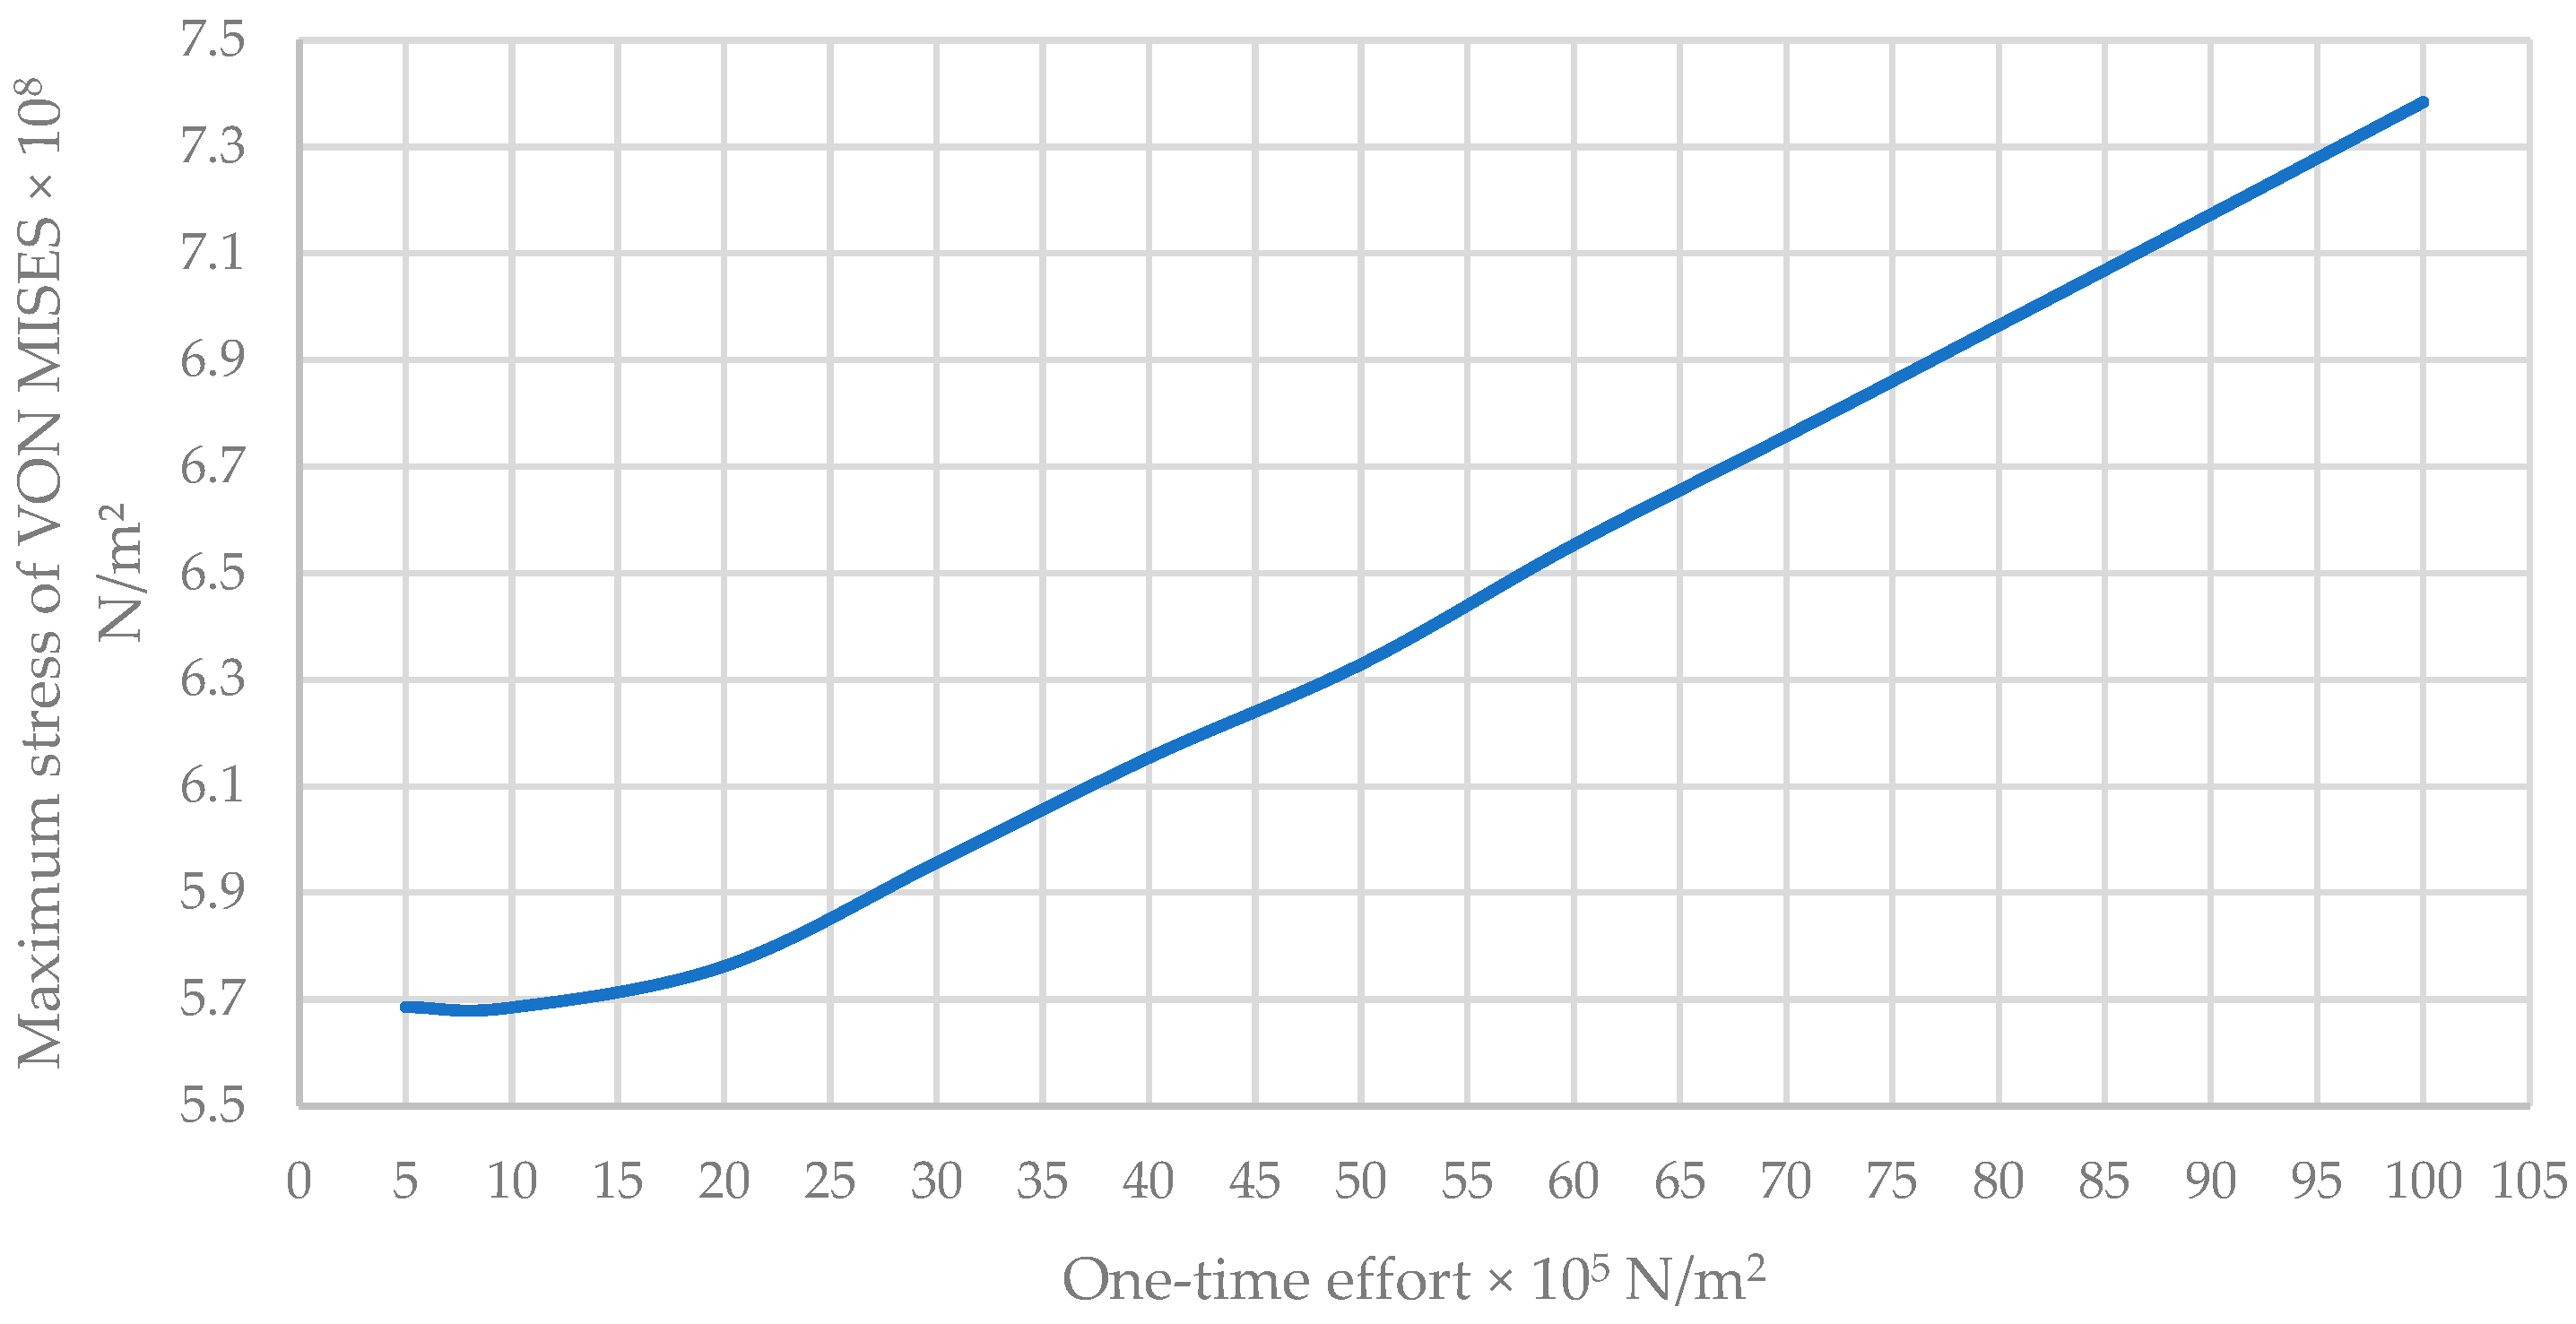
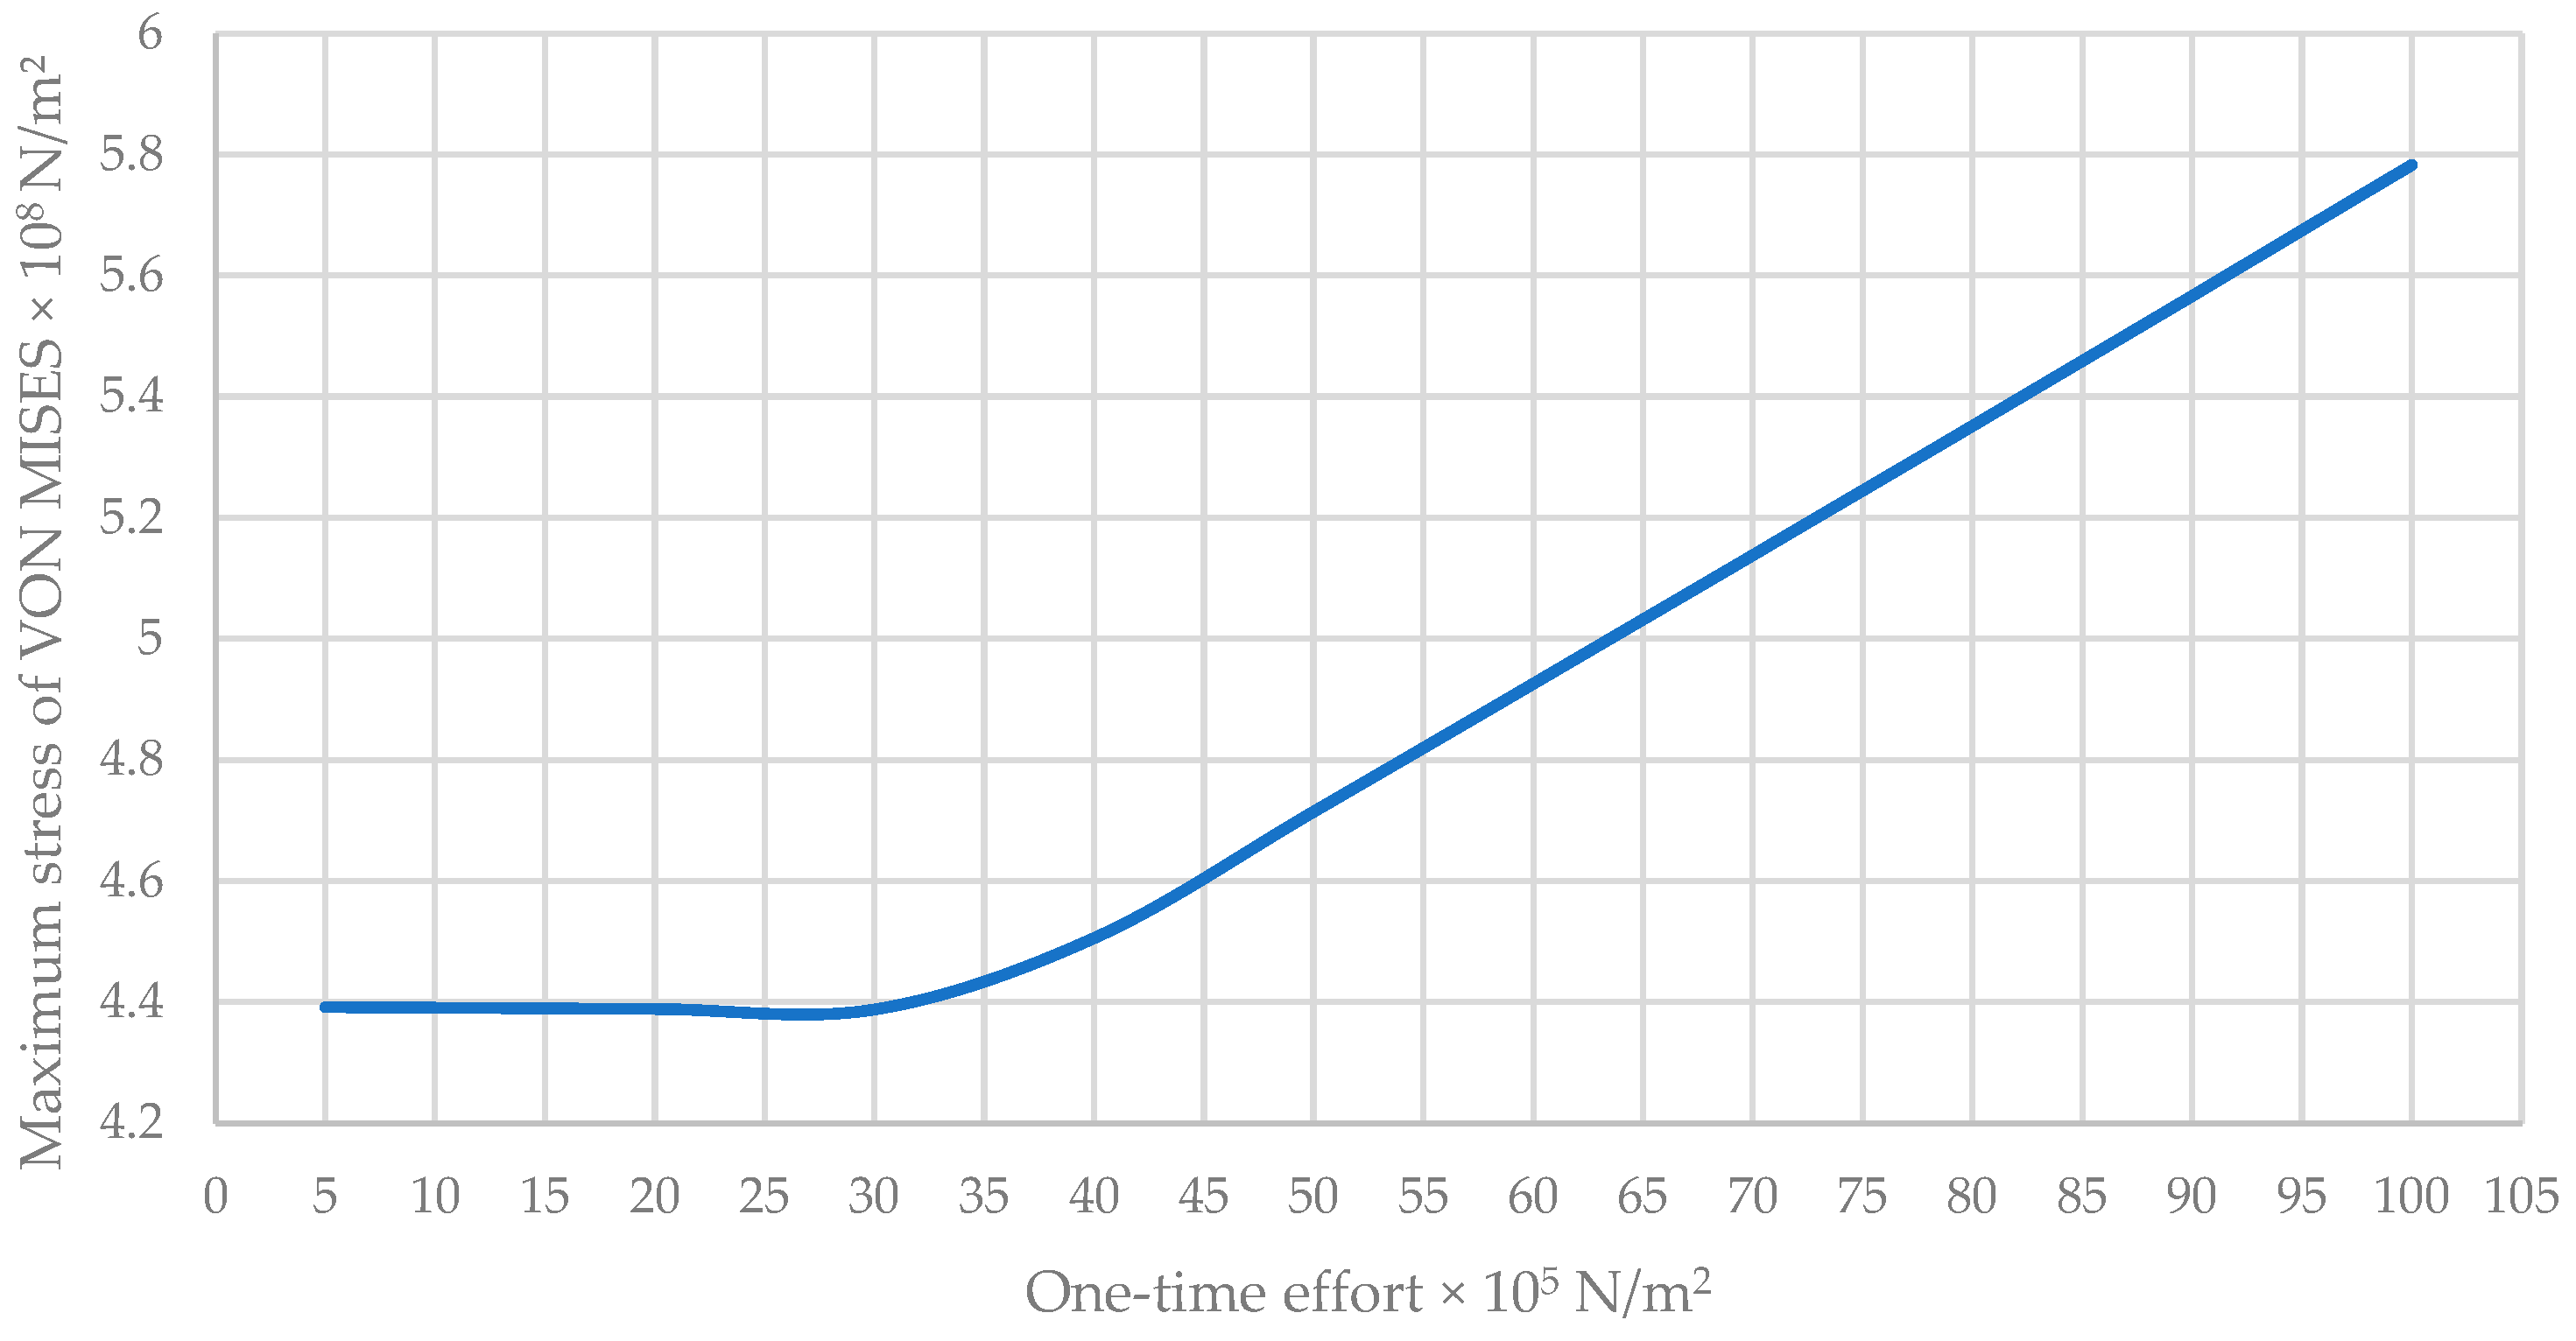
Maximum VON MISES Stress of the New Wall Model
Maximum Resulting Displacement of the New Wall Model
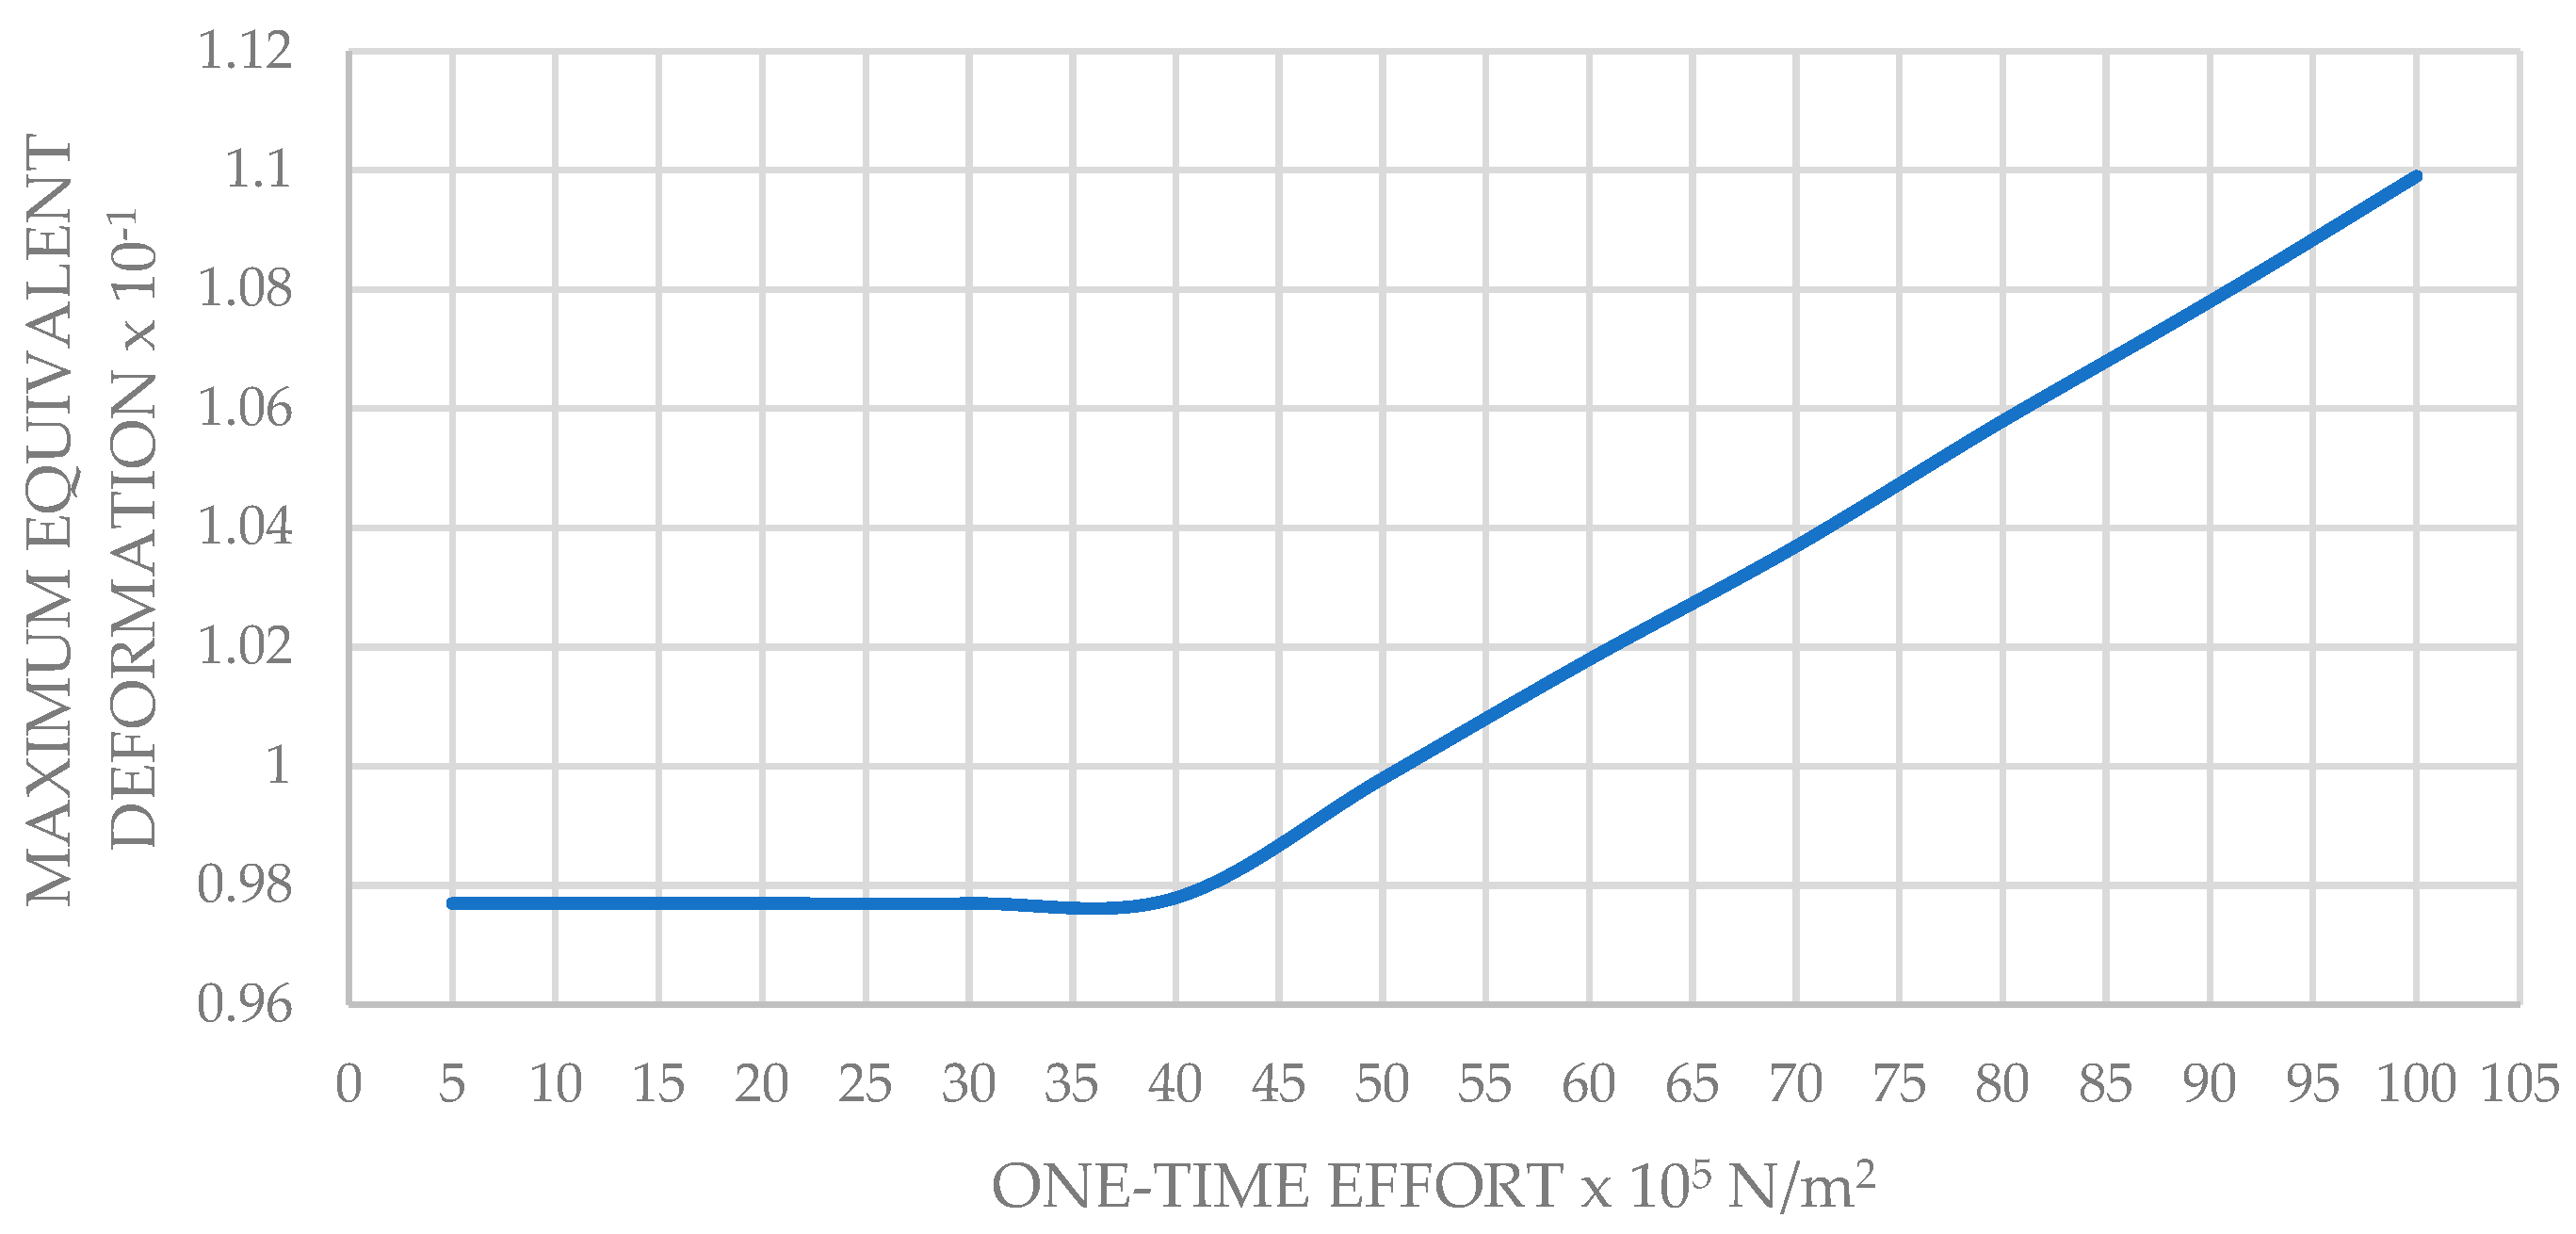
Maximum Equivalent Deformation of the New Wall Model
Maximum VON MISES Stress of the Traditional Wall
Maximum Resulting Displacement of the Traditional Wall
Maximum Equivalent Deformation of the Traditional Wall
3.1.3. Simulation of the Walls Under Compound Loadings
- Case of the new wall model
- Case of the traditional wall
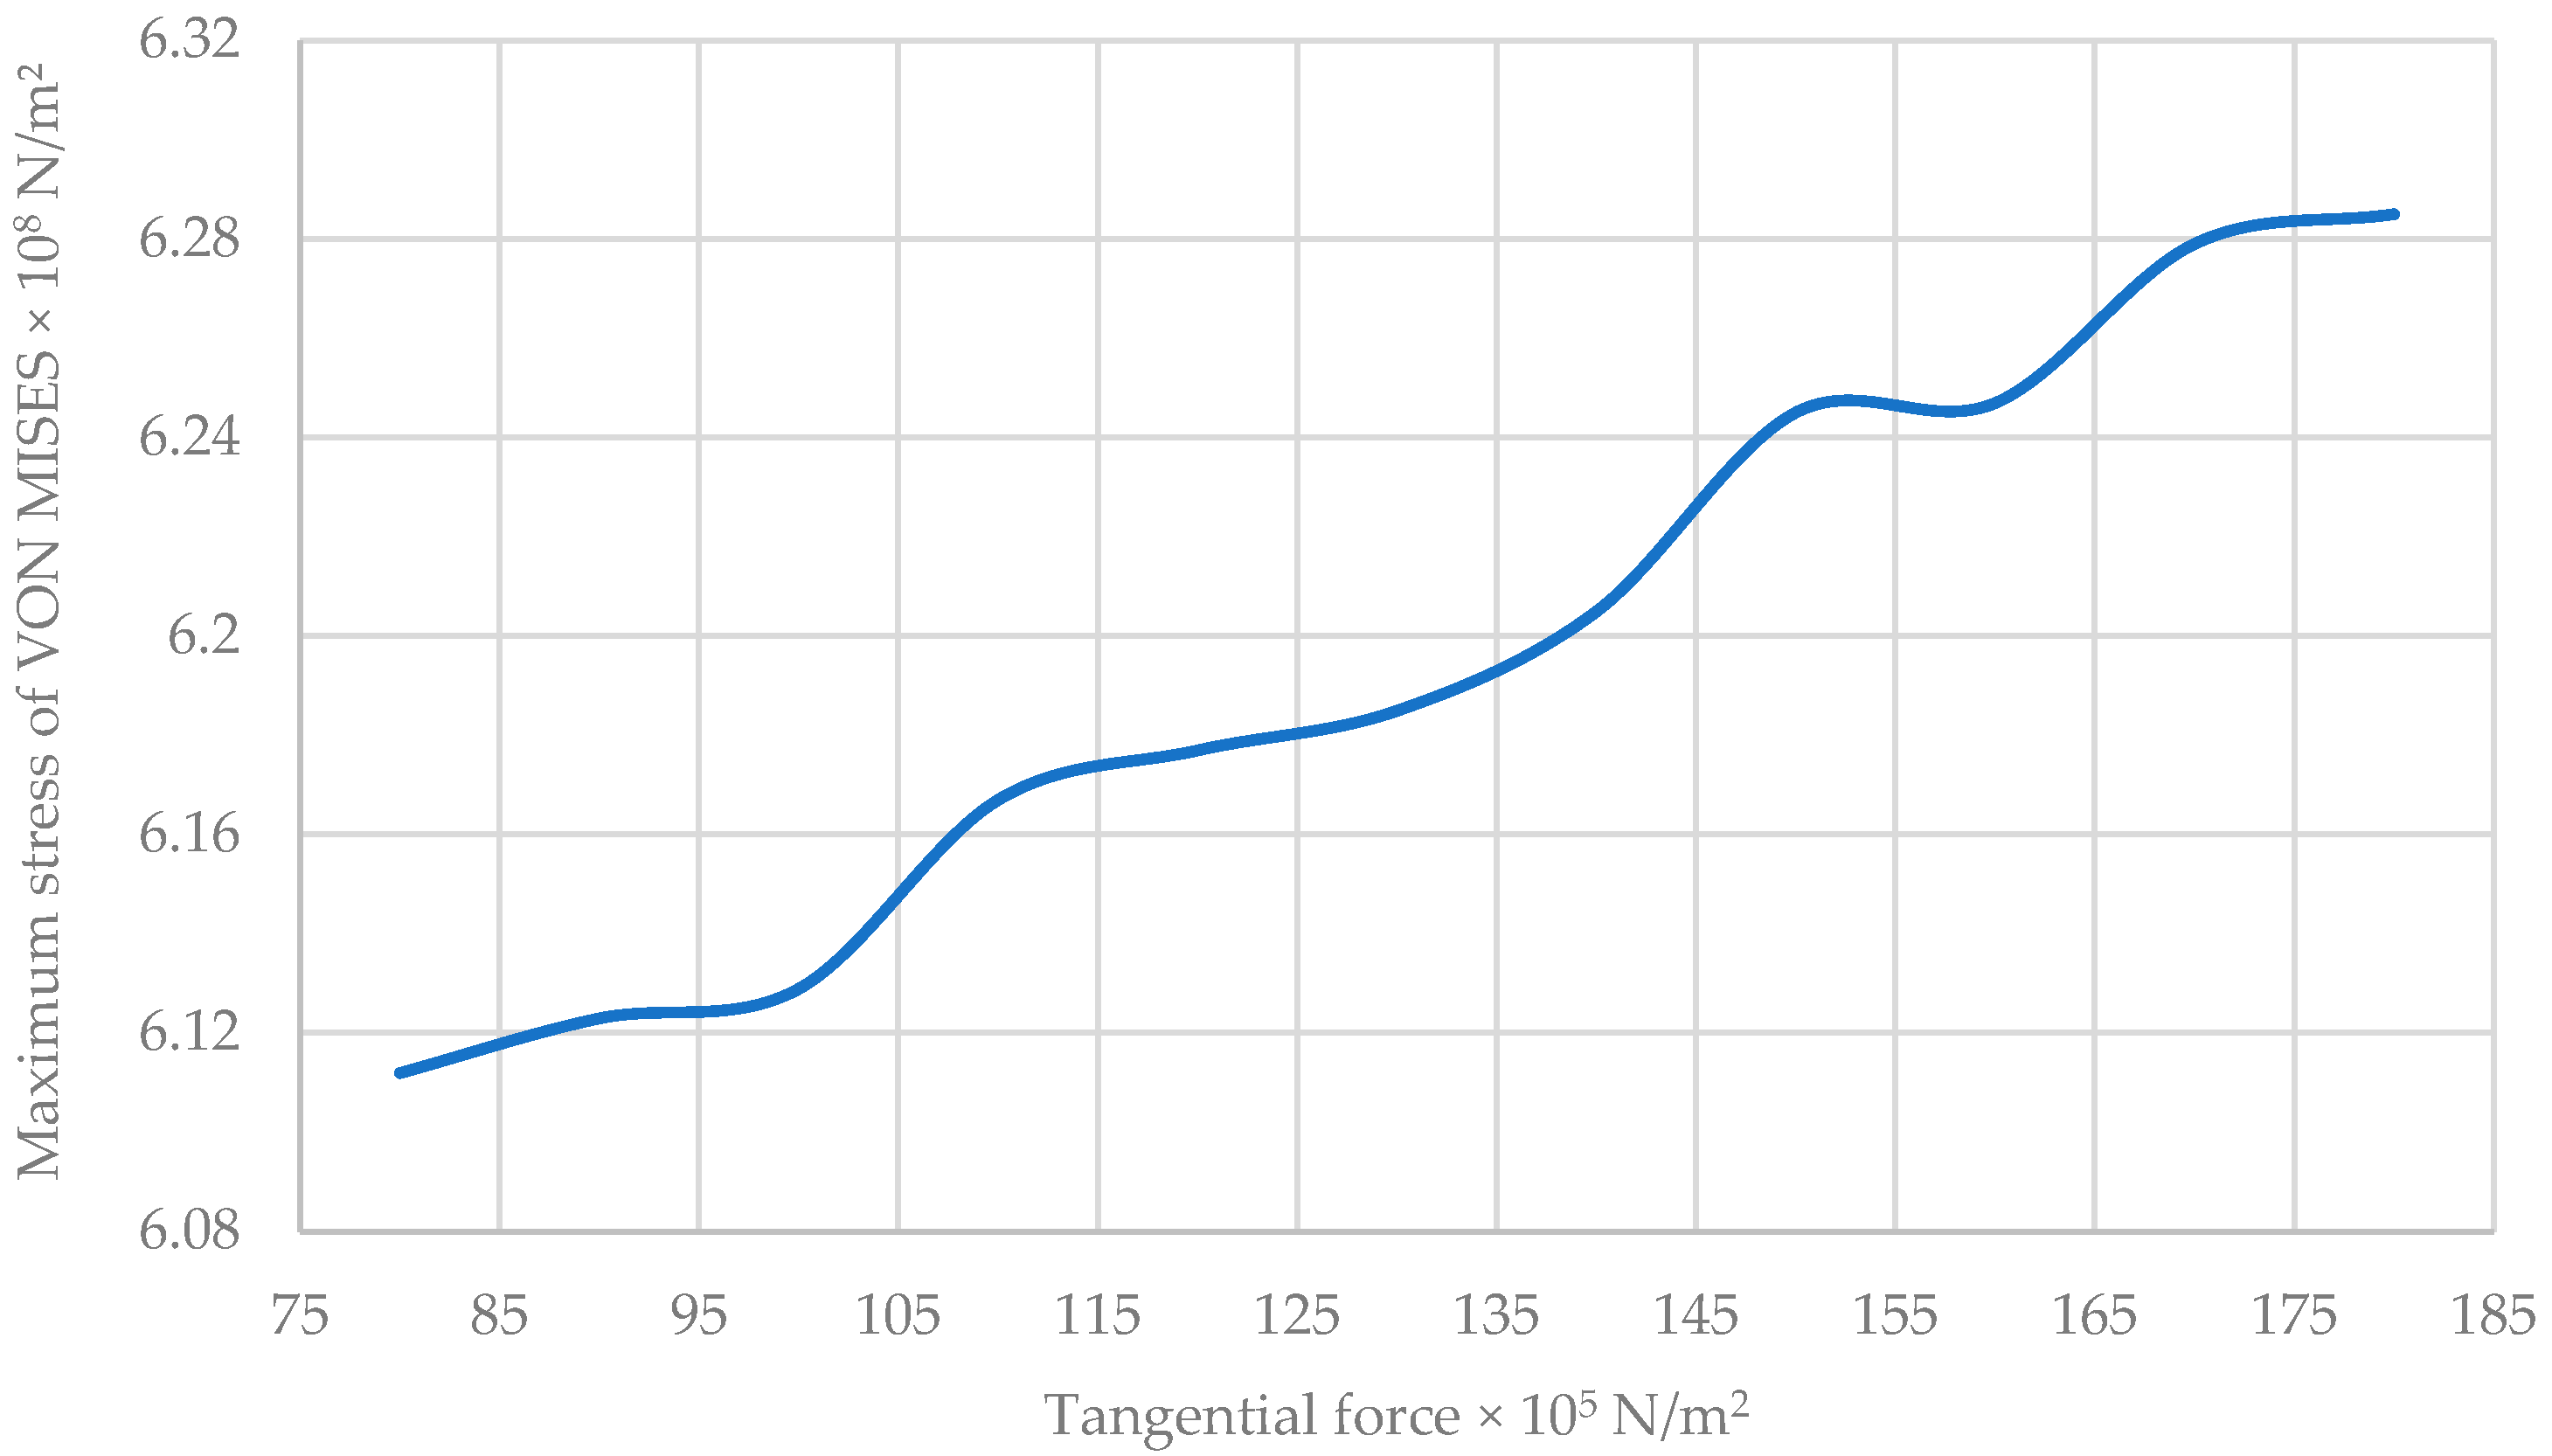
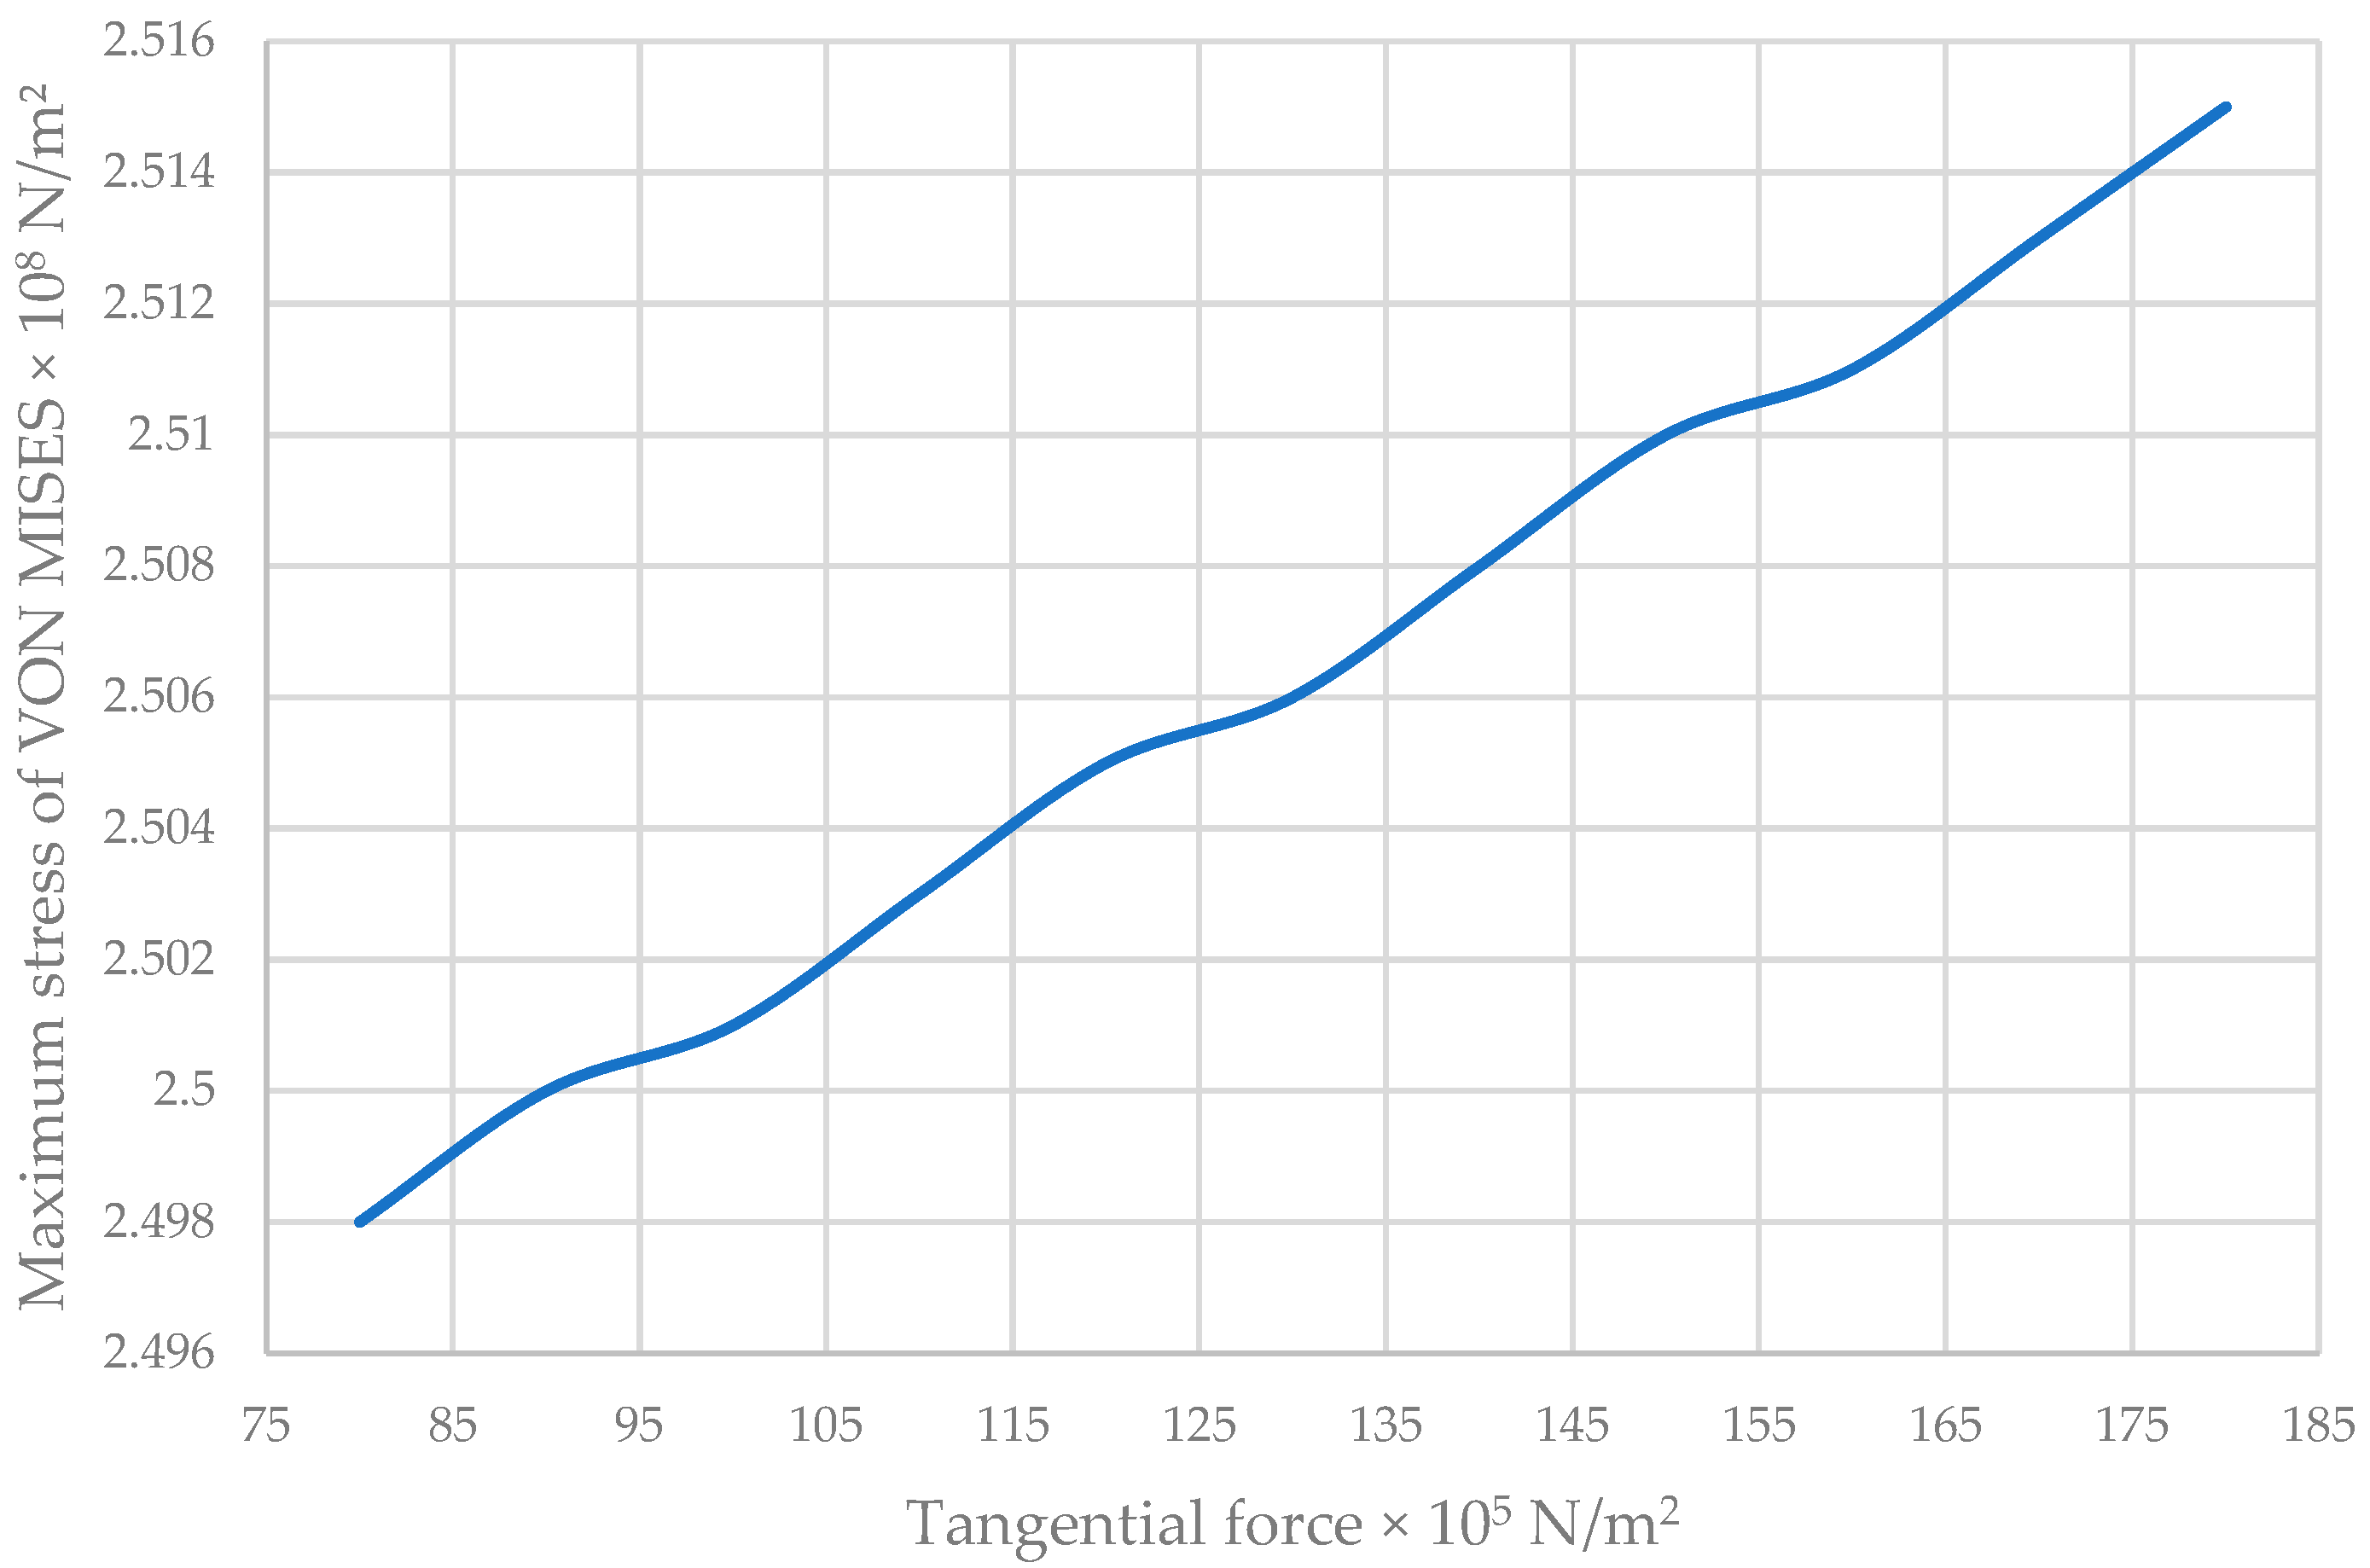
Maximum VON MISES Stress of the New Wall Model
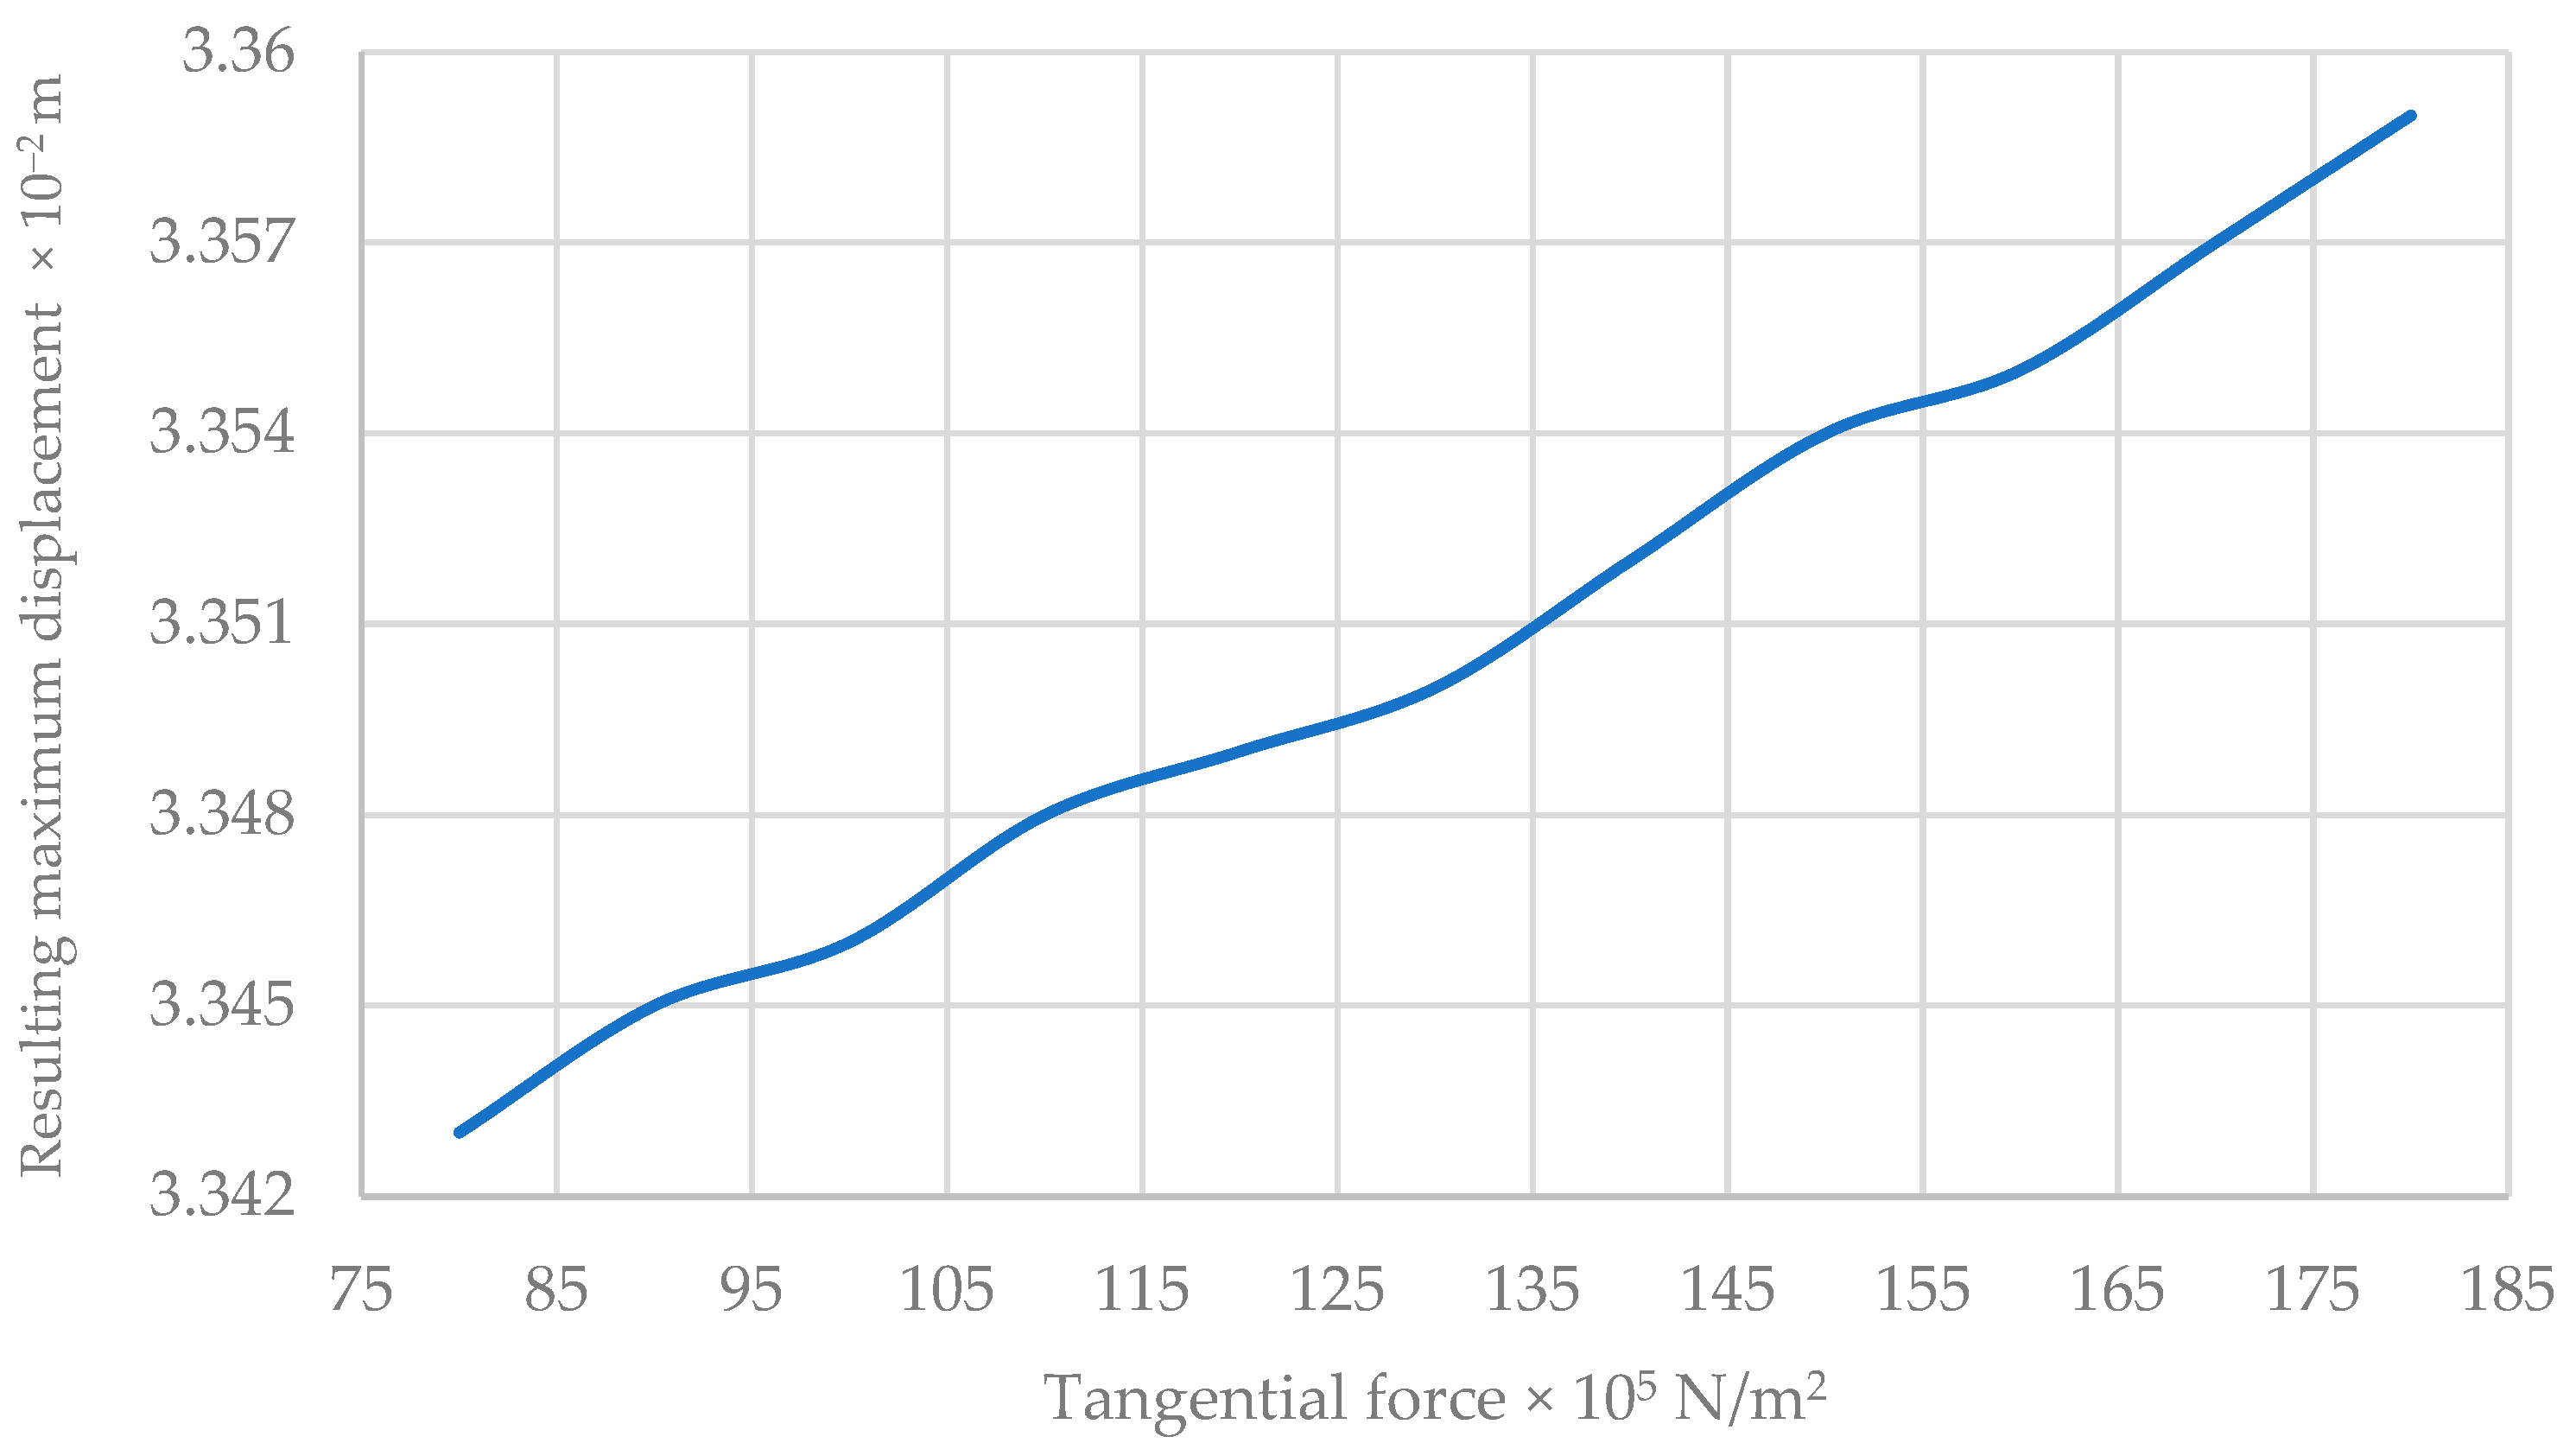
Maximum Resulting Displacement of the New Wall Model
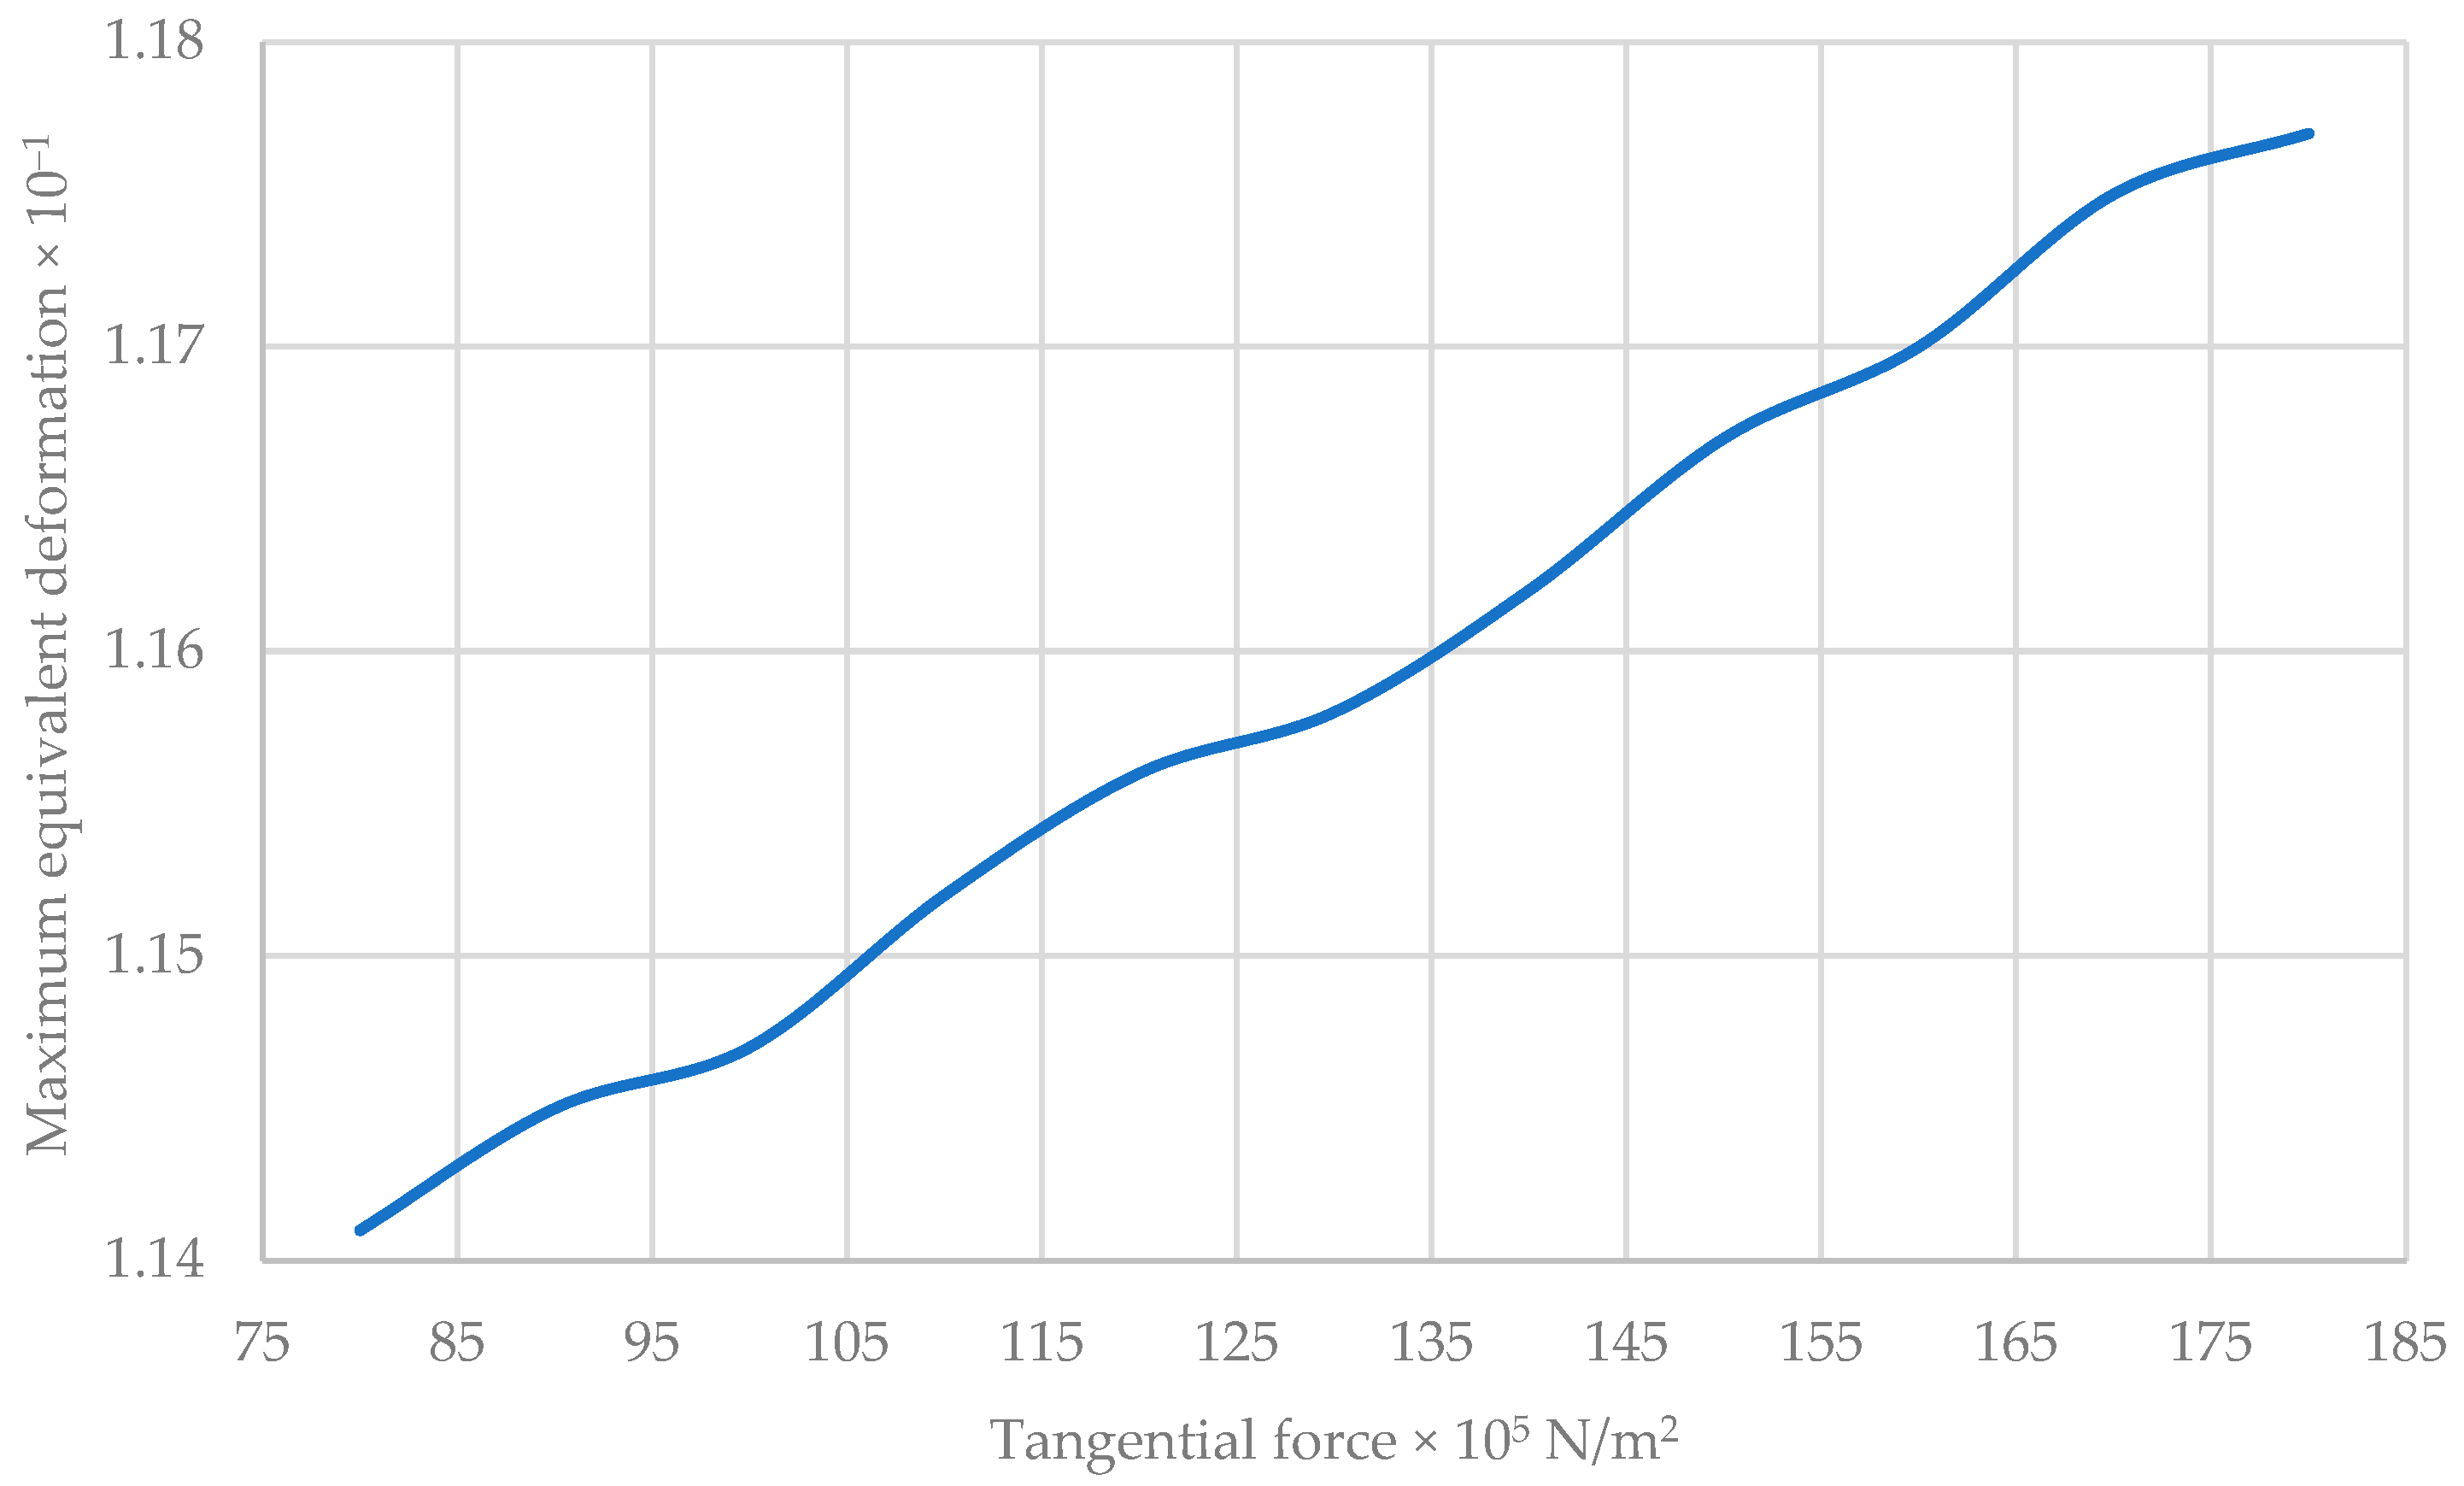
Maximum Equivalent Deformation of the New Wall Model
Maximum VON MISES Stress of the Traditional Wall
Maximum Resulting Displacement of the Traditional Wall
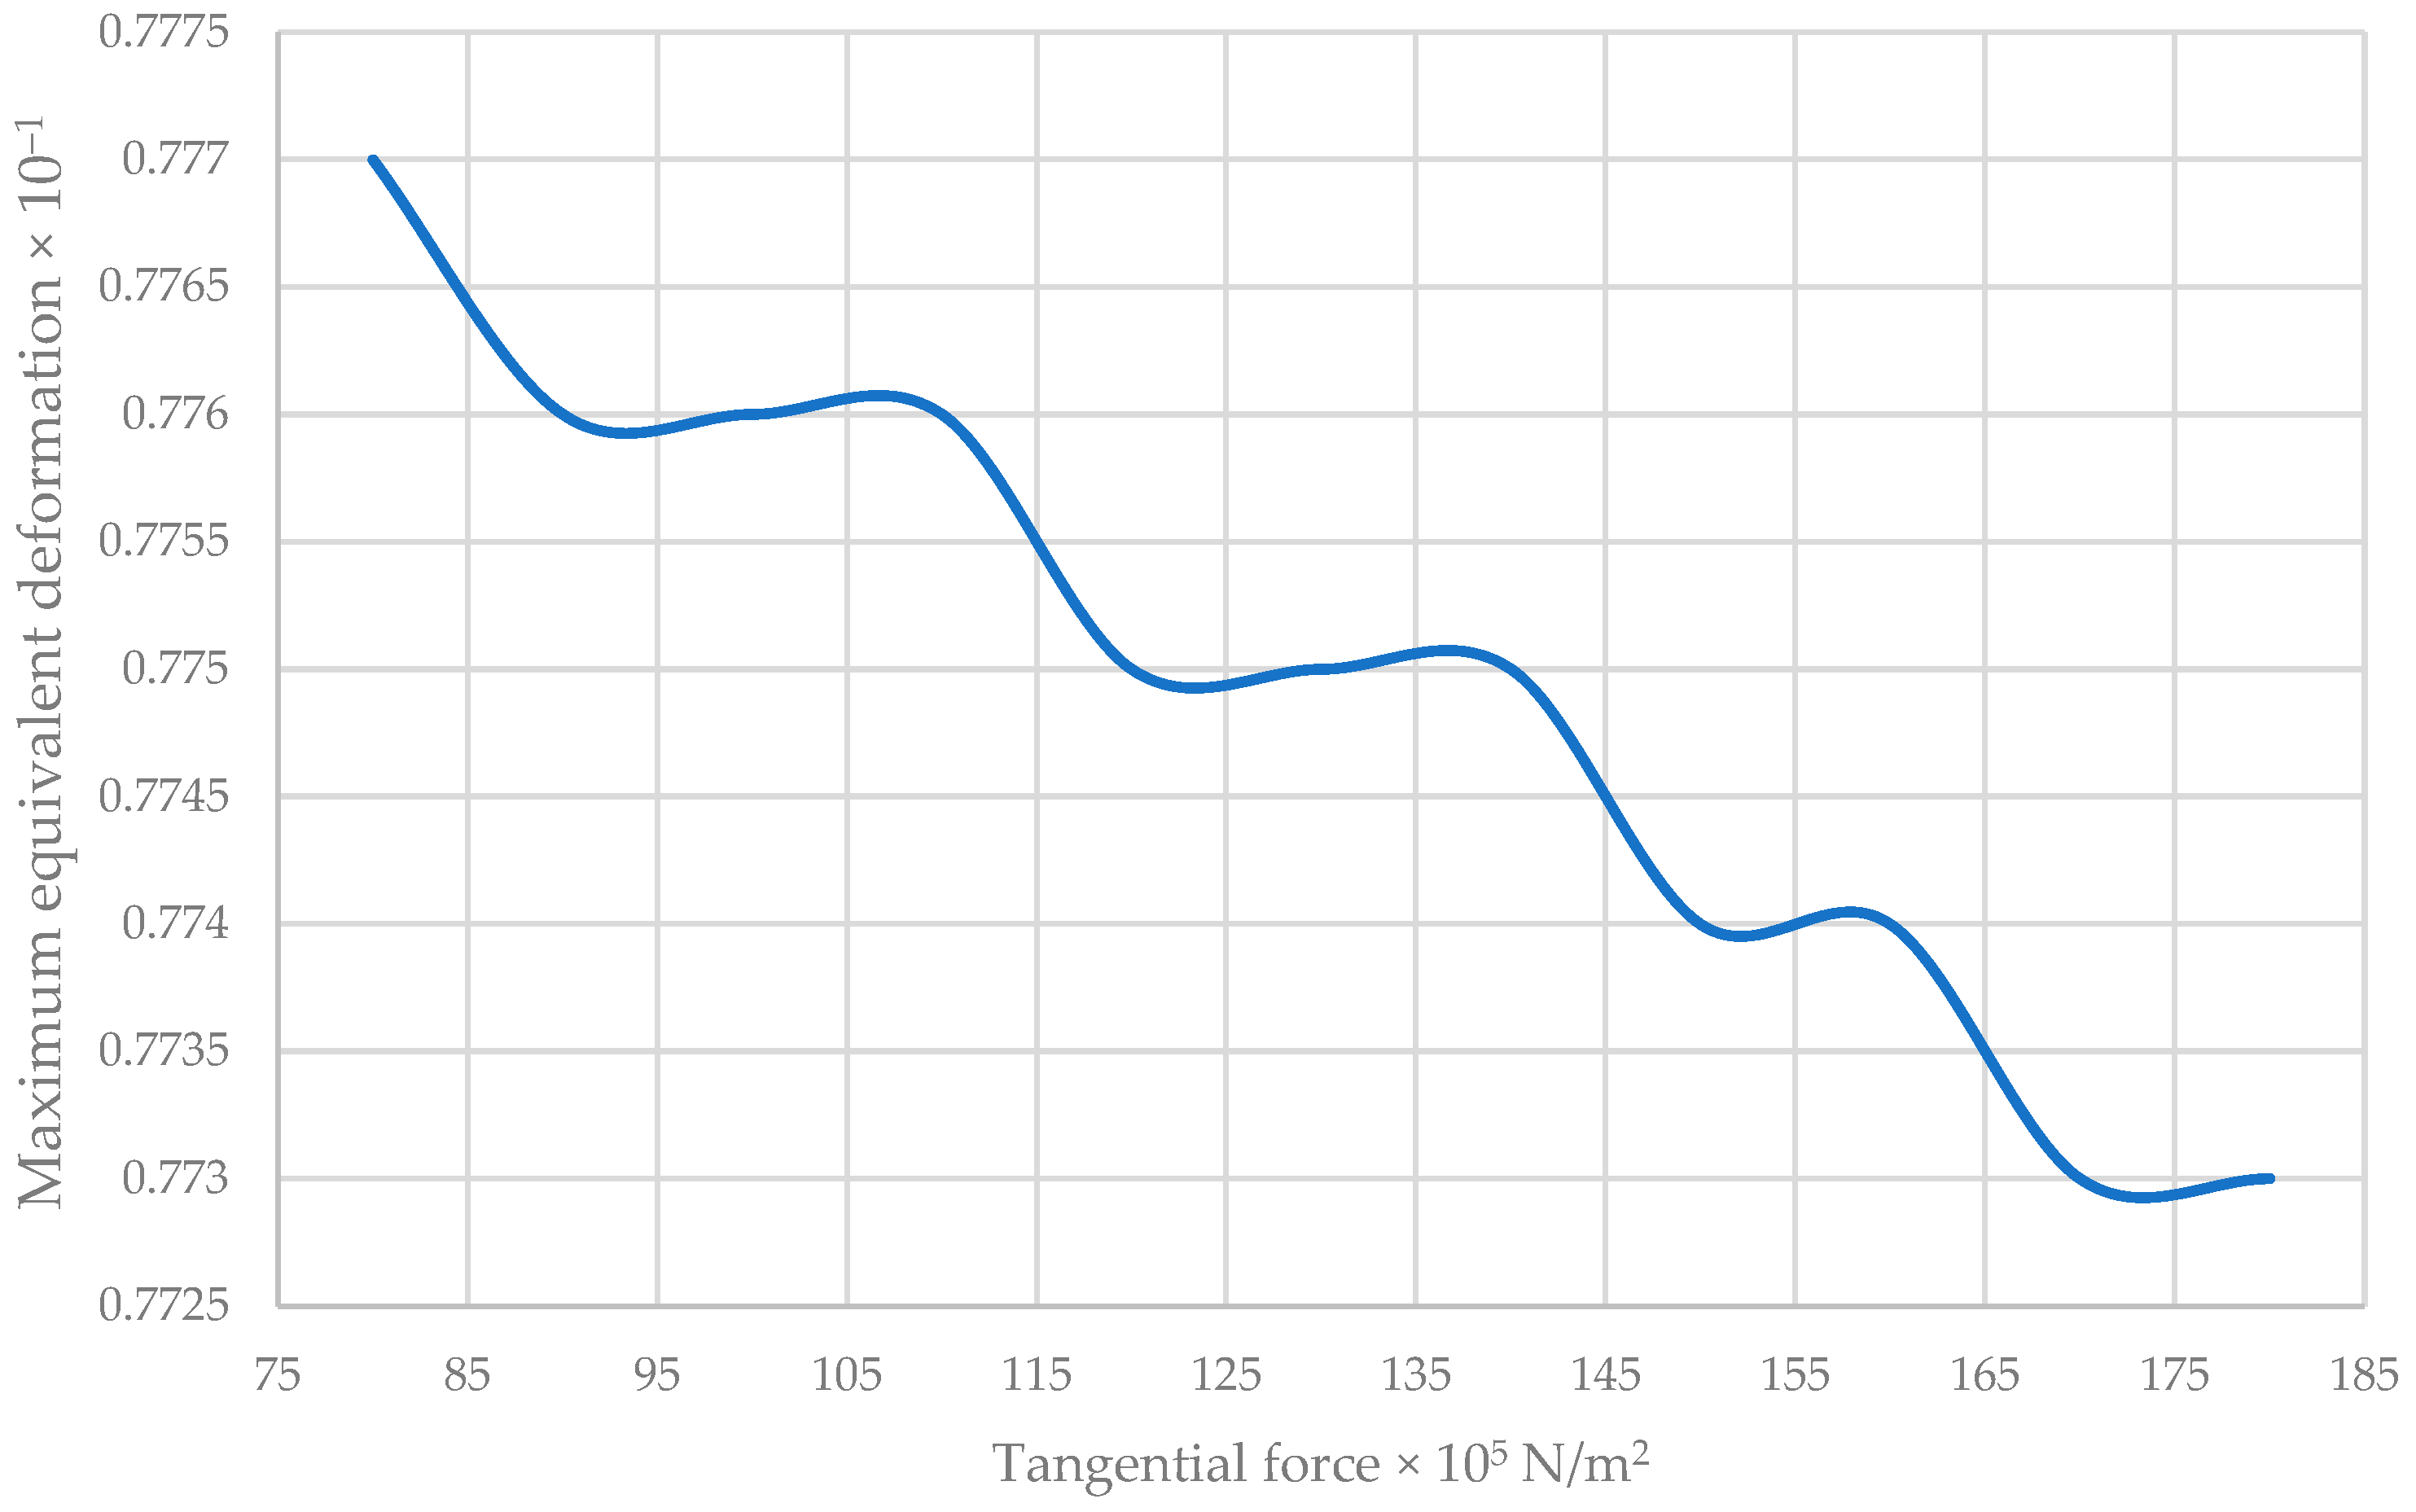
Maximum Equivalent Deformation of the Traditional Wall
4. Conclusions
Author Contributions
Funding
Data Availability Statement
Acknowledgments
Conflicts of Interest
References
- Houben, H.; Guillaud, H. Traité de Construction en Terre; Editions Parenthèses: 1989. Available online: https://www.editionsparentheses.com/traite-de-construction-en-terre (accessed on 20 December 2024).
- Olivier, M. Restauration des Structures en Terre Crue en Fonction de Leur Technologie de Construction; E. & F. N. Spon: 1993; pp. 673–680. Available online: https://www.researchgate.net/publication/291087183_Restauration_des_structures_en_terre_crue_en_fonction_de_leur_technologie_de_construction (accessed on 20 December 2024).
- Izemmouren, O.; Gadri, K.; Guettala, A. Effet des Conditions de Cure Sur les Propriétés Physiques et Mécaniques des Blocs de Terre Comprimée. 2014. Available online: https://hal.science/hal-03439821/ (accessed on 20 December 2024).
- Morel, J.-C.; P’kla, A.; Benedetto, H.D. Essai in situ sur blocs de terre comprimée: Interprétation en compression ou traction de l’essai de flexion en trois points? Rev. Française Génie Civ. 2003, 7, 221–237. Available online: https://www.researchgate.net/publication/275872020_Essai_in_situ_sur_blocs_de_terre_comprimee_Interpretation_en_compression_ou_traction_de_l'essai_de_flexion_en_trois_points (accessed on 27 December 2017). [CrossRef]
- Olivier, M.; Mesbah, A.; El Gharbi, Z.; Morel, J.C. Mode opératoire pour la réalisation d’essais de résistance sur blocs de terre comprimée. Mater. Struct. 1997, 30, 515–517. [Google Scholar] [CrossRef]
- Al-Fakih, A.; Mohammed, B.S.; Al-Shugaa, M.A.; Al-Osta, M.A. Experimental investigation of dry-bed joints in rubberized concrete interlocking masonry. J. Build. Eng. 2022, 58, 105048. [Google Scholar] [CrossRef]
- Andreev, K.; Sinnema, S.; Rekik, A.; Allaoui, S.; Blond, E.; Gasser, A. Compressive behaviour of dry joints in refractory ceramic masonry. Constr. Build. Mater. 2012, 34, 402–408. [Google Scholar] [CrossRef]
- Lourenço, P.B.; Oliveira, D.V.; Roca, P.; Orduña, A. Dry Joint Stone Masonry Walls Subjected to In-Plane Combined Loading. J. Struct. Eng. 2005, 131, 1665–1673. [Google Scholar] [CrossRef]
- Mousi, J.B.; Adjovi, E.; Mousi, J.B.; Adjovi, E. Comparative Study by Simulation of Interlocking and Ordinary Building Blocks under Static Loads. Engineering 2020, 12, 356–381. [Google Scholar] [CrossRef]
- Ali, M.; Sayet, T.; Gasser, A.; Blond, E. Computational homogenization of elastic-viscoplastic refractory masonry with dry joints. Int. J. Mech. Sci. 2021, 196, 106275. [Google Scholar] [CrossRef]
- Gajjar, P.N.; Ali, M.; Sayet, T.; Gasser, A.; Blond, E.; Pereira, J.M.; Lourenço, P.B. Numerical study on the nonlinear thermomechanical behaviour of refractory masonry with dry joints. Eng. Struct. 2023, 291, 116468. [Google Scholar] [CrossRef]
- Nguyen, T.M.H.; Blond, E.; Gasser, A.; Prietl, T. Mechanical homogenisation of masonry wall without mortar. Eur. J. Mech.-A/Solids 2009, 28, 535–544. [Google Scholar] [CrossRef]
- Ali, M.; Oliveira, R.L.; Pereira, J.M.; Rodrigues, J.P.; Lourenço, P.B.; Marschall, H.U.; Sayet, T.; Gasser, A.; Blond, E. Experimental characterization of the nonlinear thermomechanical behaviour of refractory masonry with dry joints. Constr. Build. Mater. 2023, 364, 129960. [Google Scholar] [CrossRef]
- Lourenço, P.B.; Ramos, L.F. Characterization of Cyclic Behavior of Dry Masonry Joints. J. Struct. Eng. 2004, 130, 779–786. [Google Scholar] [CrossRef]
- Vasconcelos, G.; Lourenço, P.B. Experimental characterization of stone masonry in shear and compression. Constr. Build. Mater. 2009, 23, 3337–3345. [Google Scholar] [CrossRef]
- Lourenço, P.B.; Rots, J.G. Multisurface Interface Model for Analysis of Masonry Structures. J. Eng. Mech. 1997, 123, 660–668. [Google Scholar] [CrossRef]
- Lourenço, P.B.; Barros, J.O.; Oliveira, J.T. Shear testing of stack bonded masonry. Constr. Build. Mater. 2004, 18, 125–132. [Google Scholar] [CrossRef]
- Gonen, S.; Pulatsu, B.; Lourenço, P.B.; Lemos, J.V.; Tuncay, K.; Erduran, E. Analysis and prediction of masonry wallette strength under combined compression-bending via stochastic computational modeling. Eng. Struct. 2023, 278, 115492. [Google Scholar] [CrossRef]
- Mendes, N.; Zanotti, S.; Lemos, J.V. Seismic Performance of Historical Buildings Based on Discrete Element Method: An Adobe Church. J. Earthq. Eng. 2020, 24, 1270–1289. [Google Scholar] [CrossRef]
- Peña, F.; Lourenço, P.B.; Mendes, N.; Oliveira, D.V. Numerical models for the seismic assessment of an old masonry tower. Eng. Struct. 2010, 32, 1466–1478. [Google Scholar] [CrossRef]
- Gobbin, F.; de Felice, G.; Lemos, J.V. A Discrete Element Model for Masonry Vaults Strengthened with Externally Bonded Reinforcement. Int. J. Archit. Herit. 2021, 15, 1959–1972. [Google Scholar] [CrossRef]
- Lourenço, P.B.; Gaetani, A. Finite Element Analysis for Building Assessment: Advanced Use and Practical Recommendations; Routledge: New York, NY, USA, 2022. [Google Scholar] [CrossRef]
- Lourenço, P.B.; Gaetani, A. Nonlinear structural analysis. In Finite Element Analysis for Building Assessment; Routledge: New York, NY, USA, 2022; pp. 63–125. [Google Scholar] [CrossRef]
- Lourenço, P.B.; Gaetani, A. Guidelines for practical use of nonlinear finite element analysis. In Finite Element Analysis for Building Assessment; Routledge: New York, NY, USA, 2022; pp. 321–397. [Google Scholar]
- Ali, M.; Gultom, R.J.; Chouw, N. Capacity of innovative interlocking blocks under monotonic loading. Constr. Build. Mater. 2012, 37, 812–821. [Google Scholar] [CrossRef]
- Mahoney, K.; Siegmund, T. Mechanics of tubes composed of interlocking building blocks. Int. J. Eng. Sci. 2022, 174, 103654. [Google Scholar] [CrossRef]
- Djumas, L.; Simon, G.P.; Estrin, Y.; Molotnikov, A. Deformation mechanics of non-planar topologically interlocked assemblies with structural hierarchy and varying geometry. Sci. Rep. 2017, 7, 11844. [Google Scholar] [CrossRef] [PubMed]
- Portioli, F.; Casapulla, C.; Gilbert, M.; Cascini, L. Limit analysis of 3D masonry block structures with non-associative frictional joints using cone programming. Comput. Struct. 2014, 143, 108–121. [Google Scholar] [CrossRef]
- Lourénço, P.B.; De Borst, R.; Rots, J.G. A plane stress softening plasticity model for orthotropic materials. Int. J. Numer. Methods Eng. 1997, 40, 4033–4057. [Google Scholar] [CrossRef]
- Barattucci, S.; Sarhosis, V.; Bruno, A.W.; D’Altri, A.M.; de Miranda, S.; Castellazzi, G. An experimental and numerical study on masonry triplets subjected to monotonic and cyclic shear loadings. Constr. Build. Mater. 2020, 254, 119313. [Google Scholar] [CrossRef]
- Colliat, J.-B.; Davenne, L.; Ibrahimbegovic, A. Modélisation jusqu’à rupture de murs en maçonnerie chargés dans leur plan. Rev. Française Génie Civ. 2002, 6, 593–606. [Google Scholar] [CrossRef]
- Bui, T.T.; Limam, A.; Sarhosis, V.; Hjiaj, M. Discrete element modelling of the in-plane and out-of-plane behaviour of dry-joint masonry wall constructions. Eng. Struct. 2017, 136, 277–294. [Google Scholar] [CrossRef]
- Chácara, C.; Mendes, N.; Lourenço, P.B. Simulation of Shake Table Tests on Out-of-Plane Masonry Buildings. Part (IV): Macro and Micro FEM Based Approaches. Int. J. Archit. Herit. 2017, 11, 103–116. [Google Scholar] [CrossRef]
- Lourenço, P.B.; Gaetani, A. Fundamentals of the finite element method. In Finite Element Analysis for Building Assessment; Routledge: New York, NY, USA, 2022; pp. 1–62. [Google Scholar]
- Lourenço, P.B.; Gaetani, A. Recommended properties for advanced numerical analysis. In Finite Element Analysis for Building Assessment; Routledge: New York, NY, USA, 2022; pp. 1209–1320. [Google Scholar]
- Miccoli, L.; Müller, U.; Fontana, P. Mechanical behaviour of earthen materials: A comparison between earth block masonry, rammed earth and cob. Constr. Build. Mater. 2014, 61, 327–339. [Google Scholar] [CrossRef]
- Thormark, C. The effect of material choice on the total energy need and recycling potential of a building. Build. Environ. 2006, 41, 1019–1026. [Google Scholar] [CrossRef]
- Miccoli, L.; Garofano, A.; Fontana, P.; Müller, U. Experimental testing and finite element modelling of earth block masonry. Eng. Struct. 2015, 104, 80–94. Available online: http://linkinghub.elsevier.com/retrieve/pii/S014102961500591X (accessed on 17 January 2018). [CrossRef]
- Sarhosis, V.; Lemos, J.V. A detailed micro-modelling approach for the structural analysis of masonry assemblages. Comput. Struct. 2018, 206, 66–81. [Google Scholar] [CrossRef]
- Forgács, T.; Sarhosis, V.; Bagi, K. Influence of construction method on the load bearing capacity of skew masonry arches. Eng. Struct. 2018, 168, 612–627. [Google Scholar] [CrossRef]
- D’altri, A.M.; Sarhosis, V.; Milani, G.; Rots, J.; Cattari, S.; Lagomarsino, S.; Sacco, E.; Tralli, A.; Castellazzi, G.; de Miranda, S. Modeling Strategies for the Computational Analysis of Unreinforced Masonry Structures: Review and Classification. Arch. Comput. Methods Eng. 2020, 27, 1153–1185. [Google Scholar] [CrossRef]
- Pennec, F.; Alzina, A.; Tessier-Doyen, N.; Naït-ali, B.; Mati-Baouche, N.; De Baynast, H.; Smith, D.S. A Combined Finite-Discrete Element Method for Calculating the Effective Thermal Conductivity of Bio-Aggregates Based Ma-terials. Int. J. Heat. Mass. Transf. 2013, 60, 274–283. [Google Scholar] [CrossRef]
- Omar Sore, S.; Messan, A.; Prud’homme, E.; Escadeillas, G.; Tsobnang, F. Stabilization of Compressed Earth Blocks (CEBs) by Geopolymer Binder Based on Local Materials from Burkina Faso. Constr. Build. Mater. 2018, 165, 333–345. [Google Scholar] [CrossRef]
- Aranda-Jiménez, Y.; Zuñiga-Leal, C.; Moreno-Chimely, L.; Robles-Aranda, M.E. Compressed Earth Blocks (CEB) Compression Tested under Two Earth Standards. Cogent Eng. 2023, 10, 2163116. [Google Scholar] [CrossRef]
- Nassar, S.; Baudrit, C.; Saliba, J.; Saiyouri, N. Predicting Compressed Earth Blocks Compressive Strength by Means of Machine Learning Models. Constr. Build. Mater. 2024, 447, 138135. [Google Scholar] [CrossRef]
- Taallah, B.; Guettala, A. The Mechanical and Physical Properties of Compressed Earth Block Stabilized with Lime and Filled with Untreated and Alkali-Treated Date Palm Fibers. Constr. Build. Mater. 2016, 104, 52–62. [Google Scholar] [CrossRef]
- Qu, B.; Stirling, B.J.; Jansen, D.C.; Bland, D.W.; Laursen, P.T. Testing of Flexure-Dominated Interlocking Com-pressed Earth Block Walls. Constr. Build. Mater. 2015, 83, 34–43. [Google Scholar] [CrossRef]
- Stazi, F.; Serpilli, M.; Chiappini, G.; Pergolini, M.; Fratalocchi, E.; Lenci, S. Experimental Study of the Mechanical Behaviour of a New Extruded Earth Block Masonry. Constr. Build. Mater. 2020, 244, 118368. [Google Scholar] [CrossRef]
- Adadja, C.; Labintan, C.; Gibigaye, M.; Zahrouni, H.; Hattab, M.; Jrad, M. Prediction of the Young Modulus of the Earth Reinforced by the Straw. Int. J. Adv. Res. 2020, 8, 1075–1081. [Google Scholar] [CrossRef] [PubMed]
- Keeler, E.; Sarhat, S.; Green, M.F.; Yusuf, M.D.; Schmid, K. Mechanical Properties of On-Site Manufactured Stabilised Compressed Earth Blocks: An Experimental Investigation and Proposed Models. Aust. J. Civ. Eng. 2024. [Google Scholar] [CrossRef]
- Morel, J.C.; Pkla, A. A Model to Measure Compressive Strength of Compressed Earth Blocks with the ‘3 Points Bending Test’. Constr. Build. Mater. 2002, 16, 303–310. [Google Scholar] [CrossRef]
- Subramanian, G.K.M.; Balasubramanian, M.; Jeya Kumar, A.A. A Review on the Mechanical Properties of Natural Fiber Reinforced Compressed Earth Blocks. J. Nat. Fibers 2022, 19, 7687–7701. [Google Scholar] [CrossRef]
- Kumar, A. Pushplata Building Regulations for Environmental Protection in Indian Hill Towns; Elsevier: Amsterdam, The Netherlands, 2013; Volume 2, pp. 224–231. [Google Scholar]
- Baker, J.W. Measuring Bias in Structural Response Caused by Ground Motion Scaling. Available online: https://www.jackwbaker.com/Publications/Baker_(2007)_Record_scaling,_8PCEE.pdf (accessed on 20 December 2024).
- Sturm, T.; Ramos, L.F.; Lourenço, P.B. Characterization of Dry-Stack Interlocking Compressed Earth Blocks. Mater. Struct. /Mater. Et Constr. 2015, 48, 3059–3074. [Google Scholar] [CrossRef]
- Xie, G.; Zhang, X.; Hao, H.; Thomas, J. Parametric Study of Reinforced Interlocking Brick Wall under Cyclic Loading. J. Build. Eng. 2024, 83, 108415. [Google Scholar] [CrossRef]
- Zhang, X.; Shi, T.; Hao, H.; Xie, G.; Wang, G. Numerical Derivation of Homogenised Constitutional Relation of Mortar-Less Interlocking Brick Wall for Dynamic Response Prediction. Eng. Struct. 2024, 304, 117588. [Google Scholar] [CrossRef]
- Weed, D.A.; Tennant, A.G.; Motamedi, M.H.; Gourav, K.; Foster, C.D.; Reddy, B.V.V. Finite Element Model Application to Flexural Behavior of Cement Stabilized Soil Block Masonry. Mater. Struct. /Mater. Con-Structions 2020, 53, 61. [Google Scholar] [CrossRef]
- da Porto, F.; Guidi, G.; Garbin, E.; Modena, C. In-Plane Behavior of Clay Masonry Walls: Experimental Testing and Finite-Element Modeling. J. Struct. Eng. 2010, 136, 1379–1392. [Google Scholar] [CrossRef]
- Bui, T.L.; Bui, T.T.; Bui, Q.B.; Nguyen, X.H.; Limam, A. Out-of-Plane Behavior of Rammed Earth Walls under Seismic Loading: Finite Element Simulation. Structures 2020, 24, 191–208. [Google Scholar] [CrossRef]
- Mania, R.J.; Kolakowski, Z.; Bienias, J.; Jakubczak, P.; Majerski, K. Comparative Study of {FML} Profiles Buckling and Postbuckling Behaviour under Axial Loading. Compos. Struct. 2015, 134, 216–225. [Google Scholar] [CrossRef]
- Xie, G.; Zhang, X.; Hao, H.; Shi, T.; Cui, L.; Thomas, J. Behaviour of Reinforced Mortarless Interlocking Brick Wall under Cyclic Loading. Eng. Struct. 2023, 283, 115890. [Google Scholar] [CrossRef]
- Rekik, A.; Gasser, A. Numerical Homogenization Model for Effective Creep Properties of Microcracked Masonry. Int. J. Solids Struct. 2016, 102–103, 297–320. [Google Scholar] [CrossRef]
- Qamar, F.; Thomas, T.; Ali, M. Improvement in Lateral Resistance of Mortar-Free Interlocking Wall with Plaster Having Natural Fibres. Constr. Build. Mater. 2020, 234, 117387. [Google Scholar] [CrossRef]
- Lee, J.S.; Pande, G.N.; Middleton, J.; Kralj, B. Numerical Modelling of Brick Masonry Panels Subject to Lateral Loadings. Comput. Struct. 1996, 61, 735–745. [Google Scholar] [CrossRef]


| Force × 106 N/m2 | Maximum Stress of VON MISES × 108 N/m2 | Maximum Resulting Displacement × 10−2 m | Maximum Equivalent Deformation × 10−1 |
|---|---|---|---|
| 30 | 5.276 | 2.718 | 0.964 |
| 35 | 6.152 | 3.171 | 1.125 |
| 40 | 7.034 | 3.625 | 1.284 |
| 45 | 7.921 | 4.077 | 1.447 |
| 50 | 8.807 | 4.53 | 1.648 |
| 55 | 9.676 | 4.983 | 1.768 |
| 60 | 10.555 | 5.436 | 1.929 |
| 65 | 11.428 | 5.89 | 2.09 |
| 70 | 12.305 | 6.343 | 2.251 |
| 75 | 13.19 | 6.796 | 2.411 |
| 80 | 14.069 | 7.248 | 2.572 |
| 85 | 14.938 | 7.702 | 2.733 |
| 90 | 15.852 | 8.155 | 2.894 |
| 95 | 16.723 | 8.608 | 3.054 |
| 100 | 17.574 | 9.061 | 3.215 |
| Force × 106 N/m2 | Maximum Stress of VON MISES × 108 N/m2 | Maximum Resulting Displacement × 10−2 m | Maximum Equivalent Deformation × 10−1 |
|---|---|---|---|
| 30 | 4.484 | 1.934 | 0.846 |
| 35 | 5.231 | 2.257 | 0.987 |
| 40 | 5.978 | 2.579 | 1.128 |
| 45 | 6.726 | 2.901 | 1.269 |
| 50 | 7.473 | 3.224 | 1.41 |
| 55 | 8.22 | 3.546 | 1.552 |
| 60 | 8.968 | 3.869 | 1.693 |
| 65 | 9.715 | 4.191 | 1.834 |
| 70 | 10.462 | 4.513 | 1.975 |
| 75 | 11.21 | 4.836 | 2.116 |
| 80 | 11.957 | 5.158 | 2.257 |
| 85 | 12.704 | 5.48 | 2.398 |
| 90 | 13.451 | 5.803 | 2.539 |
| 95 | 14.199 | 6.125 | 2.68 |
| 100 | 14.946 | 6.448 | 2.821 |
| Point Force × 105 N/m2 | Maximum Stress of VON MISES × 108 N/m2 | Maximum Resulting Displacement × 10−2 m | Maximum Equivalent Deformation × 10−1 |
|---|---|---|---|
| 5 | 5.686 | 1.920 | 0.977 |
| 10 | 5.685 | 1.951 | 0.977 |
| 20 | 5.763 | 2.048 | 0.977 |
| 30 | 5.957 | 2.192 | 0.977 |
| 40 | 6.154 | 2.371 | 0.980 |
| 50 | 6.330 | 2.816 | 0.998 |
| 60 | 6.554 | 3.348 | 1.018 |
| 70 | 6.757 | 3.880 | 1.037 |
| 80 | 6.965 | 4.412 | 1.058 |
| 90 | 7.174 | 4.946 | 1.078 |
| 100 | 7.384 | 5.479 | 1.099 |
| Point Force × 105 N/m2 | Maximum Stress of VON MISES × 108 N/m2 | Maximum Resulting Displacement × 10−2 m | Maximum Equivalent Deformation × 10−1 |
|---|---|---|---|
| 5 | 4.392 | 1.234 | 0.879 |
| 10 | 4.391 | 1.244 | 0.882 |
| 20 | 4.389 | 1.274 | 0.903 |
| 30 | 4.388 | 1.399 | 0.934 |
| 40 | 4.506 | 1.583 | 0.966 |
| 50 | 4.715 | 1.873 | 0.999 |
| 60 | 4.926 | 2.176 | 1.032 |
| 70 | 5.139 | 2.537 | 1.066 |
| 80 | 5.352 | 2.898 | 1.101 |
| 90 | 5.567 | 3.26 | 1.136 |
| 100 | 5.783 | 3.621 | 1.171 |
| Tangential Force × 105 N/m2 | Maximum Stress of VON MISES × 108 N/m2 | Maximum Resulting Displacement × 10−2 m | Maximum Equivalent Deformation × 10−1 |
|---|---|---|---|
| 80 | 6.112 | 3.343 | 1.141 |
| 90 | 6.123 | 3.345 | 1.145 |
| 100 | 6.129 | 3.346 | 1.147 |
| 110 | 6.167 | 3.348 | 1.152 |
| 120 | 6.177 | 3.349 | 1.156 |
| 130 | 6.185 | 3.350 | 1.158 |
| 140 | 6.205 | 3.352 | 1.162 |
| 150 | 6.245 | 3.354 | 1.167 |
| 160 | 6.247 | 3.355 | 1.17 |
| 170 | 6.279 | 3.357 | 1.175 |
| 180 | 6.285 | 3.359 | 1.177 |
| Tangential Force × 105 N/m2 | Maximum Stress of VON MISES × 108 N/m2 | Maximum Resulting Displacement × 10−2 m | Maximum Equivalent Deformation × 10−1 |
|---|---|---|---|
| 80 | 2.498 | 1.830 | 0.777 |
| 90 | 2.500 | 1.830 | 0.776 |
| 100 | 2.501 | 1.831 | 0.776 |
| 110 | 2.503 | 1.832 | 0.776 |
| 120 | 2.505 | 1.833 | 0.775 |
| 130 | 2.506 | 1.834 | 0.775 |
| 140 | 2.508 | 1.834 | 0.775 |
| 150 | 2.510 | 1.835 | 0.774 |
| 160 | 2.511 | 1.836 | 0.774 |
| 170 | 2.513 | 1.837 | 0.773 |
| 180 | 2.515 | 1.838 | 0.773 |
Disclaimer/Publisher’s Note: The statements, opinions and data contained in all publications are solely those of the individual author(s) and contributor(s) and not of MDPI and/or the editor(s). MDPI and/or the editor(s) disclaim responsibility for any injury to people or property resulting from any ideas, methods, instructions or products referred to in the content. |
© 2025 by the authors. Licensee MDPI, Basel, Switzerland. This article is an open access article distributed under the terms and conditions of the Creative Commons Attribution (CC BY) license (https://creativecommons.org/licenses/by/4.0/).
Share and Cite
Koudje, B.; Adjovi, E. Numerical Simulation of a Shear Wall Model in Interlocking Masonry with Dry Vertical and Horizontal Joints in Compressed Earth Blocks. Buildings 2025, 15, 627. https://doi.org/10.3390/buildings15040627
Koudje B, Adjovi E. Numerical Simulation of a Shear Wall Model in Interlocking Masonry with Dry Vertical and Horizontal Joints in Compressed Earth Blocks. Buildings. 2025; 15(4):627. https://doi.org/10.3390/buildings15040627
Chicago/Turabian StyleKoudje, Basile, and Edmond Adjovi. 2025. "Numerical Simulation of a Shear Wall Model in Interlocking Masonry with Dry Vertical and Horizontal Joints in Compressed Earth Blocks" Buildings 15, no. 4: 627. https://doi.org/10.3390/buildings15040627
APA StyleKoudje, B., & Adjovi, E. (2025). Numerical Simulation of a Shear Wall Model in Interlocking Masonry with Dry Vertical and Horizontal Joints in Compressed Earth Blocks. Buildings, 15(4), 627. https://doi.org/10.3390/buildings15040627