
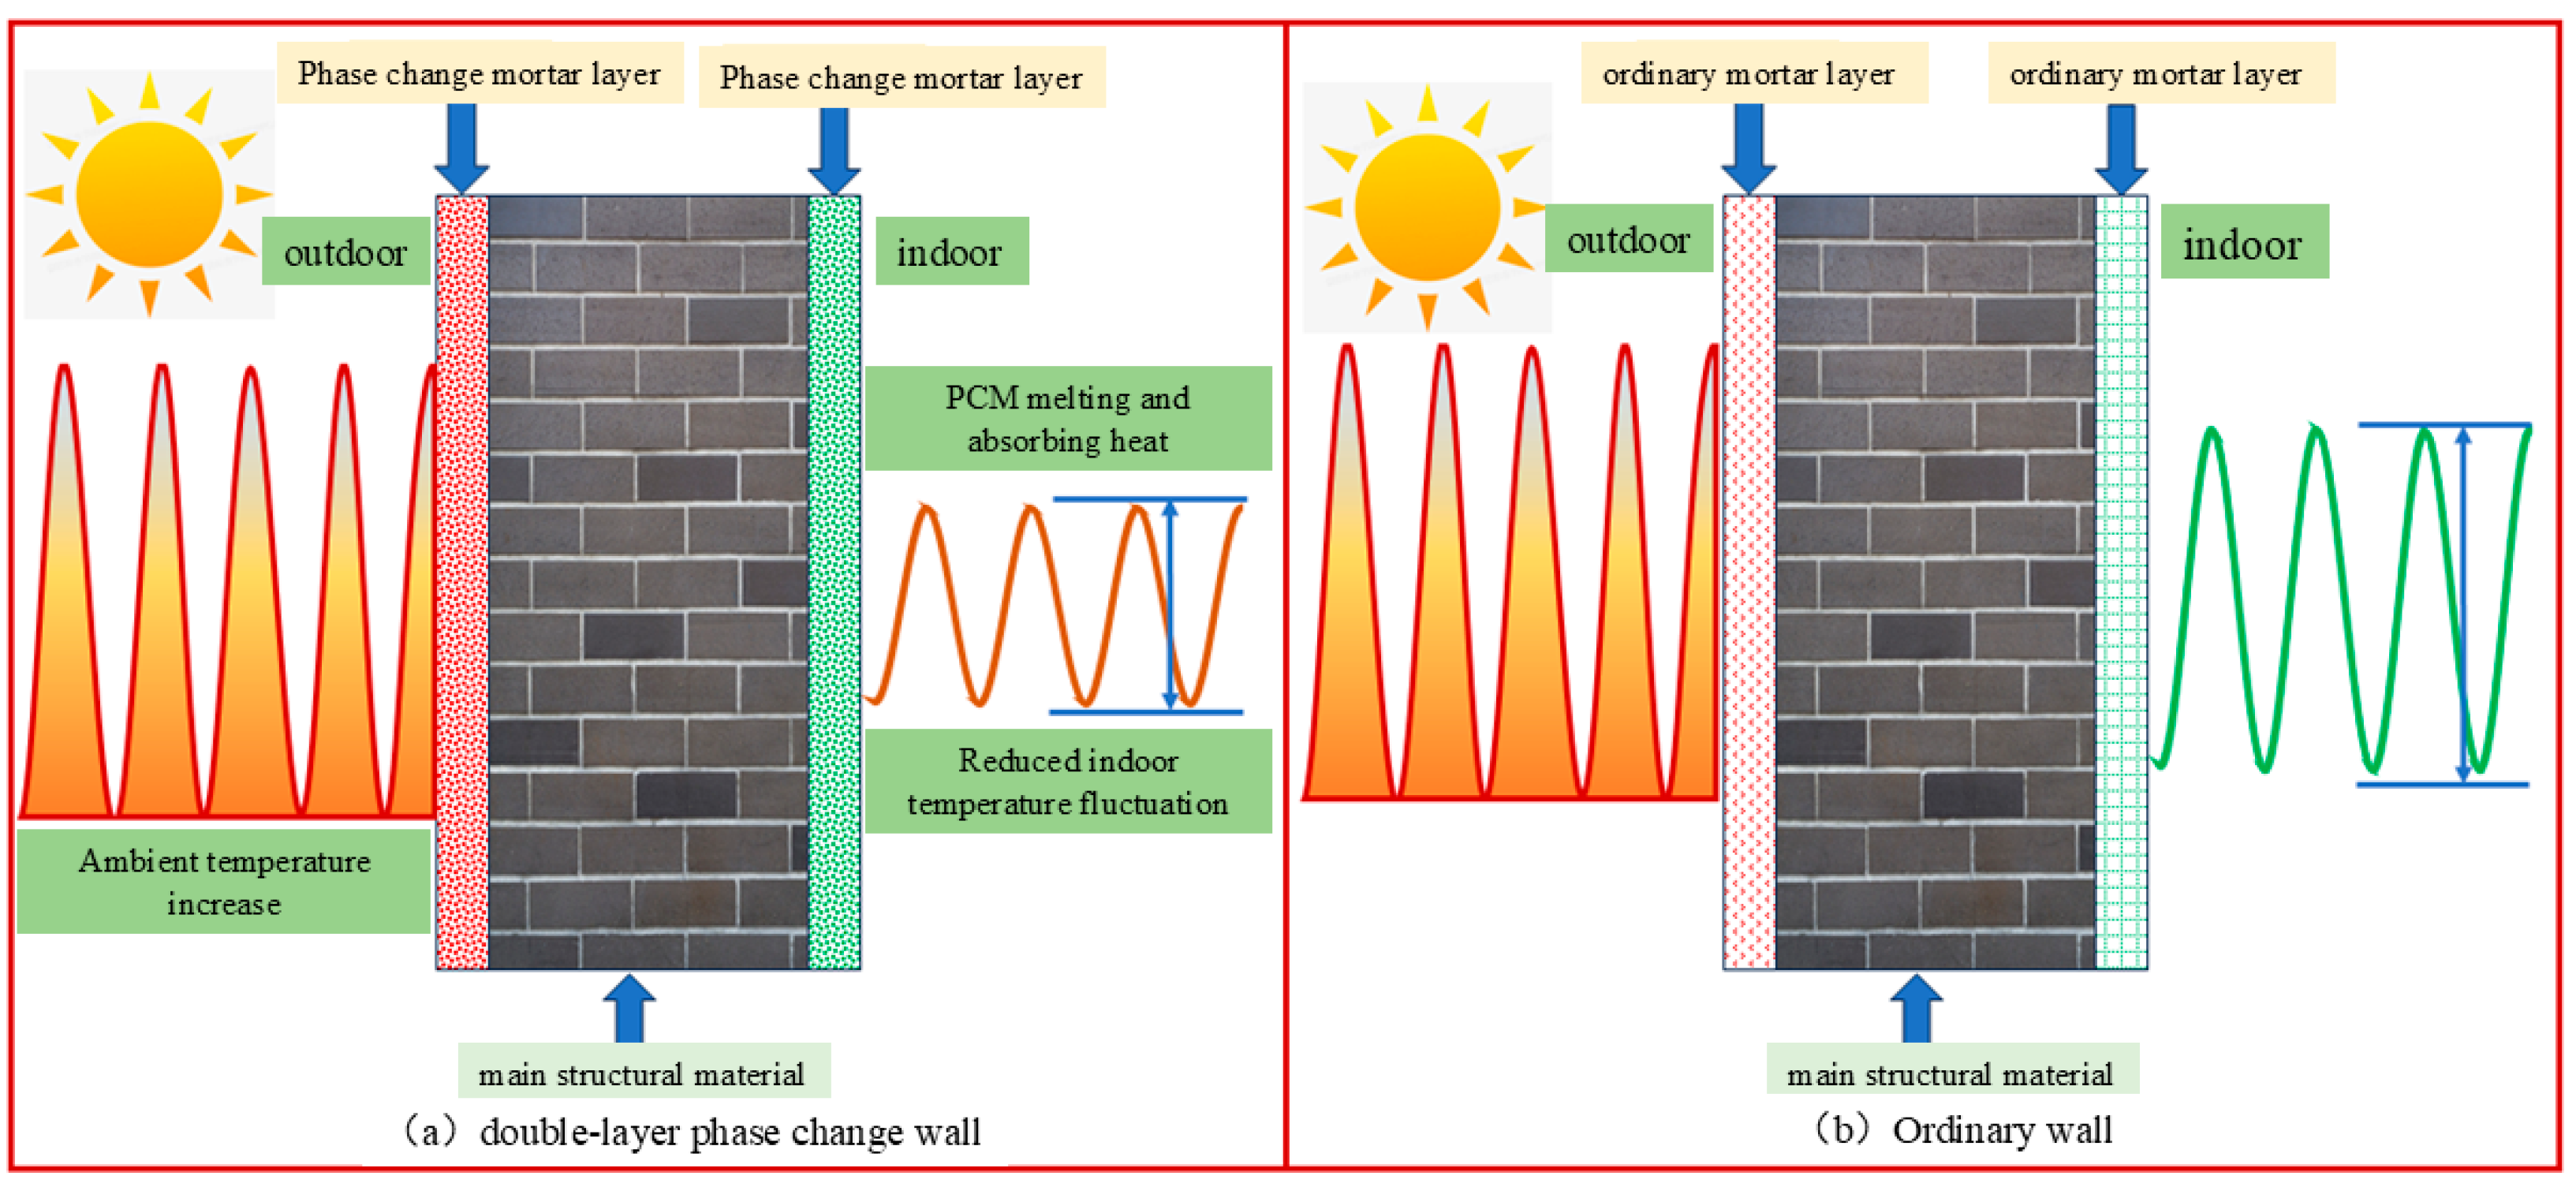
Experimental and Numerical Investigation of Heat Transfer Characteristics of Double-Layer Phase Change Walls for Enhanced Thermal Regulation in Summer Climates

Abstract
1. Introduction
2. Experiment
2.1. Materials
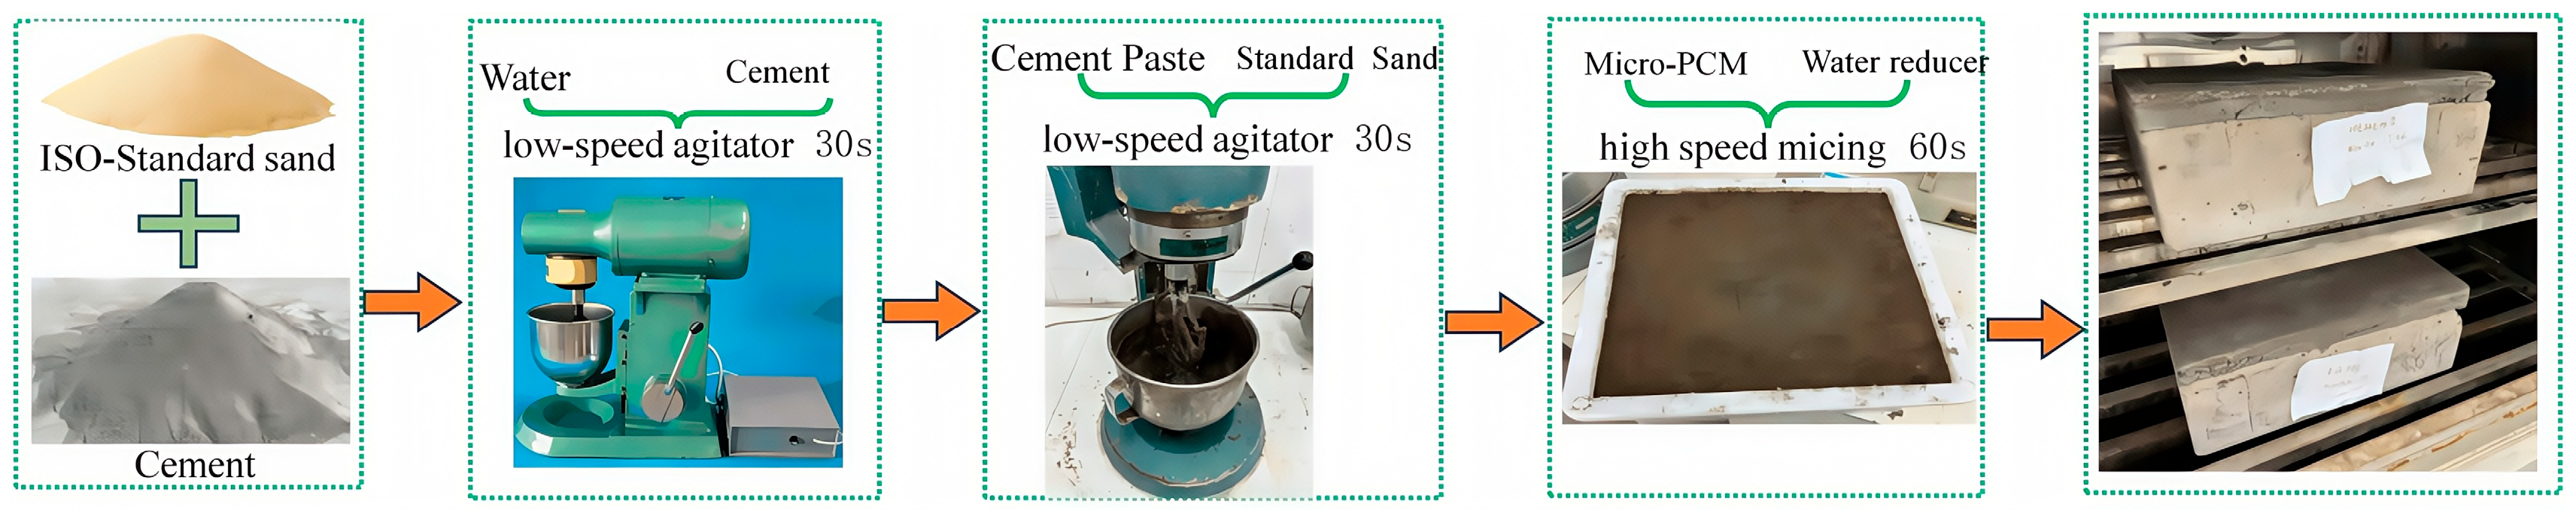
2.2. Sample Preparation
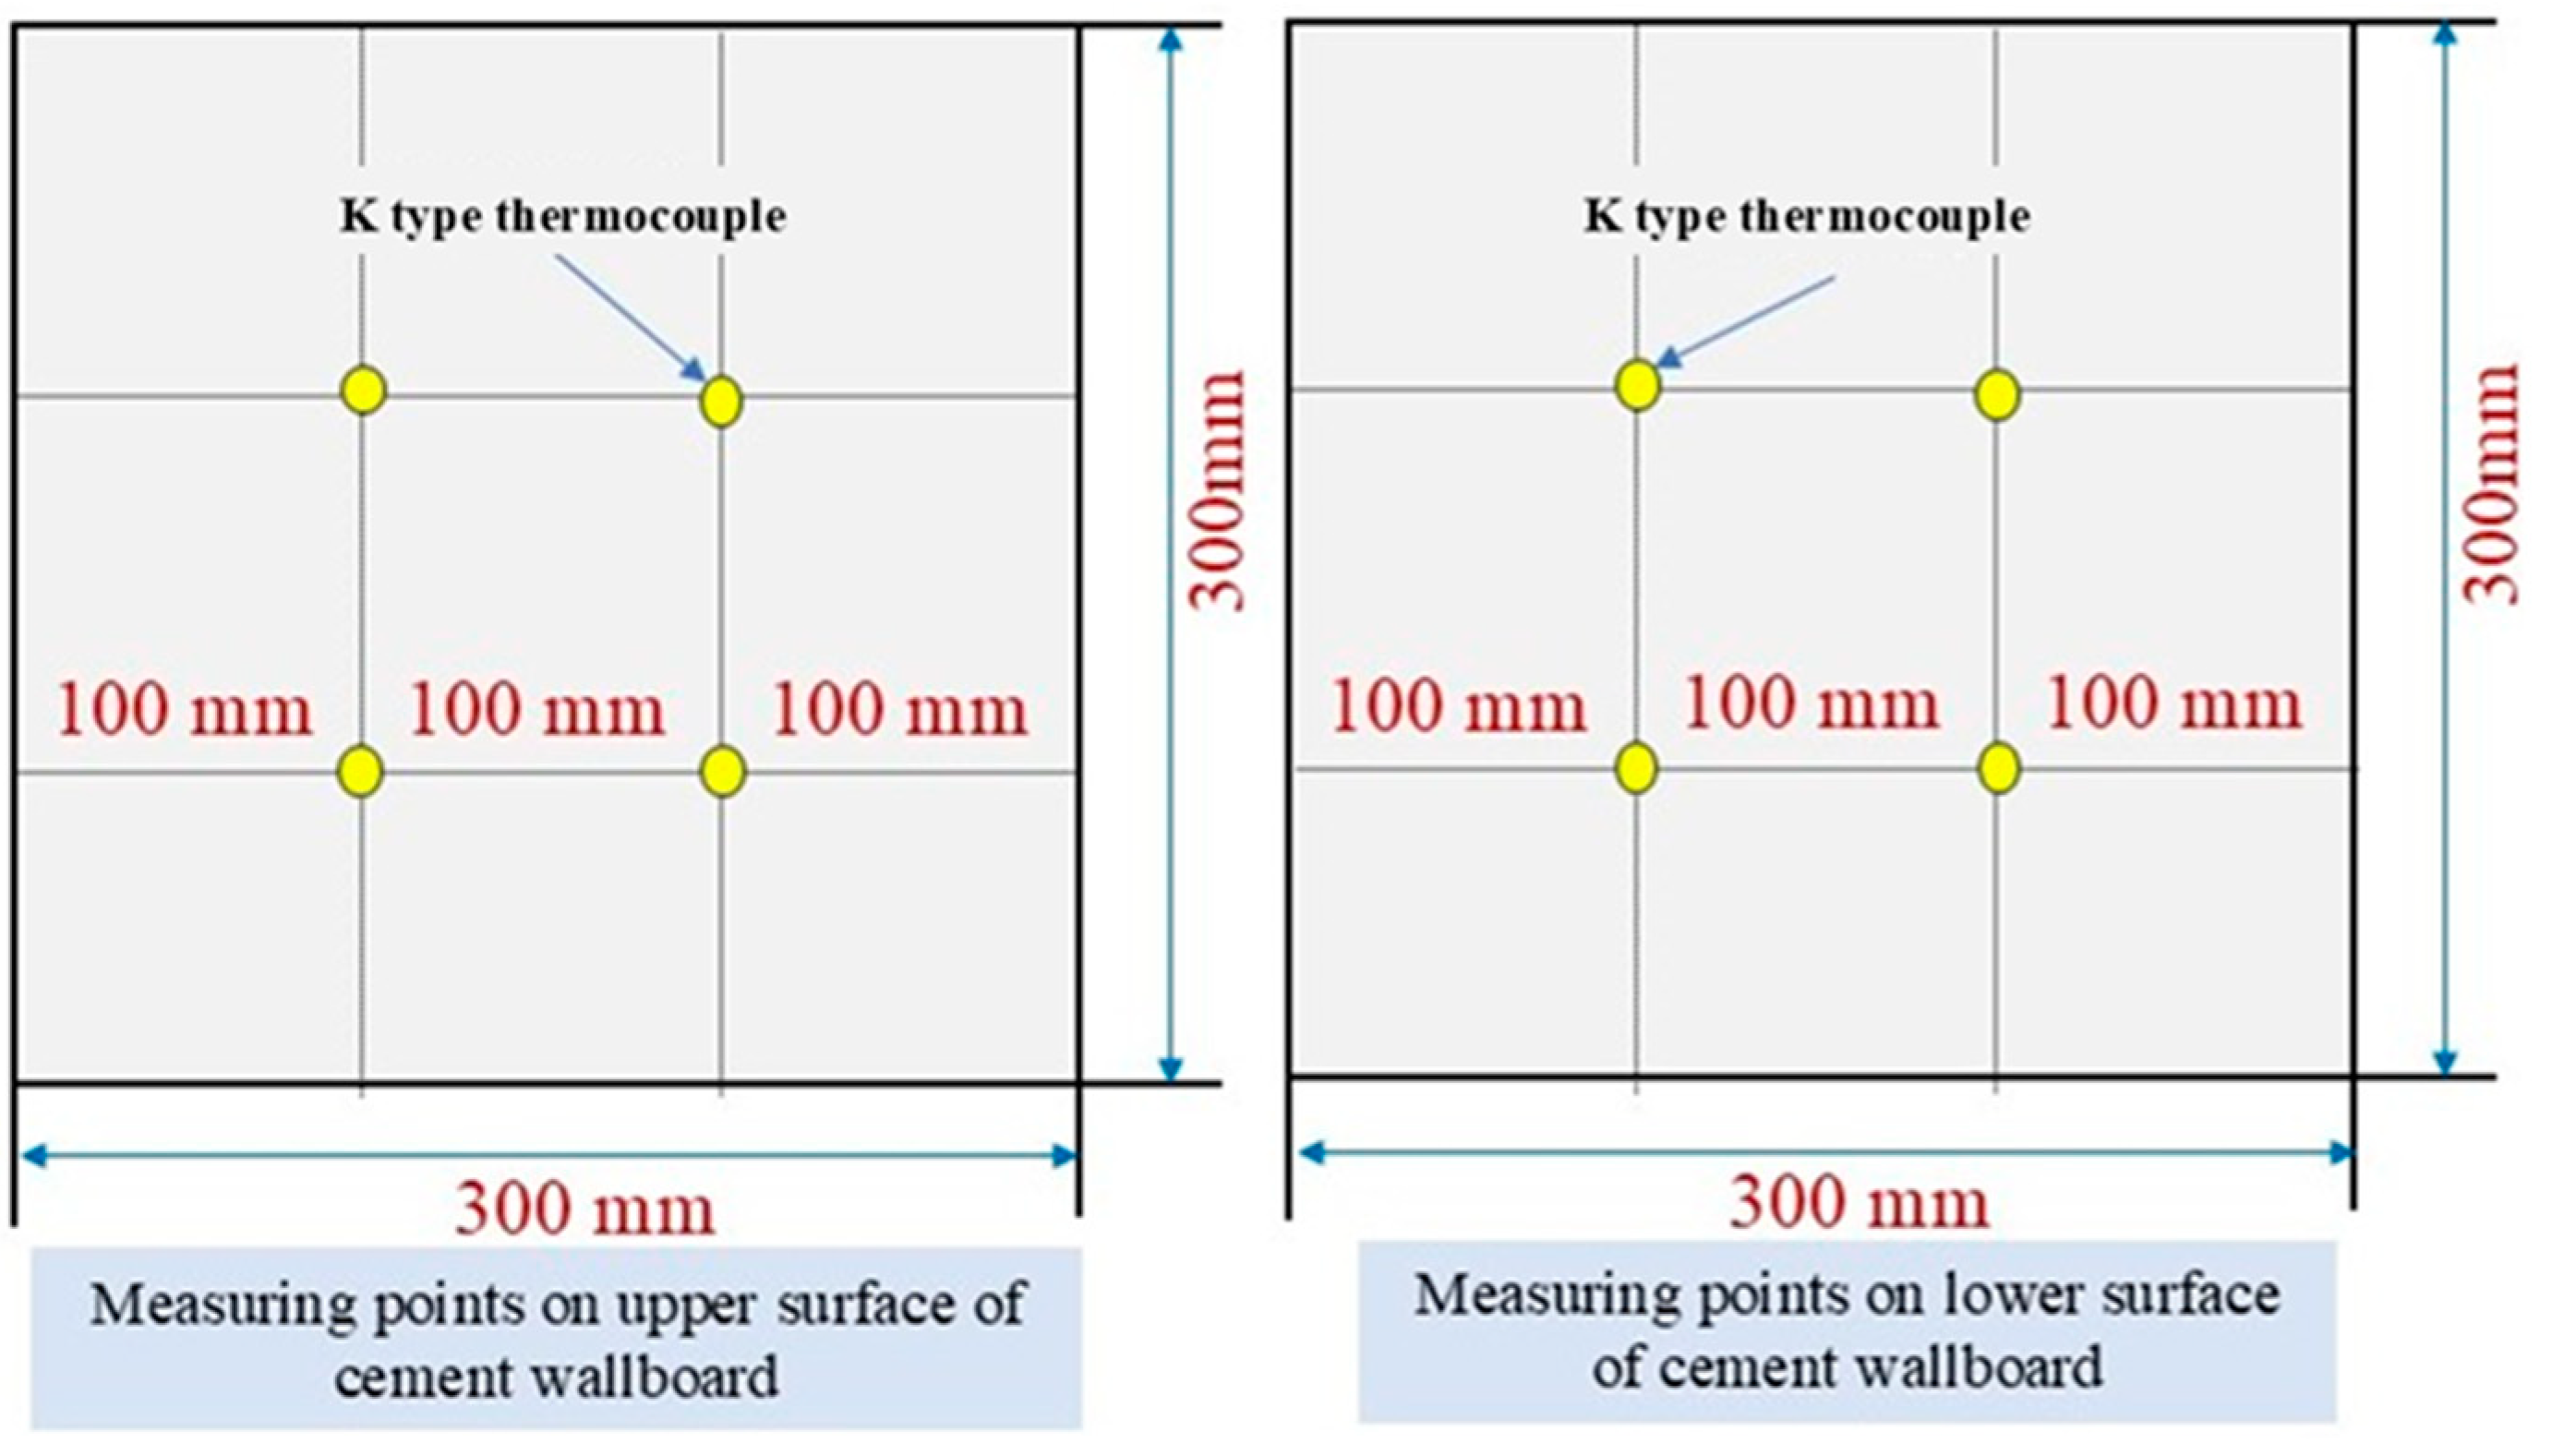
2.3. Thermal Storage Performance Tests
3. COMSOL Finite Element Analysis
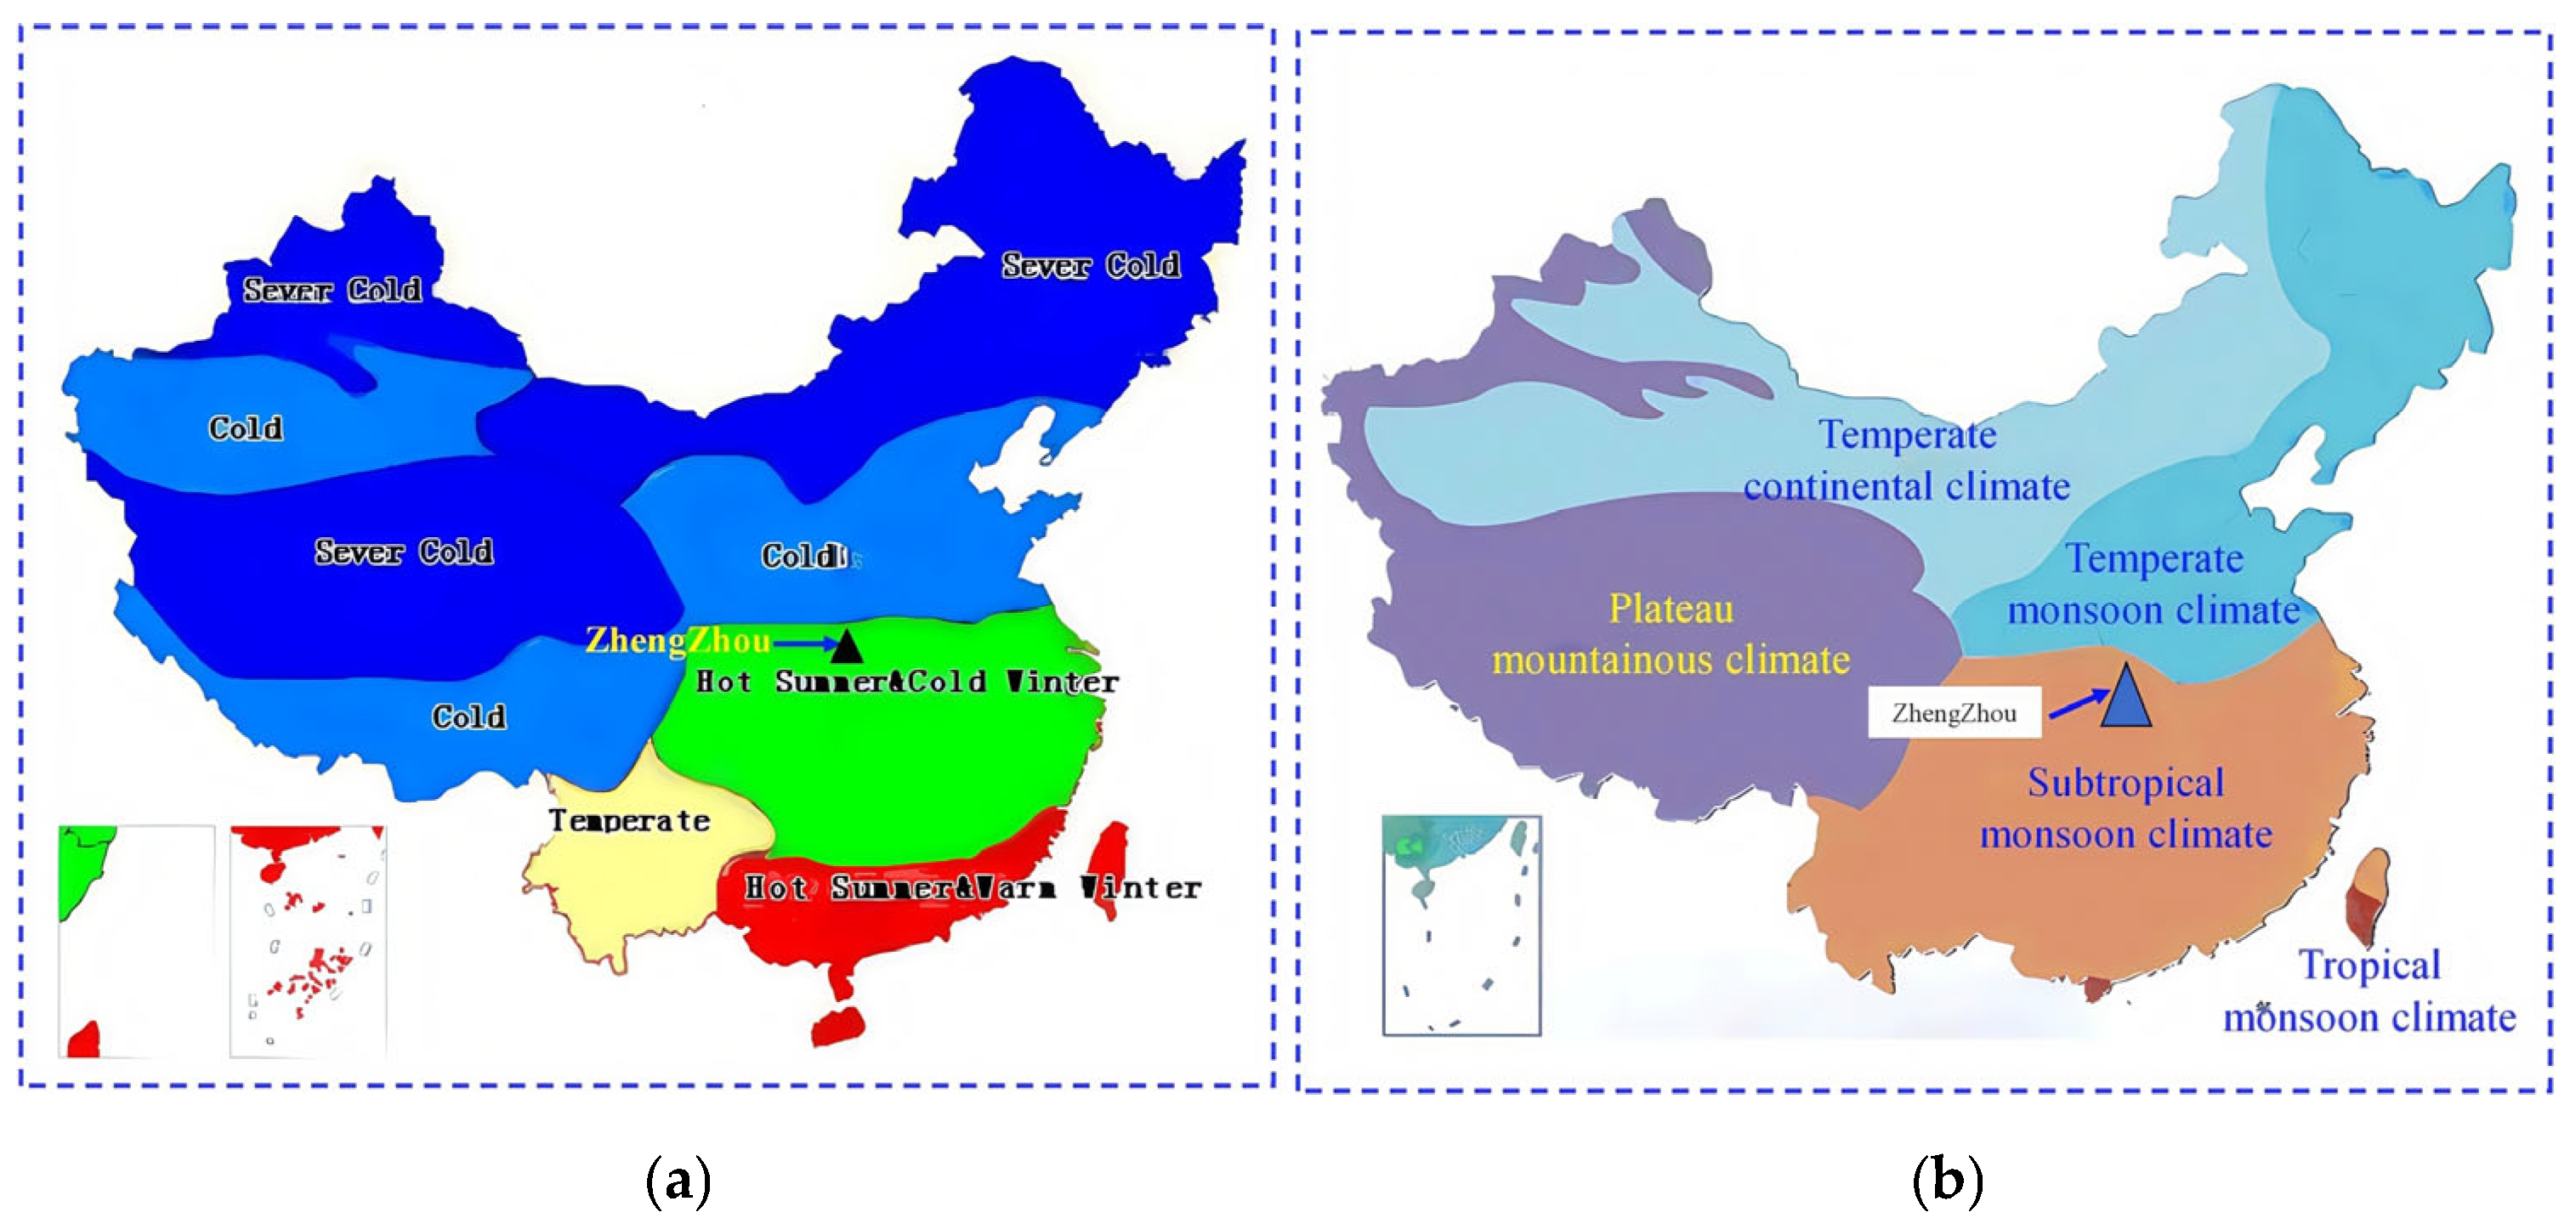
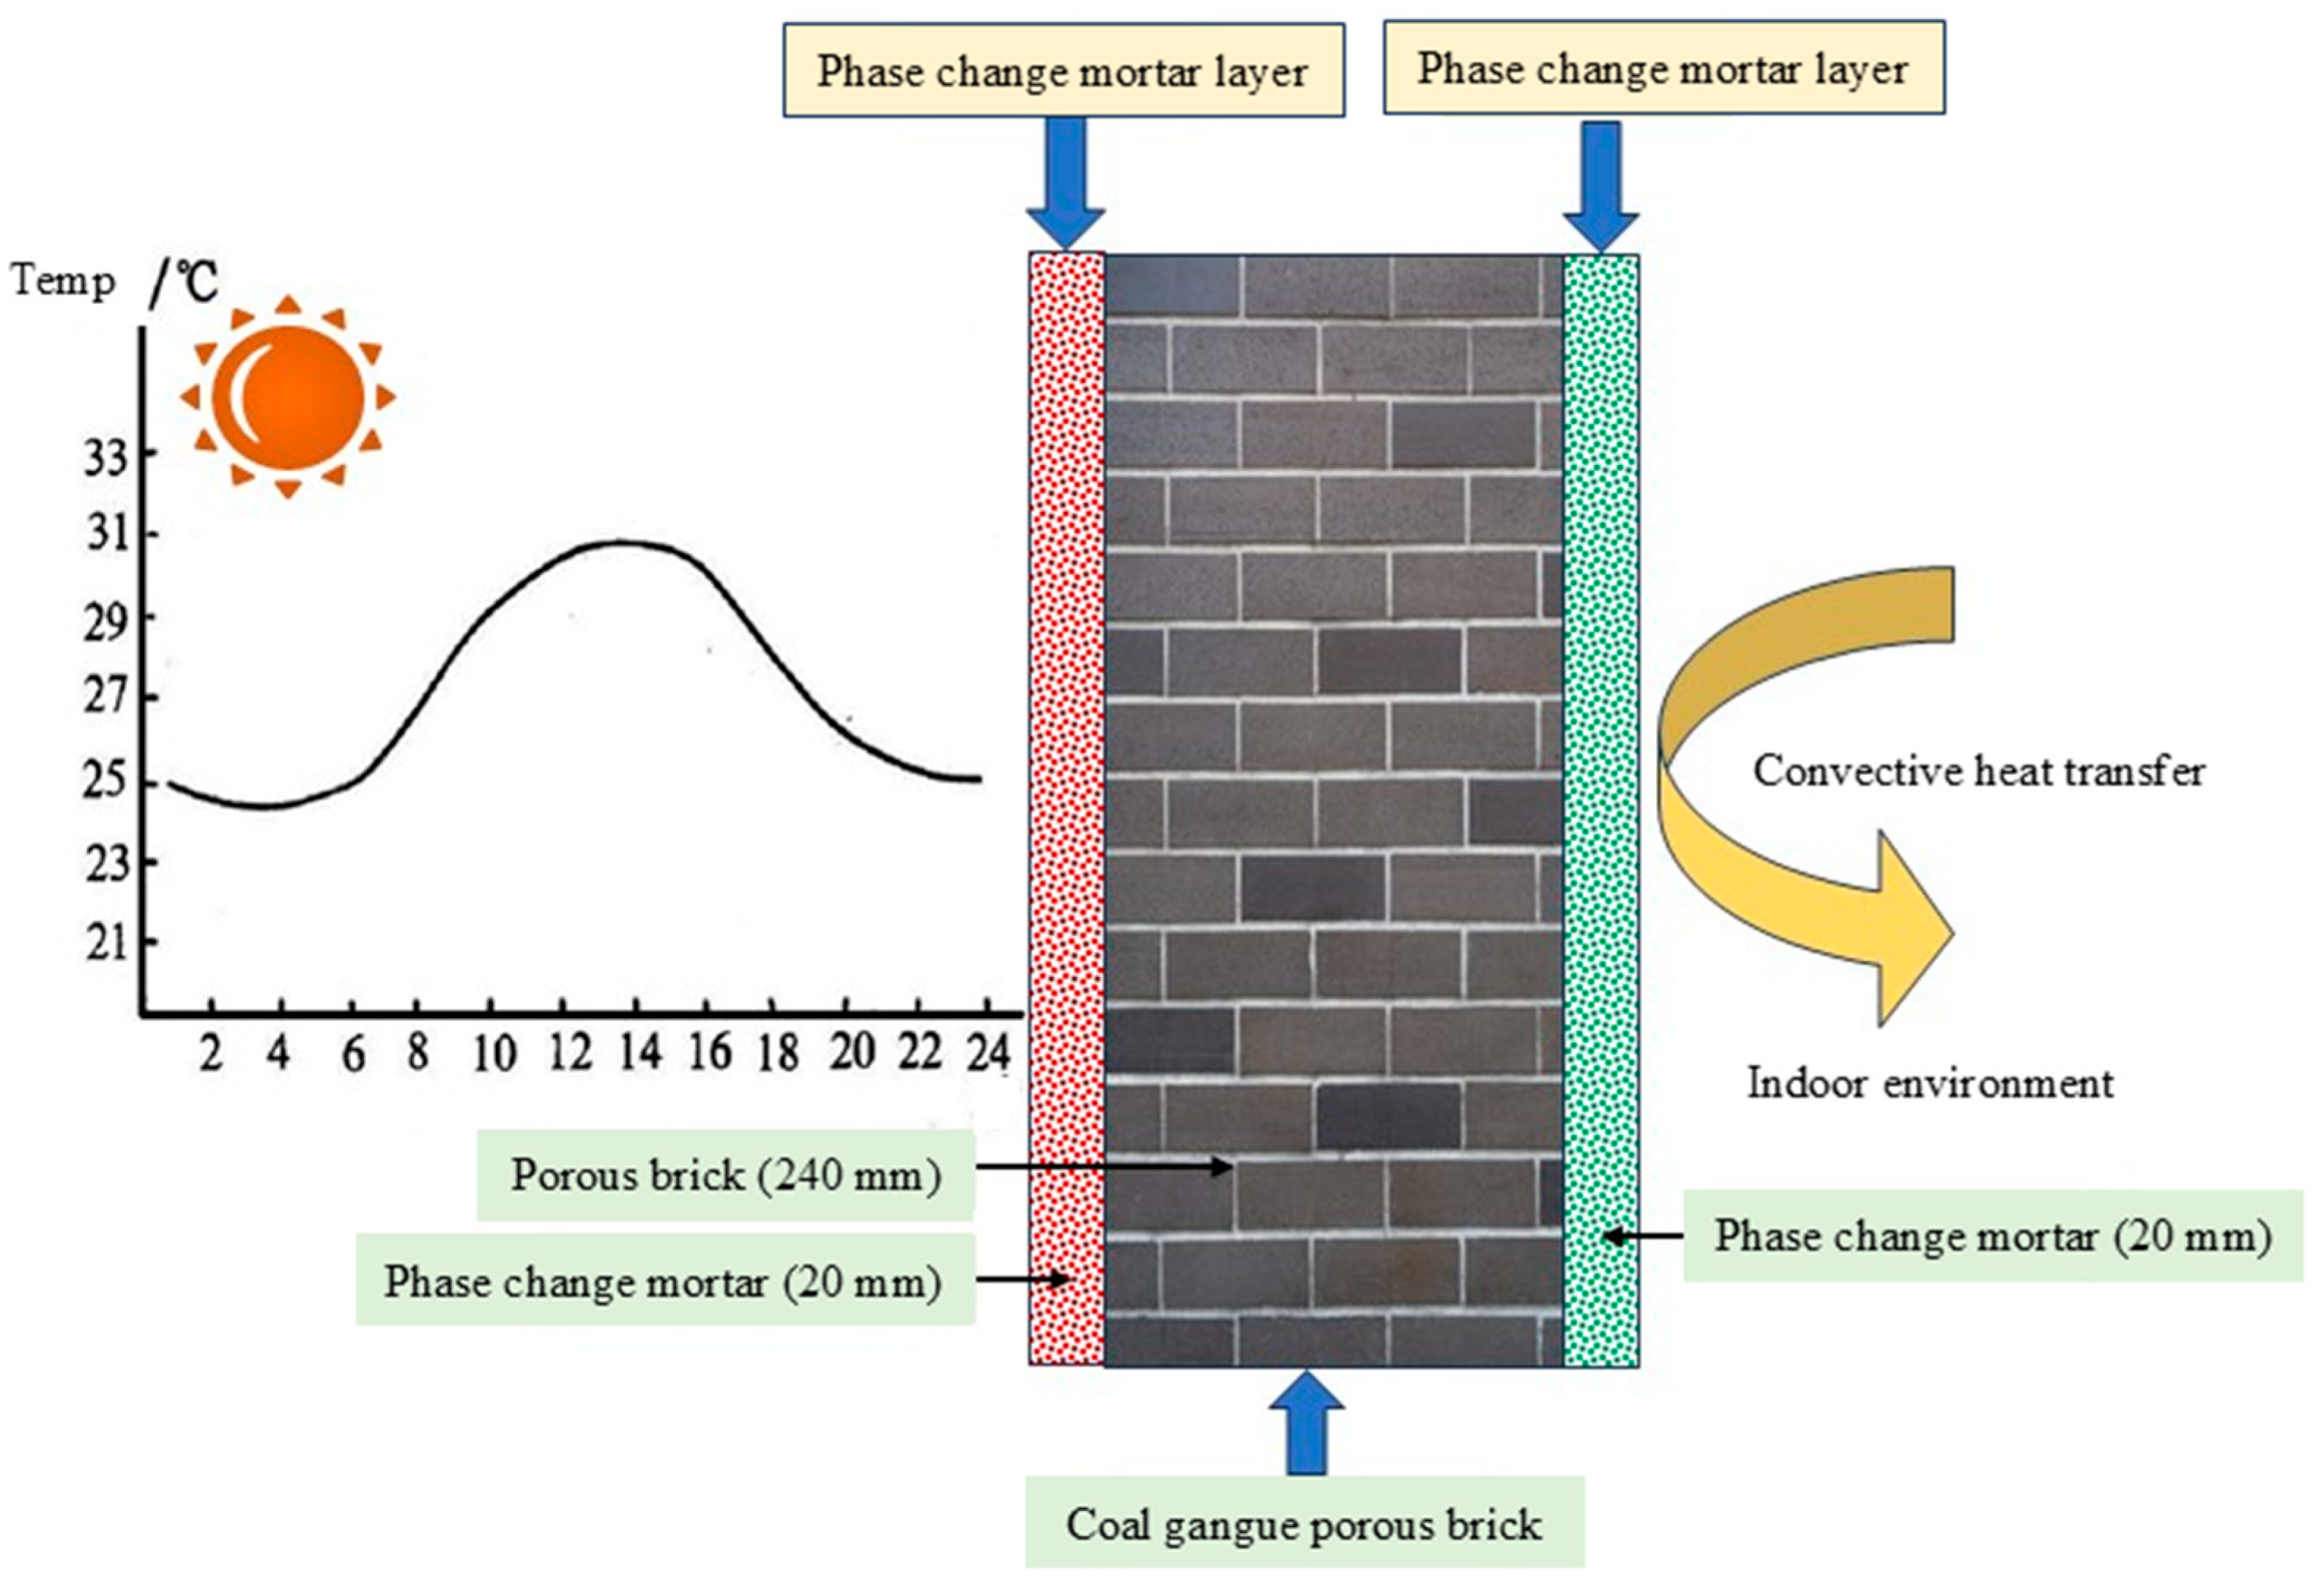
3.1. Climatic Conditions and Model Setup
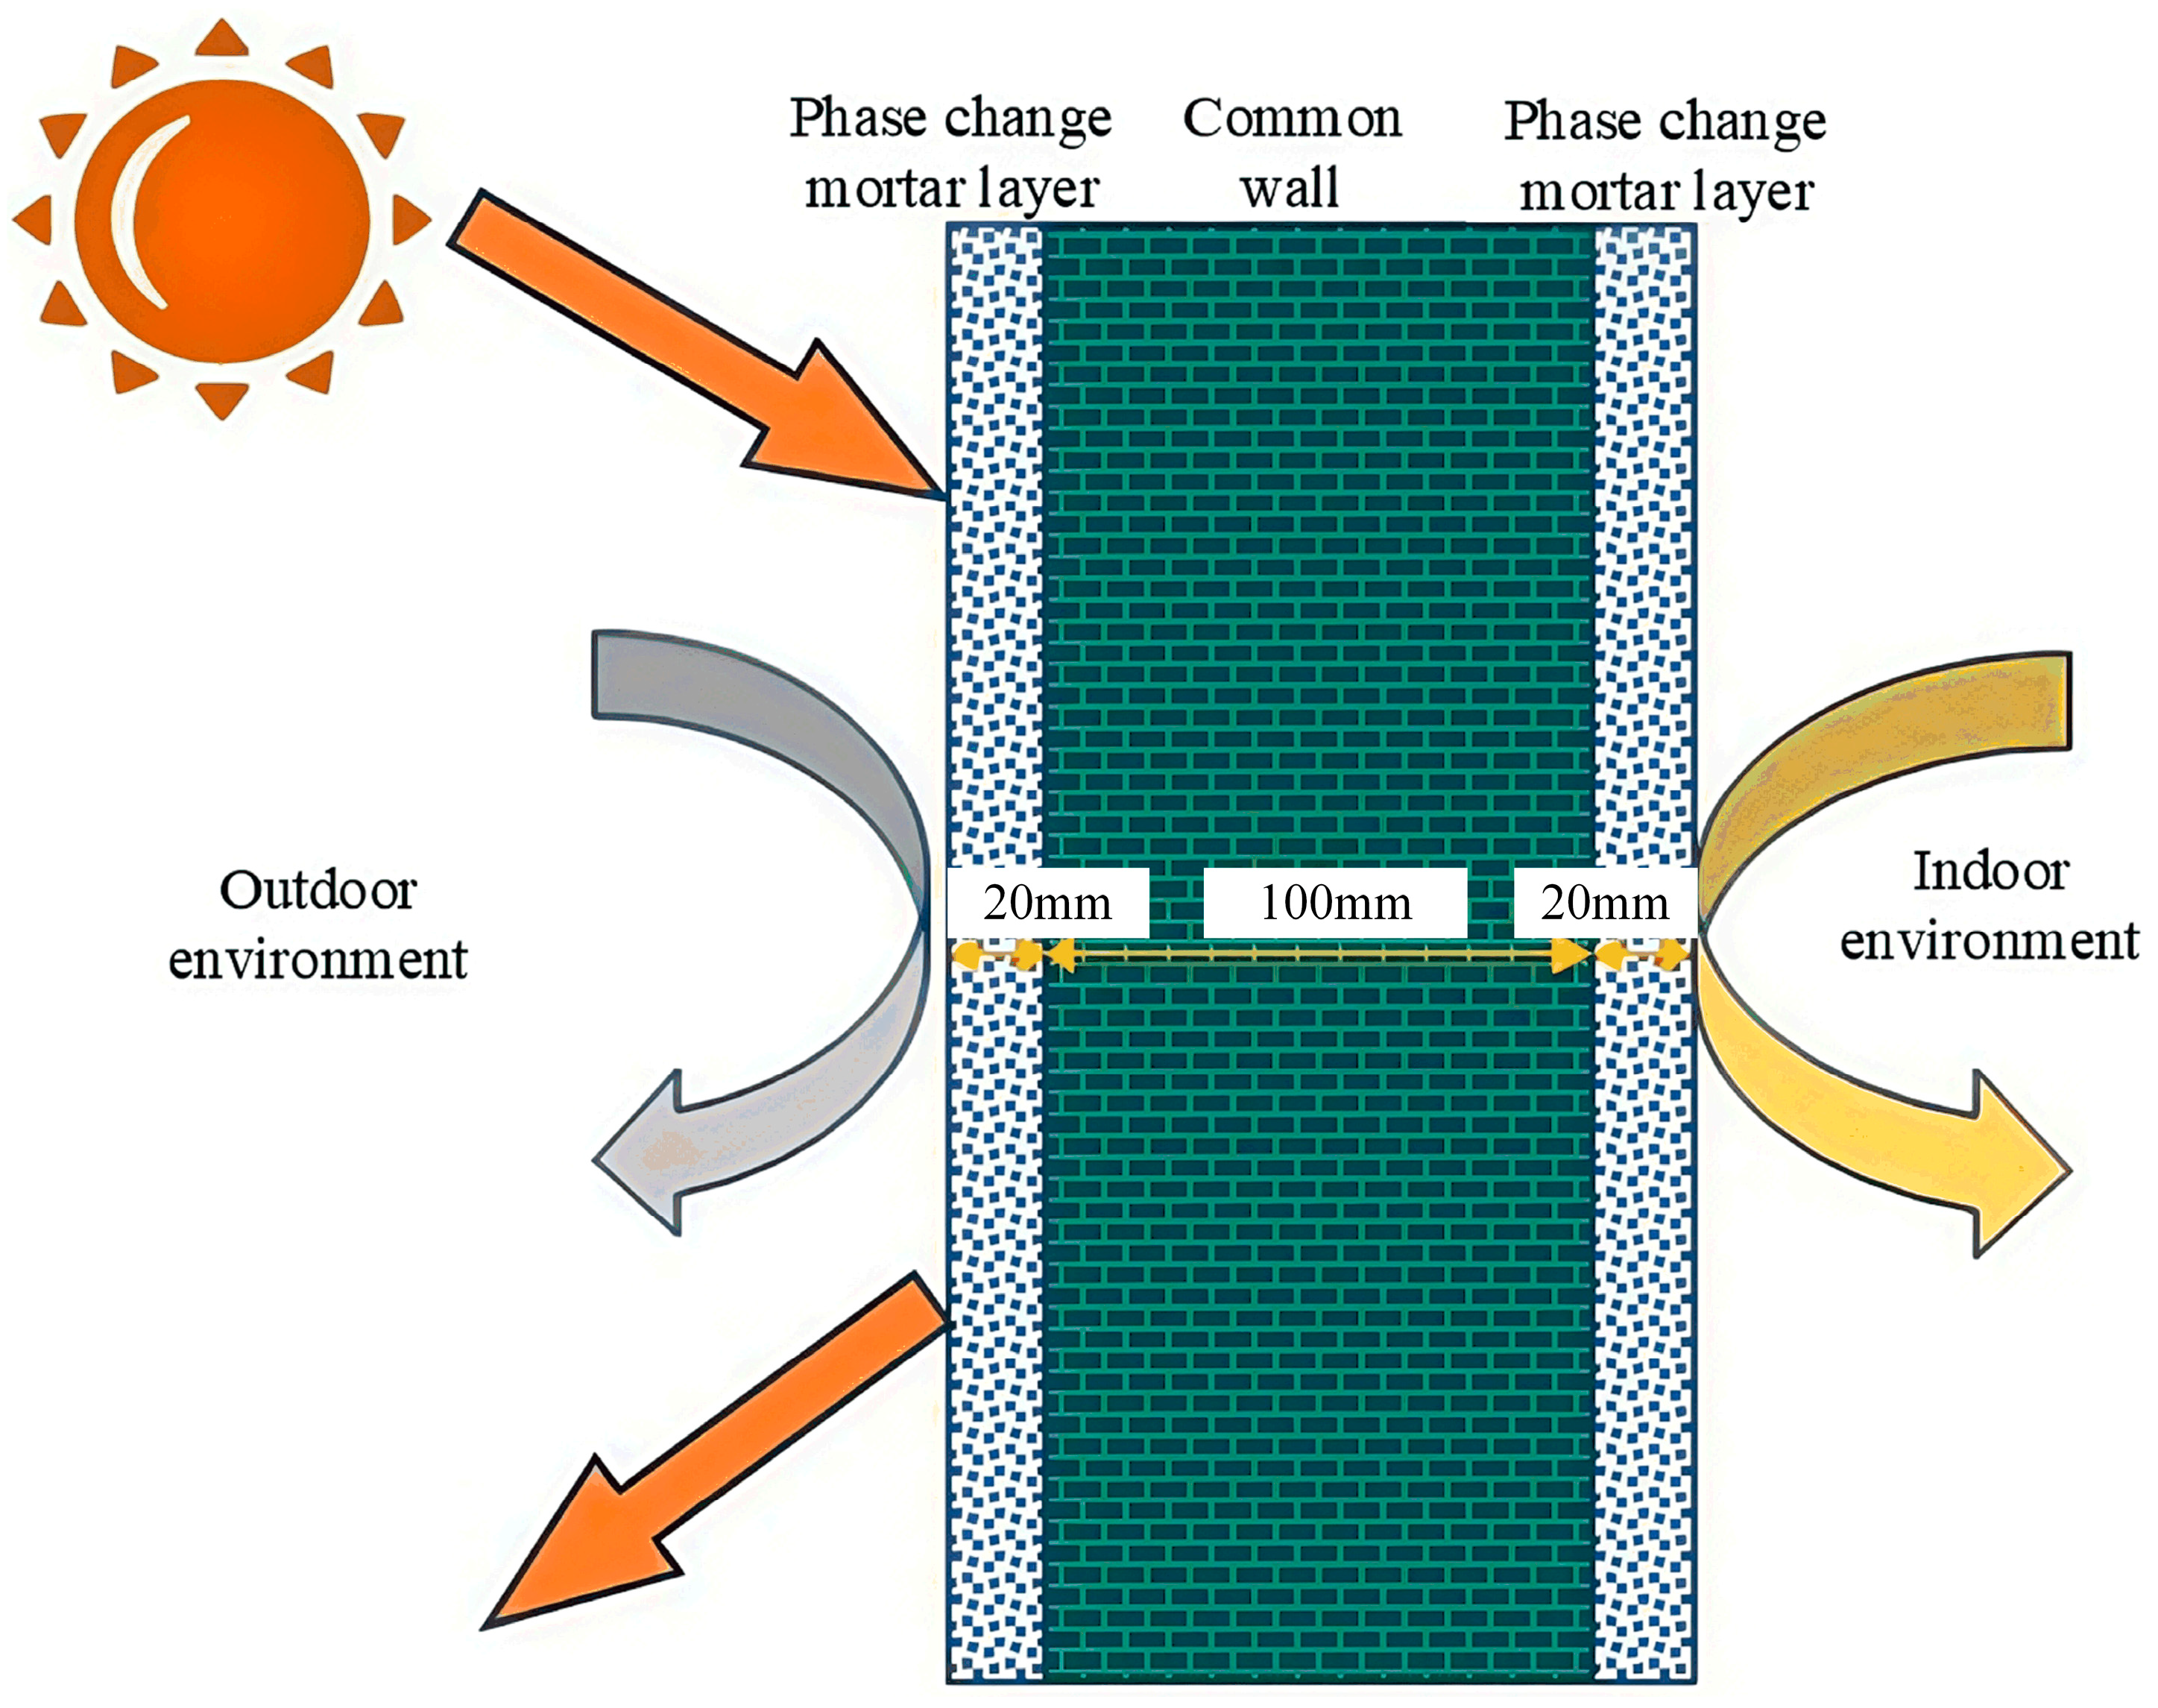
3.2. Geometric Model
3.3. Mathematical Model
- Because the wall thickness (100 mm) is much smaller than its width and height (300 mm), heat transfer is assumed to occur only in the thickness direction, allowing the process to be modeled as one-dimensional heat conduction.
- Each material layer is treated as an isotropic medium, and its thermophysical properties are constant during the calculation.
- The effects of natural convection and volume change during the melting phase are neglected, and the influence of undercooling during solidification is ignored.
- The top and bottom boundaries of the double-layer phase-change wall are assumed to be adiabatic, with no heat flow across these surfaces.
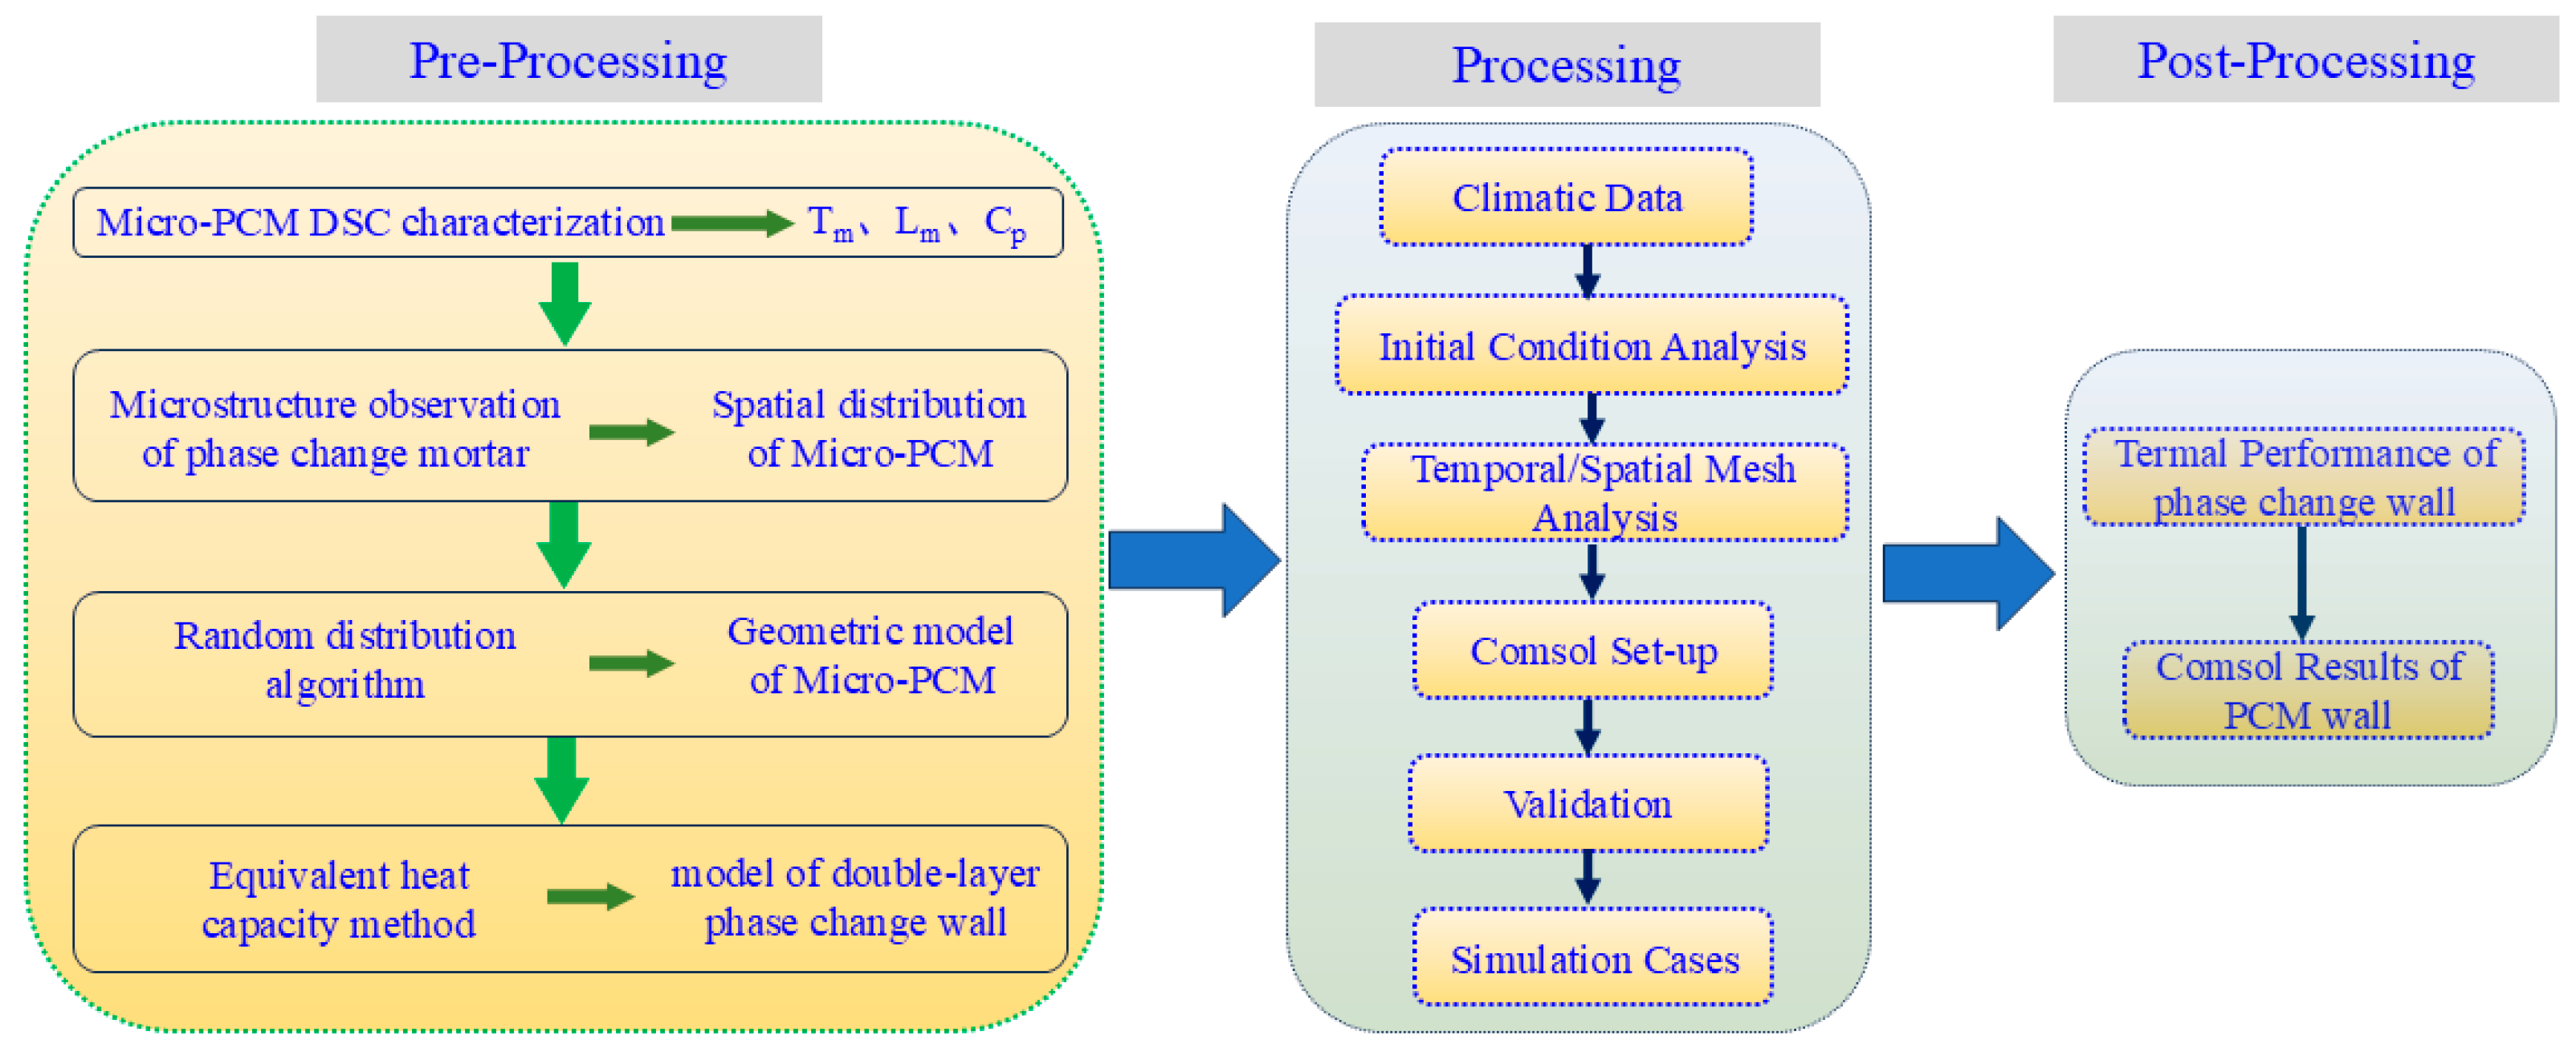
3.4. Integrated Modeling Approach for Micro-PCM Distribution and Thermal Analysis
3.5. Boundary and Initial Conditions
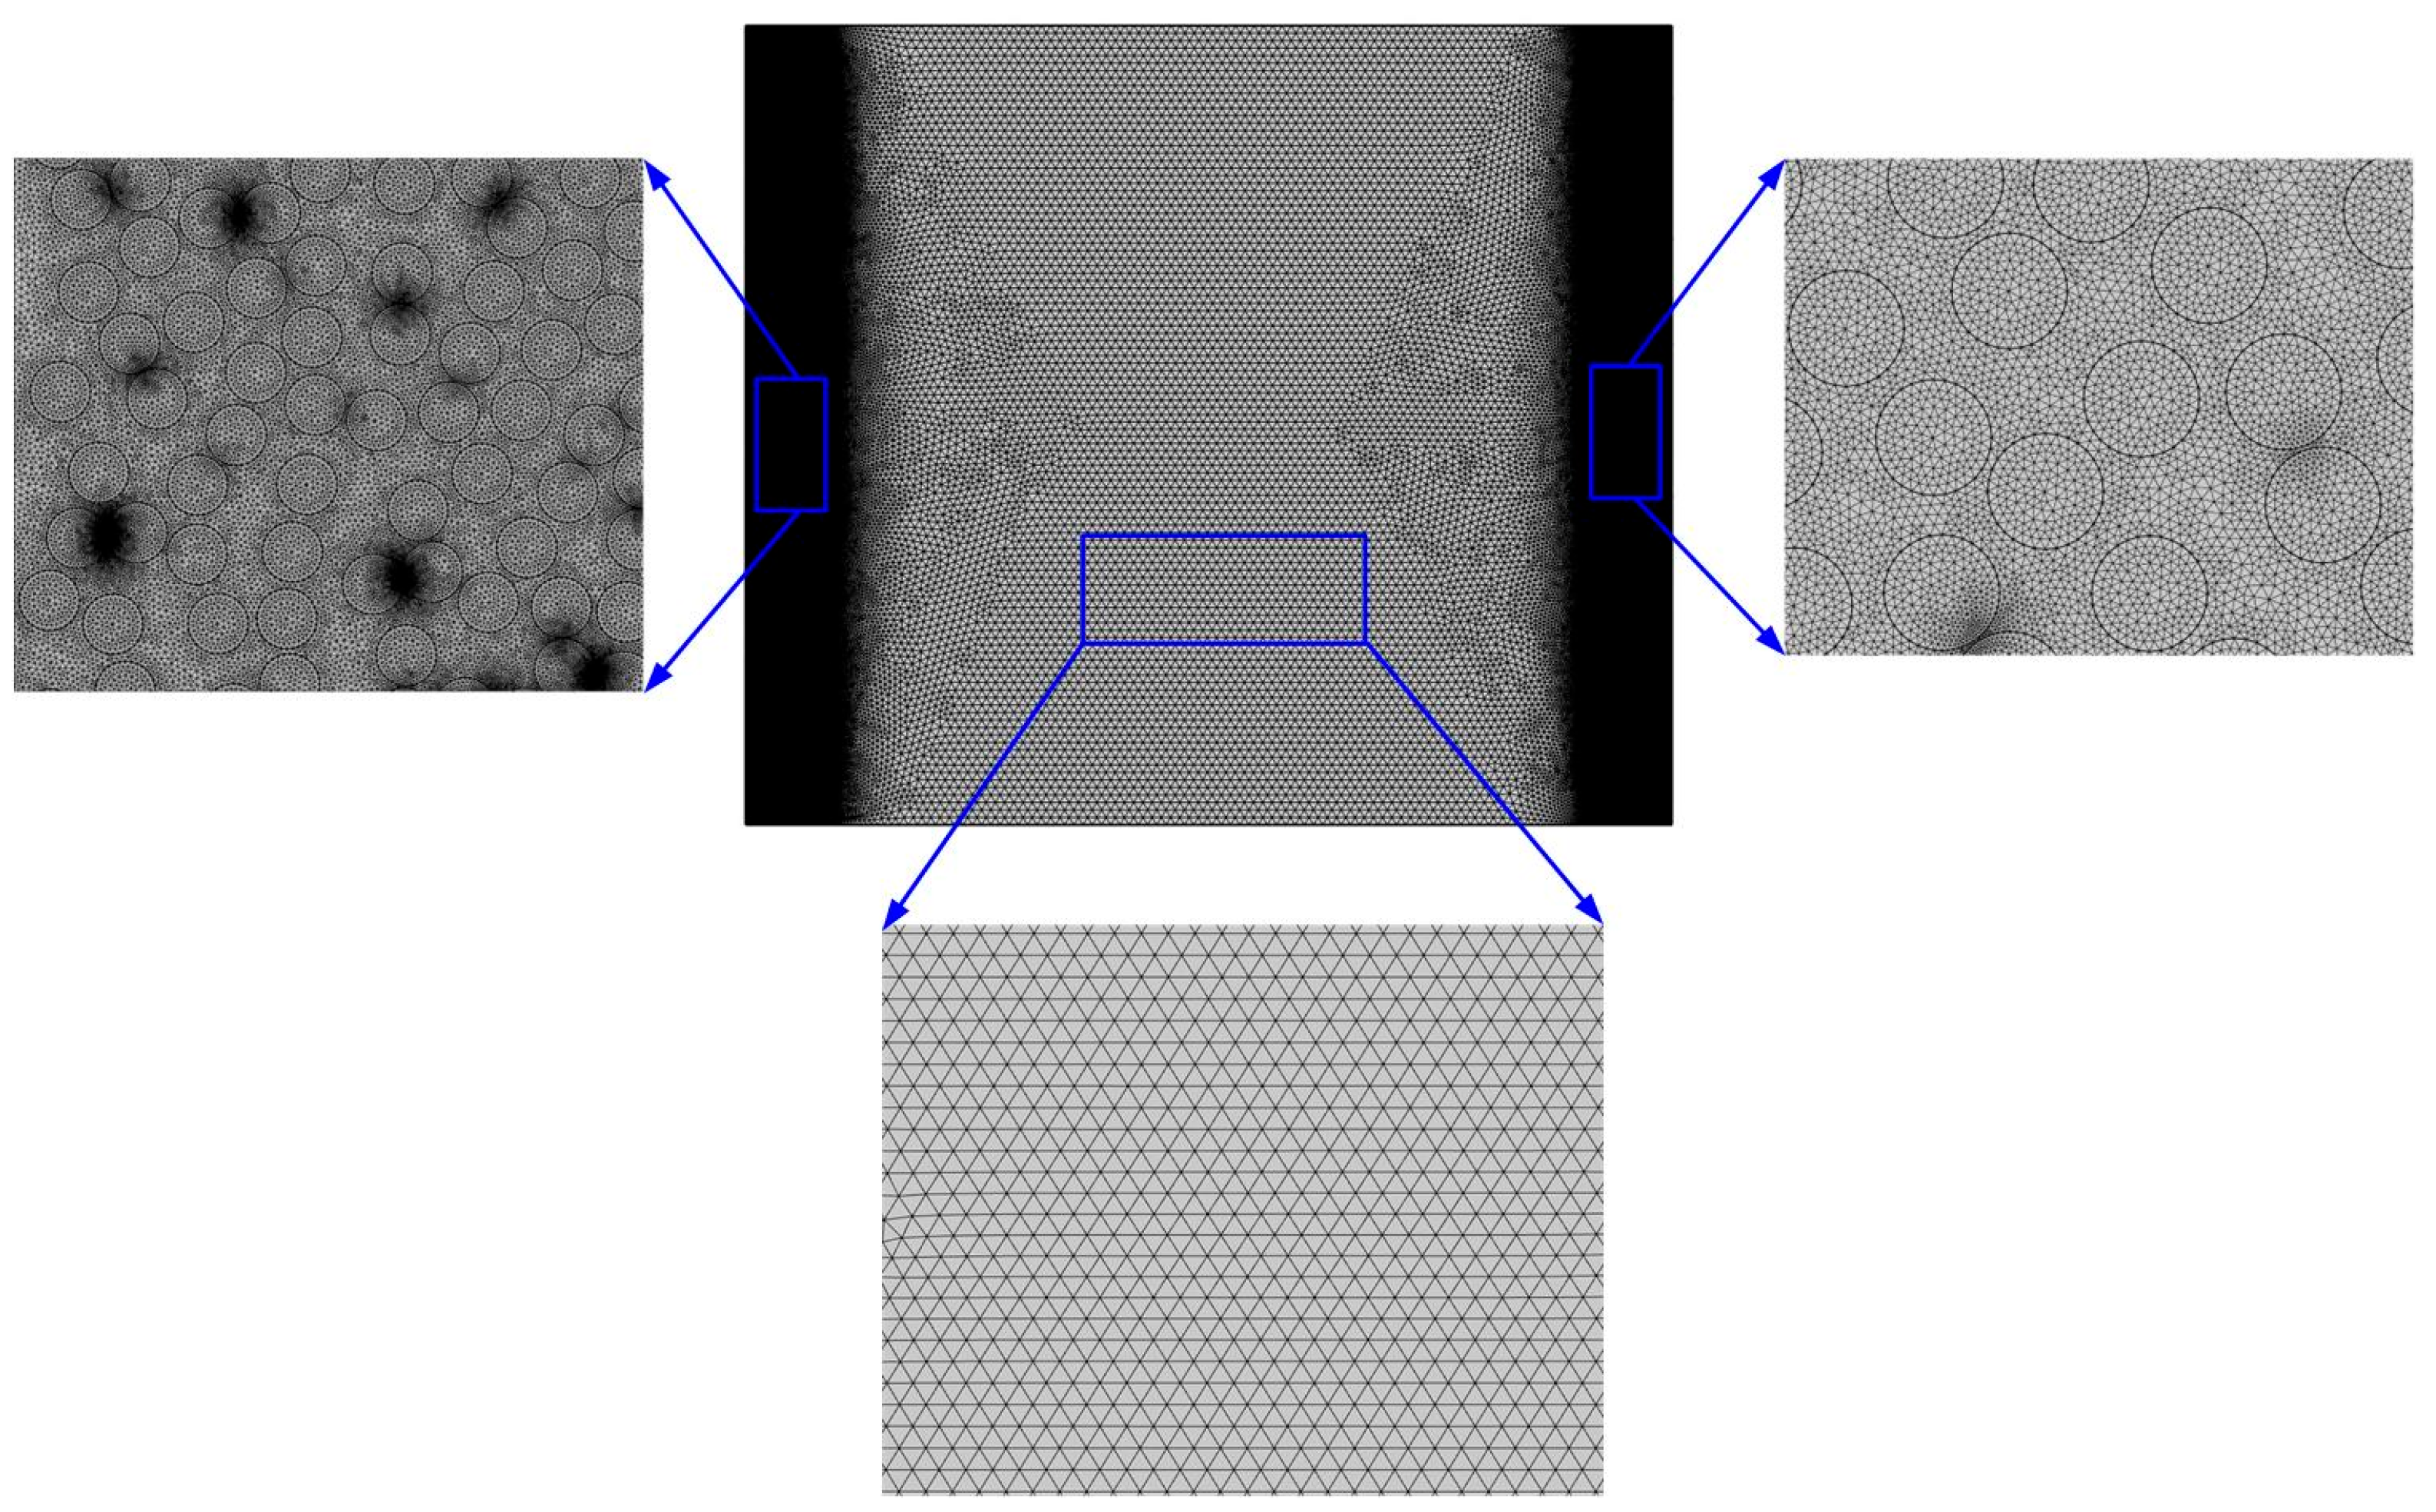
3.6. Mesh Division
4. Results and Discussion
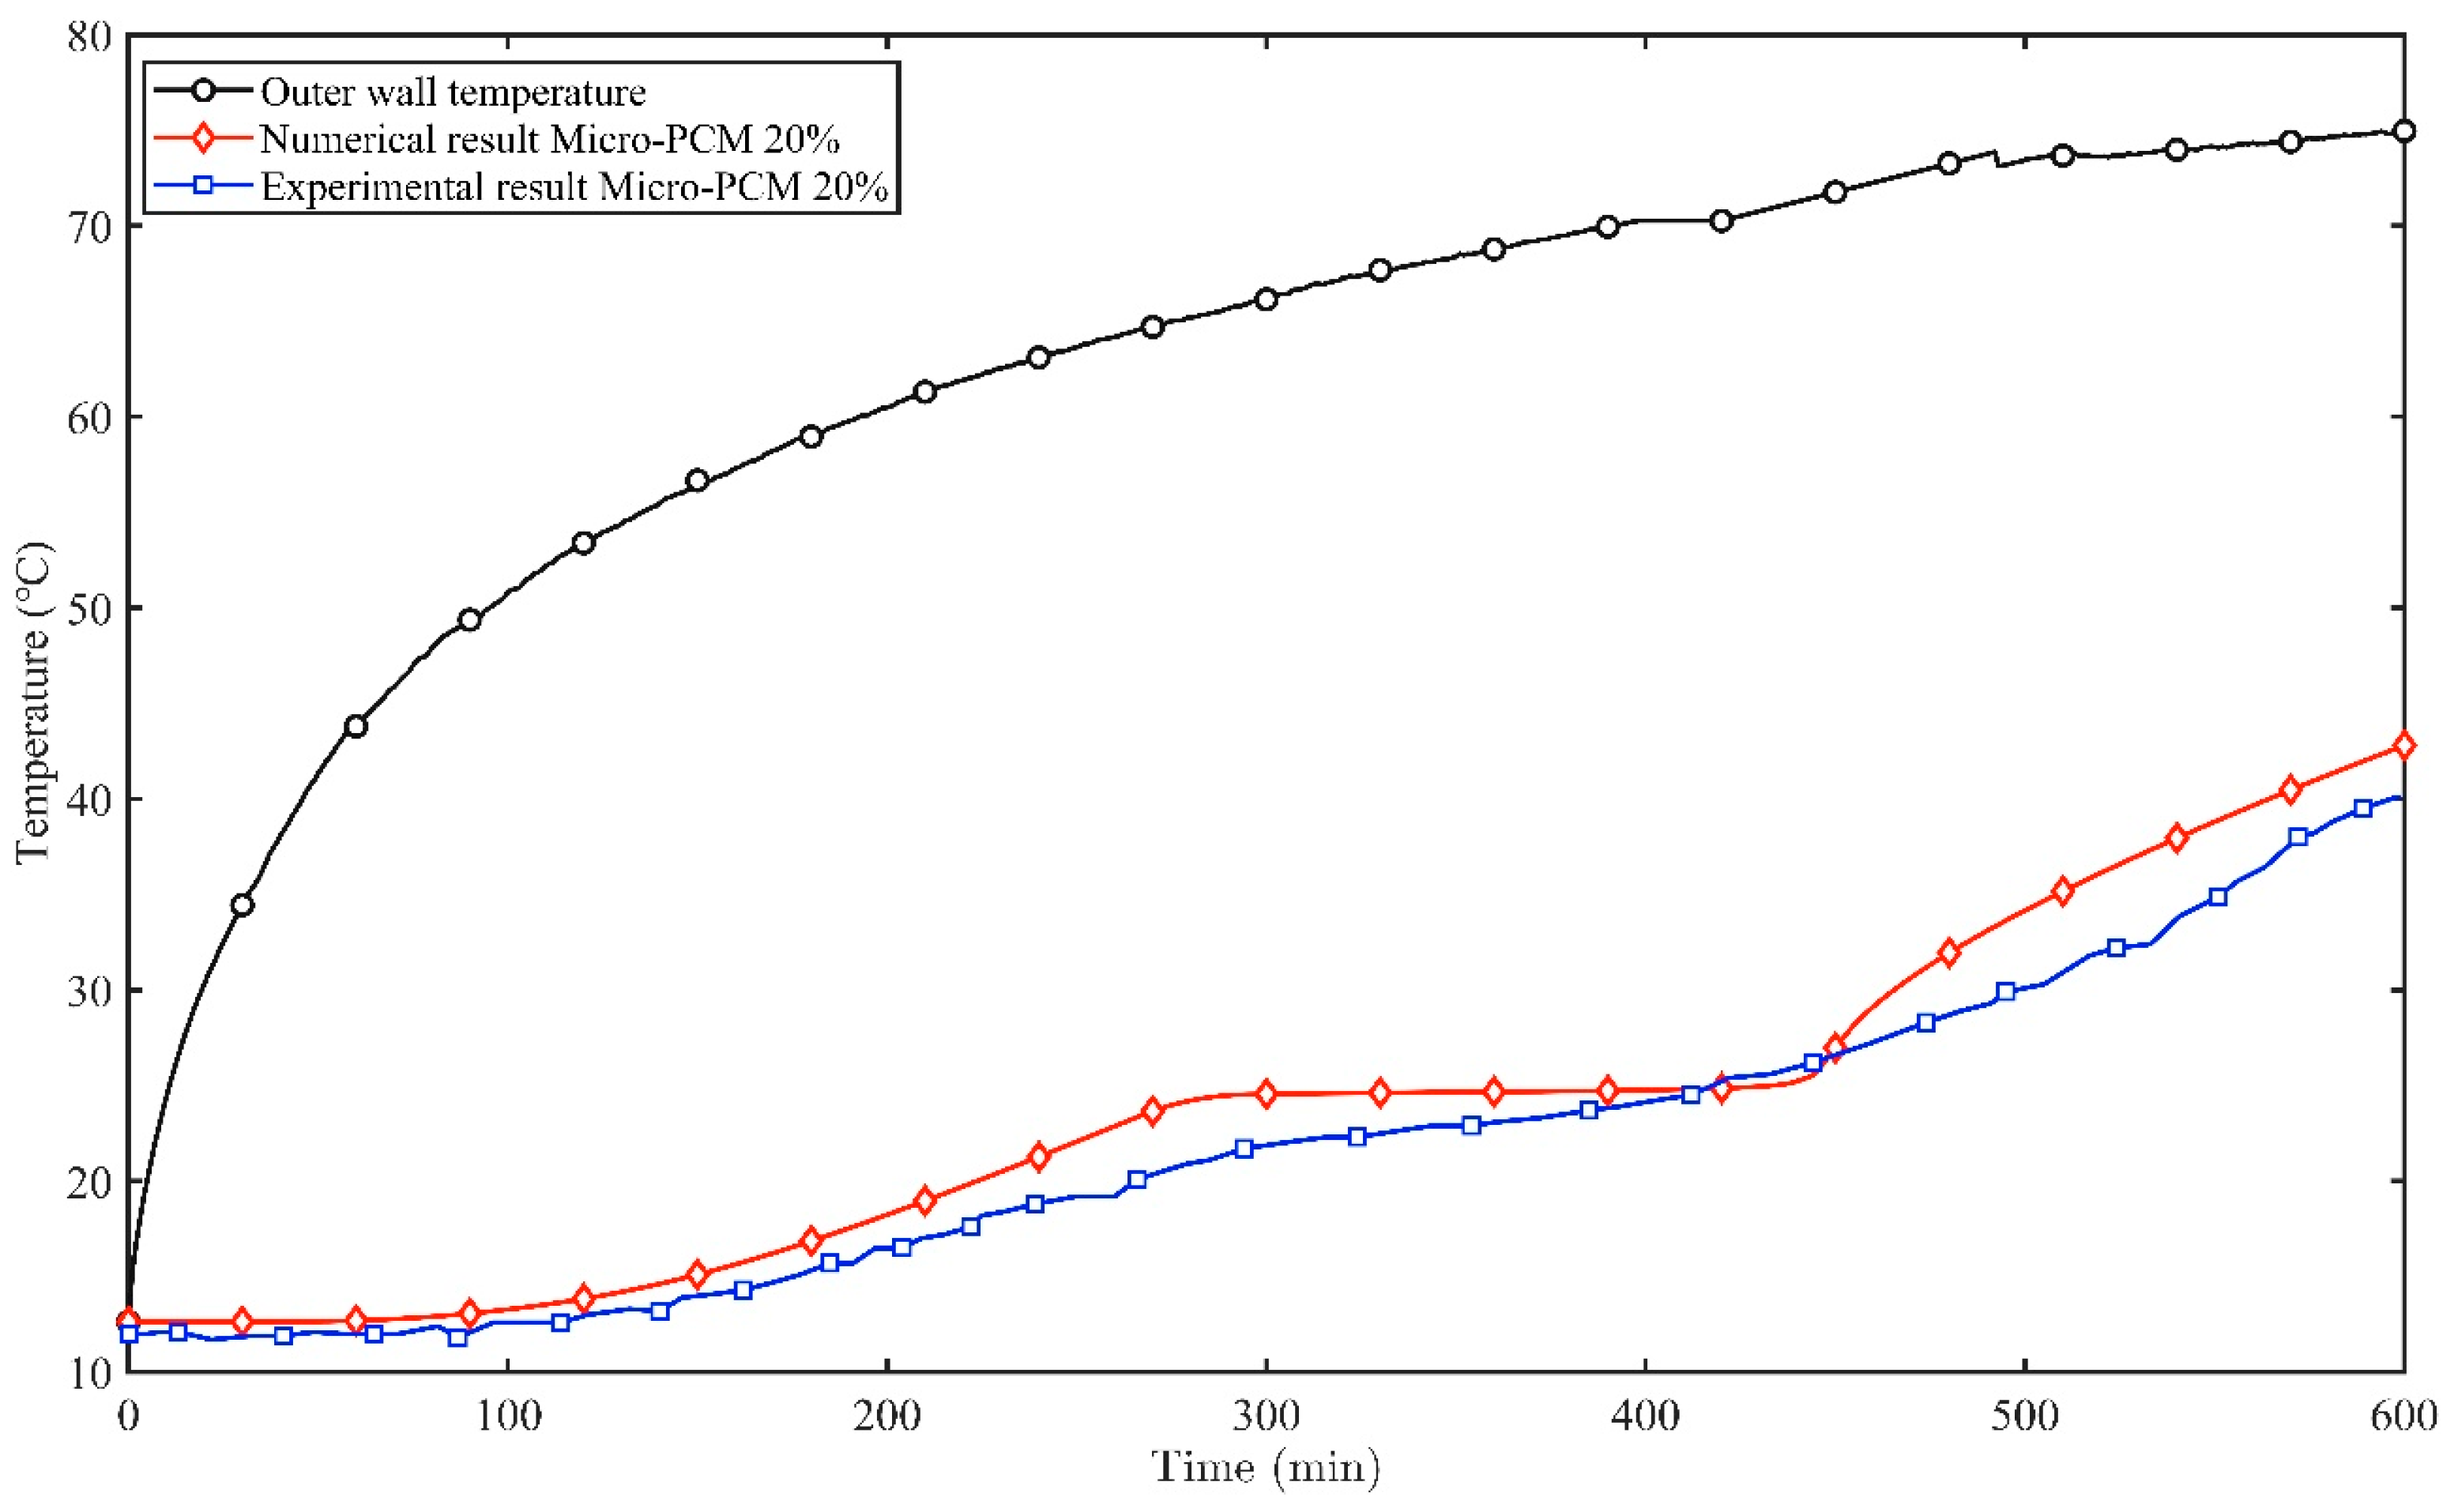
4.1. Model Validation
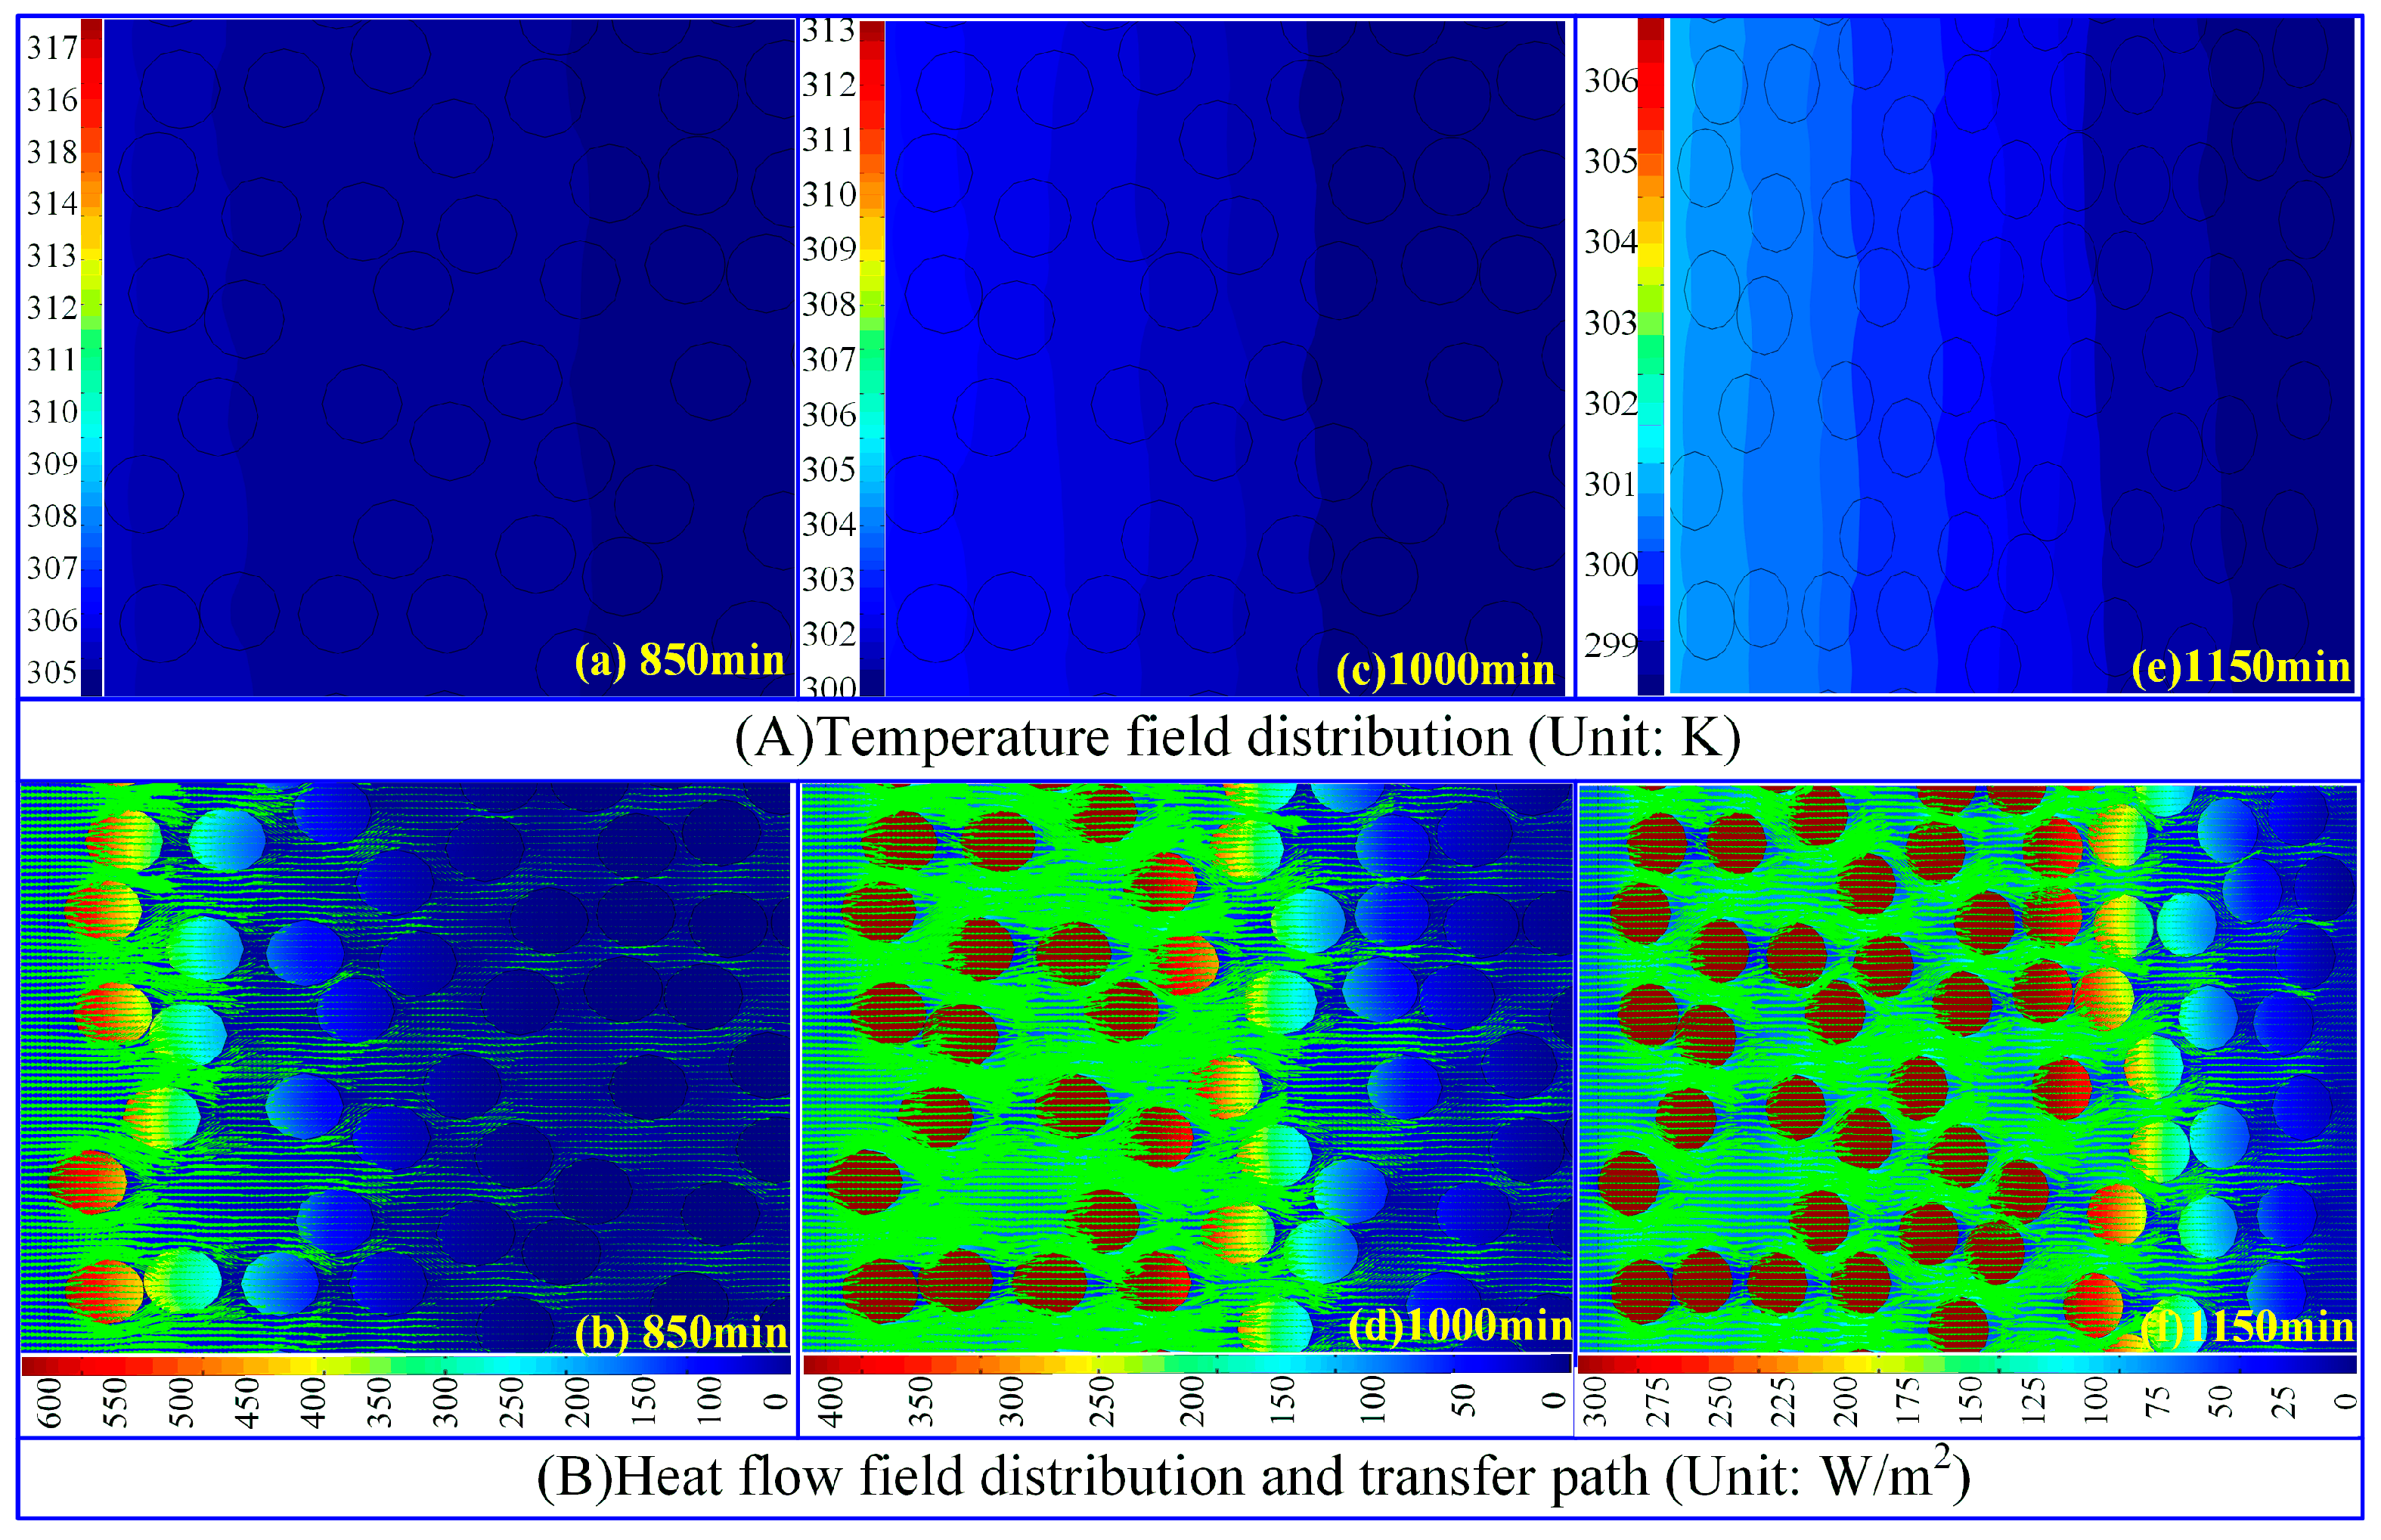
4.2. Energy Storage Analysis
- (1)
- Energy Storage Process of Micro-PCM on the Exterior Wall
- (2)
- Energy Release Process of Micro-PCM on the Exterior Wall
- (3)
- Energy Storage Process of Micro-PCM on the Interior Wall
- (4)
- Energy Release Process of Micro-PCM on the Interior Wall
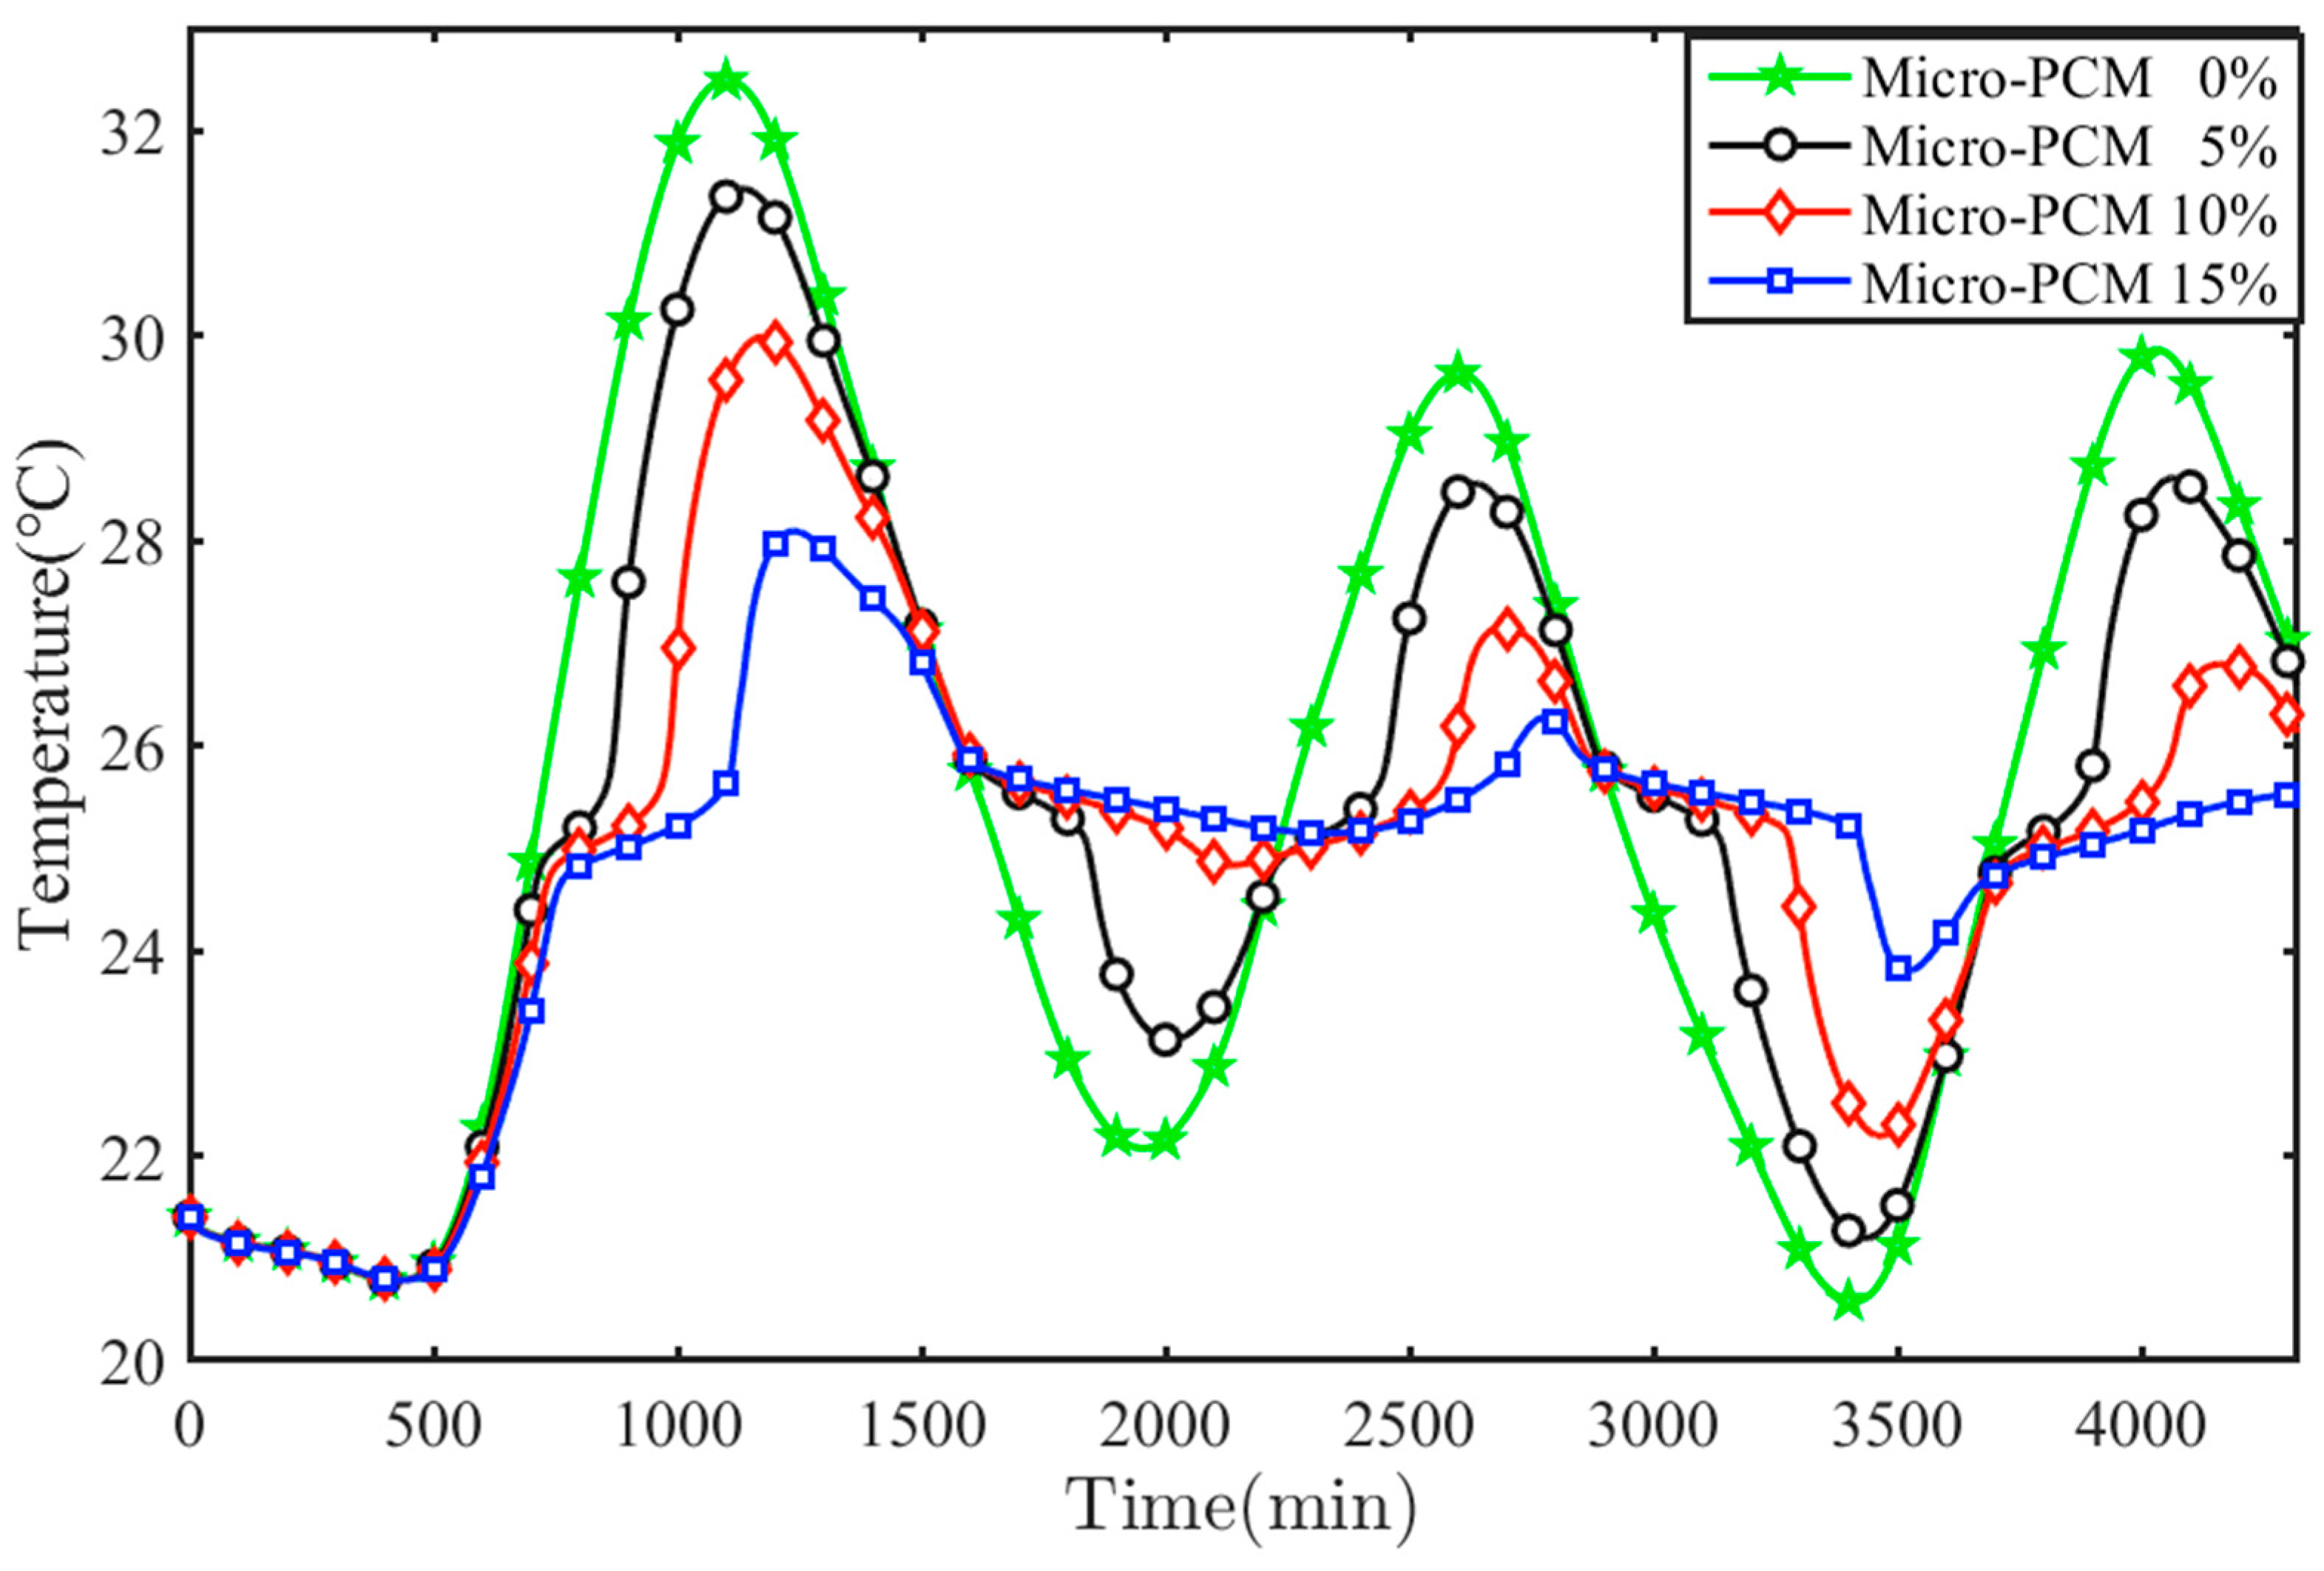
4.3. Effect of Micro-PCM Content on Wall Thermal Performance
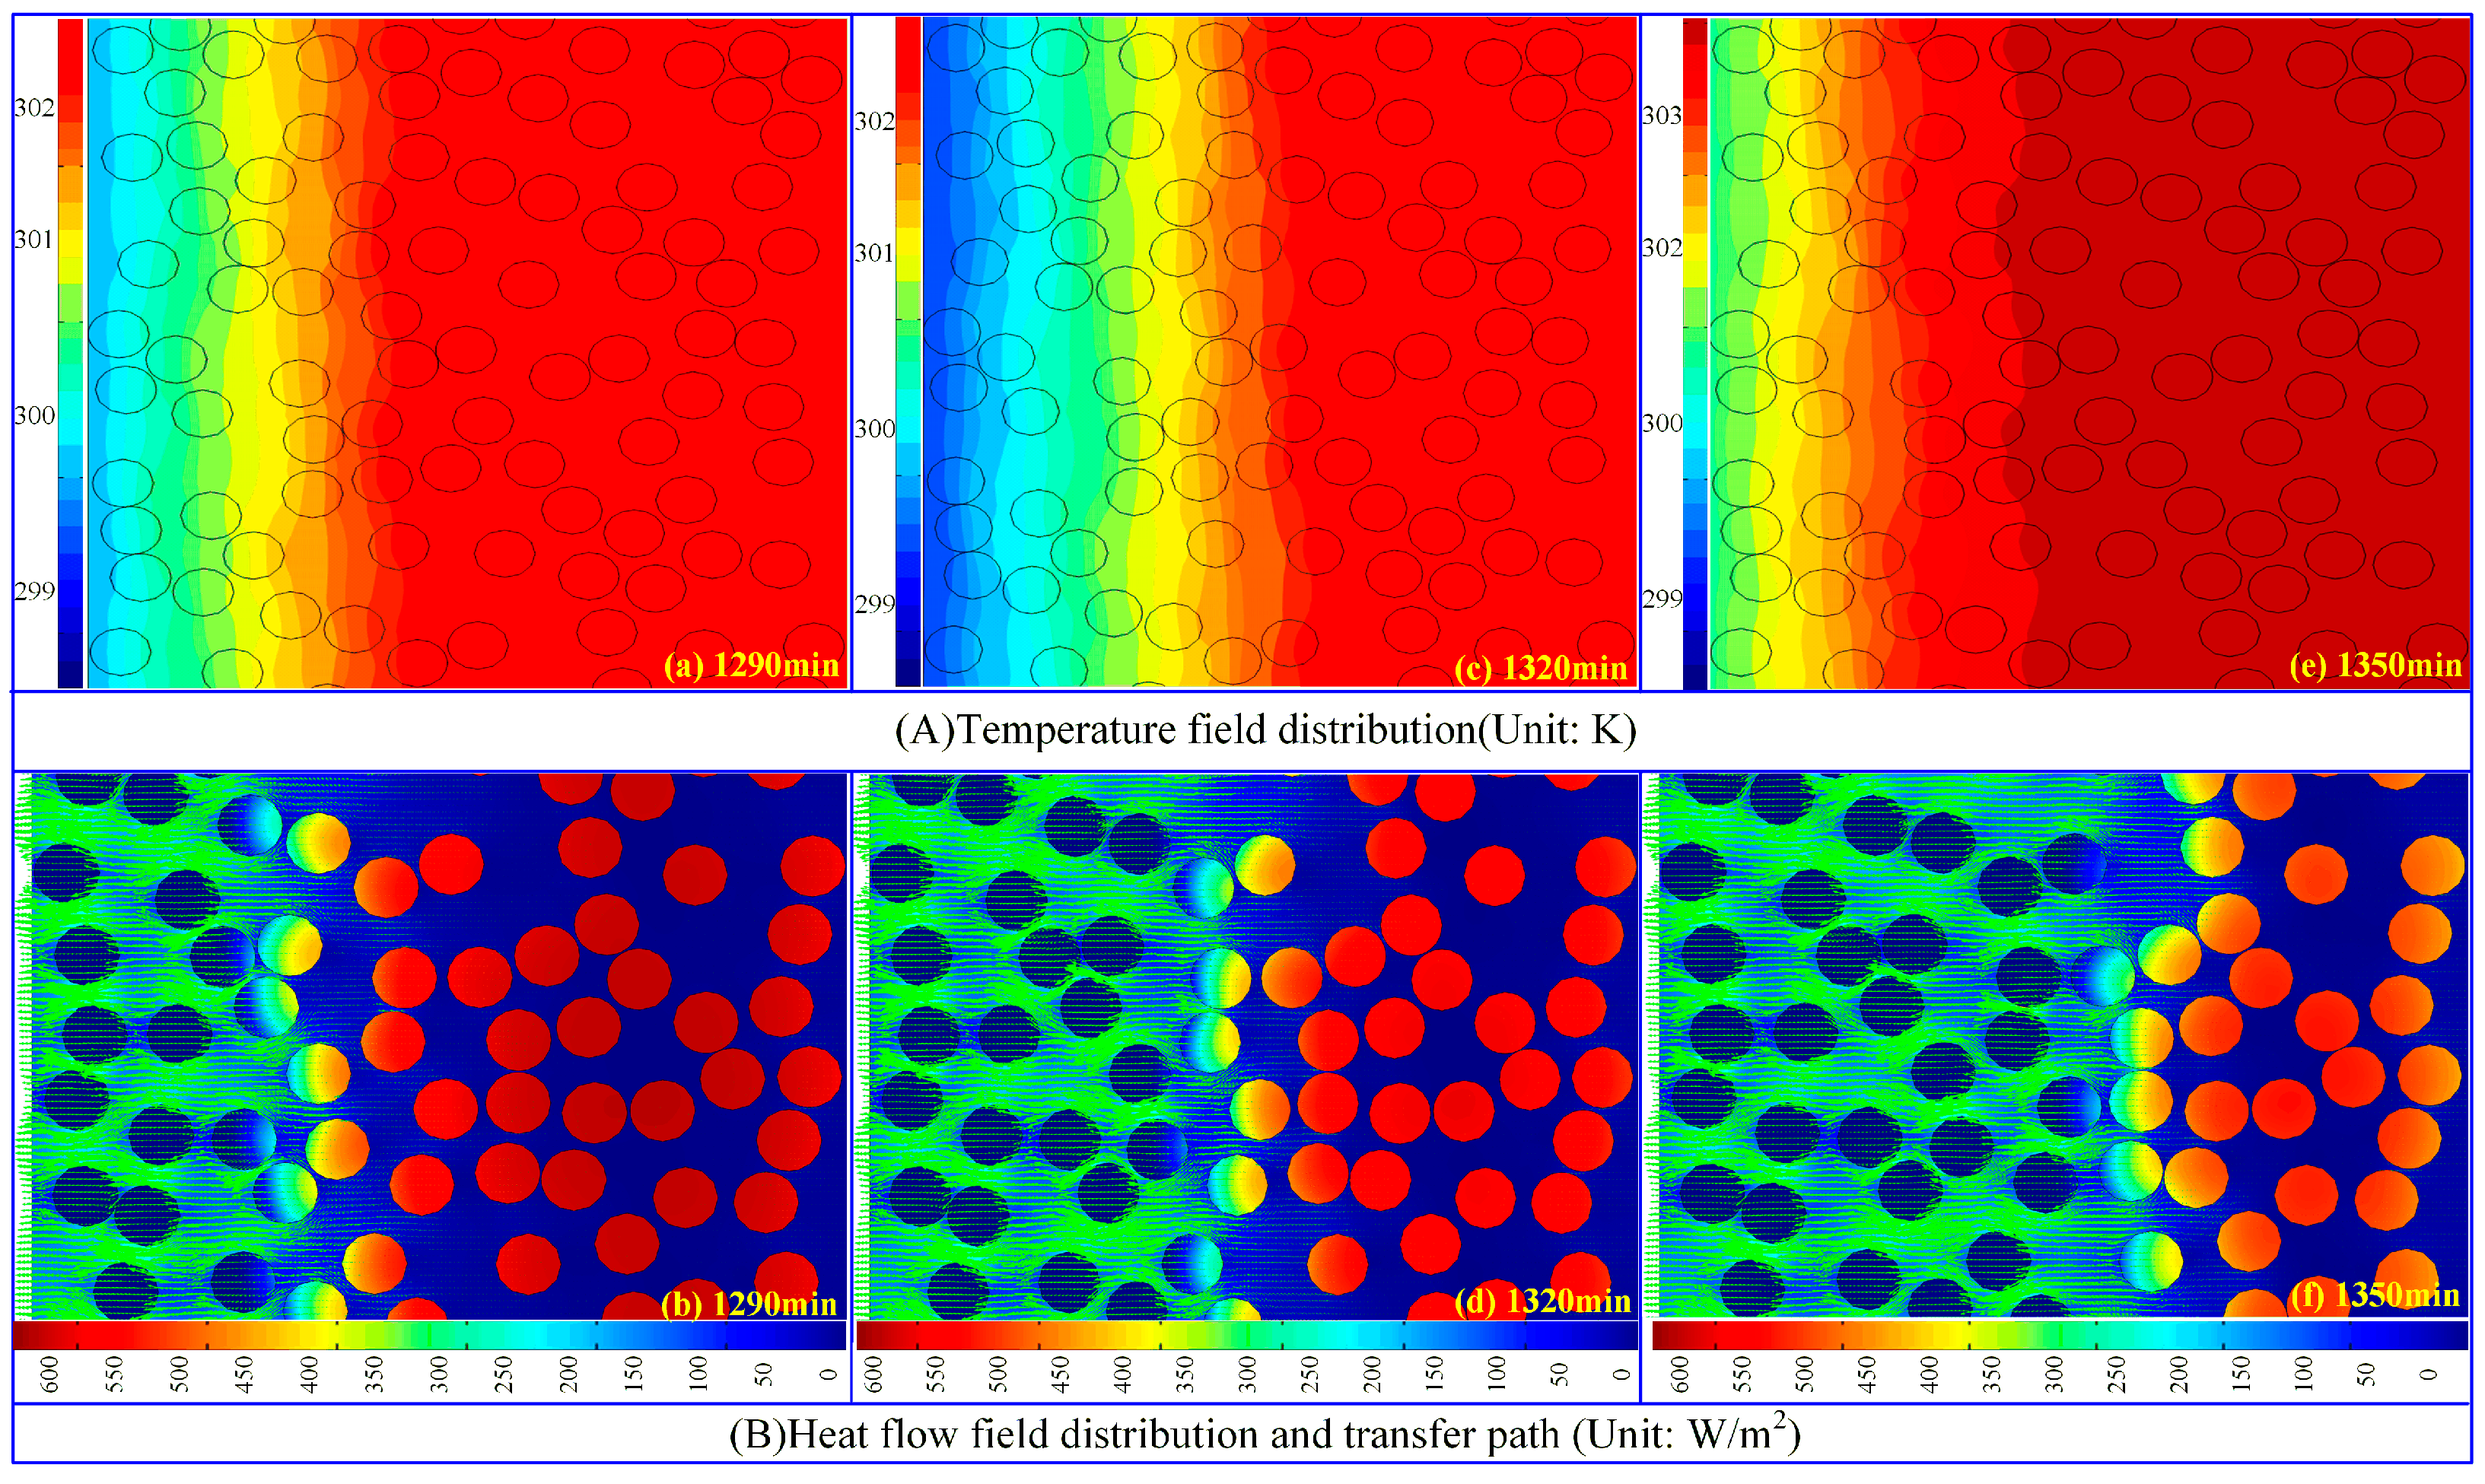
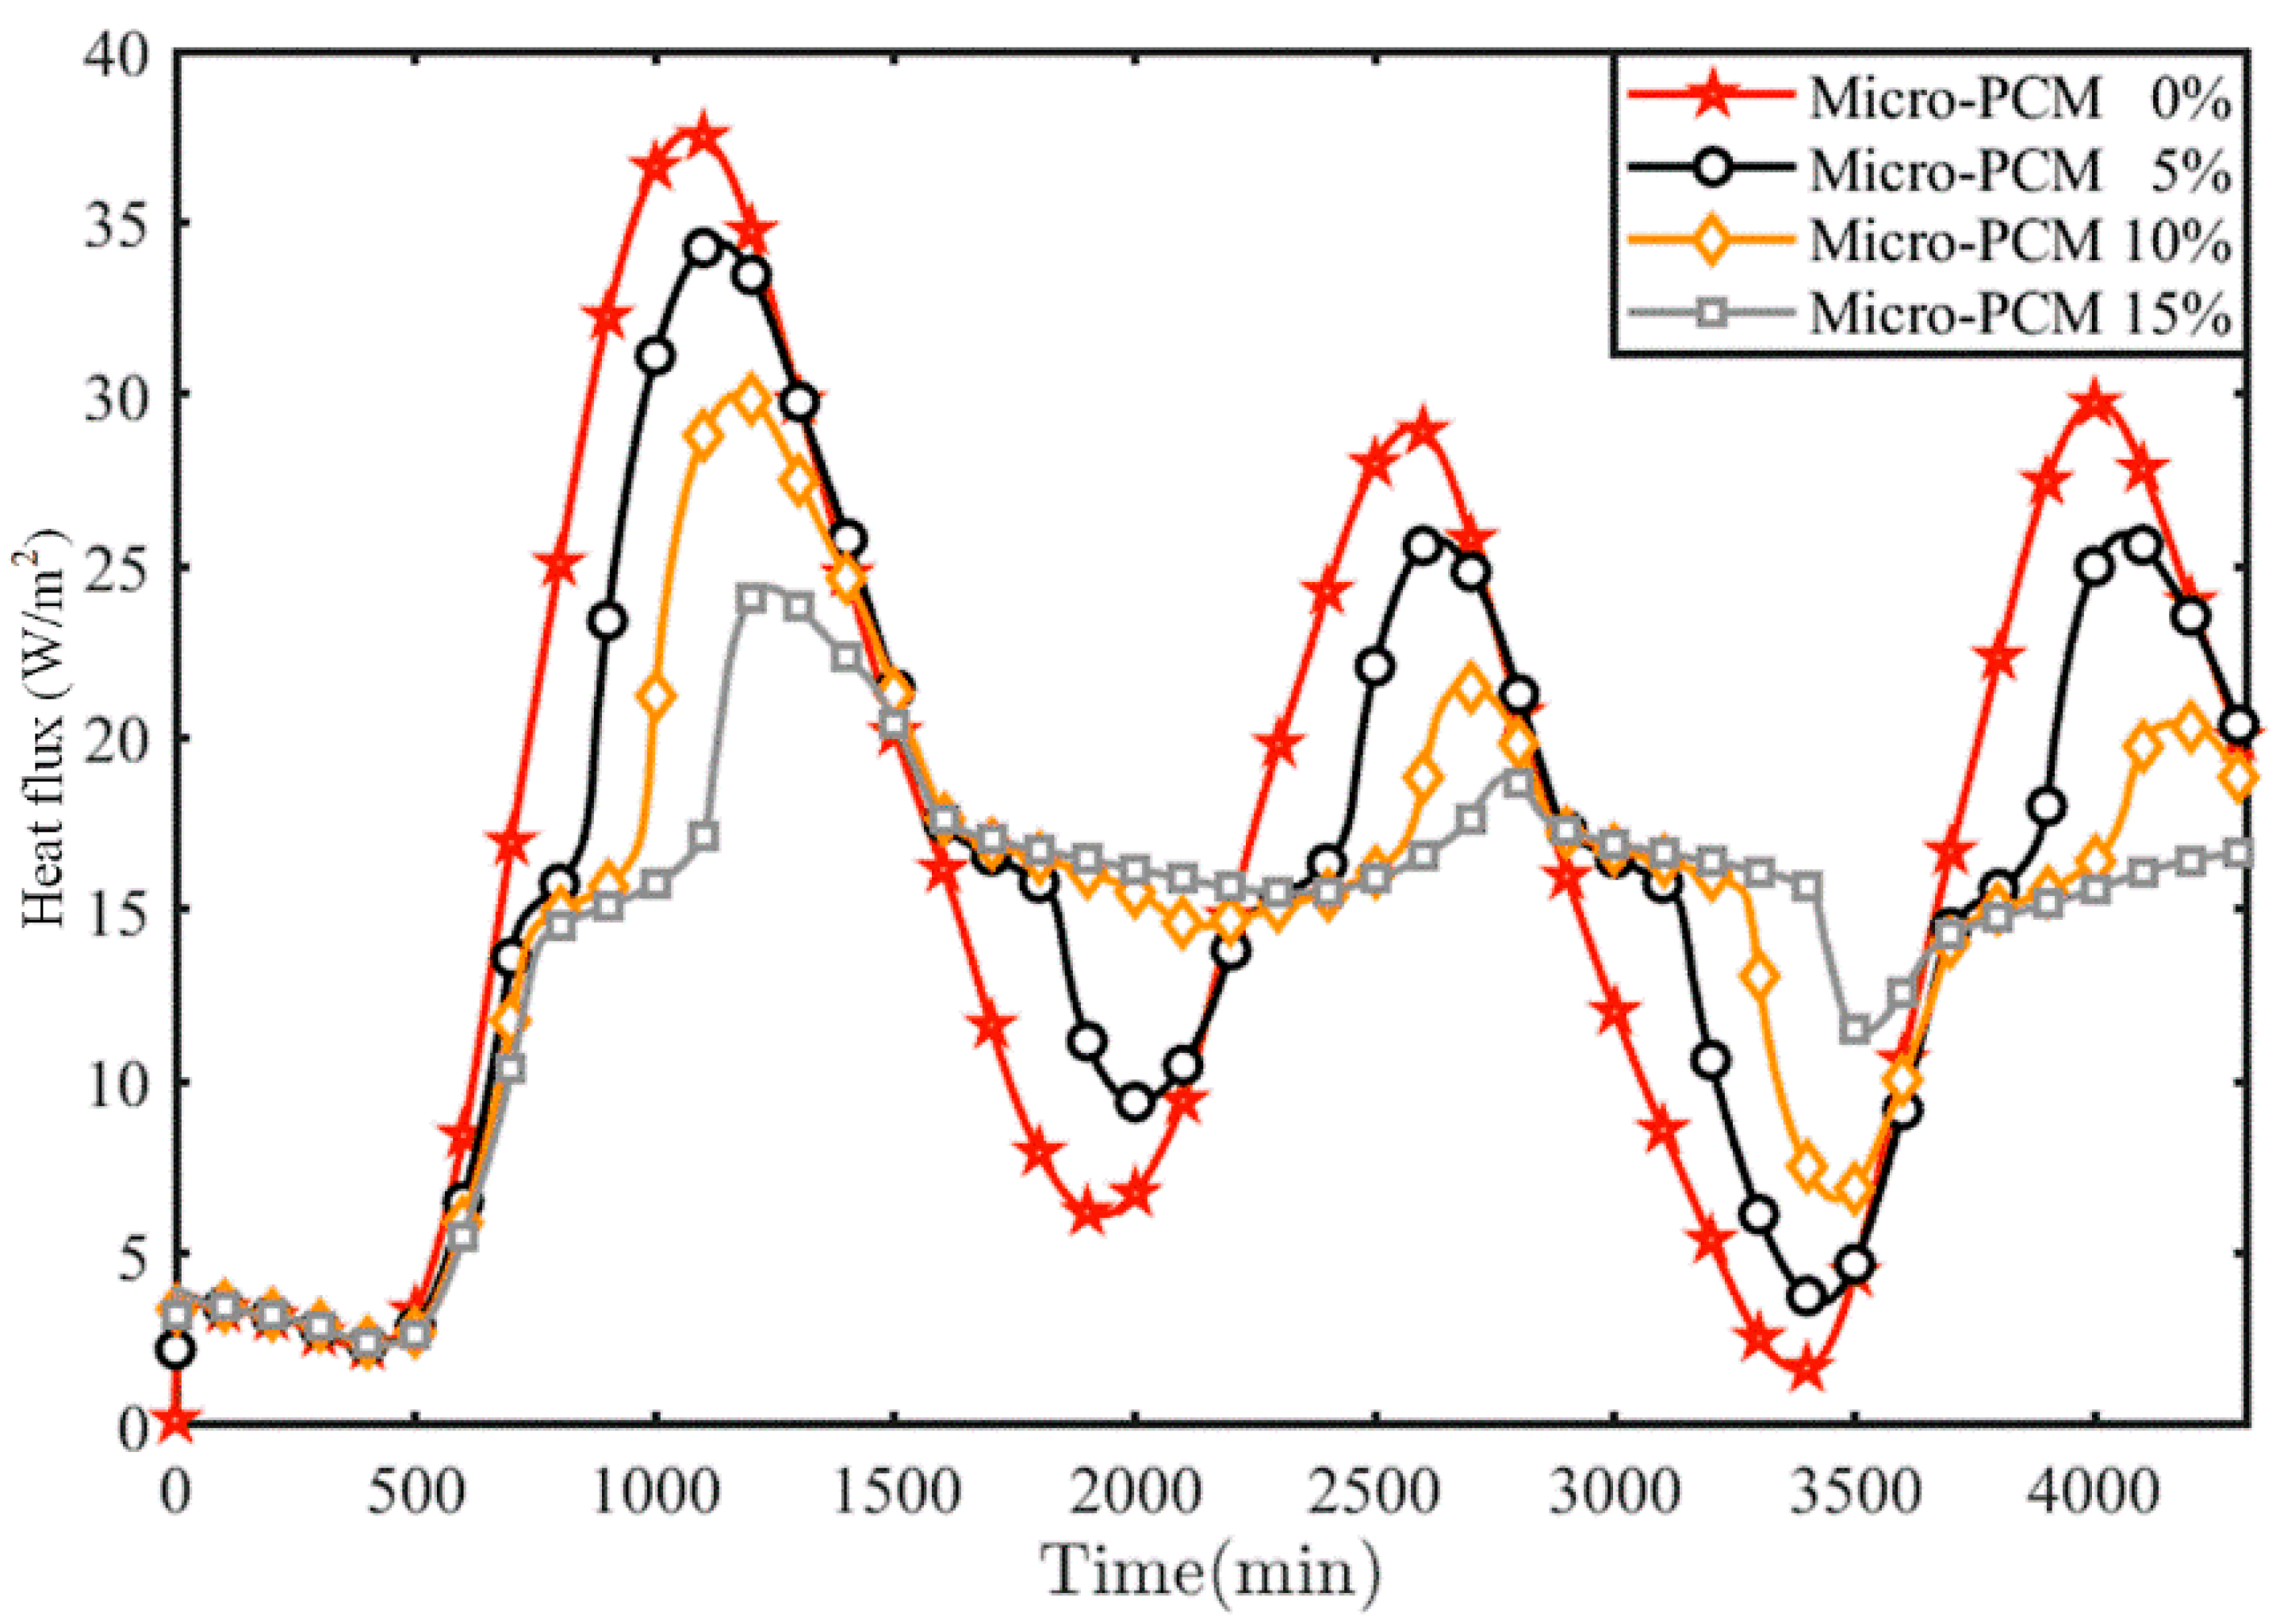
4.4. Effect of Micro-PCM Content on Wall Heat Flux
5. Conclusions
Author Contributions
Funding
Data Availability Statement
Acknowledgments
Conflicts of Interest
References
- Politi, C.; Peppas, A.; Taxiarchou, M.; Koronaki, I. Mechanistic Modelling for Optimising LTES-Enhanced Composites for Construction Applications. Buildings 2025, 15, 351. [Google Scholar] [CrossRef]
- Lachheb, M.; Younsi, Z.; Youssef, N.; Bouadila, S. Enhancing building energy efficiency and thermal performance with PCM-Integrated brick walls: A comprehensive review. Build. Environ. 2024, 256, 111476. [Google Scholar] [CrossRef]
- Bai, L.; Wang, Y.; Bai, Y.; He, L. Influence of phase change materials on the thermal performance of heavy-weight walls with different thermal inertia. J. Build. Eng. 2025, 99, 111573. [Google Scholar] [CrossRef]
- Jaradat, M.; Al Majali, H.; Bendea, C.; Bungau, C.C.; Bungau, T. Enhancing Energy Efficiency in Buildings through PCM Integration: A Study across Different Climatic Regions. Buildings 2024, 14, 40. [Google Scholar] [CrossRef]
- Dong, X.; Xiao, H.; Xue, C.; Wen, Q.; Wang, W. Evaluation of the thermal performance of Trombe walls enhanced by optimizing PCM parameters. J. Build. Eng. 2025, 99, 111542. [Google Scholar] [CrossRef]
- Li, W.; Rahim, M.; Wu, D.; El Ganaoui, M.; Bennacer, R. Dynamic integration of phase change material in walls for enhancing building thermal performance—A novel self-adaptive method for moving PCM layer. Energy Convers. Manag. 2024, 308, 118401. [Google Scholar] [CrossRef]
- Su, H.; Zhang, Z.; Dai, G.; Guo, H.; Li, X.; Xu, C. Investigating the thermal performance of a pipe-encapsulated movable PCM wall and its impact on reducing indoor heat gain during summer. Renew. Energy 2024, 237, 121897. [Google Scholar] [CrossRef]
- Roostaei Firouzabad, M.; Pourfayaz, F. The impact of using PCM layers in simultaneously the external and internal walls of building on energy annual consumption. Energy Convers. Manag. X 2024, 24, 100689. [Google Scholar] [CrossRef]
- Yari, M.; Kalbasi, R.; Thi, N.H.; Afrand, M. Incorporating PCMs and thermal insulation into building walls and their competition in building energy consumption reduction. Case Stud. Therm. Eng. 2024, 63, 105398. [Google Scholar] [CrossRef]
- Cui, Y.; Gulfam, R.; Ishrat, Y.; Iqbal, S.; Yao, F. Recent Progress of Phase Change Materials and Their Applications in Facility Agriculture and Related-Buildings—A Review. Buildings 2024, 14, 2999. [Google Scholar] [CrossRef]
- Shree, V.; Dwivedi, A.; Saxena, A.; Pathak, S.K.; Agrawal, N.; Tripathi, B.M.; Shukla, S.K.; Kumar, R.; Goel, V. A Comprehensive Review of Harnessing the Potential of Phase Change Materials (PCMs) in Energy-Efficient Building Envelopes. J. Build. Eng. 2025, 101, 111841. [Google Scholar] [CrossRef]
- Huang, Y.; Alekhin, V.N.; Hu, W.; Pu, J. Adaptability Analysis of Hollow Bricks with Phase-Change Materials Considering Thermal Performance and Cold Climate. Buildings 2025, 15, 590. [Google Scholar] [CrossRef]
- Gbekou, F.K.; Belloum, R.; Chennouf, N.; Agoudjil, B.; Boudenne, A.; Benzarti, K. Thermal performance of a building envelope including microencapsulated phase change materials (PCMs): A multiscale experimental and numerical investigation. Build. Environ. 2024, 253, 111294. [Google Scholar] [CrossRef]
- Dardouri, S.; Mankai, S.; Almoneef, M.M.; Mbarek, M.; Sghaier, J. Energy performance based optimization of building envelope containing PCM combined with insulation considering various configurations. Energy Rep. 2023, 10, 895–909. [Google Scholar] [CrossRef]
- Ke, W.; Ji, J.; Zhang, C.; Xie, H. Modelling analysis and performance evaluation of a novel hybrid CdTe-PCM PV glass module for building envelope application. Energy 2023, 284, 129182. [Google Scholar] [CrossRef]
- Hepple, R.; Zhao, Y.; Yang, R.; Zhang, Q.; Yang, S. Investigating the Effects of PCM-Integrated Walls on Thermal Performance for UK Residential Buildings of Different Typologies. Buildings 2024, 14, 3382. [Google Scholar] [CrossRef]
- Mukram, T.A.; Daniel, J. Performance evaluation of a novel cement brick filled with micro-PCM used as a thermal energy storage system in building walls. J. Energy Storage 2024, 77, 109910. [Google Scholar] [CrossRef]
- Ayaz, H.; Chinnasamy, V.; Shin, M.; Cho, H. Investigation of 1-tetradecanol with functionalized multi-walled carbon nanotubes as PCM for high-density thermal energy storage. J. Mater. Res. Technol. 2023, 27, 4005–4011. [Google Scholar] [CrossRef]
- Rolka, P.; Przybylinski, T.; Kwidzinski, R.; Lackowski, M. Investigation of low-temperature phase change material (PCM) with nano-additives improving thermal conductivity for better thermal response of thermal energy storage. Sustain. Energy Technol. Assess. 2024, 66, 103821. [Google Scholar] [CrossRef]
- Fu, W.; Lao, J.; Zhou, W.; Chen, L.; Ma, J.; He, Z.; Tan, B.; Zhou, Q. Experimental and numerical investigations on phase change thermal storage foam concrete based on CaCl2∙6H2O/silica aerogel composite phase change material. J. Energy Storage 2024, 103, 114371. [Google Scholar] [CrossRef]
- Zhang, Y.; Zhou, C.; Liu, M.; Li, X.; Liu, T.; Liu, Z. Thermal insulation performance of buildings with phase-change energy-storage wall structures. J. Clean. Prod. 2024, 438, 140749. [Google Scholar] [CrossRef]
- Al-Absi, Z.A.; Hafizal, M.I.M.; Ismail, M. Experimental study on the thermal performance of PCM-based panels developed for exterior finishes of building walls. J. Build. Eng. 2022, 52, 104379. [Google Scholar] [CrossRef]
- Gao, Y.; Liu, Z.; Gao, Y.; Mao, W.; Zuo, Y.; Li, G. Employing the double-PCM (Phase-Change Material) layer to improve the seasonal adaption of building walls: A comparative studies. J. Energy Storage 2023, 66, 107404. [Google Scholar] [CrossRef]
- Refahi, A.; Rostami, A.; Amani, M. Implementation of a double layer of PCM integrated into the building exterior walls for reducing annual energy consumption: Effect of PCM wallboards position. J. Energy Storage 2024, 82, 110556. [Google Scholar] [CrossRef]
- Cai, Y.; Huang, Y.; Shu, Z.; Liu, Z.; Zhong, H.; Zhao, F. Investigation of double-PCM based PV composite wall for power-generation and building insulation: Thermal characteristics and energy consumption prediction. Energy Built Environ. 2024; in press. [Google Scholar] [CrossRef]
- Masood, U.; Haggag, M.; Hassan, A.; Laghari, M. A Review of Phase Change Materials as a Heat Storage Medium for Cooling Applications in the Built Environment. Buildings 2023, 13, 1595. [Google Scholar] [CrossRef]
- JGJ/T 98-2010; Specification for Mix Proportion Design of Masonry Mortar. Ministry of Housing and Urban-Rural Development of the People: Beijing, China, 2010.
- Luo, Z.; Liu, X.; Yang, Q.; Qu, Z.; Xu, H.; Xu, D. Numerical study on performance of porous brick roof using phase change material with night ventilation. Energy Build. 2023, 286, 112972. [Google Scholar] [CrossRef]
- Sugiura, A.; Saegusa, S.; Jin, Y.; Yoshimoto, R.; Smith, N.D.; Dohi, K.; Higuchi, T.; Kozu, T. Evaluation of RMES, an Automated Software Tool Utilizing AI, for Literature Screening with Reference to Published Systematic Reviews as Case-Studies: Development and Usability Study. JMIR Form. Res. 2024, 8, e55827. [Google Scholar] [CrossRef]
- Yao, R.; Huang, X.; Zhang, Y.; Wang, L.; Li, J.; Yang, Q. Estimation of the surface urban heat island intensity across 1031 global cities using the regression-modification-estimation (RME) method. J. Clean. Prod. 2024, 434, 140231. [Google Scholar] [CrossRef]


| Category | Argument | |
|---|---|---|
| Volume fraction | 0% | 20% |
| Cement (kg/m3) | 230 | 212.9 |
| Water (kg/m3) | 138 | 127.74 |
| standard sand (kg/m3) | 1600 | 1480 |
| Micro-PCM (kg/m3) | 0 | 120 |
| Superolasticizer (SP)/% | 0~1.1 | 0~1.1 |
| Cement consistency/nm | 70 | 70 |
| Material | Micro-PCM | Porous Brick | Cement Mortar |
|---|---|---|---|
| Density (kg/m3) | 880 | 1500 | 1800 |
| Specific Heat Capacity (J/kg/K) | 3220 | 1052 | 1050 |
| Thermal conductivity (W/m/K) | 0.21 | 0.58 | 0.7 |
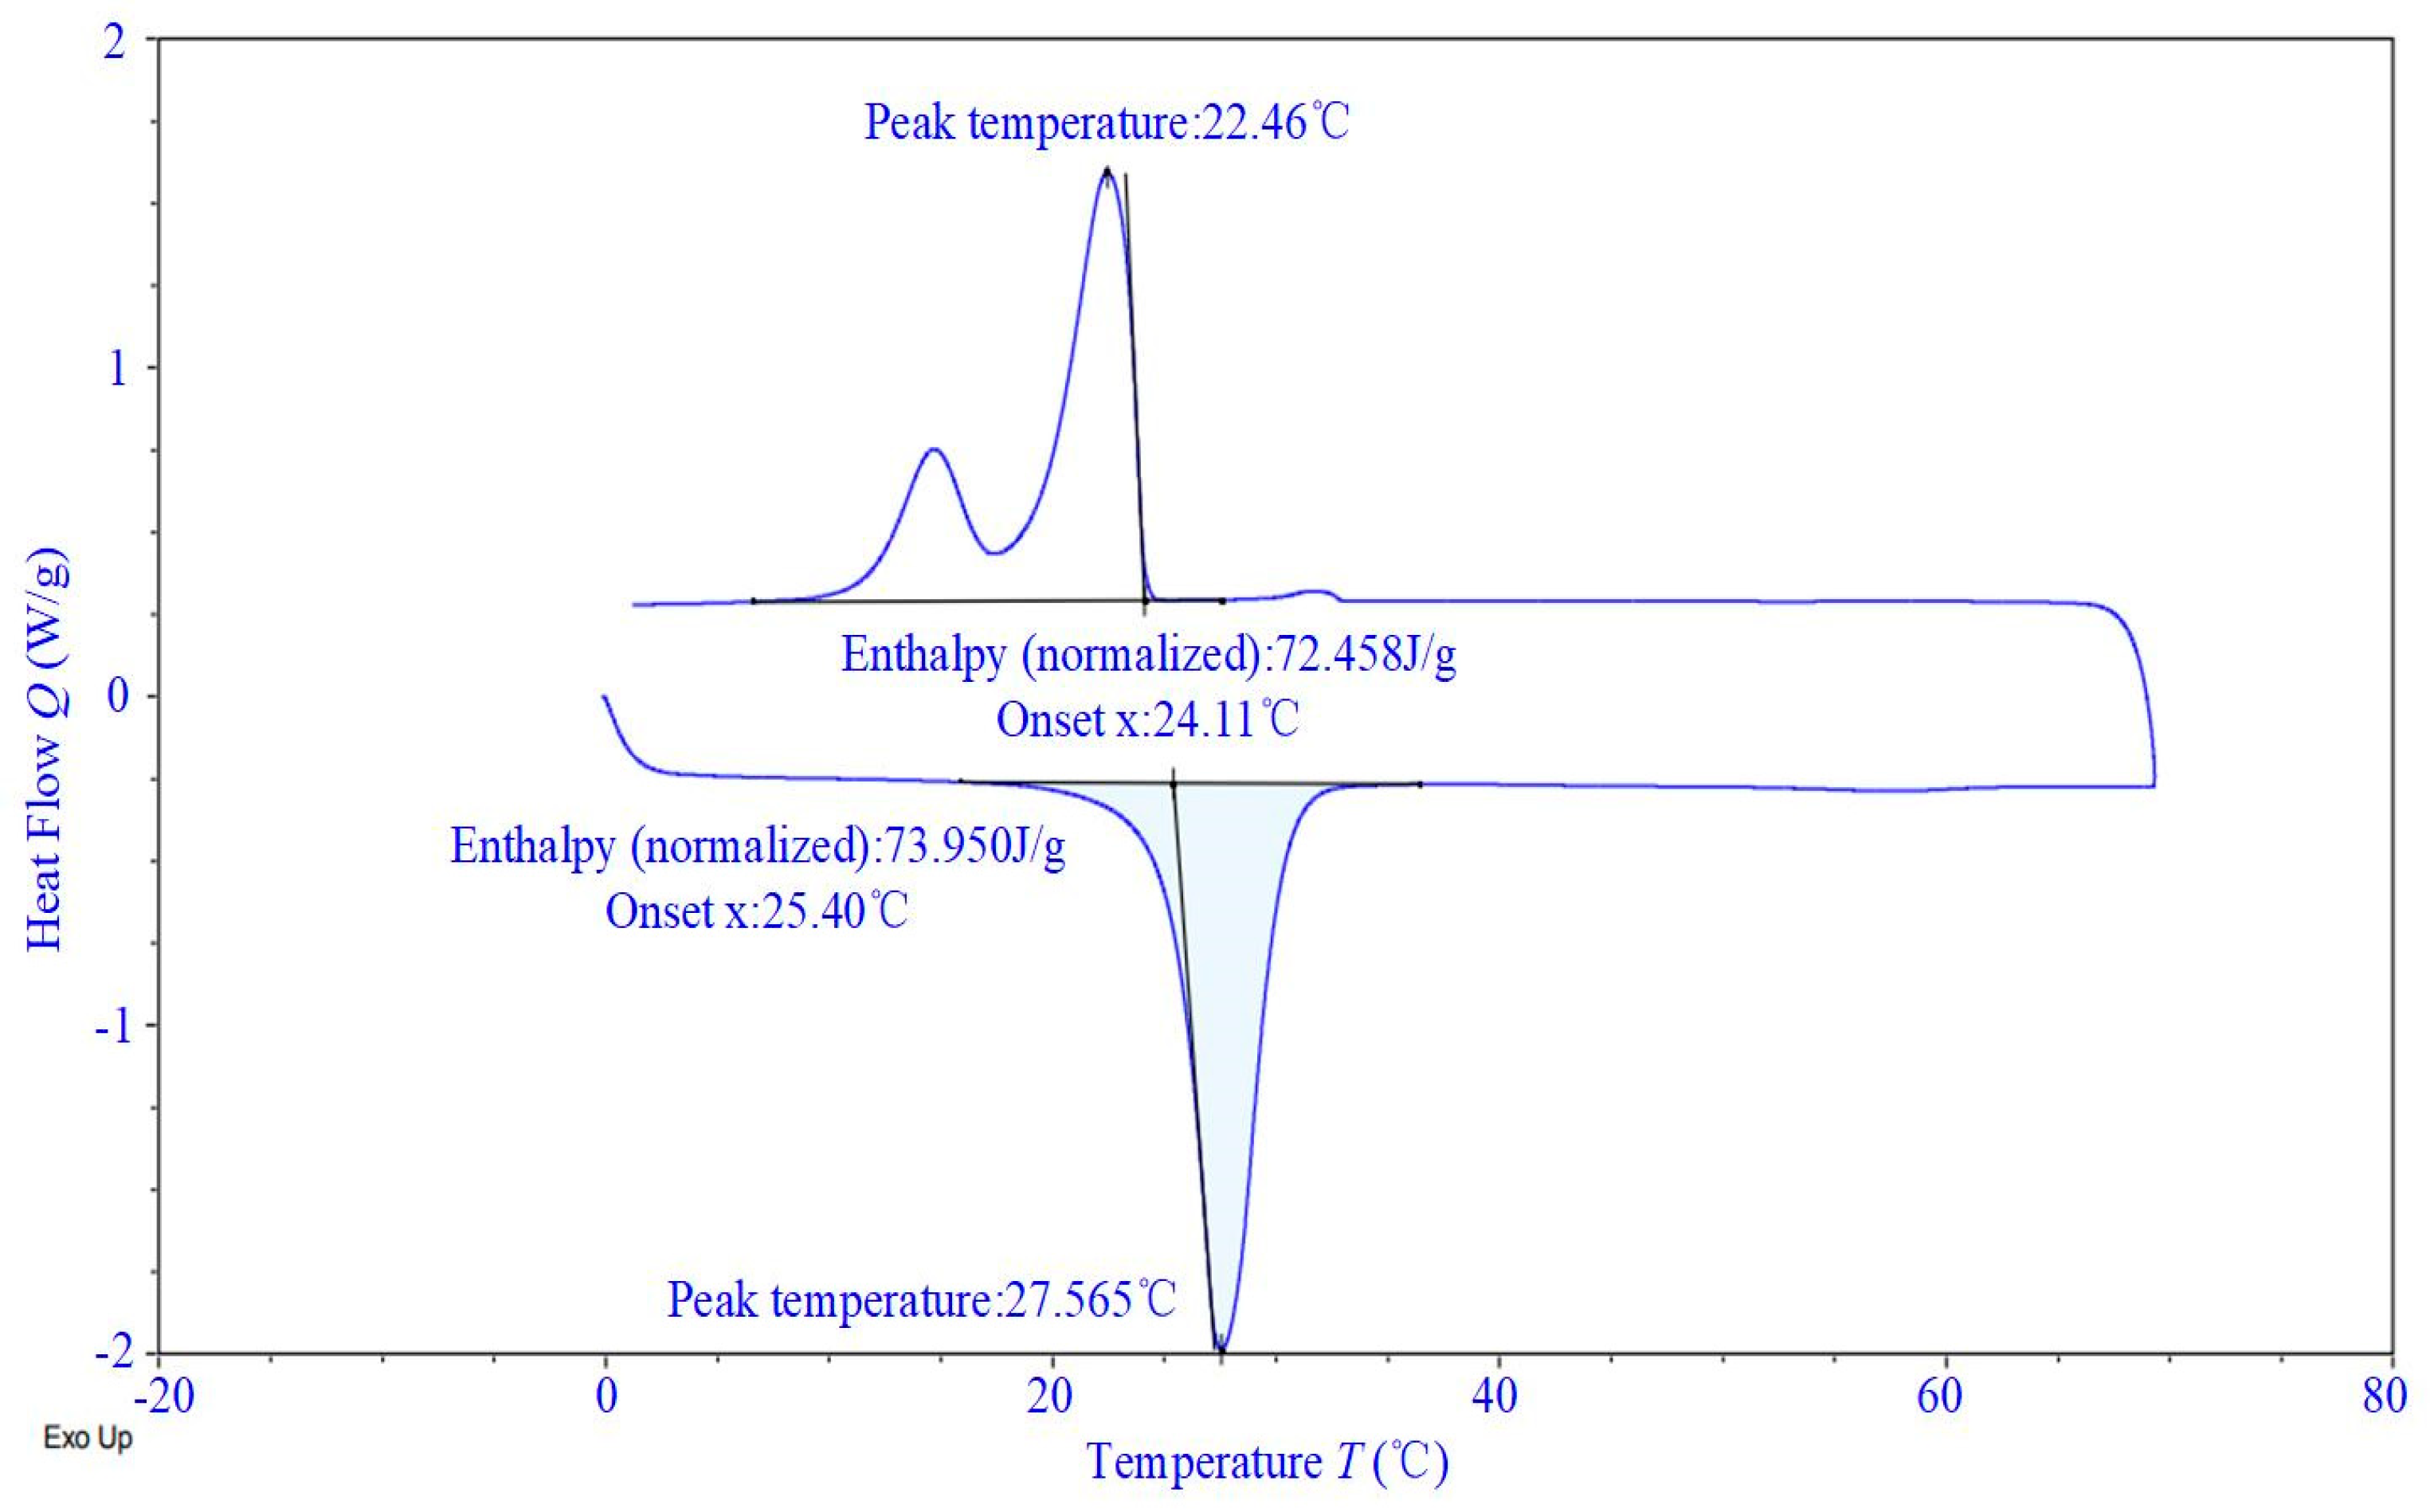
| Latent heat (J/g) | 175.39 | / | / |
| Phase transition temperature (℃) | 27.57 °C | / | / |
| Peak Temperature | Trough Temperature | Amplitude | Attenuation Factor | ||
|---|---|---|---|---|---|
| 1 | 0% | 32.49 | 20.78 | 11.71 | 2.07 |
| 5% | 31.43 | 20.78 | 10.65 | 2.28 | |
| 10% | 29.99 | 20.78 | 9.20 | 2.64 | |
| 15% | 28.09 | 20.78 | 7.31 | 3.32 | |
| 2 | 0% | 29.63 | 22.07 | 7.56 | 2.51 |
| 5% | 28.56 | 23.13 | 5.43 | 3.50 | |
| 10% | 27.15 | 24.83 | 2.32 | 8.21 | |
| 15% | 26.27 | 25.14 | 1.13 | 16.88 | |
| 3 | 0% | 29.86 | 20.57 | 9.29 | 2.33 |
| 5% | 28.61 | 21.19 | 7.41 | 2.92 | |
| 10% | 26.79 | 22.19 | 4.60 | 4.71 | |
| 15% | 25.53 | 23.80 | 1.73 | 12.50 |
| Parameter | Delay Time (min) | |||
|---|---|---|---|---|
| 0% | 5% | 10% | 15% | |
| First cycle | 262 | 295 | 336 | 400 |
| Second cycle | 209 | 239 | 296 | 383 |
| Third cycle | 249 | 282 | 382 | 537 |
| Average | 240 | 272 | 338 | 440 |
Disclaimer/Publisher’s Note: The statements, opinions and data contained in all publications are solely those of the individual author(s) and contributor(s) and not of MDPI and/or the editor(s). MDPI and/or the editor(s) disclaim responsibility for any injury to people or property resulting from any ideas, methods, instructions or products referred to in the content. |
© 2025 by the authors. Licensee MDPI, Basel, Switzerland. This article is an open access article distributed under the terms and conditions of the Creative Commons Attribution (CC BY) license (https://creativecommons.org/licenses/by/4.0/).
Share and Cite
Qin, P.; Wang, H.; Gong, N.; Cai, X.; Wang, H.; Hou, F. Experimental and Numerical Investigation of Heat Transfer Characteristics of Double-Layer Phase Change Walls for Enhanced Thermal Regulation in Summer Climates. Buildings 2025, 15, 962. https://doi.org/10.3390/buildings15060962
Qin P, Wang H, Gong N, Cai X, Wang H, Hou F. Experimental and Numerical Investigation of Heat Transfer Characteristics of Double-Layer Phase Change Walls for Enhanced Thermal Regulation in Summer Climates. Buildings. 2025; 15(6):962. https://doi.org/10.3390/buildings15060962
Chicago/Turabian StyleQin, Pengfei, Hairuo Wang, Nina Gong, Xiaoning Cai, Hui Wang, and Feng Hou. 2025. "Experimental and Numerical Investigation of Heat Transfer Characteristics of Double-Layer Phase Change Walls for Enhanced Thermal Regulation in Summer Climates" Buildings 15, no. 6: 962. https://doi.org/10.3390/buildings15060962
APA StyleQin, P., Wang, H., Gong, N., Cai, X., Wang, H., & Hou, F. (2025). Experimental and Numerical Investigation of Heat Transfer Characteristics of Double-Layer Phase Change Walls for Enhanced Thermal Regulation in Summer Climates. Buildings, 15(6), 962. https://doi.org/10.3390/buildings15060962