Determination of Dynamic Characteristics of Historic Beyazıt Tower


Abstract
:1. Introduction
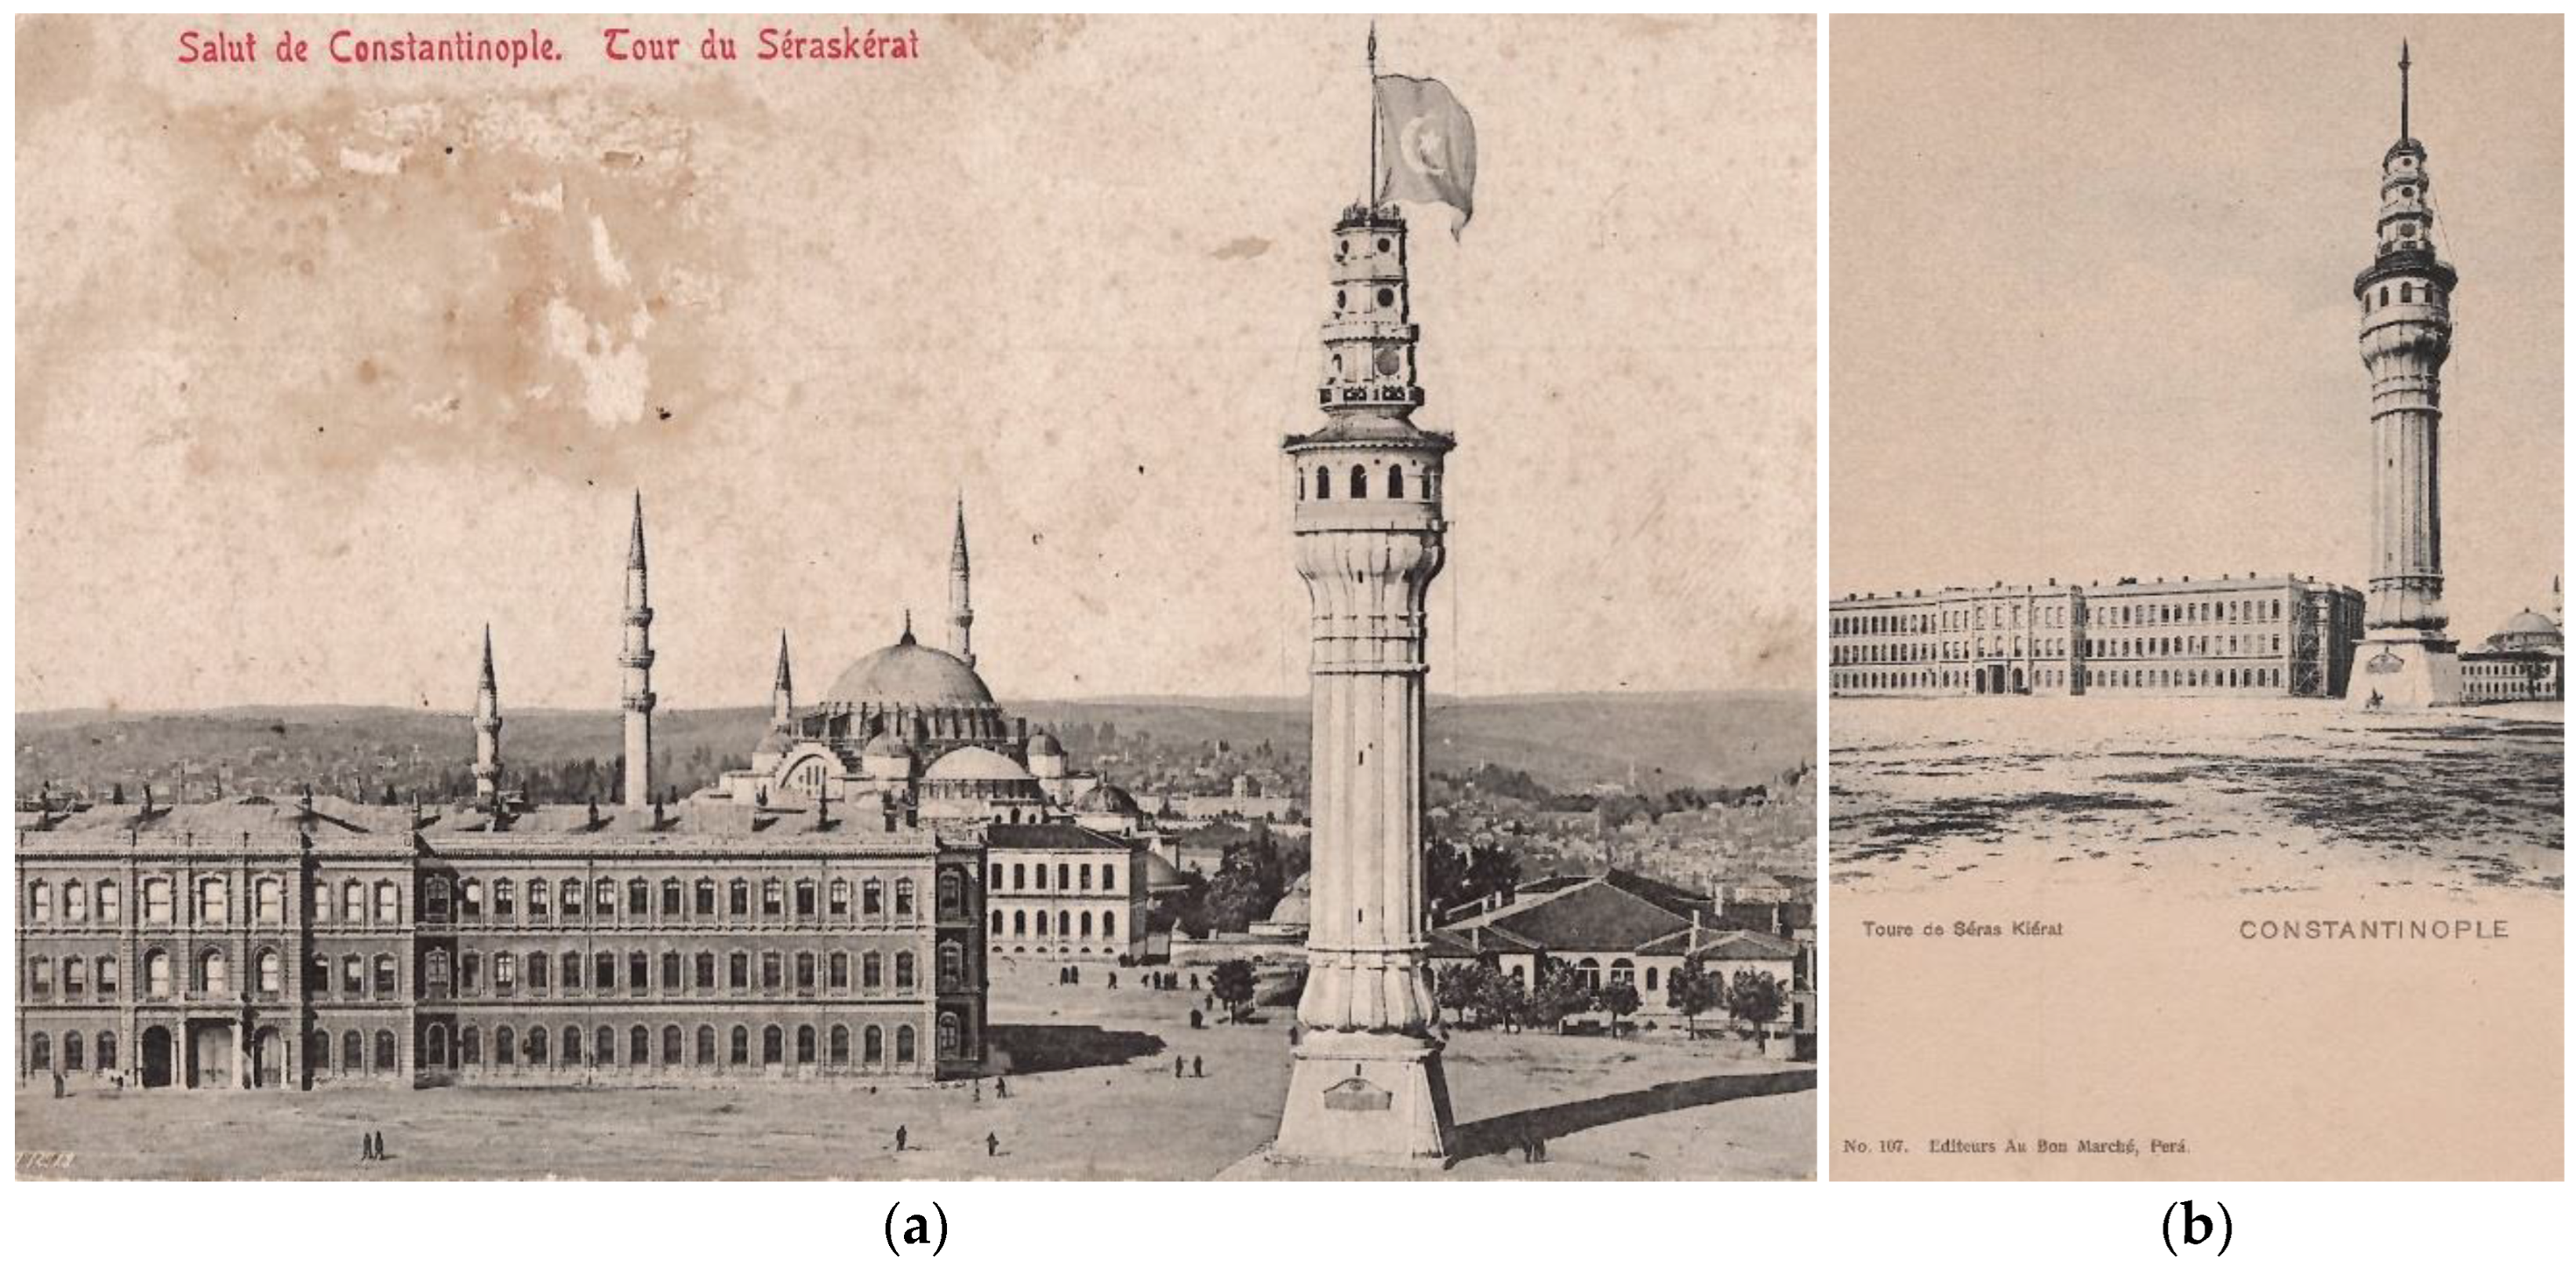
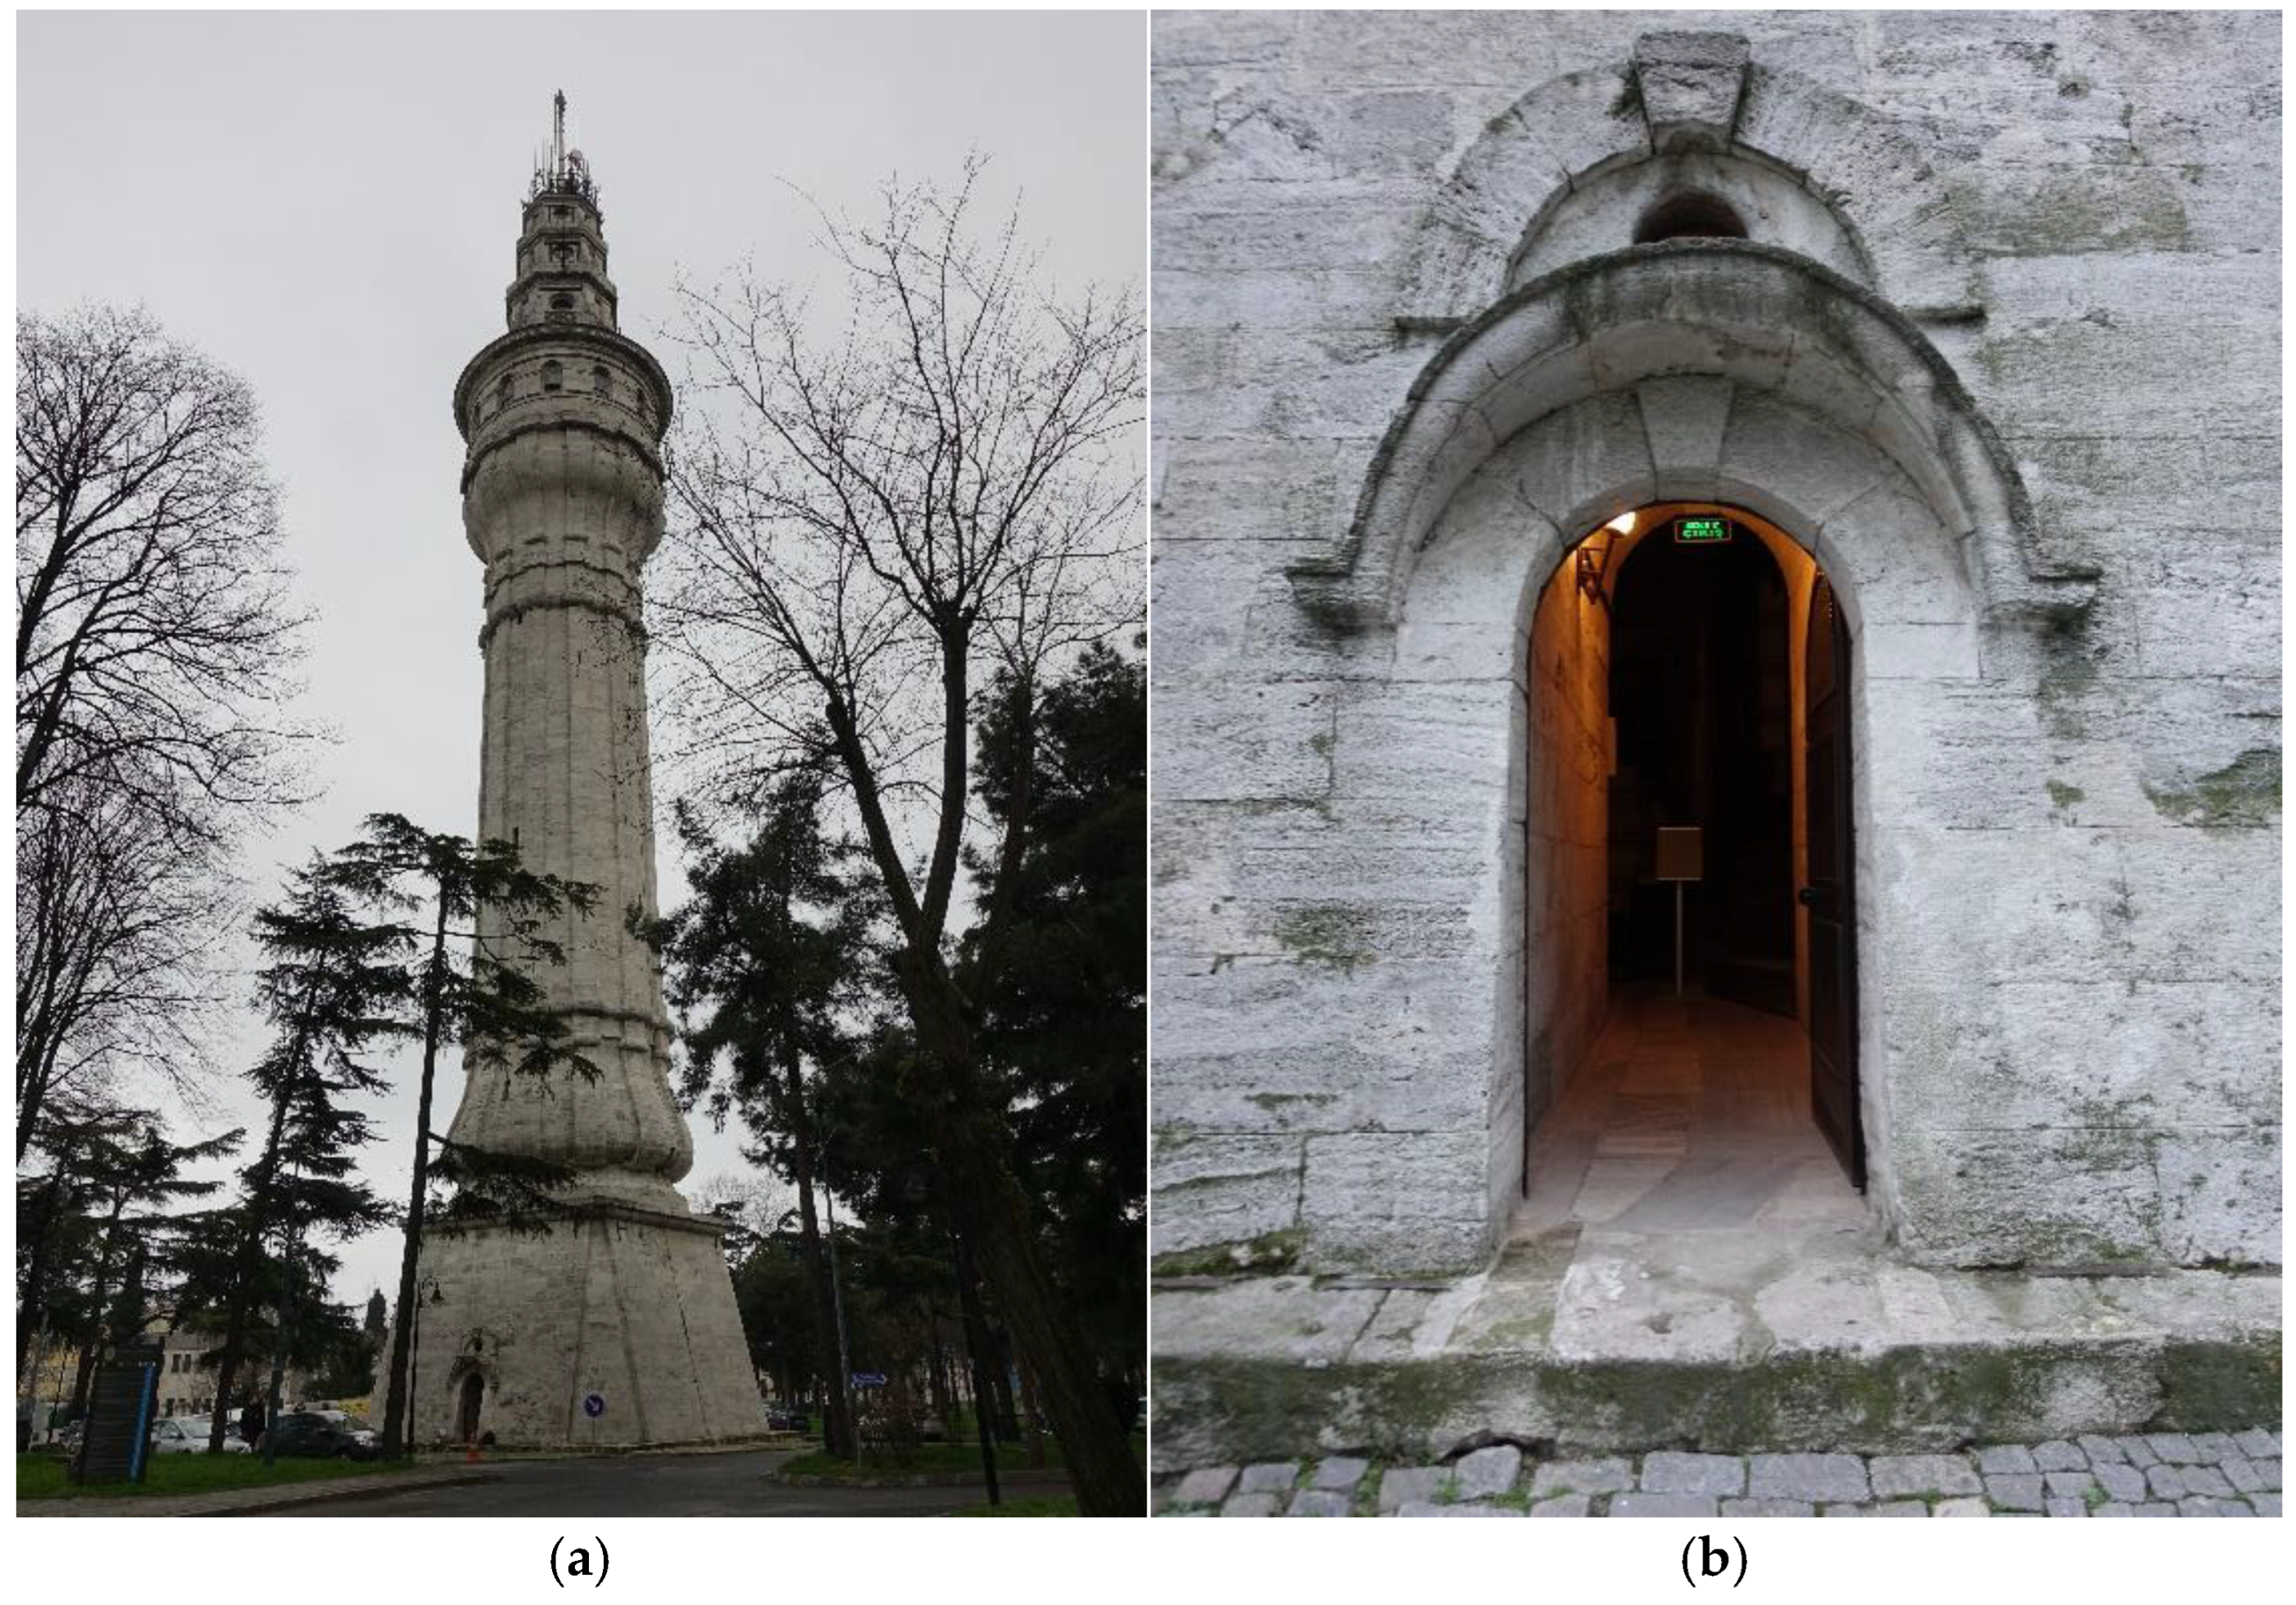
1.1. History of Beyazıt Tower
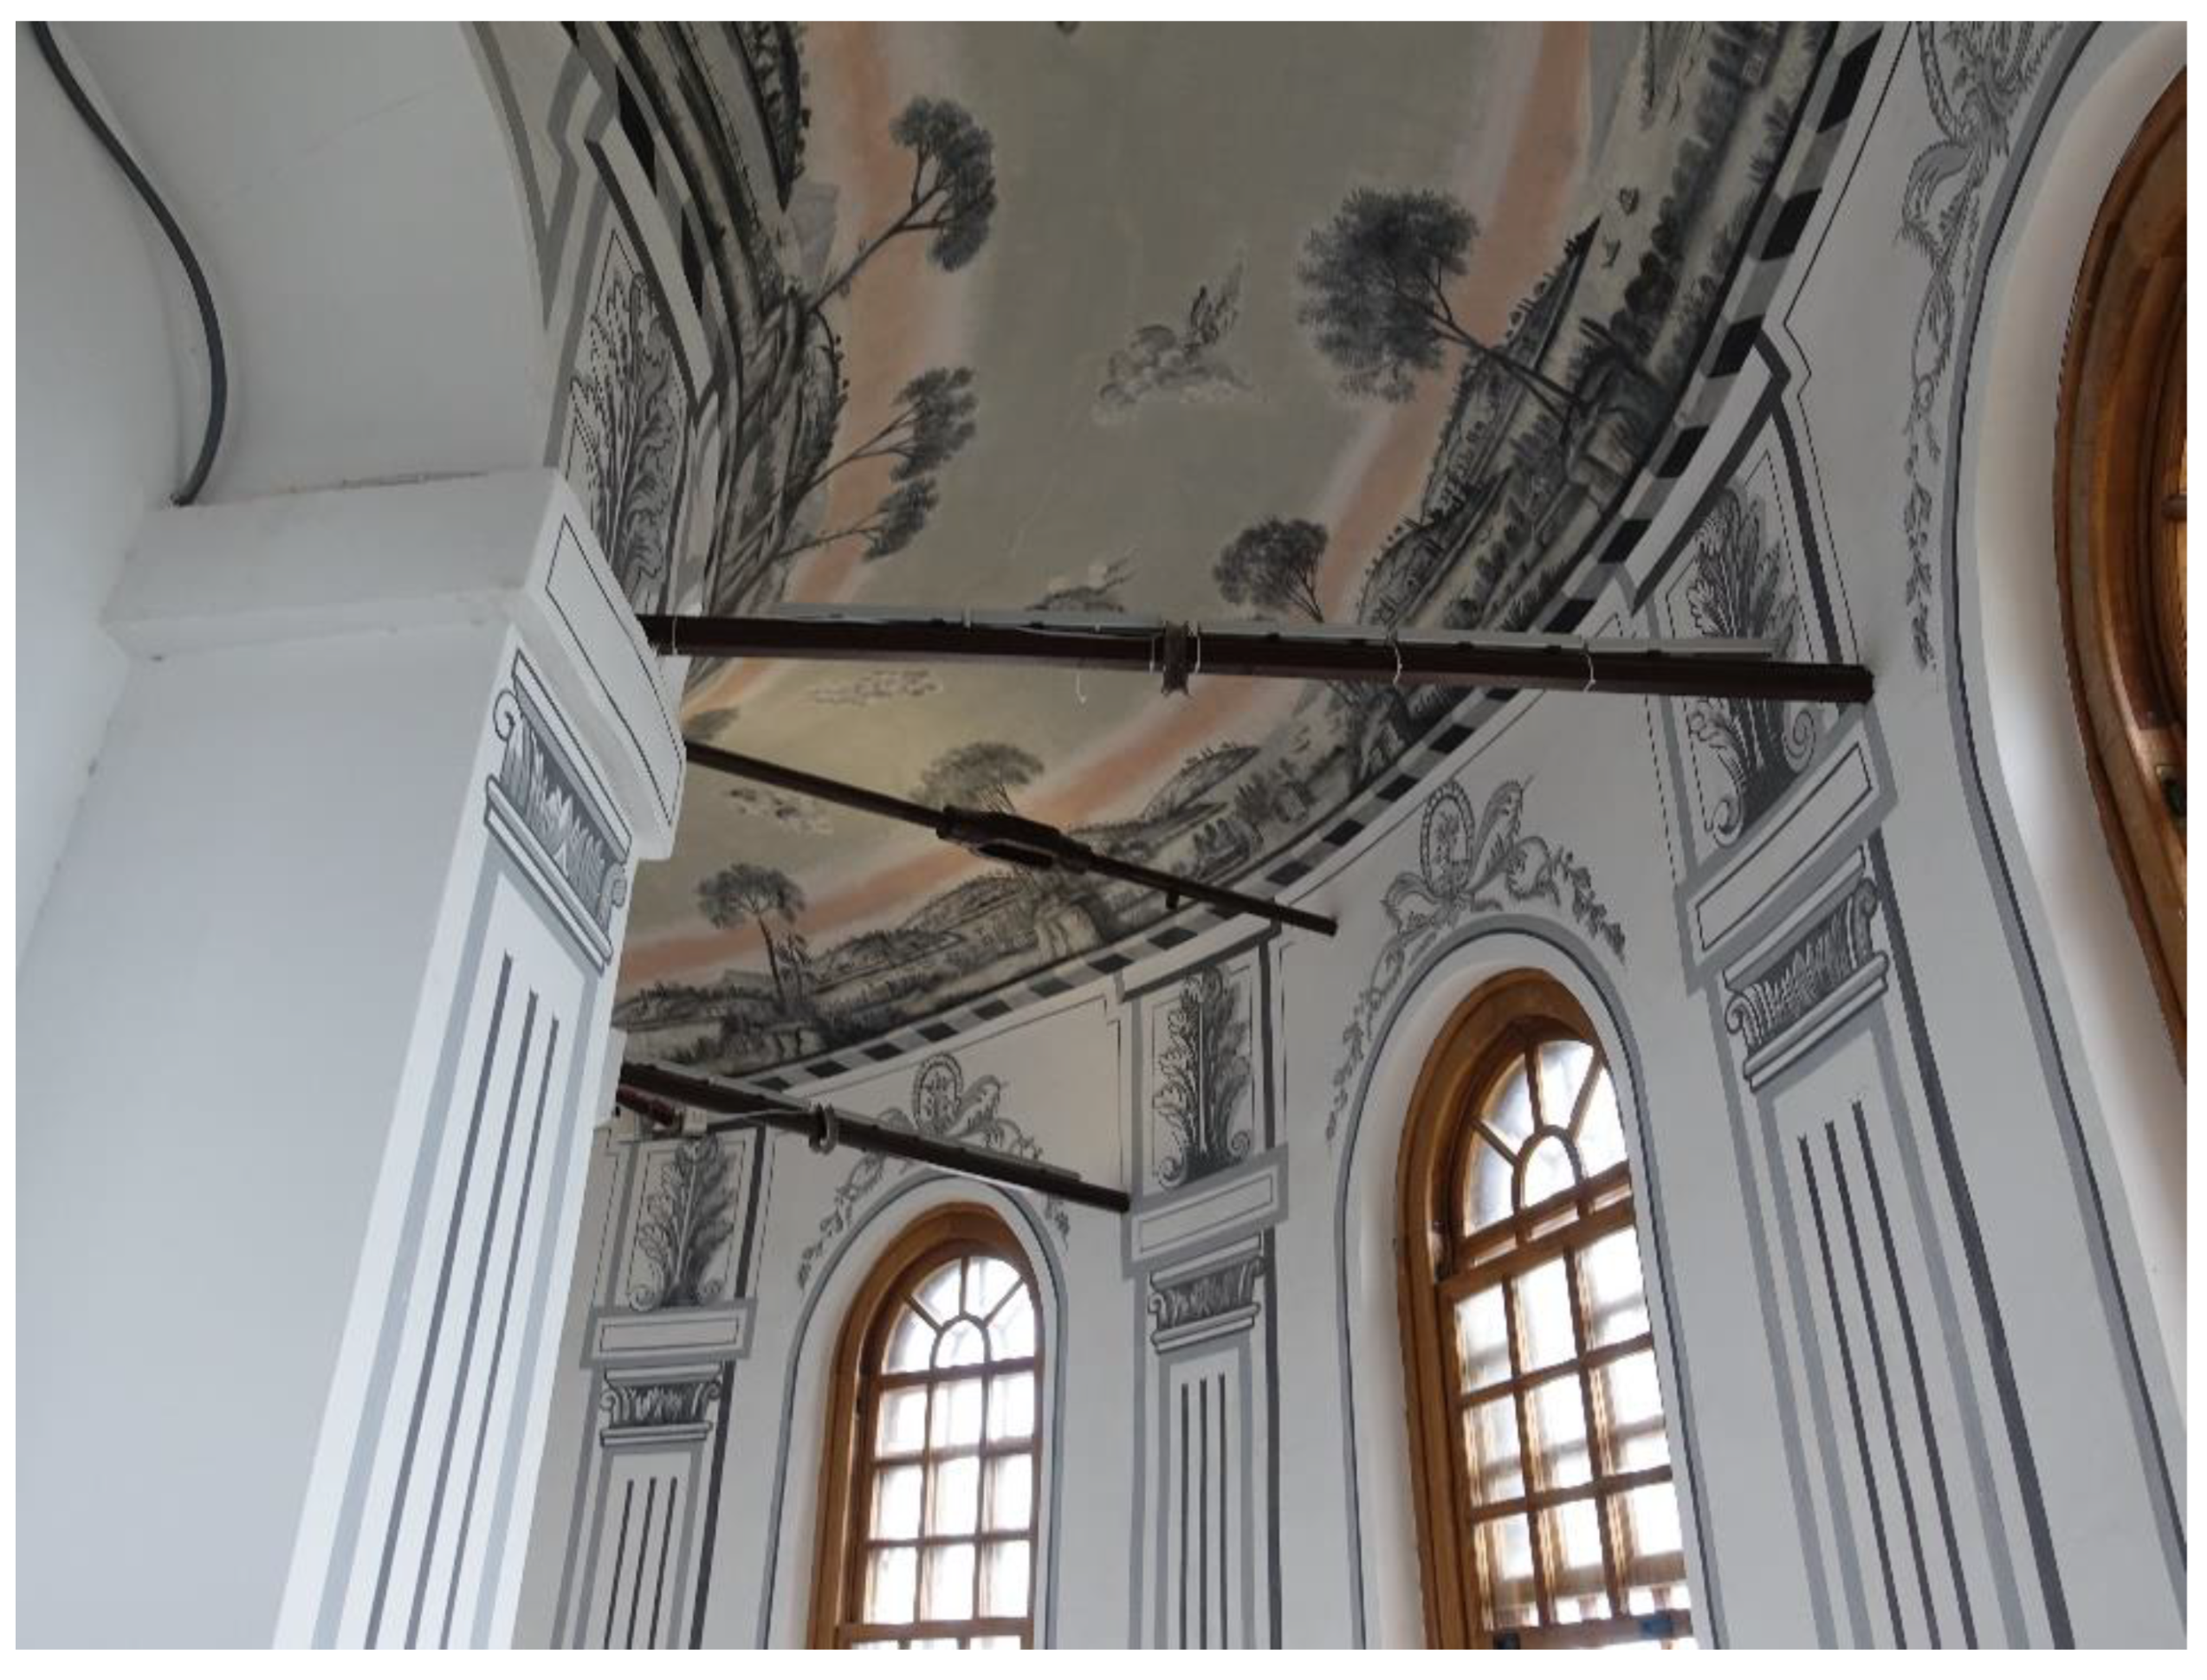
1.2. Architectural Background
1.3. Literature Preview of Historical Masonry Towers
1.4. Scope of the Study

| Masonry Building | Location | Year Built | Height [m] | Wall Thickness [m] | Plan Geometry * | Material ** | Natural Frequency [Hz] | Ref. | ||
|---|---|---|---|---|---|---|---|---|---|---|
| 1st Mode | 2nd Mode | 3rd Mode | ||||||||
| Gabbia Tower | Italy | 1227 | 54 | 2.4 | Rec | B | 0.92 | 0.99 | 3.89 | [12] |
| Santa Maria del Carrobiolo bell-tower | Italy | 1339 | 33.7 | - | Rec | - | 1.92 | 2.01 | 2.37 | [13] |
| Benedictine Abbey of San Pietro bell tower | Italy | 13th c. | 61.45 | - | Hex | S | 1.45 | 1.52 | 4.34 | [14] |
| San Vittore bell tower | Italy | 15th c. | 36.72 | 1.30–1.35 | Rec | S | 1.22 | 1.28 | 3.60 | [15] |
| The Basilica of San Pietro (Bell Tower) | Italy | 996 | 61.4 | - | Hex | B + S | 1.48 | 1.55 | 4.29 | [16] |
| Matilde Tower | Italy | - | 35 | - | Rec | B | 1.20 | 1.91 | 3.22 | [17] |
| Annunziata Bell Tower | Greece | 1394 | 20 | 1.00–0.55 | Rec | S | 2.62 | 2.83 | 5.51 | [18] |
| Sultan Ahmet Mosk minaret | Türkiye | 1616 | 50.91 | 1.5 | Cir | S | 0.87 | 3.22 | 4.85 | [19] |
| Torre Grossa | Italy | 1240 | 61 | 2.6–1.6 | Rec | B + S | 1.31 | 1.33 | 3.41 | [20] |
| Masonry Chimney | Spain | 20th c. | 38.3 | 1.71–0.5 | Cir | B | 0.76 | 8.41 | 23.05 | [21] |
| Bell Tower of Capua | Italy | 861 | 41 | - | Rec | S | 1.26 | 1.29 | 3.1 | [22] |
| Bell Tower of Averse | Italy | 1080 | 45.5 | - | Rec | S | 1.05 | 1.37 | 4.81 | [22] |
| Ghirlandina Tower | Italy | 1319 | 88.82 | - | Rec | - | 0.74 | 0.85 | 2.77 | [23] |
| Bell tower of Santa Maria del Carmine | Italy | 14th c. | 68 | 3.54–0.84 | Rec | S | 0.69 | 0.76 | 2.28 | [24] |
| Cathedral of Colima | Mexico | 1889 | 31 | 1.5 | Rec | B | 1.40 | 1.62 | - | [25] |
| Qutb Minar | India | 1368 | 72.45 | - | Cir | S | 0.79 | 0.81 | 1.95 | [26] |
| Santas Justa and Rufina Church bell tower | Spain | 15th c. | 35.5 | 1.5 | Rec | B + S | 2.15 | 2.24 | 5.95 | [27] |
| Becci tower | Italy | - | 39.4 | 1.5 | Rec | S | 1.37 | 1.67 | - | [30] |
| Bell Tower of St. Sisto’s Church | Italy | 1754 | 40 | - | Rec | S | 1.36 | 1.47 | 4.25 | [34] |
| Minaret of Little Hagia Sophia | Türkiye | 1762 | 35.39 | 0.8–0.35 | Cir | S | 1.449 | 1.495 | 6.302 | [35] |
| Hagia Sofia Tower | Türkiye | 1250–1260 | 23 | 0.9–1.5 | Rec | - | 2.59 | 2.71 | 6.37 | [36] |
2. Materials and Methods
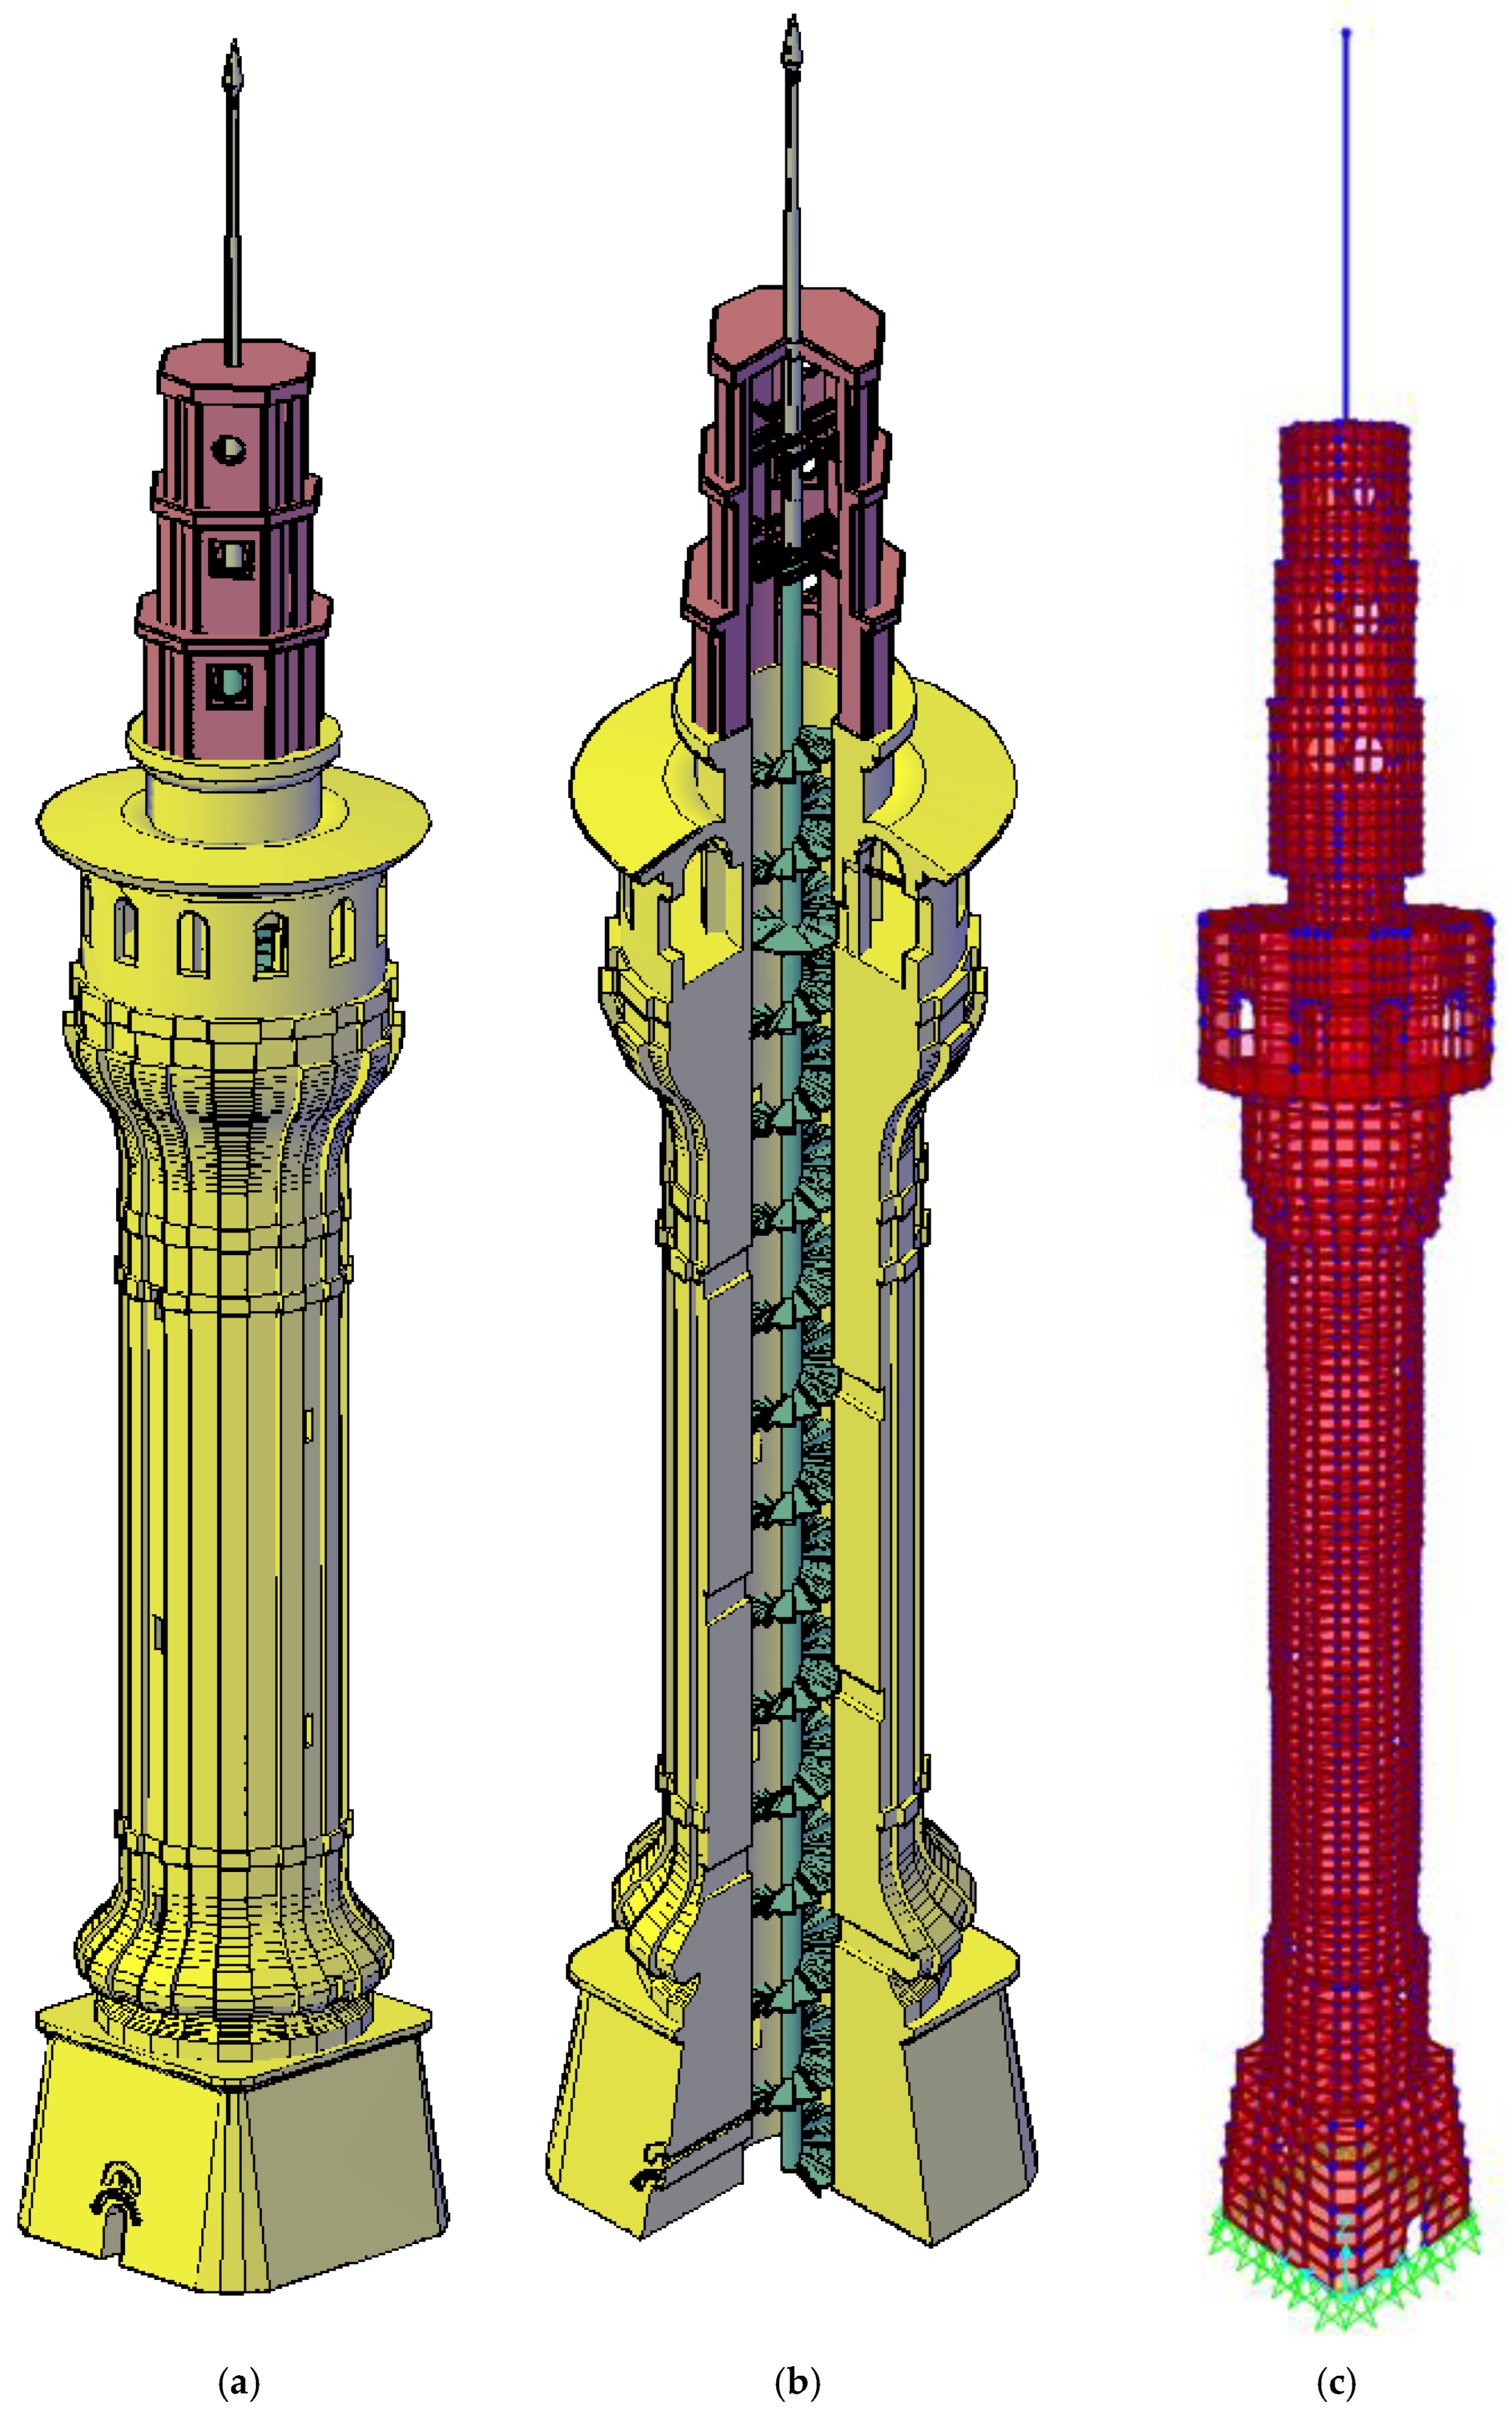
2.1. Numerical Modeling: Finite Element Models
2.2. Modal Analysis Using Finite Element Models
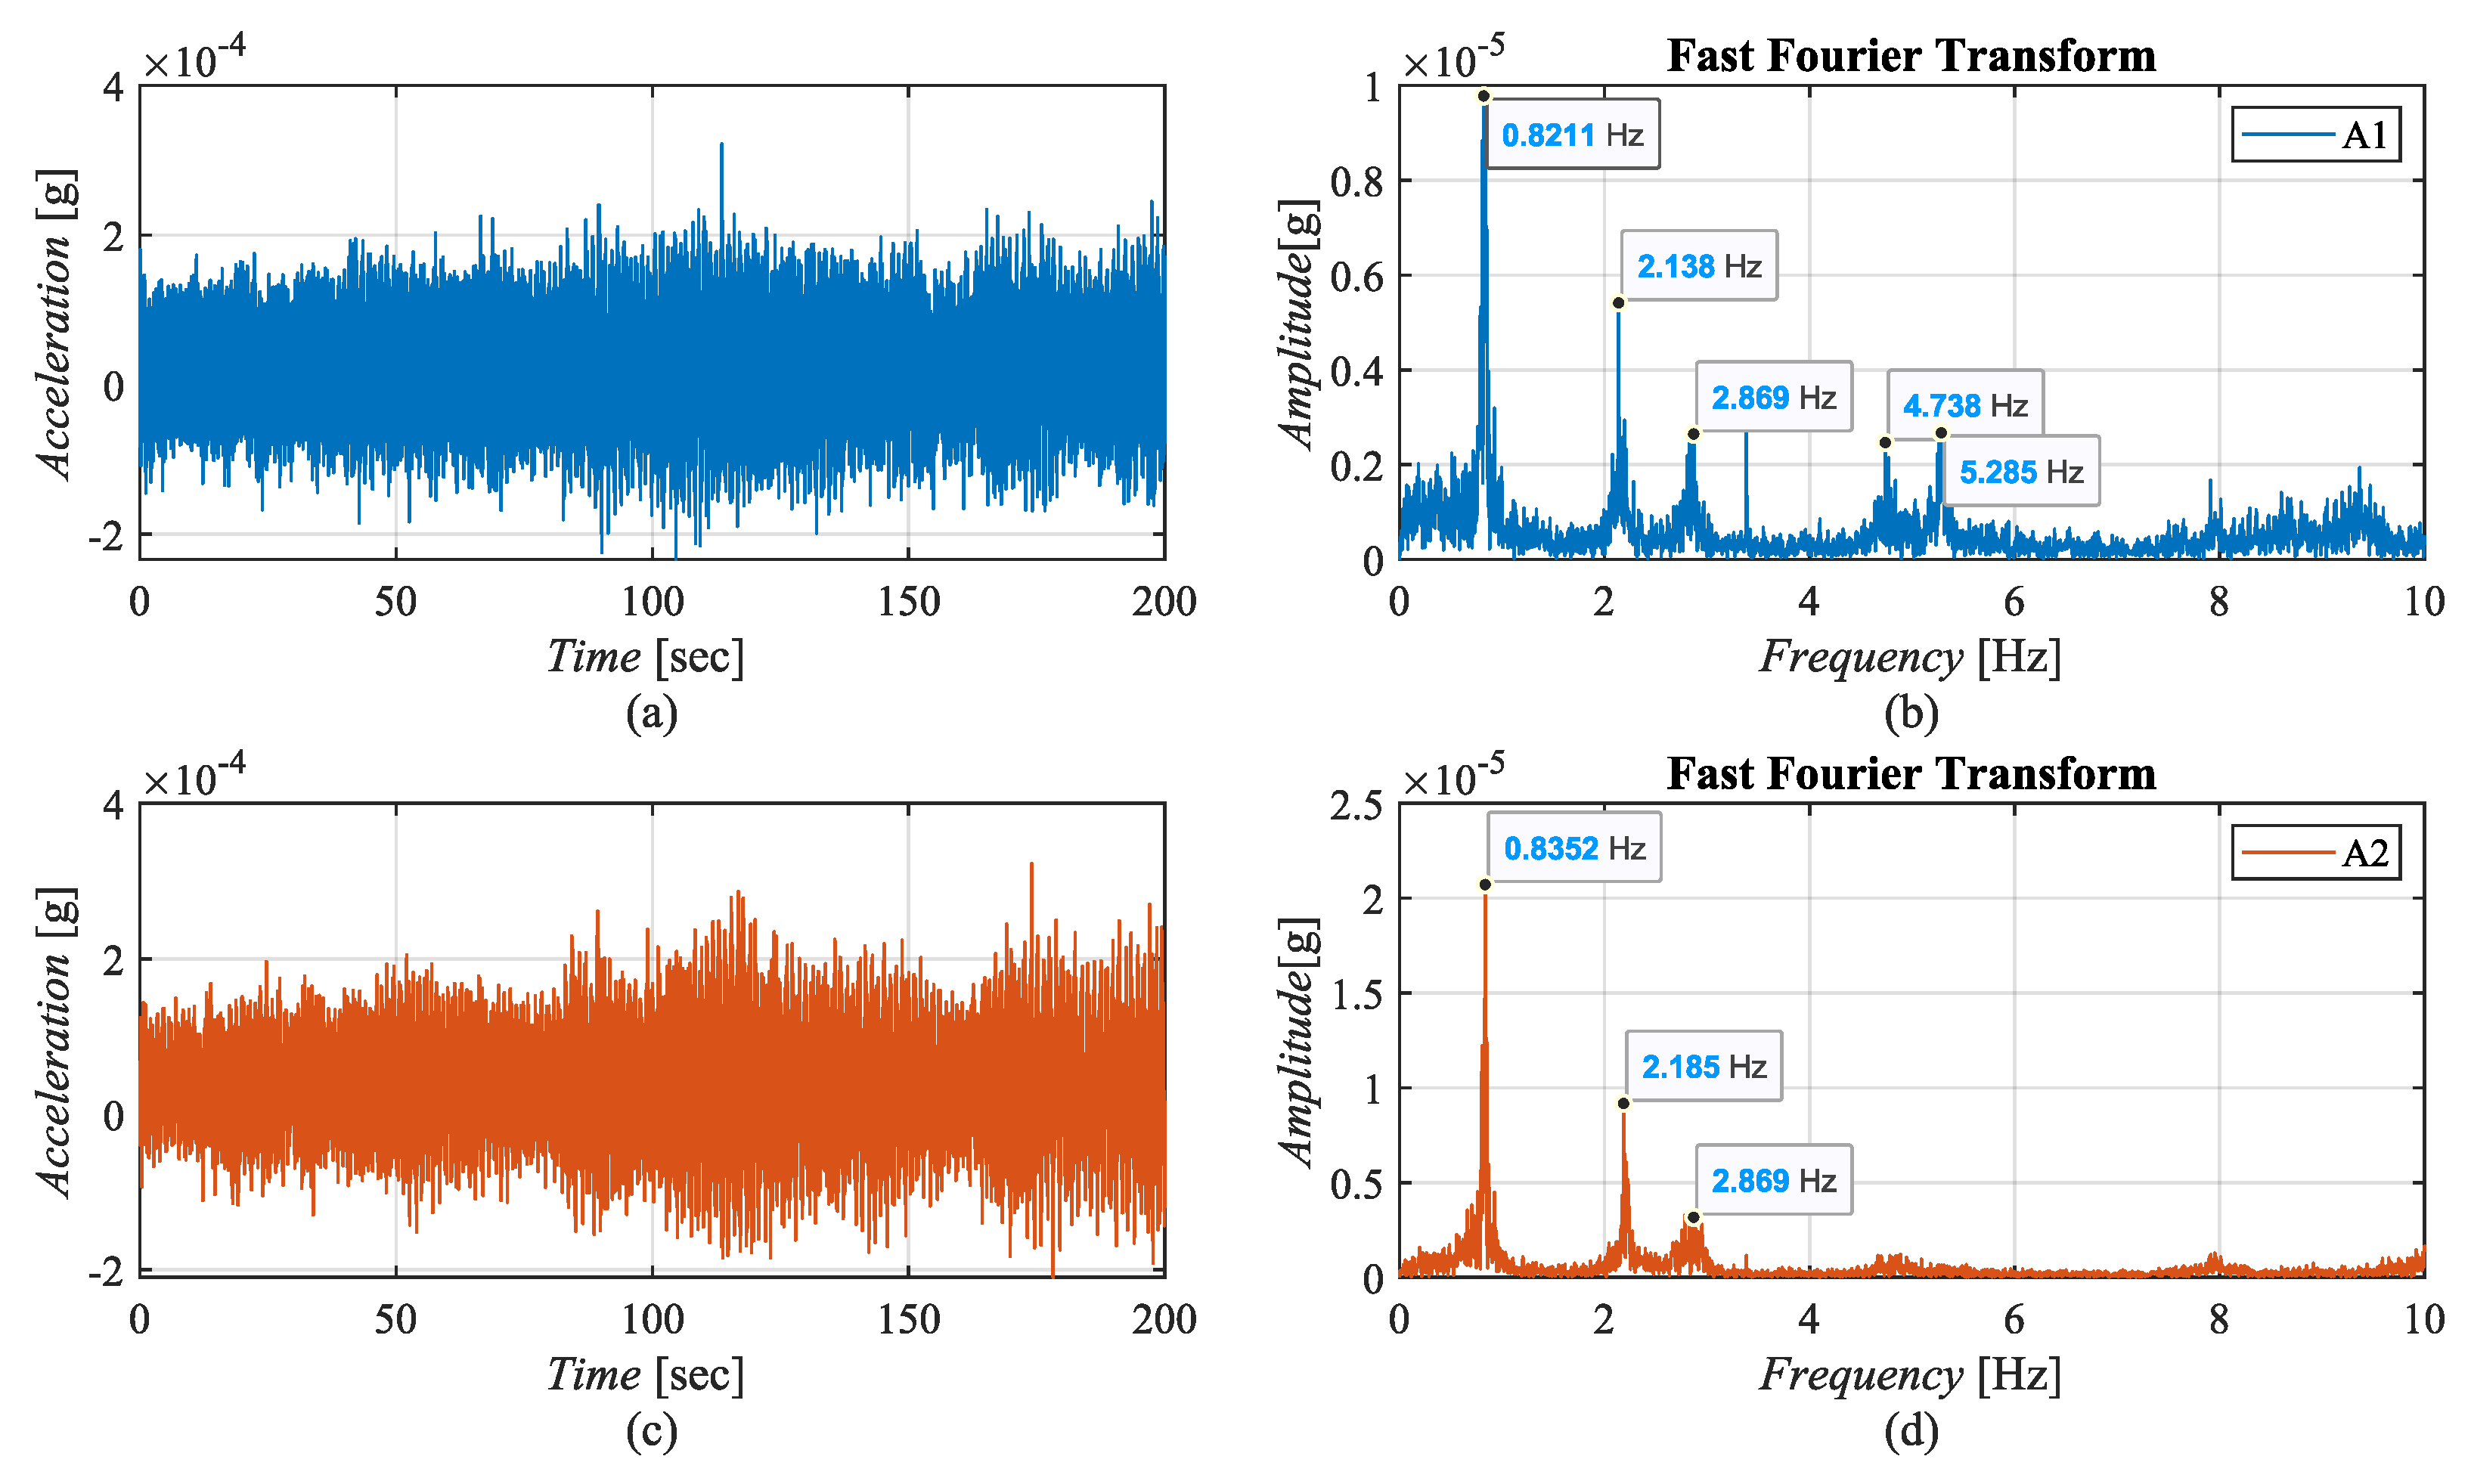
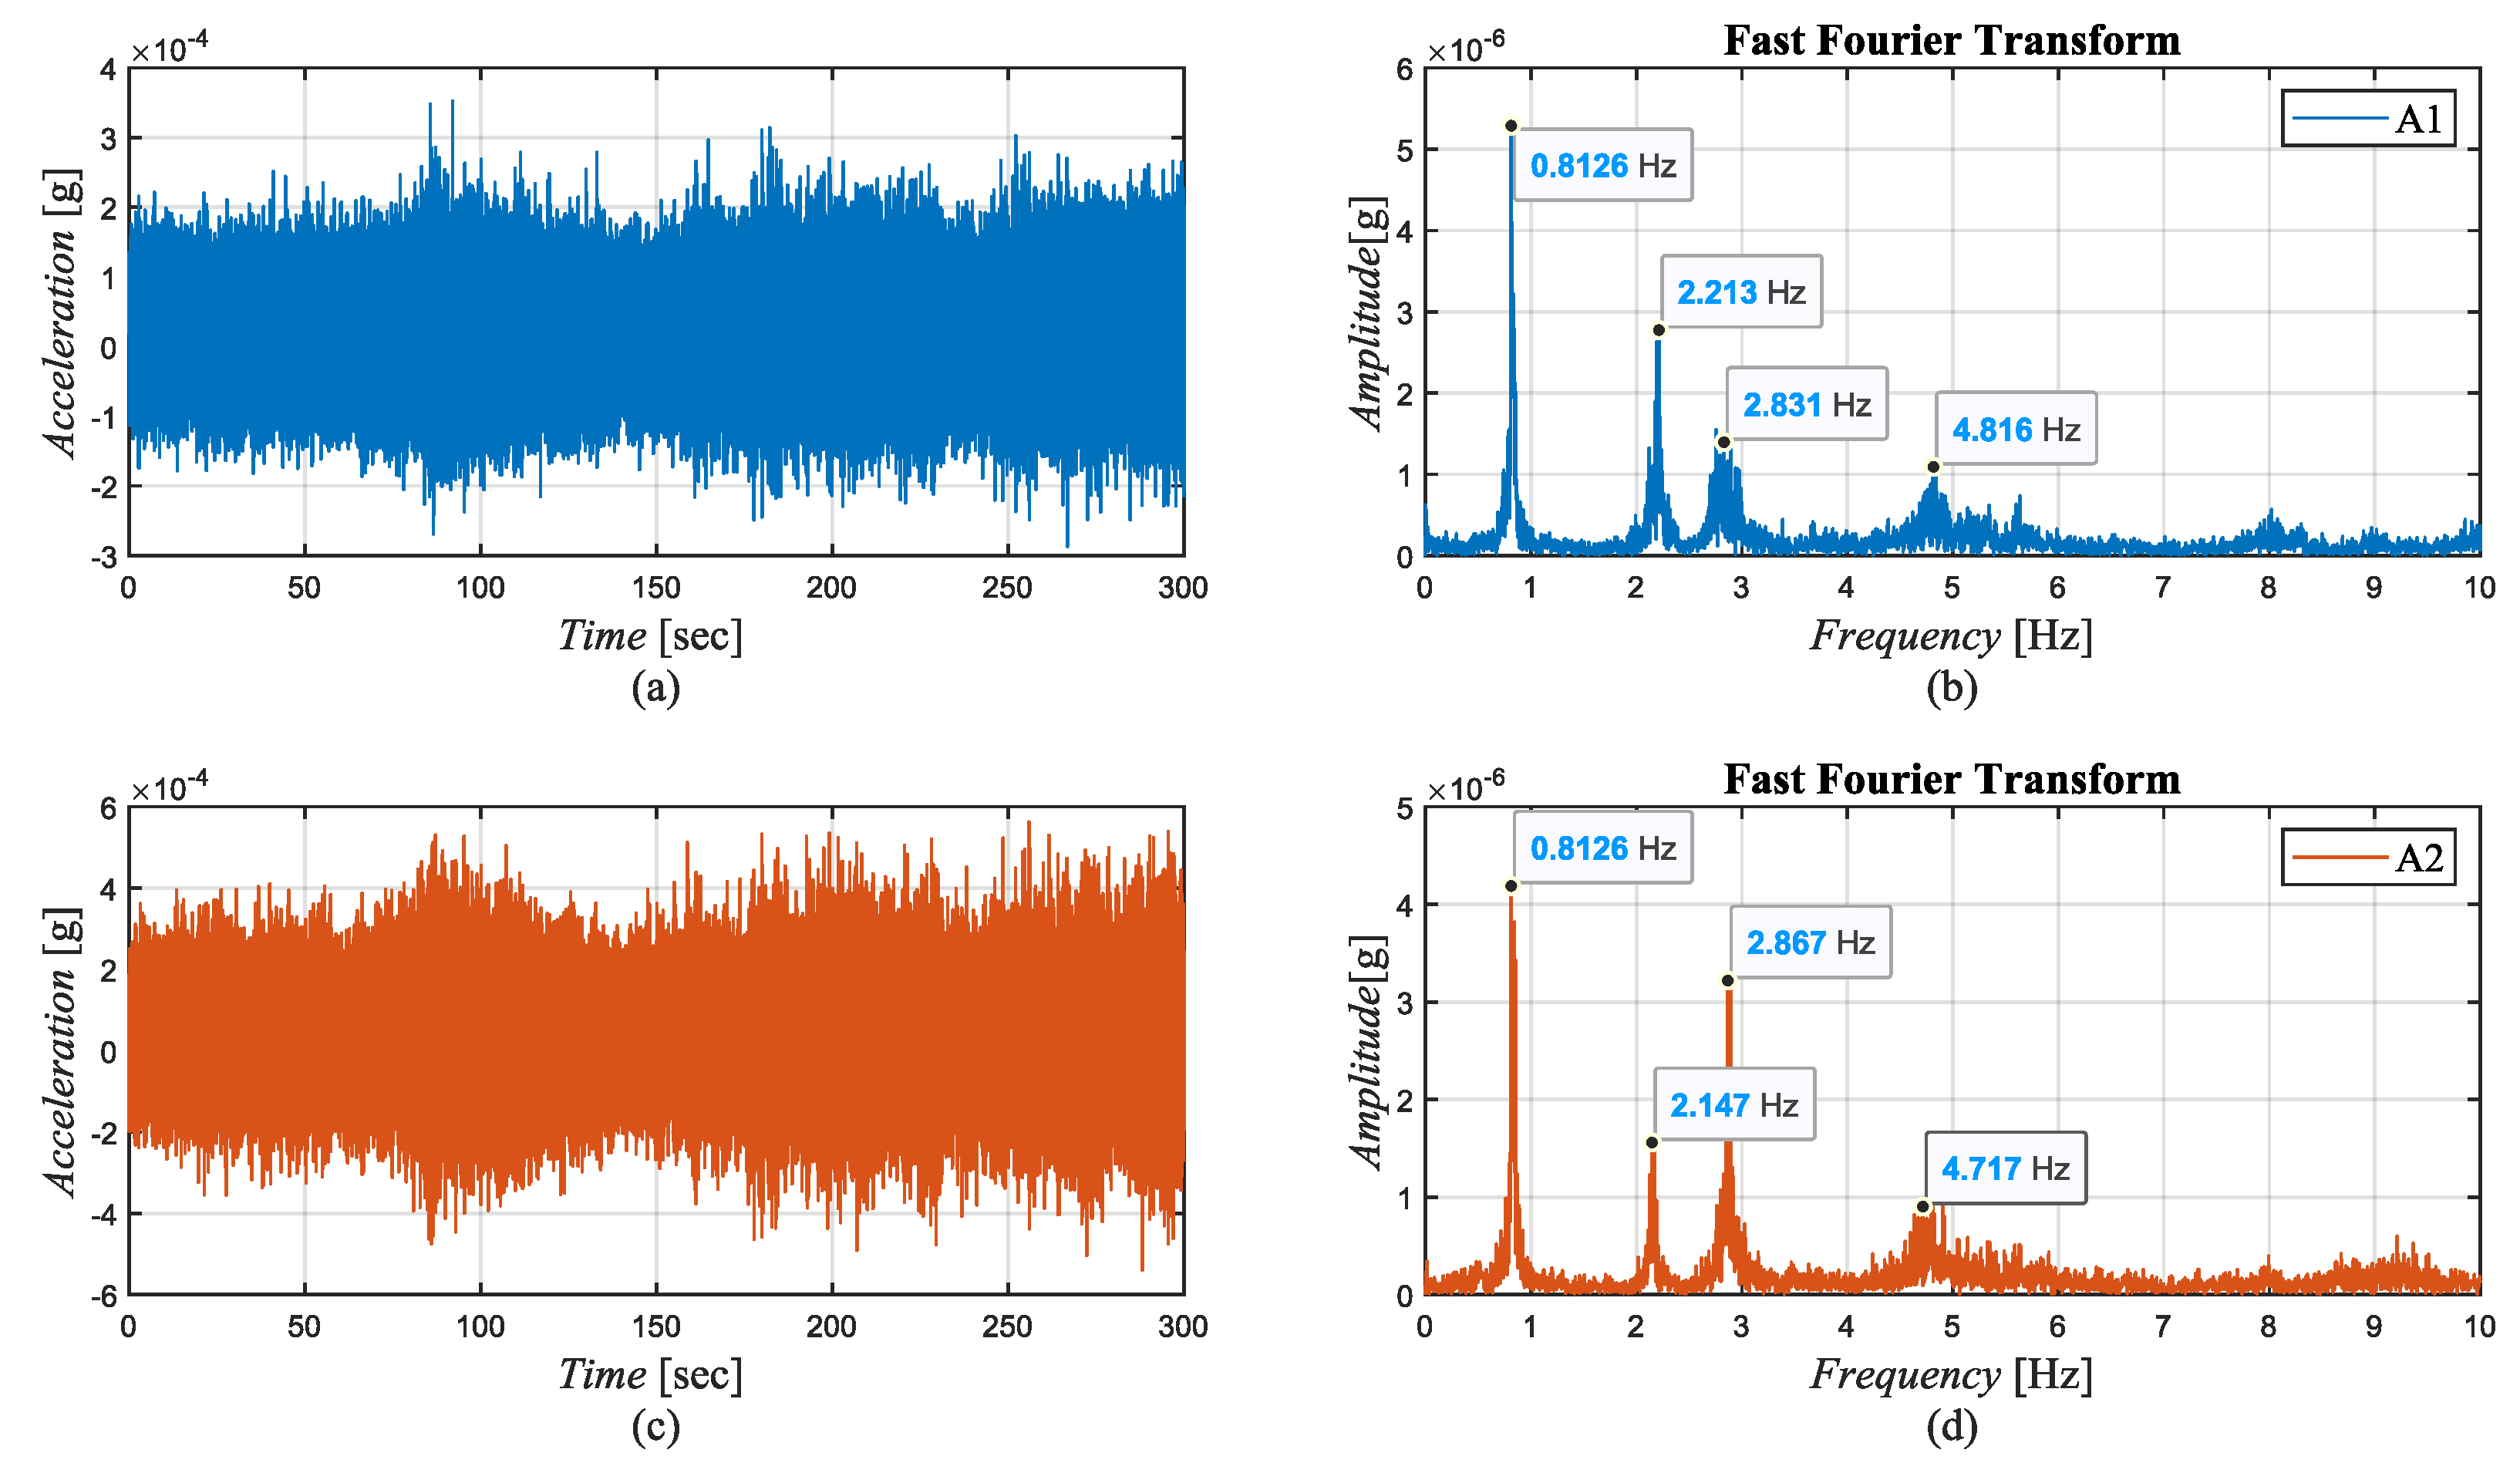
2.3. Experimental Study
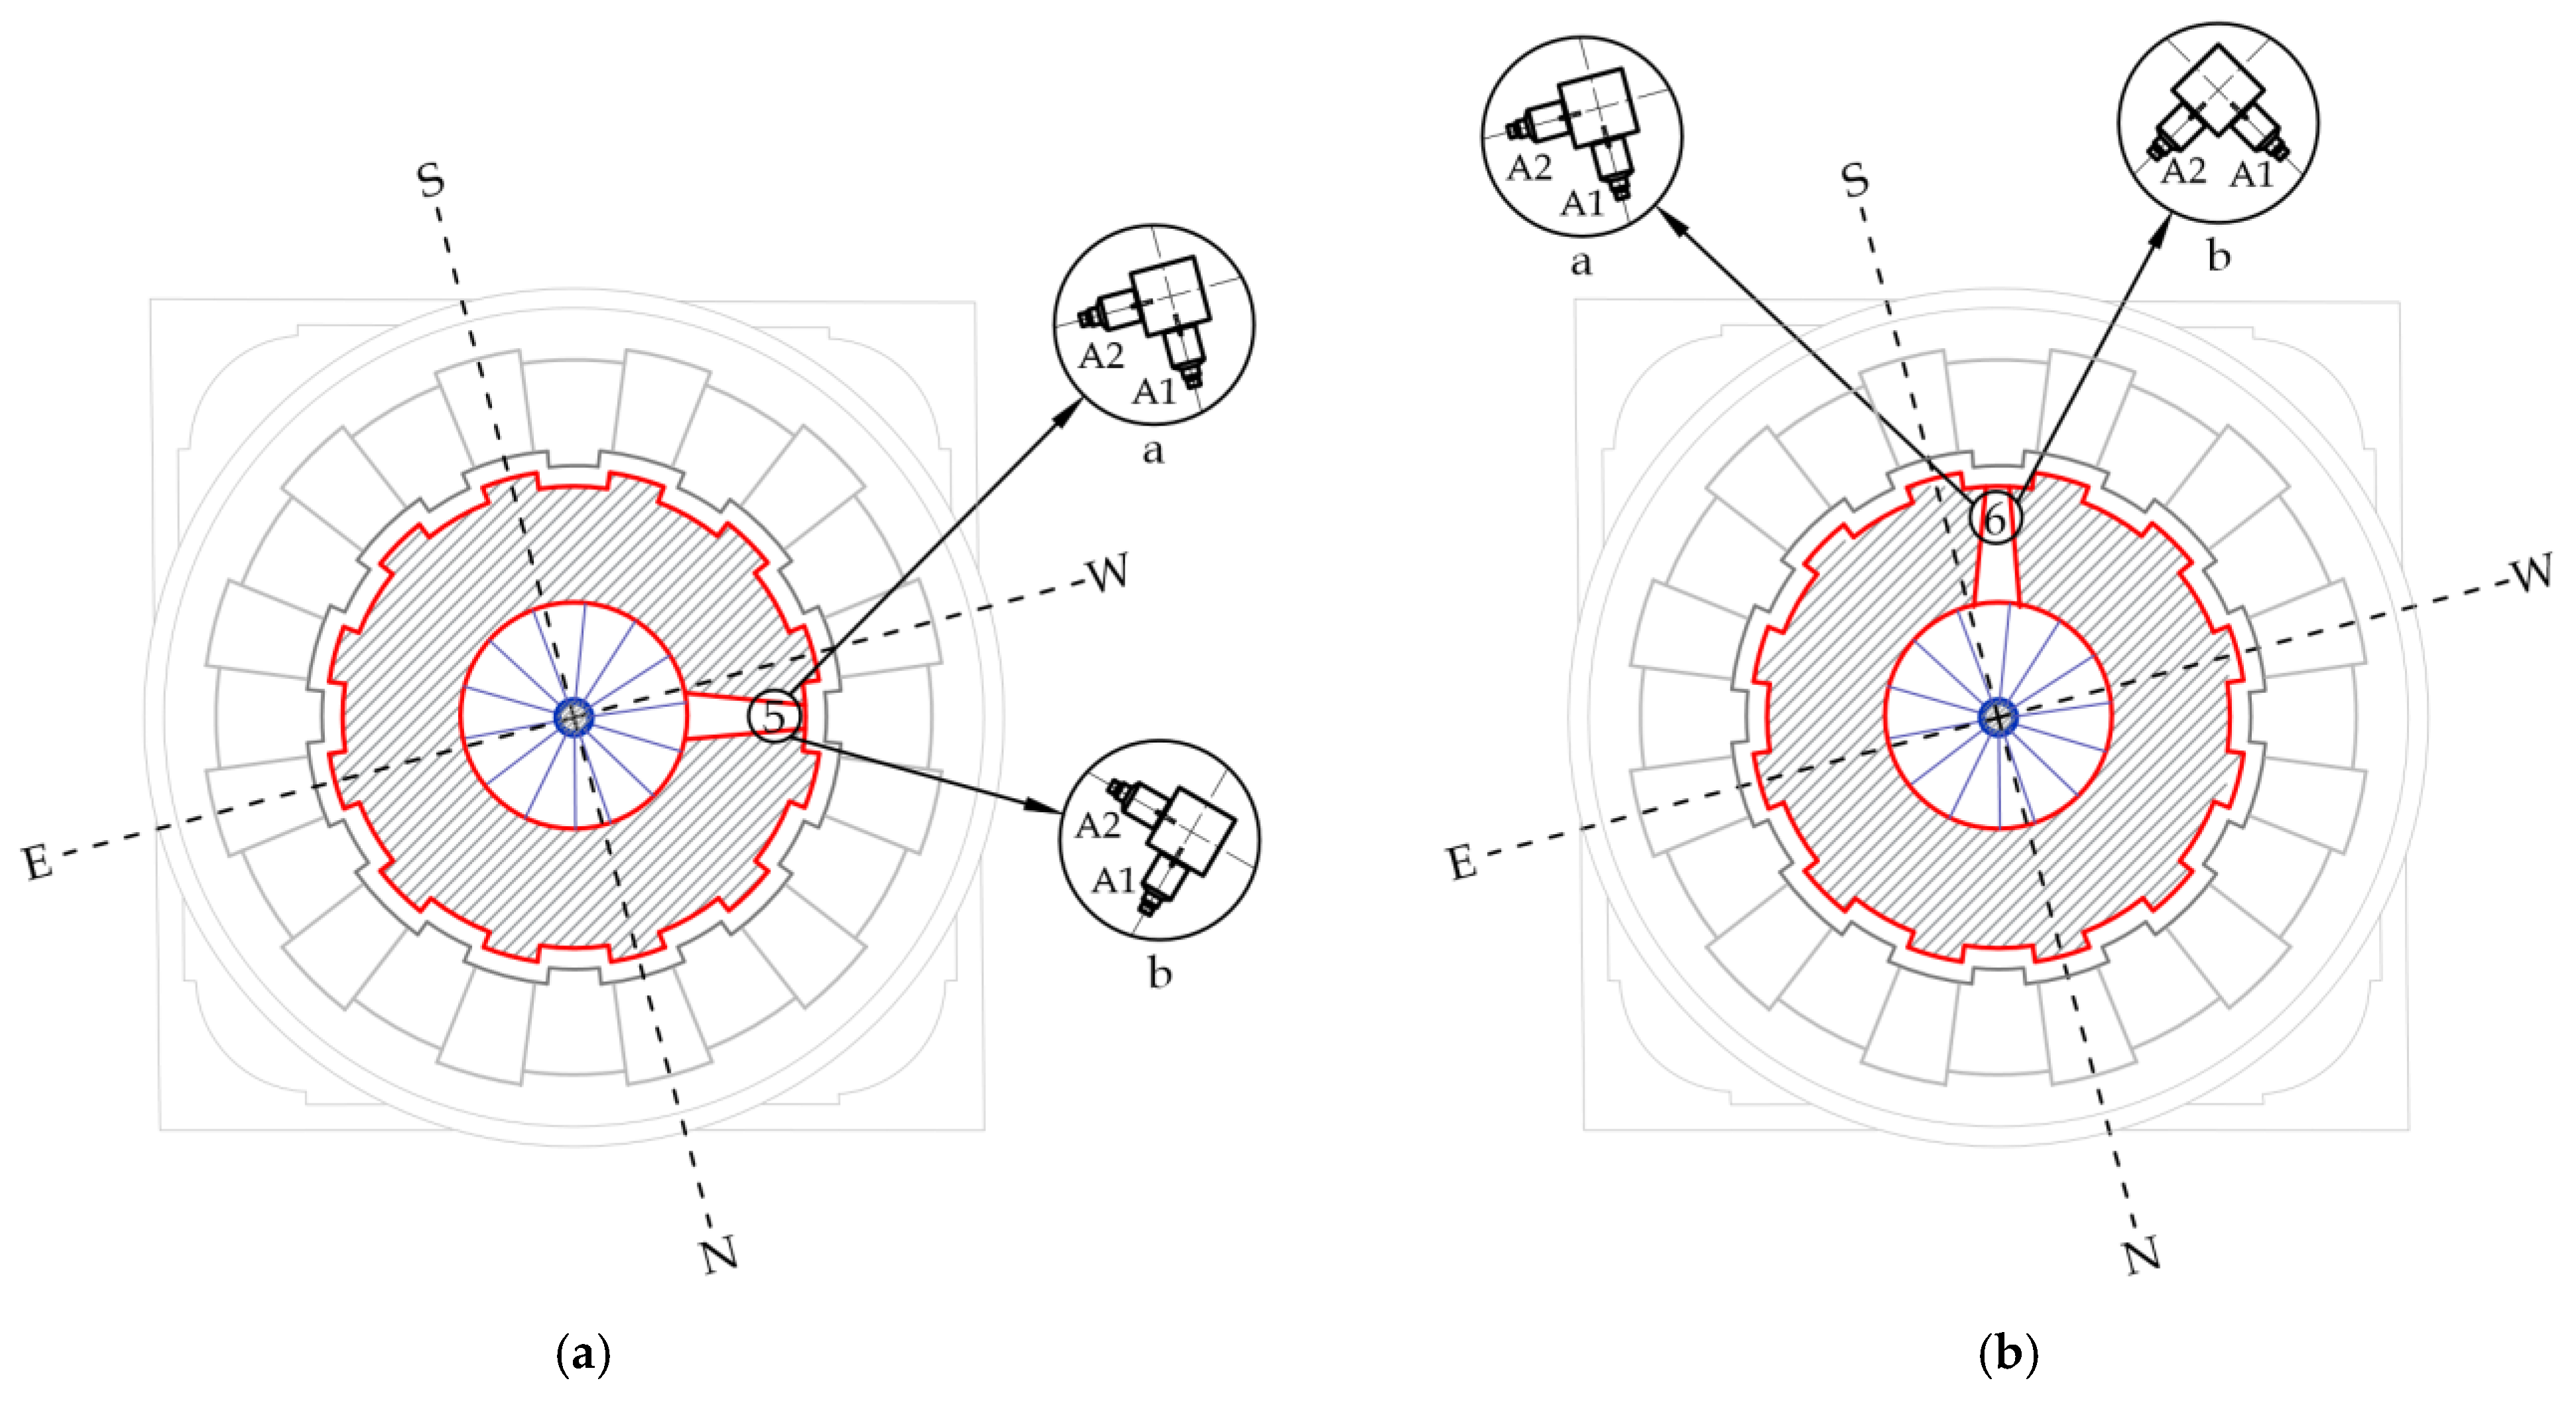
Ambient Vibration Tests
3. Results
3.1. Modal Analysis Results
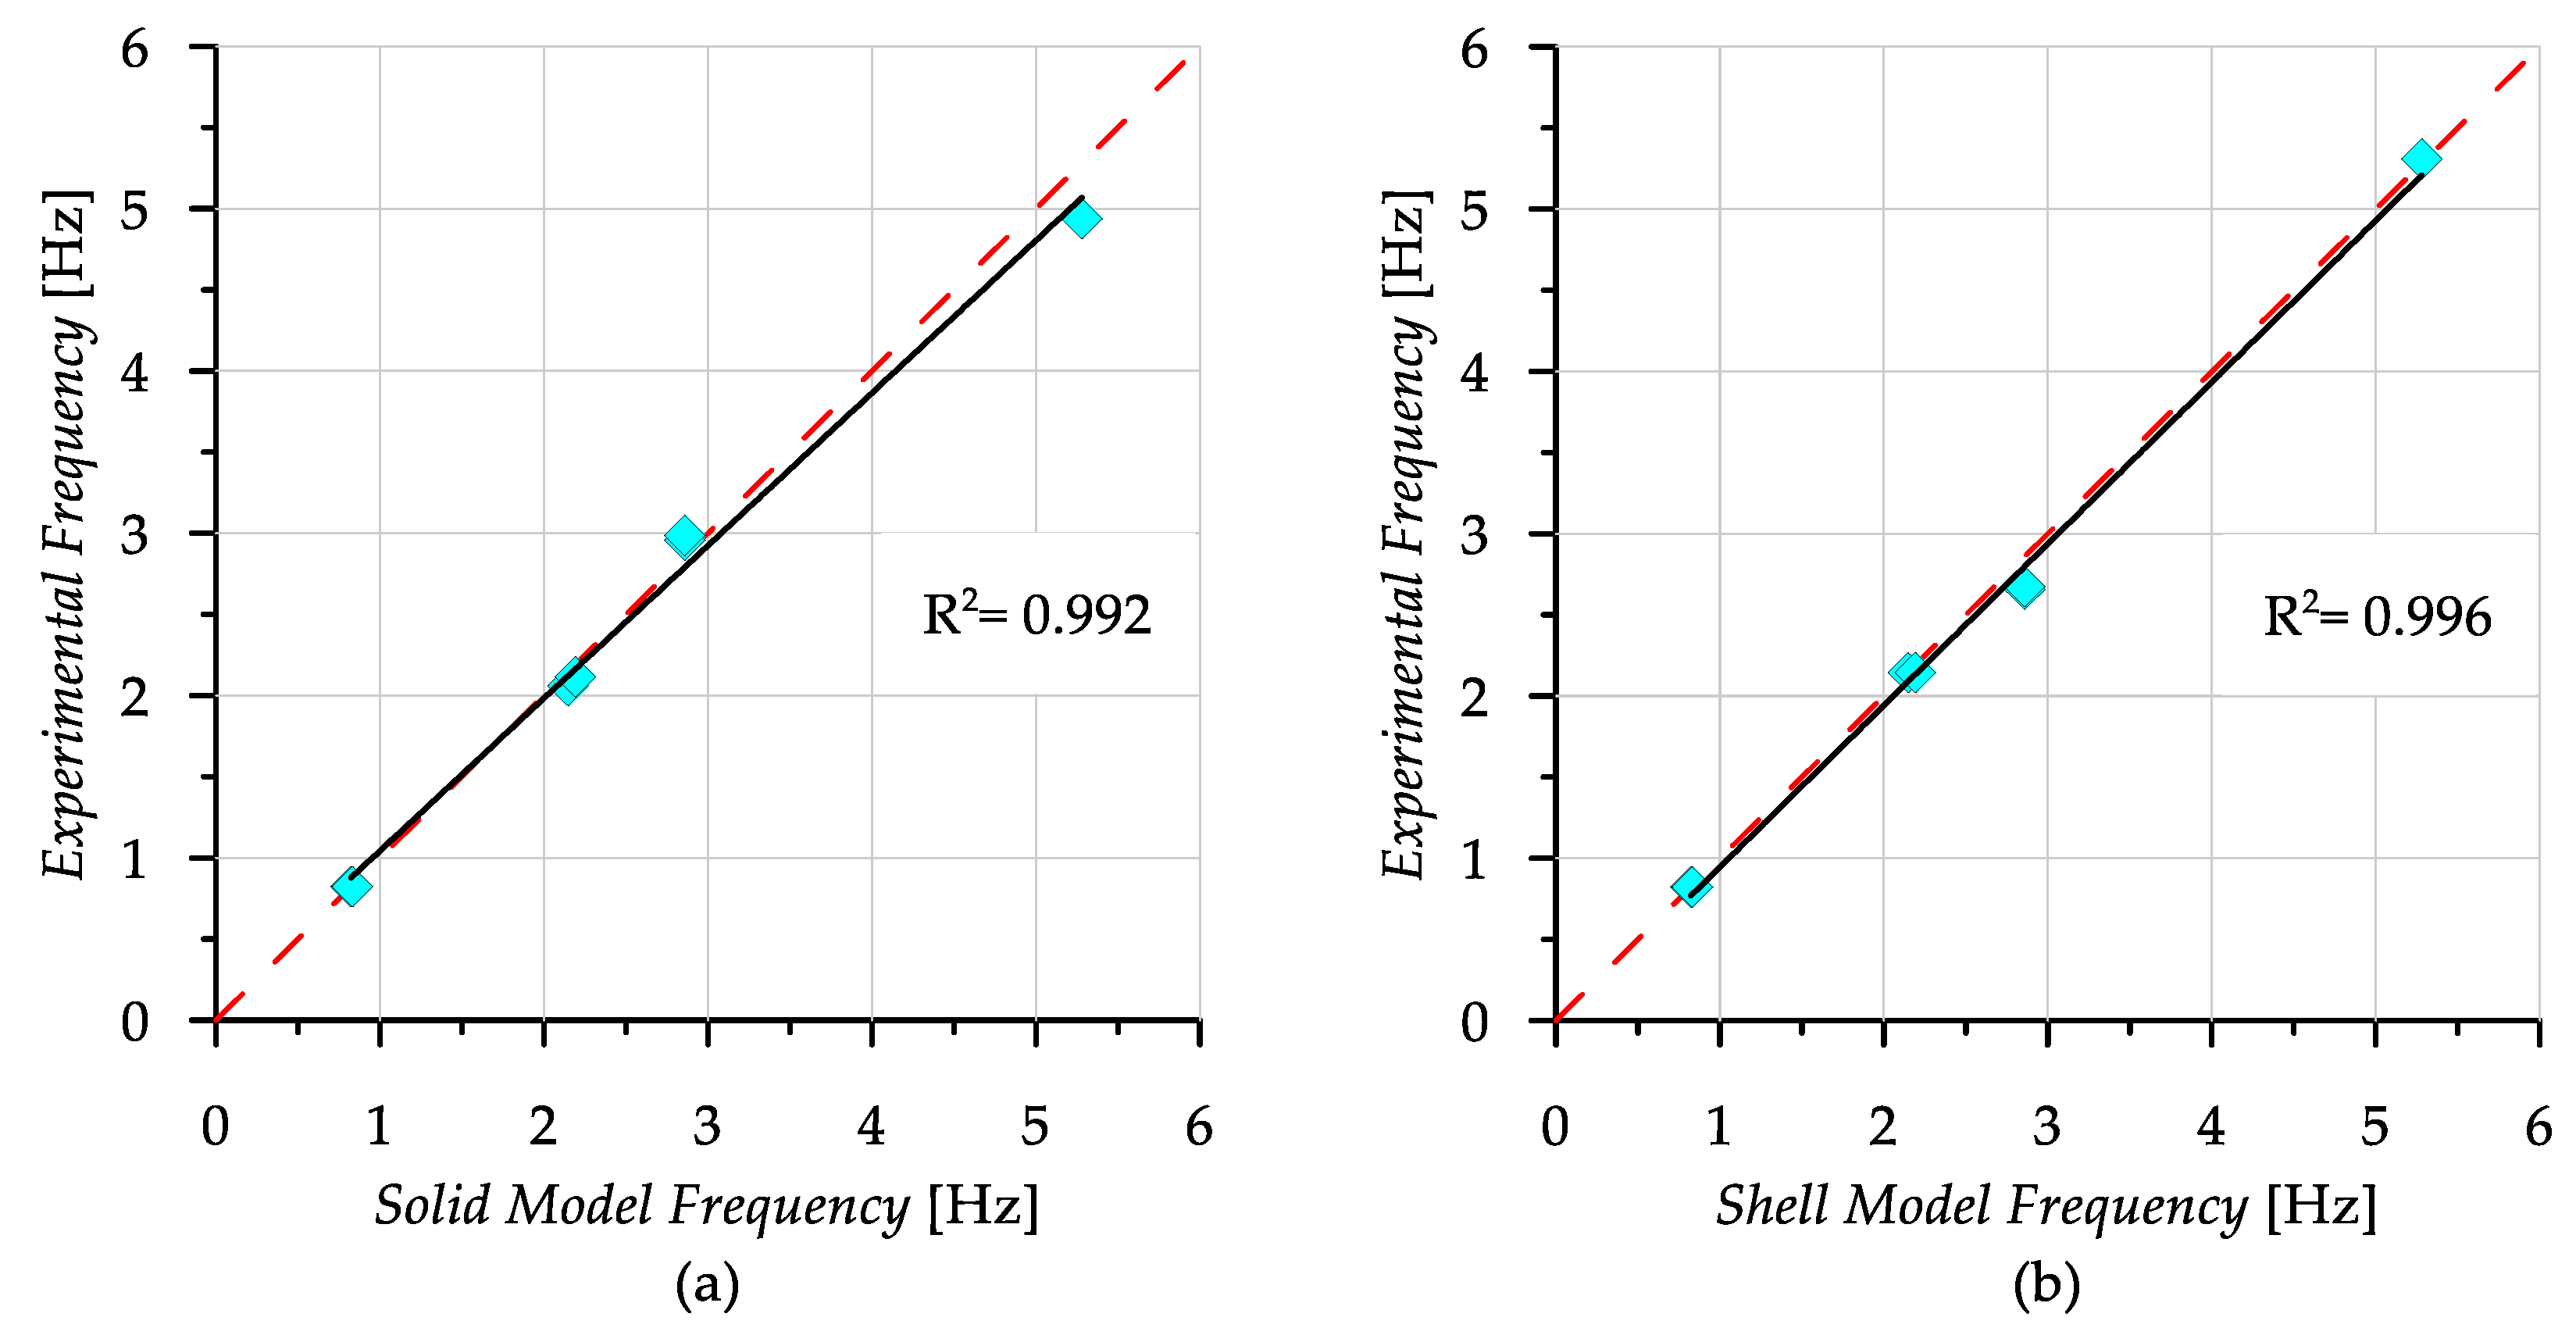
3.2. Comparison of Solid and Shell Models
- Due to the difficulties in the modeling technique of the shell model, the inability to achieve actual geometry in the regions where the body thickness of the tower changes.
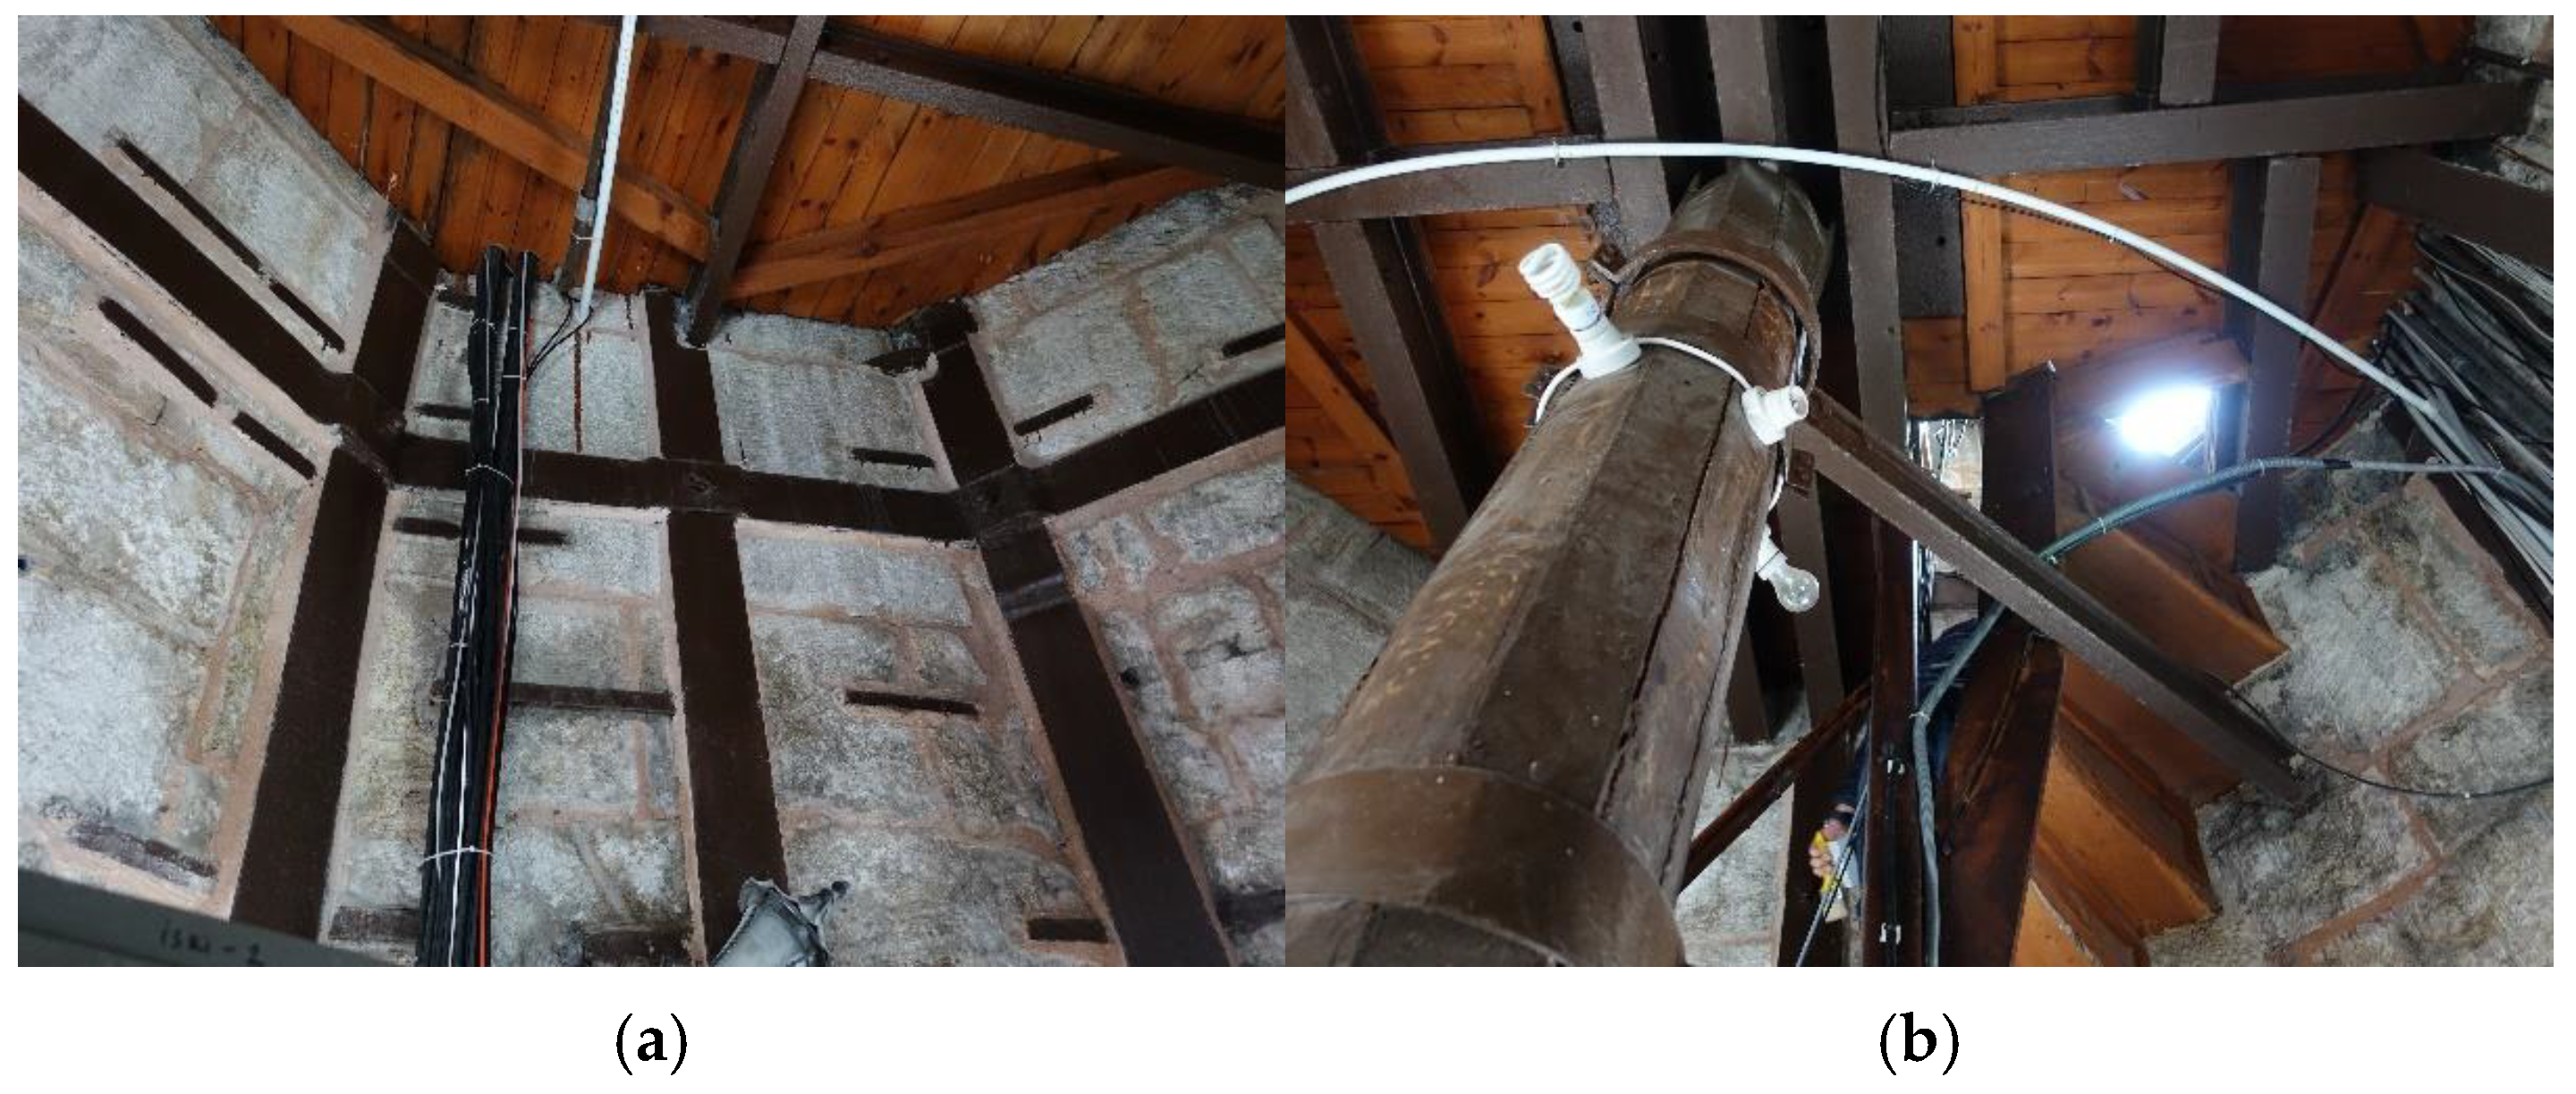
- Uncertainties about the presence of tension bars remaining in the walls, which cannot be included in the 3D solid and shell models.
- Inability to model the actual support conditions of architectural elements such as stairs.
3.3. Comparison of Updated Numerical and Experimental Results
4. Discussion
5. Conclusions
Author Contributions
Funding
Data Availability Statement
Acknowledgments
Conflicts of Interest
References
- Çobanoğlu, A.V. Beyazit Fire Tower Art History Report; Department of Construction of Technical Works Archive, Istanbul University: Istanbul, Türkiye, 2013. [Google Scholar]
- Minghini, F.; Bertolesi, E.; Del Grosso, A.; Milani, G.; Tralli, A. Modal Pushover and Response History Analyses of a Masonry Chimney before and after Shortening. Eng. Struct. 2016, 110, 307–324. [Google Scholar] [CrossRef]
- Öztorun, N.K. Beyazıt Tower. In Proceedings of the 1st Turkey Earthquake Engineering and Seismology Conference, Ankara, Türkiye, 11–14 October 2011; pp. 1–8. (In Turkish). [Google Scholar]
- Bocciarelli, M.; Barbieri, G. A Numerical Procedure for the Pushover Analysis of Masonry Towers. Soil Dyn. Earthq. Eng. 2017, 93, 162–171. [Google Scholar] [CrossRef]
- Bocciarelli, M. On the Behavior Factor of Masonry Towers. Soil Dyn. Earthq. Eng. 2017, 101, 81–89. [Google Scholar] [CrossRef]
- Milani, G.; Casolo, S.; Naliato, A.; Tralli, A. Seismic Assessment of a Medieval Masonry Tower in Northern Italy by Limit, Nonlinear Static, and Full Dynamic Analyses. Int. J. Archit. Herit. 2012, 6, 489–524. [Google Scholar] [CrossRef]
- Milani, G.; Shehu, R.; Valente, M. Seismic Assessment of Masonry Towers by Means of Nonlinear Static Procedures. Procedia Eng. 2017, 199, 266–271. [Google Scholar] [CrossRef]
- Valente, M.; Milani, G. Effects of Geometrical Features on the Seismic Response of Historical Masonry Towers. J. Earthq. Eng. 2018, 22, 2–34. [Google Scholar] [CrossRef]
- Menon, A.; Lai, C.G.; Macchi, G.; Pavese, A. Non-Linear Dynamic Analysis for Seismic Assessment of Ancient Masonry Towers. In Proceedings of the Structural Analysis of Historical Constructions, New Delhi, India, 6–8 November 2006; pp. 1641–1650. [Google Scholar]
- Preciado, A.; Sperbeck, S.T.; Ramírez-gaytán, A. Seismic Vulnerability Enhancement of Medieval and Masonry Bell Towers Externally Prestressed with Unbonded Smart Tendons. Eng. Struct. 2016, 122, 50–61. [Google Scholar] [CrossRef]
- Azzara, R.M.; De Roeck, G.; Girardi, M.; Padovani, C.; Pellegrini, D.; Reynders, E. The Influence of Environmental Parameters on the Dynamic Behaviour of the San Frediano Bell Tower in Lucca. Eng. Struct. 2018, 156, 175–187. [Google Scholar] [CrossRef]
- Saisi, A.; Gentile, C.; Guidobaldi, M. Post-Earthquake Continuous Dynamic Monitoring of the Gabbia Tower in Mantua, Italy. Constr. Build. Mater. 2015, 81, 101–112. [Google Scholar] [CrossRef]
- Saisi, A.; Gentile, C.; Ruccolo, A. Static and Dynamic Monitoring of a Cultural Heritage Bell-Tower in Monza, Italy. Procedia Eng. 2017, 199, 3356–3361. [Google Scholar] [CrossRef]
- Ubertini, F.; Comanducci, G.; Cavalagli, N.; Laura, A.; Luigi, A.; Cotana, F. Environmental Effects on Natural Frequencies of the San Pietro Bell Tower in Perugia, Italy, and Their Removal for Structural Performance Assessment. Mech. Syst. Signal Process. 2017, 82, 307–322. [Google Scholar] [CrossRef]
- Cabboi, A.; Gentile, C.; Saisi, A. From Continuous Vibration Monitoring to FEM-Based Damage Assessment: Application on a Stone-Masonry Tower. Constr. Build. Mater. 2017, 156, 252–265. [Google Scholar] [CrossRef]
- Cavalagli, N.; Comanducci, G.; Ubertini, F. Earthquake-Induced Damage Detection in a Monumental Masonry Bell-Tower Using Long-Term Dynamic Monitoring Data. J. Earthq. Eng. 2018, 22, 96–119. [Google Scholar] [CrossRef]
- Bennati, S.; Nardini, L.; Salvatore, W. Dynamic Behavior of a Medieval Masonry Bell Tower. II: Measurement and Modeling of the Tower Motion. J. Struct. Eng. 2005, 131, 1656–1664. [Google Scholar] [CrossRef]
- Diaferio, M.; Foti, D.; Giannoccaro, N.I. Modal Parameters Identification on Environmental Tests of an Ancient Tower and Validation of Its FE Model. Int. J. Mech. 2016, 10, 80–89. [Google Scholar]
- Erdogan, Y.S.; Kocatürk, T.; Demir, C. Investigation of the Seismic Behavior of a Historical Masonry Minaret Considering the Interaction with Surrounding Structures. J. Earthq. Eng. 2019, 23, 112–140. [Google Scholar] [CrossRef]
- Preciado, A.; Bartoli, G.; Ramírez-Gaytán, A. Earthquake Protection of the Torre Grossa Medieval Tower of San Gimignano, Italy by Vertical External Prestressing. Eng. Fail. Anal. 2017, 71, 31–42. [Google Scholar] [CrossRef]
- Sancibrian, R.; Lombillo, I.; Sarabia, E.G.; Boffill, Y.; Wong, H.; Villegas, L. Dynamic Identification and Condition Assessment of an Old Masonry Chimney by Using Modal Testing. Procedia Eng. 2017, 199, 3410–3415. [Google Scholar] [CrossRef]
- Ferraioli, M.; Mandara, A.; Abruzzese, D.; Miccoli, L. Dynamic Identification and Seismic Safety of Masonry Bell Towers. In Proceedings of the ANIDIS, Barı, Italy, 18–22 September 2011. [Google Scholar]
- Sabia, D.; Aoki, T.; Cosentini, R.M.; Lancellotta, R. Model Updating to Forecast the Dynamic Behavior of the Ghirlandina Tower in Modena, Italy. J. Earthq. Eng. 2015, 19, 1–24. [Google Scholar] [CrossRef]
- Ceroni, F.; Pecce, M.; Manfredi, G. Seismic Assessment of the Bell Tower of Santa Maria Del Carmine: Problems and Solutions. J. Earthq. Eng. 2010, 14, 30–56. [Google Scholar] [CrossRef]
- Preciado, A.; Budelmann, H.; Bartoli, G. Earthquake Protection of Colonial Bell Towers in Colima, Mexico with Externally Prestressed Frps. Int. J. Archit. Herit. 2016, 10, 499–515. [Google Scholar] [CrossRef]
- Peña, F.; Lourenço, P.B.; Mendes, N.; Oliveira, D. V Numerical Models for the Seismic Assessment of an Old Masonry Tower. Eng. Struct. 2010, 32, 1466–1478. [Google Scholar] [CrossRef]
- Ivorra, S.; Pallarés, F.J.; Adam, J.M.; Tomás, R. An Evaluation of the Incidence of Soil Subsidence on the Dynamic Behaviour of a Gothic Bell Tower. Eng. Struct. 2010, 32, 2318–2325. [Google Scholar] [CrossRef]
- D’Ambrisi, A.; Mariani, V.; Mezzi, M. Seismic Assessment of a Historical Masonry Tower with Nonlinear Static and Dynamic Analyses Tuned on Ambient Vibration Tests. Eng. Struct. 2012, 36, 210–219. [Google Scholar] [CrossRef]
- Lorenzoni, F.; Valluzzi, M.R.; Salvalaggio, M.; Minello, A.; Modena, C. Operational Modal Analysis for the Characterization of Ancient Water Towers in Pompeii. Procedia Eng. 2017, 199, 3374–3379. [Google Scholar] [CrossRef]
- Bartoli, G.; Betti, M.; Facchini, L.; Marra, A.M.; Monchetti, S. Bayesian Model Updating of Historic Masonry Towers through Dynamic Experimental Data. Procedia Eng. 2017, 199, 1258–1263. [Google Scholar] [CrossRef]
- Bergamo, O.; Campione, G.; Russo, G. Testing of “Global Young’s Modulus E” on a Rehabilitated Masonry Bell Tower in Venice. Eng. Fail. Anal. 2017, 74, 202–217. [Google Scholar] [CrossRef]
- Diaferio, M.; Foti, D.; Potenza, F. Prediction of the Fundamental Frequencies and Modal Shapes of Historic Masonry Towers by Empirical Equations Based on Experimental Data. Eng. Struct. 2018, 156, 433–442. [Google Scholar] [CrossRef]
- Şekerci, Ç. Determination of Dynamic Characteristics of Tall Historical Buildings: A Case Study Beyazıt Tower; Istanbul University: Istanbul, Türkiye, 2018. [Google Scholar]
- Balduzzi, B.; Mazza, D.; Papis, D.; Rossi, C.; Rossi, P.P. Experimental and Numerical Analysis for the Strengthening Intervention of the Bell-Tower of St. Sisto’s Church in Bergamo. In Proceedings of the Structural Analysis of Historical Constructions, New Delhi, India, 6–8 November 2006; pp. 1–8. [Google Scholar]
- Erkal, A. Transmission of Traffic-Induced Vibrations on and around the Minaret of Little Hagia Sophia. Int. J. Archit. Herit. 2017, 11, 349–362. [Google Scholar] [CrossRef]
- Bayraktar, A.; Türker, T.; Sevim, B.; Altunişik, A.C.; Yildirim, F. Modal Parameter Identification of Hagia Sophia Bell-Tower via Ambient Vibration Test. J. Nondestruct. Eval. 2009, 28, 37–47. [Google Scholar] [CrossRef]
- Haznedar, F.T.; Haznedar, B.; Alpdemir, H.; Kasap, O. Beyazit Tower Restoration Project; TEB Mimarlık ve İnşaat Taahhüt Ltd., Şti.: Istanbul, Türkiye; Department of Construction of Technical Works Archive, Istanbul University: Istanbul, Türkiye, 2011. [Google Scholar]
- ANSYS Inc. ANSYS, version 19.0; ANSYS Inc.: Canonsburg, PA, USA, 2017.
- Computers and Stuructures Inc. SAP2000, version 15.0.0; Computers and Stuructures Inc.: Walnut Creek, CA, USA, 2015.
- Aktas, Y.D.; Turer, A. Seismic Evaluation and Strengthening of Nemrut Monuments. J. Cult. Herit. 2015, 16, 381–385. [Google Scholar] [CrossRef]
- Mele, E.; De Luca, A.; Giordano, A. Modelling and Analysis of a Basilica under Earthquake Loading. J. Cult. Herit. 2003, 4, 355–367. [Google Scholar] [CrossRef]
- Magenes, G.; Penna, A.; Galasco, A.; Rota, M. Experimental Characterisation of Stone Masonry Mechanical Properties. In Proceedings of the 8th International Masonry Conference 2010, Dresden, Germany, 4–7 July 2010; pp. 247–256. [Google Scholar]
- Corradi, M.; Borri, A.; Vignoli, A. Experimental Study on the Determination of Strength of Masonry Walls. Constr. Build. Mater. 2003, 17, 325–337. [Google Scholar] [CrossRef]
- Ozgunler, M.; Ozgunler, S.A. The Experimental Methods Suggested in Characterization of Natural Stones Used in Historical Buildings. World Appl. Sci. J. 2010, 11, 569–572. [Google Scholar]
- TEC. Turkish Earthquake Code; Ministry of Public Works and Housing, Republic of Türkiye: Ankara, Türkiye, 2007. [Google Scholar]
- Turkish Chamber of Civil Engineers. Unit Weights of Building Materials and Construction Parts. Available online: https://www.imo.org.tr/resimler/dosya_ekler/f7deb880ca6b4b7_ek.pdf (accessed on 24 January 2025).
- TBEC. Turkey Building Earthquake Code; Disaster and Emergency Management Presidency, Ministry of Interior: Ankara, Türkiye, 2018. [Google Scholar]
- Mahmutoğlu, Y.; Angı, O.S.; Özmen, I.E.; Yeşilkaya, Z. Investigation of Potential Resource Areas of Indigenous Natural Stones Used in Historical Buildings in Istanbul. In Proceedings of the National Engineering Geology and Geotechnics Symposium, MUHJEO’2017, Adana, Türkiye, 12–14 October 2017; pp. 58–65. (In Turkish). [Google Scholar]
- Bozdağ, B.; Bütüner, M.M. Restoration Project of Pertev Mehmet Paşa Mosque. In Proceedings of the Conservation and Repair of Masonry Structures Seminar VI, Istanbul, Türkiye, 2–3 December 2014; pp. 66–76. (In Turkish). [Google Scholar]
- Arioğlu, N.; Arioğlu, E. Engineering Mystery of Master Architect Sinan’s “Küfeki” Shell Limestone. Archit. Sci. Rev. 2005, 48, 163–171. [Google Scholar] [CrossRef]
- Turk, A.M.; Cosgun, C. Seismic Behaviour and Retrofit of Historic Masonry Minaret. Građevinar 2012, 64, 39–45. [Google Scholar] [CrossRef]
- The MathWorks Inc. Matlab, version 2017b; The MathWorks Inc.: Natick, MA, USA, 2017.
- Brincker, R.; Zhang, L.; Andersen, P. Aalborg Universitet Modal Identification from Ambient Responses Using Frequency Domain Decomposition. In Proceedings of the MAC 18: Proceedings of the International Modal Analysis Conference, San Antonio, TX, USA, 7–10 February 2000; pp. 625–630. [Google Scholar]
- Rainieri, C.; Fabbrocino, G. Operational Modal Analysis of Civil Engineering Structures; Springer: New York, NY, USA, 2014; ISBN 9781493907663. [Google Scholar]
- Salehi, M.; Esfarjani, S.M.; Ghorbani, M. Modal Parameter Extraction of a Huge Four Stage Centrifugal Compressor Using Operational Modal Analysis Method. Lat. Am. J. Solids Struct. 2018, 15, e29. [Google Scholar] [CrossRef]
- Lancellotta, R.; Sabia, D. Identification Technique for Soil-Structure Analysis of the Ghirlandina Tower. Int. J. Archit. Herit. 2015, 9, 391–407. [Google Scholar] [CrossRef]
- Cruz, C.; Miranda, E. Evaluation of Soil-Structure Interaction Effects on the Damping Ratios of Buildings Subjected to Earthquakes. Soil Dyn. Earthq. Eng. 2017, 100, 183–195. [Google Scholar] [CrossRef]
- De Silva, F.; Pitilakis, D.; Ceroni, F.; Sica, S.; Silvestri, F. Experimental and Numerical Dynamic Identification of a Historic Masonry Bell Tower Accounting for Different Types of Interaction. Soil Dyn. Earthq. Eng. 2018, 109, 235–250. [Google Scholar] [CrossRef]
- De Angelis, A.; Lourenço, P.B.; Sica, S.; Pecce, M.R. Influence of the Ground on the Structural Identification of a Bell-Tower by Ambient Vibration Testing. Soil Dyn. Earthq. Eng. 2022, 155, 107102. [Google Scholar] [CrossRef]
- Aras, F.; Krstevska, L.; Altay, G.; Tashkov, L. Experimental and Numerical Modal Analyses of a Historical Masonry Palace. Constr. Build. Mater. 2011, 25, 81–91. [Google Scholar] [CrossRef]


| Density [kg/m3] | Ref. | Young Modulus [MPa] | Ref. | |
|---|---|---|---|---|
| Rubble stone | 2700 | [40] | 20,000 | [40] |
| 1600 | [41] | 1100 | [41] | |
| 2579 | [42] | 1124 | [43] | |
| 2050–2120 | [44] | 240 | [45] | |
| 2400 | [46] | 1050–9000 | [47] | |
| Limestone | 1870–2700 | [48] | - | - |
| 1700 | [49] | 10,000 | [49] | |
| 1920–1970 | [35] | 11,500–13,000 | [35] | |
| 2190 | [50] | 24,000 | [50] | |
| 2390 | [51] | 5840 | [51] |
| Mode | Mode Shape | Modal Frequencies [Hz] | |
|---|---|---|---|
| Shell | Solid | ||
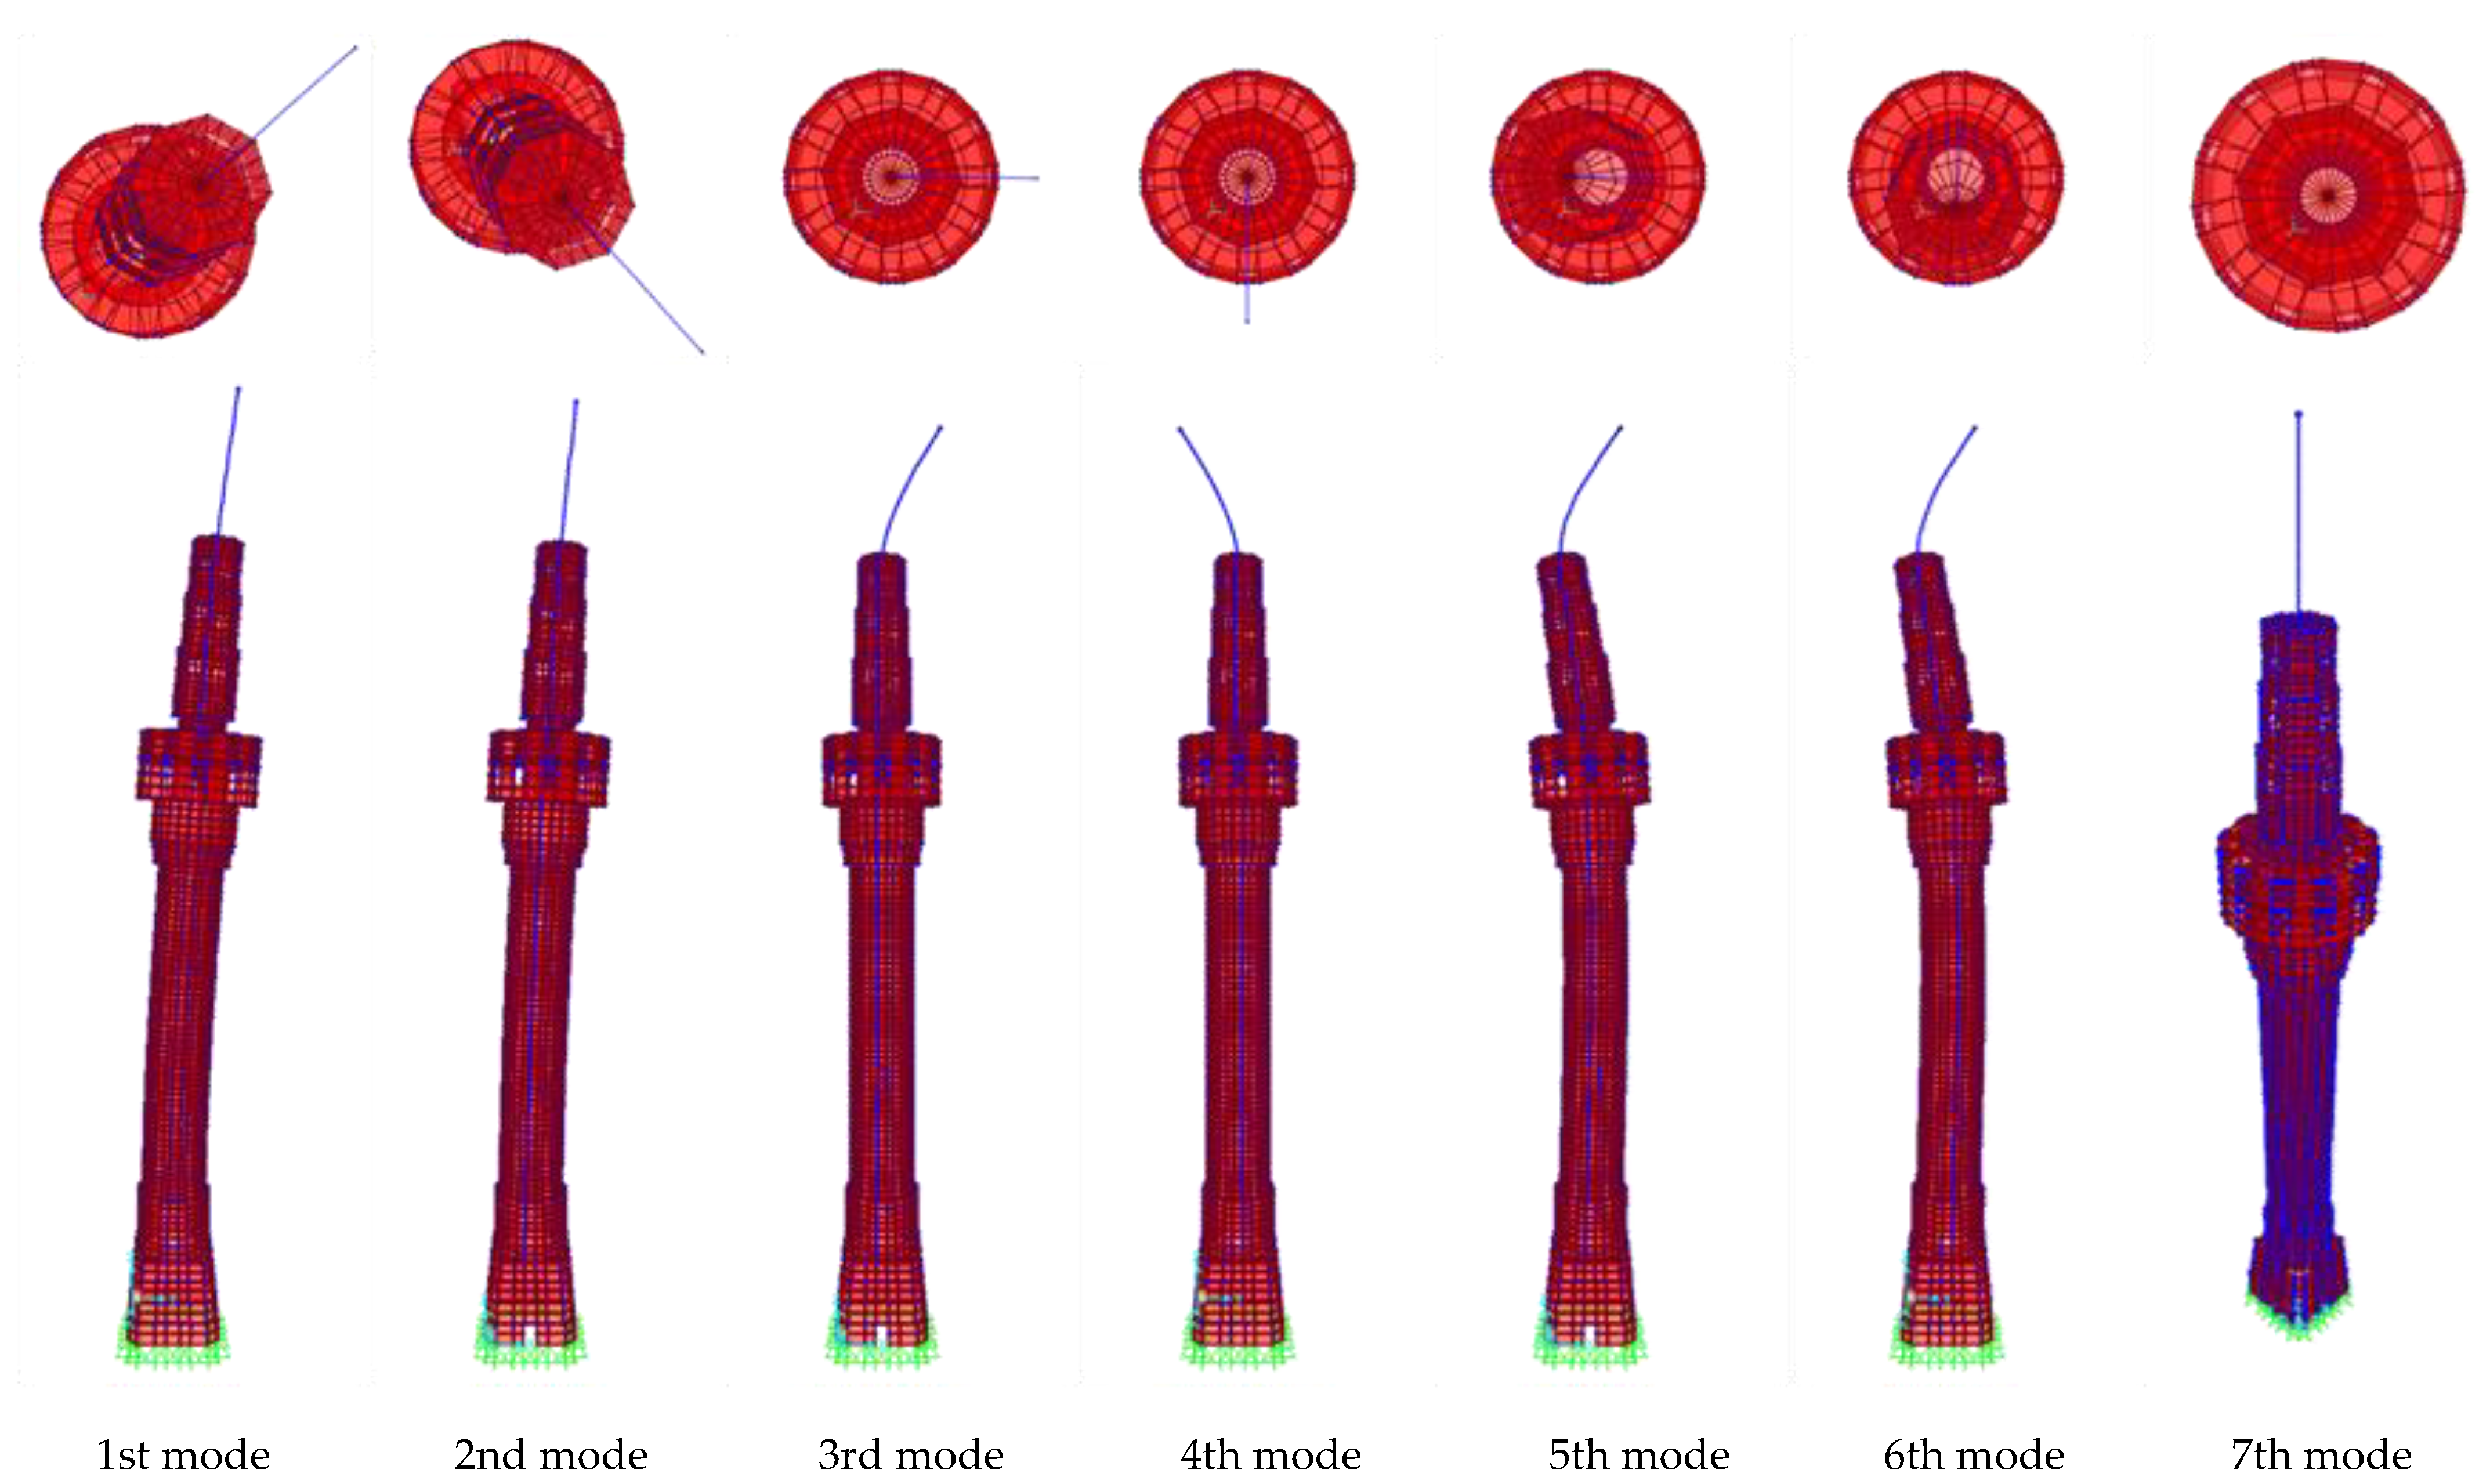
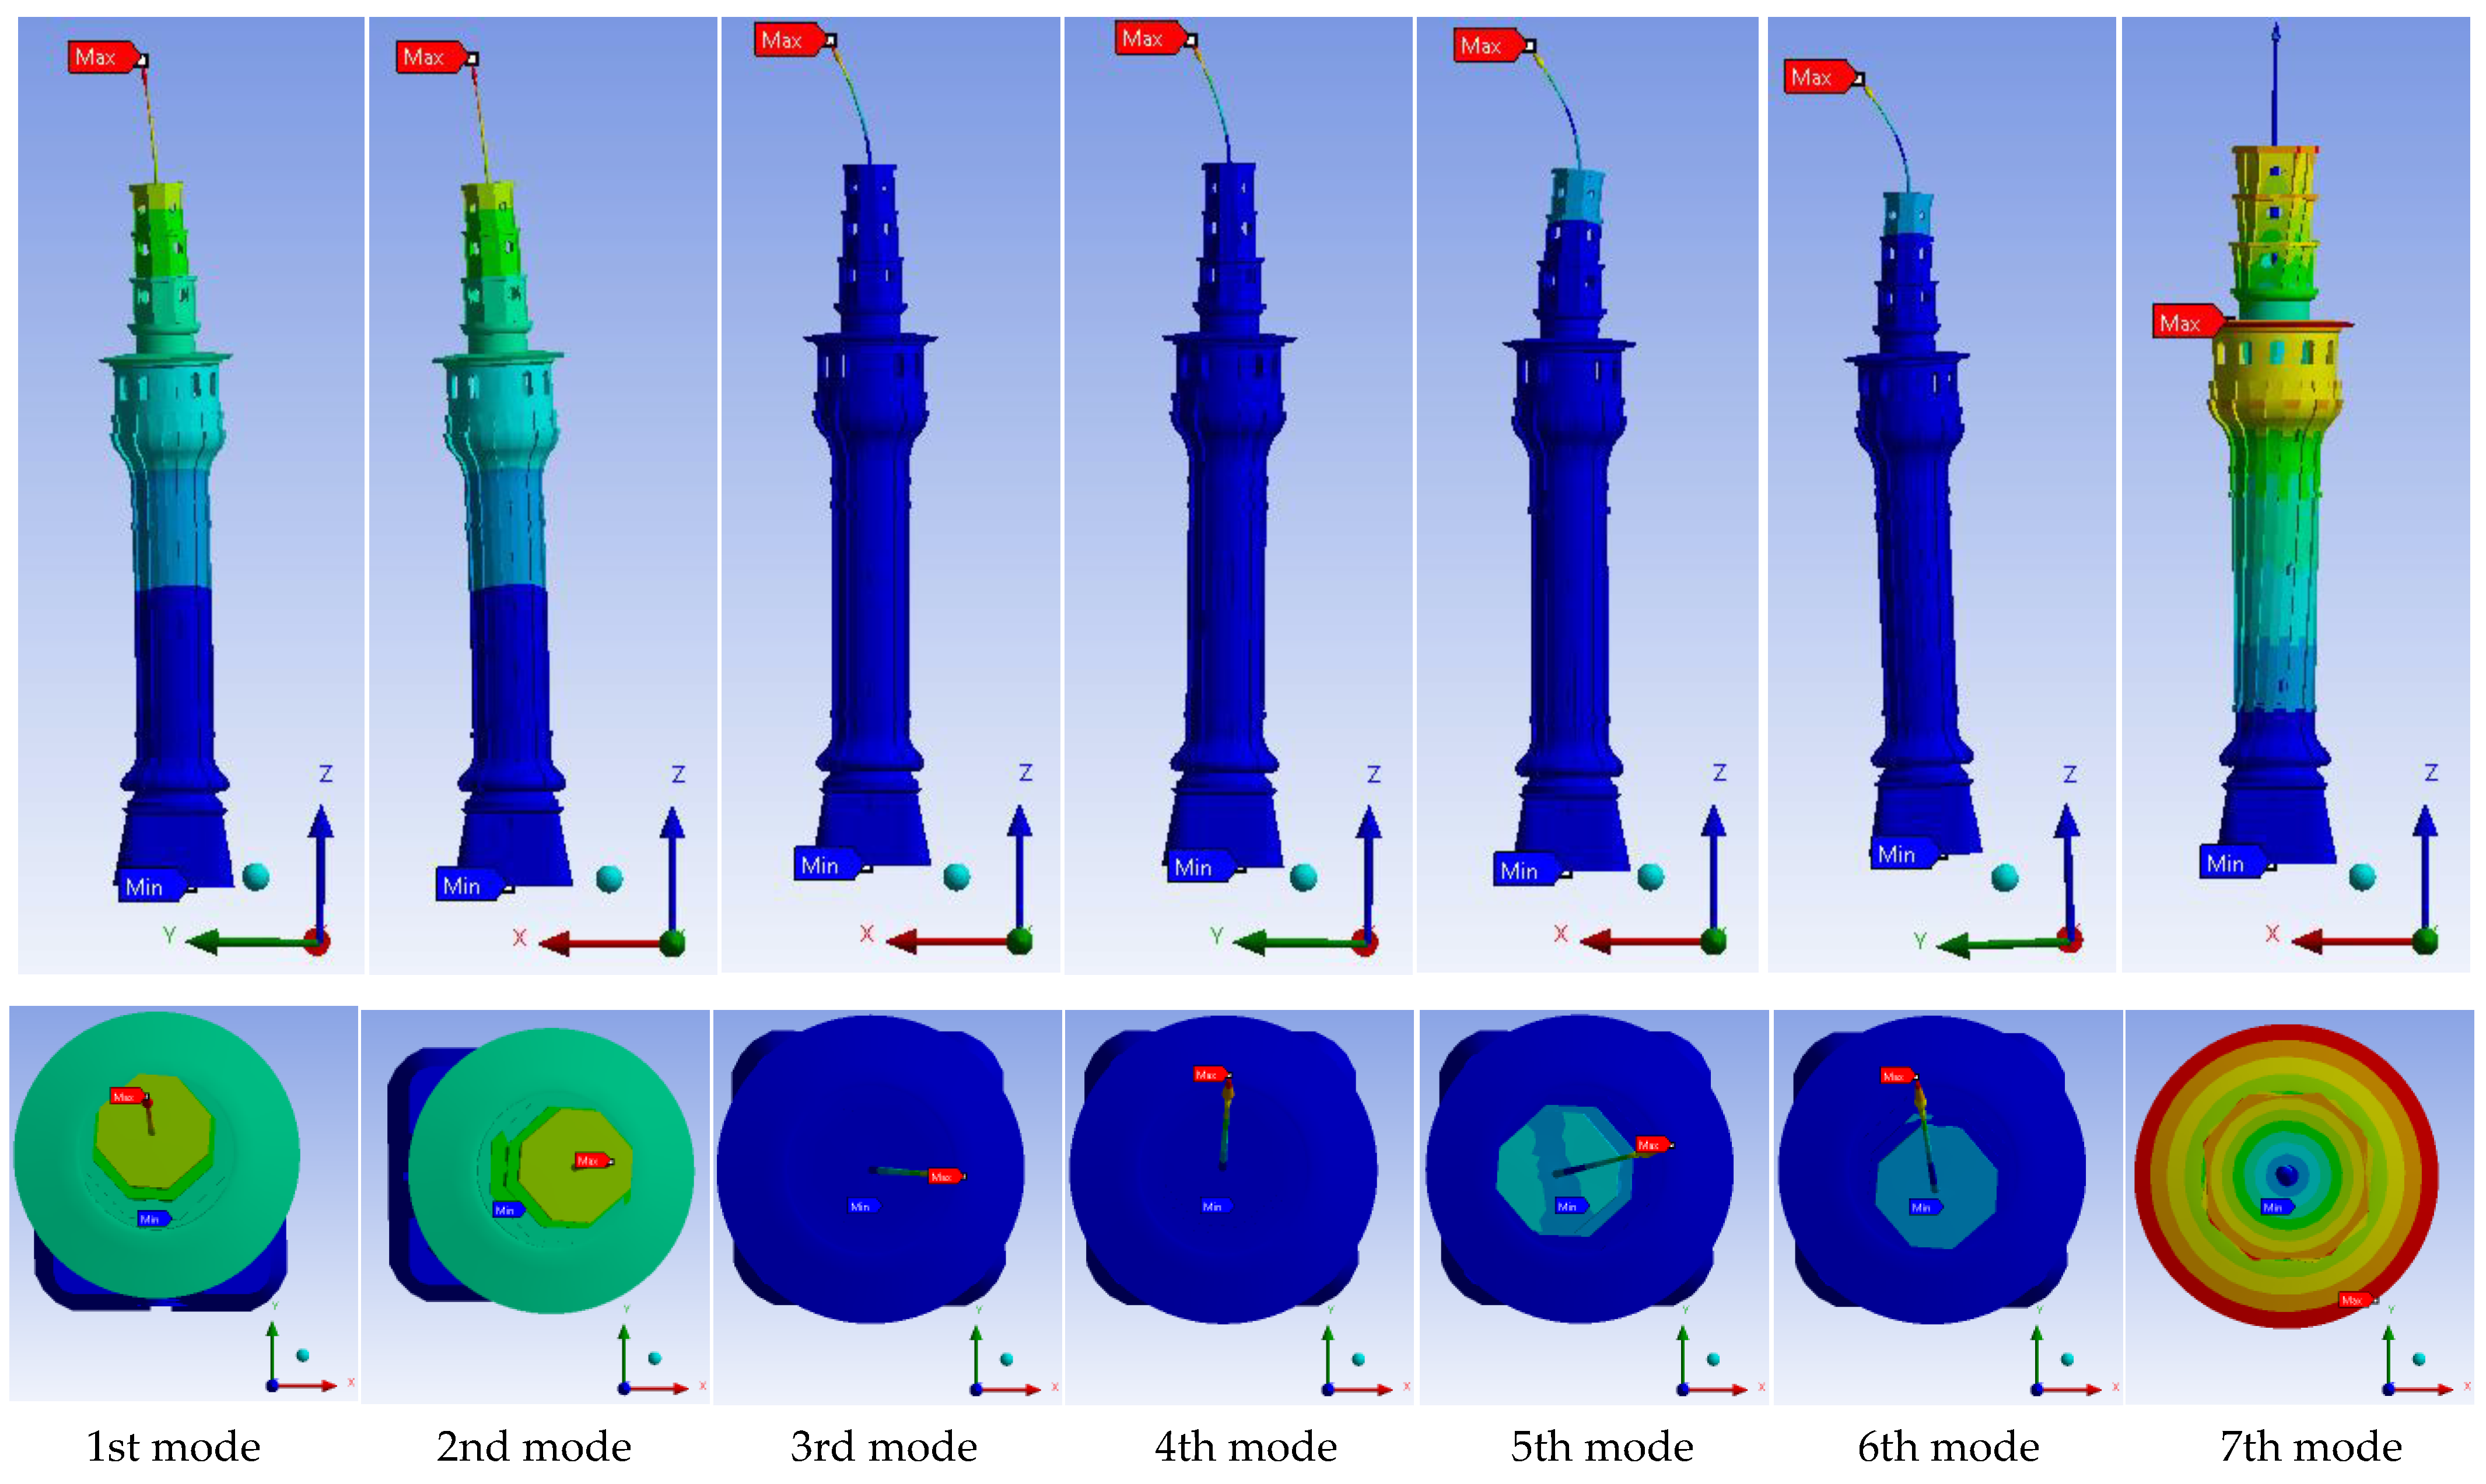
| 1 | Bending (N–S) | 0.5761 | 0.5891 |
| 2 | Bending (E–W) | 0.5767 | 0.5896 |
| 3 | Bending (E–W) | 2.0842 | 2.2890 |
| 4 | Bending (N–S) | 2.0847 | 2.2907 |
| 5 | Bending (E–W) | 2.7997 | 3.0490 |
| 6 | Bending (N–S) | 2.8440 | 3.0568 |
| 7 | Torsional | 3.7354 | 3.5452 |
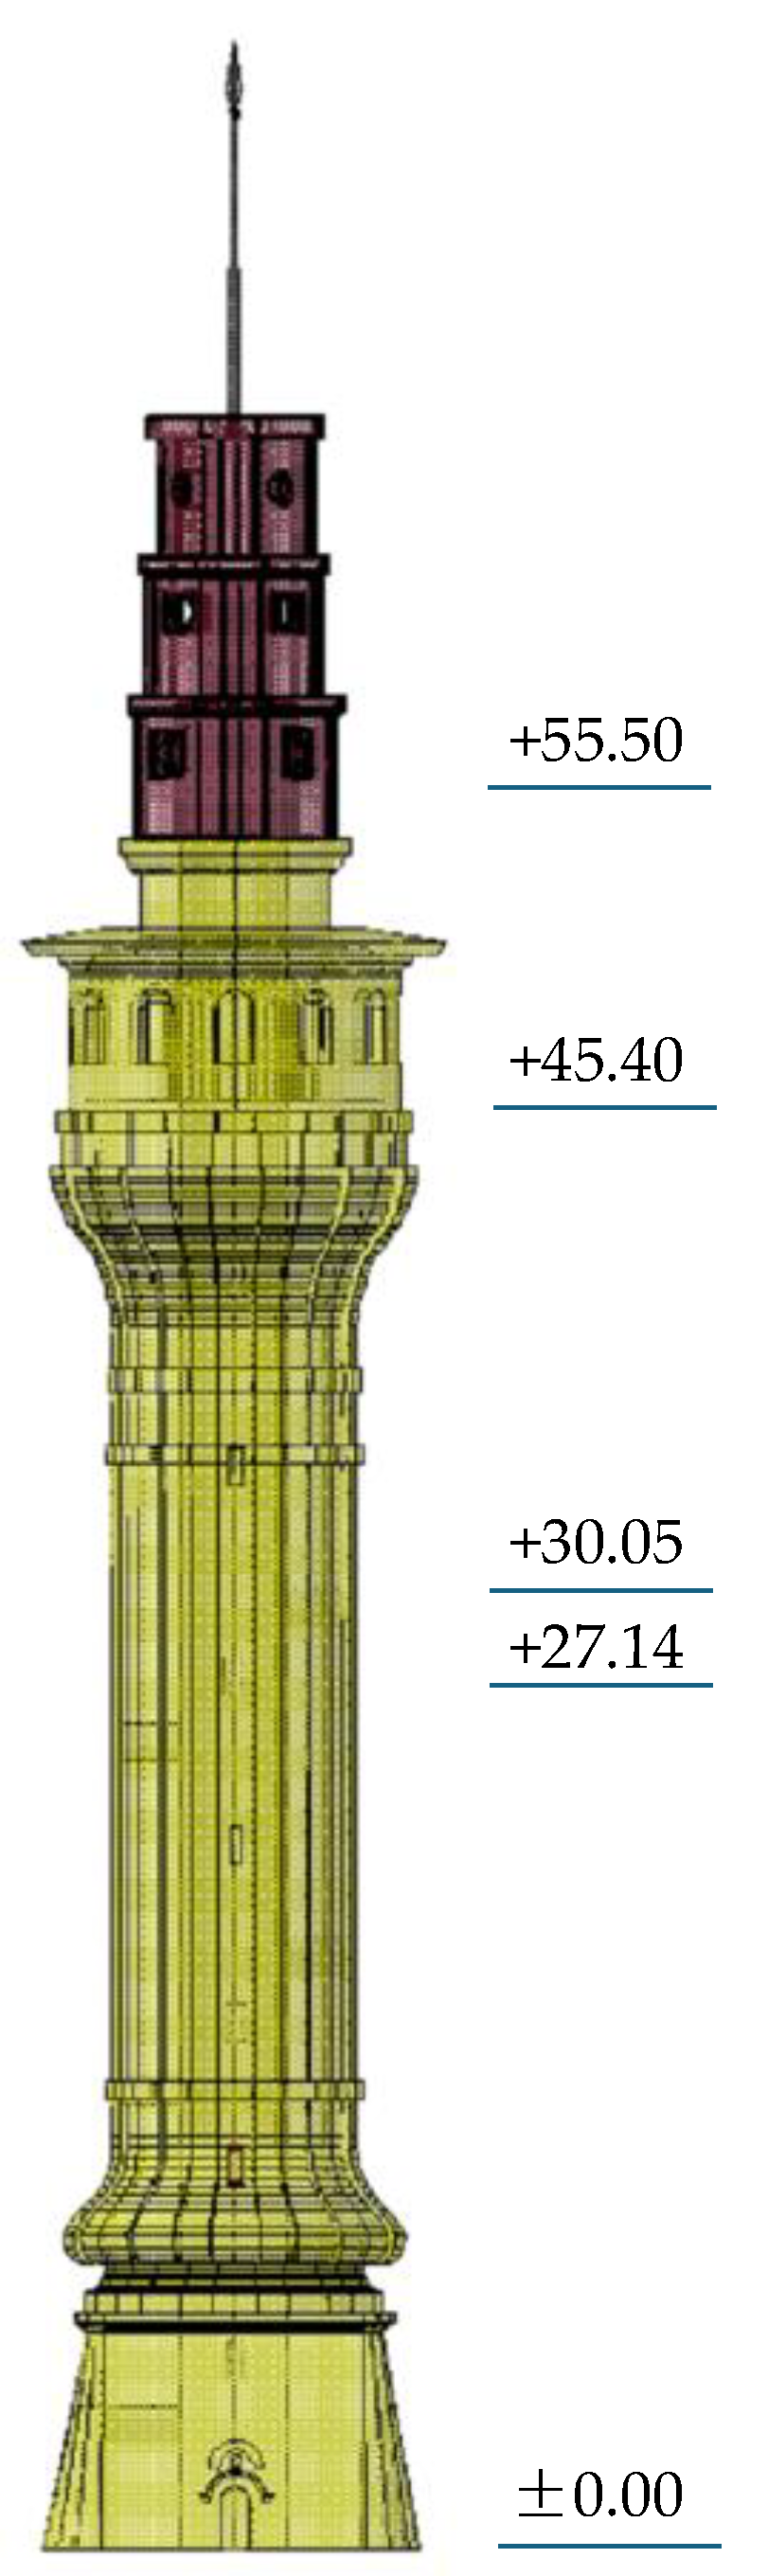
| No. | Elevation [m] | Location | Orientation | No. | Elevation [m] | Location | Orientation |
|---|---|---|---|---|---|---|---|
| 1 | +45.40 | 1 | a | 13 | +45.40 | 3 | a |
| 2 | +45.40 | 1 | a | 14 | +45.40 | 3 | a |
| 3 | +45.40 | 1 | a | 15 | +45.40 | 3 | b |
| 4 | +45.40 | 1 | a | 16 | +45.40 | 3 | b |
| 5 | +45.40 | 1 | a | 17 | +45.40 | 4 | a |
| 6 | +55.50 | 2 | a | 18 | +45.40 | 4 | b |
| 7 | +55.50 | 2 | a | 19 | +30.04 | 5 | a |
| 8 | +55.50 | 2 | a | 20 | +30.04 | 5 | a |
| 9 | +55.50 | 2 | b | 21 | +30.04 | 5 | b |
| 10 | +55.50 | 2 | b | 22 | +27.14 | 6 | a |
| 11 | +45.40 | 3 | a | 23 | +27.14 | 6 | a |
| 12 | +45.40 | 3 | a | 24 | +27.14 | 6 | b |
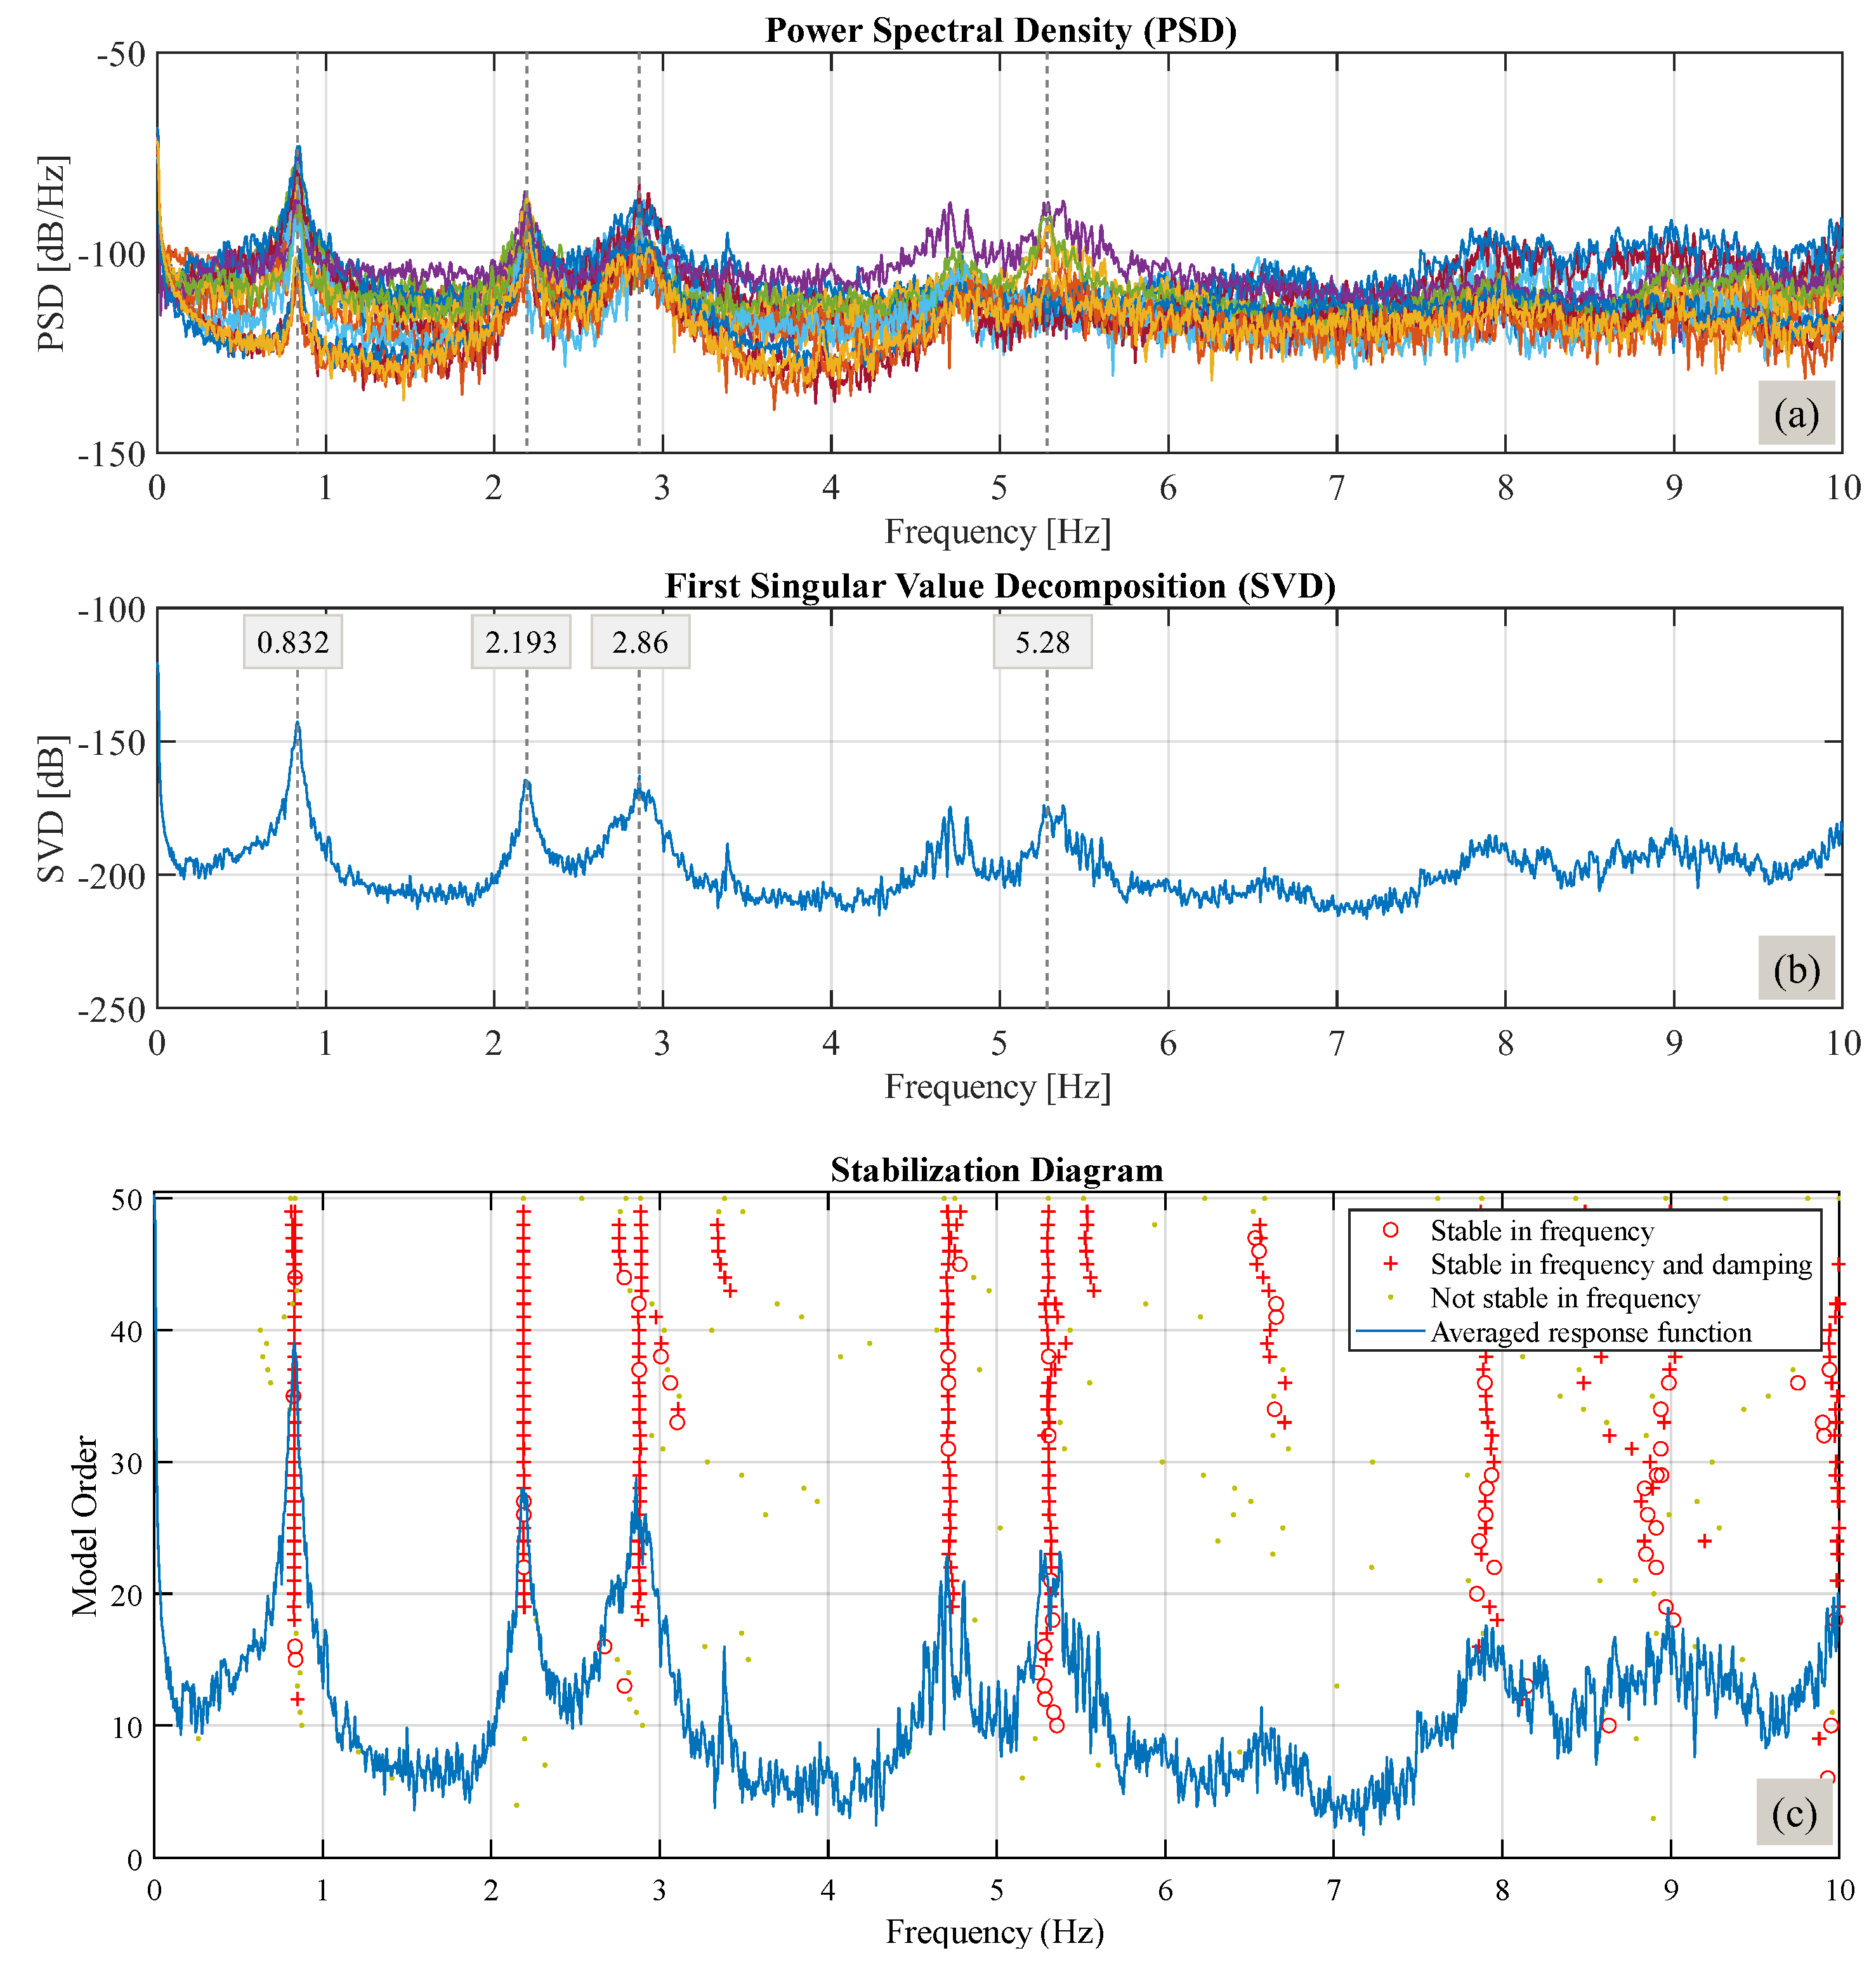
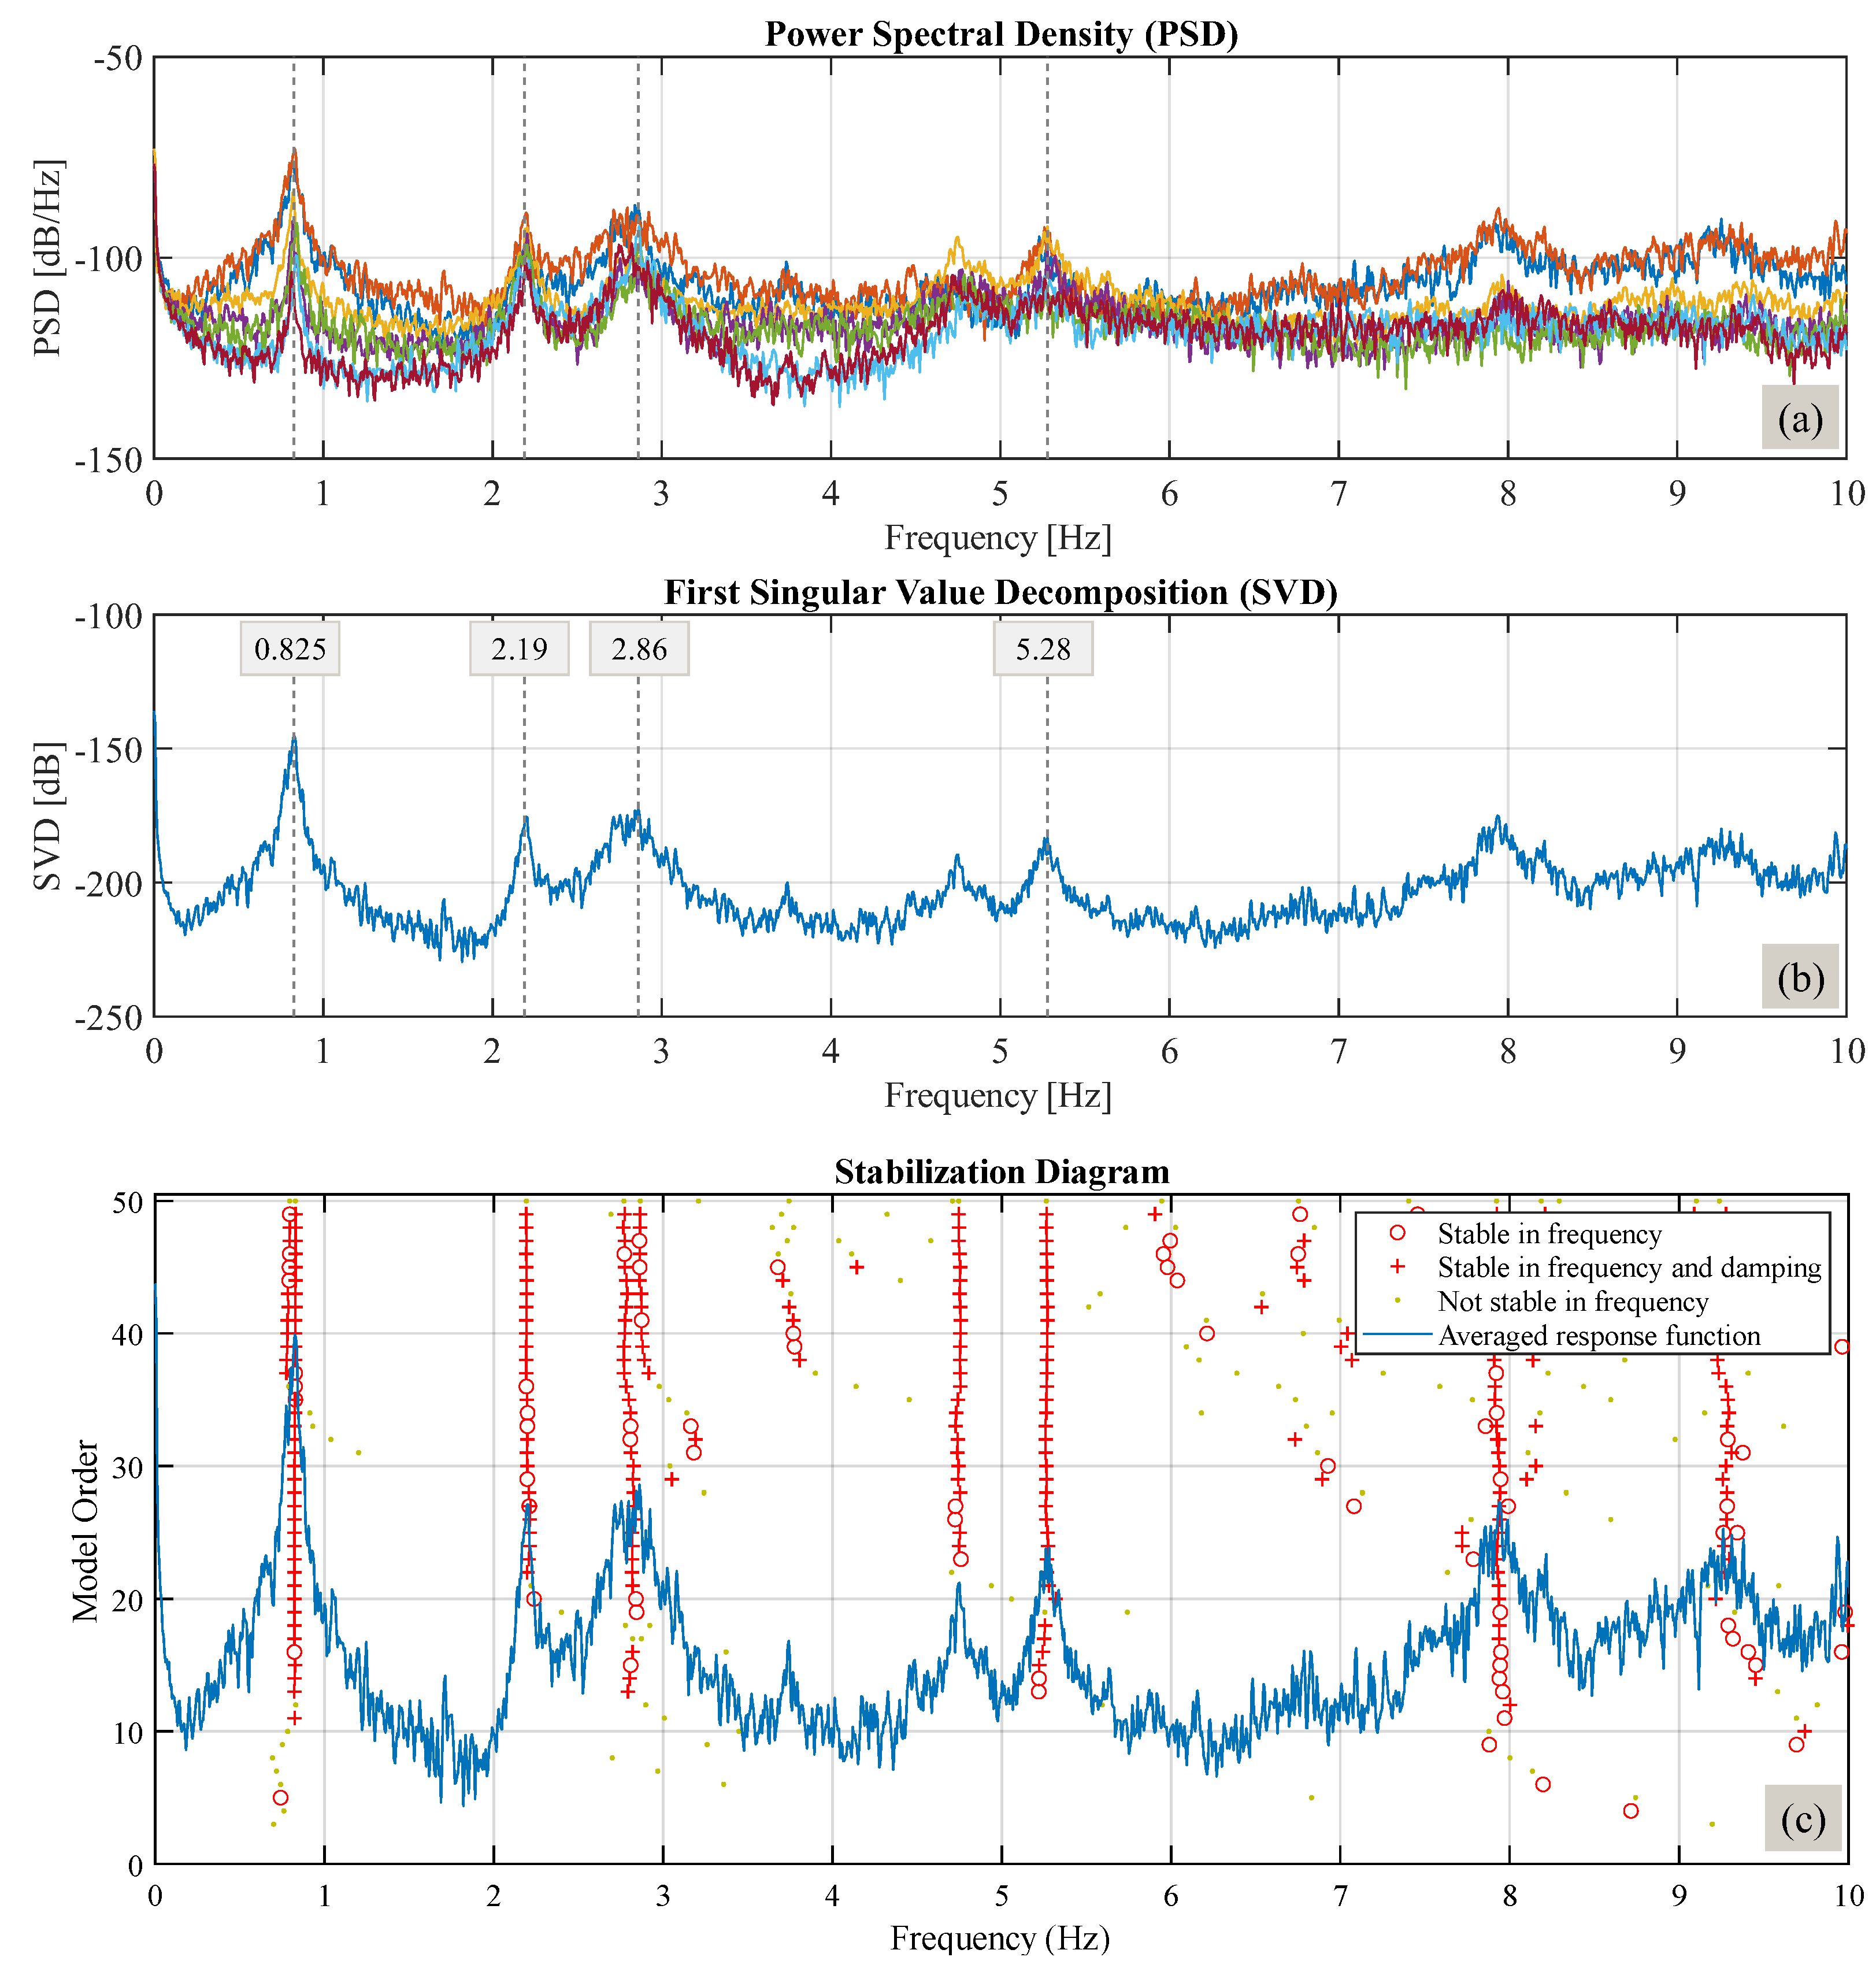
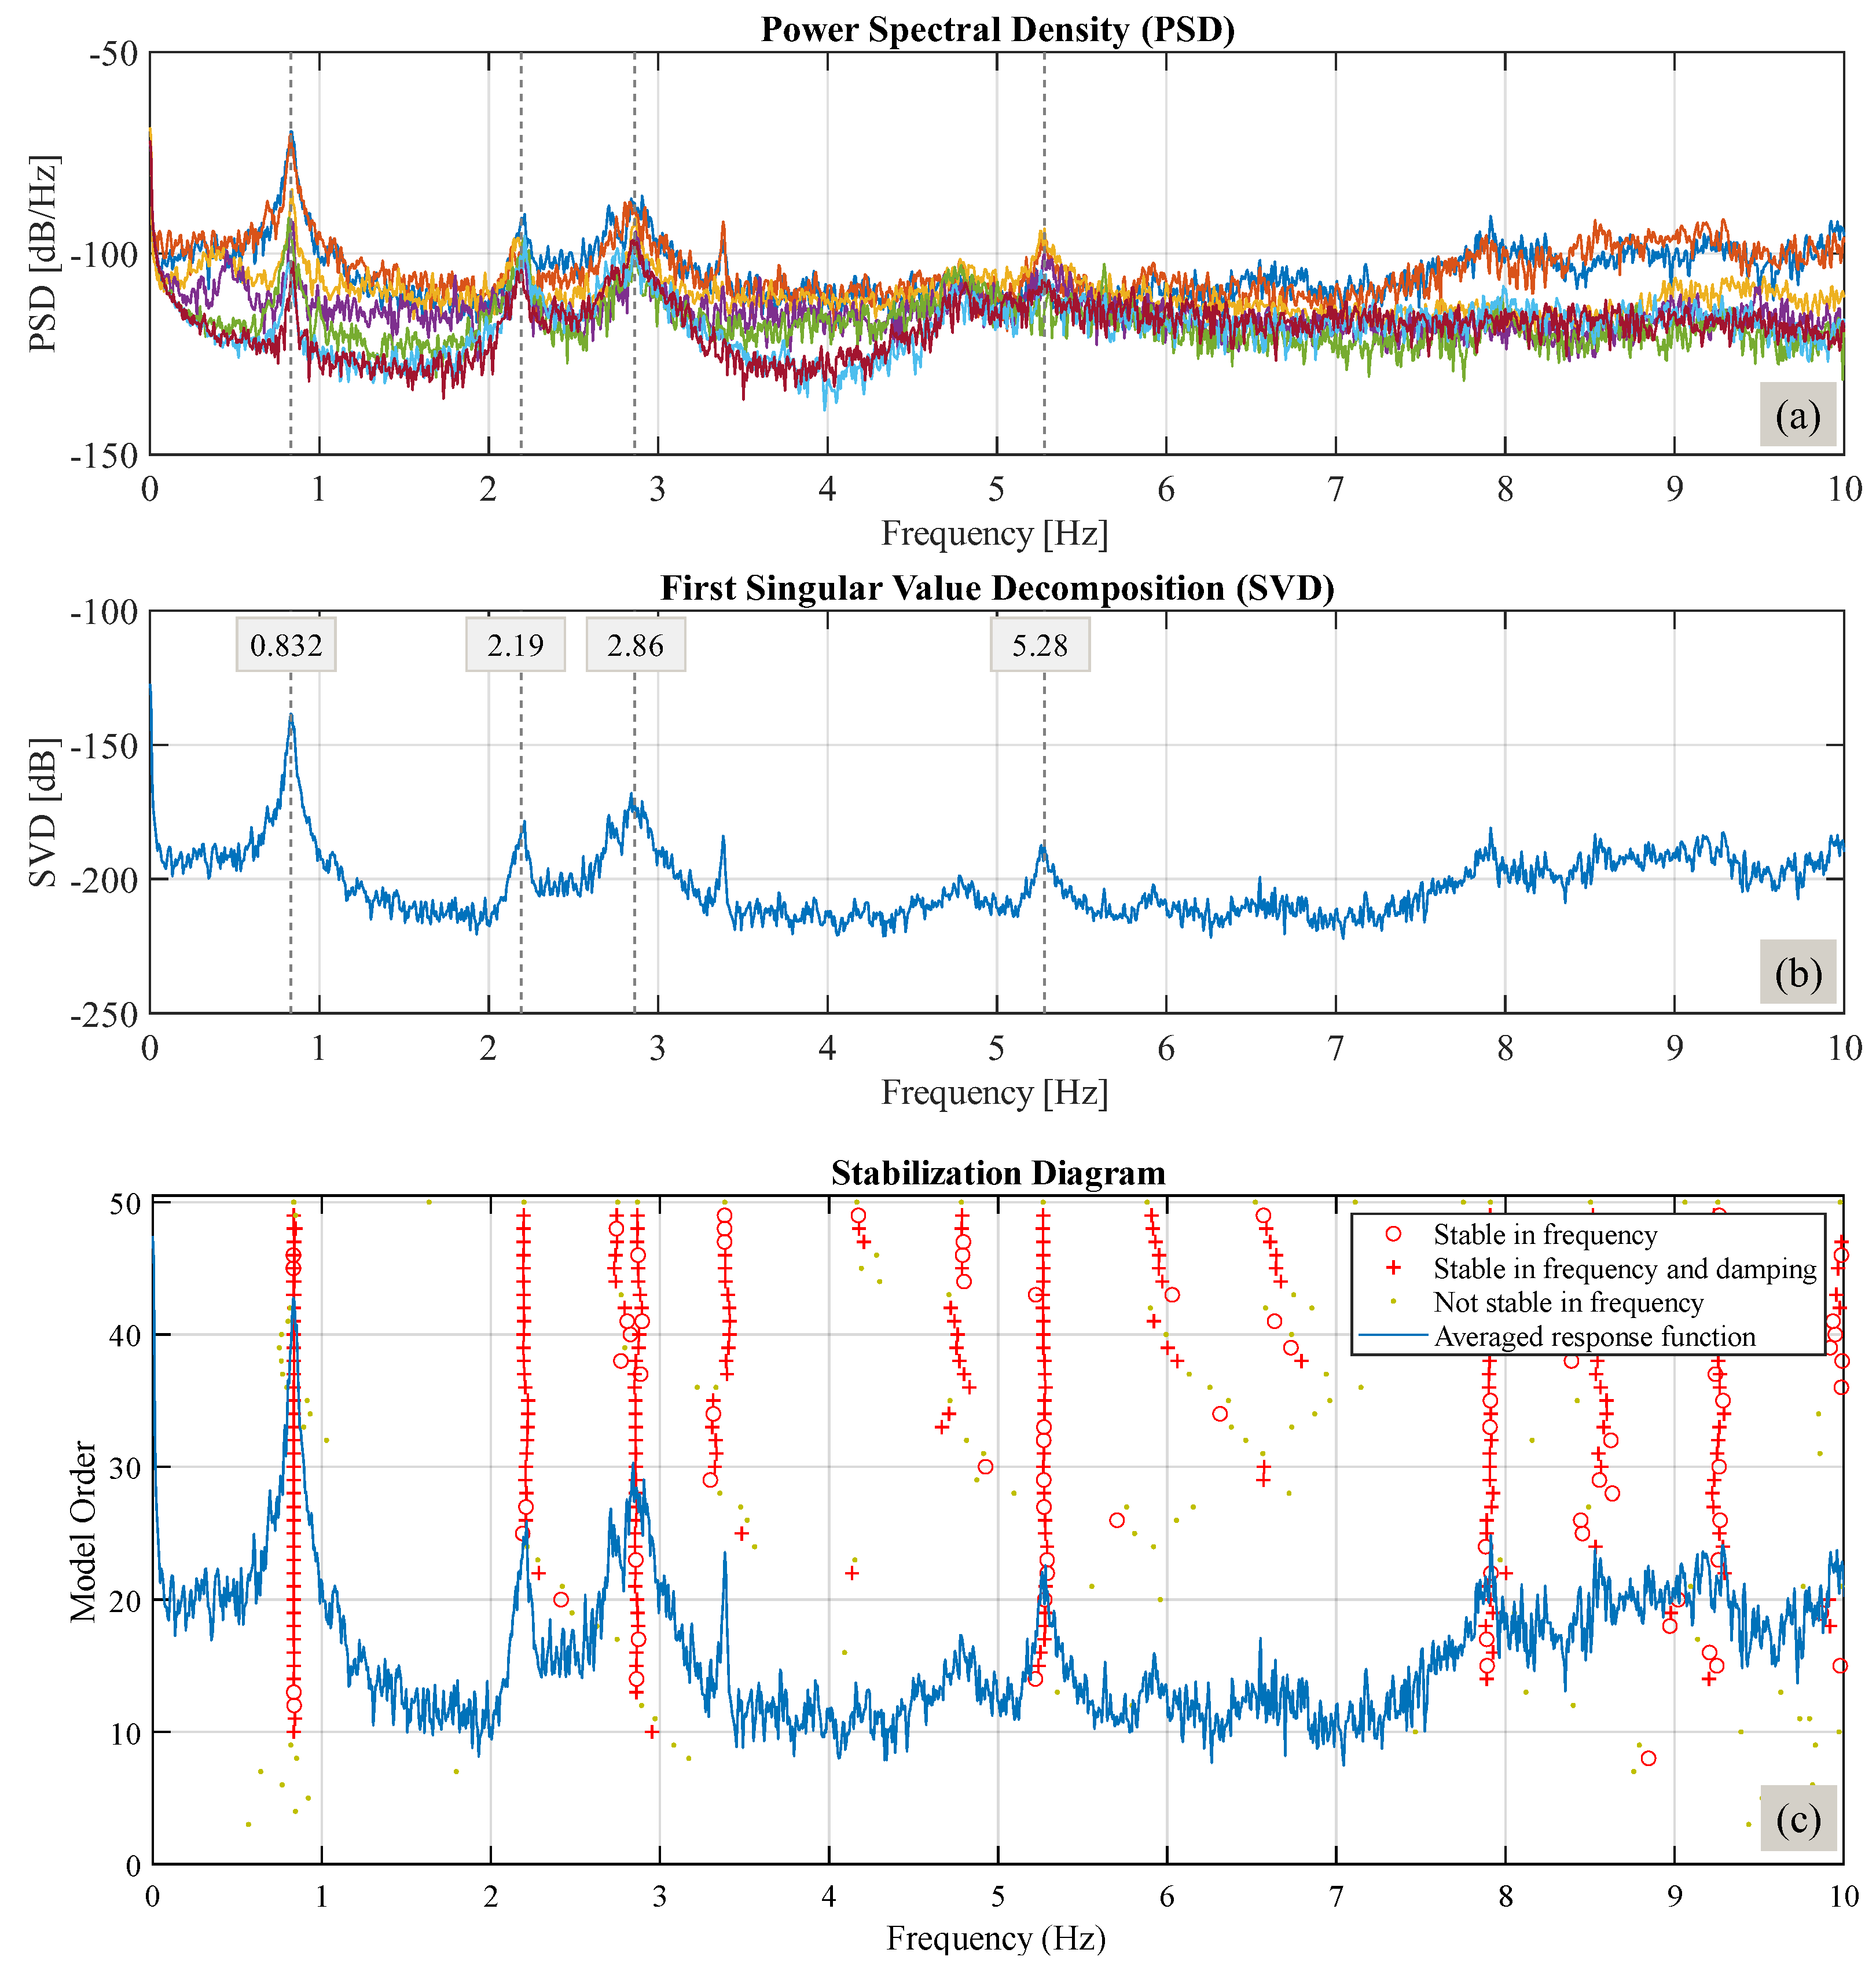
| Mode | Experimental | Shell Model | Solid Model | ||
|---|---|---|---|---|---|
| Frequency [Hz] | Frequency [Hz] | Difference [%] | Frequency [Hz] | Difference [%] | |
| 1 | 0.823 | 0.576 | 30.60 | 0.589 | 29.04 |
| 2 | 0.832 | 0.576 | 30.60 | 0.589 | 29.04 |
| 3 | 2.150 | 2.084 | 3.07 | 2.289 | −6.47 |
| 4 | 2.193 | 2.084 | 3.07 | 2.290 | −6.51 |
| 5 | 2.860 | 2.803 | 1.99 | 3.049 | −6.61 |
| 6 | 2.860 | 2.848 | 0.42 | 3.056 | −6.85 |
| 7 | 5.280 | 3.738 | 29.20 | 3.545 | 32.86 |
| Mode | Experimental | 1st Iteration | 2nd Iteration | 3rd Iteration | |||
|---|---|---|---|---|---|---|---|
| Frequency [Hz] | Frequency [Hz] | Difference [%] | Frequency [Hz] | Difference [%] | Frequency [Hz] | Difference [%] | |
| 1 | 0.823 | 0.828 | −0.61 | 0.824 | −0.12 | 0.823 | 0.00 |
| 2 | 0.832 | 0.829 | 0.36 | 0.825 | 0.84 | 0.824 | 0.96 |
| 3 | 2.150 | 2.226 | −3.53 | 1.972 | 8.28 | 2.061 | 4.14 |
| 4 | 2.193 | 2.226 | −1.50 | 2.034 | 7.25 | 2.116 | 3.51 |
| 5 | 2.860 | 4.25 | −48.60 | 2.936 | −2.66 | 2.957 | −3.39 |
| 6 | 2.860 | 4.26 | −48.95 | 2.964 | −3.64 | 2.988 | −4.48 |
| 7 | 5.280 | 4.983 | 5.63 | 4.937 | 6.50 | 4.937 | 6.50 |
| Em1 = 9869 MPa | Em1 = 9869 MPa | Em1 = 9869 MPa | |||||
| Efp = 185,270 MPa | Efp = 185,270 MPa | Efp = 201,617 MPa | |||||
| Em2 = 700 MPa | Em2 = 700 MPa | ||||||
| Mode | Experimental | 1st Iteration | 2nd Iteration | ||
|---|---|---|---|---|---|
| Frequency [Hz] | Frequency [Hz] | Difference [%] | Frequency [Hz] | Difference [%] | |
| 1 | 0.823 | 0.828 | −0.61 | 0.823 | 0.00 |
| 2 | 0.832 | 0.829 | 0.36 | 0.824 | 0.96 |
| 3 | 2.150 | 2.188 | −1.77 | 2.144 | 0.28 |
| 4 | 2.193 | 2.188 | 0.23 | 2.145 | 2.19 |
| 5 | 2.860 | 4.021 | −40.59 | 2.657 | 7.10 |
| 6 | 2.860 | 4.087 | −42.90 | 2.676 | 6.43 |
| 7 | 5.280 | 5.374 | −1.78 | 5.31 | −0.57 |
| Em1 = 10,208 MPa | Em1 = 10,208 MPa | ||||
| Efp = 210,000 MPa | Efp = 210,000 MPa | ||||
| Em2 = 700 MPa | |||||
Disclaimer/Publisher’s Note: The statements, opinions and data contained in all publications are solely those of the individual author(s) and contributor(s) and not of MDPI and/or the editor(s). MDPI and/or the editor(s) disclaim responsibility for any injury to people or property resulting from any ideas, methods, instructions or products referred to in the content. |
© 2025 by the authors. Licensee MDPI, Basel, Switzerland. This article is an open access article distributed under the terms and conditions of the Creative Commons Attribution (CC BY) license (https://creativecommons.org/licenses/by/4.0/).
Share and Cite
Şekerci, Ç.; Damcı, E.; Öztorun, N.K. Determination of Dynamic Characteristics of Historic Beyazıt Tower. Buildings 2025, 15, 650. https://doi.org/10.3390/buildings15050650
Şekerci Ç, Damcı E, Öztorun NK. Determination of Dynamic Characteristics of Historic Beyazıt Tower. Buildings. 2025; 15(5):650. https://doi.org/10.3390/buildings15050650
Chicago/Turabian StyleŞekerci, Çağla, Erdem Damcı, and Namık Kemal Öztorun. 2025. "Determination of Dynamic Characteristics of Historic Beyazıt Tower" Buildings 15, no. 5: 650. https://doi.org/10.3390/buildings15050650
APA StyleŞekerci, Ç., Damcı, E., & Öztorun, N. K. (2025). Determination of Dynamic Characteristics of Historic Beyazıt Tower. Buildings, 15(5), 650. https://doi.org/10.3390/buildings15050650