
The Impact of Spatial Dimensions, Location, Luminance, and Gender Differences on Visual Search Efficiency in Three-Dimensional Space

Abstract
1. Introduction
2. Literature Review
2.1. Spatial Fundamental Nature and Broad Applicability
2.2. Key Influencing Factors of Visual Search
2.3. Visual Search Efficiency Evaluation Standards
2.4. Applications of Virtual Reality (VR) Technology
3. Methods
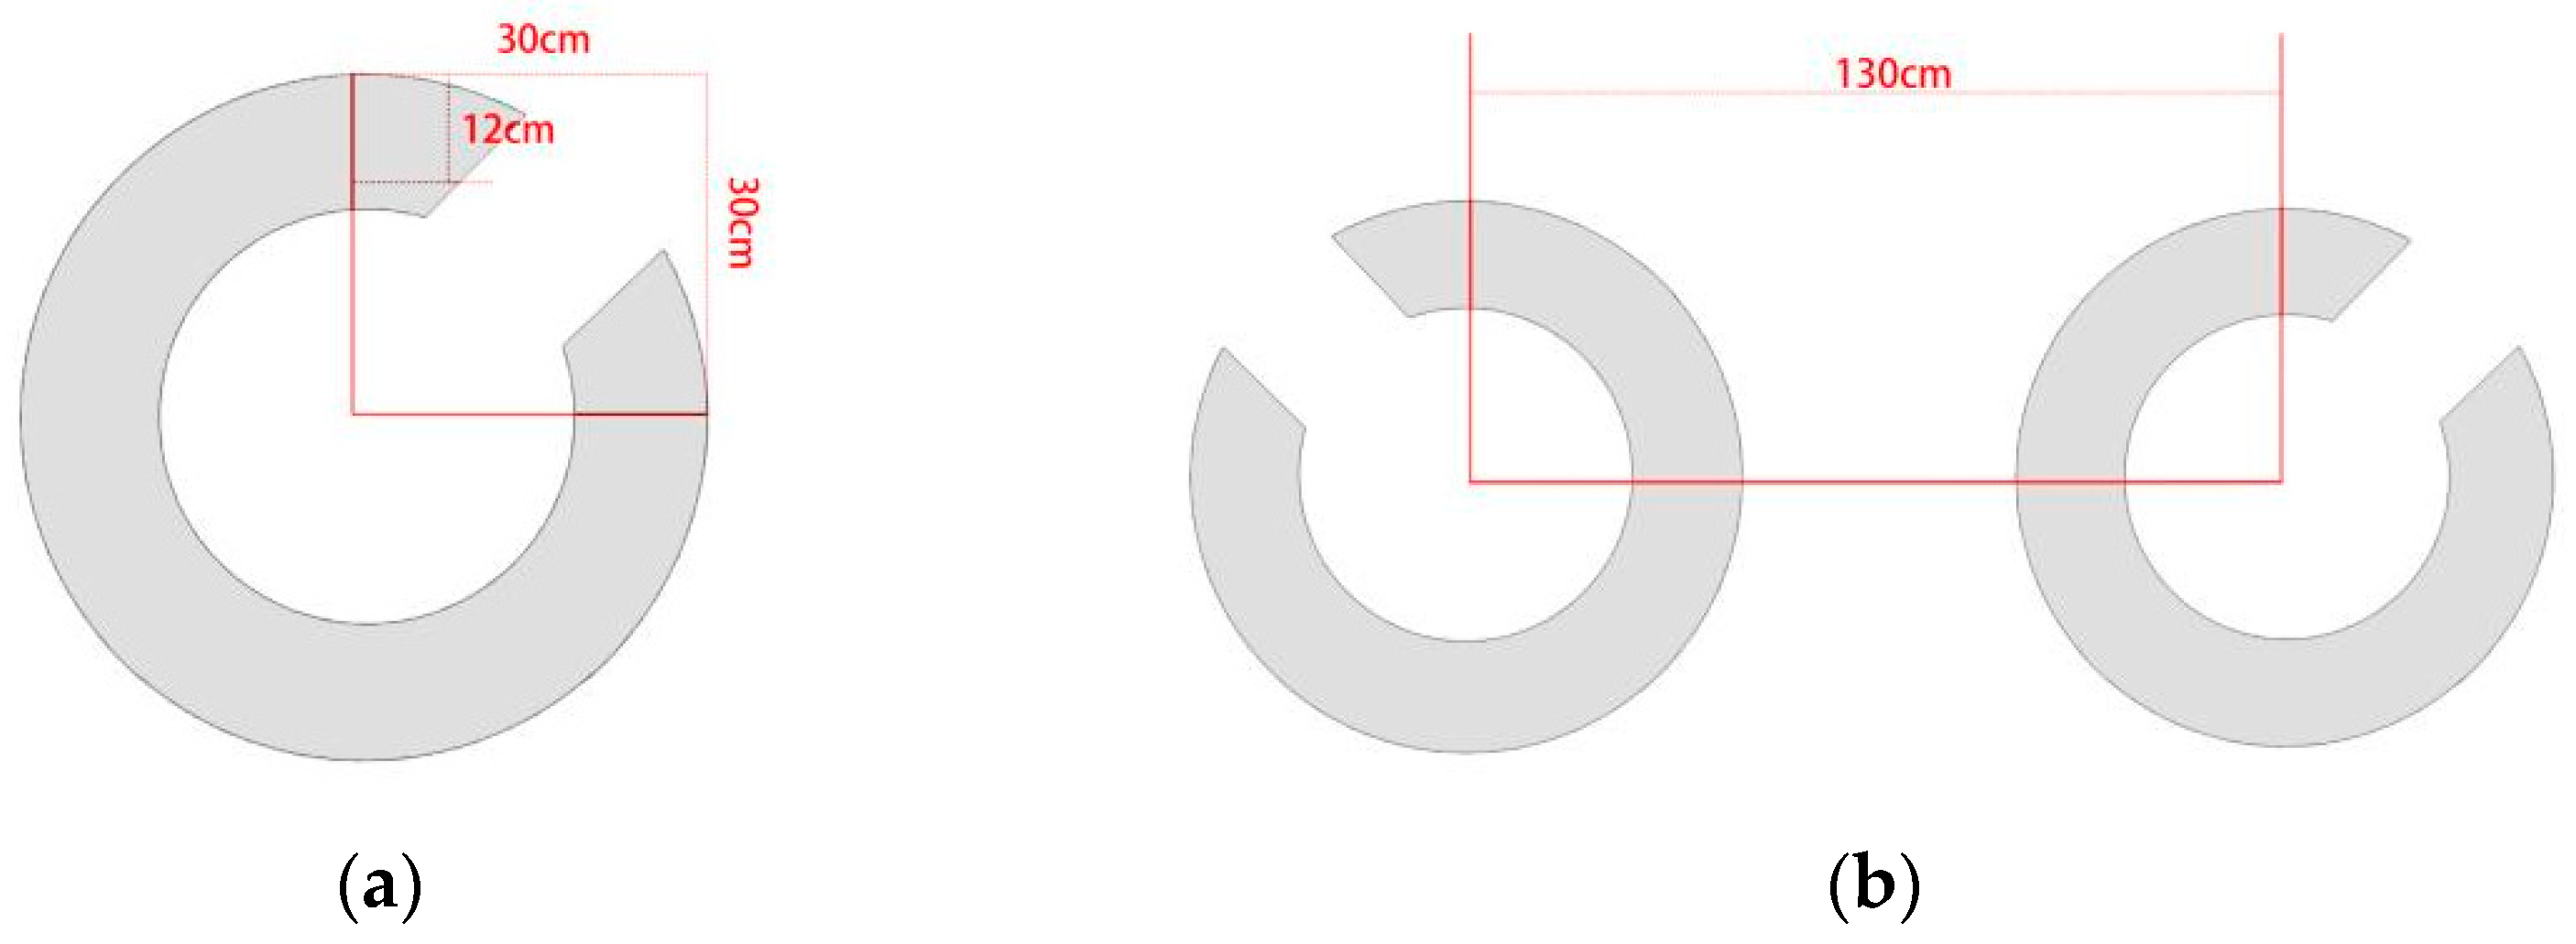
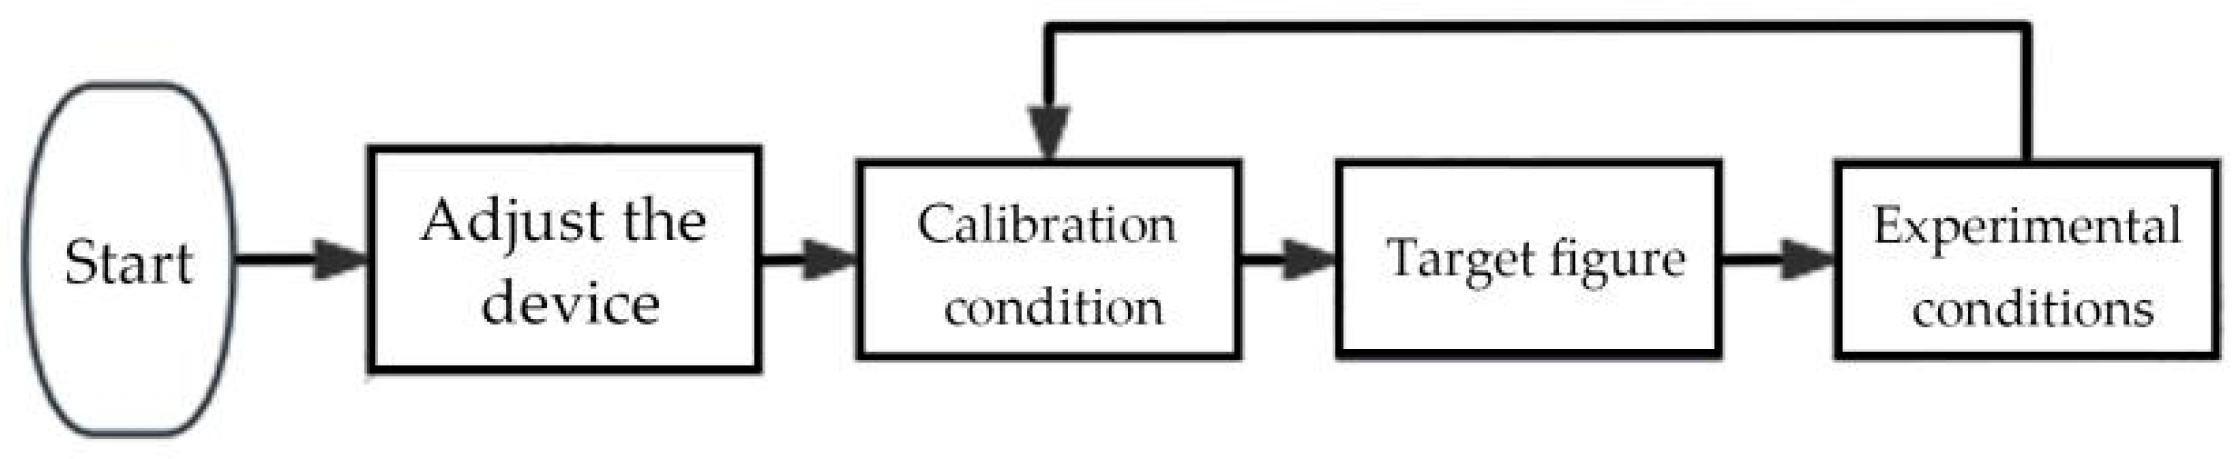
3.1. Preliminary Experiment
- ①
- Design of Materials
- ②
- Experimental Design
- ③
- Results
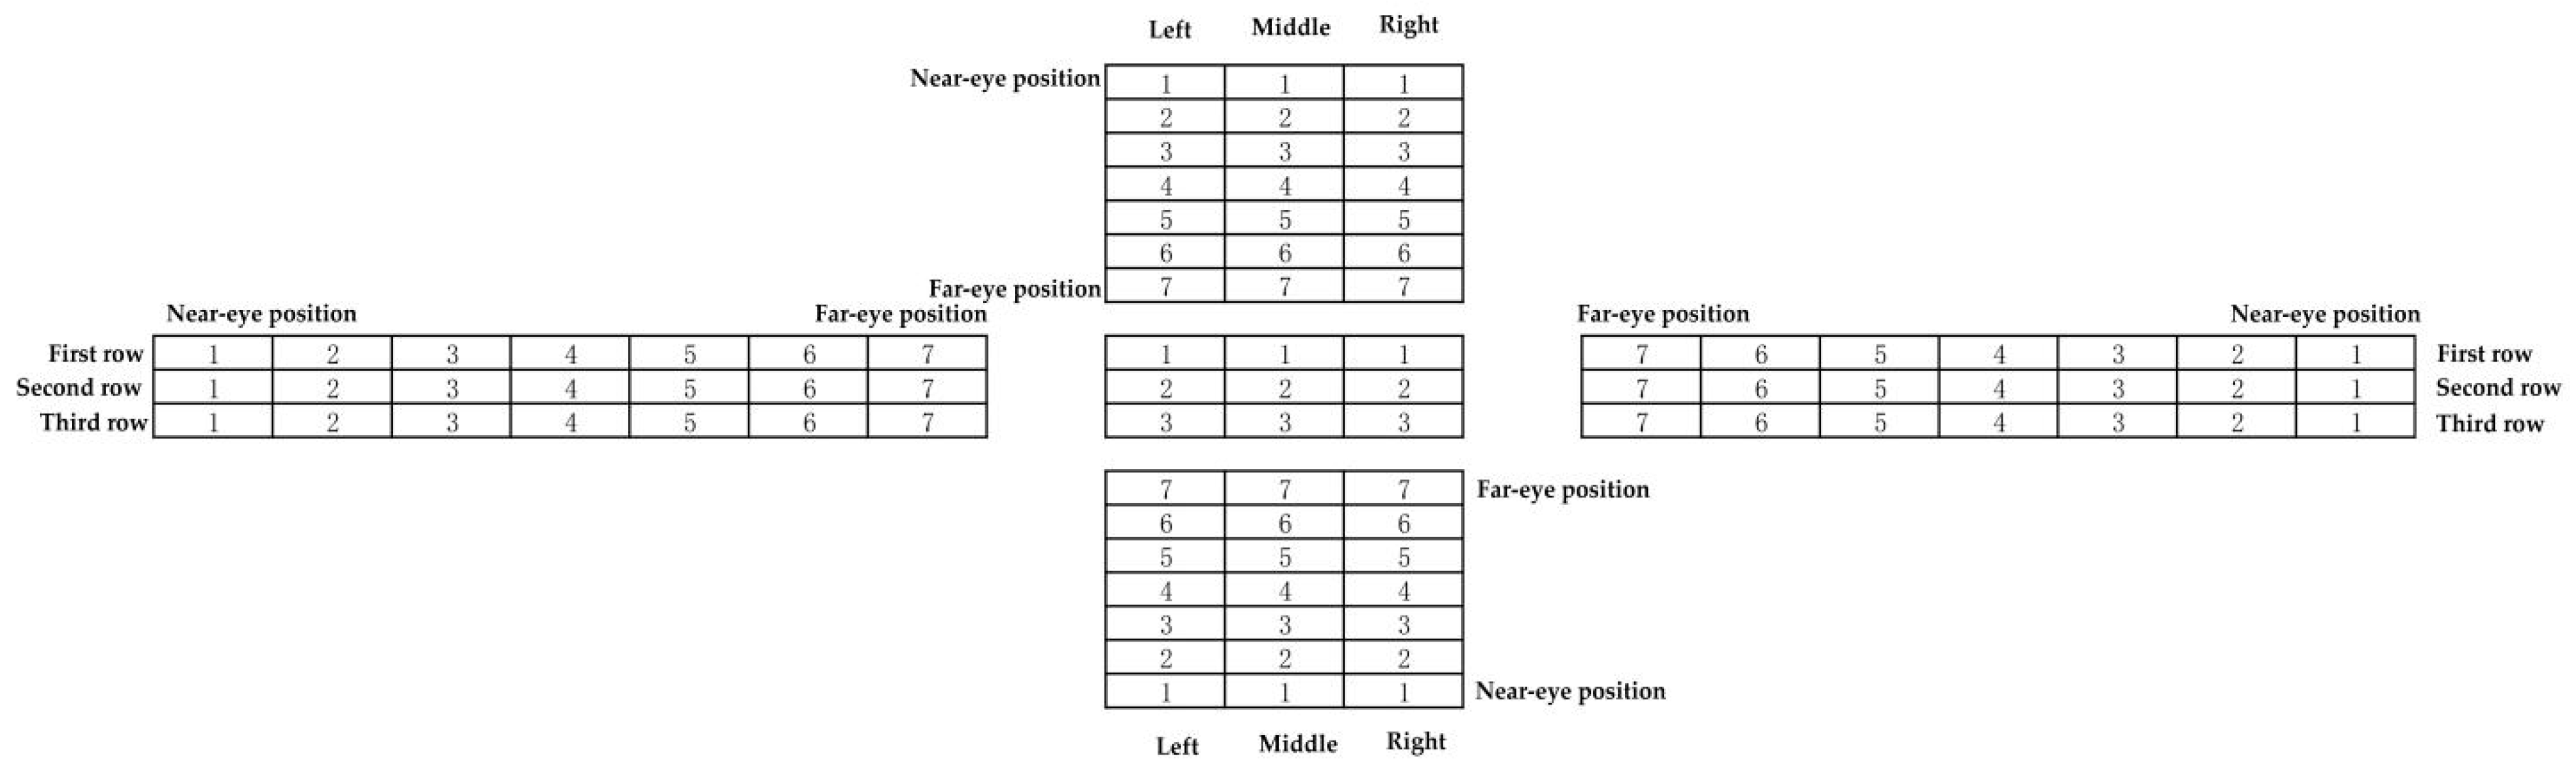
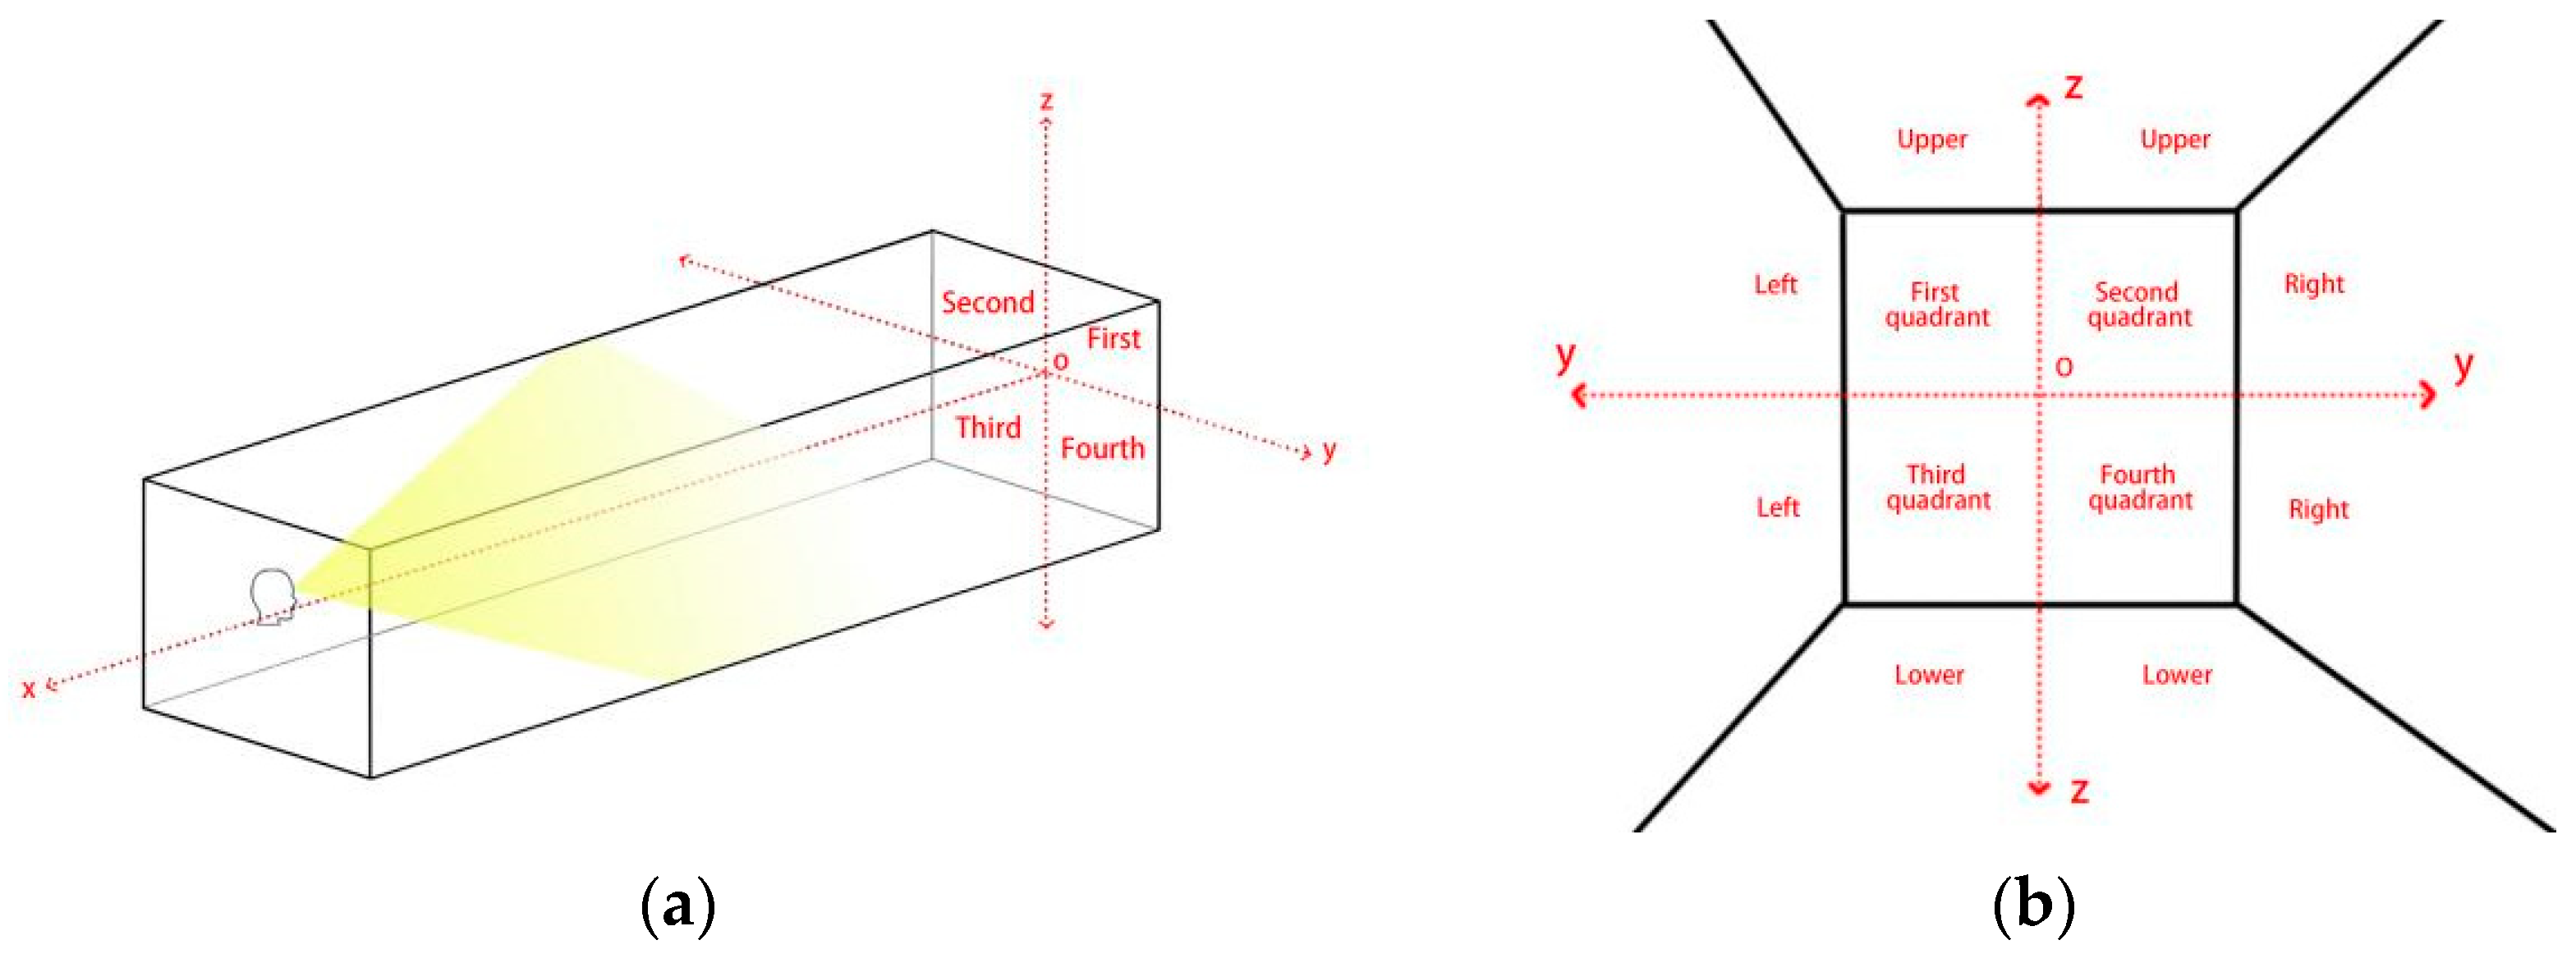
3.2. Main Experiment A: The Impact of Spatial Dimensions and Position on Visual Search Efficiency
- ①
- Design of Materials
- ②
- Experimental Design
3.3. Main Experiment B: The Impact of Luminance Contrast on Visual Search Efficiency
- ①
- Design of Materials
- ②
- Experimental Design
4. Results
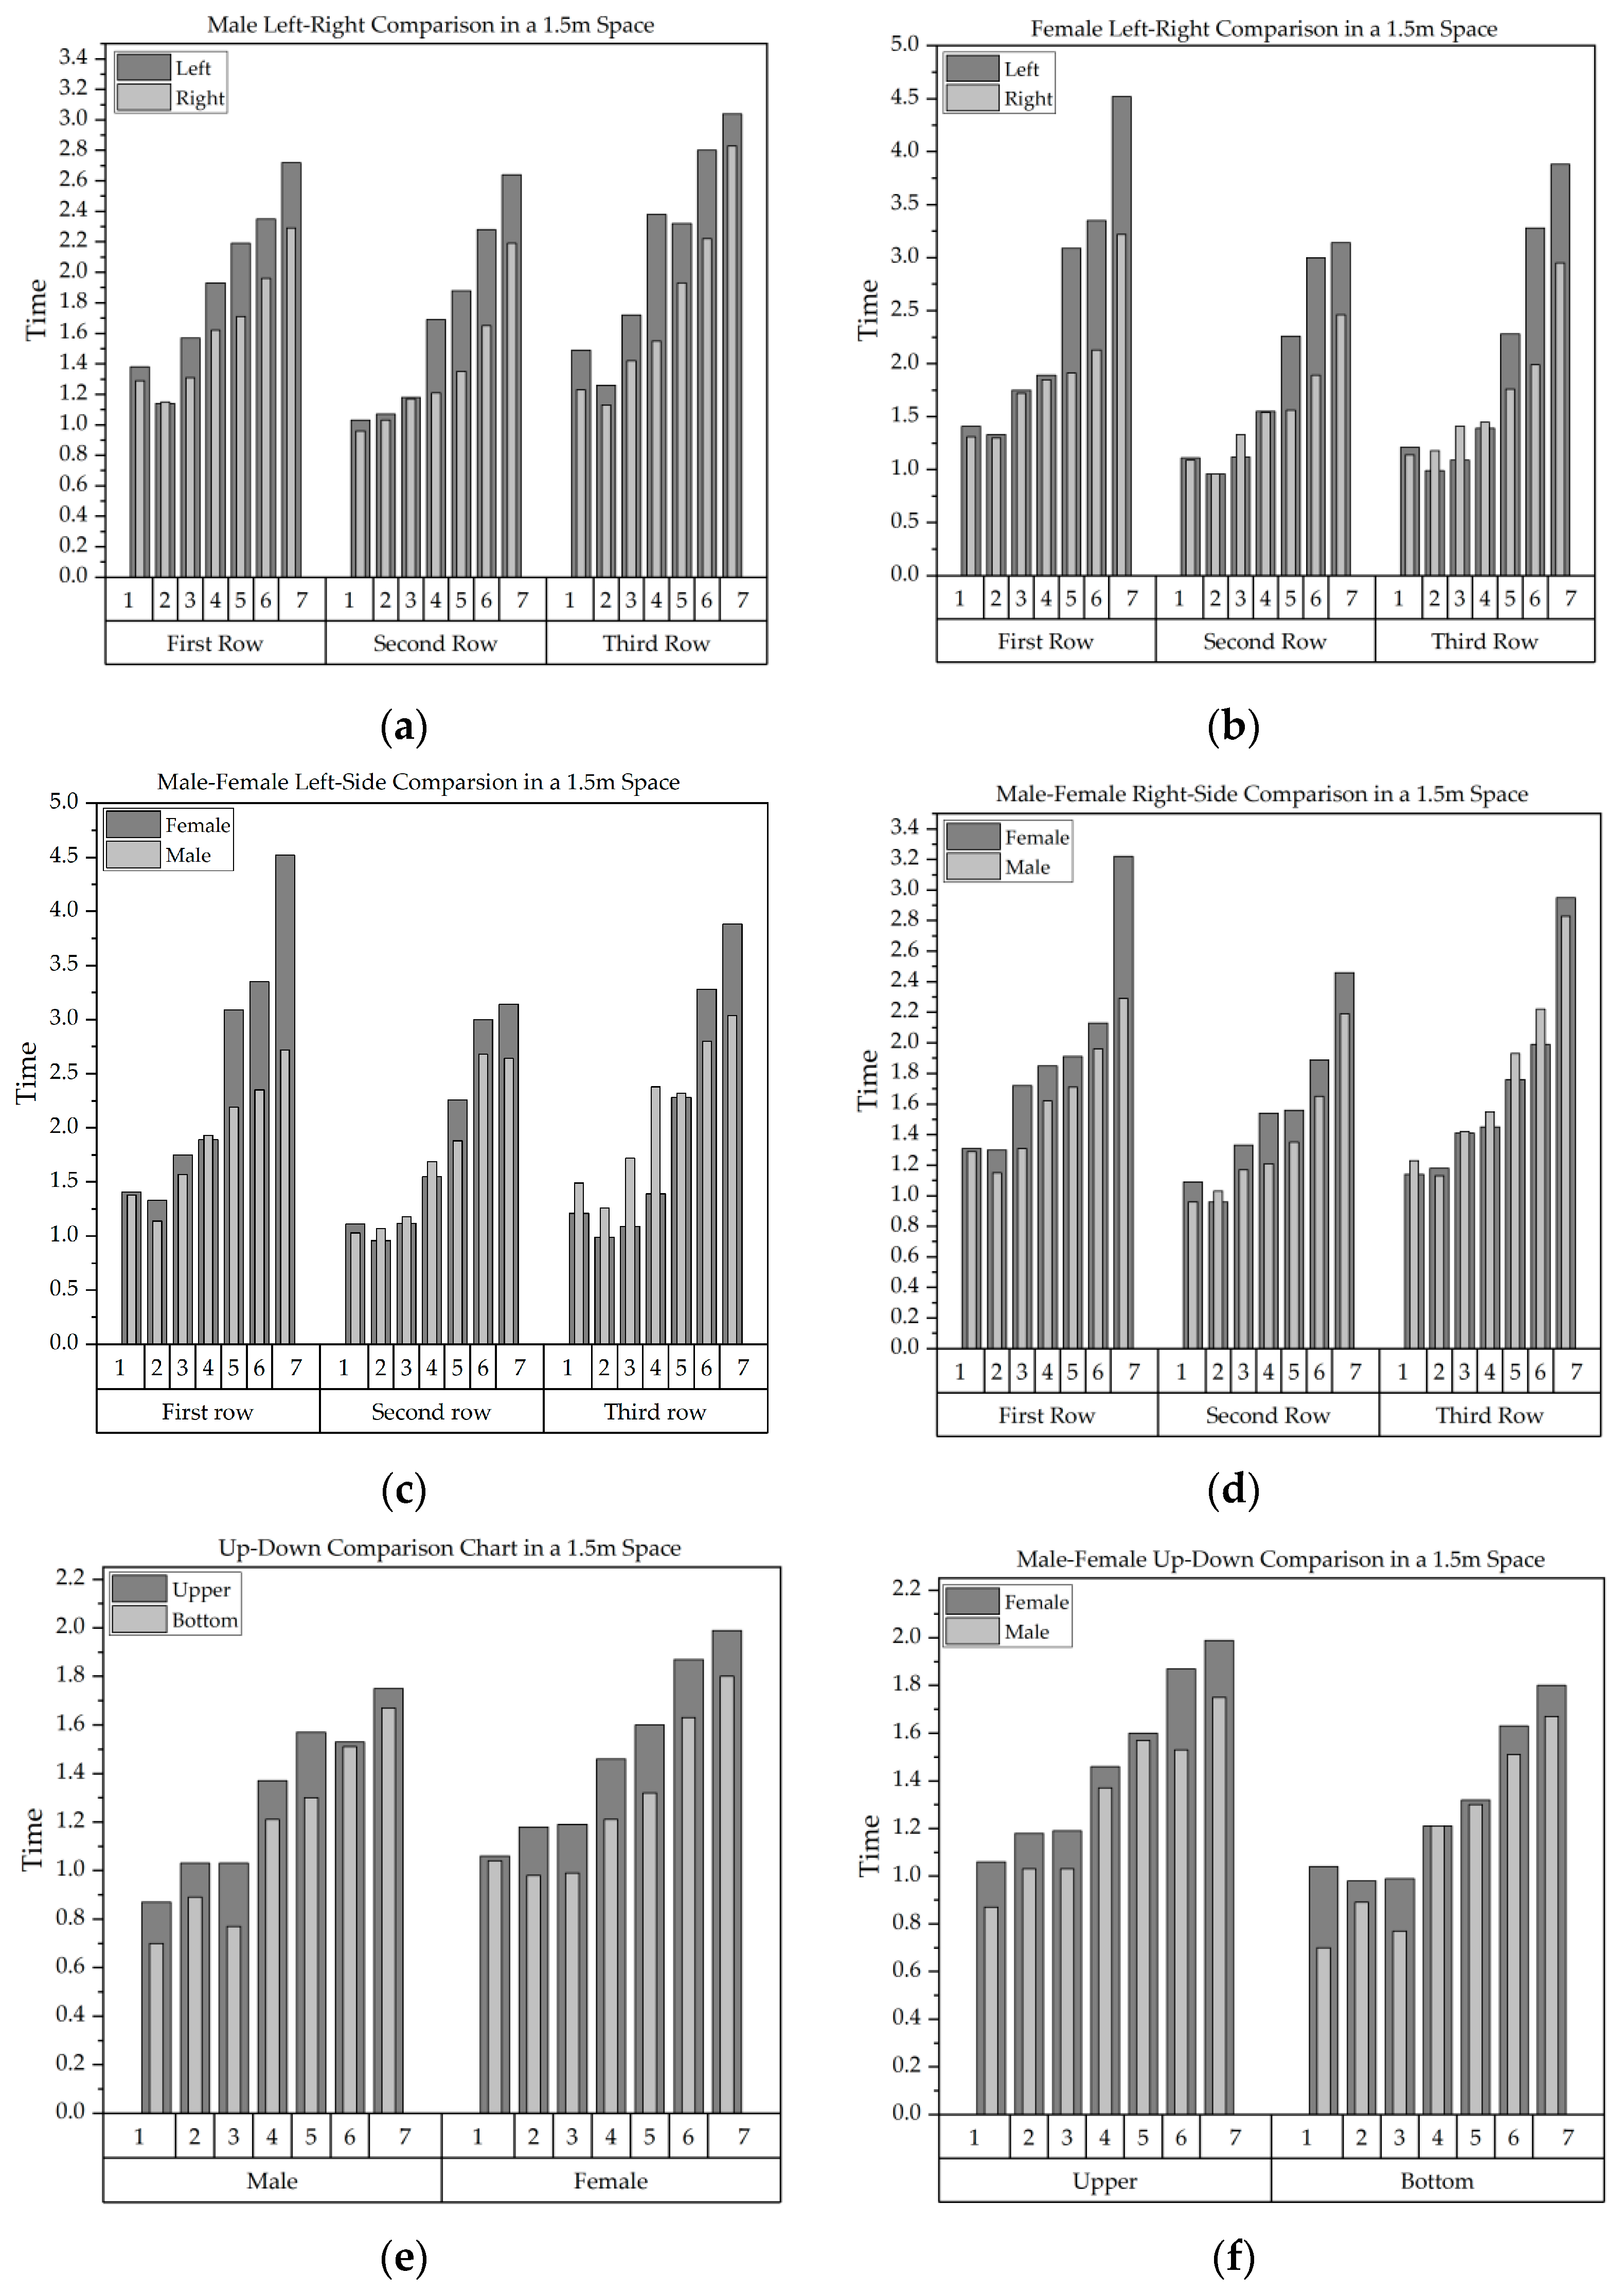
4.1. Experiment A: The Impact of Spatial Dimensions and Position on Visual Search Efficiency
- ①
- Experimental Results
- ②
- Data Analysis
4.2. Experiment B: The Impact of Luminance Contrast on Visual Search Efficiency
- ①
- Experimental Results
- ②
- Data Analysis
5. Discussion
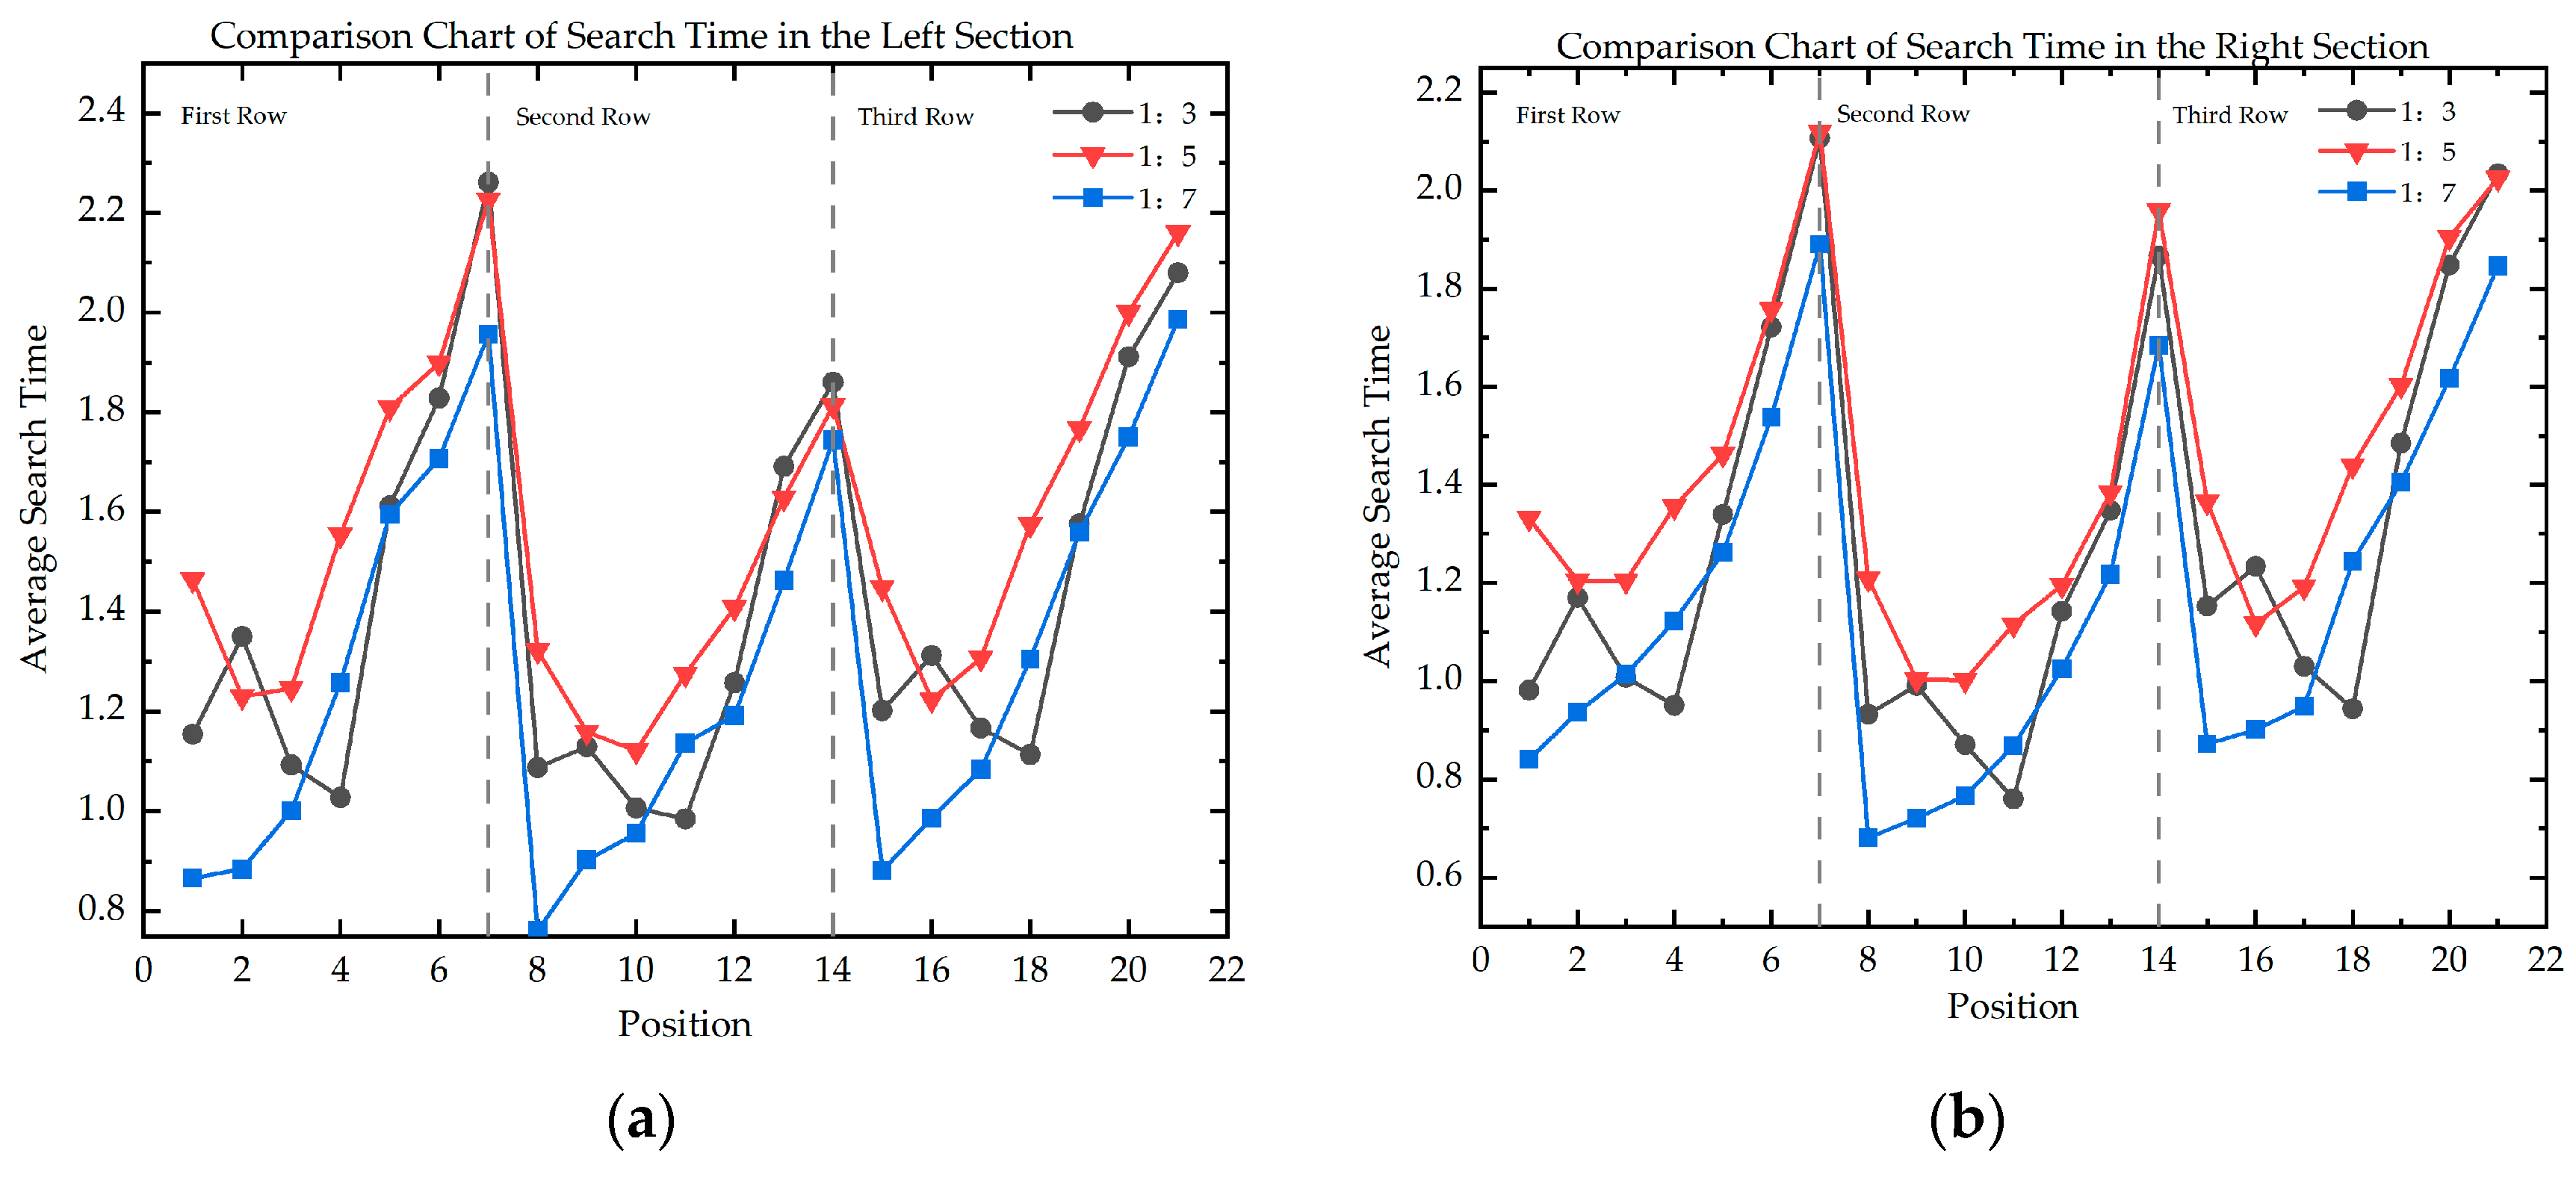
5.1. The Influence of Spatial Dimensions and Position on Visual SEARCH Efficiency
5.2. The Impact of Luminance on Visual Search Efficiency
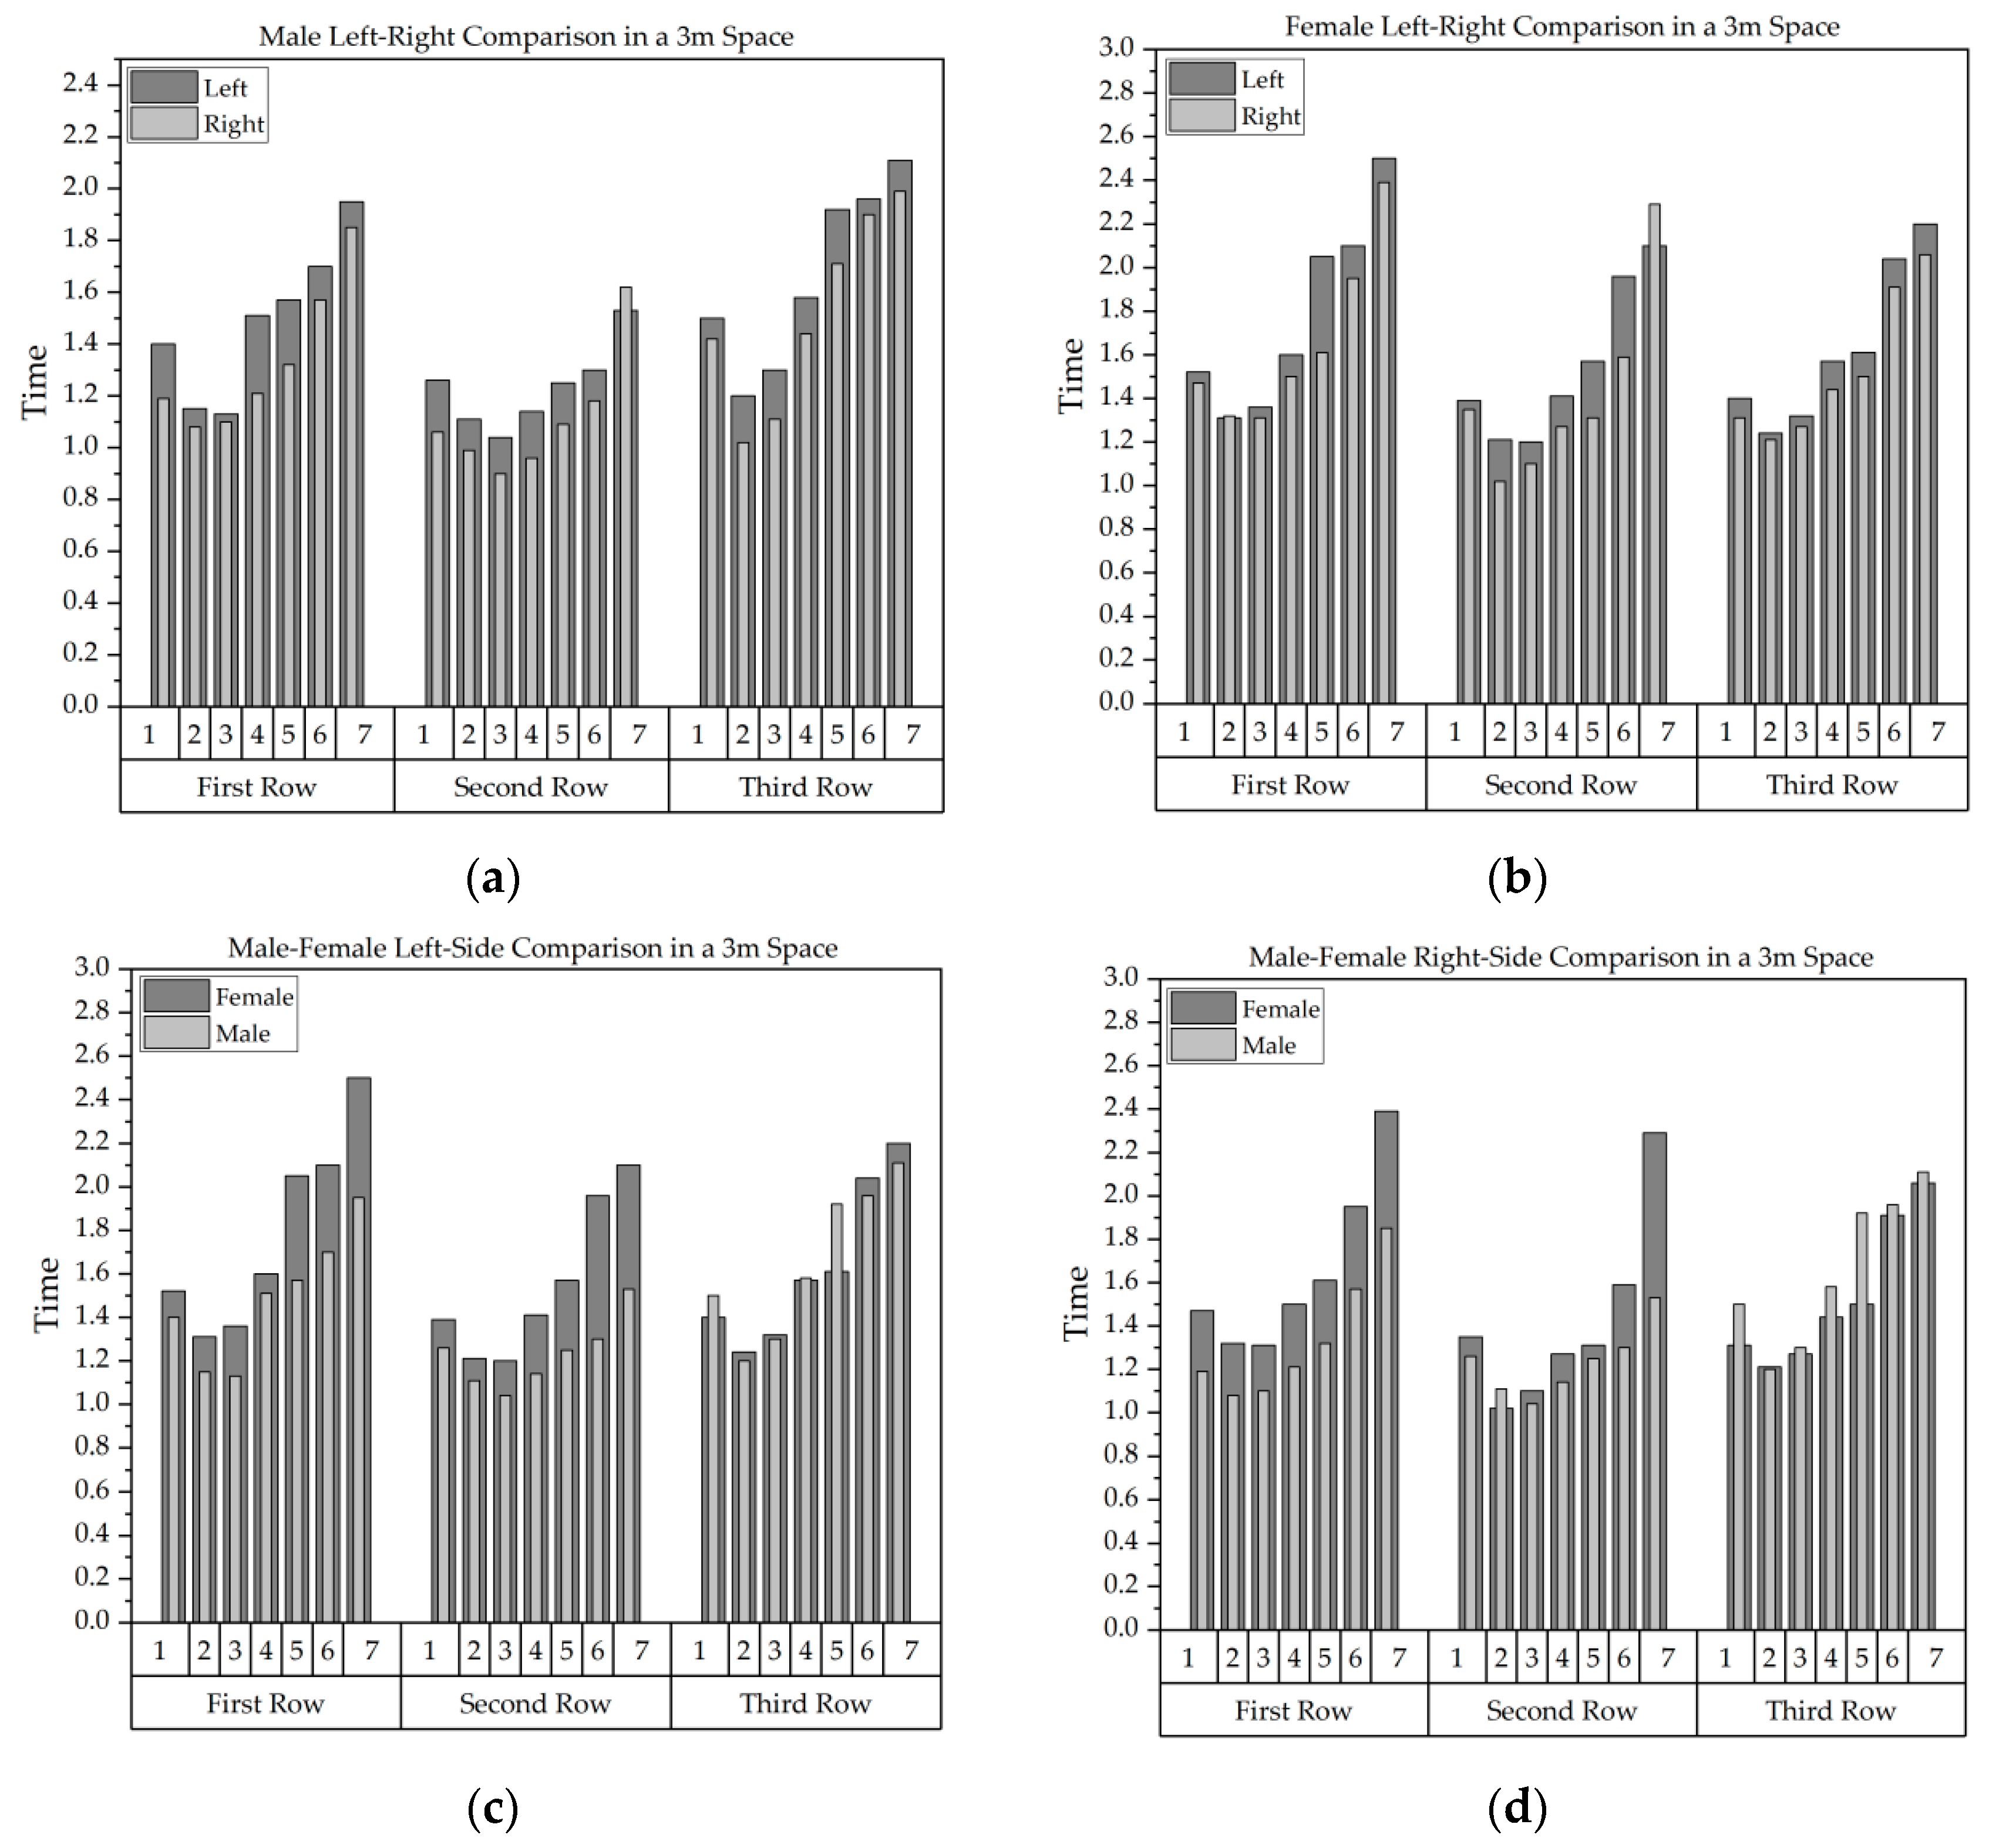
5.3. The Impact of Gender Differences on Visual Search Efficiency
6. Conclusions
Author Contributions
Funding
Data Availability Statement
Conflicts of Interest
References
- Ashman, A.F. The Relationship Between Planning and Simultaneous and Successive Synthesis; University of Alberta: Edmonton, AB, Canada, 1978. [Google Scholar]
- Ren, Y. The Spatial Effect in the Course of Visual Search. Master’s Thesis, Liaoning Normal University, Dalian, China, 2006. [Google Scholar]
- Wolfe, J.M.; Horowitz, T.S. Five Factors That Guide Attention in Visual Search. Nat. Hum. Behav. 2017, 1, 58. [Google Scholar] [CrossRef] [PubMed]
- Carr, K.T. An investigation into the effects of a simulated thermal cueing aid upon air-toground search performance. Vis. Search 1988, 361–370. [Google Scholar] [CrossRef]
- Chan, A.H.S.; Yu, R. Validating the Random Search Model for Two Targets of Different Difficulty. Percept. Mot. Skills 2010, 110, 167–180. [Google Scholar] [CrossRef] [PubMed]
- Treisman, A.M.; Gelade, G. A Feature-Integration Theory of Attention. Cognit. Psychol. 1980, 12, 97–136. [Google Scholar] [CrossRef] [PubMed]
- Duncan, J.; Humphreys, G. Beyond the Search Surface: Visual Search and Attentional Engagement. J. Exp. Psychol. Hum. Percept. Perform. 1992, 18, 578–588. [Google Scholar] [CrossRef] [PubMed]
- Wolfe, J.M.; Cave, K.R.; Franzel, S.L. Guided Search: An Alternative to the Feature Integration Model for Visual Search. J. Exp. Psychol. Hum. Percept. Perform. 1989, 15, 419–433. [Google Scholar] [CrossRef] [PubMed]
- Buetti, S.; Cronin, D.A.; Madison, A.M.; Wang, Z.; Lleras, A. Towards a Better Understanding of Parallel Visual Processing in Human Vision: Evidence for Exhaustive Analysis of Visual Information. J. Exp. Psychol. Gen. 2016, 145, 672–707. [Google Scholar] [CrossRef] [PubMed]
- Wang, A.; Lu, J.; Liu, X. Effect Mechanism of Attention Allocation Strategy on Task Performance and Visual Behavior of Interface. Comput. Syst. Appl. 2022, 31, 10–20. [Google Scholar]
- Varjo, J.; Hongisto, V.; Haapakangas, A.; Maula, H.; Koskela, H.; Hyönä, J. Simultaneous Effects of Irrelevant Speech, Temperature and Ventilation Rate on Performance and Satisfaction in Open-Plan Offices. J. Environ. Psychol. 2015, 44, 16–33. [Google Scholar] [CrossRef]
- Pierrette, M.; Parizet, E.; Chevret, P.; Chatillon, J. Noise Effect on Comfort in Open-Space Offices: Development of an Assessment Questionnaire. Ergonomics 2015, 58, 96–106. [Google Scholar] [CrossRef]
- Peng, Y. Theory of Architectural Spatial Composition; China Architecture & Building Press: Beijing, China, 2008. [Google Scholar]
- Cheng, D. Architecture Form Space and Order: Tianjin, China; John Wiley & Sons: Hoboken, NJ, USA, 2008. [Google Scholar]
- Kobayashi, T.; Jadram, N.; Sugaya, M. Evaluation of the Effect of Three-Dimensional Shape in VR Space on Emotion Using Physiological Indexes. In Virtual, Augmented and Mixed Reality; Springer: Berlin/Heidelberg, Germany, 2024; Volume 14706, pp. 213–223. [Google Scholar]
- Li, H.; Yi, P.; Hong, Y.; Wang, L. Research on search behavior of evacuation signs under the influence of interference of different complexity. J. Saf. Environ. 2024, 24, 2348–2356. [Google Scholar]
- Mingming, M.; Jianhua, G.; Wenhang, L.; Lin, H.; Xiaohui, M.; Yabin, L. Layout Optimization of the Directional Emergency Evacuation Signs Based on Virtual Reality Eye-Tracking Experiment. Geomat. Inf. Sci. Wuhan Univ. 2020, 45, 1386–1394. [Google Scholar]
- Schrom-Feiertag, H.; Settgast, V.; Seer, S. Evaluation of Indoor Guidance Systems Using Eye Tracking in an Immersive Virtual Environment. Spat. Cogn. Comput. 2017, 17, 163–183. [Google Scholar] [CrossRef]
- López, G.; De Oña, J.; Garach, L.; Baena, L. Influence of Deficiencies in Traffic Control Devices in Crashes on Two-Lane Rural Roads. Accid. Anal. Prev. 2016, 96, 130–139. [Google Scholar] [CrossRef]
- Wakide, I. Standardized guide signs at Yokohama station. Jpn. Railw. Eng. 2005, 45, 16–18. [Google Scholar]
- Matsubara, H. A User-Specific Passenger Guidance System Aimed at Universal Design. Jpn. Railw. Eng. 2005, 45, 1–3. [Google Scholar]
- Lei, B.; Xu, J.; Li, M.; Li, H.; Li, J.; Cao, Z.; Hao, Y.; Zhang, Y. Enhancing Role of Guiding Signs Setting in Metro Stations with Incorporation of Microscopic Behavior of Pedestrians. Sustainability 2019, 11, 6109. [Google Scholar] [CrossRef]
- Vilar, E.; Rebelo, F.; Noriega, P.; Teles, J.; Mayhorn, C. The Influence of Environmental Features on Route Selection in an Emergency Situation. Appl. Ergon. 2013, 44, 618–627. [Google Scholar] [CrossRef]
- Vilar, E.; Rebelo, F.; Noriega, P.; Teles, J.; Mayhorn, C. Signage Versus Environmental Affordances: Is the Explicit Information Strong Enough to Guide Human Behavior During a Wayfinding Task? Hum. Factors Ergon. Manuf. Serv. Ind. 2015, 25, 439–452. [Google Scholar] [CrossRef]
- Ma, X.; Zhou, J.; Gong, J.; Huang, L.; Li, W.; Zou, Y. VR Eye-Tracking Perception Experiment and Layout Evaluation for Indoor Emergency Evacuation Signs. J. Geo-Inf. Sci. 2019, 21, 1170–1182. [Google Scholar]
- GB 55031-2022; General Code for Civil Building. Ministry of Housing and Urban Rural Development of the People’s Republic of China: Beijing, China, 2022.
- GB 55037-2022; General Specification for Building Fire Protection. Ministry of Housing and Urban Rural Development of the People’s Republic of China: Beijing, China, 2022.
- Dijkstra, J.J.; Chen, Q.Q.; De Vries, B.B.; Jessurun, A.J. Measuring Individual’s Egress Preference in Wayfinding through Virtual Navigation Experiments. Pedestr. Evacuation Dyn. 2014, 2012, 371–383. [Google Scholar]
- Zhao, H. Discussion on Safety Evacuation Design of Commercial Buildings. Fire Tech. Prod. Inf. 2005, 9–11. [Google Scholar]
- Duncan, J.; Humphreys, G.W. Visual Search and Stimulus Similarity. Psychol. Rev. 1989, 96, 433–458. [Google Scholar] [CrossRef] [PubMed]
- Previc, F.H.; Naegele, P.D. Target-Tilt and Vertical-Hemifield Asymmetries in Free-Scan Search for 3-D Targets. Percept. Psychophys. 2001, 63, 445–457. [Google Scholar] [CrossRef]
- Castiello, U.; Umiltà, C. Size of the Attentional Focus and Efficiency of Processing. Acta Psychol. 1990, 73, 195–209. [Google Scholar] [CrossRef] [PubMed]
- Eriksen, C.W.; St James, J.D. Visual Attention within and around the Field of Focal Attention: A Zoom Lens Model. Percept. Psychophys. 1986, 40, 225–240. [Google Scholar] [CrossRef]
- Carrasco, M.; Chang, I. The Interaction of Objective and Subjective Organizations in a Localization Search Task. Percept. Psychophys. 1995, 57, 1134–1150. [Google Scholar] [CrossRef]
- Shieh, K.-K.; Lin, C.-C. Effects of Screen Type, Ambient Illumination, and Color Combination on VDT Visual Performance and Subjective Preference. Int. J. Ind. Ergon. 2000, 26, 527–536. [Google Scholar] [CrossRef]
- Lin, C.-C. Effects of Screen Luminance Combination and Text Color on Visual Performance with TFT-LCD. Int. J. Ind. Ergon. 2005, 35, 229–235. [Google Scholar] [CrossRef]
- Wang, A.-H.; Chen, M.-T. Effects of Polarity and Luminance Contrast on Visual Performance and VDT Display Quality. Int. J. Ind. Ergon. 2000, 25, 415–421. [Google Scholar] [CrossRef]
- Guan, X.; Zhao, H.; Hu, S. Measurement of Spatial Luminance Influence on Visual Clarity of Road Lighting. China Illum. Eng. J. 2010, 21, 17–24. [Google Scholar]
- Ji, Z.; Shao, H.; Lin, Y. The Effect of Adaptation Time, Adaptation Luminance and Glare on Contrast of Human ’s Eye. China Illum. Eng. J. 2006, 15, 1–4. [Google Scholar]
- Jin, L.; Min, L.; Chen, S.; Zheng, X.; Jiang, X.; Chen, Y. Visual Space Model and Eye Motion Verification of Visual Guiding System in Public Space. J. Eng. Stud. 2017, 9, 430–438. [Google Scholar] [CrossRef]
- Zhang, Y.; Zheng, X.J.; Hong, W.; Mou, X.Q. A Comparison Study of Stationary and Mobile Eye Tracking on EXITs Design in a Wayfinding System; IEEE: Piscataway, NJ, USA, 2015; pp. 649–653. [Google Scholar]
- Hedges, L.V.; Nowell, A. Sex Differences in Mental Test Scores, Variability, and Numbers of High-Scoring Individuals. Science 1995, 269, 41–45. [Google Scholar] [CrossRef] [PubMed]
- Liu, X.; Jin, T.; Wu, X.; Gu, H.; Zhao, D. Effect of Emergency Icon Presentation and Brightness Contrast on Cognitive Performance. Sci. Technol. Eng. 2024, 24, 3291–3297. [Google Scholar]
- Jin, T.; Ming, C.; Zhou, S.; He, J. Impact Mechanism of Icon Layout on Visual Search Performance. J. Northeast. Univ. 2021, 42, 1579–1584. [Google Scholar]
- Wang, Y. Feature-Oriented Visual Search ERP Research. Master’s Thesis, Southeast University, Nanjing, China, 2022. [Google Scholar]
- Teng, S. Research on Visual Saliency of Guide Signs in Underground Commercial Street Based on Eye Movement Experiment. Master’s Thesis, China University of Mining and Technology, Beijing, China, 2022. [Google Scholar]
- Chen, Y.; Cui, Z.; Hao, L. Virtual Reality in Lighting Research: Comparing Physical and Virtual Lighting Environments. Light. Res. Technol. 2019, 51, 820–837. [Google Scholar] [CrossRef]
- Zong, Z. VR simulation research on colour and light environment design of cruise cabin. Master’s Thesis, Harbin Engineering University, Harbin, China, 2023. [Google Scholar]
- Kobes, M.; Helsloot, I.; De Vries, B.; Post, J.G. Building Safety and Human Behaviour in Fire: A Literature Review. Fire Saf. J. 2010, 45, 1–11. [Google Scholar] [CrossRef]
- Bode, N.W.F.; Codling, E.A. Human Exit Route Choice in Virtual Crowd Evacuations. Anim. Behav. 2013, 86, 347–358. [Google Scholar] [CrossRef]
- Tang, C.-H.; Wu, W.-T.; Lin, C.-Y. Using Virtual Reality to Determine How Emergency Signs Facilitate Way-Finding. Appl. Ergon. 2009, 40, 722–730. [Google Scholar] [CrossRef]
- Kobes, M.; Helsloot, I.; de Vries, B. Exit choice,(pre-) movement time and (pre-) evacuation behaviour in hotel fire evacuation—Behavioural analysis and validation of the use of serious gaming in experimental research. Procedia Eng. 2010, 3, 37–51. [Google Scholar] [CrossRef]
- GB-T 10000-2023; The Chinese Adult Body Size. The State Bureau of Quality and Technical Supervision: Beijing, China, 2023.
- Yang, X. The Processing of Configural Superiority Effect in the Ventral Visual Pathway: A fMRI and TMS Study. Master’s Thesis, University of Electronic Science and Technology of China, Chengdu, China, 2020. [Google Scholar]
- Ojanpää, H.; Näsänen, R. Effects of Luminance and Colour Contrast on the Search of Information on Display Devices. Displays 2003, 24, 167–178. [Google Scholar] [CrossRef]
- Liao, H.; Dong, W. An Exploratory Study Investigating Gender Effects on Using 3D Maps for Spatial Orientation in Wayfinding. ISPRS Int. J. Geo-Inf. 2017, 6, 60. [Google Scholar] [CrossRef]
- Lawton, C.A. Gender differences in way-finding strategies: Relationship to spatial ability and spatial anxiety. Sex Roles 1994, 30, 765–779. [Google Scholar] [CrossRef]
- Huo, X. Gender Differences of Visual Search in Scene Perception. Master’s Thesis, Ningxia University, Yinchuan, China, 2014. [Google Scholar]
- Chapman, A.F.; Störmer, V.S. Feature Similarity Is Non-Linearly Related to Attentional Selection: Evidence from Visual Search and Sustained Attention Tasks. J. Vis. 2022, 22, 4. [Google Scholar] [CrossRef] [PubMed]


| Quadrant | Field of View Area Ratio | Spatial Distance |
|---|---|---|
| First quadrant |  (R2 = 0.516) | 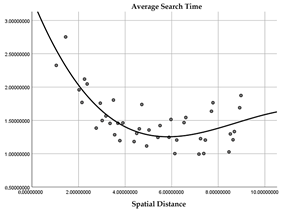 (R2 = 0.622) |
| Second quadrant |  (R2 = 0.598) | 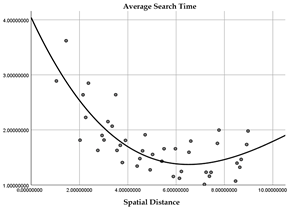 (R2 = 0.631) |
| Third quadrant | 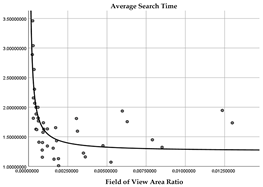 (R2 = 0.601) |  (R2 = 0.659) |
| Fourth quadrant |  (R2 = 0.491) | 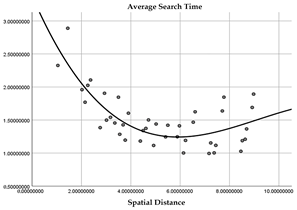 (R2 = 0.614) |
| Quadrant | GRA | Normalization | Final Influence Function | |
|---|---|---|---|---|
| First quadrant | d | 0.826 | 0.53 | |
| p | 0.727 | 0.47 | ||
| Second quadrant | d | 0.814 | 0.53 | |
| p | 0.728 | 0.47 | ||
| Third quadrant | d | 0.814 | 0.53 | |
| p | 0.727 | 0.47 | ||
| Fourth quadrant | d | 0.826 | 0.53 | |
| p | 0.727 | 0.47 | ||
| Quadrant | Position | Group | Regression Equation |
|---|---|---|---|
| First quadrant | Right | Cs | |
| Cl | |||
| Ch | |||
| Upper | Cs | ||
| Cl | |||
| Ch | |||
| Second quadrant | Left | Cs | |
| Cl | |||
| Ch | |||
| Upper | Cs | ||
| Cl | |||
| Ch | |||
| Third quadrant | Left | Cs | |
| Cl | |||
| Ch | |||
| Lower | Cs | ||
| Cl | —— | ||
| Ch | |||
| Fourth quadrant | Right | Cs | |
| Cl | |||
| Ch | |||
| Lower | Cs | ||
| Cl | —— | ||
| Ch |
Disclaimer/Publisher’s Note: The statements, opinions and data contained in all publications are solely those of the individual author(s) and contributor(s) and not of MDPI and/or the editor(s). MDPI and/or the editor(s) disclaim responsibility for any injury to people or property resulting from any ideas, methods, instructions or products referred to in the content. |
© 2025 by the authors. Licensee MDPI, Basel, Switzerland. This article is an open access article distributed under the terms and conditions of the Creative Commons Attribution (CC BY) license (https://creativecommons.org/licenses/by/4.0/).
Share and Cite
Wang, W.; Zhang, M.; Wang, Z.; Fan, Q. The Impact of Spatial Dimensions, Location, Luminance, and Gender Differences on Visual Search Efficiency in Three-Dimensional Space. Buildings 2025, 15, 656. https://doi.org/10.3390/buildings15050656
Wang W, Zhang M, Wang Z, Fan Q. The Impact of Spatial Dimensions, Location, Luminance, and Gender Differences on Visual Search Efficiency in Three-Dimensional Space. Buildings. 2025; 15(5):656. https://doi.org/10.3390/buildings15050656
Chicago/Turabian StyleWang, Wenheng, Mingyu Zhang, Zhide Wang, and Qing Fan. 2025. "The Impact of Spatial Dimensions, Location, Luminance, and Gender Differences on Visual Search Efficiency in Three-Dimensional Space" Buildings 15, no. 5: 656. https://doi.org/10.3390/buildings15050656
APA StyleWang, W., Zhang, M., Wang, Z., & Fan, Q. (2025). The Impact of Spatial Dimensions, Location, Luminance, and Gender Differences on Visual Search Efficiency in Three-Dimensional Space. Buildings, 15(5), 656. https://doi.org/10.3390/buildings15050656