Abstract
This study addresses the urgent need to improve energy efficiency in air conditioning systems by developing a low-cost automated control system for mini-split units. In alignment with the United Nations Sustainable Development Goal (SDG) 12, the proposed system reduces energy consumption without compromising user comfort. Implemented in an educational building in Jalisco, Mexico, the system integrates a Siemens Logo 8 PLC, the NodeMCU ESP12-E board, and open-source software to control operations through temperature sensors and infrared signal emitters. A quantitative, descriptive, and correlational methodology was applied, yielding significant results: a 10.63% reduction in energy consumption and a 34.8% reduction in operating costs. Additionally, the system maintains stable indoor temperatures within the optimal range of 22 to 24 °C while operating on a local network, ensuring reliability without constant internet access. The installation cost per unit was USD 95, with an annual return on investment of 30.74%, which makes it scalable and profitable to modernize existing buildings. The study highlights the transformative potential of integrating low-cost technologies into building management, offering a practical and replicable solution to improve energy efficiency, particularly in resource-limited contexts. These contributions support global efforts to mitigate climate change, reduce carbon footprints, and promote energy sustainability goals.
1. Introduction
The planet faces drastic climate changes, prompting the approval of the 2030 Agenda by the United Nations General Assembly []. Among its objectives, Sustainable Development Goal (SDG) 12 emphasizes responsible resource production and consumption. However, according to the 2023 progress report on SDGs, significant advancements in this area remain elusive [].
Global warming has increased indoor temperatures in buildings. Ref. [], escalating energy costs for maintaining occupant comfort [,,]. While studies propose innovative materials and efficient construction strategies [,,,], retrofitting existing buildings to optimize energy efficiency is critical to avoid unnecessary waste [,].
The International Energy Agency []. Highlights the growing demand for energy in buildings, underscoring the urgency of improving current infrastructure. Emerging technologies, including artificial intelligence and IoT-based solutions, have shown potential for enhancing energy efficiency [,,,,,,,,,,,]. However, in developing countries like Mexico, limited infrastructure and high indirect costs hinder widespread adoption, necessitating cost-effective alternatives.
Mini-split systems, preferred over traditional HVAC systems for their ductless design and ease of installation, are widely used in Mexico for indoor temperature conditioning [,]. According to Mexico’s Ministry of Energy, mini-splits offer high energy efficiency and sustainability by replacing less efficient equipment [].
This study proposes an innovative, low-cost solution to optimize mini-split systems in existing buildings. The system ensures reliable and gradual temperature regulation by using a Siemens Logo 8 PLC with integrated Proportional-Integral (PI) control [,,,,]. Additionally, the integration of open-source software and NodeMCU ESP12-E boards enhances practicality and cost-effectiveness, offering scalable and sustainable energy solutions [,,,,,,].
The proposed system not only reduces energy consumption but also provides a profitable alternative for improving energy efficiency, contributing to global sustainability efforts, building decarbonization, and SDG 12 [,,,].
Recent studies demonstrate the effectiveness of low-cost technologies for energy efficiency, such as open-source platforms and programmable logic controllers (PLCs) [,,,]. For instance, ref. [] analyzed the implementation of IoT-based systems for optimizing HVAC performance, achieving significant energy reductions in educational buildings []. Similarly, ref. [] highlighted the versatility of Raspberry Pi and ESP8266-based boards in energy monitoring applications, demonstrating their scalability and cost-effectiveness. Moreover, ref. [] reported a 30% reduction in energy consumption using automated control systems based on open-source tools in retrofitted commercial buildings. These technologies have been successfully deployed across various domains, from optimizing industrial processes to enhancing residential energy management, showcasing their adaptability to diverse scenarios [,,]. Such advancements underscore the transformative potential of integrating affordable technologies to achieve energy efficiency, particularly in developing nations where budget constraints often limit innovation.
In the present study, the main results are summarized in Table 1, which reveals the impact of the proposed energy management system. This table includes important aspects such as a 10.63% reduction in energy consumption and consequently a decrease in operating costs. The installation cost per unit is estimated at USD 95, with annual savings of USD 23.4 kWh. In addition, the system guarantees an optimal interior temperature range of 22 to 24 °C, which contributes to improving comfort and energy efficiency.

Table 1.
Summary of key results for the developed system.
To illustrate the effectiveness of the system, a comparative graph of the energy consumption shown in Figure 1 is provided, which represents the energy use without the use of the system, using the system, and the reduction that the system provides when implemented in the mini-splits. When visually comparing the scenarios, the graph highlights the reduction in energy consumption (gray) after implementation; the return on investment is achieved at 39 months (blue), which is acceptable as shown by the recovery cost (green), which reinforces the energy efficiency of the developed system.
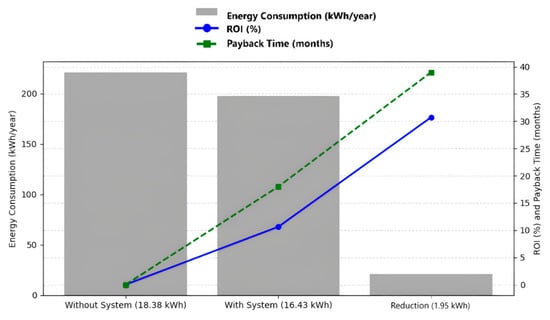
Figure 1.
Comparison chart: energy consumption in function of time/ROI/energy consumption. Source: Own elaboration.
The growing need for sustainable construction practices is driven by the urgency to address environmental challenges and reduce energy consumption. Sustainability in construction encompasses strategies to minimize a building’s environmental impact throughout its entire lifecycle, from construction to decommissioning. While new, energy-efficient buildings offer potential, most existing structures, particularly in educational settings, require targeted interventions to optimize energy usage. This research examines sustainable approaches not only in new developments but also in retrofitting existing buildings using advanced energy control technologies to reduce their ecological footprint.
1.1. Sustainability in Construction
Sustainability in construction refers to the ability of a building to minimize its environmental impact throughout its lifecycle, from the construction phase to operation and decommissioning. In the context of improving energy efficiency, sustainability involves implementing strategies that reduce energy consumption, enhance resource efficiency, and minimize greenhouse gas emissions without compromising user comfort. While constructing new sustainable buildings is an option, the reality is that most existing buildings, especially in educational settings, require solutions that optimize their energy efficiency. This research focuses on sustainability not only in terms of new developments but also on how existing buildings can be adapted to reduce their environmental footprint using intelligent energy control technologies.
1.2. Justification for Focusing on Building Sustainability
The focus on the sustainability of existing buildings is justified by the fact that constructing new sustainable buildings is not always feasible due to economic, social, and spatial constraints. Moreover, the process of demolishing and constructing new buildings generates a significant amount of waste and carbon emissions. Therefore, optimizing energy systems in existing buildings, such as air conditioning systems, represents one of the most accessible and effective solutions for improving sustainability in the construction sector.
2. Materials and Methods
2.1. Materials
The space for temperature conditioning is 34.8 m2. According to the manufacturer’s recommendation [], two mini-splits are required to condition the space shown in Figure 2, where the area to be air-conditioned is represented in red and the location of the mini-splits in green. mini-splits commonly condition the interior temperature of small spaces, as noted by []. Regarding the type of mini-split, the Mirage Magnum 19 Inverter brand of 12,000 BTU (British Thermal Units) was used, as shown in Figure 2.
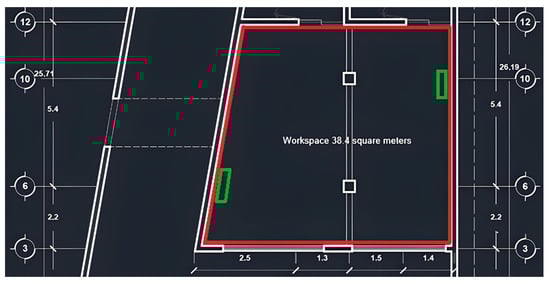
Figure 2.
Workspace for the internal temperature conditioning system (the red box corresponds to the workspace and the green box corresponds to the Mi-Splits localization). Source: Own elaboration.
Usually, when using a mini-split, users directly manipulate the control to adjust the desired temperature during their activities. This method generates high and disproportionate energy consumption due to the lack of constant monitoring once the desired temperature is reached. With a control, monitoring, and automation system, it is possible to reduce energy consumption, simplify user activities, and extend the useful life of devices by avoiding unnecessary use and reducing expenses derived from preventive maintenance. The development of the system includes various technologies, from devices for capturing or obtaining data to processing, control, and automation. The components used are described below:
Data Collection:
- RTD (resistance temperature detector) type PT100 with signal processing module (acquired in TACT AUTOMATION, place: Aguascalientes, Mexico).
- HS0038B infrared receiver (fabricant 1-source electronic components, acquired in Jalisco, México).
- Sonoff Pow R2 energy consumption meter (Fabricant: Sonoff, acquired in Jalisco, México).
Data control and processing:
- Siemens Logo 8 Comfort PLC (Fabricant: Siemens, acquired in: Jalisco, Mexico).
- Raspberry Pi 3 B+ (Operative System version Linux 5.4.51-v7+ arm LE, Fabricant Raspberry Pi, acquired in Jalisco, Mexico).
- NodeMCU 1.0 ESP 12-E (V2 board, acquired in AV Electronics Web page, place: Quito, Ecuador).
- Node-RED (software version v1.0.6, Fabricant del software IBM and Open JS Foundation, acquired: Preinstalled in Raspberry Pi 3+).
- Mosquitto software version 1.5.7-deb10u1 (MQTT protocol, Fabricant: EPL/EDL Licensed, acquired in Web Open-Source Software).
- 2N222 transistor, (Fabricant: Mouser Electronics, acquired in Jalisco, México).
2.2. Methodology
The developed system follows a four-phase methodology and its corresponding sub-phases, and once the system is implemented, a comparative analysis of energy consumption is carried out using and without using the implemented system. This analysis allows us to demonstrate the efficiency of the system in contrast to the normal use of persons to air-condition living spaces with mini-split. The methodology used is shown in Figure 3, and the development phases are described below:
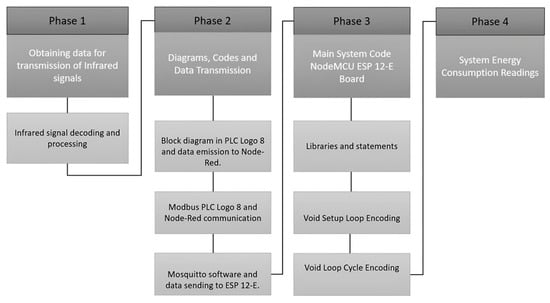
Figure 3.
Four phases and subphases of the methodology were developed for the study. Source: Own elaboration.
Regarding the proportional-integral (PI) control, this generates better signal processing []. Due to the signal capture times and the temperature, air, and gas commonly controlled in home automation, this type of control, in addition to being recommended by the type of signal to process and the amount of data to handle, is also preconfigured in PLCs such as the Siemens Logo 8 (robust range device for the development of home automation systems in homes). By implementing this type of control, energy consumption is reduced, the system is automated, and direct user intervention is eliminated. In addition, through communication between devices using Modbus TCP/IP (Transmission Control Protocol/Internet Protocol) and MQTT protocols, with open-source technologies in a Linux environment (Raspberry Pi 3+). Once the data have been processed, the transmission of infrared signals is completed using infrared LEDs and a 2N222 transistor to amplify the signal range, achieving a closed-loop system.
Development phases.
- Obtaining hexadecimal codes:
- Use of infrared emitters and receivers to decode the remote-control signals of the mini-split.
- Development of a code in “into” language to capture and store signals.
- Control and transmission of variables:
- Implementation of a block diagram in the Siemens Logo 8 PLC for temperature control.
- Use of Node-RED and Mosquitto (MQTT) on the Raspberry Pi 3+ to transmit the variables to the NodeMCU ESP12-E board.
- Emission of infrared signals:
- Development of a code on the ESP12-E board to receive and process the controlled variables.
- Emission of infrared signals towards the mini-split using an IR-333 LED.
- Reading and analysis of energy consumption:
- Using the Sonoff Pow R2 device to record energy consumption.
- Comparison between the consumption recorded with manual handling of the mini-split and the consumption with the automated system.
The automated system operates through a local network (Ethernet) to guarantee independence from the internet connection and avoid connectivity problems.
2.2.1. Phase 1: Obtaining Data for the Emission of Infrared Signals
Infrared signal decoding and processing.
To decode the Mirage remote control signals, electronic devices connected to the NodeMCU ESP12-E board are used, as shown in Figure 4. The signals are extracted considering response time, hexadecimal codes, communication protocol, instruction sent, and number of bits.
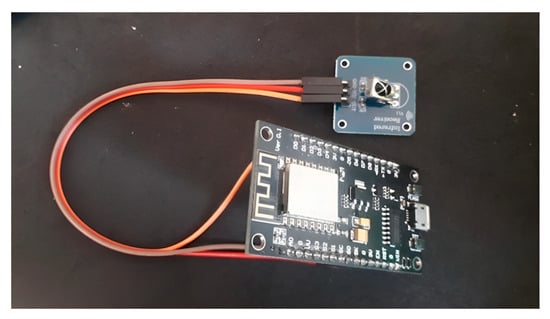
Figure 4.
HS0038B infrared receiver connected to the ESP12-E board. Source: Own elaboration.
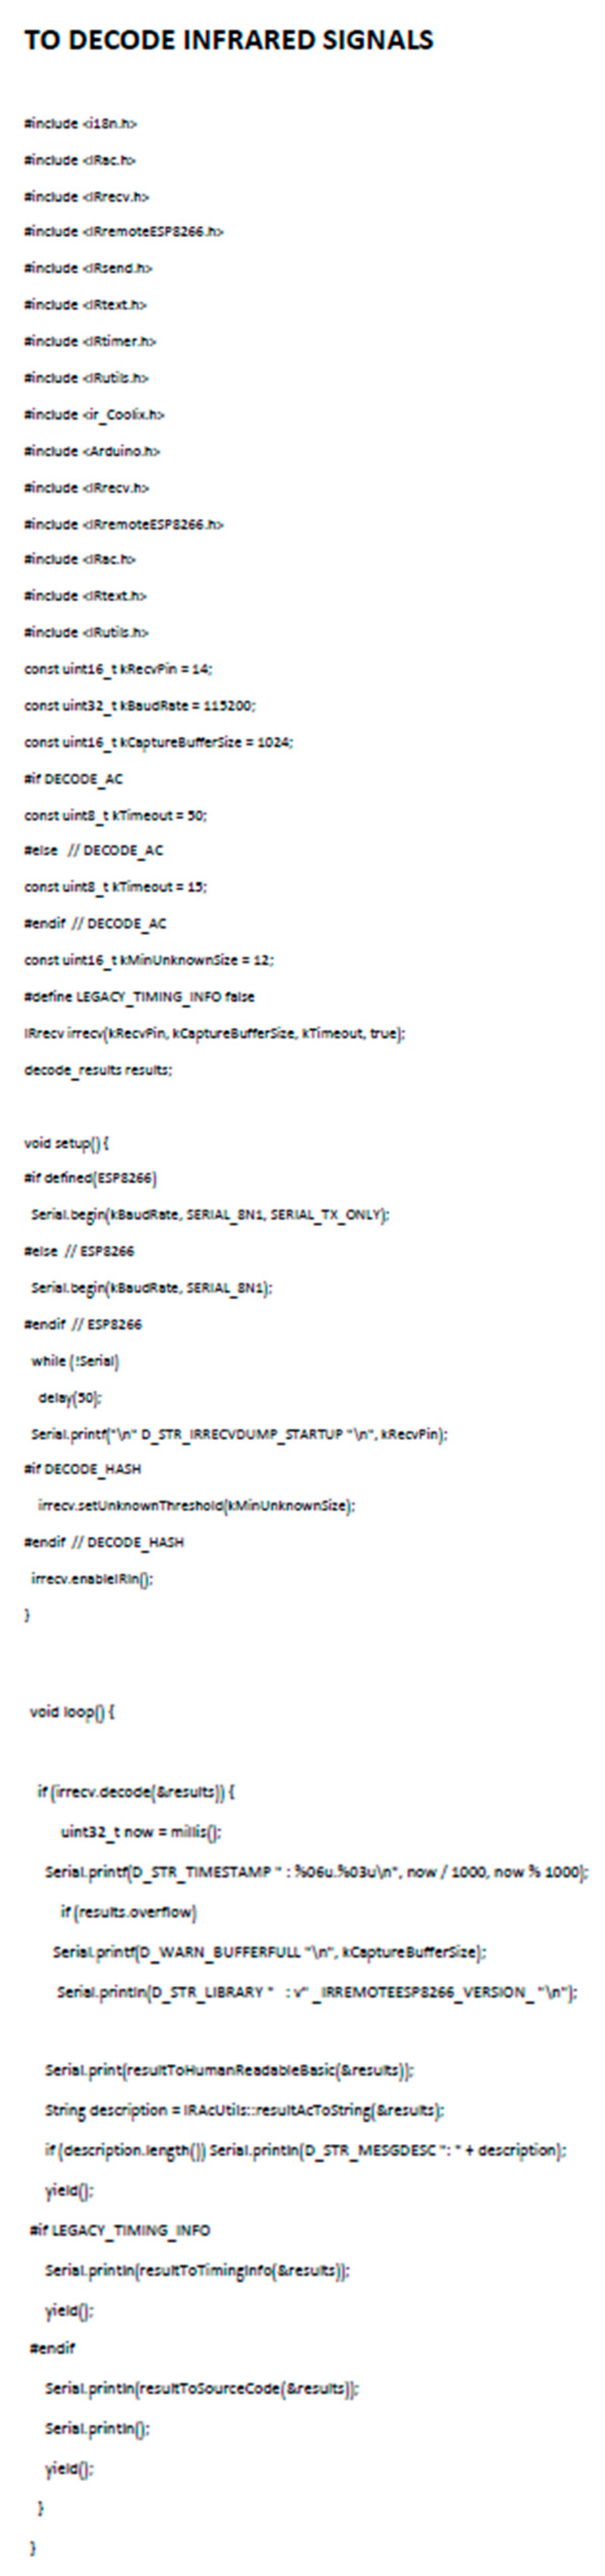
The Arduino IDE libraries are essential to manage the communication protocol and transmission times. Figure 5 shows an infrared signal obtained using the developed code, shown in full in Appendix A.
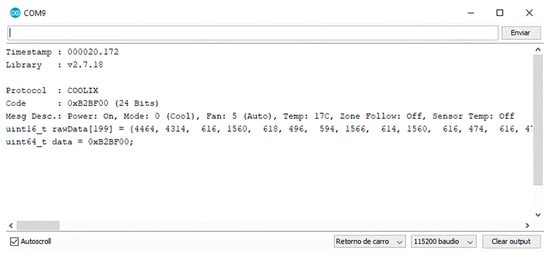
Figure 5.
Serial monitor with an infrared signal decoded in Arduino. Source: Own elaboration.
2.2.2. Phase 2: Code Diagrams and Data Transmission
Block diagram in PLC Logo 8 and data emission to Node-RED.
The Siemens Logo 8 PLC offers an interface for monitoring network projects, consisting of linking the IP address assigned to the device and entering it in any internet browser, while there is communication between any computer/modem/PLC. It begins by opening the Logo Soft Comfort software V8.4 version interface on a computer, creating a network project, assigning the PLC to be used, and the IP address of the device. For this project, the IP address 192.168.0.12 was used. Subsequently, the connection is made via Modbus as the Logo 8 PLC client to a server that will be the Node-RED software v1.0.6 version. A pop-up window is generated where the permissions are accepted, and the Modbus communication is generated.
To have greater certainty of the available ports, inputs, and all the available functions and characteristics of the device, the properties of the PLC icon are selected, as can be seen in Figure 6. It is important to consider the output “Q” and the outputs Modbus that start from port 8193–8212, which are essential for communication with the Node-RED software.
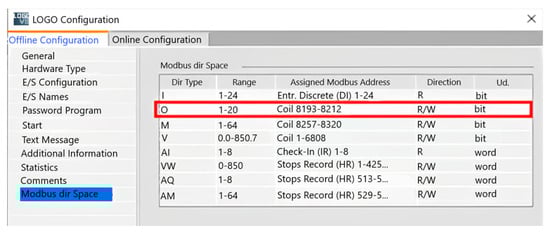
Figure 6.
Ports for Modbus communication for data transmission to Node-RED (the red box shows the Modbus port outputs of the Logo 8 PLC to be considered for the offset considered in the counting for communication between devices). Source: Own elaboration.
Once the network configuration has been assigned and carried out, the block diagram is prepared to generate the proportional integral control using the blocks preloaded in the Logo 8 PLC software and connecting the PT100 sensors to capture temperature signals; Figure 7 shows the diagram generated to capture the temperature, process it in the proportional integral control, and emit the setpoint or temperature assigned through the PI control, and finally the output block for sending the value to Node-RED software.
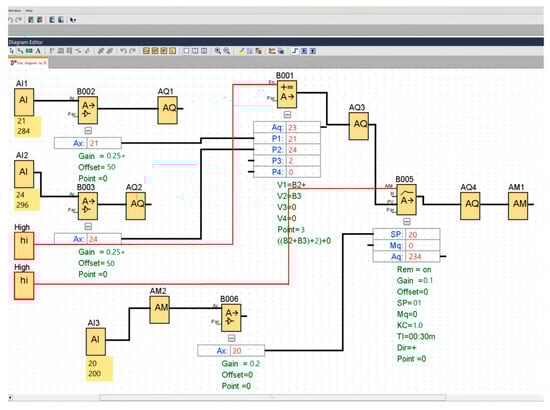
Figure 7.
PLC block diagram to generate control in the temperature variable and generate sending to the Node-RED software (red lines indicate “high value” are on). Source: Own elaboration.
Modbus PLC Logo 8 and Node-RED Communication
Regarding the Node-RED software, the one pre-installed in the Raspberry Pi 3+ operating system was used. For its connectivity and operation, it is necessary to download the following data packages in Node-RED:
- Node-red-contrib-modbus (version 5.14.0 or higher).
- Node-red-contrib-modbus-api (version 0.3.0 or higher).
- Node-red-contrib-modbus-tcp-ip (version 1.1.5 or higher).
The use of these is essential for the beneficial operation of the system and its communication. Regarding Modbus communication with the PLC, it is necessary to prepare the flow diagram or nodes; the “Modbus-Read” node reads the information coming from the PLC with the setpoint value issued by the PI control; the node configuration is shown in Figure 8, assigning the data required by the node. It is very important to consider the following: In the “Unit-Id” section, the number “255” was placed because it is the gateway or identifier used by the Logo 8 PLC. In the FC option, we selected “FC 3: Read Holding Registers”, to retain the information sent by the Logo 8 PLC and saved in memory for later manipulation. This information is found in the general data of the Logo 8 PLC interface. Siemens begins the address count from 1 to 513 for communication, and Node-RED begins the assignment considering 0, there being a lag of 1 in the count, resulting in the assignment of address 512 in Node-RED. In the “Quantity” and “Poll Rate” section, “1” was assigned in Quantity to ensure the quality of the sending with level “1”; it is optimal, and in Poll Rate, it is finally assigned to the sending time “1 s”.
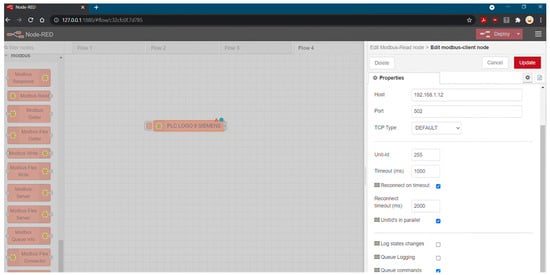
Figure 8.
Configuring Modbus Read node properties in Node-RED. Source: Own elaboration.
To configure the “server” option, it is necessary to select and open the window called “properties”, assigning the communication type as “TCP”, in addition to some previously selected parameters. Then the IP address of the Logo 8 PLC is entered (the default port is 502, the TCP type is default), the assigned time is 1 s and the reconnection time is 2 s. Finally, it is completed by only enabling the “Queue Commands” parameter to enable the start commands and concluding the configuration of the Logo 8 PLC reading block, as shown graphically in Figure 8.
Once the Modbus Read icon is received, a hexadecimal value decoded to voltage is obtained. For its proper manipulation, it is necessary to use the “function” node to generate a code that separates the information needed from the signal received from the PLC. It is necessary to create 2 variables, “r1” and “E”, where “r1” stores the message or information that we need from Modbus communication; the additional values sent by Modbus communication are ignored because they are not necessary for information transmission; subsequently, the equality of both variables is declared; another equality is declared consisting of the message transmitted via Modbus and the variable “E”, plus the legend “temperature”. The above will serve to identify the information of interest; the function code is concluded with a message return to guarantee its continuity shown in Figure 9.
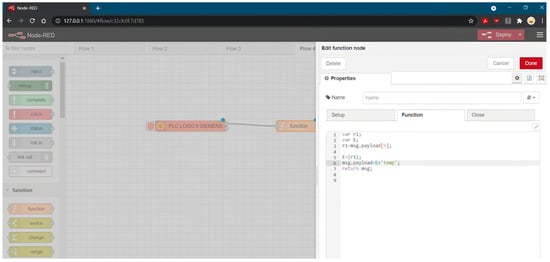
Figure 9.
Node function configuration in Node-RED for information processing. Source: Own elaboration.
Once the necessary information is processed in the function node, the Node-RED “Mqtt out” node is transmitted and sent to the Mosquitto software (MQTT) by sending data to the Mosquitto software broker. The configuration requires setting the following parameters:
- Enter server configuration and assign the name “ESP 8266” to identify the board to use.
- The IP address of the “broker”, the address to which the information will be sent, remains disabled as a security icon.
- “Raspberry” is assigned to the client ID, identifying the origin of the client (Raspberry Pi Board), and we assign 60 s as the value for reconnection.
Regarding security and messages, they are disregarded because they will be used in a local network to simplify the process. Figure 10 shows the configuration described for the “mqtt broker” node.
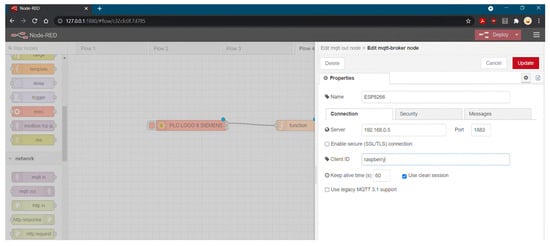
Figure 10.
Mqtt broker node configuration for data transmission to Mosquitto software. Source: Own elaboration.
Regarding the properties section, the topic “team” is assigned, the quality level of the message to be sent is assigned QoS level “1”, guaranteeing the sending of the information, and the name “temperature” is assigned, facilitating the recognition of the data packet; subsequently, it is possible to establish the signal for sending the data packet through Node-RED as publisher in the Mosquitto software broker.
In this section, the node configuration has been completed by accepting the data entered in the “done” key and starting the flows and nodes in the start option (Deploy). Figure 11 shows the flows described and connected for operation. The configuration made in Node-RED establishes the sending of data as a client to the Mosquitto software broker, identifying Node-RED as the publisher.
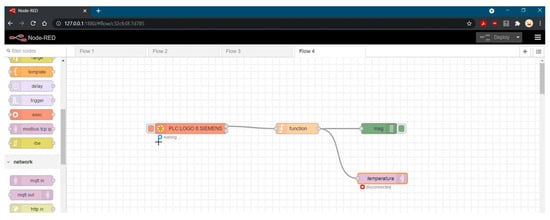
Figure 11.
Start of nodes and flows in Node-RED for reception, processing, and sending of data to the Mosquitto software broker. Source: Own elaboration.
Mosquitto Software and Data Sending to ESP 12-E
The Mosquitto software is optimal for communication for installation on the Raspberry Pi 3+ computer; it is convenient to do so by opening the main command window and installing version 1.5.7-1+deb10u1 for its proper operation using the following lines of code.
- sudo apt-get install mosquito -yInstruction for installing the software on the Raspberry Pi 3+
- sudo apt-get install mosquitto-clientsInstruction to download and install the “clients” package in the Mosquitto software to establish subscribers and publishers in the Software broker.
- sudo nano/etc/mosquitto/mosquitto.conf
In this section, it is important to highlight the importance of entering the source code of the software because in the version downloaded on the Raspberry Pi 3+ computer, port 1883 is disabled for subscribers and publishers. Due to the above, it is necessary when entering the code source to write two additional lines of code to enable port 1883 for sending data on a local network. Inside the folder, delete its contents and enter the lines “allow_anonymous true” and “listener 0.0.0.0 1883”. Figure 12 shows the lines of code to modify to enable the port for subscribers and publishers.
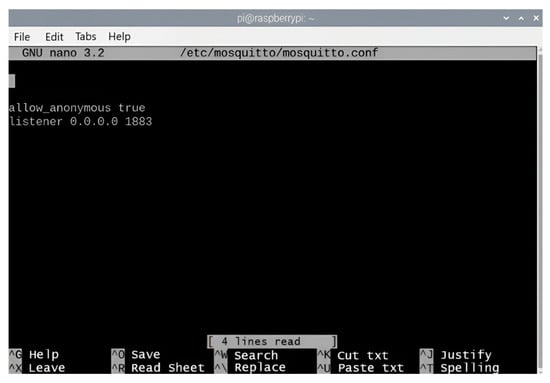
Figure 12.
Commands to enable port 1883 as a “listener” in Mosquitto software. Source: Own elaboration.
Through the instruction “Mosquitto -c default.conf:”, local addresses are enabled for communication through port 1883, and in the context of finding subscribers, they are automatically linked to the Mosquitto broker. Figure 13 shows the instruction executed and the connection enabled.
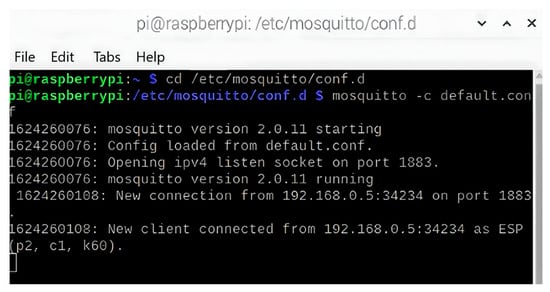
Figure 13.
Command line to initialize, enable, and save settings in Mosquitto software. Source: Own elaboration.
Finally, for the communication stage up to this point, both the Logo 8 PLC with integral proportional control, the Node-RED software for reception, data coding, and sending, and the Mosquitto software for data reception through port 1883 are configured and enabled for subscribers and publishers of information in the broker.
2.2.3. Phase 3 Main System Code with NodeMCU ESP 12-E Board
Regarding the NodeMCU 12-E board, to develop the programming code, the Arduino Software IDE 2.3.4 version was used. The developed coding assigns the ESP 12-E board as the master of the system, which will manipulate the data coming from the Logo 8 PLC (setpoint of the integral proportional control) to establish the sending of infrared signals to the Mini-split devices through two infrared LEDs connected to a 2N2222 transistor to amplify the signal and check the mini-splits, Figure 14 shows the connection of both the infrared LEDs to the NodeMCU 12-E board and the transistors connection description.
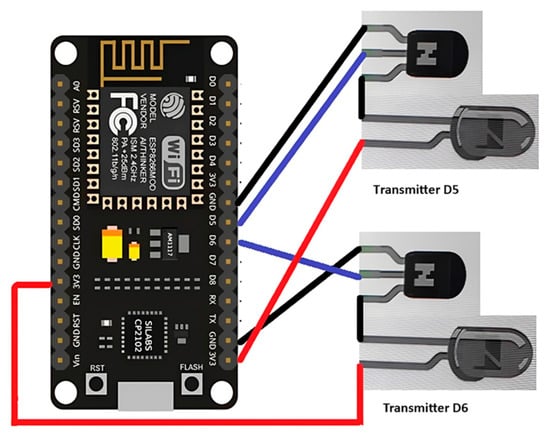
Figure 14.
Connection of the 2N2222 transistor and infrared LEDs to control the Mini-Split of the System. Source: Own elaboration.
Until this section, everything has been performed from the PI control to the data transmission to the NodeMCU ESP 12-E board. Now, having everything necessary for the development of the system’s source code, it will be developed in the Arduino interface due to its practicality considering the system’s operation as a closed loop. The two mini-splits, the modem for connectivity to the local network, and the transmission of information from the Logo 8 PLC to the data extracted from the infrared signals will be considered.
Libraries and Statements
The developed code includes the following libraries essential for the operation of the system:
- Library ESP8266WiFi.h (version 1.0.7 or higher)
- Library PubSubClient.h (version 2.8 or higher)
- Library Arduino.h (version 1.2.0 or higher)
- Library IRremoteESP8266.h (version 2.8.6 or higher)
- Library IRsend.h (version 1.2.3 or higher)
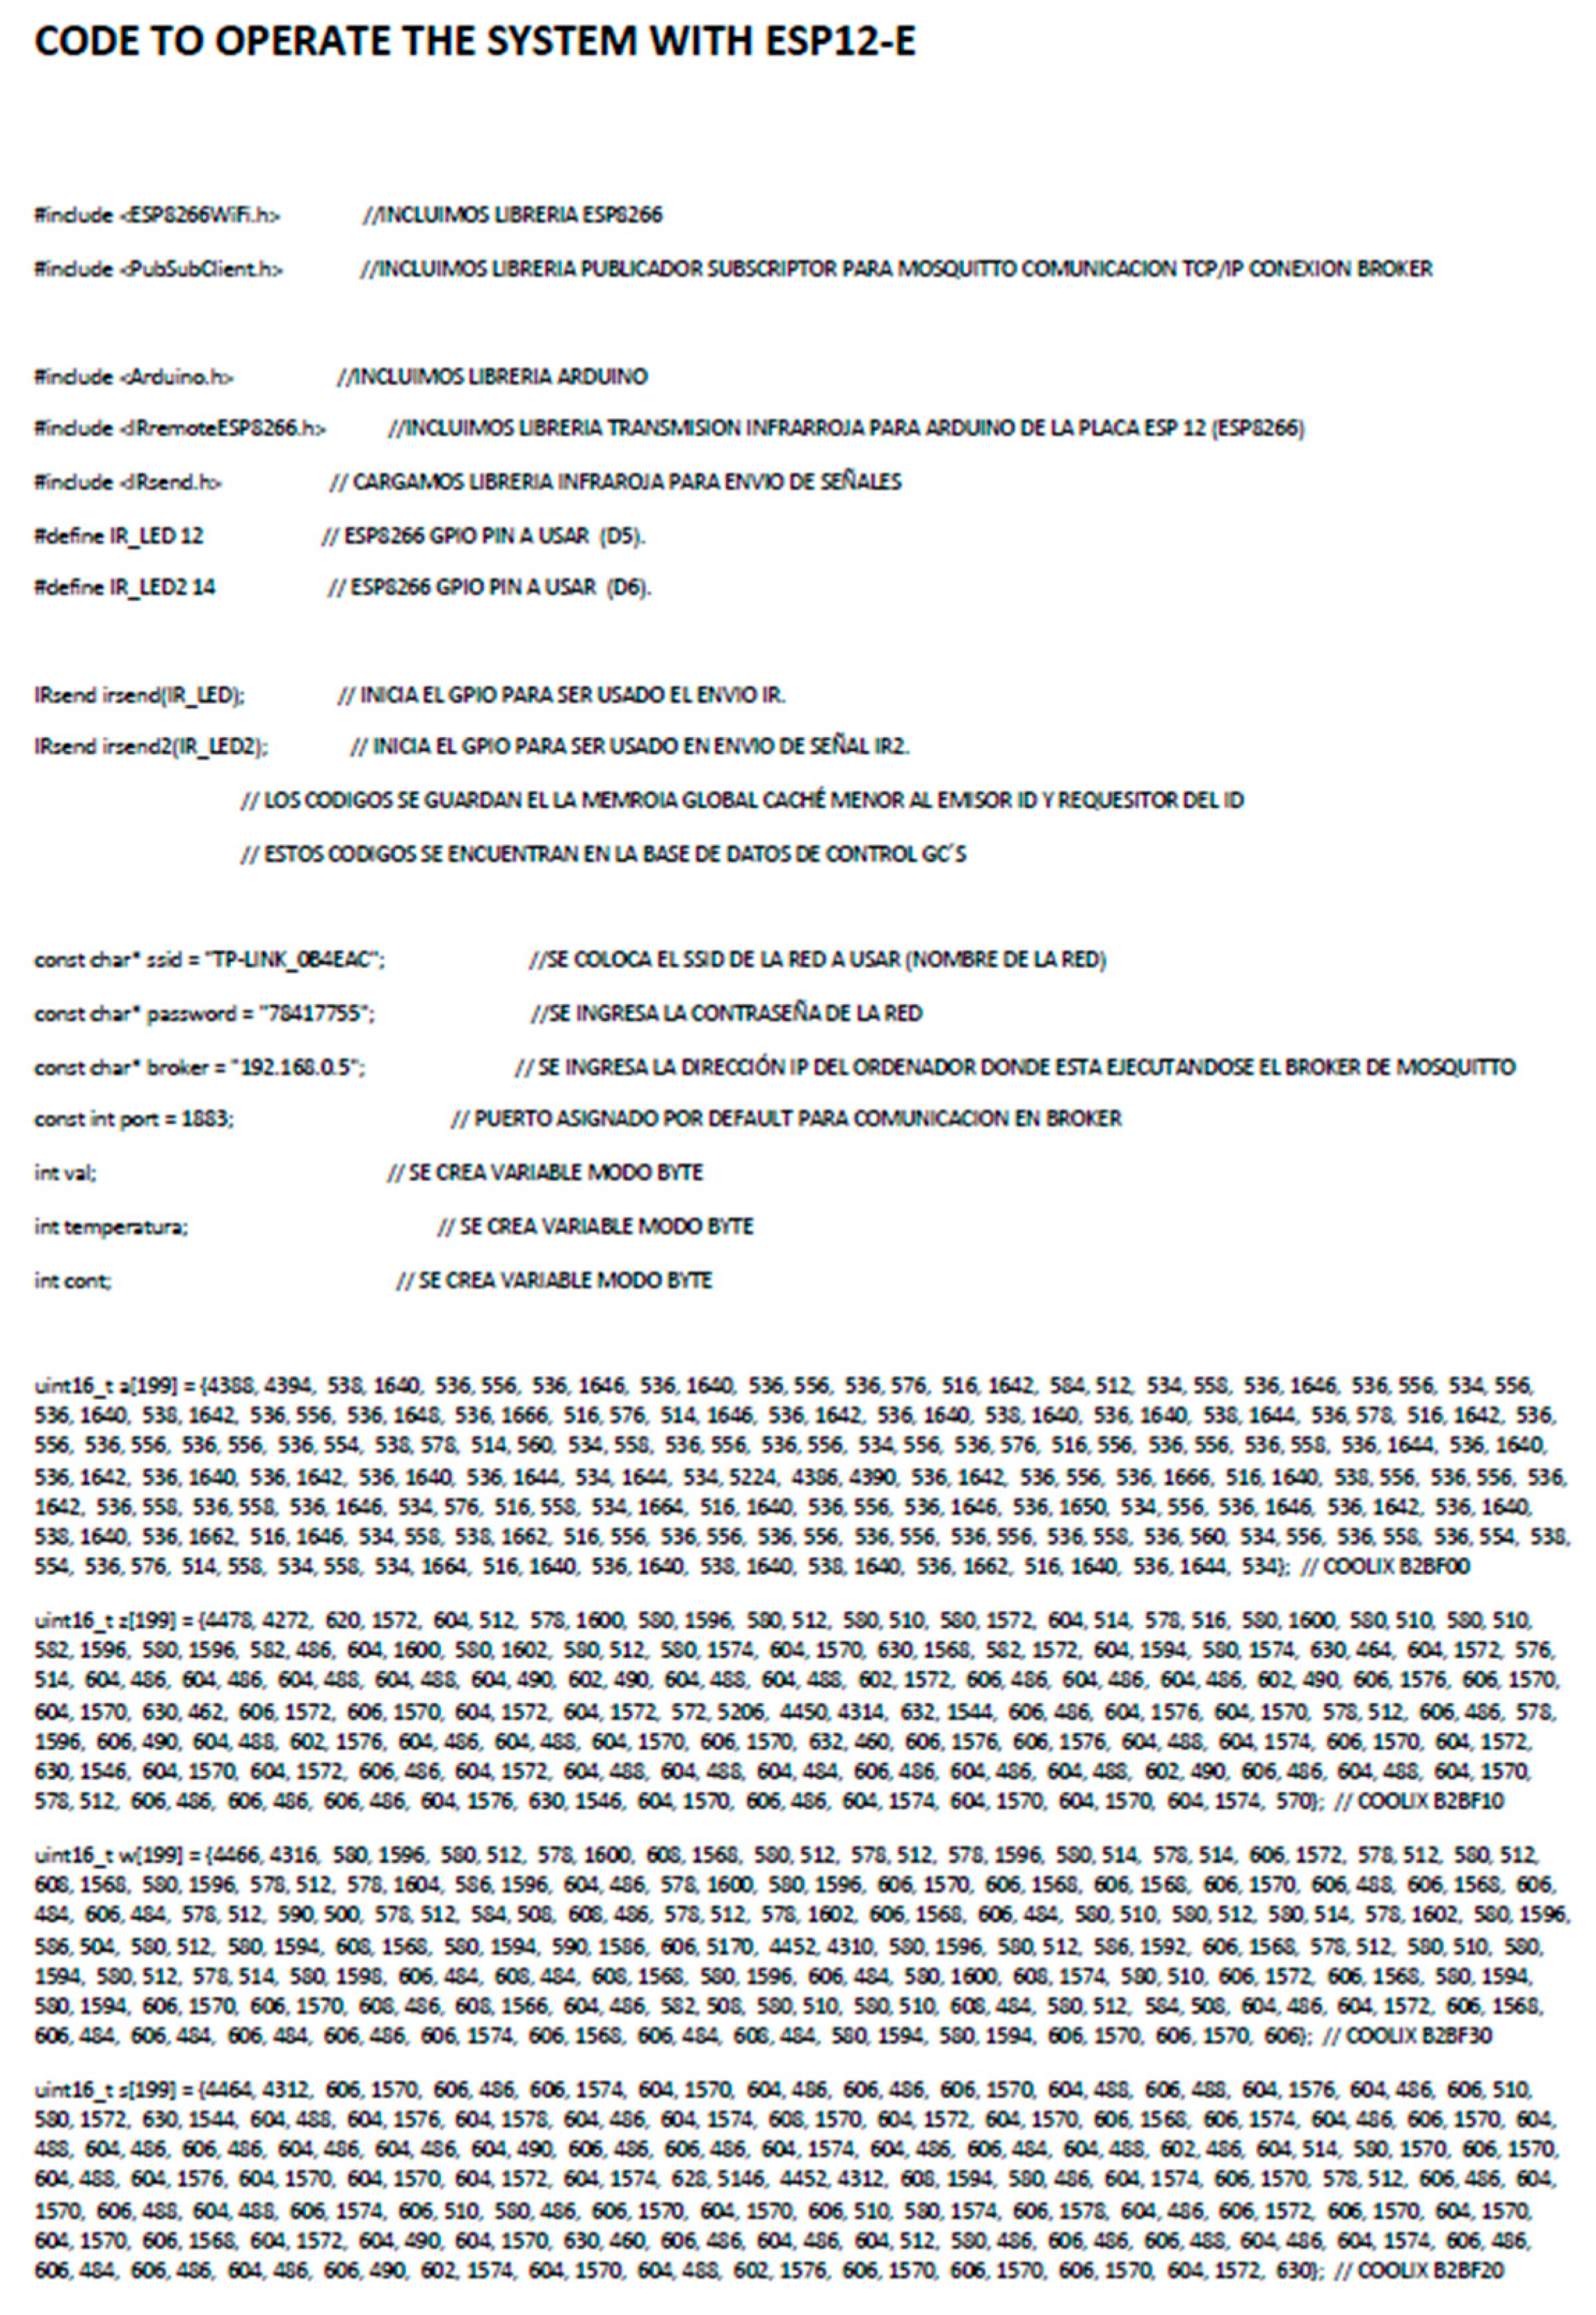
Once the libraries are loaded, the development of the code begins by defining two variables using define, and subsequently, they are initialized as infrared signal transmitters with the IRsend declaration, initializing the General Port Input and Output (GPIO); in this way, the D5 pins and D6 (IR_LED 12 and IR_LED 14) will function as outputs for sending infrared signals. Figure 15 shows both the libraries used, as well as the last two lines of code described.
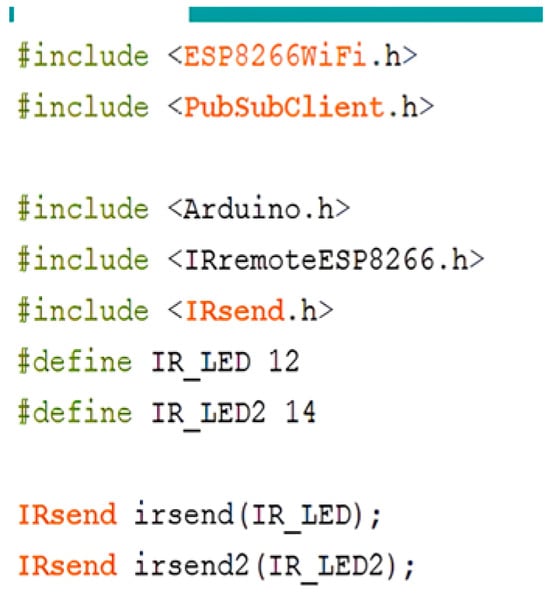
Figure 15.
Libraries and declaration of outputs on the NodeMCU 12-E board for the emission of infrared signals to the mini-splits. Source: Own elaboration.
Later in the code, it is essential to consider connectivity with the local network for the developed code. The coding used for this is described below:
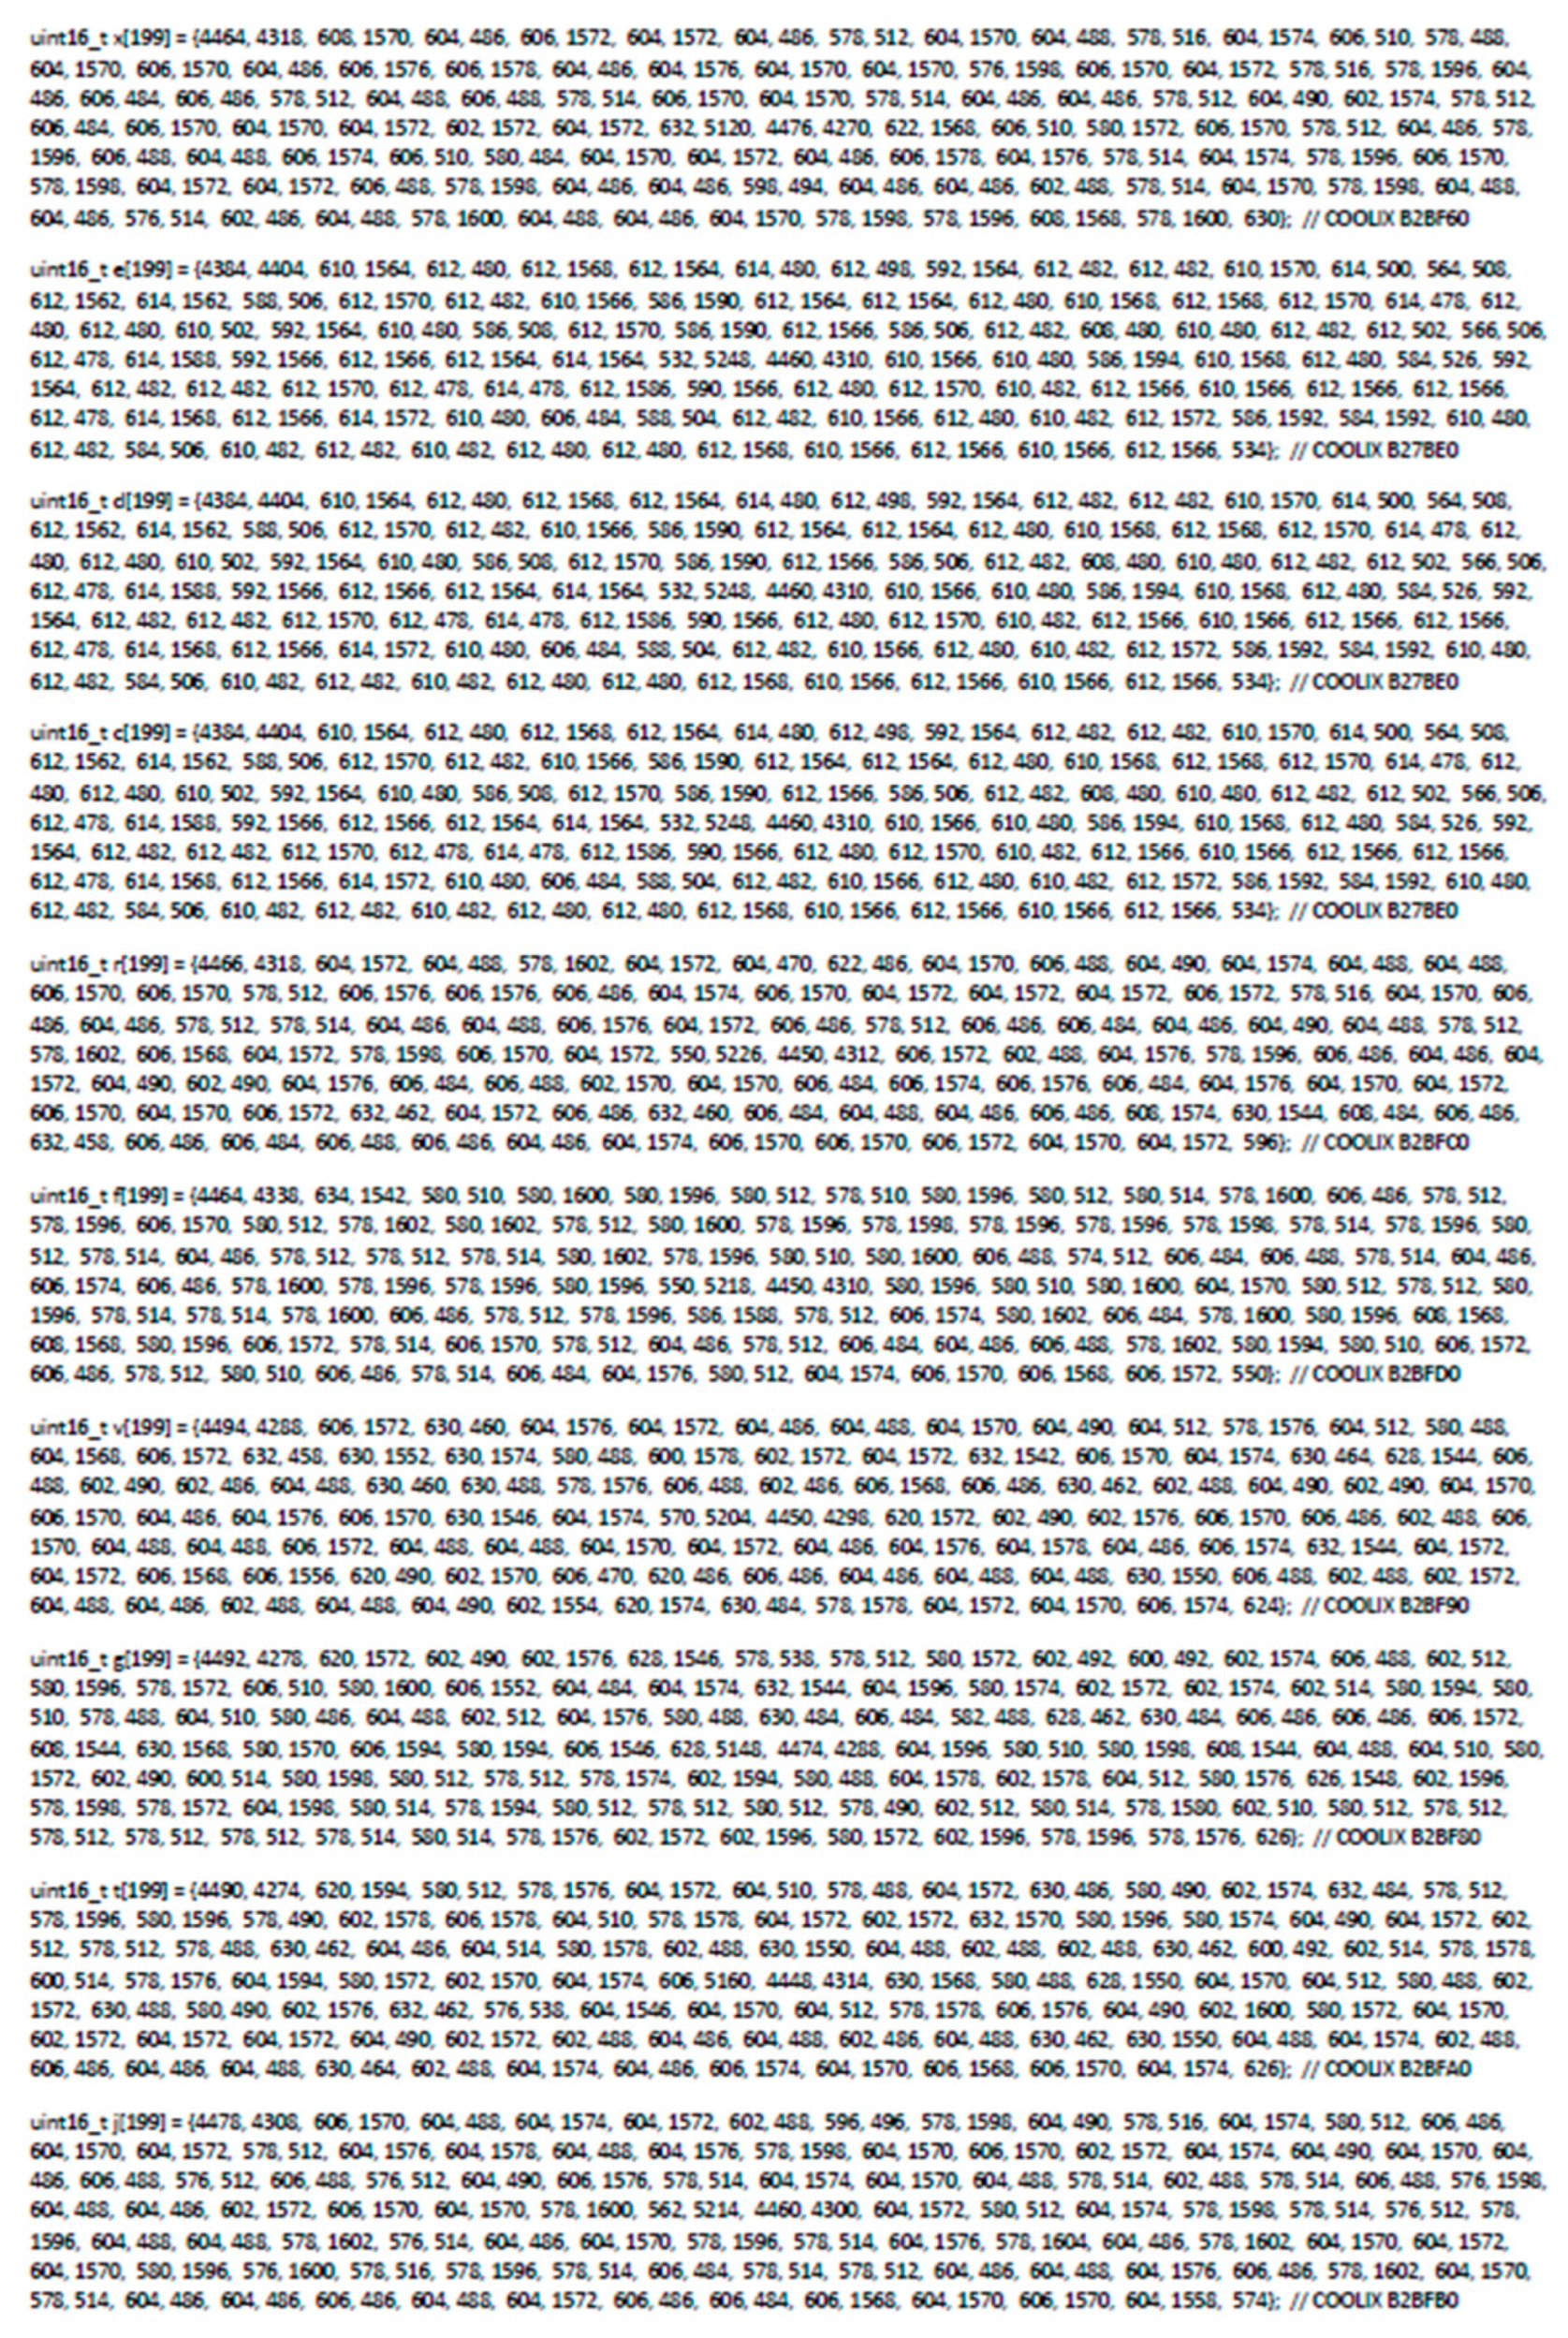
The const char declaration defines the network to use for a Wi-Fi connection, establishing the SSID (Service Set Identifier) of the modem, the password, and the address of the broker to the port to use. An int input constant, called “temperature” and “Val”, is also enabled for data storage, concerning the variable “cont being” created for subsequent adjustments in values received from the broker and to resolve appropriate emission times for infrared signals. The “uintl6_t” variables are used due to their type of data storage and their only admission of integers. These are declared to define the infrared signals to be transmitted (Raw’s), previously decoded from the Mirage control of the mini-split; in this section, 14 variable will be used in the code, assigned the letters “a” through “j”. These will define the degrees in which the Mini-Split operates (17 °C, 30 °C). It is important to mention the operation of the variable “e”, “d”, and “c” corresponding to 22 °C, 23 °C, and 24 °C; their code has been changed to the “off” signal, as they are within a comfortable temperature range. When capturing temperatures that are not in this range, the system will emit the value to the plate and turn on the Mini-Split, renewing temperature conditioning. This simple but efficient system produces energy savings in the system. Figure 16 shows the code described.
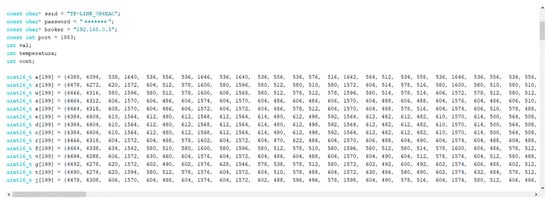
Figure 16.
Declaration of the 14 variables to control the Mini-Splits using infrared signals in Arduino IDE. Source: Own elaboration.
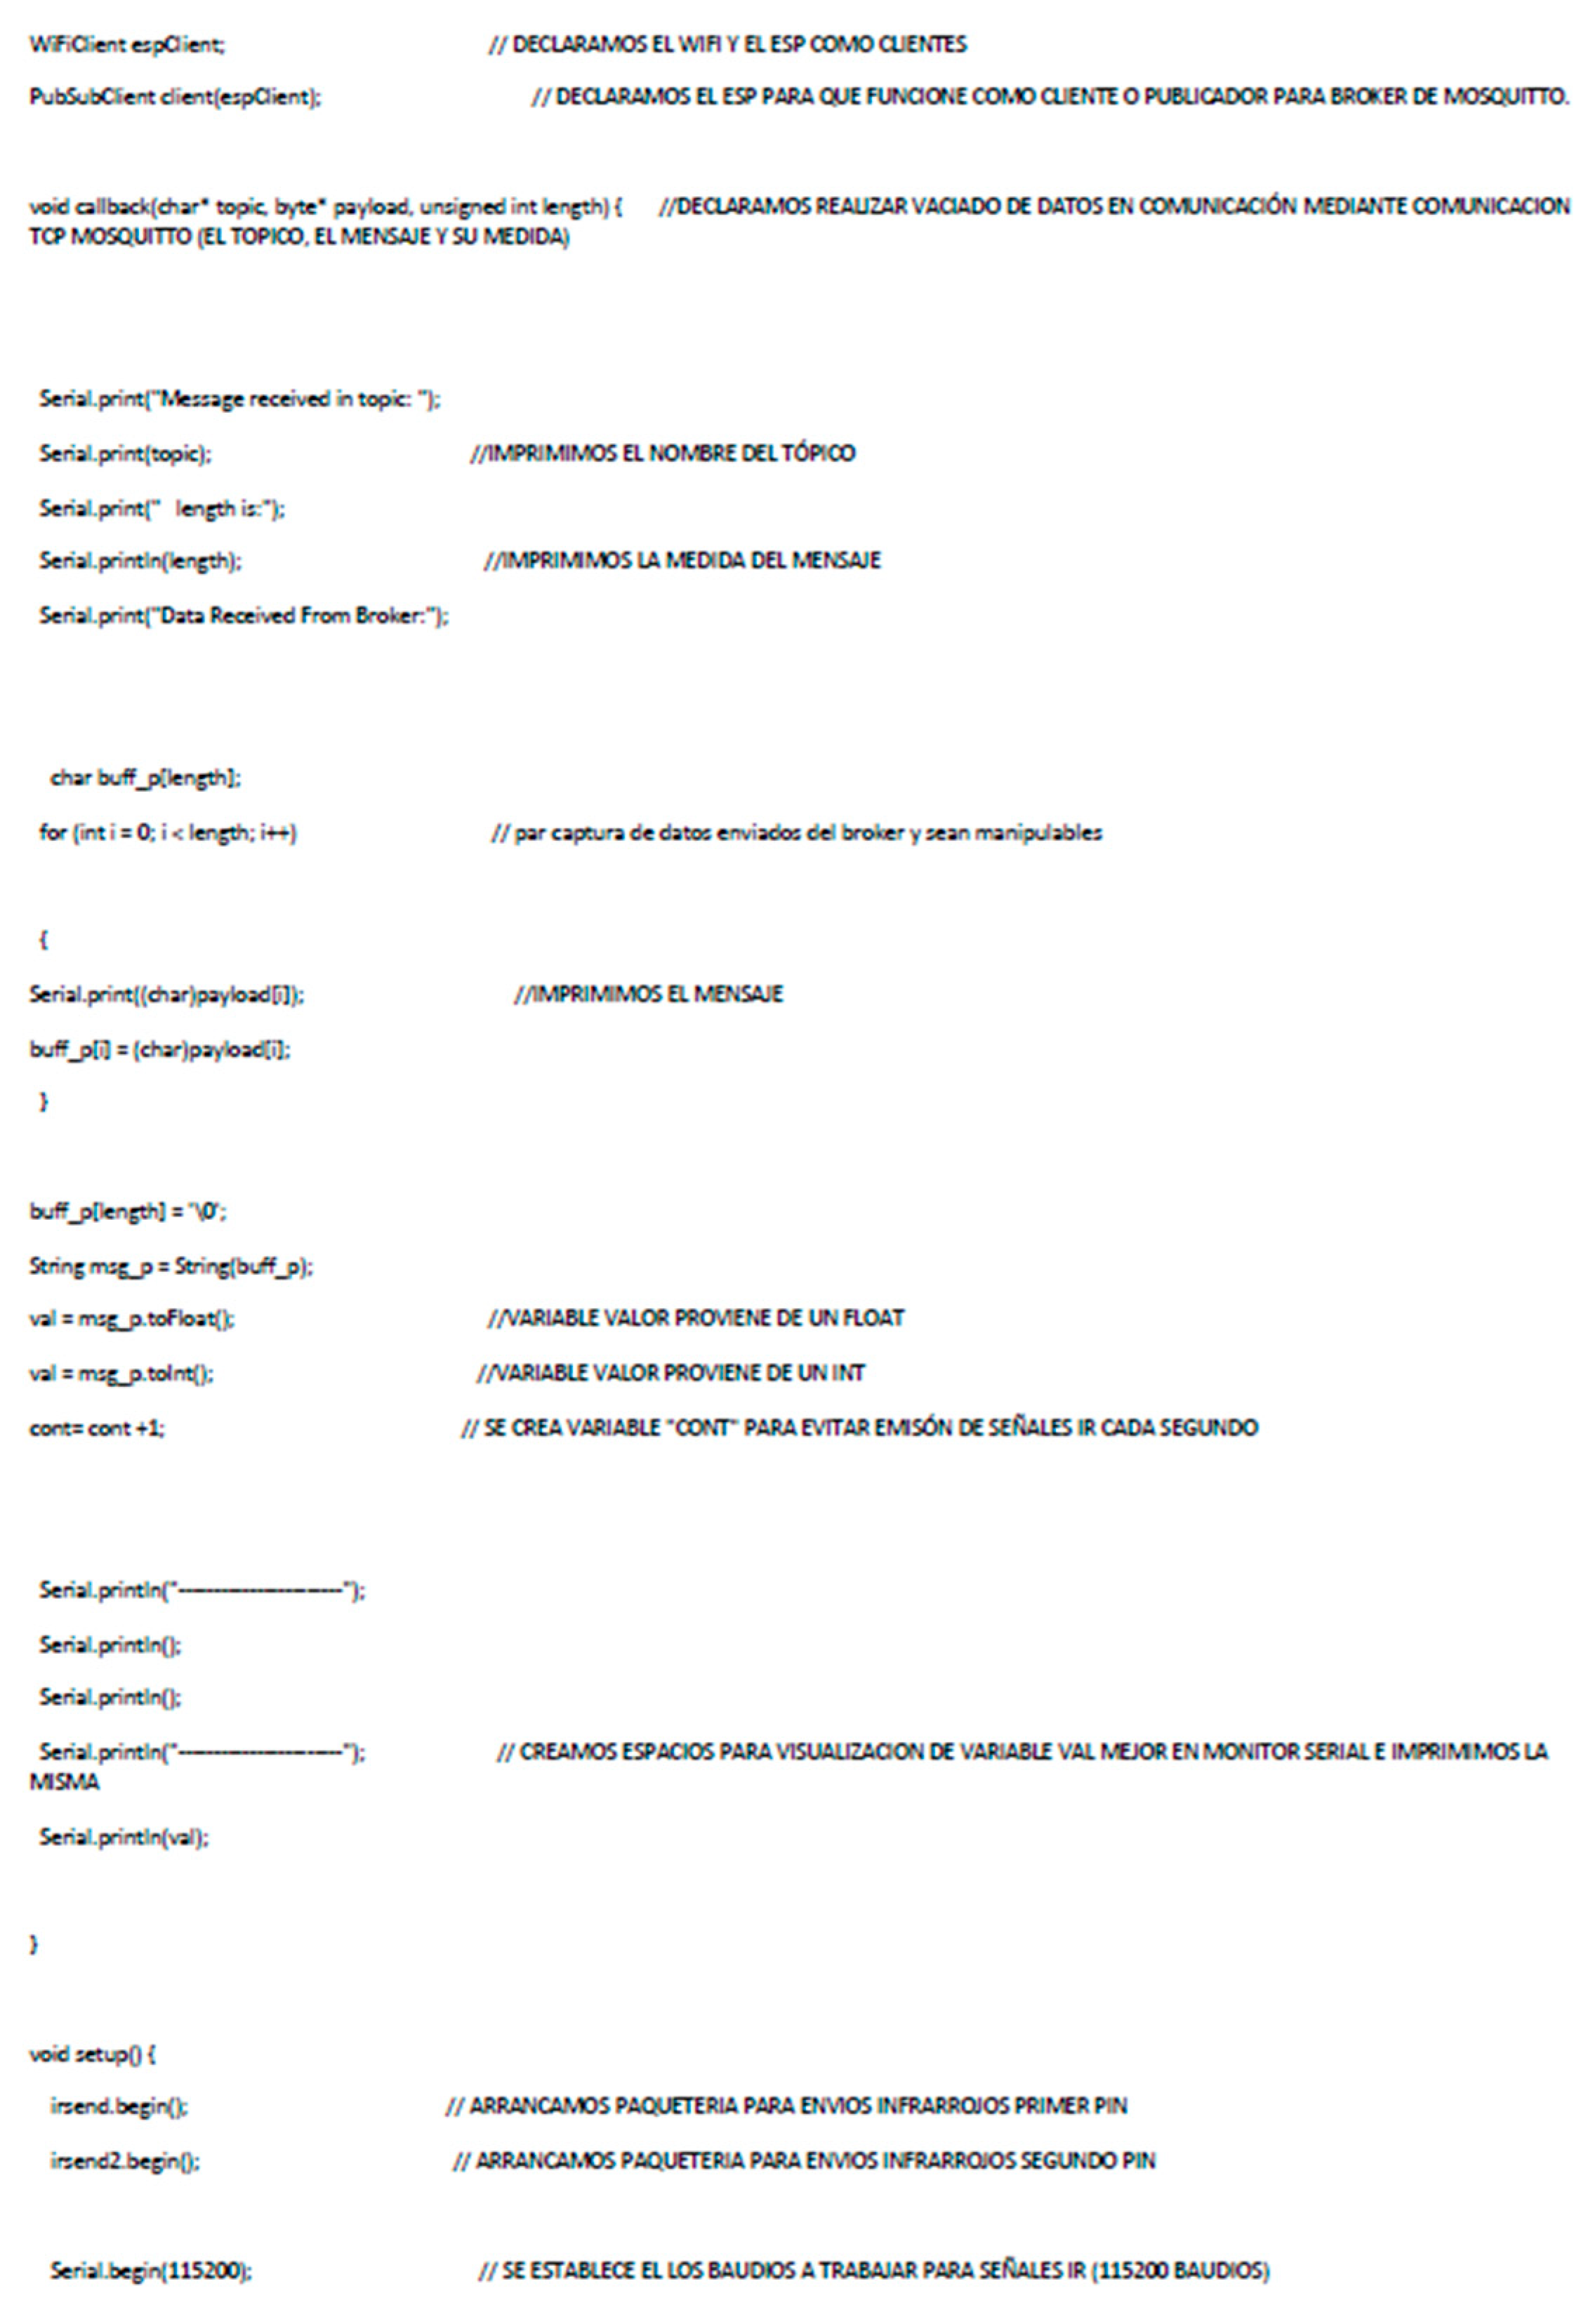
Additionally, Figure 17 shows the declaration of the ESP12-E board, as well as a subscriber to the Mosquitto broker via Wi-Fi. Regarding the declaration called Void Callback, it will work to empty the information transmitted to the Mosquitto program broker, consisting of the topic, the payload message, and its size through the unsigned int variable. Finally, the instruction declared with “Serial.print” will indicate the transmitted topic, the topic message, its measurement, and the reception of data issued by the broker, and through the “SerialPrintln” command, it will be displayed in the Arduino IDE interface.
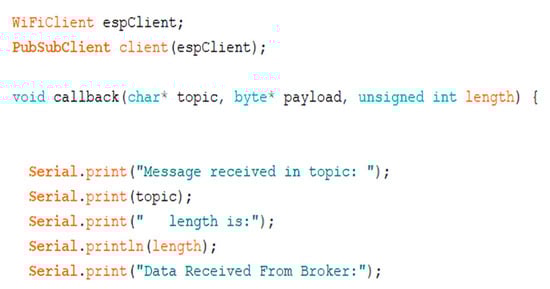
Figure 17.
Statement of instructions before Void Setup and Void Loop. Source: Own elaboration.
Concerning Modbus TCP/IP communication, the data sent from the Mosquitto broker needs to be converted into continuous integers with the corresponding measurement. The char variable “buff_p” performs the function of collecting the information sent from the Mosquitto broker (integers, letters) and the length of the message. Subsequently, through a “for” loop to execute the variable “i”, starting at “0” up to the length of the message from the broker, to store it in the variable “buff_p” in “i”, the value from the broker is stored. “payload”, ending the “for” loop, it is necessary after the “for” loop to declare it “0”, for optimization purposes in its length, by creating the variable “msg_p”, the data conversion is declared in a “String”, converted by the instruction into a “vector”. The variable “value” is generated to store the data converted to a string in a single character or unit and be used in the loop of the code. Another conversion is also necessary, assigning it as an “Int” to create the data in integers and store them in the variable “val”. This section concludes by declaring the variable “cont”, adding a unit to it to record the number of executions about shipments made from the “broker”.
Executing the instructions shown in Figure 18. The data coming from the broker in the Mosquitto software can later be used for comparative purposes in the “loop” cycle.
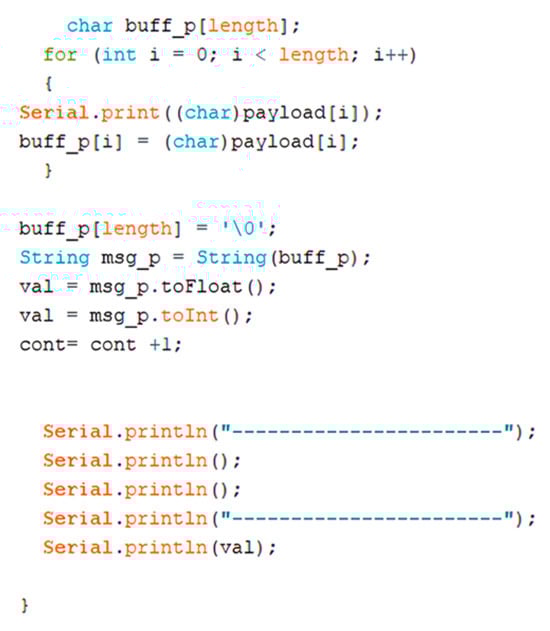
Figure 18.
Declaration of variables, integers, and cycles for decoding and processing of data transmitted from the Mosquitto software broker. Source: Own elaboration.
Void Setup Loop Encoding
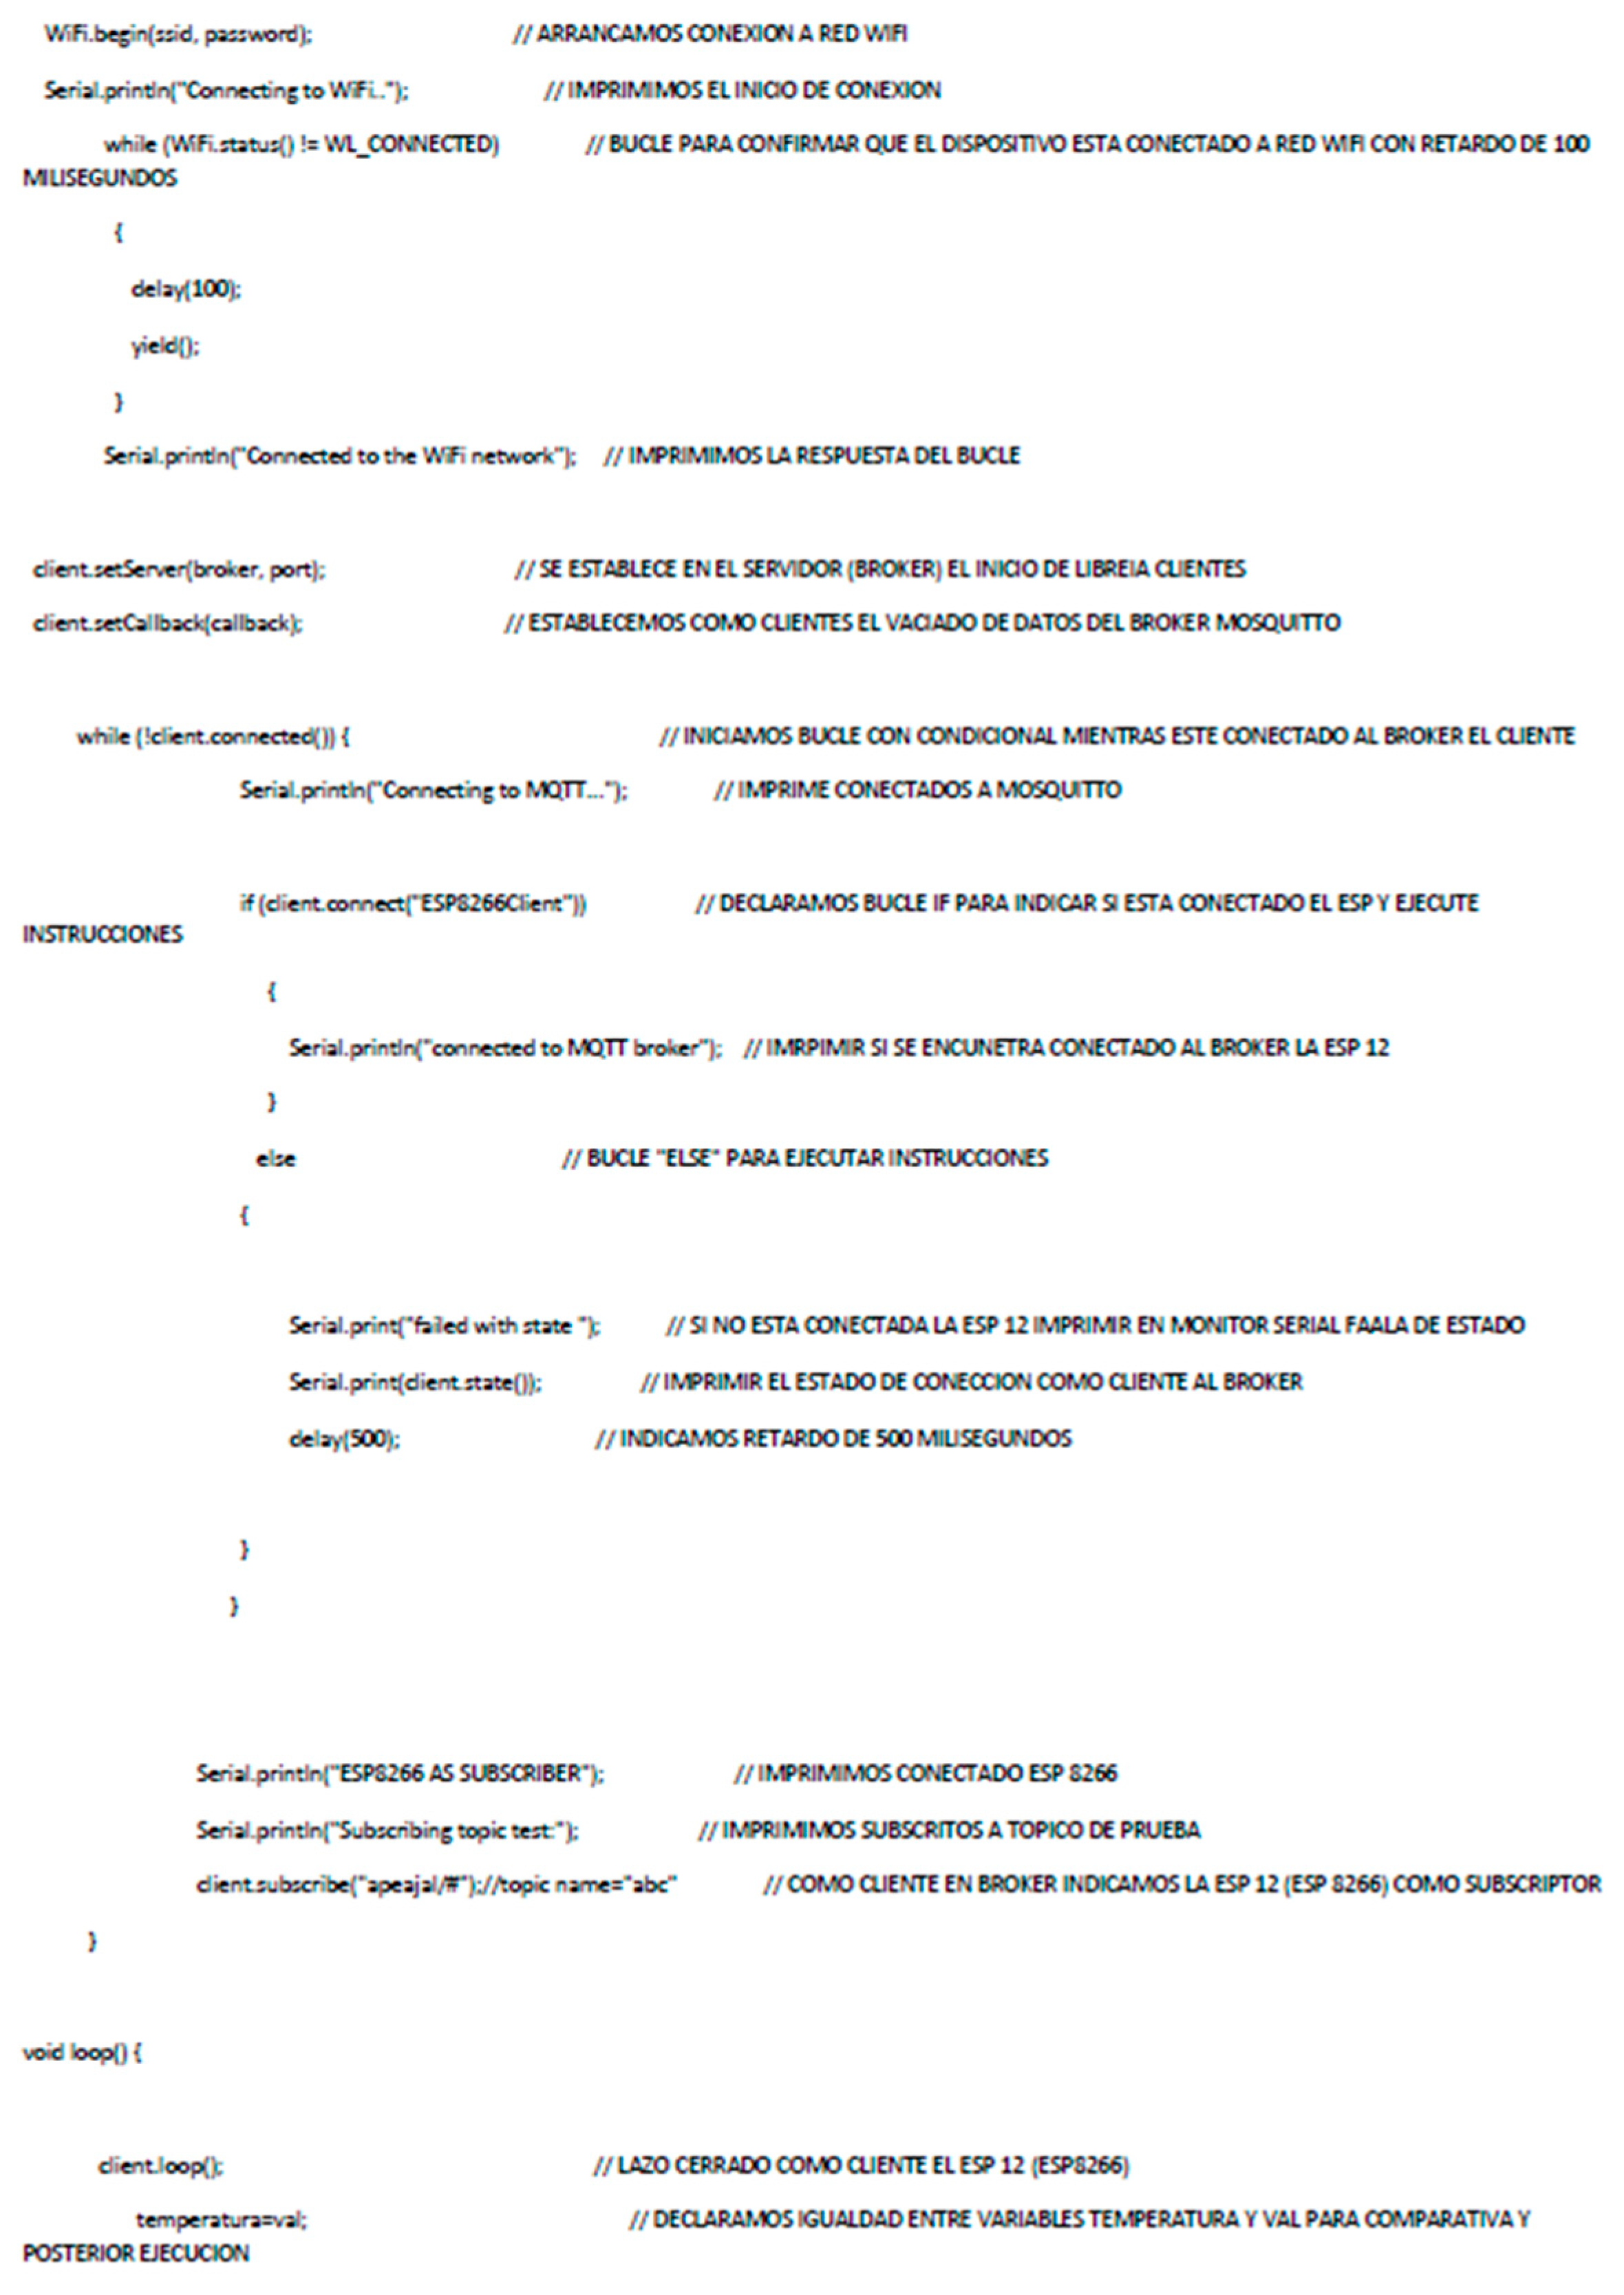
Once functions, global variables, cycles, and libraries have been declared, the “Void Setup” section is programmed with the instructions for starting the data packet to send infrared signals for outputs D5 and D6 on the NodeMCU ESP 12 board. E, (irsend and ir-send2), the processing speed is configured at 115,200 baud, the connection to the Wireless Network is configured, and the connection status is printed on the Arduino serial monitor. In addition, a “while” cycle is generated, generating a reconnection process every 100 milliseconds and printing a message to verify the action with the phrase “connected to wifi network”. After concluding the “while” cycle, the connection is declared to the Mosquitto broker and the emptying of data coming from it using the “callback” instruction takes place once the board is connected to the Mosquitto broker. Figure 19 shows the coding described above.
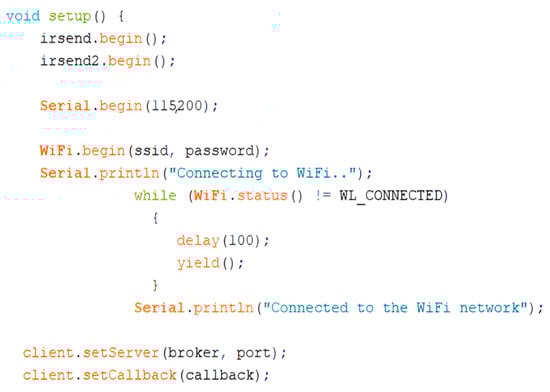
Figure 19.
First part of coding in the Void Setup section of the system. Source: Own elaboration.
The Void Setup section is the last section of the code developed for TCP communication and sending infrared signals from the ESP 12-E board. Through a “while” cycle, various instructions are generated to be carried out while the board maintains the connection to the Wi-Fi network. The current state and connection status of the board to the Mosquitto broker as a subscriber are printed on the Arduino serial monitor in the “tecnm” topic, as shown in Figure 20; otherwise, using the “else” command, it will print the legend “failed with state” to physically check the connection status of the ESP board 12-E.
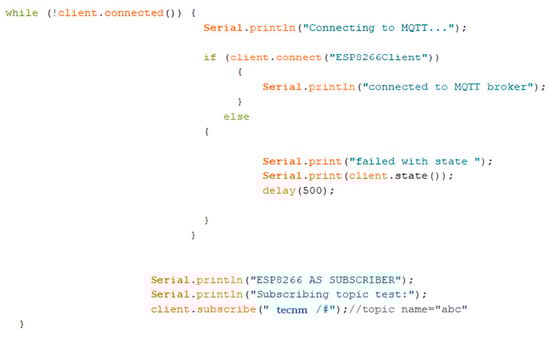
Figure 20.
The second part of coding in the Void Setup section of the system. Source: Own elaboration.
Void Loop Cycle Encoding
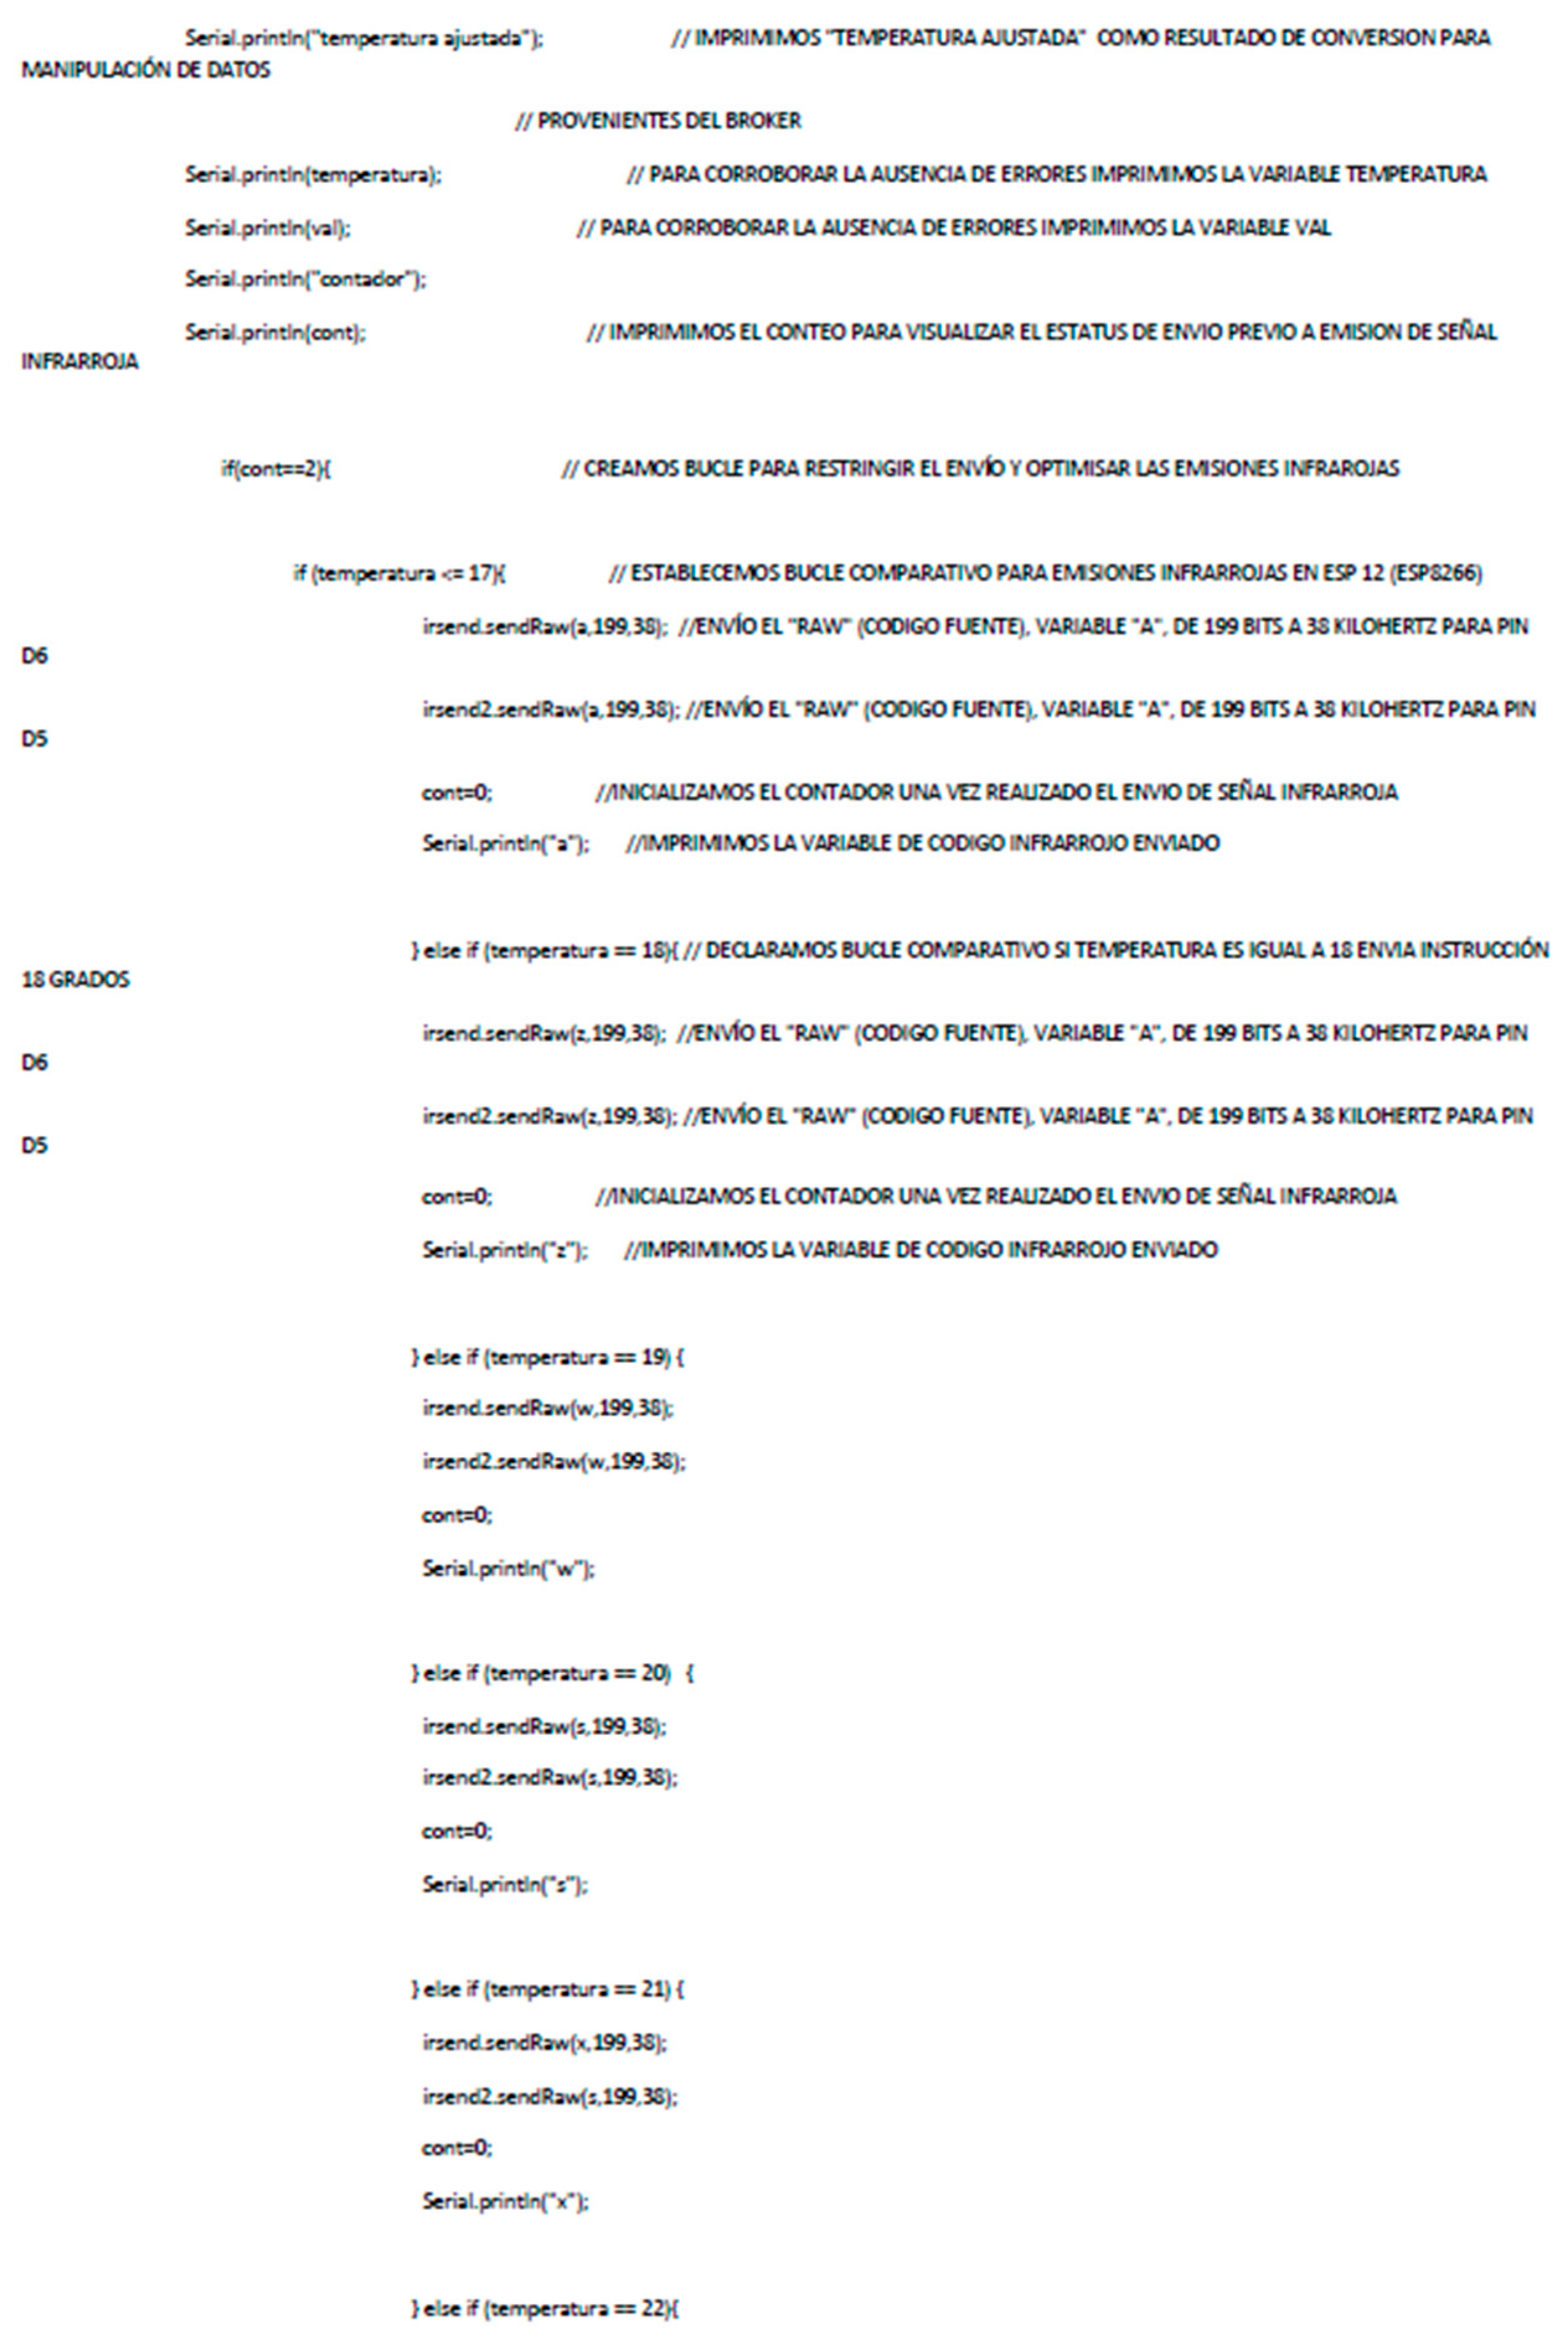
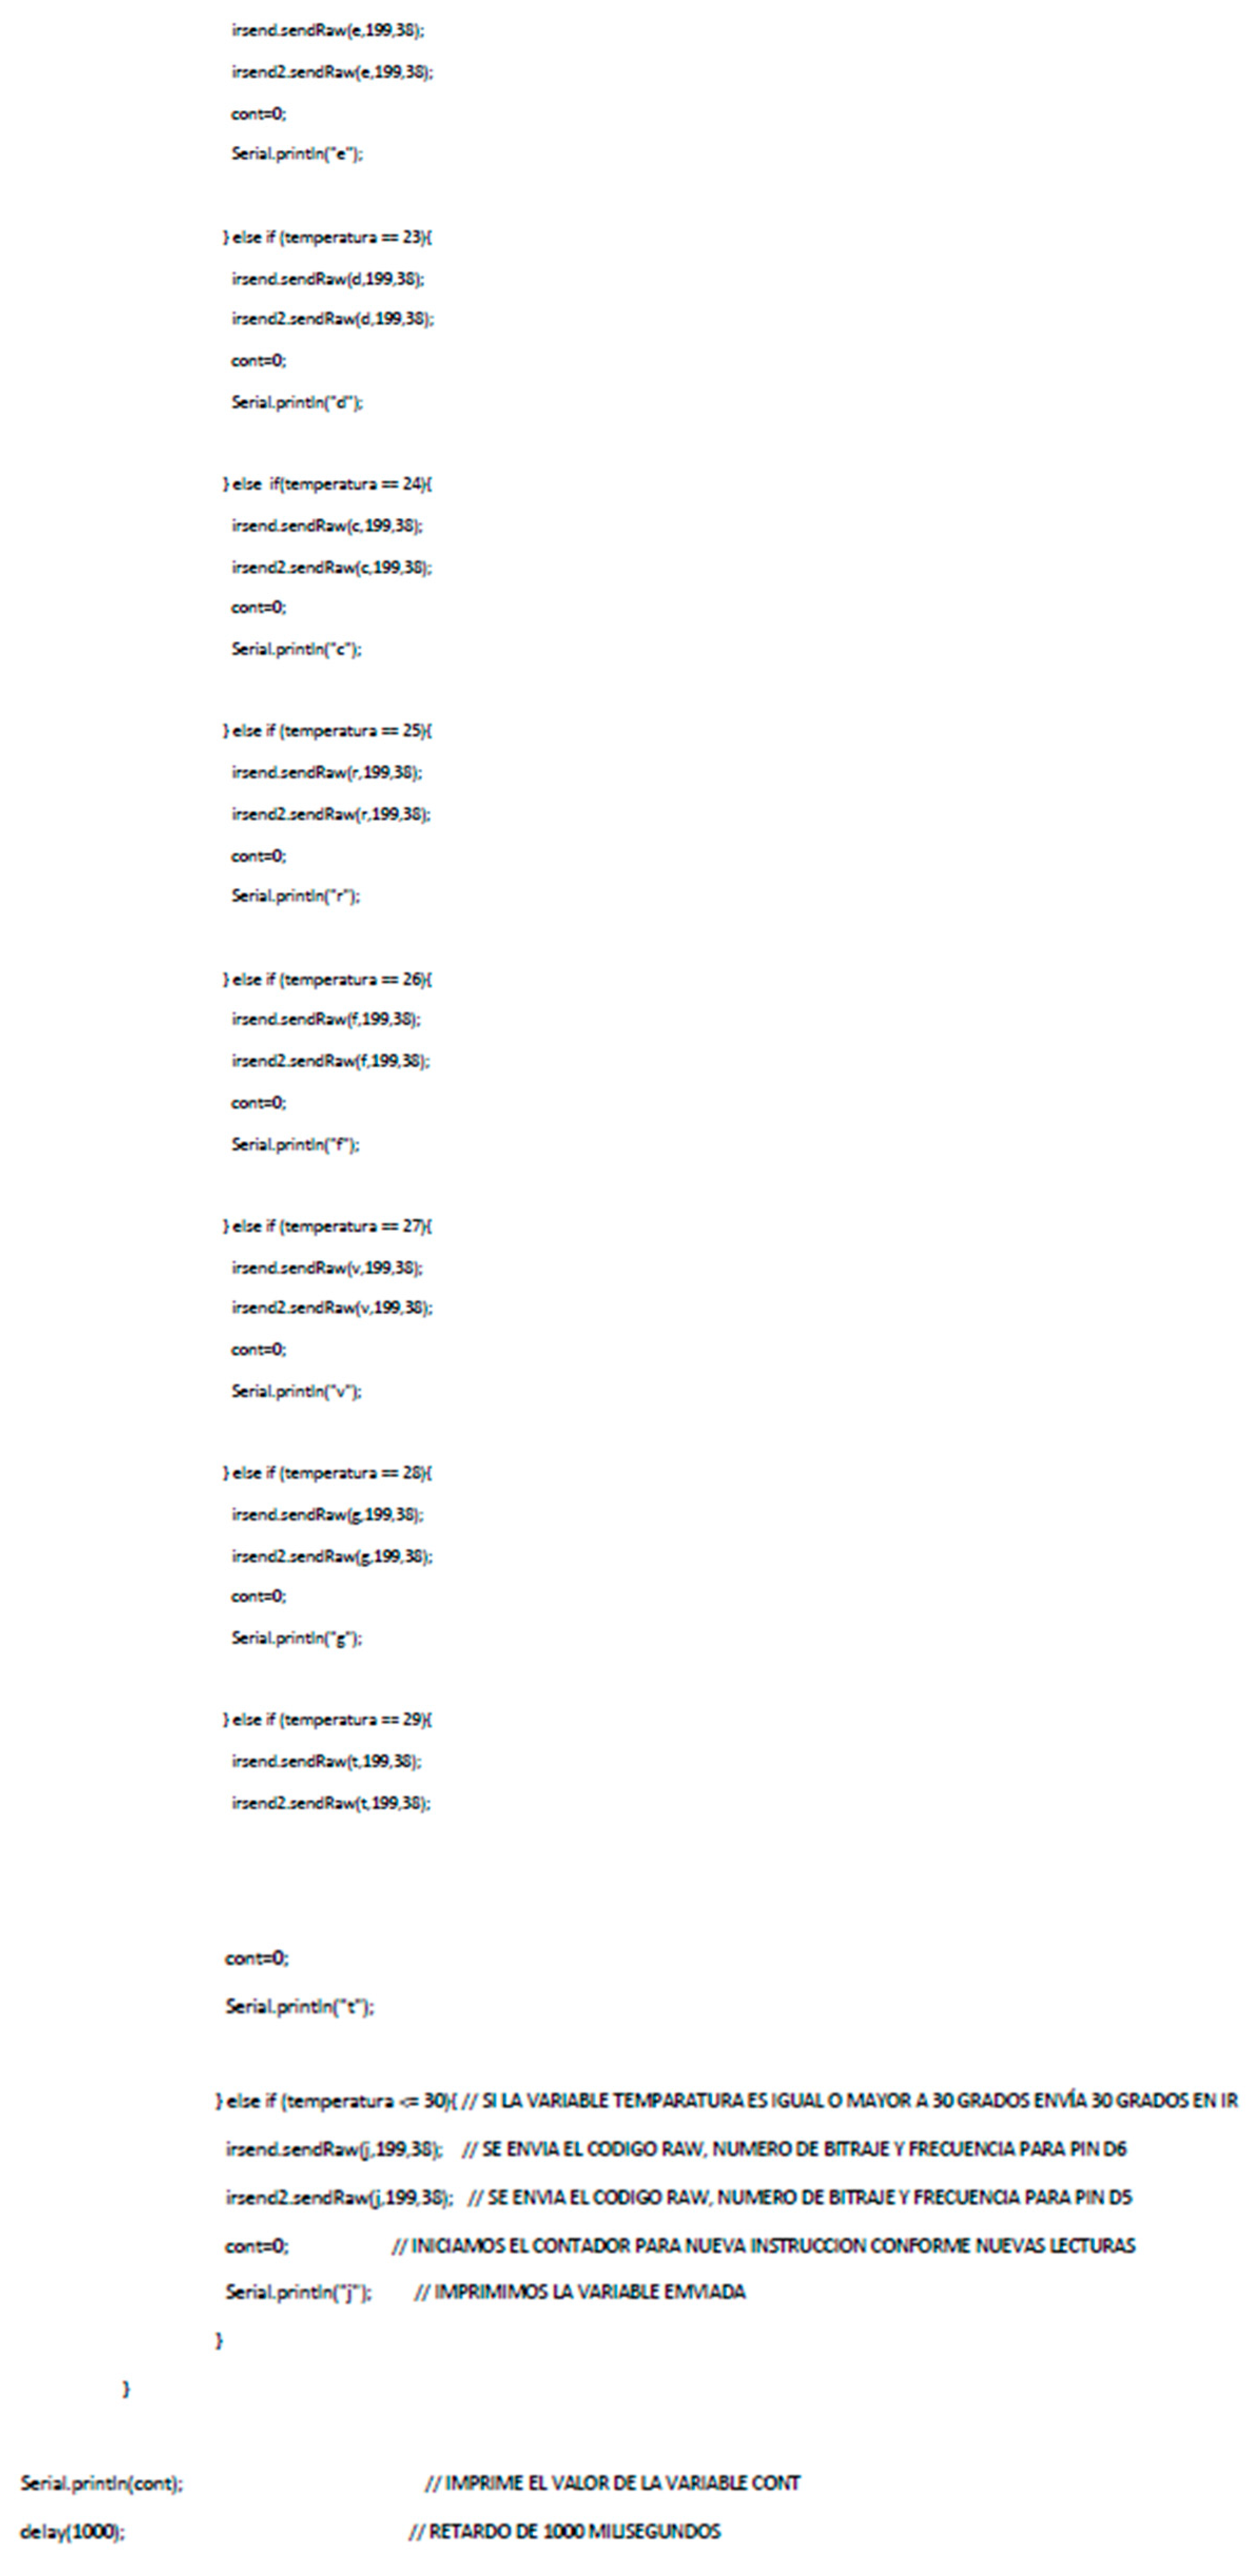
Regarding the “Void loop” section, it is developed to generate instructions repetitively in any programming carried out. First, the data received as clients (subscribers) will always be developed cyclically with the declaration “client.loop()”. Then, the variables temperature and “value” are declared an equality. Regarding the printing of the variables using the code “Serial. Println”, it is declared to show the programmer the status of the information. Through an “if” cycle, the sending of consecutive infrared signals is restricted, as can be seen in Figure 21, avoiding sound responses from the Mini-Splits every second of transmission when they are implemented, achieving an adequate sound environment for the users. Once the “if” cycle has been resolved (counting in 2 data receptions and their respective processing from the broker), a second “if” cycle is executed to compare data transmitted from the PLC issued by PI Control and condition the temperature. Starting at value 17, in this way, the values of the PI controller will be sent to the mini-splits, and at the assigned values of 22, 23, and 24, the “off” instruction is sent, and when they are values different from those previously determined, they are turned on and temperature conditioning begins through closed-loop control. This simple but efficient strategy achieves control and automation of the process; the complete code described is found in Appendix A.
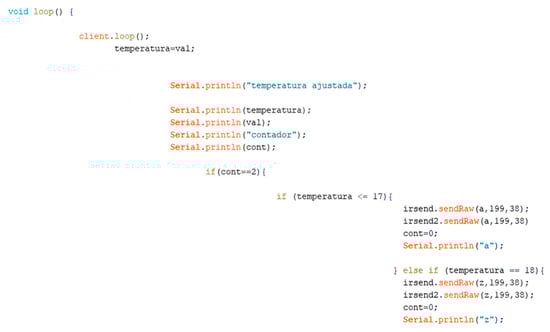
Figure 21.
First part of the Void Loop coding for the developed system. Source: Own elaboration.
Through this cycle, the infrared signals are transmitted equally to the PI control at outputs D5 and D6 of the ESP 12-E board. Subsequently, the two infrared LEDs will emit the signal to the two mini-splits, converting the system into a closed loop.
Phase 4 System Energy Consumption Readings
The installation of the Sonoff Pow R2 meter will provide readings without the use of the system and subsequent implementation and functioning, due to its commercialization, and it becomes an easily accessible and reliable option. In addition, it guarantees legitimate and real readings, without the option of modifications of the device or application.
The space used for temperature conditioning has 2 load centers; each Mini-Split is fed to a load center. The connection of the Sonoff Pow R2 consumption meters will be in the same context, one for each device. Figure 22 shows the connection made to a load center with the Sonoff Pow R2 energy consumption meter.
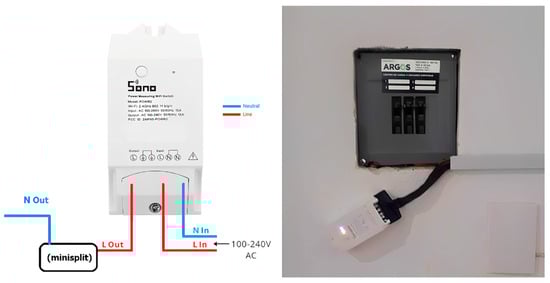
Figure 22.
Elaborate connection to the charging center with the Sonoff Pow R2 device. Source: Own elaboration.
3. Results
The expected results were obtained in terms of data processing, transmission, and communication between the devices and software used. The system processed the variables and data with a response of 1500 milliseconds, which is favorable for the type of system developed, due to the proportional integral (PI) control used to regulate the interior temperature of the required space []. The results and verifications that will be presented in each software interface of each developed phase and subphase of the system, as well as its connectivity and data processing, are described and verified both textually and in Figures 24–28 described in more detail below. Continuation:
- PLC Logo 8: Temperature capture with PT100 sensors and processing in PI control. After initializing the readings and processing the temperature signals by the PT100 sensors (shown in the green rectangle), the processing in the PI control generates the expected result or setpoint to send the setpoint to the Node-RED software, visible in the yellow box. The product is then output for transmission using block AM1, shown in the red rectangle in Figure 23.
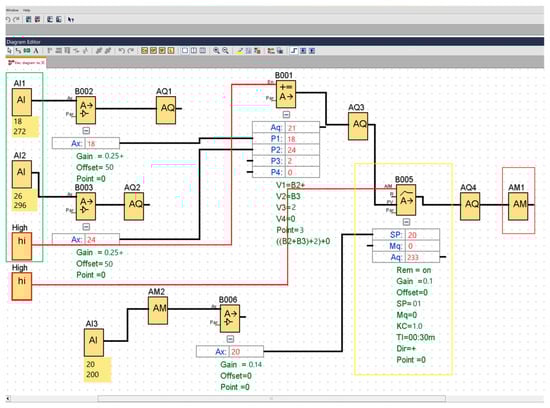 Figure 23. Signal capture and PI control processing in Siemens PLC (the green box shows the signal inputs, the yellow box shows the PI control, and the red box shows the signal output processed by the PLC). Source: Own elaboration.
- Node-RED: Data reception, processing, and transmission to the Mosquitto software (MQTT). The diagram and configuration of the Node-RED software installed on the Raspberry Pi 3+ were executed properly, receiving the temperature value emitted from the PLC to the Mosquitto software. Figure 24 shows the information reception block, the processing and coding block, and the emission to the Mosquitto software. The software results and computation of connectivity are shown by the software through a blue circle at the top of the nodes, indicating active processing, and a green rectangle indicating established connectivity with both the Logo PLC and the ESP 12-E board.
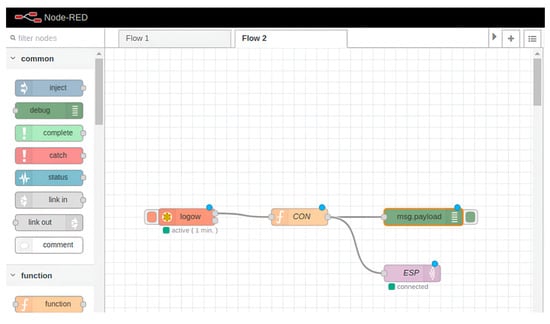
Figure 24.
Node-RED software operation on Raspberry Pi, reception, processing, and transmission to Mosquitto software. Source: Own elaboration.
- Mosquitto Software: Communication and data transfer. The software function was satisfactory when initializing TCP/IP communication port 1883 on the local network. The reception of the data packets from Node-RED, their processing and emission to the software broker, and the corresponding data transmission to the ESP 12-E development board were carried out properly. Figure 25 shows the expected result, indicated by a red rectangle both for connectivity and proper operability of the software and devices.
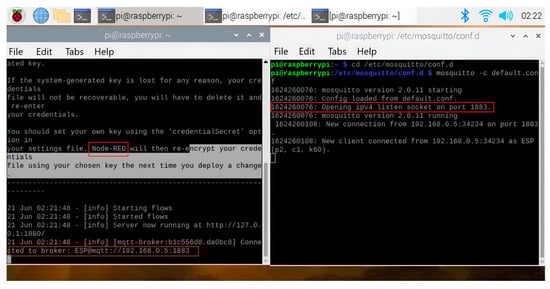
Figure 25.
Connectivity between Node-RED software and Mosquitto software through port 1883 (the red boxes show both the use of the Node-RED software, the port 1883 enabled for listening and the connection of the IPV address to the Mosquitto broker). Source: Own creation.
- NodeMCU ESP 12-E board: The connectivity of the NodeMCU board to the Mosquitto broker on the Raspberry Pi 3+ and the developed code were verified in the Arduino programming software interface, without errors. Figure 26 shows the favorable connectivity and error-free code compilation for the NodeMCU ESP12-E board through the red rectangle located at the bottom of the figure.
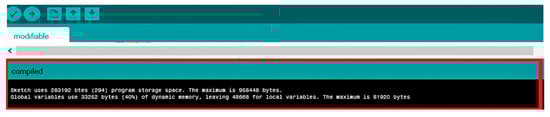
Figure 26.
Compilation of code developed for the operation of the system in the Arduino IDE for the ESP-12E board. Source: Own elaboration.
Once the system was implemented, the data transmission from the PI control was satisfactory, ranging from processing to execution on the ESP 12-E board. In addition, it is possible to monitor the operation of the system through the preconfigured IP address to the PLC in the local network, Figure 27 shows the display interface preloaded on the device, showing the network outputs used in the PLC block diagram, including the 2 PT100 sensors, the output of the PI controller, the product of the arithmetic operator, and the value of the assigned automatic setpoint of 24 °C, as well as the PI control graph for proper monitoring in real time, checking both processing and connectivity, data transmission, and completing the closed-loop system of the entire project, including the two mini-splits.
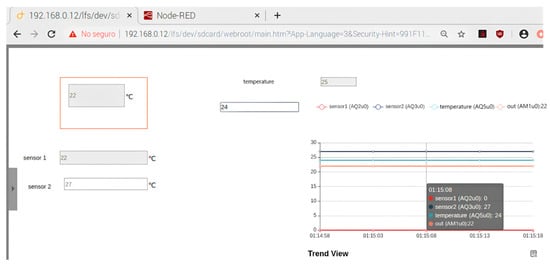
Figure 27.
System and interface functioning as a closed loop in the space to be temperature conditioned. Source: Own elaboration.
Two energy consumption measurements were made. The first was carried out with the devices working and being manipulated by the users of the property for a period of 30 days. The second measurement was carried out by implementing the system to generate closed-loop control and avoid manipulation by the user, operating only within a 6 h daily schedule. The measurements were carried out using the Sonoff Pow R2 device to guarantee the veracity of the readings. Next, Figure 28 shows the measurements of the energy consumption of the mini-split without the use of the developed system.
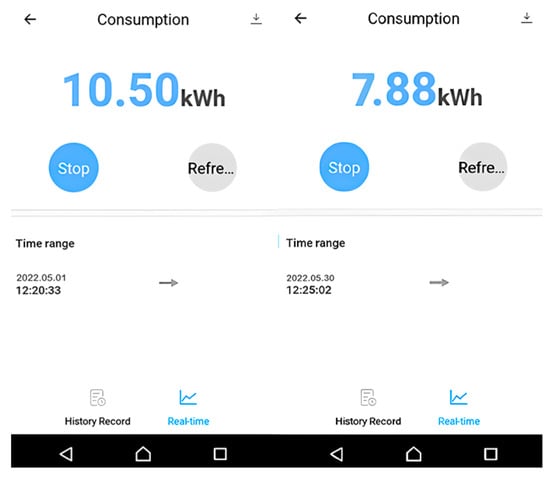
Figure 28.
Measurements of the Sonoff Pow R2 device WITHOUT the use of the developed system. Source: Own elaboration.
As shown in the figure above, the total consumption of the two mini-splits for temperature conditioning is 18.38 kWh over 30 days. Subsequently, the system developed to generate closed-loop control and avoid user manipulation was installed. After 30 days, the energy consumptions were extracted, and the results are shown in Figure 29.
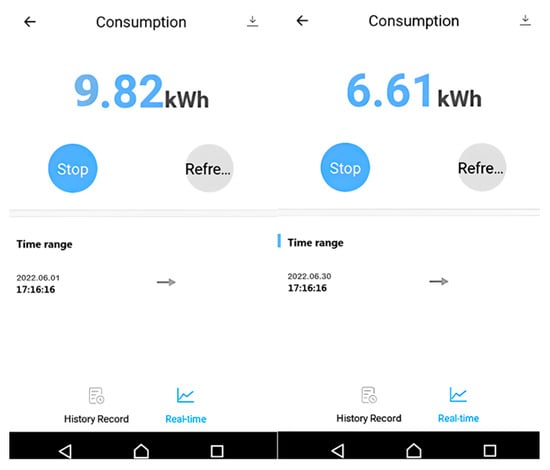
Figure 29.
Measurements of the Sonoff Pow R2 device running the developed system. Source: Own elaboration.
At the end of the energy consumption captures, a total of 16.43 kWh was obtained from the complete system for temperature conditioning during the period of use. The study presents a comparative analysis to demonstrate the energy savings obtained by implementing the system.
Table 1 presents a comparison between the energy consumption obtained when using and not using the system developed for temperature conditioning. In the scenario without the system, the total consumption was 18.38 kWh, while with the implementation of the system, it was reduced to 16.43 kWh. This difference of 1.95 kWh shows significant energy savings, which highlights the effectiveness of the system in optimizing energy consumption.
Table 2 includes the individual consumption of the devices, where it is observed that device 1 experienced a slight reduction of 0.68 kWh (from 10.5 kWh to 9.82 kWh), and device 2 reduced its consumption by 1.27 kWh (from 7.88 kWh to 6.61 kWh). These results show how the implementation of the system contributes to more efficient energy management, which can generate a positive impact both in terms of economic savings and energy sustainability.
Table 2.
Comparative analysis of the energy consumption obtained using and without using the developed system. Source: Own elaboration.
This comparative analysis confirms the effectiveness of the system’s energy consumption terms and establishes a basis for future studies on optimizing energy efficiency in similar environments.
To support the results of the research, such as the 10.63% reduction in energy consumption and a decrease in operating costs, it is important to provide a detailed analysis of how these percentages were calculated and measured. Below is a breakdown to back up these results.
Energy consumption was measured before and after the system was implemented. The data collected showed:
- ○
- Consumption without the control system: 18.38 kWh (for two mini-split units over 30 days).
- ○
- Consumption with the control system: 16.43 kWh (for two mini-split units over 30 days).
The reduction in energy consumption is as follows:
This calculation shows a 10.63% reduction in energy consumption over one month. When projecting these savings for an entire year to obtain the annual energy savings, we obtain:
Operating costs include not only energy consumption but also maintenance, equipment useful life, and other indirect costs associated with the operation of the system, considering the analysis to be developed:
- The monthly energy savings for both units was calculated at 1.95 kWh.
- The annual energy savings for both units was calculated at 23.4 kWh.
- Energy cost per kWh in Mexico []: 0.17 USD/kWh.
- The annual economic savings for both units of 4.16 USD.
- The useful life [] of both units is considered 6 years.
In addition, operating costs also involve other efficiency factors, such as reduced failure rates, reduced need for user intervention (reducing wear and tear on devices), and overall optimization of system usage. These additional factors contribute significantly to the reduction in operating costs, leading to a decrease compared to pre-implementation operating costs. This percentage arises from considering that the system not only saves energy but also improves operational efficiency by reducing manual interventions, energy leaks, and wear of device components within the considered useful life period of 6 years for Mini-Splits. Below, the system analyses are shown under a constant scheme to define the reduction not only in energy costs but also in maintenance of the Mini-Split, considered a service every 5 months.
Regarding the calculation of the reduction in the operating costs of the system, the following is considered:
Adjusted energy consumption with all the improvements implemented (21.14 kWh/year), we will calculate the reduction in operating costs considering everything from the energy cost, maintenance costs (corrective and preventive), the reduction in equipment wear (extended useful life), to the reduction in downtime.
Reduction in energy costs:
- Energy cost per kWh: 0.17 USD.
- Annual consumption before improvements: 23.40 kWh.
- Annual consumption after improvements: 21.14 kWh.
Savings in energy consumption: 23.4 kWh − 21.14 kWh = 2.26 kWh/year. Therefore, when contemplating it and considering the energy cost, it results in (2.26 kWh) (0.17 USD) = 0.38 USD/year.
Another aspect to consider is the reduction in costs for both preventive and corrective maintenance, considering both the average repair (corrective) cost per unit at 15 USD and the frequency of service 2 times a year before implementing the developed system and a reduction to 1 time a year when the system is implemented, resulting in 30 USD annually for both Mini-Splits. Concerning preventive maintenance, 10 USD per annual mini-split is contemplated with 3 services before implementing the system and 2 services per year when implementing them for the mini-split, resulting in a saving of 20 USD.
The analysis for the reduction in wear of the major equipment is another aspect to consider in the Mini-Split derived from the implementation of the system for both pieces of equipment. For this, a replacement cost of a mini-split is taken into account with a cost of 300 USD, a useful life of the system of 5 years, and when implementing the system, a useful life of 6 years is considered due to the energy reduction produced by the proposed system, obtaining 20 USD for both mini-splits, as shown below:
The inactivity time also represents a factor to be considered and detached from the energy savings obtained when using the system. By contemplating it, it can be ensured that by reducing the use of the mini-split, failures are also reduced, resulting in a longer life of the system without the need for temporary replacement. For this, an estimated cost per inactivity of 5 USD is contemplated, and depending on the time, 3 days per year of inactivity using the system and 1 day per year without using the system are contemplated, obtaining a total savings of 10 USD annually. Table 3 shows the contemplated savings based on the operating costs described.
Table 3.
Energy savings based on operating costs for Mini-Splits. Source: Own elaboration.
Regarding the broken-down information and considering the previous operating cost of 231 USD/year, the contemplated percentage reduction would correspond to 34.8% in operating costs, as shown below:
The analysis developed above is based on the consumption reduced by the system of 1.95 kWh/month. The application of operational improvements to the system significantly reduces operating costs, reaching approximately a 35% reduction.
Calculation of Return on Investment (ROI)
Regarding the calculation of Return on Investment, it is necessary to consider both the total investment of USD 261.5 as well as the total annual savings estimated at USD 80.38 as shown below:
Annually, the system represents a recovery of 30.74% concerning the initial investment. To estimate the total period for the recovery of the investment, it is necessary to develop the estimate based on the months, as shown below:
The system manages to reduce operating costs and generate significant savings, although the recovery of the investment takes approximately 39 months due to the initial cost of the system and the installation, obtaining a return within 3 years and 3 months with the proposed system and the described reductions derived from the energy efficiency produced. Table 4 shows both data contemplated and obtained and the ROI.
Table 4.
Total data contemplated and obtained regarding energy consumption, ROI, energy savings, and time. Source: Own elaboration.
4. Discussion
The implemented system offers an appropriate solution for the context in which it is developed. The energy efficiency obtained has been verified through a comparative analysis carried out. However, there is research that addresses energy efficiency using advanced technologies such as artificial intelligence, machine learning, and the internet of things (IoT). These developments propose innovative and avant-garde solutions [,,,,]. However, the applicability of these technologies depends on the context, the available infrastructure, the cost of services, and network connectivity. In developed countries, the proposals had considerable success, being beneficial both for users, the economy, and the environment, which makes them an ideal option. On the other hand, in developing countries, such as Mexico, the proposals may not be adequate due to limitations in infrastructure, the costs of necessary services, and connectivity, which is not always affordable in all locations.
The developed system, although not connected to the internet, works effectively on a local network. The transmitted data and open-source devices used have low costs, require little maintenance, and are easily replaceable without generating significant problems. As for the Logo 8 PLC, being a robust device, it does not present initial problems, but it may experience problems in the long term. Although it requires specialized labor, it guarantees effective processing of the control and sensors compared to open-source devices.
During the development of the system, various connectivity problems between devices and software were identified and resolved. Below are some contributions that will be relevant for future work:
- Port offset between Logo 8 PLC and Node-RED software.By configuring the Network window, it was possible to find a gap of one unit in the Modbus communication between the PLC and the Node-RED software, in the addresses shown, Siemens starts the address count from 1 to 513 for its communication, and Node-RED begins the assignment considering 0, there being a lag of 1 in the count, resulting in the assignment of address 512 in Node-RED (see Figure 6).
- Codification for data decoding in Node-RED.When receiving and processing the data from the Modbus Read icon, a hexadecimal value decoded to voltage is obtained. To manipulate it, it was necessary to use the “function” node and generate a formula that separates the information needed from the received signal. from the PLC (see Figure 9).
- Encryption to enable Mosquitto software to publish/listen to subs on a local network.It was essential to enter the source code of the software and write two additional lines of code to enable port 1883; inside the folder, its contents are deleted, and the following lines of code “allow_anonymous true” and “listener 0.0.0.0 1883” are entered, (see Figure 12).
Regarding measurements with the Sonoff Pow R2 device, the accuracy of the consumption measurements could be questioned. However, by performing measurements under the same conditions, both for the system with and without the device, the results are suitable for comparative analysis within the context of the study.
Regarding the assignment of functions to each device, it would be common to use the Logo 8 PLC to perform more complex functions. However, the purpose of the system is to allow scalability that considers various variables, not just temperature. In addition, the incorporation of low-cost and open-source devices contributes to reducing costs and facilitating simple replacements. The adoption of free software such as Node-RED v1.0.6 version, Mosquitto 1.5.7-deb10u1 version (MQTT), and NodeMCU boards (Raspberry Pi 3+ and ESP12-E, V2 version), such as the ESP 12-E, shows how new technologies can be functional and viable for projects to be developed in the future.
This work represents a solution to the problem raised since it manages to implement and quantify an energy reduction in living spaces for temperature conditioning, all within a limited context of resources and with low preventive maintenance. This is possible for the use of open-source software and devices, which can be purchased in duplicate and easily replaced. Additionally, the system can operate without the need for continuous internet access, as the local network provides the necessary connectivity between devices.
Various research studies have addressed the implementation of advanced technologies to improve energy efficiency in different contexts. For example, ref. [] proposes the use of algorithms with deep reinforcement learning to optimize energy consumption in air conditioning systems, demonstrating a significant improvement in the energy efficiency of smart buildings in developed countries. Similarly, ref. [] highlights a systematic review of the use of various AI (artificial intelligence) techniques, as well as the internet of things (IoT) in smart cities, where the interconnection of devices through local networks, processing, and the ability to collect data in real-time improves energy management and reduces operating costs. In contrast, ref. [] points out that, in developing countries, the implementation of these advanced technologies faces significant challenges, such as limited infrastructure, lack of stable connectivity, and high dependence on network services. Aligned with these ideas, ref. [] emphasizes that, although AI and IoT offer advanced solutions, for developing countries there are still limitations when using hardware, and its performance may not be ideal. Comparing these approaches with the system developed in this work, it is observed that the choice of open-source devices and the dependence on local networks, instead of constant connectivity to the internet, allows a more accessible, flexible, and appropriate solution to the contexts of limited resources. Thus, while cutting-edge technologies promise great advances in energy efficiency, it is crucial to consider the local context and adapt solutions to ensure their long-term viability, especially in regions with less developed infrastructure.
Future Works
The proposed system solves the control of indoor temperature in buildings using devices such as the Mini-Split. However, there are more problems to solve. In this context, the Logo 8 PLC has additional inputs to process variables such as lighting, humidity, and movement (PIR sensors). By incorporating these variables, the energy efficiency of spaces in a building is enhanced under a control and automation scheme, especially in existing buildings in developing countries. This solution could contribute to various Sustainable Development Goals (SDGs) by improving energy efficiency and sustainability in these contexts.
Decarbonization in the building sector is critical for achieving global climate goals, as buildings contribute significantly to carbon emissions through energy consumption, construction materials, and operational inefficiencies. The process of decarbonizing buildings involves reducing greenhouse gas emissions, improving energy efficiency, and transitioning to low-carbon or renewable energy sources. As highlighted by [,,], strategies such as retrofitting existing buildings, utilizing sustainable building materials, and integrating renewable energy solutions are vital for mitigating climate change. These approaches not only reduce the carbon footprint of buildings but also promote long-term sustainability in urban environments. In this research, we draw on these findings to explore how decarbonization strategies can be implemented in existing building infrastructures, with a particular focus on optimizing energy use and reducing emissions in the context of educational buildings. The integration of intelligent energy systems, as discussed by [], further supports the potential for decarbonization in the building sector, offering a scalable solution to reduce carbon emissions without sacrificing user comfort.
5. Conclusions
The implemented system effectively addresses the specific energy efficiency needs of its development context, demonstrating significant improvements through comparative analysis. While advanced technologies such as artificial intelligence (AI), machine learning, and the internet of things (IoT) offer innovative solutions, their applicability depends on infrastructure availability, service costs, and network connectivity. In developed countries, these technologies have been successfully integrated, benefiting users, the economy, and the environment. However, in developing regions like Mexico, limited infrastructure and high service costs hinder widespread adoption.
Despite these limitations, the developed system operates efficiently within a local network without relying on an internet connection. The use of open-source devices ensures low costs, minimal maintenance requirements, and easy replacement, making it a practical and sustainable option. The integration of a Logo 8 PLC provides robustness and reliable processing, though it requires specialized labor. Additionally, various connectivity issues between devices and software were identified and resolved, contributing valuable insights for future work.
Compared to more complex energy management systems, this solution prioritizes accessibility and adaptability. While AI- and IoT-based systems promise significant energy efficiency improvements, their implementation in resource-limited settings remains challenging. The proposed system demonstrates that energy savings in living spaces can be achieved through open-source software and locally connected devices, reducing reliance on continuous internet access.
From a scientific perspective, this research offers an innovative and accessible solution for temperature control and energy efficiency in buildings. Open-source adoptions and low-cost technologies, such as Node-RED, Mosquitto, and NodeMCU devices, promote an inclusive and replicable research approach. This model is particularly relevant in developing countries, where technological solutions must adapt to infrastructure and internet connectivity limitations.
Additionally, the study validates a technical management solution focused on energy efficiency while highlighting its qualitative impact on sustainability and technological accessibility. The integration of open and low-cost technologies promotes greater autonomy in energy management within educational institutions, either as a complementary alternative to commercial devices or as an independent automation and control system. The implementation process and resolution of technical challenges reinforce the importance of practical learning and adaptability, key factors in technological development.
Furthermore, the experience gained during system development not only expands technical knowledge but also fosters a culture of innovation, continuous optimization, and implementation of open-access technologies in resource-limited environments like Mexico. The study also provides a cost-effective solution for energy management, validated through a case study in an educational setting. This implementation underscores the importance of applied research, bridging the gap between theory and practice to offer tangible solutions that improve energy efficiency.
The research also addresses key technical challenges and solutions:
- Data transmission issues using the Modbus protocol due to port mismatch between the Logo 8 PLC and Node-RED software. Resolving this issue improved system performance and optimized device interoperability within local networks.
- Decoding and converting voltage data into a usable format within Mosquitto software, overcoming technical barriers and enabling seamless data flow.
- Deploying Mosquitto software on a local network, addressing complications caused by disabling port 1883, which had previously hindered subscriber and publisher operations. Proper network configuration ensured reliable device connectivity and data exchange.
- Integration of the NodeMCU ESP 12-E board using the “Coolix” library for the Mirage mini-split. Initially, infrared signals lacked sufficient power to drive the Mini-Splits; integrating a 2N2222 transistor to amplify the signal provided an effective and low-cost solution. This improvement not only enabled system functionality but also introduced new possibilities for optimizing remote control systems in energy efficiency projects.
These practical, low-cost, and easy-to-implement solutions significantly contribute to the field of open technologies, particularly in resource-constrained environments.
Finally, this research contributes to developing sustainable energy automation solutions, especially in contexts with limited resources. By using open-source platforms and low-cost devices, a flexible, scalable, and easily replicable system has been created that optimizes energy consumption while promoting technological inclusion. This approach enables institutions with limited budgets to access advanced solutions without relying on expensive commercial equipment.
This study provides a concrete response to current energy challenges and lays a solid foundation for future research on energy automation in educational settings. The integration of innovative and accessible technologies demonstrates that sustainability and energy efficiency are achievable, even in conditions of limited infrastructure and resources.
Author Contributions
Conceptualization, J.F.P.B. and F.C.F.; methodology, J.F.P.B., F.C.F. and J.J.C.; software, J.F.P.B., F.C.F., J.J.C., J.C.-C. and R.R.P.; validation, J.F.P.B., F.C.F., J.J.C. and J.C.-C.; formal analysis, J.F.P.B., F.C.F. and R.R.P.; investigation, J.F.P.B., F.C.F., J.J.C. and R.R.P.; resources, J.F.P.B. and F.C.F.; data curation, J.F.P.B., F.C.F. and R.R.P.; writing—original draft preparation, J.F.P.B. and F.C.F.; writing—review and editing, F.C.F., J.J.C. and R.R.P.; visualization, F.C.F., J.J.C. and R.R.P.; supervision, J.F.P.B., F.C.F. and J.C.-C.; project administration, J.F.P.B., F.C.F. and J.J.C.; funding acquisition J.J.C. All authors have read and agreed to the published version of the manuscript.
Funding
This research was funded by Tecnológico Nacional de México (TecNM), grant number 20806.24-P, and the APC was supported by the Call for Scientific Research Projects, Technological Development, and Innovation 2024.
Data Availability Statement
The data presented in this study are available on request from the corresponding author. The data are not publicly available due to privacy.
Acknowledgments
The authors are grateful for the facilities provided to the Tecnológico Nacional de Mexico (TecNM)—Instituto Tecnológico de Ciudad Guzman.
Conflicts of Interest
The authors declare no conflicts of interest.
Appendix A. Sketch to Decode Infrared Signals
References
- UN. 17 Objetivos de Desarrollo Sostenible (ODS). Available online: https://sdgs.un.org/es/goals (accessed on 26 August 2024).
- United Nations Organization. Status of the Sustainable Development Goals in 2023, What Is the Status of the SDGs of the 2030 Agenda? Available online: https://unstats.un.org/sdgs/report/2024/?_gl=1*upx33m*_ga*MjA4OTY5MjQ4Mi4xNzMyODAyMzE0*_ga_TK9BQL5X7Z*MTczOTkzMjE2Mi45LjEuMTczOTkzMjI2NC4wLjAuMA (accessed on 26 August 2024).
- Navarro, S.; Vallejo Coral, C.; Orozco Salcedo, M.; Zúñiga Puebla, H.; Perlaza, J. Thermal Vulnerability Analysis in Low-Income Housing with Natural Ventilation in the Galápagos Islands: Measured and Simulated Data. In Towards Low and Positive Energy Buildings; Torres González, M., Rubio Bellido, C., Eds.; Green Energy and Technology; Springer: Cham, Switzerland, 2024. [Google Scholar] [CrossRef]
- Gamero-Salinas, J.C.; Monge-Barrio, A.; Sánchez-Ostiz, A. Overheating risk assessment of different dwellings during the hottest season of a warm tropical climate. Build Environ. 2020, 171, 106664. [Google Scholar] [CrossRef]
- Sánchez-Almodóvar, E.; Gómez-Trigueros, I.M.; Olcina-Cantos, J. Climate Change and Extreme Weather Events in the Education of the Citizens of the Twenty-First Century: The Perception of Secondary Education Students. Soc. Sci. 2022, 12, 27. [Google Scholar] [CrossRef]
- Ma, K.; Yu, Y.; Yang, B.; Yang, J. Demand-Side Energy Management Considering Price Oscillations for Residential Building Heating and Ventilation Systems. IEEE Trans. Ind. Inform. 2019, 15, 4742–4752. [Google Scholar] [CrossRef]
- Fonseca, F.C.; Pérez, R.R.; Rodríguez, J.P.; Bernal, J.F.P.; Cárcel-Carrasco, J. Sustainable Built Environments: Building Information Modeling, Biomaterials, and Regenerative Practices in Mexico. Buildings 2024, 14, 202. [Google Scholar] [CrossRef]
- Cornaro, C.; Buratti, C. Energy Efficiency in Buildings and Innovative Materials for Building Construction. Appl. Sci. 2020, 10, 2866. [Google Scholar] [CrossRef]
- Frigione, M.; de Aguiar, J.L.B. Innovative Materials for Construction. Materials 2020, 13, 5448. [Google Scholar] [CrossRef] [PubMed]
- Nwokediegwu, Z.Q.S.; Ilojianya, V.I.; Ibekwe, K.I.; Adefemi, A.; Etukudoh, E.A.; Umoh, A.A. Advanced Materials for Sustainable Construction: A Review of Innovations and Environmental Benefits. Eng. Sci. Technol. J. 2024, 5, 201–218. [Google Scholar] [CrossRef]
- Marzouk, M.; Azab, S. Environmental and economic impact assessment of construction and demolition waste disposal using system dynamics. Resour. Conserv. Recycl. 2014, 82, 41–49. [Google Scholar] [CrossRef]
- Motalebi, M.; Rashidi, A.; Nasiri, M.M. Optimization and BIM-based lifecycle assessment integration for energy efficiency retrofit of buildings. J. Build. Eng. 2022, 49, 104022. [Google Scholar] [CrossRef]
- International Energy Agency. Energy Efficiency 2024. Available online: https://www.iea.org/ (accessed on 26 August 2024).
- Aini, Q.; Rahardja, U.; Manongga, D.; Sembiring, I.; Hardini, M.; Agustian, H. IoT-Based Indoor Air Quality Using Esp32. In Proceedings of the 2022 IEEE Creative Communication and Innovative Technology (ICCIT), Tangerang, Indonesia, 22–23 November 2022; pp. 1–5. [Google Scholar] [CrossRef]
- Chen, L.; Zhang, Y. Design and implementation of infrared wireless data transmission system. In Proceedings of the 2010 IEEE International Conference on Information and Automation, Harbin, China, 20–23 June 2010; pp. 2192–2195. [Google Scholar] [CrossRef]
- Cheng, G.; Wang, Z.; Wang, Y.; Shi, B.; Li, T.; Wu, J.; Zhang, H.; You, Q. Research on Performance Test of the Optic-Electric Sensors for Reservoir Landslide Temperature Field Monitoring. Water 2023, 15, 3125. [Google Scholar] [CrossRef]
- Dounis, A.I.; Caraiscos, C. Advanced control systems engineering for energy and comfort management in a building environment—A review. Renew. Sustain. Energy Rev. 2008, 13, 1246–1261. [Google Scholar] [CrossRef]
- Essa, M.E.-S.M.; El-Shafeey, A.M.; Omar, A.H.; Fathi, A.E.; El Maref, A.S.A.; Lotfy, J.V.W.; El-Sayed, M.S. Reliable Integration of Neural Network and Internet of Things for Forecasting, Controlling, and Monitoring of Experimental Building Management System. Sustainability 2023, 15, 2168. [Google Scholar] [CrossRef]
- Metallidou, C.K.; Psannis, K.E.; Egyptiadou, E.A. Energy Efficiency in Smart Buildings: IoT Approaches. IEEE Access 2020, 8, 63679–63699. [Google Scholar] [CrossRef]
- Rihhadatulaisy, Z.H.; Irianto, K.D. Designing an Automatic Room Temperature Control System for Smart Homes for the Elderly Using IoT. Int. J. Softw. Eng. Comput. Sci. 2024, 4, 758–766. [Google Scholar] [CrossRef]
- Himeur, Y.; Elnour, M.; Fadli, F.; Meskin, N.; Petri, I.; Rezgui, Y.; Bensaali, F.; Amira, A. AI-big data analytics for building automation and management systems: A survey, actual challenges and future perspectives. Artif. Intell. Rev. 2022, 56, 4929–5021. [Google Scholar] [CrossRef] [PubMed]
- Haruehansapong, K.; Roungprom, W.; Kliangkhlao, M.; Yeranee, K.; Sahoh, B. Deep Learning-Driven Automated Fault Detection and Diagnostics Based on a Contextual Environment: A Case Study of HVAC System. Buildings 2022, 13, 27. [Google Scholar] [CrossRef]
- Lopez-Vargas, A.; Fuentes, M.; Vivar, M. Challenges and opportunities of the internet of things for global development to achieve the united nations sustainable development goals. IEEE Access 2020, 8, 37202–37213. [Google Scholar] [CrossRef]
- Yang, L.; Yan, H.; Lam, J.C. Thermal comfort and building energy consumption implications—A review. Appl. Energy 2014, 115, 164–173. [Google Scholar] [CrossRef]
- Mena, V.G.; Molina, F.Q.; Catalán, M.L.; Valdés, D.O.; Serrano, A. Energetic efficiency in residential buildings. ESTOA 2015, 004, 59–67. [Google Scholar] [CrossRef]
- Bhandari, M.; Fumo, N. A review of ductless mini split HVAC system. Energy Rep. 2022, 8, 5930–5942. [Google Scholar] [CrossRef]
- Hussien, A.; Ali, A.; Ismail, I. Comparative Investigation of the Energy Efficiency of Mini-Split Air Conditioning with Variable Refrigerant Flow Systems for Office Buildings in Hot Climate. JES J. Eng. Sci. 2024, 52, 52–72. [Google Scholar] [CrossRef]
- López, J.M.G.; Estrada, A.J.A.; Chavolla, F. Comparativo de Eficiencia Energética de Sistemas de Aire Acondicionado con Tecnologías on-off e Inverter. Available online: www.gob.mx/sener (accessed on 21 July 2018).
- Cuevas, J.J.; Rubio, R.R.; Esesarte, L.L.; Perez, R.R.; Bernal, J.F.P. System Development with PLC Logo 8 Siemens, Raspberry Pi4 and ESP8266-12E Desarrollo de Sistema con PLC Logo 8 Siemens, Raspberry Pi4 y ESP8266-12E. 2021. Available online: http://difu100cia.uaz.edu.mx/index.php/difuciencia/article/view/190/148 (accessed on 20 December 2024).
- Ogata, K.; Martín-Romo, M.; Martín, E.; Pearson Educación, S.A. (Eds.) Ingeniería de Control Moderna, 5th ed.; 2010; Available online: https://www.pearsonenespanol.com/Ecuador/Inicio/ingenieria-control-moderna-ogata-1ed-ebook1 (accessed on 12 February 2025).
- Siemens. Regulador PI with LOGO! Siemens Support (Sie Portal). 30 September 2019. Available online: https://support.industry.siemens.com/cs/document/23753479/regulador-pi-con-logo!-para-aplicaciones-sencillas-regulación-óptima-de-la-velocidad-de-motores-(set-23)?dti=0&lc=es-MX (accessed on 12 February 2025).
- Almshari, M.; Khadidos, A.O.; Tsaramirsis, G.; Khan, F.Q.; Khadidos, A.; Giannopoulos, I.K.; Leros, A.K.; Piromalis, D.; Bukya, M. Setting up Local Private Smart Grids with Data Collection Sensors for Scientific Experiments using MQTT and Node-Red. In Intelligent Computing Techniques for Smart Energy Systems: Proceedings of ICTSES 2021; Springer: Singapore, 2022; pp. 743–755. [Google Scholar] [CrossRef]
- Hägglund, T.; Åström, K.J. Revisiting The Ziegler-Nichols Tuning Rules For Pi Control. Asian J. Control. 2002, 4, 364–380. [Google Scholar] [CrossRef]
- Hagino, T. Practical Node-Red Programing Learn Powerful Visual Programing Techniques and Best Practices for the Web and IoT; Rogers, S., Ed.; Packt Publishing Ltd.: New York, NY, USA, 2021; Available online: https://www.packtpub.com/en-co/product/practical-node-red-programming-9781800201590 (accessed on 12 February 2025).
- Parikh, D. Raspberry Pi and MQTT Essentials, 1st ed.; Packt Publishing: Birmingham, UK, 2022. [Google Scholar]
- Gurcan, F.; Dalveren, G.G.M.; Cagiltay, N.E.; Roman, D.; Soylu, A. Evolution of Software Testing Strategies and Trends: Semantic Content Analysis of Software Research Corpus of the Last 40 Years. IEEE Access 2022, 10, 106093–106109. [Google Scholar] [CrossRef]
- Mirage, M. Choose Your Air Capacity Correctly . 2024. Available online: https://mirage.mx/saber/elegir-correctamente/ (accessed on 12 February 2025).
- Rodríguez, E. Incentiva UANL Uso Debido de Aires Acondicionados, Vida Universitaria, Periódico de la Universidad Autónoma de Nuevo León. Available online: https://vidauniversitaria.uanl.mx/sustentabilidad/incentiva-uanl-uso-debido-de-aires-acondicionados/ (accessed on 12 February 2024).
- Brandi, S.; Piscitelli, M.S.; Martellacci, M.; Capozzoli, A. Deep reinforcement learning to optimise indoor temperature control and heating energy consumption in buildings. Energy Build. 2020, 224, 110225. [Google Scholar] [CrossRef]
- Li, T.; Li, Y. Artificial intelligence for reducing the carbon emissions of 5G networks in China. Nat. Sustain. 2023, 6, 1522–1523. [Google Scholar] [CrossRef]
- Li, T.; Yu, L.; Ma, Y.; Duan, T.; Huang, W.; Zhou, Y.; Jin, D.; Li, Y.; Jiang, T. Carbon emissions of 5G mobile networks in China. Nat. Sustain. 2023, 6, 1620–1631. [Google Scholar] [CrossRef]
- Chen, Y.; Li, Q.; Liu, J. Innovating Sustainability: VQA-Based AI for Carbon Neutrality Challenges. J. Organ. End User Comput. 2024, 36, 1–22. [Google Scholar] [CrossRef]
- Zhao, S.; Zhang, L.; An, H.; Peng, L.; Zhou, H.; Hu, F. Has China’s low-carbon strategy pushed forward the digital transformation of manufacturing enterprises? Evidence from the low-carbon city pilot policy. Environ. Impact Assess. Rev. 2023, 102, 107184. [Google Scholar] [CrossRef]
- Amaxilatis, D.; Akrivopoulos, O.; Mylonas, G.; Chatzigiannakis, I. An IoT-Based Solution for Monitoring a Fleet of Educational Buildings Focusing on Energy Efficiency. Sensors 2017, 17, 2296. [Google Scholar] [CrossRef] [PubMed]
- Merabet, G.H.; Essaaidi, M.; Ben Haddou, M.; Qolomany, B.; Qadir, J.; Anan, M.; Al-Fuqaha, A.; Abid, M.R.; Benhaddou, D. Intelligent building control systems for thermal comfort and energy-efficiency: A systematic review of artificial intelligence-assisted techniques. Renew. Sustain. Energy Rev. 2021, 144, 110969. [Google Scholar] [CrossRef]
- Kareem, A. Design and Implementation of Humidity and Temperature Automation and Monitoring for Public Building Comfortable Climate Based on Cloud Platform. Przegląd Elektrotechniczny 2022, 1, 96–102. [Google Scholar] [CrossRef]
- Hong, T.; Piette, M.A.; Chen, Y.; Lee, S.H.; Taylor-Lange, S.C.; Zhang, R.; Sun, K.; Price, P. Commercial Building Energy Saver: An energy retrofit analysis toolkit. Appl. Energy 2015, 159, 298–309. [Google Scholar] [CrossRef]
- Sanzana, M.R.; Maul, T.; Wong, J.Y.; Abdulrazic, M.O.M.; Yip, C.-C. Application of deep learning in facility management and maintenance for heating, ventilation, and air conditioning. Autom. Constr. 2022, 141, 104445. [Google Scholar] [CrossRef]
- Nižetić, S.; Šolić, P.; González-de-Artaza, D.L.-D.-I.; Patrono, L. Internet of Things (IoT): Opportunities, issues and challenges towards a smart and sustainable future. J. Clean. Prod. 2020, 274, 122877. [Google Scholar] [CrossRef]
- Deng, X.; Zhang, Y.; Jiang, Y.; Zhang, Y.; Qi, H. A novel operation method for renewable building by combining distributed DC energy system and deep reinforcement learning. Appl. Energy 2023, 353, 122188. [Google Scholar] [CrossRef]
- Cronist, T. The CFE Confirmed a Preferential Rate for 2025: The Electricity Bill Will Be Cheaper for These Users, Finance and Economy. Available online: https://www.cronista.com/mexico/finanzas-economia/la-cfe-confirmo-una-tarifa-preferencial-para-2025-la-boleta-de-luz-sera-mas-barata-para-estos-usuarios/ (accessed on 5 February 2025).
- Mayes, R. How Long Do Mini Splits Last? Carrier, Turn to the Experts. Available online: https://www.carrier.com/residential/en/us/products/ductless-mini-splits/mini-split-maintenance/how-long-do-mini-splits-last/#:~:text=Generally%2C%20a%20well-maintained%20mini,usage%20also%20contribute%20to%20longevity (accessed on 5 February 2025).
- Pérez-Gomariz, M.; López-Gómez, A.; Cerdán-Cartagena, F. Artificial Neural Networks as Artificial Intelligence Technique for Energy Saving in Refrigeration Systems—A Review. Clean Technol. 2023, 5, 116–136. [Google Scholar] [CrossRef]
- Koebel, M.M.; Wernery, J.; Malfait, W.J. Energy in buildings—Policy, materials and solutions. MRS Energy Sustain. 2017, 4, 12. [Google Scholar] [CrossRef]
- Mannan, M.; Al-Ghamdi, S.G. Building for Climate Change: Examining the Environmental Impacts of the Built Environment. In Sustainable Cities in a Changing Climate; Wiley: Hoboken, NJ, USA, 2023; pp. 39–59. [Google Scholar] [CrossRef]
- de Oliveira, C.C.; Vaz, I.C.M.; Ghisi, E. Retrofit strategies to improve energy efficiency in buildings: An integrative review. Energy Build 2024, 321, 114624. [Google Scholar] [CrossRef]
- Madadizadeh, A.; Siddiqui, K.; Aliabadi, A.A. Review: The Economics Landscape for Building Decarbonization. Sustainability 2024, 16, 6214. [Google Scholar] [CrossRef]
Disclaimer/Publisher’s Note: The statements, opinions and data contained in all publications are solely those of the individual author(s) and contributor(s) and not of MDPI and/or the editor(s). MDPI and/or the editor(s) disclaim responsibility for any injury to people or property resulting from any ideas, methods, instructions or products referred to in the content. |
© 2025 by the authors. Licensee MDPI, Basel, Switzerland. This article is an open access article distributed under the terms and conditions of the Creative Commons Attribution (CC BY) license (https://creativecommons.org/licenses/by/4.0/).