Article

Study on the Optimal Construction Time of Adjacent Pile Foundation Considering the Thermal Stability of the Existing Pile Foundation

1
Institute of Geological Hazards Prevention, Gansu Academy of Sciences, Lanzhou 730099, China
2
School of Civil Engineering, Lanzhou Institute of Technology, Lanzhou 730050, China
*
Author to whom correspondence should be addressed.
Buildings 2025, 15(5), 684; https://doi.org/10.3390/buildings15050684
Submission received: 1 January 2025 / Revised: 13 February 2025 / Accepted: 18 February 2025 / Published: 21 February 2025
(This article belongs to the Special Issue Structural Mechanics Analysis of Soil-Structure Interaction)

Abstract

:
To control settlement deformation in permafrost regions, new piles are constructed for remediation. However, the construction of new piles inevitably causes thermal disturbance to the existing pile foundations. A three-dimensional quarter-model of a rectangularly arranged pile group was established to analyze temperature field changes under construction time in odd-numbered months. In addition, a refreezing rate formula based on the effective freezing temperature was developed to examine the annual changes. The results indicate that the thermal disturbance from the new pile foundation construction gradually weakens over time but does not subside within a year, which significantly affects 75% of the existing pile length, and that the refreezing rate continues to increase after construction in November, i.e., the initial month of the cold season, and is maximized in approximately 60 days. This result suggests that November is the optimal time for such construction activities. The findings of this study provide valuable insights for pile engineering practices to mitigate issues caused by permafrost degradation.

1. Introduction

With the development of the global economy and technology, the construction of railways, highways, and other infrastructure in permafrost regions is becoming increasingly common. Over the past half-century, the Qinghai–Tibet Highway and Qinghai–Tibet Railway have been successively opened to traffic [1,2]. During the operation of projects in permafrost regions, a series of engineering problems has emerged, and some sections have experienced varying degrees of engineering diseases [3]. Permafrost depends on low-temperature environments for existence. Studies have shown that the average annual temperature on the Qinghai–Tibet Plateau is rising due to global climate change and threatens the survival of the permafrost [4,5]. Changes in the permafrost environment will directly change its thermal stability and mechanical stability [6].
The study of interaction mechanisms between engineering structures and permafrost and of the mechanics of permafrost has been in a gradual exploration phase [7,8,9]. Its mechanical properties, thermal stability, and engineering characteristics are key to understanding the permafrost [10]. Correct understanding and in-depth research on these issues are crucial for the design, construction, and post-operation maintenance of engineering projects in permafrost regions [11].
In permafrost foundation engineering, pile foundations are the most common form of foundation. Due to their great depth and minimal influence from the active layer, they are widely used in permafrost regions [12,13]. Engineering structures such as “replacing roads with bridges” projects and other facilities designed to protect permafrost play an important role in ensuring the safe operation of the Qinghai–Tibet Railway and Highway [14]. Notably, the implementation of these engineering measures has reduced deformation compared to conventional embankments according to long-term monitoring data. Engineering practice in permafrost regions has shown that pile foundations are an effective foundation type for controlling structure deformation [15]. In general, the bearing capacity of pile foundations in permafrost regions mainly relies on the adfreeze force between the piles and the permafrost [16,17]. Therefore, the increase in temperature of the permafrost and increase in depth of the permafrost table directly decrease the bearing capacity of pile foundations [18]. In some areas, sub-permafrost water poses a threat to the permafrost environment, which makes the permafrost base rise, decreases the thickness of the permafrost layer [19], and threatens the thermal stability of pile foundations [20,21].
Ensuring the thermal stability of pile foundations in the context of global warming and extreme climate conditions is a critical task in design and construction [22]. For the existing projects, ensuring the safe operation of existing structures is a major challenge. Current research is mostly focused on the thermal stability and bearing capacity of newly constructed bored pile foundations, while there is less attention given to the treatment of settlement-related issues [23], particularly differential settlement induced by permafrost degradation [24]. For pile foundations with significant deformation and settlement issues, adding new piles around the existing ones is an effective remediation measure, though this may create complex group pile interaction effects [25]. Using thermosyphons for active cooling is another main measure to reduce thermal disturbances during pile construction [26,27]. However, the thermal effects of pile construction can cause thermal disturbances to the surrounding environment and eventual failure or deformation of the existing pile foundations, particularly under the influence of concrete hydration heat [18]. To address this issue, reducing the hydration heat of concrete and pouring temperature can reduce the range of thermal disturbance and accelerate the refreezing process of permafrost to enhance the long-term thermal stability of pile foundations, but the hydration heat of concrete is not completely eliminated in practice. Therefore, optimizing the construction time of new pile foundations becomes an effective strategy to minimize the thermal disturbance to the existing pile foundations.
This paper used a defective pile foundation in a permafrost region as an example and added new piles deeper than the existing one on both sides of the existing pile foundation. The distribution of ground temperature fields was analyzed after pile pouring at different times to determine the optimal construction time for the new pile foundation. The study considered the influence of the environmental temperature, latent heat of phase change, and concrete hydration heat. The concept of effective freezing temperature, which is the difference between the current negative temperature of the soil and its freezing temperature, was introduced. The refreezing rate within 360 days after pouring the new pile foundation in January, March, May, July, September, and November was plotted. This study has good practical value for determining the optimal construction time for new pile foundations while considering the thermal stability of the existing ones.

2. Geometric Model and Method

2.1. Geometric Model

The model, as shown in Figure 1, is based on a practical bridge engineering project in the permafrost region of the Qinghai–Tibet Plateau, with a depth of H = 20 m and a diameter of D = 1.25 m. It is arranged in a rectangular pile group with a spacing of 3.5*D. The new pile foundation has a depth of h = 40 m, a diameter of d = 1.0 m, and a spacing between old and new piles of 3.5*D. Considering the symmetry of the object under study, one-quarter of the object was selected for analysis. The thermal influence range of the pile group in the horizontal direction is designated as 20 m through a trial calculation, and the range may vary depending on the temperature environment. For ease of calculation, the model selects a rectangular frozen soil body of 20 m × 20 m × 50 m to represent the range of frozen soil affected by thermal disturbance.

2.2. Governing Equations

In a Cartesian coordinate system, the heat conduction equation for a space containing heat sources is:
C T t = x λ T x + y λ T y + z λ T z + q v ,
where C is the specific heat capacity with units of J/(m3·K); λ is the thermal conductivity with units of W/(m·K); T is the temperature measured in degrees Celsius (K); t is time measured in seconds (s); and q v is the source term with units of W/(m3).
During the freezing–thawing process of soil, water in the soil experiences a phase transition. Assuming a sharp phase transition interval, in the temperature range of T t Δ T 2 , T t + Δ T 2 , most of the water in the soil undergoes phase transition. Thus, to prevent abrupt changes in numerical values that may lead to non-convergence of the numerical calculations, a smoothing segment must be introduced into the function by incorporating a second-order differentiable step function α as follows:
α = 0 T < T t Δ T 2 1 T T t + Δ T 2 ,
where Δ T is the interval of abrupt phase transition, taken as 1 °C; and T t is the temperature of the abrupt phase transition, taken as −0.5 °C.
The first-order derivative of α is:
δ T = d α T , T ,
+ δ T d T = 1 .
Disregarding water migration during the soil freezing–thawing process, the equivalent heat capacity from the water phase transition in the soil is expressed by Equation (5), and the thermal conductivity is expressed by Equation (6) [28].
C = C f + C u C f α T + L ρ d θ 0 δ T ,
λ = λ f + λ u λ f α T
In the equation, L is the latent heat of the water phase transition, which is 334.56 kJ/kg; ρ d is the dry density of the soil measured in kg/m3; θ 0 is the moisture content; and subscripts u and f represent the thawed and frozen states of the soil, respectively. Table 1 lists the thermal parameters of soil.

2.3. Boundary Conditions

Based on measured data from a natural borehole in the Tanggula region of the Qinghai–Tibet Plateau, the surface temperature considerably fluctuates due to ambient temperature variations, and the ground temperature at a depth of 0.5 m exhibits a sinusoidal variation pattern. Therefore, this depth was disregarded and instead applied as a boundary condition after fitting, and data in 2024 were fitted as follows [29]:
T s = 1.91 + 7.35 sin 2 π 8640 t + 3 2 π .
The surface of the soil adopts a first-type boundary condition based on the aforementioned equation. For the surface of the pile foundation, a first-type boundary condition T p is imposed, which has a higher average temperature than the natural ground surface (as referenced in the literature). Δ T c is 0.3 °C [30].
T p = 1.91 + 7.35 sin 2 π 8640 t + φ + Δ T c
In the equation, φ is the initial phase angle.
A flux boundary condition is applied at the lower boundary z = −50 m.
T z = 0.015   K / m
Insulating boundaries are applied around the perimeter of the three-dimensional geometric model.

2.4. Initial Condition

Using the above boundary conditions, a one-dimensional soil column temperature field calculation was conducted to obtain a stable temperature field distribution. Then, the temperature fields of each odd-numbered month were extracted as the initial values for the three-dimensional soil calculation, with adjustments for the initial phase angles. Table 2 shows the initial phase angle of each month.

2.5. Concrete Hydration Heat

The generation rate of hydration heat in concrete is [31]:
q v = W Q 0 m e m t .
In the equation, the cement content W is taken as 275 kg/m3; the final hydration heat release of cement Q 0 is taken as 335 kJ/kg; t is time, i.e., the age of the concrete in days; and m is a parameter related to the initial temperature and cement content with units of 1/d. The initial temperature is 5.0 °C, and m is taken as 0.295. The specific heat capacity of concrete C c is taken as 2300 kJ/(m3·K), and the thermal conductivity is taken as 1.74 W/(m·K).

3. Results and Analysis

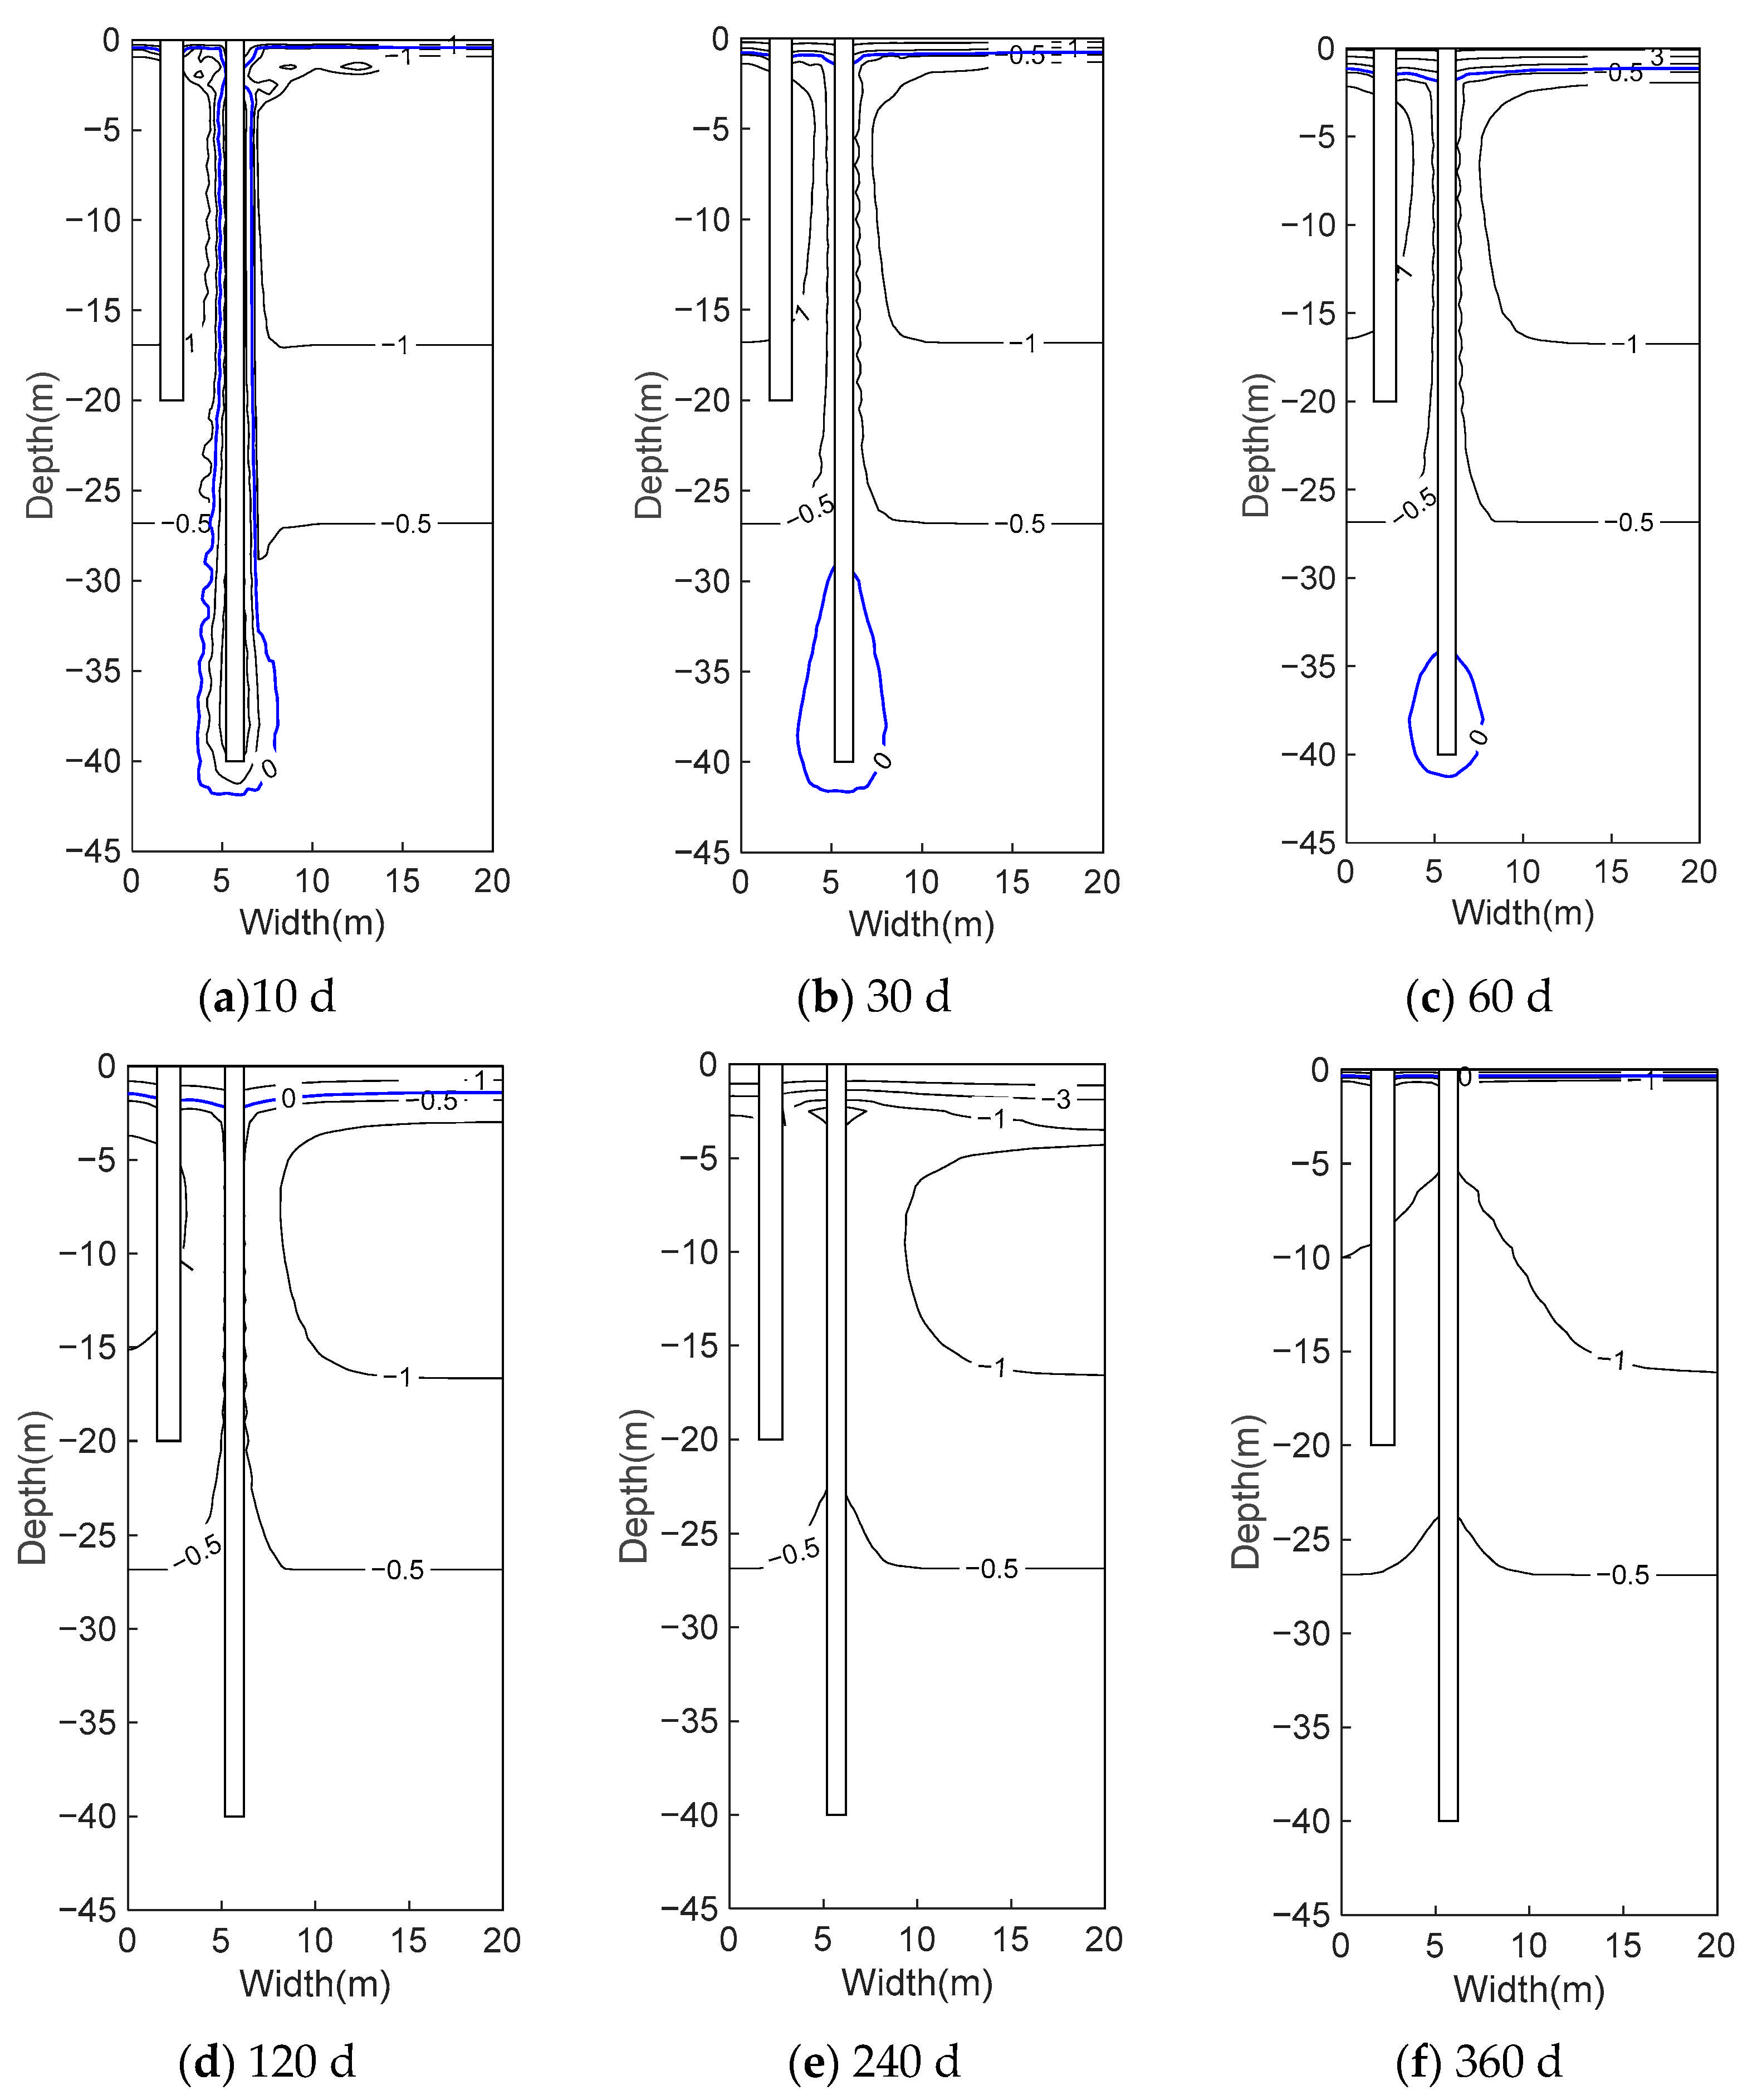
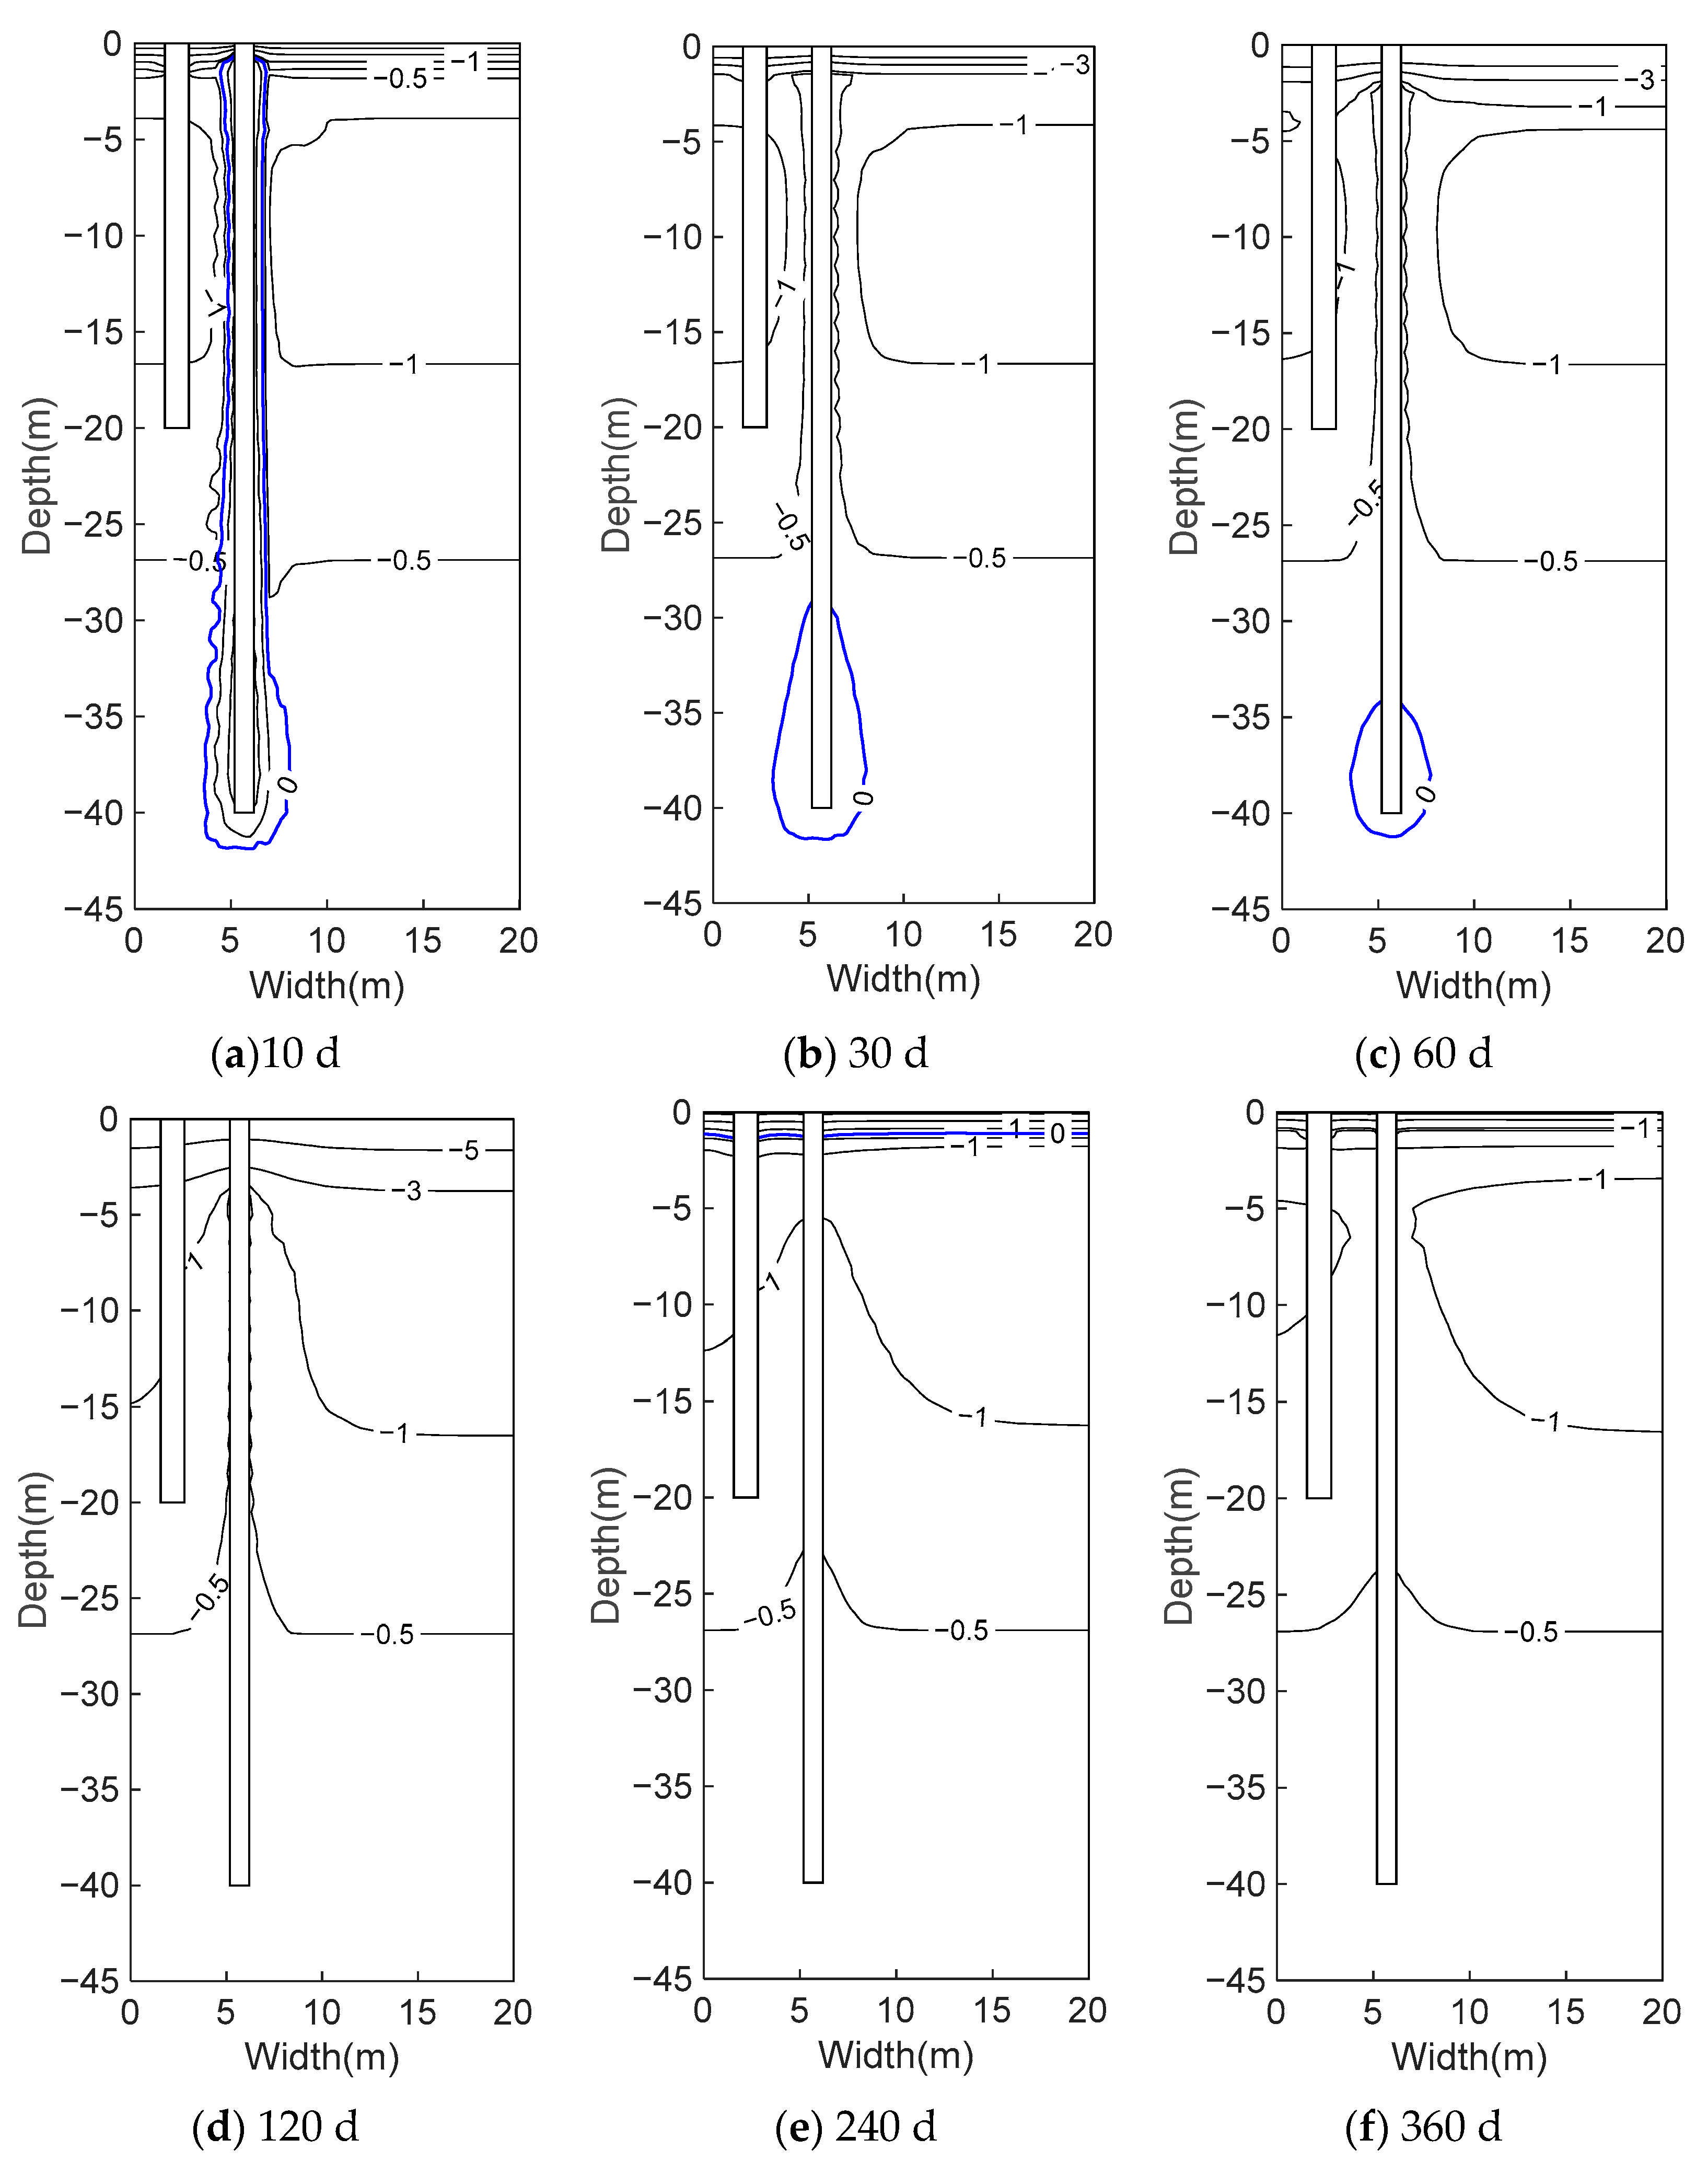
3.1. Temperature Field Distribution of Pile Foundations

The interaction between pile and soil, including heat and stress, is the basis for the study of pile bearing characteristics [32,33,34]. After solving for the spatial temperature field, we extracted the temperatures at the cross-section through the center of the new and old pile foundations and generated the contour plots. Then, ground temperatures were extracted at intervals of 10, 30, 60, 120, 240, and 360 days after the new pile foundation had been constructed. The changes in temperature field after the pile construction were analyzed. Additionally, taking the initial months of November and May as examples for pile construction in the cold and warm seasons, respectively, we analyzed the changing patterns of the ground temperature field.
Figure 2 shows the temperature field distribution at different times after the pile construction in May. Overall, the thermal disturbance caused by the hydration heat of the pile concrete weakened over time, but its thermal impact was not completely eliminated within 360 days. Figure 2a shows the temperature field at 10 days after construction, where the new pile circumference was surrounded by the 0 °C isotherm, which indicates that the pile was completely in a thawed state. Additionally, the lower part of the new pile foundation exhibited a larger thermal disturbance range in the surrounding frozen soil without causing a significant thermal disturbance to the existing pile foundation. Figure 2b shows the temperature field at 30 days, where the temperature around the new pile foundation was below 0 °C but above −0.5 °C. The area below −30.0 m in depth was surrounded by the 0 °C isotherm, which shows a gradually expanding drop-shaped distribution of temperature disturbance from top to bottom. Figure 2c illustrates the temperature field at 60 days, where the area surrounded by the 0 °C isotherm continued to decrease, but the temperature in the negative-temperature section of the pile remained relatively high. Within the depth of −35 m, the temperature around the pile foundation was below 0 °C; the area between −35.0 m and −40 m remained enclosed by the 0 °C isotherm. At this stage, the thermal impact on the existing pile foundation became more significant. Figure 2d–f show the temperature field at 120, 240, and 360 days after construction, respectively. The thermal disturbance generated by the construction of the new pile foundation gradually weakened over time. However, the ground temperature around the new and old pile foundations remained higher than the temperature of undisturbed ground, which indicates that the thermal disturbance caused by the construction of the new pile foundation continued for more than a year. Complete elimination of the thermal impact of hydration heat from the new pile foundation on both existing and new pile foundations may require a longer period.
As shown in Figure 3, the temperature field after the pile construction in November had a similar variation trend to that in May. Regardless of whether pile construction occurred in the warm season starting in May or in the cold season starting in November, the thermal disturbance caused by hydration heat on the existing pile foundations and underlying permafrost did not dissipate within one year. The increase in temperature of the existing pile foundations due to hydration heat may decrease their bearing capacity. The thermal disturbance caused by pile construction is detrimental, since it may cause further settlement deformation. Therefore, after the construction of new pile foundations, it is essential to construct combined pile foundations of new and old ones. This process involves enlarging the pile caps between new and old pile foundations to provide support for the upper loads of both foundations, control the deformation of the superstructure, and complete the treatment of engineering diseases.

3.2. Effect of Thermal Disturbance of New Pile Construction on Existing Pile Foundations

In this study, a distance of 20.0 m from the geometric center of the original pile group was considered unaffected by the pile foundation thermal disturbance. Ground temperatures within a depth of −20.0 m were extracted and compared with the temperatures of existing pile foundations. Temperature–depth relationship curves were plotted to analyze the relationship between existing pile foundations and undisturbed permafrost after the construction of new pile foundations at different times.
Figure 4 shows the temperature comparison curves between existing pile foundations and natural ground after 30, 60, 120, and 240 days of pile construction in November. Overall, within 240 days, the temperature difference between existing pile foundations and undisturbed ground increased over time, which indicates an overall increase in temperature of existing pile foundations due to the hydration heat of new pile foundations. Figure 4a shows the comparison curve at 30 days after construction; except for a slight difference at a depth of approximately −2.5 m, no significant impact was observed at lower depths. Figure 4b–d show the comparison curves at 60, 120, and 240 days after construction, respectively. The temperature difference between existing pile foundations and undisturbed ground gradually increased over time. For example, at a depth of −8.0 m, the temperature of existing pile foundations was 0.11 °C, 0.21 °C, and 0.46 °C higher than that of undisturbed ground at 60, 120, and 240 days, respectively.
Figure 5a–f show the comparison curves of ground temperatures between existing pile foundations and undisturbed ground at 180 days after pile construction in January, March, May, July, September, and November, respectively. Overall, after 180 days of construction in different months, the ground temperatures of the existing pile foundations increased. For example, at a depth of −8.0 m, the ground temperature of the existing pile foundations increased by 0.39 °C after 180 days of construction in January (Figure 5a) and by 0.25 °C after 180 days of construction in July (Figure 5d).
As shown in Figure 4 and Figure 5, after a certain period following construction in different months, the temperature of the existing pile foundations increased due to the hydration heat of new pile foundations, although no thawing occurred. The lower part of the existing pile foundations was most affected by the thermal disturbance of the new pile foundations. Within a depth of approximately 3.0 m from the ground surface, both existing pile foundations and undisturbed ground were most influenced by ambient temperatures, and their temperature changes closely corresponded to variations in ambient temperature. Since the pile material was mainly concrete, which is a good heat conductor, the thermal impact of new pile foundations on the temperature in this depth range was negligible. There was no significant temperature increase within the lower 2.0 m range of the pile base, which indicates that the thermal impact of hydration heat in this segment was also negligible. Therefore, construction in different months increased the temperature at a certain depth of the pile body. The majority of the depth range of the pile body is affected by hydration heat except for the ends of the pile. The heat-affected length accounted for 75% of the total pile length.

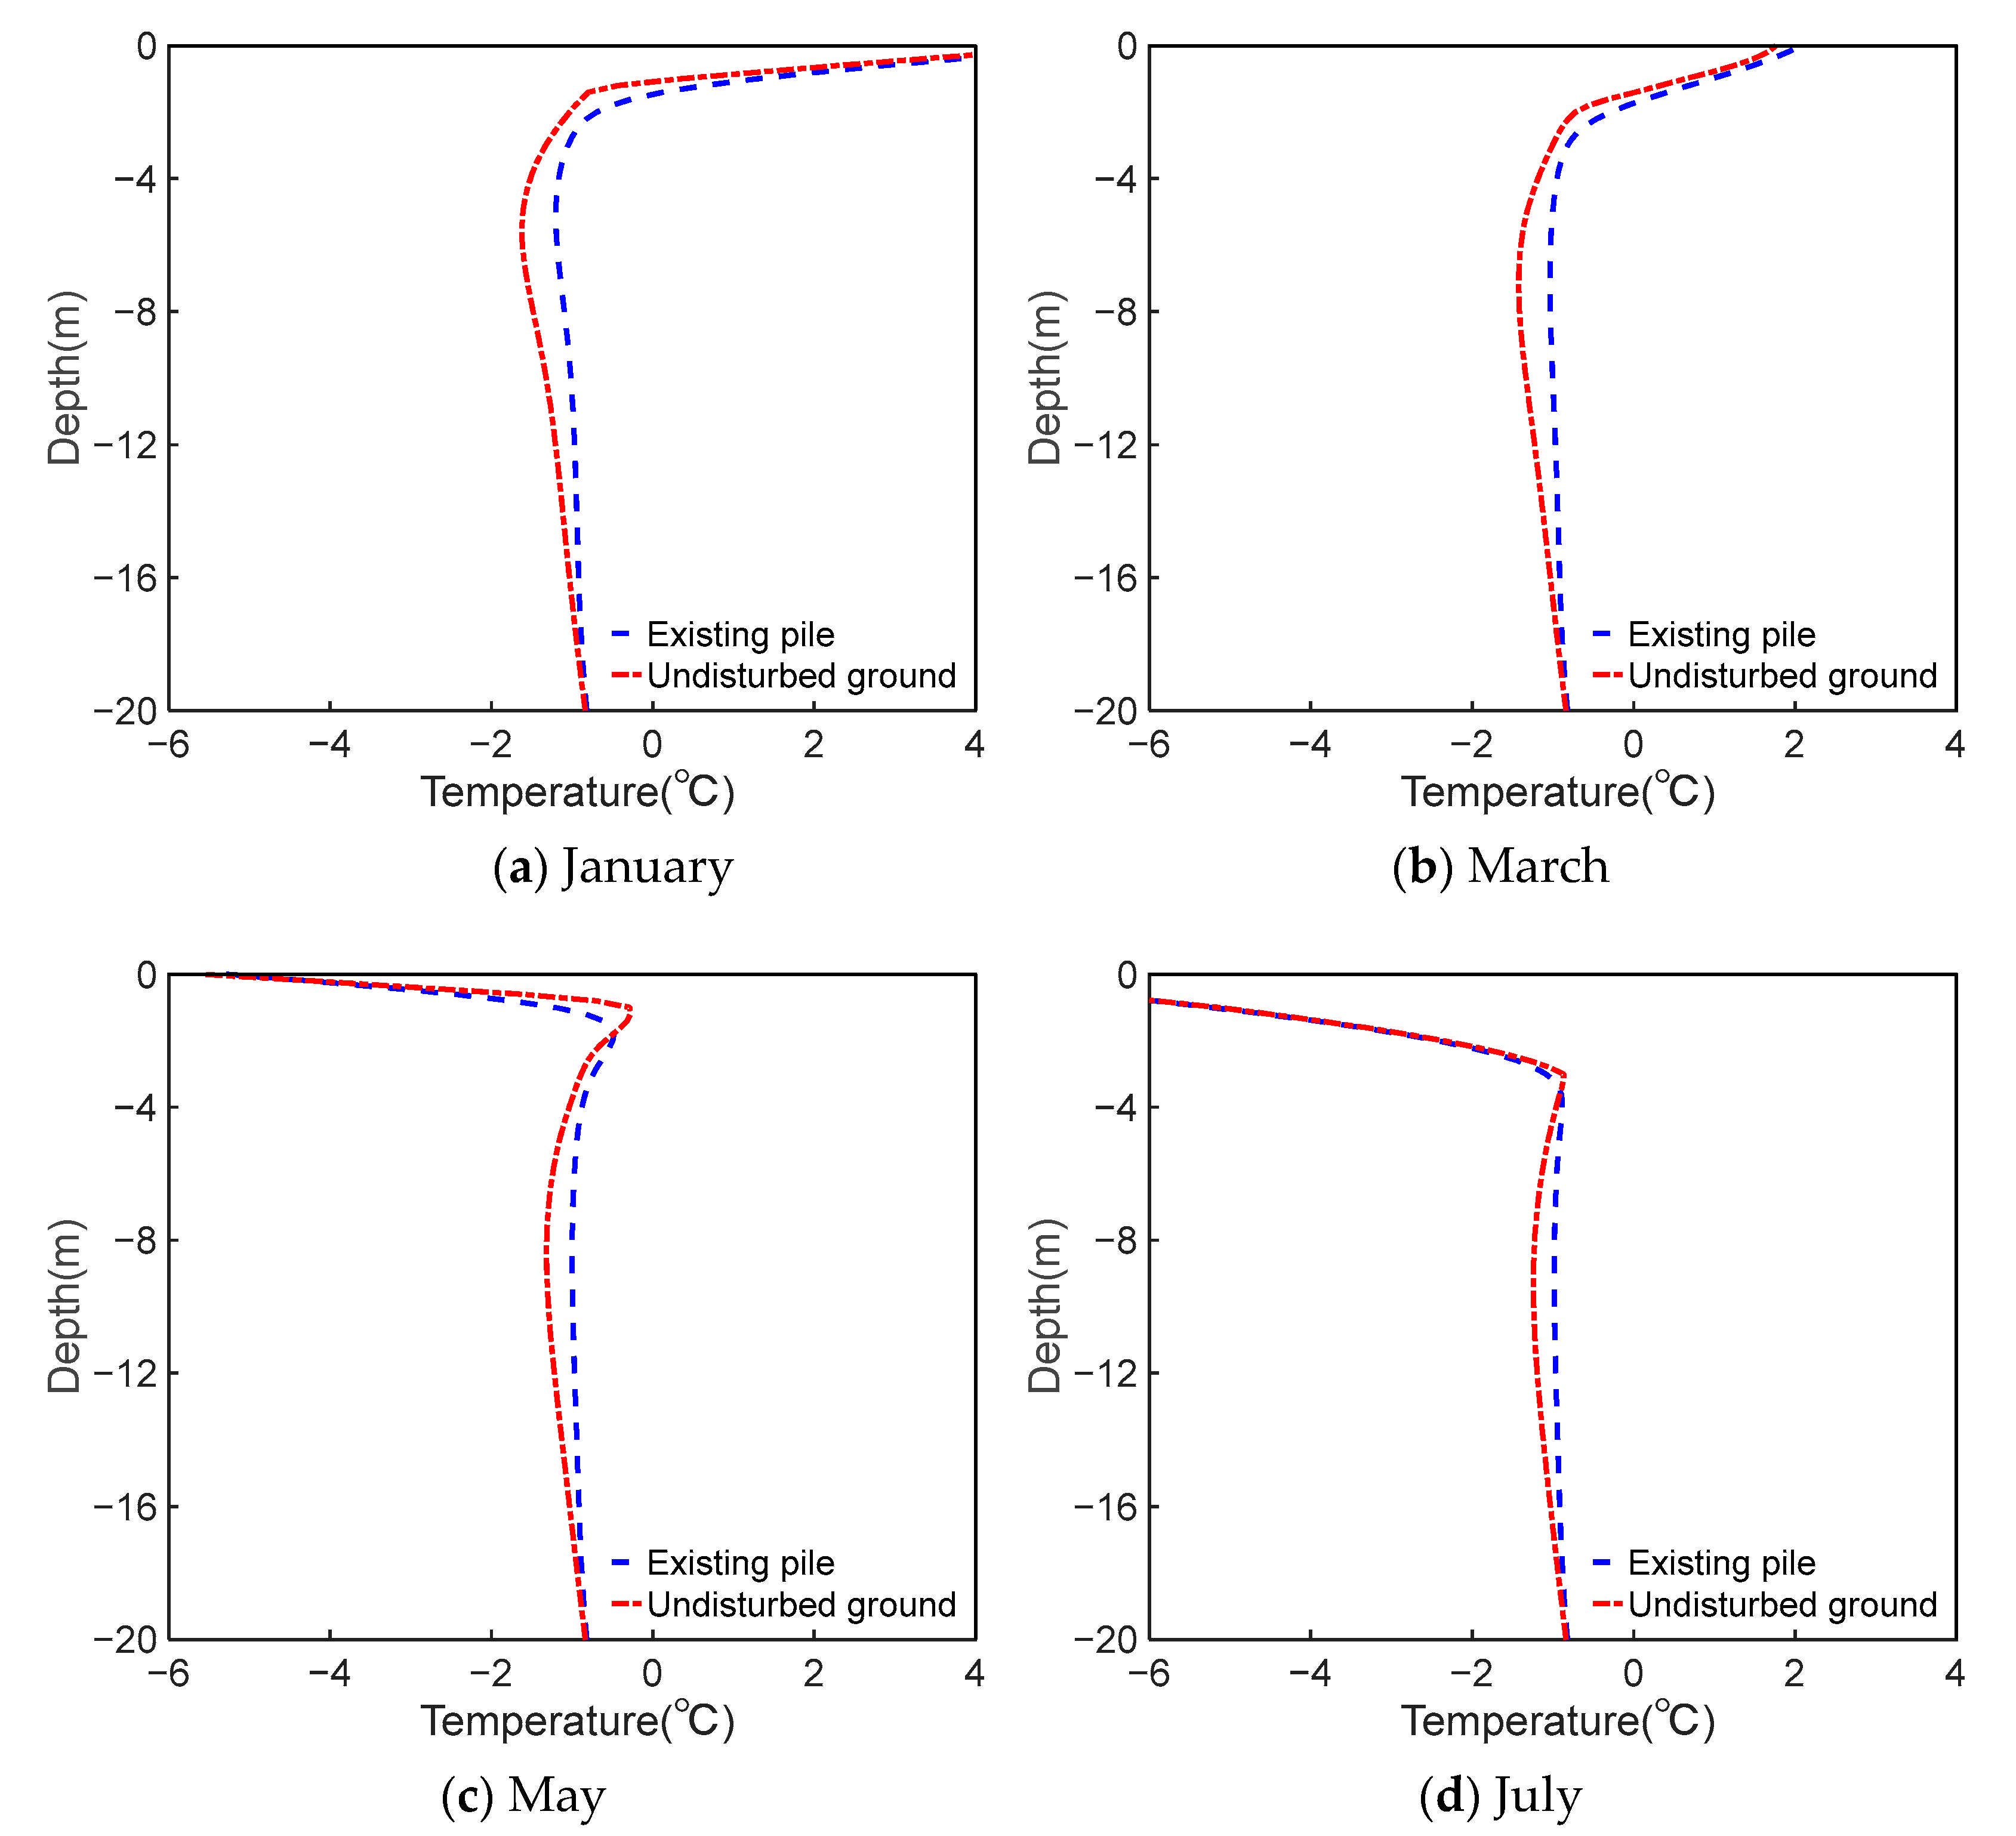
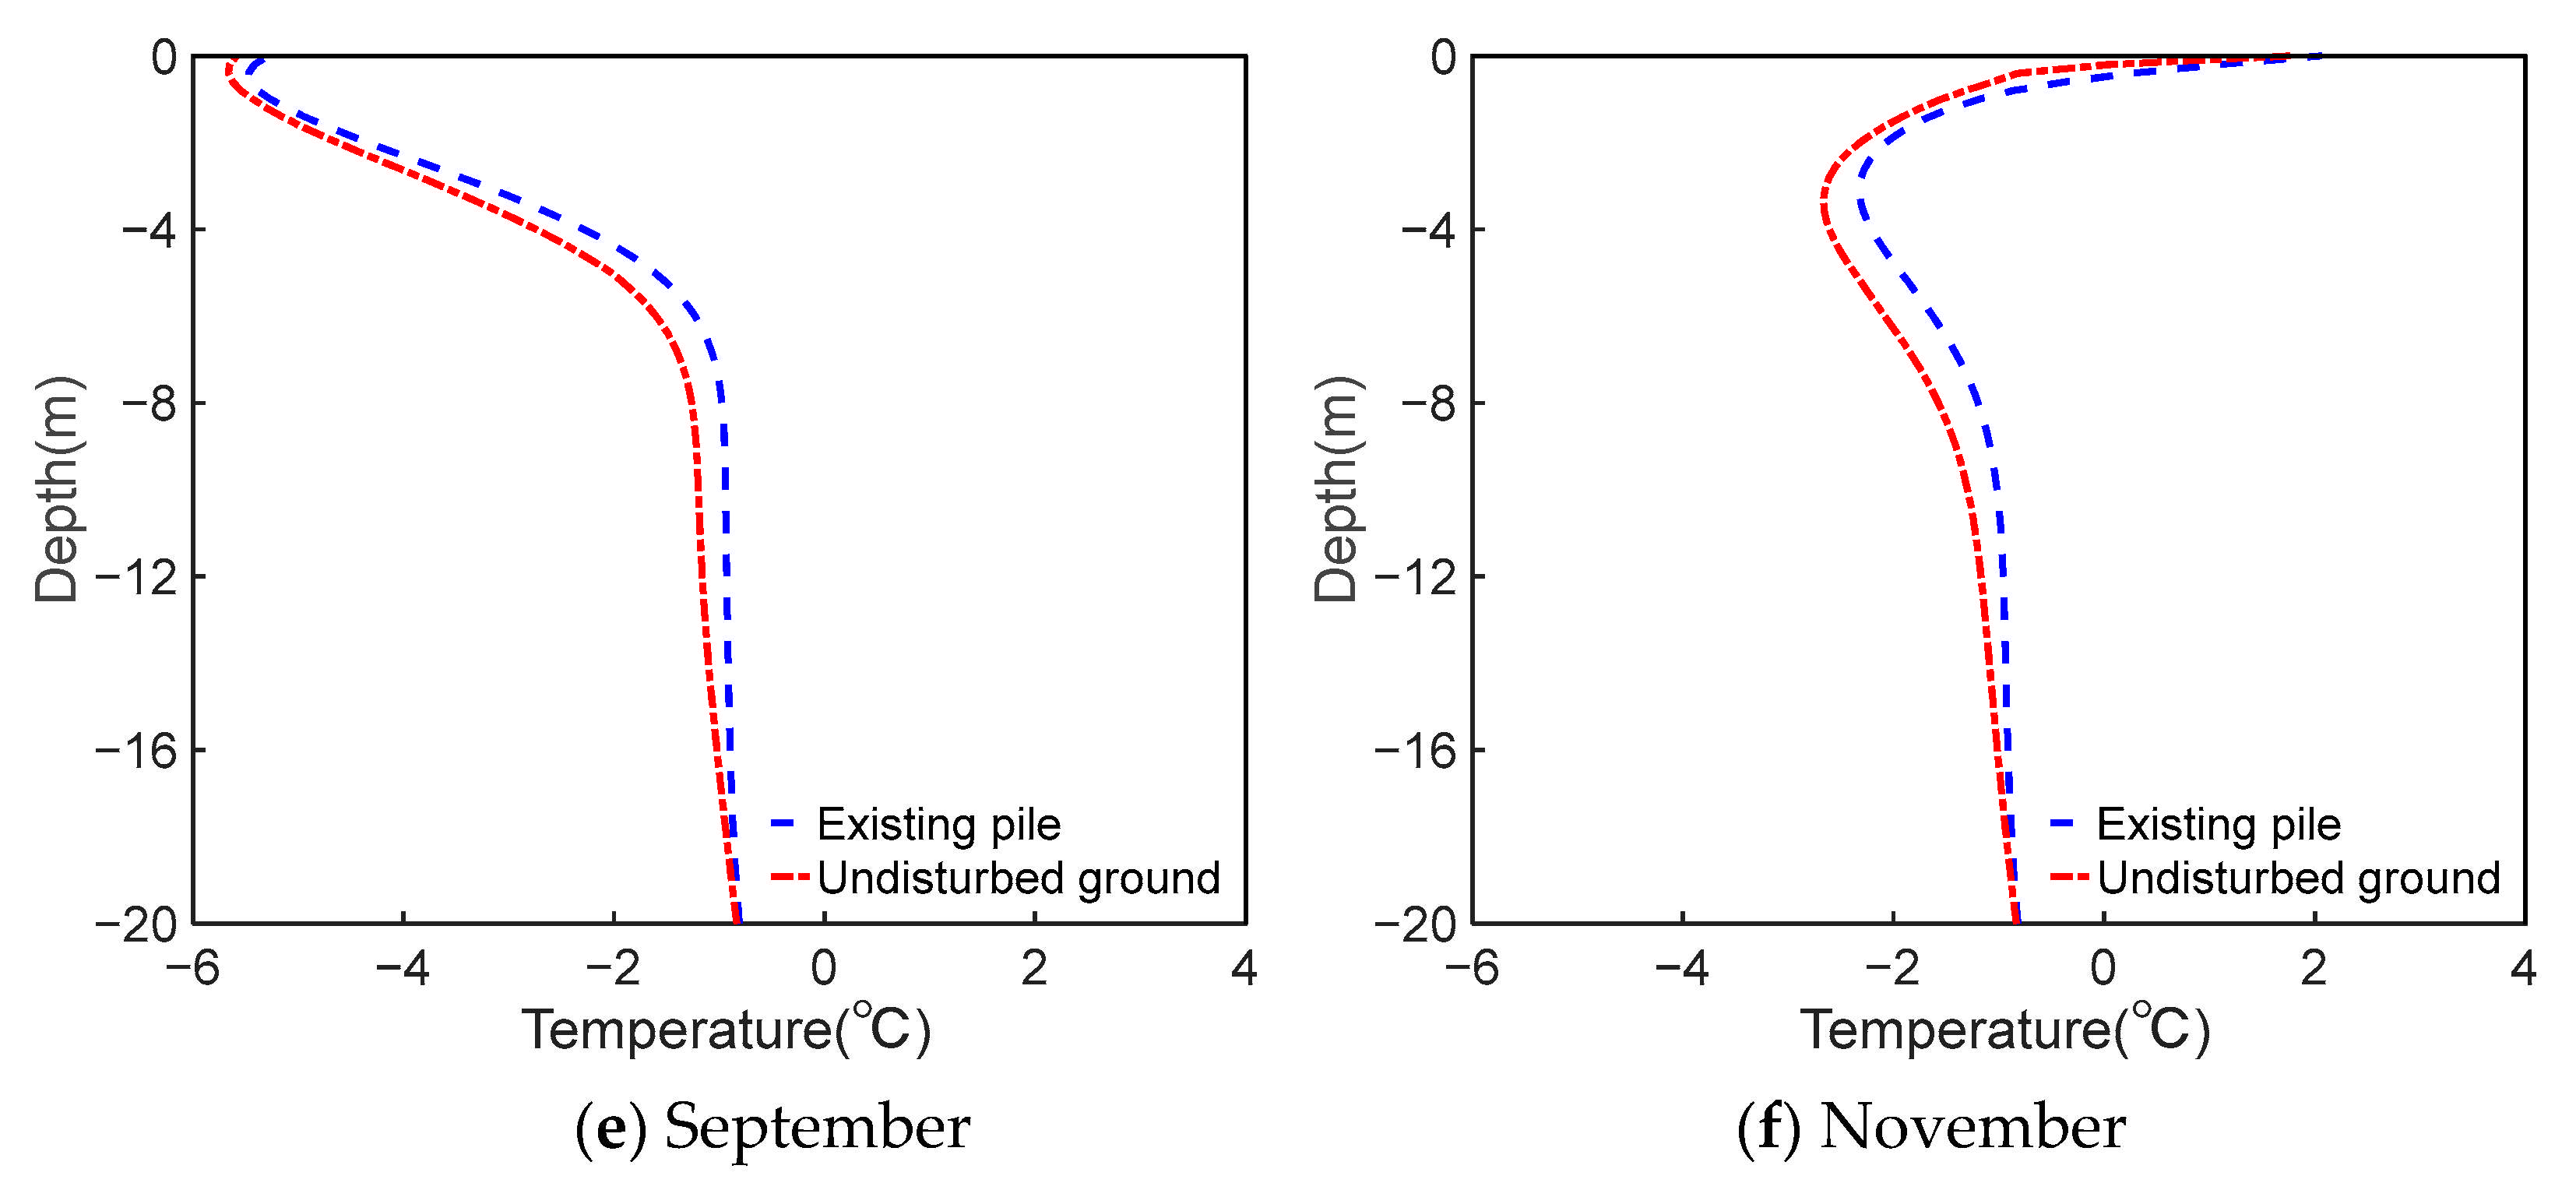
3.3. Temperature Variation Characteristics at Different Depths of Existing Pile Foundations over Time

To analyze the temperature variation trend of existing pile foundations after the construction of new pile foundations, ground temperatures at depths of −5 m, −10 m, −15 m, and −20 m at 360 days after the pile construction in November were extracted. A temperature–time variation curve was plotted for each depth, as shown in Figure 6. Overall, the temperature of the entire pile body increased when the magnitude of temperature fluctuations decreased with increasing depth. The ground temperature at the bottom of the existing pile foundations (−20 m) showed almost no annual variation: the temperature increased by approximately 0.04 °C within 360 days. The ground temperature at a depth of −15 m also exhibited little fluctuation, with a temperature increase of approximately 0.19 °C. At a depth of −10 m, the ground temperature slightly increased by approximately 0.30 °C with minor fluctuations. The ground temperature at a depth of −5 m had the largest fluctuation: the difference between peaks and valleys was 1.0 °C, and the temperature increase was approximately 0.15 °C. Comparatively, the temperature increase was maximal in the middle part of the existing pile foundations and minimal at the bottom of the pile foundations.

3.4. Temperature Variation Characteristics of New Pile Foundations over Time

The preceding sections analyzed the thermal impact of hydration heat from new pile foundations on existing pile foundations. This section examines the refreezing process of pile foundations under hydration heat conditions. The temperature along the axis of the new pile foundations was extracted, and contour plots in November construction were generated, as shown in Figure 7. Overall, under the influence of hydration heat, the temperature of the entire pile body increased but gradually decreased over time. Within approximately 20.0 m from the center of the new pile foundations, which is the upper section of the new pile foundations, basic freezing (≤0 °C) was achieved in approximately 20 days. However, at deeper depths, it took longer to achieve basic freezing, and a deeper depth required more time to complete freezing. By day 92 of pile construction, the entire pile body achieved basic freezing.

4. Discussion

In permafrost regions, the bearing capacity of pile foundations mainly relies on the development of a freezing force in the pile body. A lower temperature corresponds to a greater freezing force. Therefore, to avoid significant plastic deformation of the pile foundation, loading should be applied after the pile body has refrozen in some degree. As analyzed in the preceding sections, new pile foundations can cause considerable thermal disturbance to the existing pile foundations, increase the deformation, and exacerbate diseases. Consequently, the loading construction for new pile foundations cannot wait until after they have completely refrozen.
Analyzing the temperature field of new and existing pile foundations and selecting the construction time based on the ground temperature curves of new and existing pile foundations are complex and inconvenient for comparison. Therefore, this study integrated the ground temperature curve into a single value and introduced the concept of the refreezing rate. The ratio of the integral in the disturbed and undisturbed depth ranges is considered the refreezing rate. The refreezing rate can also be the ratio of the average ground temperature in the pile length range.
Negative temperatures significantly impact the bearing capacity of pile foundations. Therefore, this study focused on the contribution of temperatures below the freezing temperature to the pile foundation. In this context, the effective freezing temperature was introduced, which is the difference between the current negative temperature of the soil and its freezing temperature. It is defined as follows:
T = 0 T T f T T f T < T f .
By introducing a piecewise function β ( T ) , we can rewrite the effective freezing temperature as follows:
β ( T ) = 0 T T f 1 T < T f ,
T = T T f β T .
To comprehensively reflect the thermal disturbance situation of the permafrost site after backfilling construction, using single-point temperatures is insufficient for fully evaluating the thermal condition of the disturbed site. Neglecting the positive-temperature section, the area between the temperature–depth curve of the disturbed site and the freezing temperature curve of the soil from the lower limit of construction disturbance to the surface is:
S = z 1 z 2 T z d z .
By integrating within the depth range of construction disturbance between upper limit z1 and lower limit z2, we compared the disturbed site and undisturbed site at the same depth range. The ratio of the area between the temperature–depth curve of the disturbed site and freezing temperature curve and the area between the temperature–depth curve of the undisturbed site and freezing temperature curve is defined as the refreezing rate. This refreezing rate was used to comprehensively assess the thermal condition of the site under heat disturbance and is expressed as follows:
η = S d S n × 100 %
In practical applications, the trapezoidal rule can be used for integration based on the measured single-borehole temperature data.
To analyze the refreezing situation of the piles under the combined effect of the new and old piles, the temperature–depth curves of the existing 20 m-long piles and newly constructed 40 m-long piles were separately integrated and summed. The result was compared with the sum of the integrated values of the undisturbed site temperature–depth curves at the corresponding depths.
Figure 8 shows the refreezing rate over time after new piles were poured in January, March, May, July, September, and November. A decreasing trend in the refreezing rate was observed within approximately 20 days after construction for May, July, and September. Then, an increasing trend was evident, wherein May, July, and September showed progressively greater rates of increase. The refreezing rate maximized at 73% after 112 days of construction in September, and slightly higher peaks were achieved in May and July after 220 and 174 days, respectively. There was no significant increase in refreezing rate after new piles were poured in March, and the maximal refreezing rate was 78% at 290 days. For construction in January, the maximal refreezing rate of 63% was attained after approximately 45 days. For construction in November, the maximum of 68% was attained after 60 days, followed by a minor decrease due to environmental temperature.
The above analysis indicates that construction during the winter season is most favorable for reducing the temperature of newly constructed piles and minimizing the thermal disturbance caused by the hydration heat on the existing piles. After the construction in May and July, the refreezing rate decreased, and it took approximately half a year to reach the peak refreezing rate. Construction in March led to a relatively slow increase in refreezing rate, which was not conducive to the construction of disease control engineering projects. Construction in January resulted in a faster increase in refreezing rate, but the peak refreezing rate was relatively low, and the low environmental temperature at this time was not suitable for on-site construction. In September, due to the higher ground temperature and thermal disturbance caused by hydration heat, the refreezing rate decreased in a certain time period. However, throughout the entire winter season, the refreezing rate increased to a relatively high level. Since a decrease in refreezing rate may exacerbate existing pile diseases, construction at this time is not advisable. November is the beginning of the winter season, and after construction, the comprehensive refreezing rate of the new and old piles increased, so November is the optimal construction time for settlement deformation control.
It should be noted that the temperature of the pile foundation is the main factor affecting its deformation and bearing capacity, so it is essential to pay comprehensive attention to the changes in this key factor and try to simplify the evaluation index. When settlement damage occurs to pile foundations, the above method can be used to optimize the construction time selection. Additionally, in practical engineering, thermosyphons are also a measure for addressing pile foundation diseases. When both thermosyphons and newly constructed pile foundations are applied simultaneously, further research is needed to determine the optimal construction time for both measures. The method of this paper can be generalized and applied to other foundation types, such as tower foundation by open-cut construction.

5. Conclusions

In conditions where permafrost is subjected to warming or underground water heat disturbance, the bearing capacity of existing pile foundations may decrease, which necessitates pile reinforcement measures for disease control. The hydration heat generated by the construction of new pile foundations can thermally disturb the existing piles and permafrost. To minimize these disturbances, this study numerically simulated temperature field changes under different construction conditions for new pile foundations in different months. A formula was established for the refreezing rate based on the effective freezing temperature to select the optimal construction time. The conclusions are:
The thermal disturbance generated by the construction of new pile foundations gradually diminishes over time. Under the calculated ground temperature conditions, the ground temperature around new and existing pile foundations remains higher than that of undisturbed ground for up to one year. The thermal impact caused by the hydration heat of new pile foundations on existing and new pile foundations may require more than one year to completely disappear. Construction in different months results in temperature increases at certain depths of the pile body. Except for the ends of the pile, 75% of the length of the existing pile body is affected by the hydration heat.
Under the influence of hydration heat, the new pile body experiences temperature increases, but the temperature gradually decreases over time. A pile body at a greater burial depth takes longer to completely freeze. Under construction conditions in November, the entire pile body achieves basic freezing (≤0 °C) in approximately 92 days. The winter season plays a crucial role in reducing thermal disturbances from new pile foundations and increasing the refreezing rate. Compared to other months, construction in the initial month of winter, i.e., November, increases the refreezing rate, which maximizes at 68% in approximately 60 days. Thus, November is the optimal construction time for the disease treatment of such pile foundations.

Author Contributions

X.S. collected all the data. Z.Z. and L.H. analyzed the data. X.S. and Y.W. carried out numerical simulations and wrote the manuscript. All authors have read and agreed to the published version of the manuscript.

Funding

This study was funded by the Gansu Provincial Science and Technology Program (NO.23JRRA1661, NO.22ZD6FA042), the Scientific Fund for Young Scientists of Gansu Academy of Sciences (NO. 2024QN-04, NO. 2023YQ-06), the Research Startup Fund of Gansu Academy of Sciences (NO. QD2021-01), and the Postdoctoral Science Foundation of Gansu Academy of Sciences (No. BSH2021-02).

Data Availability Statement

The original contributions presented in this study are included in the article. Further inquiries can be directed to the corresponding author.

Acknowledgments

The author would like to thank the editor and the reviewers for their valuable suggestions and constructive comments.

Conflicts of Interest

The authors declare no conflicts of interest.

References

  1. Cheng, G.; Sun, Z.; Niu, F. Application of the Roadbed Cooling Approach in Qinghai–Tibet Railway Engineering. Cold Reg. Sci. Technol. 2008, 53, 241–258. [Google Scholar] [CrossRef]
  2. Wang, S.; Chen, J.; Zhang, J.; Li, Z. Development of Highway Constructing Technology in the Permafrost Region on the Qinghai-Tibet Plateau. Sci. China Ser. E-Technol. Sci. 2009, 52, 497–506. [Google Scholar] [CrossRef]
  3. Zhang, S.; Niu, F.; Wang, S.; Sun, Y.; Wang, J.; Dong, T. Risk Assessment of Engineering Diseases of Embankment–Bridge Transition Section for Railway in Permafrost Regions. Permafr. Periglac. Process. 2022, 33, 46–62. [Google Scholar] [CrossRef]
  4. Guo, D.; Wang, H. Permafrost Degradation and Associated Ground Settlement Estimation under 2 °C Global Warming. Clim. Dyn. 2017, 49, 2569–2583. [Google Scholar] [CrossRef]
  5. Biskaborn, B.K.; Smith, S.L.; Noetzli, J.; Matthes, H.; Vieira, G.; Streletskiy, D.A.; Schoeneich, P.; Romanovsky, V.E.; Lewkowicz, A.G.; Abramov, A.; et al. Permafrost Is Warming at a Global Scale. Nat. Commun. 2019, 10, 264. [Google Scholar] [CrossRef]
  6. Jin, H.-J.; Wu, Q.-B.; Romanovsky, V.E. Degrading Permafrost and Its Impacts. Adv. Clim. Change Res. 2021, 12, 1–5. [Google Scholar] [CrossRef]
  7. Dourado, J.B.d.O.L.; Deng, L.; Chen, Y.; Chui, Y.-H. Foundations in Permafrost of Northern Canada: Review of Geotechnical Considerations in Current Practice and Design Examples. Geotechnics 2024, 4, 285–308. [Google Scholar] [CrossRef]
  8. Allen, J.; Huck, R.W. Frost Heaving of Piles in Permafrost; American Society of Civil Engineers: New York, NY, USA, 1972. [Google Scholar]
  9. Ivanin, A.S.; Kumallagov, V.A.; Smirnov, N.V. Field and Laboratory Studies of the Effect of Frost Heaving Tangential Forces on Pile Foundations. Sci. Technol. Oil Oil Prod. Pipeline Transp. 2020, 10, 460–469. [Google Scholar] [CrossRef]
  10. Lai, Y.; Xu, X.; Dong, Y.; Li, S. Present Situation and Prospect of Mechanical Research on Frozen Soils in China. Cold Reg. Sci. Technol. 2013, 87, 6–18. [Google Scholar] [CrossRef]
  11. Penner, E.; Gold, L.W. Transfer of Heaving Forces by Adfreezing to Columns and Foundation Walls in Frost-Susceptible Soils. Can. Geotech. J. 1971, 8, 514–526. [Google Scholar] [CrossRef]
  12. Mi, W. Study on Stability of Bridge Pile Foundation in Permafrost Area along Qinghai-Tibet Railway. J. Railw. Eng. Soc. 2010, 27, 15–19. [Google Scholar]
  13. Cao, Y. Study on Design of Pile Foundation in Permafrost Area on Qinghai-Tibet Railway Line. J. Railw. Eng. Soc. 2004, 21, 127–131. [Google Scholar]
  14. Yaping, W.; Luxin, Z.; Shiyun, Z. Nonlinear Analysis of Ground Refreezing Processfor Pile Group Bridge Foundation in Permafrost. China Civ. Eng. J. 2006, 39, 78–84. [Google Scholar]
  15. Wu, Q.; Ma, W.; Lai, Y.; Cheng, G. Permafrost Degradation Threatening the Qinghai–Xizang Railway. Engineering, 2024; in press. [Google Scholar] [CrossRef]
  16. Chen, K.; Yu, Q.; Guo, L.; Zhang, G.; Zhang, D. A Fast-Freezing System to Enhance the Freezing Force of Cast-in-Place Pile Quickly in Permafrost Regions. Cold Reg. Sci. Technol. 2020, 179, 103140. [Google Scholar] [CrossRef]
  17. Aksenov, V.I.; Kistanov, O.G. Estimation of Resistance Components to an Axial Load on Piles Embedded in Permafrost. Soil Mech. Found. Eng. 2008, 45, 71–75. [Google Scholar] [CrossRef]
  18. Shang, Y.; Niu, F.; Wu, X.; Liu, M. A Novel Refrigerant System to Reduce Refreezing Time of Cast-in-Place Pile Foundation in Permafrost Regions. Appl. Therm. Eng. 2018, 128, 1151–1158. [Google Scholar] [CrossRef]
  19. Jin, H.; Huang, Y.; Bense, V.F.; Ma, Q.; Marchenko, S.S.; Shepelev, V.V.; Hu, Y.; Liang, S.; Spektor, V.V.; Jin, X.; et al. Permafrost Degradation and Its Hydrogeological Impacts. Water 2022, 14, 372. [Google Scholar] [CrossRef]
  20. Shi, X.; Li, D.; Zhang, Z. Research on Bearing Capacity of Pile Foundation with Impact of Subpermafrost Water; Springer International Publishing: Cham, Switzerland, 2018. [Google Scholar]
  21. Tang, L.; Wang, K.; Deng, L.; Yang, G.; Chen, J.; Jin, L. Axial Loading Behaviour of Laboratory Concrete Piles Subjected to Permafrost Degradation. Cold Reg. Sci. Technol. 2019, 166, 102820. [Google Scholar] [CrossRef]
  22. Chen, Z. Thermal Stability of Fabricated Foundations with Different Warming Patterns in Permafrost Regions. China Earthq. Eng. J. 2013, 35, 876–884. [Google Scholar]
  23. You, Y.; Wang, J.; Wu, Q.; Yu, Q.; Pan, X.; Wang, X.; Guo, L. Causes of pile foundation failure in permafrost regions: The case study of a dry bridge of the Qinghai-Tibet Railway. Eng. Geol. 2017, 230, 95–103. [Google Scholar] [CrossRef]
  24. Qiu, K.; Yu, W.; Kong, X.; Han, F.; Zhao, Y. Investigation on the bearing capacity evolution of building pile foundation during permafrost degradation. Cold Reg. Sci. Technol. 2024, 221, 104152. [Google Scholar] [CrossRef]
  25. Hou, X.; Chen, J.; Yang, B.; Wang, J.; Dong, T.; Rui, P.; Mei, Q. Monitoring and simulation of the thermal behavior of cast-in-place pile group foundations in permafrost regions. Cold Reg. Sci. Technol. 2022, 196, 103486. [Google Scholar] [CrossRef]
  26. Zhi, W.; Yu, S.; Wei, M.; Jilin, Q.; Wu, J. Analysis on Effect of Permafrost Protection by Two-Phase Closed Thermosyphon and Insulation Jointly in Permafrost Regions. Cold Reg. Sci. Technol. 2005, 43, 150–163. [Google Scholar] [CrossRef]
  27. Niu, F.; Shang, Y.; Luo, J.; Liu, M.; Gao, Z.; Yuan, K.; Chen, D. Cooling Effect of Two-Phase Closed Thermosyphons on a Cast-In-Place Pile Foundation in a Permafrost Region. J. Cold Reg. Eng. 2025, 39, 04024042. [Google Scholar] [CrossRef]
  28. Comini, G.; Guidice, S.D.; Lewis, R.W.; Zienkiewicz, O.C. Finite Element Solution of Non-linear Heat Conduction Problems with Special Reference to Phase Change. Int. J. Numer. Methods Eng. 1974, 8, 613–624. [Google Scholar] [CrossRef]
  29. Shi, X. Study on the Thermostability of Pile Foundation Under Subpermafrost Water. Master’s Thesis, Lanzhou Jiaotong University, Lanzhou, China, 2016. [Google Scholar]
  30. Zhu, L.N. Study of the Adherent Layer on Different Types of Ground in Permafrost Regions on the Qinghai-Xizang Plateau. J. Glaciol. Geocryol. 1988, 10, 8–14. [Google Scholar]
  31. Ballim, Y.; Graham, P.C. A Maturity Approach to the Rate of Heat Evolution in Concrete. Mag. Concr. Res. 2003, 55, 249–256. [Google Scholar] [CrossRef]
  32. Kramer, S.L. Geotechnical Earthquake Engineering; Prentice Hall: Upper Saddle River, NJ, USA, 1996; p. 07458. [Google Scholar]
  33. Avilés, J.; Suárez, M. Effective Periods and Dampings of Building-Foundation Systems Including Seismic Wave Effects. Eng. Struct. 2002, 24, 553–562. [Google Scholar] [CrossRef]
  34. Forcellini, D. A Novel Framework to Assess Soil Structure Interaction (SSI) Effects with Equivalent Fixed-Based Models. Appl. Sci. 2021, 11, 10472. [Google Scholar] [CrossRef]
Figure 1. Schematic diagram of the geometric model.
Buildings 15 00684 g001
Figure 2. Temperature field distribution after the pile construction in May.
Buildings 15 00684 g002
Figure 3. Temperature field distribution after the pile construction in November.
Buildings 15 00684 g003
Figure 4. Comparison curves of ground temperatures between existing pile foundations and undisturbed ground at 30 d, 60 d, 120 d, and 240 d after the pile construction in November.
Buildings 15 00684 g004
Figure 5. Comparison of ground temperatures between existing pile foundations and undisturbed ground at 180 days after the pile construction in different months.
Buildings 15 00684 g005aBuildings 15 00684 g005b
Figure 6. Ground temperature curves at different depths of an existing pile over time.
Buildings 15 00684 g006
Figure 7. Contour plot of the new pile temperature in November construction.
Buildings 15 00684 g007
Figure 8. Refreezing rate curves under construction conditions in different months.
Buildings 15 00684 g008
Table 1. Thermal parameters of soil.
LithologyDepth
(m)
θ 0
(%)
C u
(kJ/(m3·K))
C f
(kJ/(m3·K))
λ u
(W/(m·K))
λ f
(W/(m·K))
Fine angular gravel−1.0–018.0191115771.111.26
Fine sand−5.0–−1.015.0183415251.291.43
Weathered bedrock−20.0–−5.012.0254921401.491.61
−50.0–−20.010.0239020211.521.63
Table 2. Initial phase angles.
Month1357911
θ π /2 π /6 π /6 π /2 5 π /6 7 π /6
Disclaimer/Publisher’s Note: The statements, opinions and data contained in all publications are solely those of the individual author(s) and contributor(s) and not of MDPI and/or the editor(s). MDPI and/or the editor(s) disclaim responsibility for any injury to people or property resulting from any ideas, methods, instructions or products referred to in the content.

