
Innovative Solutions: Comparative Study of Laboratory and In Situ Measurements of Thermal Properties of Bark Insulated Exterior Walls


Abstract
1. Introduction
- 5.72 €/m2 for EPS (12–30 kg/m3), λ = 0.032–0.042 W/mK
- 16.52 €/m2 for MW (10–200 kg/m3), λ = 0.035–0.050 W/mK
- Approx. 1.98 €/m2 for raw material–tree bark (approx. 300 kg/m3),
- λ = 0.0651–0.0657 W/mK according to [15]
2. Materials and Methods
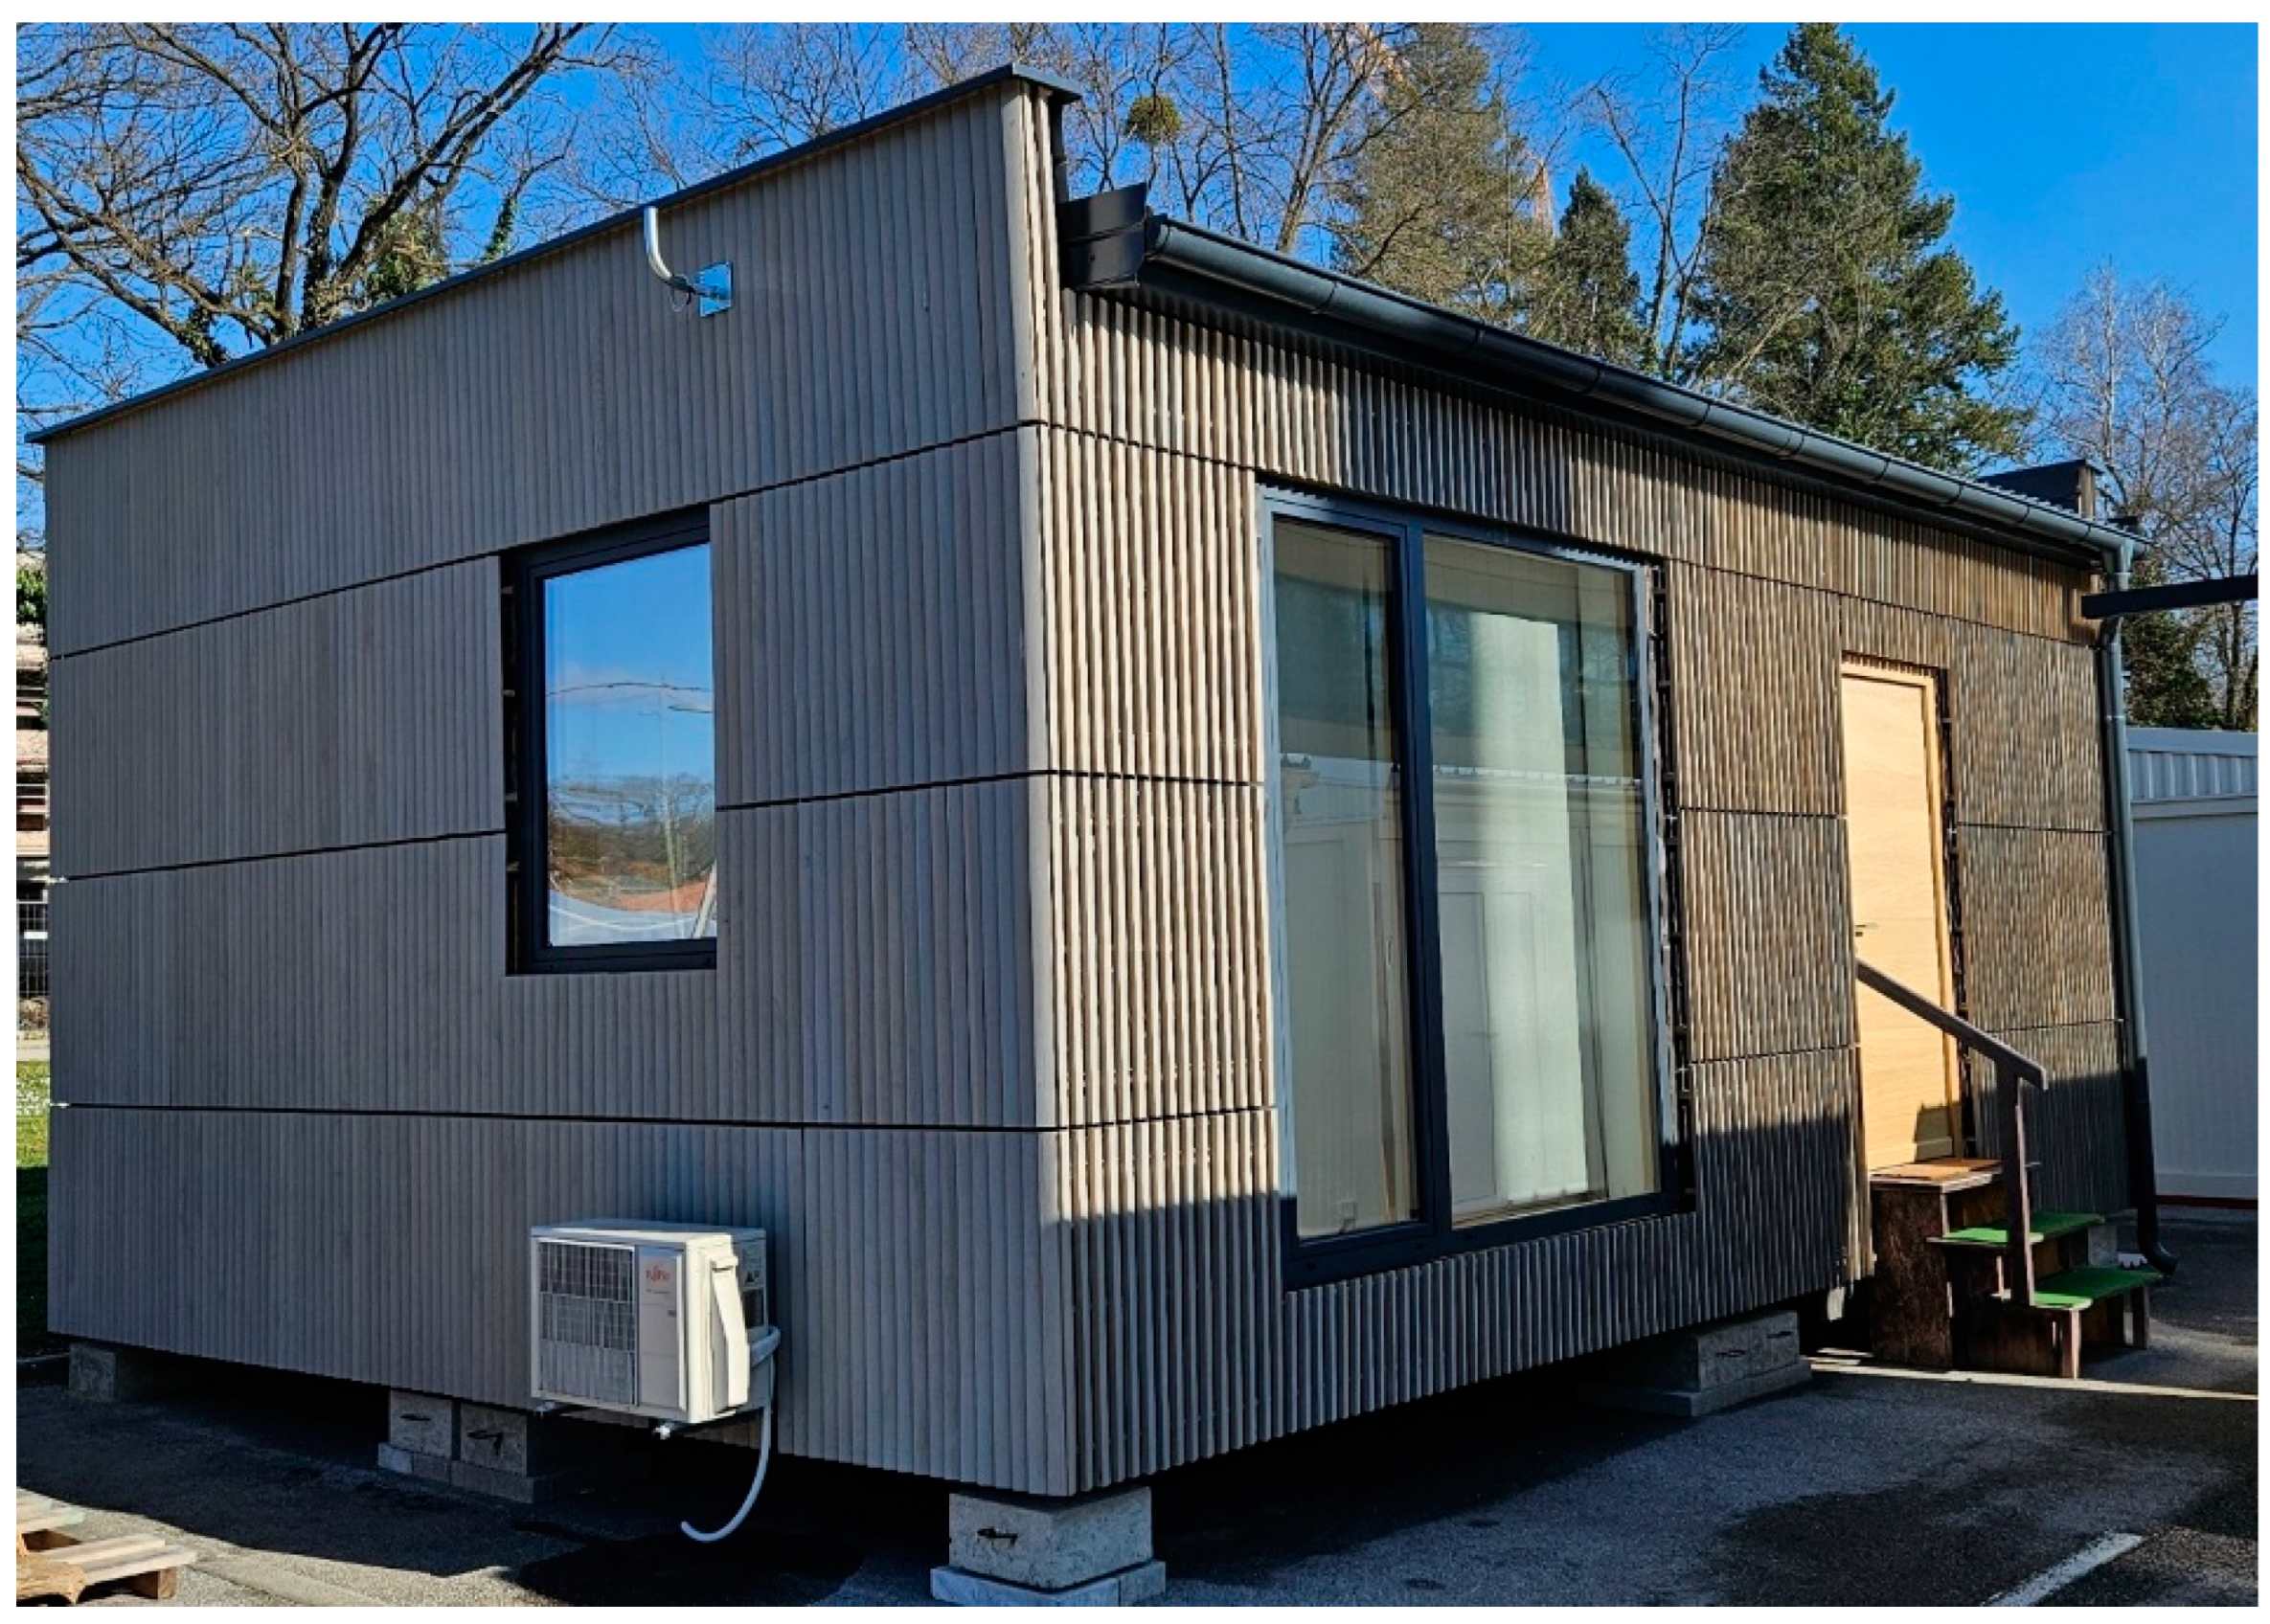
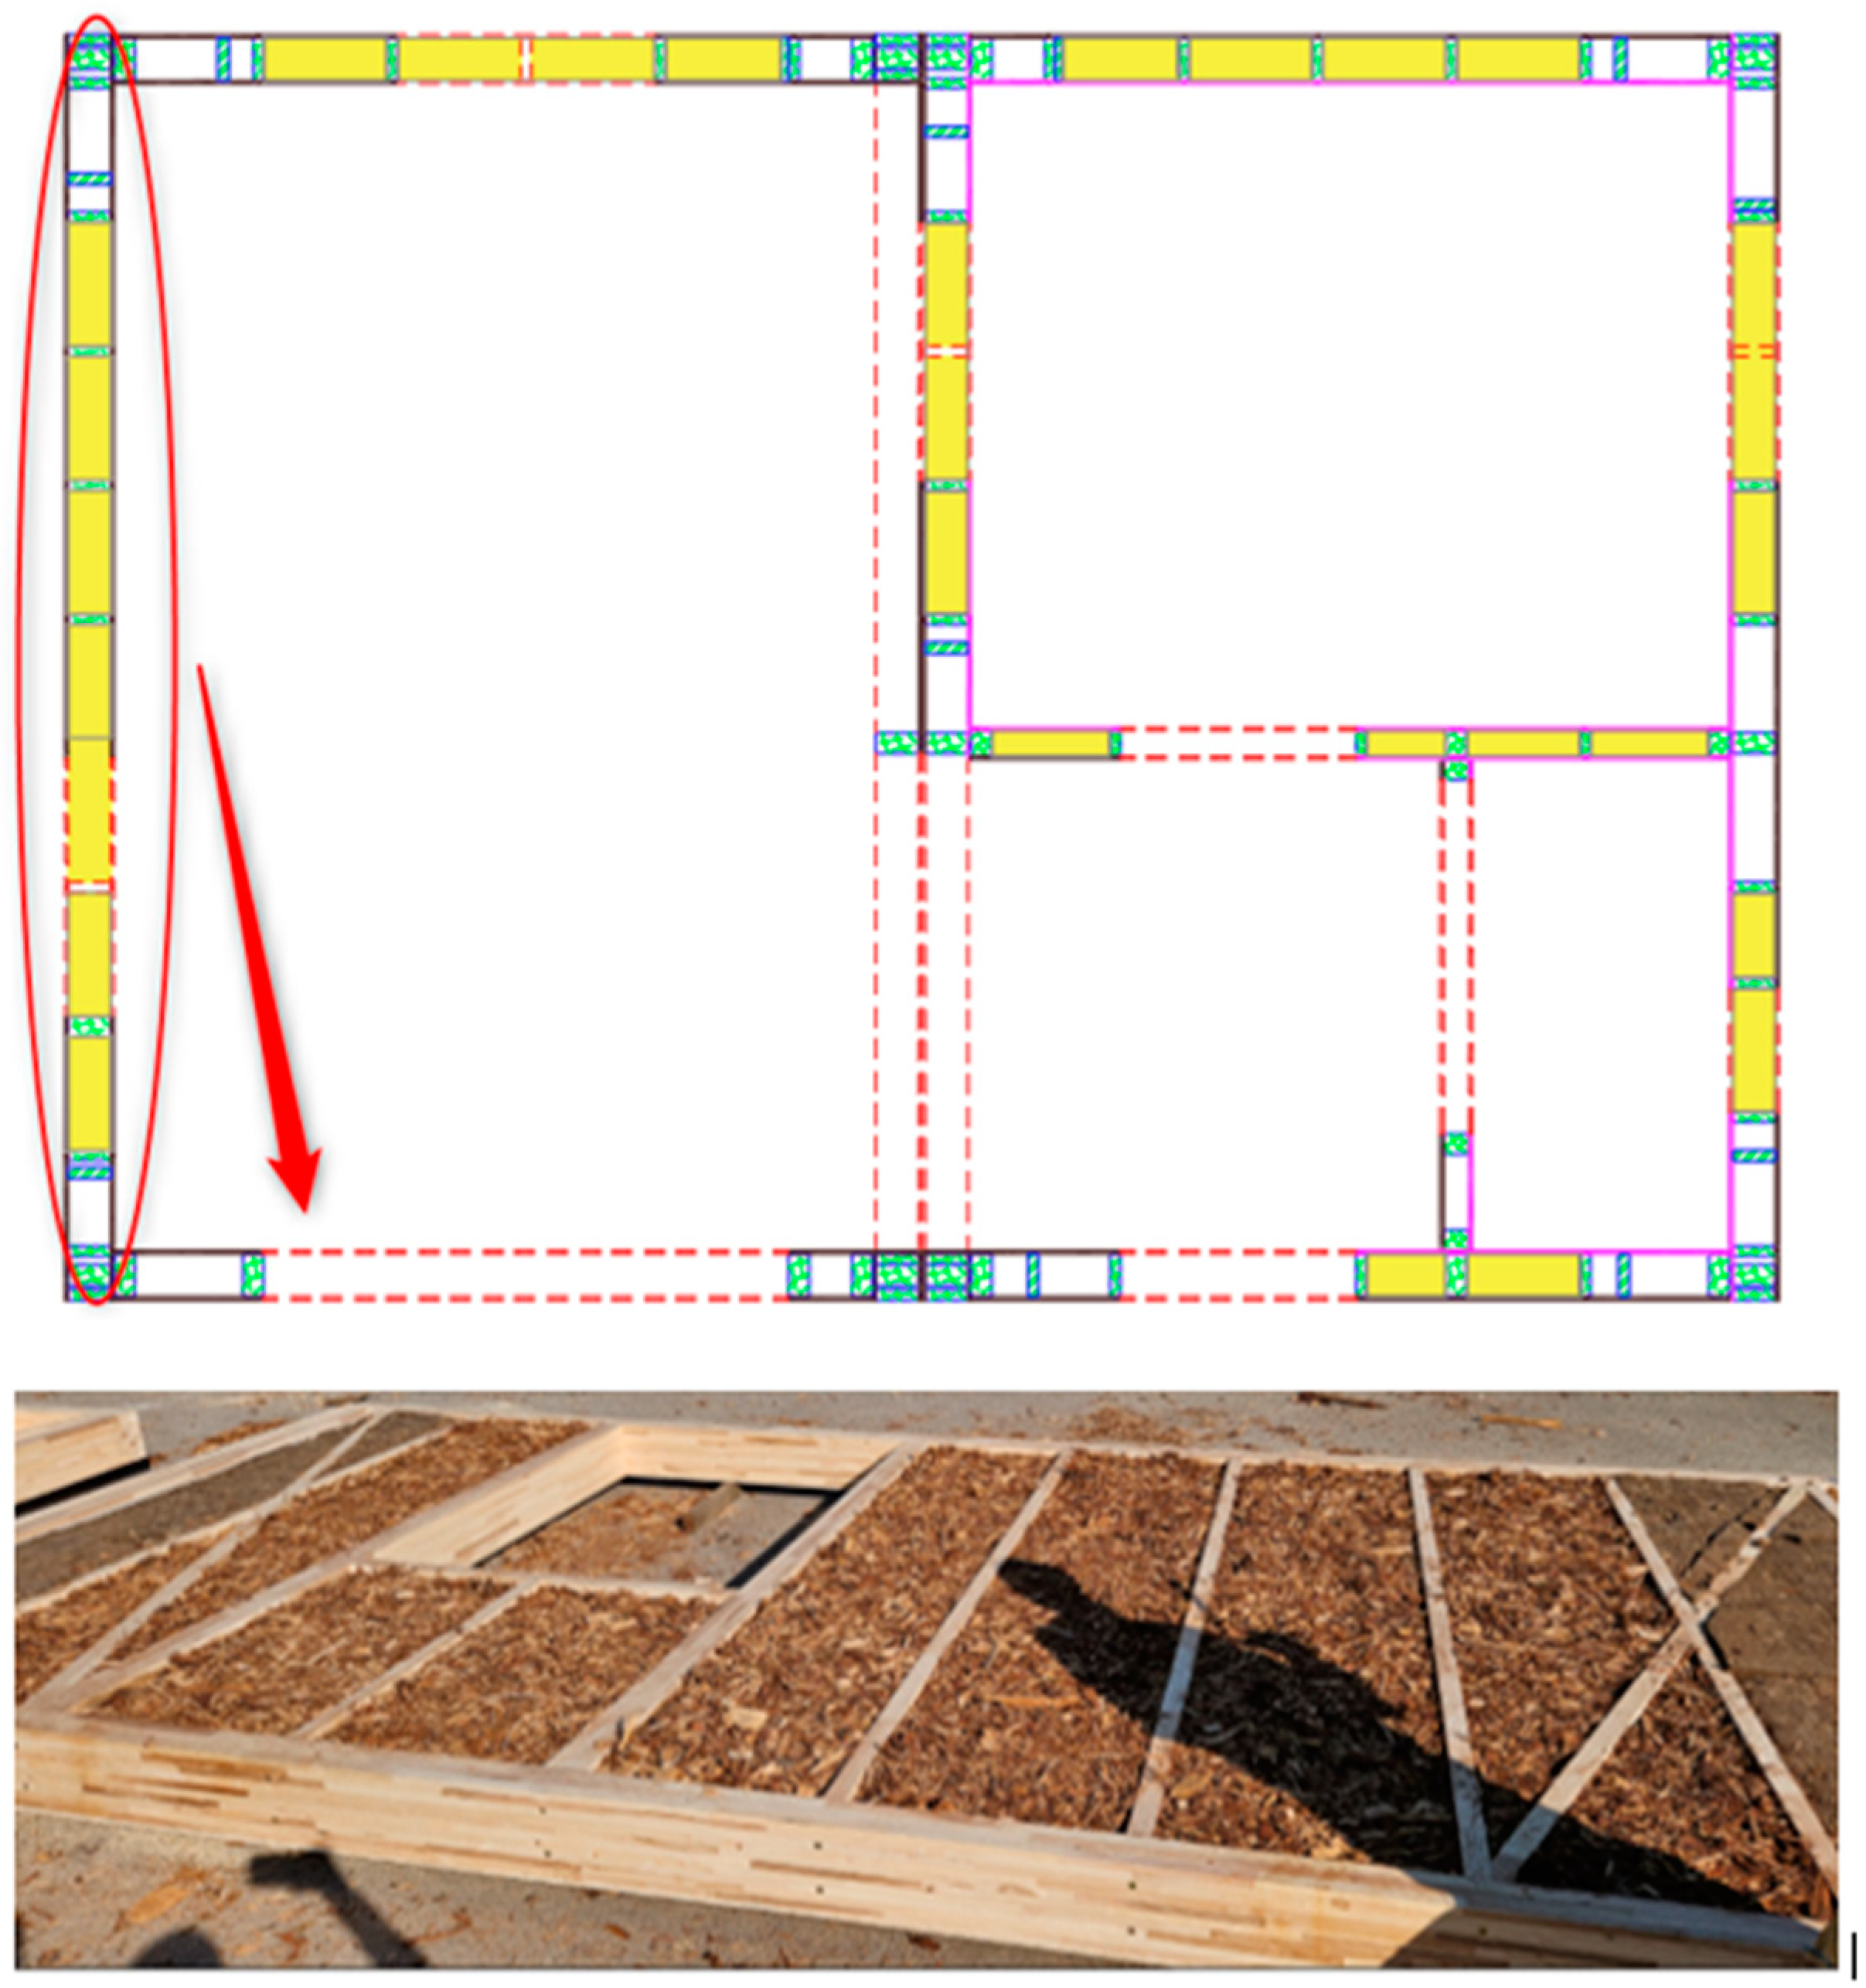
2.1. Experimental Bungalow
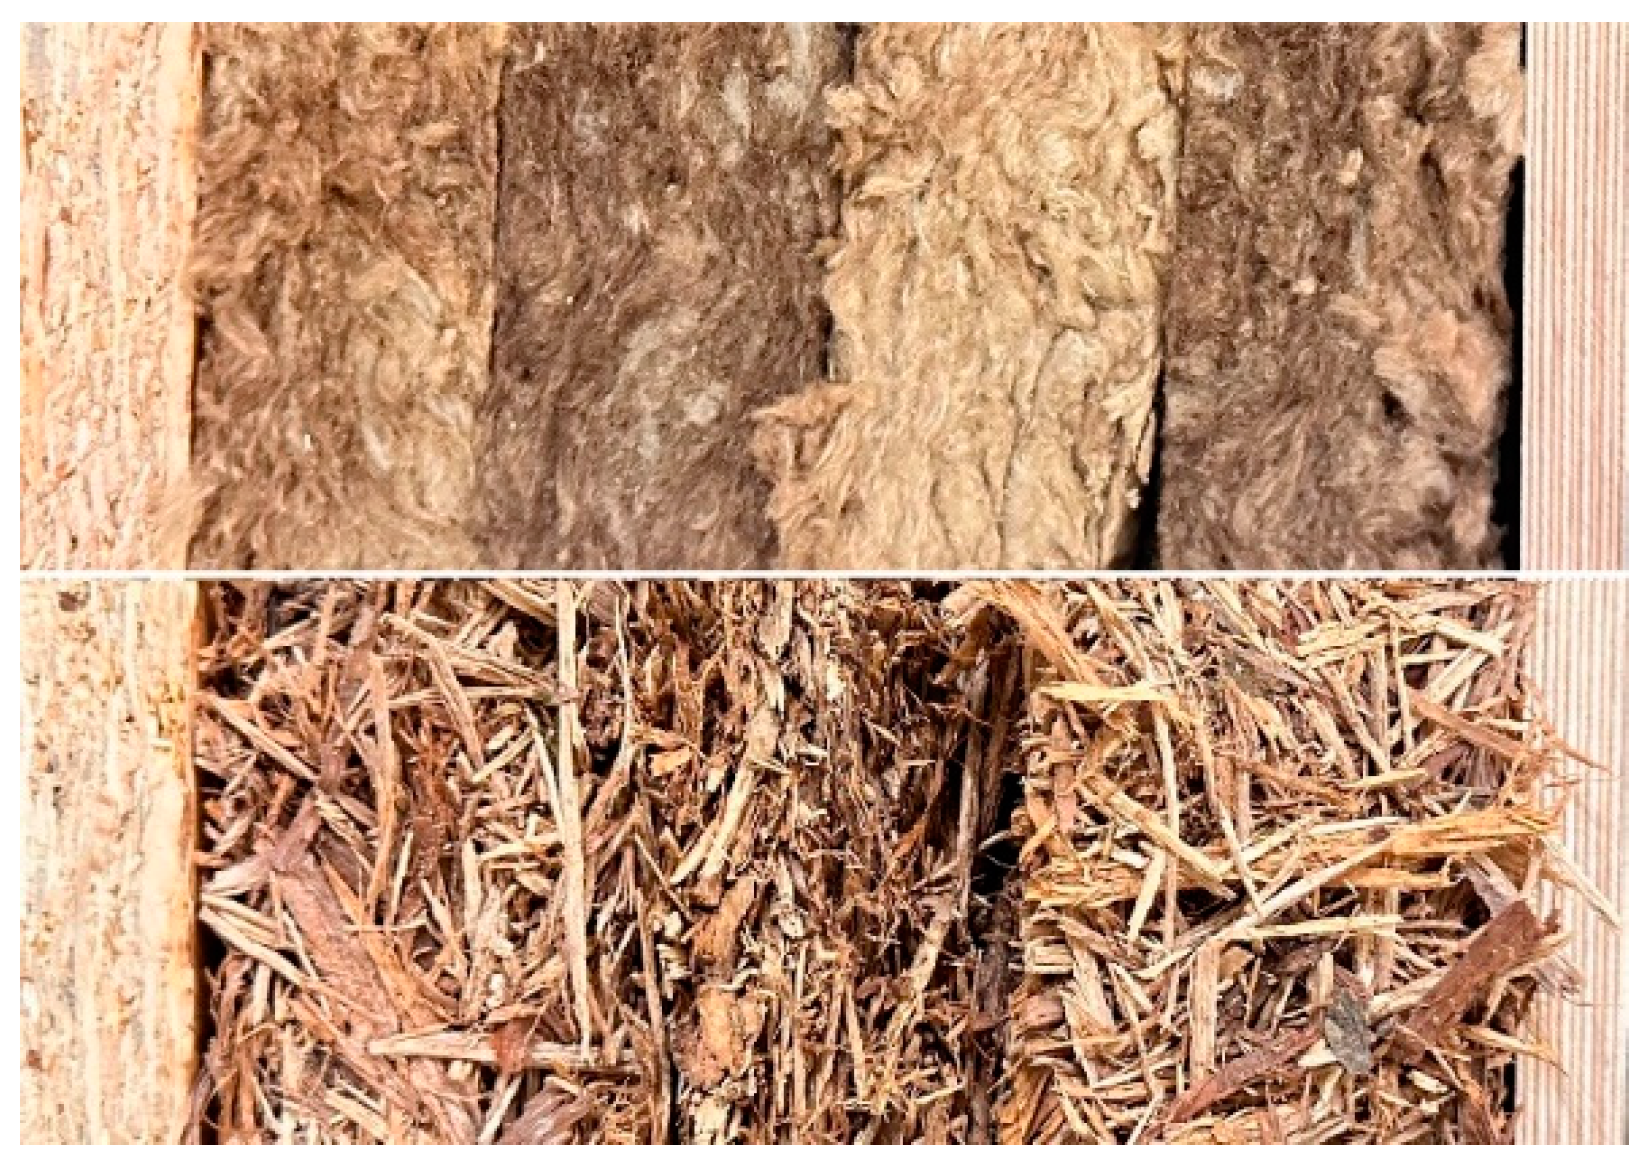
2.2. Thermal Properties Testing on the Material Level
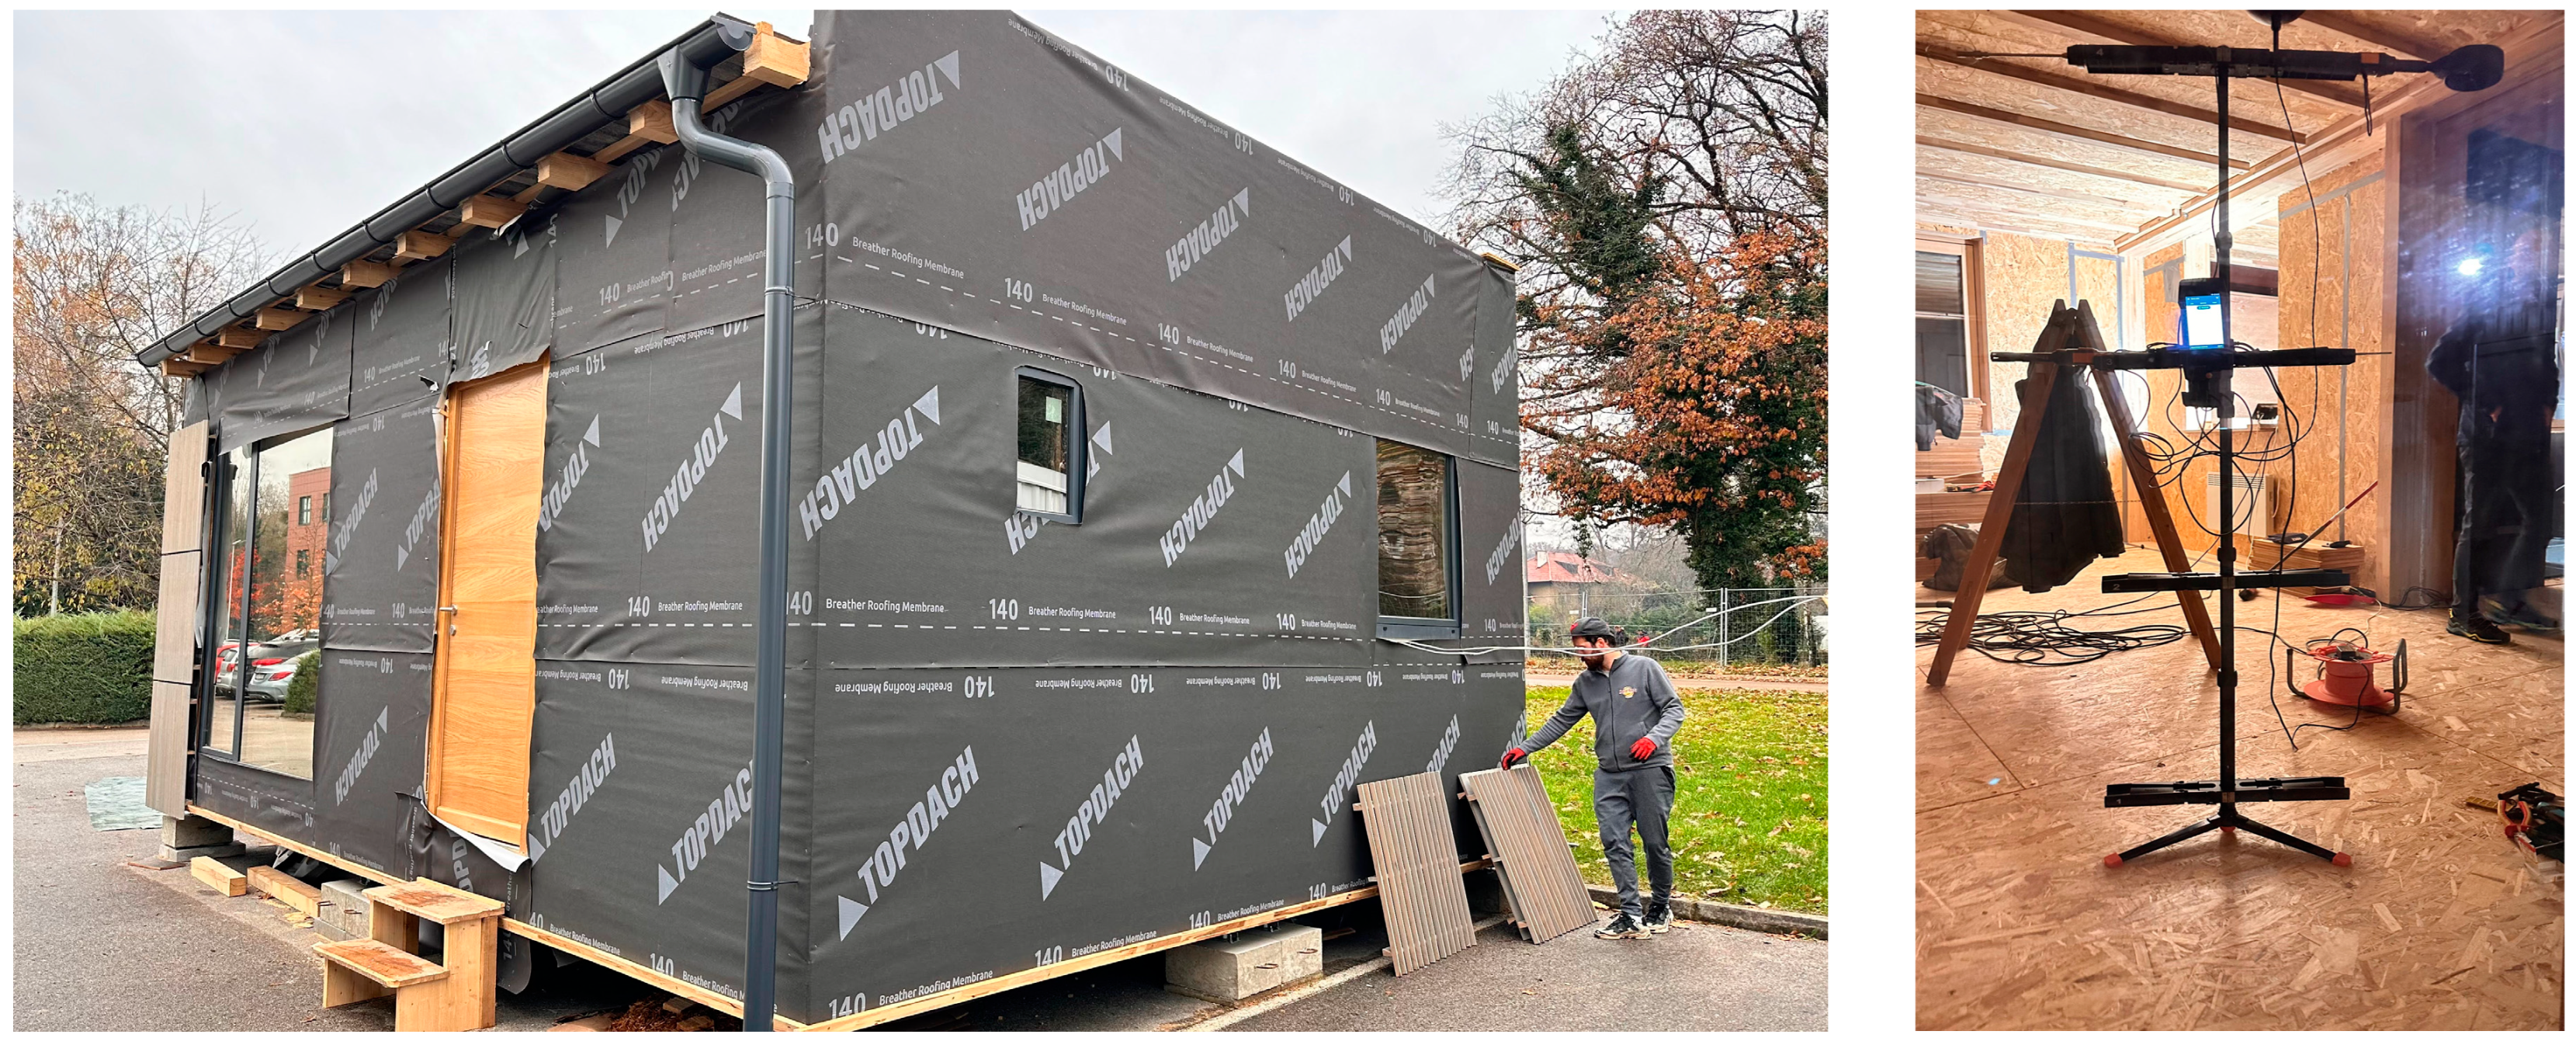
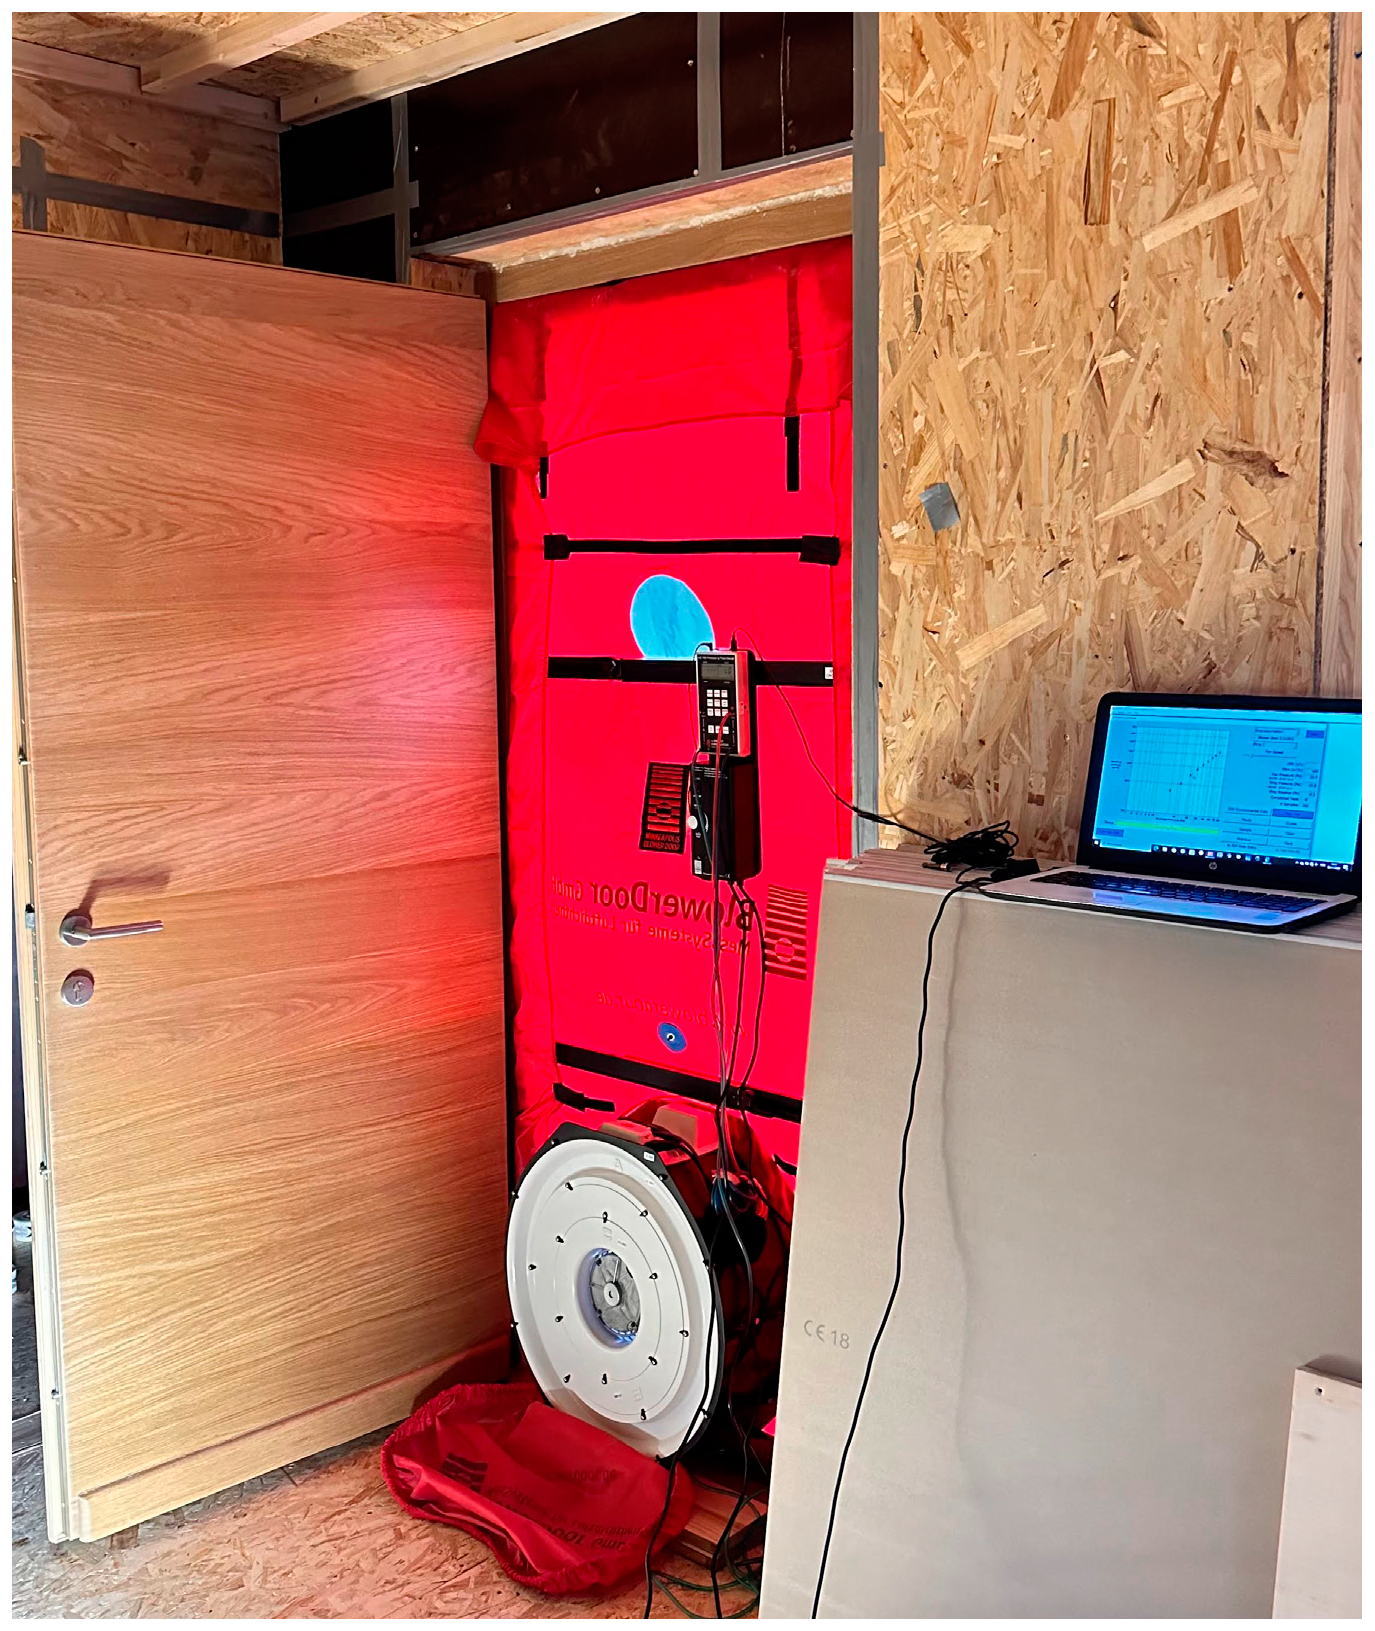
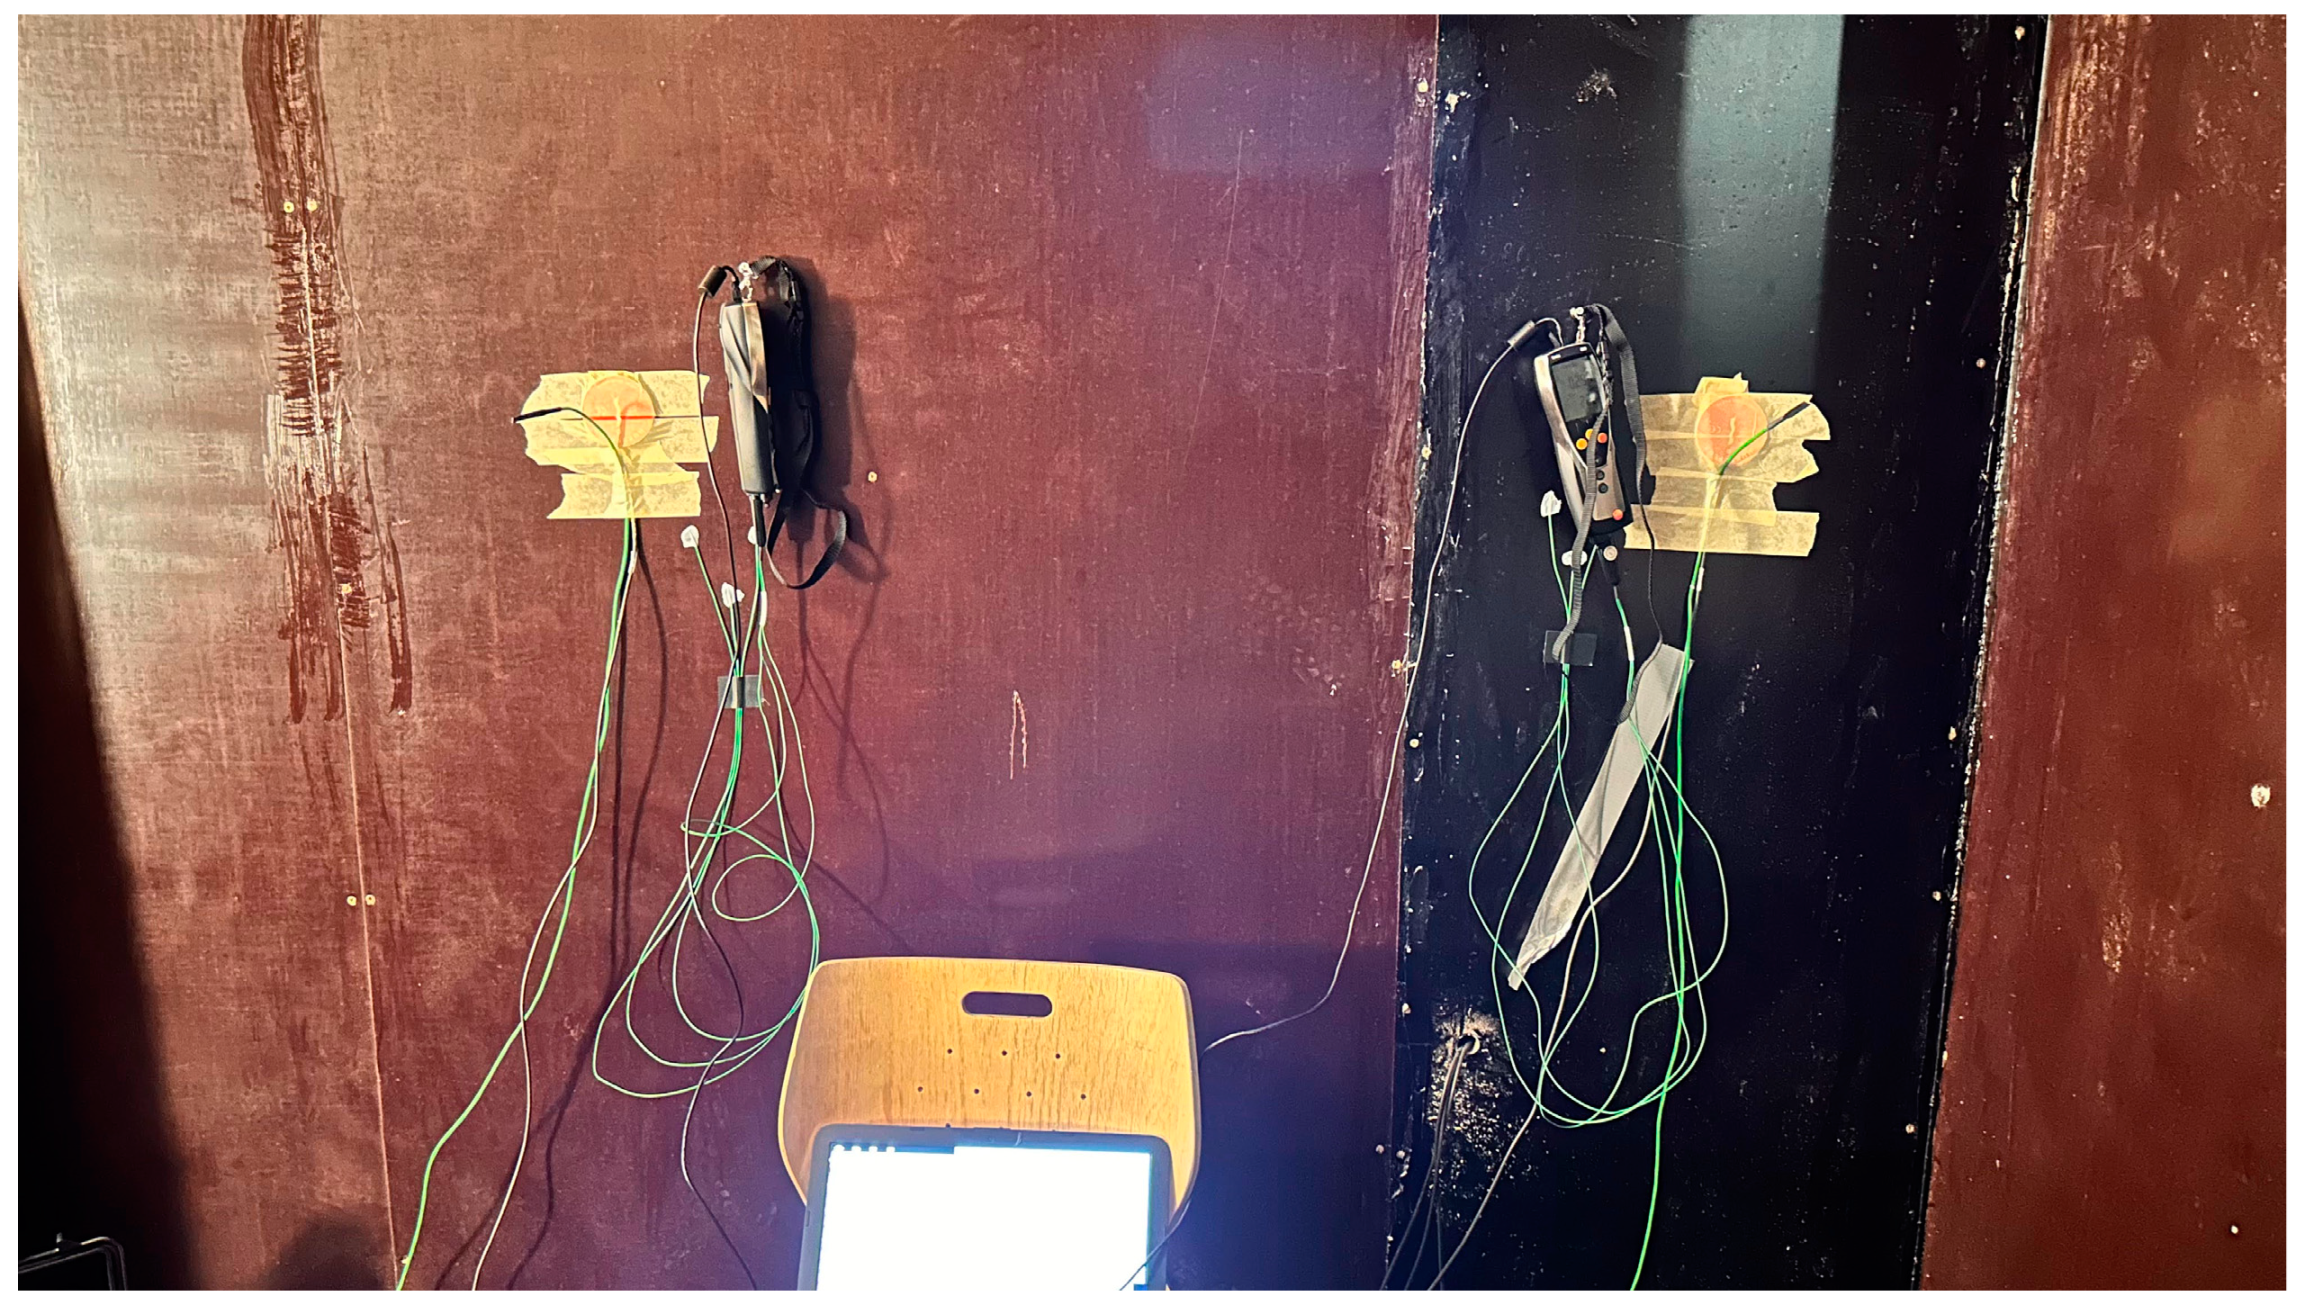
2.3. In Situ Testing of Thermal Properties of External Walls
3. Results and Discussion
3.1. Thermal Properties Testing on the Material Level
3.2. In Situ Testing of Thermal Properties of External Walls
- U-values obtained by measurements for Wall 1 are higher than calculated ones, 26%;
- U-values obtained by measurements for Wall 2 are slightly lower than calculated ones, less than 10%;
4. Conclusions
Author Contributions
Funding
Data Availability Statement
Acknowledgments
Conflicts of Interest
Abbreviations
| MW | Mineral wool |
| EU | European Union |
| OSB | Oriented strand board |
| IRT | Infra-Red Thermography |
| EPS | Expanded polystyrene |
| GWP | Global warming potential |
| POCP | Formation potential of tropospheric ozone |
| ADP-fossil fuels | Abiotic depletion potential |
| PENRT | Primary energy and primary energy resources used as raw materials |
| HFM | Heat flow method |
| TBM | Temperature-based Method |
| TB | Tree bark |
| nZEB | Nearly zero-energy buildings |
References
- Ozel, M. Cost analysis for optimum thicknesses and environmental impacts of different insulation materials. Energy Build. 2012, 49, 552–559. [Google Scholar] [CrossRef]
- Pargana, N.; Pinheiro, M.D.; Silvestre, J.D.; de Brito, J. Comparative environmental life cycle assessment of thermal insulation materials of buildings. Energy Build. 2014, 82, 466–481. [Google Scholar] [CrossRef]
- Levia, D.; Herwitz, S. Interspecific variation of bark water storage capacity of three deciduous tree species in relation to stemflow yield and solute flux to forest soils. Catena 2005, 64, 117–137. [Google Scholar] [CrossRef]
- Gaff, M.; Sandberg, D.; Kuzman, M. Engineered Wood Products: Wood as an Engineering and Architectural Material; Czech University of Life Sciences: Prague, Czech Republic, 2018. [Google Scholar]
- Borysiuk, P.; Boruszewski, P.; Auriga, R.; Danecki, L.; Auriga, A.; Rybak, K.; Nowacka, M. Influence of a bark-filler on the properties of PLA biocomposites. J. Mater. Sci. 2021, 56, 9196–9208. [Google Scholar] [CrossRef]
- Pásztory, Z.; Ronyecz, I. The Thermal Insulation Capacity of Tree Bark. Acta Silv. Lignaria Hung. 2013, 9, 111–117. [Google Scholar] [CrossRef]
- Kain, G. Design of Tree Bark Insulation Boards: Analysis of Material, Structure and Property Relationships. Ph.D. Thesis, Technischen Universität München, Munich, Germany, 2016. [Google Scholar]
- Pasztory, Z.; Mohácsiné, I.R.; Gorbacheva, G.; Börcsök, Z. The utilization of tree bark. BioResources 2016, 11, 7859–7888. [Google Scholar] [CrossRef]
- Marrakech Partnership for Global Climate Action [MPGCA]. 2021. Available online: https://unfccc.int/climate-action/marrakech-partnership-for-global-climate-action (accessed on 30 January 2024).
- Violano, A.; Cannaviello, M. The Carbon Footprint of Thermal Insulation: The Added Value of Circular Models Using Recycled Textile Waste. Energies 2023, 16, 6768. [Google Scholar] [CrossRef]
- Asdrubali, F.; D’Alessandro, F.; Schiavoni, S. A review of unconventional sustainable building insulation materials. Sustain. Mater. Technol. 2015, 4, 1–17. [Google Scholar] [CrossRef]
- Ata-Ali, N.; Penadés-Plà, V.; Martínez-Muñoz, D.; Yepes, V. Recycled versus non-recycled insulation alternatives: LCA analysis for different climatic conditions in Spain. Resour. Conserv. Recycl. 2021, 175, 105838. [Google Scholar] [CrossRef]
- Kunič, R. Carbon footprint of thermal insulation materials in building envelopes. Energy Effic. 2017, 10, 1511–1528. [Google Scholar] [CrossRef]
- Moncaster, A.; Symons, K. A method and tool for ‘cradle to grave’ embodied carbon and energy impacts of UK buildings in compliance with the new TC350 standards. Energy Build. 2013, 66, 514–523. [Google Scholar] [CrossRef]
- Volf, M.; Diviš, J.; Havlík, F. Thermal, Moisture and Biological Behaviour of Natural Insulating Materials. Energy Procedia 2015, 78, 1599–1604. [Google Scholar] [CrossRef]
- Styrofoam for Facades 10 cm—EPS 70, with Fold. Available online: https://www.ikoma.hr/hr/fasade-143/stiropor-eps-145/stiropor-za-fasade-10-cm-eps-70-s-preklopom-2944/#tab-description (accessed on 31 January 2024).
- Stone Wool for Facades 10 cm—KNAUF Insulation FKD-N Thermal. Available online: https://www.ikoma.hr/hr/fasade-143/kamena-vuna-za-fasade-535/kamena-vuna-za-fasade-10-cm-knauf-insulation-fkd-n-thermal-6215/#tab-description (accessed on 31 January 2024).
- Superti, V.; Forman, T.V.; Houmani, C. Recycling Thermal Insulation Materials: A Case Study on More Circular Management of Expanded Polystyrene and Stonewool in Switzerland and Research Agenda. Resources 2021, 10, 104. [Google Scholar] [CrossRef]
- Michalak, J.; Czernik, S.; Marcinek, M.; Michałowski, B. Environmental burdens of External Thermal Insulation Systems. Expanded Polystyrene vs. Mineral Wool: Case Study from Poland. Sustainability 2020, 12, 4532. [Google Scholar] [CrossRef]
- Kain, G.; Tudor, E.M.; Barbu, M.-C. Bark Thermal Insulation Panels: An Explorative Study on the Effects of Bark Species. Polymers 2020, 12, 2140. [Google Scholar] [CrossRef]
- Kain, G.; Barbu, M.C.; Hinterreiter, S.; Richter, K.; Petutschnigg, A. Bark as Heat Insulation Material. BioResources 2013, 8, 3718–3731. [Google Scholar] [CrossRef]
- Pásztory, Z.; Mohácsiné, I.R.; Börcsök, Z. Investigation of thermal insulation panels made of black locust tree bark. Constr. Build. Mater. 2017, 147, 733–735. [Google Scholar] [CrossRef]
- TA Instruments. Available online: https://www.tainstruments.com/fox-200ht/ (accessed on 25 February 2025).
- Wargocki, P.; Wyon, D.P.; Sundell, J.; Clausen, G.; Fanger, P.O. The effects of outdoor air supply rate in an office on perceived air quality, sick building syndrome (SBS) symptoms and productivity. Indoor Air 2000, 10, 222–236. [Google Scholar] [CrossRef]
- Kalamees, T. Air tightness and air leakages of new lightweight single-family detached houses in Estonia. Build. Environ. 2007, 42, 2369–2377. [Google Scholar] [CrossRef]
- Poupard, O.; Blondeau, P.; Iordache, V.; Allard, F. Statistical analysis of parameters influencing the relationship between outdoor and indoor air quality in schools. Atmospheric Environ. 2005, 39, 2071–2080. [Google Scholar] [CrossRef]
- Sherman, M.H.; Chan, R. Building Airtightness: Research and Practice. In Building Ventilation; Santamouris, M., Wouters, P., Eds.; Routledge: London, UK, 2006. [Google Scholar]
- Max, H.S.; Nance, M. Air Tightness of New U.S. Houses: A Preliminary Report; LBL Publications: Berkeley, CA, USA, 2002. [Google Scholar]
- Relander, T.-O.; Holøs, S.; Thue, J.V. Airtightness estimation—A state of the art review and an en route upper limit evaluation principle to increase the chances that wood-frame houses with a vapour- and wind-barrier comply with the airtightness requirements. Energy Build. 2012, 54, 444–452. [Google Scholar] [CrossRef]
- Teni, M.; Krstić, H.; Kosiński, P. Review and comparison of current experimental approaches for in-situ measurements of building walls thermal transmittance. Energy Build. 2019, 203, 109417. [Google Scholar] [CrossRef]
- Çengel, Y.A. Heat Transfer: A Practical Approach; McGraw-Hill: New York, NY, USA, 2004. [Google Scholar]
- Kain, G.; Güttler, V.; Barbu, M.-C.; Petutschnigg, A.; Richter, K.; Tondi, G. Density related properties of bark insulation boards bonded with tannin hexamine resin. Eur. J. Wood Wood Prod. 2014, 72, 417–424. [Google Scholar] [CrossRef]
- Uređenja, M.G.I.P. Technical Regulation on the Rational Use of Energy and Thermal Insulation in Buildings. Nar. Novine 2015, 128. (In Polish). Available online: https://narodne-novine.nn.hr/clanci/sluzbeni/2015_11_128_2428.html (accessed on 25 February 2025).
- ISO 9972:2015; Thermal Performance of Buildings—Determination of Air Permeability of Buildings—Fan Pressurization Method. BSI Standard Publication: London, UK, 2015.
- ISO 9972:1996; Thermal Performance of Buildings—Determination of Air Permeability of Buildings—Fan Pressurization Method. Slovenian Institute for Standardization: Ljubljana, Slovenia, 2002.
- Rodríguez-Soria, B.; Domínguez-Hernández, J.; Pérez-Bella, J.M.; del Coz-Díaz, J.J. Review of international regulations governing the thermal insulation requirements of residential buildings and the harmonization of envelope energy loss. Renew. Sustain. Energy Rev. 2014, 34, 78–90. [Google Scholar] [CrossRef]
- ISO 9869-1:2014; Thermal Insulation—Building Elements—In-Situ Measurement of Thermal Resistance and Thermal Transmittance—Part 1: Heat Flow Meter Method. International Organization for Standardization: Geneva, Switzerland, 2014.
- Standard UNI 10351; Thermal Conductivity and Vapour Permeability. UNI: Milan, Italy, 1994.
- Albatici, R.; Tonelli, A.M.; Chiogna, M. A comprehensive experimental approach for the validation of quantitative infrared thermography in the evaluation of building thermal transmittance. Appl. Energy 2015, 141, 218–228. [Google Scholar] [CrossRef]
- Lucchi, E. Thermal transmittance of historical brick masonries: A comparison among standard data, analytical calculation procedures, and in situ heat flow meter measurements. Energy Build. 2017, 134, 171–184. [Google Scholar] [CrossRef]
- Evangelisti, L.; Guattari, C.; Gori, P.; Vollaro, R.D.L. In Situ Thermal Transmittance Measurements for Investigating Differences between Wall Models and Actual Building Performance. Sustainability 2015, 7, 10388. [Google Scholar] [CrossRef]


| External Wall Element | Sample Number | Thickness [mm] | Coefficient of Thermal Conductivity [W/mK] | Average [W/mK] | Deviation from Average |
|---|---|---|---|---|---|
| OSB panel | 1 | 24.55 | 0.1041 | 0.1068 | −3% |
| 2 | 24.53 | 0.1075 | 1% | ||
| 3 | 24.41 | 0.1088 | 2% | ||
| Tree bark insulation | 1 | 47.82 | 0.07849 | 0.0760 | 3% |
| 2 | 45.44 | 0.07353 | −3% | ||
| 3 | 47.5 | 0.07288 | −4% | ||
| Mineral Wool | 1 | 43.55 | 0.0361 | 0.0351 | 3% |
| 2 | 40.47 | 0.03476 | −1% | ||
| 3 | 36.68 | 0.03456 | −2% | ||
| Veneer plywood | 1 | 14.87 | 0.1231 | 0.1267 | −3% |
| 2 | 14.6 | 0.1289 | 2% | ||
| 3 | 15.02 | 0.1282 | 1% |
| Material | Thermal Conductivity (λ, W/mK)—Measured Average Values | Thermal Conductivity (λ, W/mK)—Values According to [26] |
|---|---|---|
| OSB panel | 0.1068 | 0.130 |
| Mineral Wool | 0.0351 | 0.034–0.038 |
| Veneer plywood | 0.1267 | 0.100–0.180 |
| Tree bark | 0.0760 | N.A. |
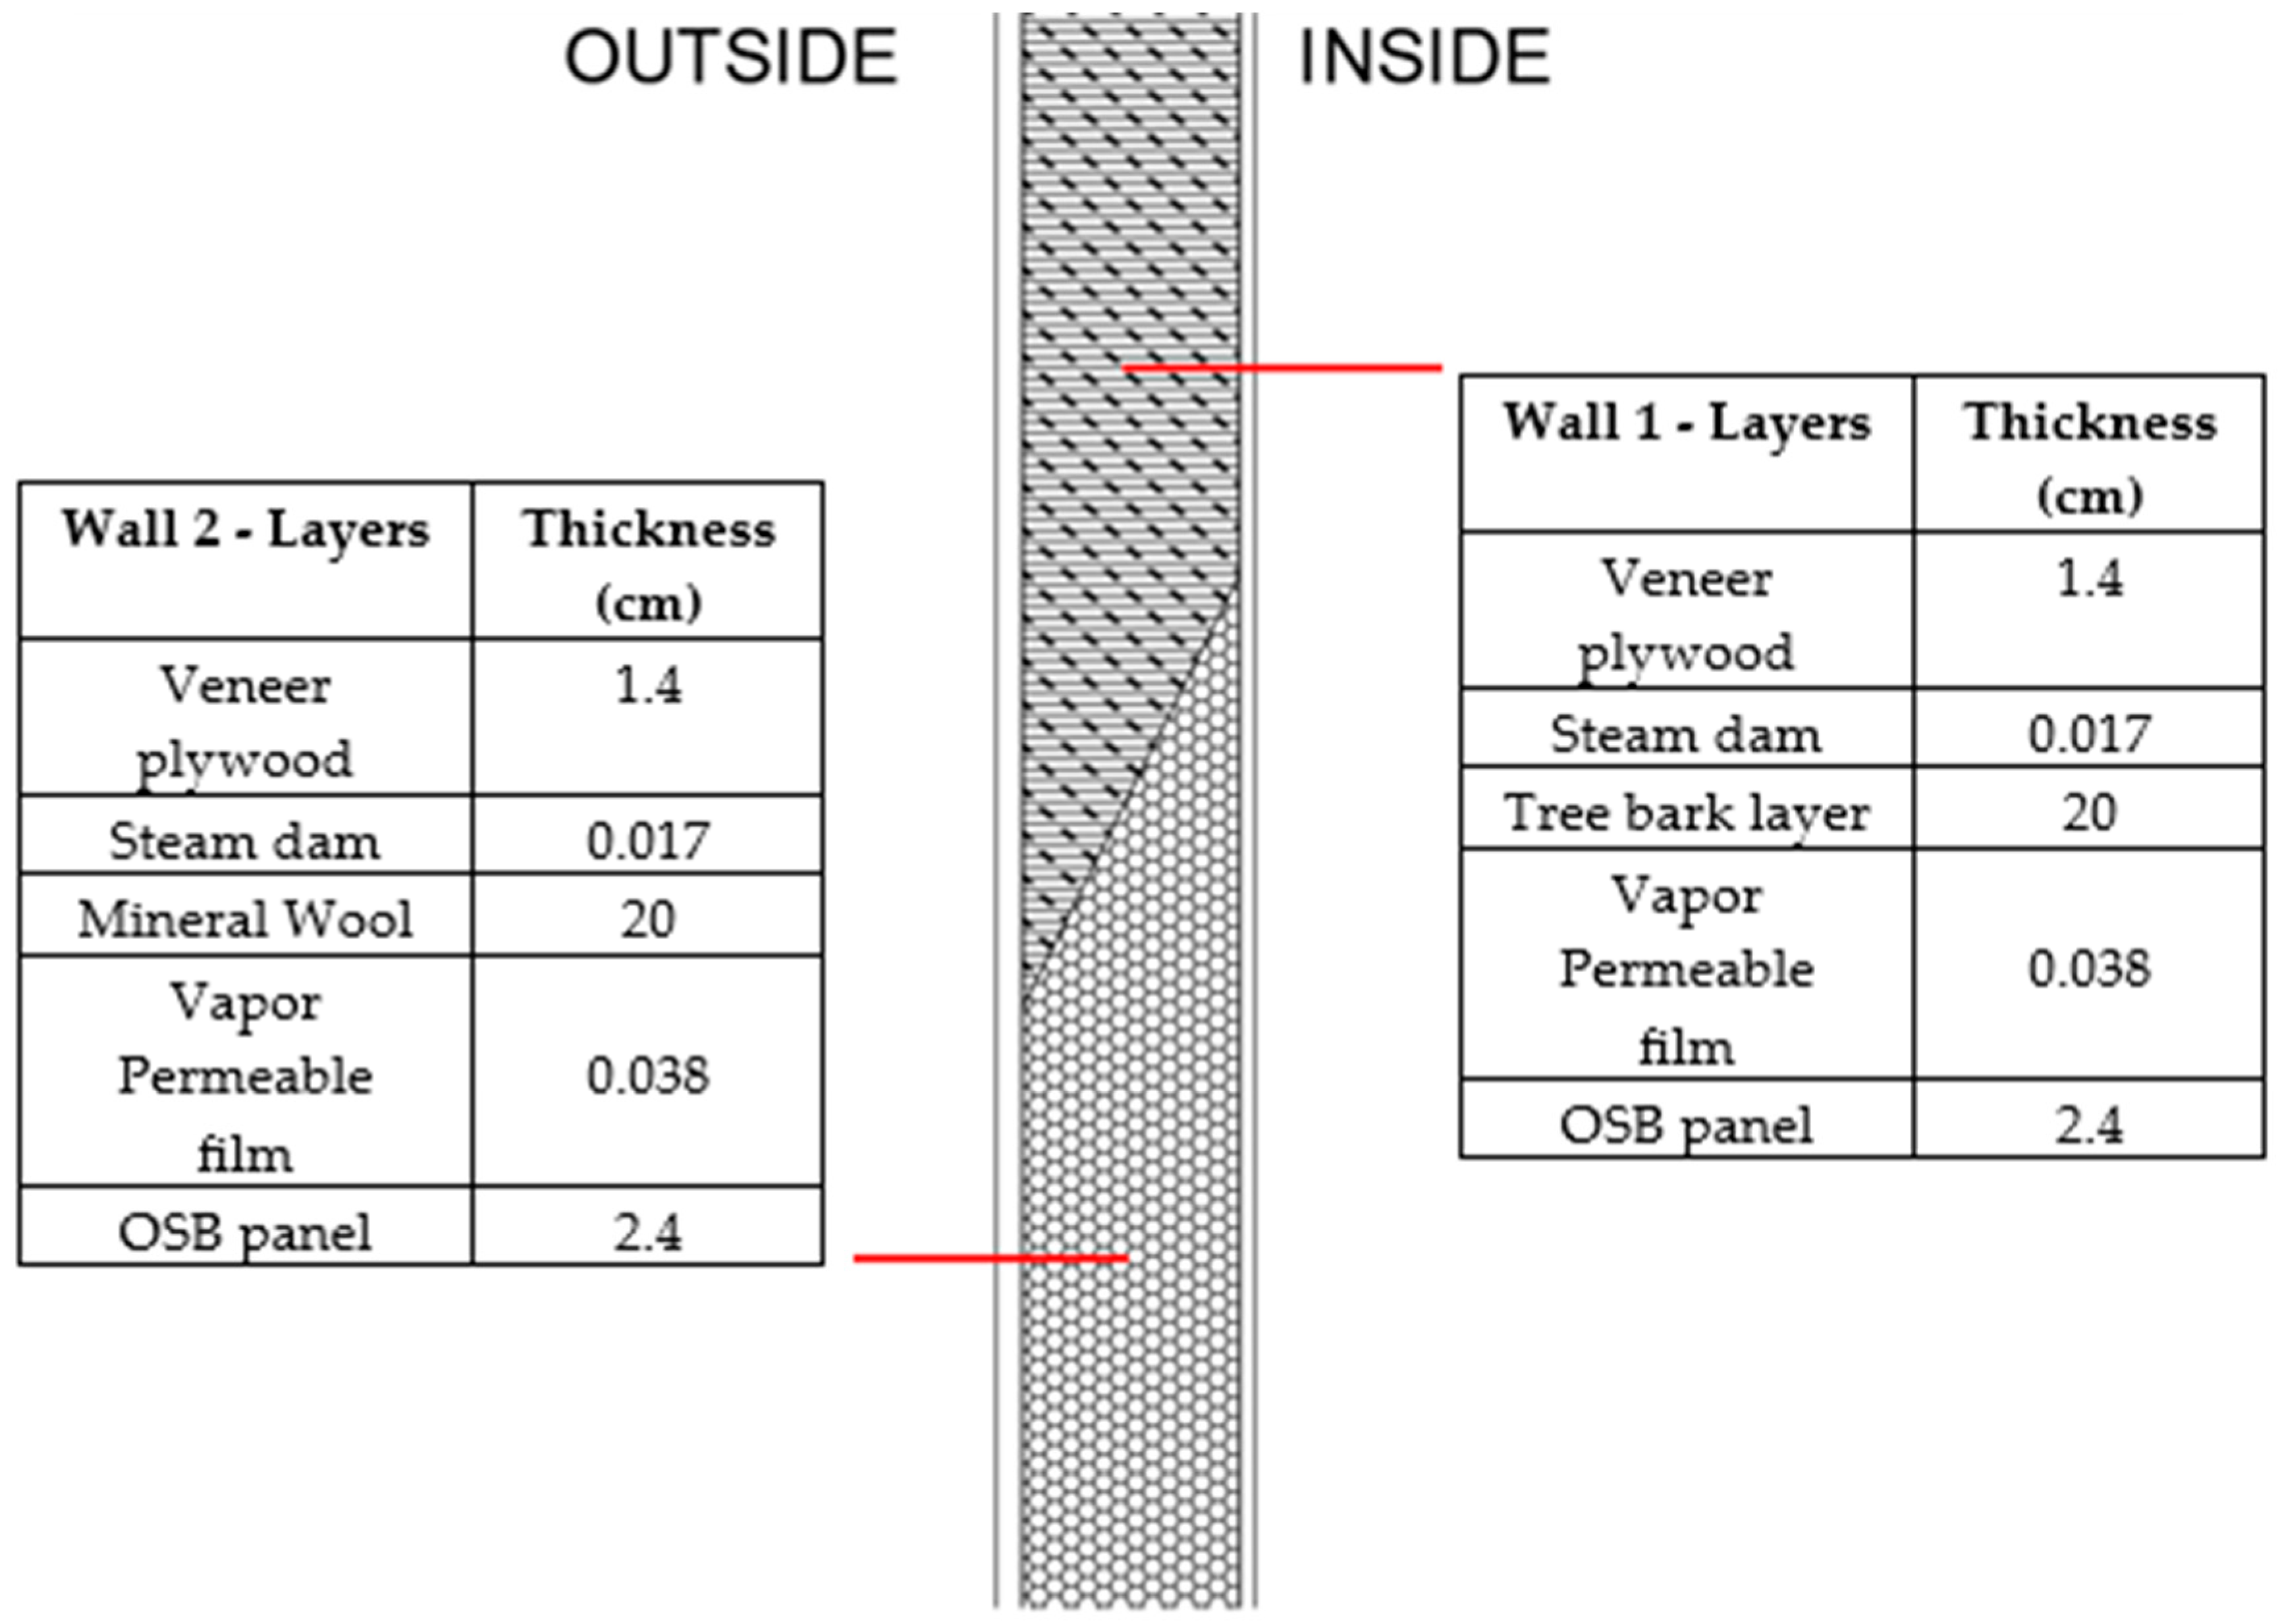
| Wall | Layers | Thickness [cm] | Coefficient of Thermal Conductivity of Layer [W/mK] | Wall Thermal Transmittance [W/m2K]—Calculated Value | Wall Thermal Transmittance [W/m2K]—Measured Value HFM | Wall Thermal Transmittance [W/m2K]—Measured Value TBM |
|---|---|---|---|---|---|---|
| Wall 1 (insulated with MW) | Veneer plywood | 1.4 | 0.1267 | 0.1600 | 0.2017 | 0.2237 |
| Steam dam | 0.017 | - | ||||
| Mineral Wool | 20 | 0.0351 | ||||
| Vapor-permeable film | 0.038 | - | ||||
| OSB panel | 2.4 | 0.1068 | ||||
| Wall 2 (insulated with Tree Bark) | Veneer plywood | 1.4 | 0.1267 | 0.3200 | 0.2902 | 0.2984 |
| Steam dam | 0.017 | - | ||||
| Tree bark layer | 20 | 0.0760 | ||||
| Vapor-permeable film | 0.038 | - | ||||
| OSB panel | 2.4 | 0.1068 |
Disclaimer/Publisher’s Note: The statements, opinions and data contained in all publications are solely those of the individual author(s) and contributor(s) and not of MDPI and/or the editor(s). MDPI and/or the editor(s) disclaim responsibility for any injury to people or property resulting from any ideas, methods, instructions or products referred to in the content. |
© 2025 by the authors. Licensee MDPI, Basel, Switzerland. This article is an open access article distributed under the terms and conditions of the Creative Commons Attribution (CC BY) license (https://creativecommons.org/licenses/by/4.0/).
Share and Cite
Živković, V.; Novosel, A.; Krstić, H. Innovative Solutions: Comparative Study of Laboratory and In Situ Measurements of Thermal Properties of Bark Insulated Exterior Walls. Buildings 2025, 15, 810. https://doi.org/10.3390/buildings15050810
Živković V, Novosel A, Krstić H. Innovative Solutions: Comparative Study of Laboratory and In Situ Measurements of Thermal Properties of Bark Insulated Exterior Walls. Buildings. 2025; 15(5):810. https://doi.org/10.3390/buildings15050810
Chicago/Turabian StyleŽivković, Vjekoslav, Andrija Novosel, and Hrvoje Krstić. 2025. "Innovative Solutions: Comparative Study of Laboratory and In Situ Measurements of Thermal Properties of Bark Insulated Exterior Walls" Buildings 15, no. 5: 810. https://doi.org/10.3390/buildings15050810
APA StyleŽivković, V., Novosel, A., & Krstić, H. (2025). Innovative Solutions: Comparative Study of Laboratory and In Situ Measurements of Thermal Properties of Bark Insulated Exterior Walls. Buildings, 15(5), 810. https://doi.org/10.3390/buildings15050810