Article

BIM for Sustainable Redevelopment of a Major Office Building in Rome

Department of Astronautical, Electrical and Energy Engineering (DIAEE), Sapienza University of Rome, 00184 Roma, Italy
*
Author to whom correspondence should be addressed.
Buildings 2025, 15(5), 824; https://doi.org/10.3390/buildings15050824
Submission received: 10 February 2025 / Revised: 27 February 2025 / Accepted: 1 March 2025 / Published: 5 March 2025

Abstract

:
Energy efficiency represents a strategic priority in both Italian and European legislation to mitigate the energy consumption of buildings, which are significant contributors to greenhouse gas emissions. Currently, about 75% of the EU building stock is considered to be energy inefficient and requires substantial retrofitting. This study examines the energy redevelopment of a large building complex, which currently has an energy class E label. The aim is to achieve a significant improvement in energy efficiency and reduce fossil fuels usage, in line with sustainability standards. The intervention includes replacing the existing air-conditioning and heating systems with high-efficiency air-to-water heat pumps, powered by electricity generated, in part, by an integrated photovoltaic system. Through the analysis of available technological solutions and the application of a Building Information Modeling (BIM) methodology, the research proposes strategies to optimize the energy efficiency of buildings while minimizing the environmental impact and ensuring compliance with current regulations. The results highlight the effectiveness of such approaches in supporting the energy transition, with the implemented measures reducing the non-renewable energy demand from 191,684 kWh/m2/year to 76,053 kWh/m2/year. This led to a decrease in CO2 emissions of 604 tons/year, representing a 78% reduction compared to initial levels, a clear contribution toward achieving European sustainability goals.

1. Introduction

Modern societies depend on an ever-increasing use of energy resources to support production, mobility and daily life. This dependence has led to the rapid depletion of natural resources and an increase in greenhouse gas emissions, contributing to significant changes in the global climate balance. Human activities, in particular the use of fossil fuels and deforestation, are considered among the main factors responsible for the climate changes observed in recent decades [1]. The development of economic systems has generated a demand for energy that, in many cases, exceeds the regenerative capacity of the planet. The impact of this intensive activity goes far beyond the simple depletion of non-renewable resources and also affects the natural cycles of the ecosystem [2]. The theory of planetary limits highlights how humanity is approaching or has already crossed certain critical thresholds, such as the carbon cycle and the loss of biodiversity [3].
The negative impacts of human activities on climate cannot be analyzed in isolation, as there is a close interdependence between economic, social and environmental systems. Rising global temperatures, changes in precipitation patterns and the intensification of extreme weather events have a direct impact on local and global economies and undermine the stability of societies, especially in the areas most affected by these changes [4]. Continued pressure from economic activity threatens to exceed the capacity of ecosystems to absorb CO2 emissions and regenerate natural resources, compromising the well-being of future generations [5]. This means that beyond a certain limit, irreversible changes occur because of the level of economic activity exceeding the assimilative capacity of the ecosystem, where one cannot act on one part of it without the others being affected, e.g., environment, economy and society. The catastrophic trend in the CO2 concentration in the atmosphere is heading toward the 450 ppm threshold. Exceeding this limit would lead to extreme weather events with a temperature rise of 2 °C, which could trigger irreversible situations [6].
At the global level, the Paris Agreement, signed in 2015, represents a turning point in the fight against climate change [7]. This international agreement sets the goal of limiting the global temperature increase to well below 2 °C compared to pre-industrial levels, ideally to 1.5 °C, and it highlights the importance of international cooperation and financial support for developing countries that are particularly vulnerable to the effects of climate change. The United States has introduced significant incentives to promote renewable energy production and reduce emissions, particularly in the transport and industrial sectors, through the 2022 Act [8]. China, one of the world’s largest greenhouse gas emitters, has pledged to peak its emissions by 2030 and become carbon neutral by 2060 by investing in renewable energy and sustainable technologies [9].
The European Union has adopted a series of ambitious policies with the objective of mitigating the effects of climate change and aligning itself with global targets. One of the main initiatives is the European Green Deal, a strategy that aims to make Europe the first continent to achieve climate neutrality by 2050 [10]. In order to achieve this goal, the plan is to reduce net greenhouse gas emissions by 55% by 2030 compared to 1990 levels, through the following measures:
  • Energy transition, massive investment in the development and expansion of renewable energies such as solar, wind and hydropower to reduce dependence on fossil fuels;
  • Circular economy, to reduce waste, improve resource efficiency and promote sustainability throughout the life cycle of products;
  • Sustainable agriculture, with a “farm to fork” strategy to reduce the environmental impact of agriculture by promoting sustainable practices, reducing pesticide use and increasing efficiency in the use of natural resources.
Achieving these goals requires the development of a system based on the principles of the circular economy, as a radical transformation of the energy system is needed, because energy is responsible for 75% of European greenhouse gas emissions [11].
A further sustainability standard is the Energy Performance of Buildings Directive (EPBD), a key piece of legislation to improve the energy efficiency of buildings, reduce greenhouse gas emissions and promote the use of renewable energy in the buildings sector [12]. The Directive sets minimum energy performance requirements for new and existing buildings, with the aim of optimizing energy consumption throughout the life cycle of buildings. A key aspect of the EPBD is the promotion of near-Zero-Energy Buildings (nZEBs), which are characterized by very low energy requirements that are largely met by renewable energy that is produced on site or nearby. The Directive requires all buildings to have an Energy Performance Certificate (EPC) when they are constructed, sold or rented out, providing information on energy performance and suggestions for improvement. Another important element is the regular inspection of heating and air-conditioning systems to ensure their efficiency and minimize energy losses. EU Member States must develop long-term strategies to renovate existing buildings, improve their energy efficiency and contribute to a more sustainable building stock. The EPBD is based on scientific principles of thermodynamics and energy transfer and encourages the use of innovative technologies, such as advanced materials and energy management systems, to optimize the energy consumption of buildings. It plays a crucial role in decarbonizing the building sector, supporting the EU’s climate change objectives and promoting the sustainability of the built environment.
Italy is one of the most energy-efficient countries in Europe, with a primary energy intensity that is 18% lower than the EU average, aiming to decarbonize through major changes in energy and environmental policies, achieving savings of 50.98 MTOE (million tons of oil equivalent) [13]. To promote these energy efficiency processes, several incentivizing instruments are available, from the Next Generation EU to the PNRR, which contributes to the green revolution and ecological transition [14]. Considering that the highest energy consumption is found in the residential context, accounting for 40% of the global primary energy demand, these European policies aim to mitigate the energy refurbishment schemes applied to buildings. In fact, starting from 2021, all new buildings and those undergoing major redevelopment must comply with high energy-efficiency requirements, guaranteeing the passage of two energy classes through public economic instruments. Italian legislation has established minimum requirements, including, for example, the global average heat transfer coefficient for transmission per unit area, solar equivalent summer surface per unit useful area and thermal insulation verification, among others [15,16].

1.1. Energy Requalification of Buildings

In the Architectural, Engineering, Construction and Operational (AECO) sector, decarbonization policy goals can also be achieved by taking into account the impact of design solutions on buildings. Buildings are responsible for 40% of final energy consumption in the EU and 36% of energy-related greenhouse gas emissions, while 75% of EU buildings are still energy inefficient [17]. Buildings produce greenhouse gas emissions not only during their operational phase, but also in the construction, use and end-of-life phases. The goal of having carbon-neutral buildings by 2050 cannot be limited to reducing only emissions related to daily use but must take into account the entire life cycle of buildings, especially new one. As buildings contain resources that last for decades, they can be considered as material banks, and design decisions and materials selection significantly influence the overall emissions, both for new and renovated buildings. It is, therefore, essential to assess the environmental performance of buildings throughout their life cycle and to integrate policies that reduce greenhouse gas emissions into national renovation plans. The Global Warming Potential (GWP) of a building represents its total impact on the emissions responsible for climate change. The GWP considers both the emissions incorporated into the building materials and those generated during the use of the building. Requiring GWP calculations for new buildings is an important step toward an increased focus on sustainability throughout the life cycle of buildings and the adoption of a circular economy [18]. It is necessary to develop various technical, fiscal and regulatory measures that promote the diffusion of key retrofit measures, in particular those for conversion to nZEBs [19]. These measures, as well as having to be calibrated according to the type of intervention and the recipient, could incorporate different functions, such as, for example, the coupling of energy requalification and anti-seismic adaptation, since integrated interventions have significantly lower costs.
Other important aspects are the optimization of plant management and plant components, as well as the use of new materials and generation systems, mostly focused on renewable energy. All of this will be facilitated by the development of increasingly specialized skills in energy efficiency, with a focus on the building system and the status quo of the building, which are relevant for comparing different improvement solutions, supported by energy diagnoses. These measures should take into account environmental conditions, including adaptation to climate change, and different uses, without losing sight of achieving a high level of energy efficiency. These measures should not compromise other building requirements, such as accessibility and fire and seismic safety.
The energy requalification of buildings is a strategic intervention that is not limited to optimizing energy consumption but aims to minimize the overall environmental impact of buildings and improve their quality of life. In a global context where natural resources are limited, it is imperative to adopt technological and design solutions capable of preserving the environment by reducing the demand for energy and non-renewable materials and the production of waste. Energy retrofitting is part of a broader sustainable transformation of the building sector, helping to improve efficiency in the use of energy, material or spatial resources. This holistic process implies a rethinking of building and plant technologies, aimed at optimizing energy performance and adopting more environmentally friendly design and construction practices, based on innovative solutions that optimize energy efficiency, reduce primary energy demand and promote the recovery/reuse of materials through circular economy techniques. In addition, interventions in buildings must be designed with energy performance in mind throughout their life cycle, during both the use and production and disposal phases. In this perspective, building renovation becomes a key driver in reducing the environmental footprint of the built environment and strengthening the resilience of buildings in response to climate change.
On the other hand, making architectural and plant engineering changes to achieve high energy performance on existing buildings is often very costly. An energy performing building can largely provide for its own energy needs while minimizing consumption and the environmental impact generated by material consumption. Several authors have approached the study of retrofitting existing buildings in the scientific community.
Mostafazadeh et al. present a new simulation-based multi-objective optimization approach using a modified version of the NSGA-III algorithm (prNSGA-III) that exploits parallel computing to improve computational performance. This method integrates Energy Plus as the energy simulation engine and the improvement algorithm programmed in MATLAB. R2024a Various active, passive, water conservation and renewable energy retrofit measures are investigated to maximize environmental performance while minimizing thermal discomfort and life cycle costs. The results show that the proposed energy retrofit measures can significantly improve environmental performance, reducing CO-eq emissions by up to 73% and thermal discomfort by up to 46% [20]. Sirin et al. discuss the limitations of urban spaces for the use of renewable energy, such as solar systems, and propose the use of building façades for energy production as a solution. Building-Integrated PV/T systems (BIPV/T) allow for the generation of both electrical and thermal energy, thus improving the energy performance of buildings. This review study examines the operation, classification, benefits and performance improvement techniques of BIPV/T systems, providing an overview of recent technological innovations and key trends in the literature [21]. Maria Calama-Gonzalez et al. adopted a bottom-up approach, using calibrated and parameterized energy models (building archetypes) and data from a large building database. The thermal performance of the social housing stock in the south of Spain is evaluated through dynamic simulations under current and future climate scenarios. Among the main conclusions, the feasibility of implementing low-cost retrofit strategies with investments up to about 200 EUR/m2 is highlighted, reducing overheating and undercooling hours to below 55% and 45%, respectively [22]. Barone et al. focus on the use of DSF (double-skin façade) with active solar systems in Mediterranean countries, trying to identify the optimal solution for the energy retrofitting of existing buildings. A parametric analysis shows that the use of DSF in multi-story buildings is sustainable as it allows energy savings without the need to add insulation to the building [23]. Galimshima et al. identify the best renovation options for the envelope and heating systems for representative historic buildings in need of renovation in Switzerland. The results underline the fundamental importance of replacing heating systems for different building periods. The use of bio-based insulation materials emerges as a solution that balances the reduction in environmental impact and low-energy operating costs, promoting just and low-carbon transformations in Switzerland and similar northern European contexts [24]. Li et al. developed a methodology using an ensemble model for energy simulation integrated with Latin hypercube sampling to improve the performance of the energy model. A quantitative analysis was also performed to extract the relevance and rules linking global passive measures, Building-Integrated Photovoltaics (BIPV) and building energy to improve the interpretability of the framework. The model is tested on a school in Guangzhou, China, and shows that the method improves the average prediction metrics by 8.2% compared to traditional Latin hypercube sampling with extreme gradient boosting [25].

1.2. Advanced Digital System

In the context of the growing need to improve the energy efficiency of buildings and reduce greenhouse gas emissions, digital systems are emerging as critical tools for optimizing building production processes [26]. Digital models, in a Building Information Modeling (BIM) environment and technologies such as Digital Twin (DT), allow for a detailed and dynamic representation of buildings, facilitating the analysis and simulation of their energy performance, providing an integrated view of the structural characteristics and energy systems of buildings, and enabling a precise evaluation of different possible options. Energy simulation based on BIM models allows for different intervention strategies to be tested and their impact on energy consumption and emissions predicted, thereby improving design decisions before actual implementation [27]. The use of advanced digital systems, such as Internet of Things (IoT) devices for data collection and analysis, enables real-time monitoring of building energy performance. Smart sensors and energy management platforms provide detailed data on consumption, system efficiency and environmental metrics [28]. This information is essential to identify areas of inefficiency and target corrective measures. In addition, the data collected can be used to optimize maintenance operations and adapt refurbishment strategies to actual conditions and changes over time. The continued evolution of digital technologies offers new opportunities to improve building renovation. Innovations such as Artificial Intelligence (AI), predictive analytics and augmented reality are increasingly being integrated into the AECO sector, providing advanced tools for energy design, management and efficiency. The adoption of these emerging technologies can lead to significant improvements in the energy efficiency and sustainability of buildings [29].
Alexandrou et al. discuss the difficulties and solutions related to the use of BIM for Building Energy Simulation (BES), highlighting problems related to data integration and geometric transformation. They propose a method for integrating environmental analysis data into BIM models of historic buildings and a visual programming process to retrieve missing data through auxiliary exchange operations. This approach demonstrates how visual programming tools and common data exchange formats can overcome major interoperability challenges [30]. Shehata et al. apply the framework (3Ts) to the historic Suez Canal villas in Port Said, analyzing how stakeholders perceive their input and decision making, measuring climate parameters, proposing different green redevelopments and integrating them into sustainable scenarios. The scenarios are evaluated using the simulation software Design Builder v7.3.1.003, while the Skelion plug-in calculates the energy production of Photovoltaic (PV) systems. The results show that the total energy savings could reach up to 74% and the reduction in CO2 emissions up to 73%, without compromising the historical value of the buildings [31].
Compared to traditional methods, the implementation of building energy analysis in a BIM environment is transforming the construction industry toward more sustainable and efficient building design, as evidenced by the results described below and the most recent literature review. At a time when environmental sustainability is a growing priority, BIM provides an advanced platform for accurately estimating building energy consumption and optimizing projects for energy efficiency. It allows alternative design scenarios to be explored, improving conceptual design and promoting a more conscious and sustainable approach to building construction. Alhammad et al. highlights the transition of architectural firms from traditional CAD to BIM and the need to integrate the latter with Building Energy Modeling (BEM) to reduce the energy consumption of buildings. BEM, a computational analysis, can be used in conjunction with BIM or Computer-Aided Engineering (CAE) systems. The study reviews the existing literature on BIM–BEM integration, showing that this convergence is beneficial for long-term projects, but presents interoperability challenges. The most widely used software for this integration is Autodesk’s Green Building Studio [32,33]. Oktavian et al. anticipate that the development of BIM technology can provide accurate estimates of building energy consumption and recommendations for improving energy efficiency. The use of BIM for energy analysis during building design supports sustainable design, based on energy simulations using three-dimensional models with material attributes, project schedule and location. Through various scenarios, the most efficient solutions for energy consumption are determined, with cost estimates to implement these solutions comprehensively [34]. Maglad et al. examine the built environment in Pakistan, which consumes over 50% of total energy, with annual growth rates of 4.7% in the residential sector and 2.5% in the commercial sector. Using Autodesk Insight 360 and Green Building Studio, a case study of the A-Block building at COMSATS Abbottabad is analyzed to optimize energy use through building rotation and the installation of efficient building materials. The results show a reduction in energy consumption and annual costs, with energy savings of 585.10 kWh and financial savings of $550 [35]. Mehraban et al. discuss optimizing the energy efficiency of residential buildings in hot climates, such as Dubai and Riyadh, using the integration of BIM and Machine Learning (ML). In the study, detailed models of typical residential villas with different envelope types were created to perform energy simulations and predict Energy Use Intensity (EUI) using ML algorithms. Of the algorithms tested, the Gradient Boosting Machine (GBM) showed the best predictive performance. The analysis identified elements such as roofs, external walls and windows as the main factors influencing energy consumption. The study also proposed solutions for energy optimization, demonstrating the effectiveness of combining BIM and ML for sustainable design in extreme climates [36]. Hmidah et al. assessed the reliability and validity of a questionnaire designed to identify applications relevant to a large-scale study of BIM and energy retrofitting of existing buildings. Barriers related to the multidisciplinary nature of information sharing and timeliness of communication were highlighted. A pilot survey of 30 respondents analyzed the validity of the internal consistency and Pearson’s correlation, showing satisfactory results for all parts of the questionnaire, with a Cronbach’s alpha factor above 0.6, confirming the validity of the questionnaire for further analysis on a larger scale [37].
The aim of the research is to achieve an “A1” energy certification for a large office building through the use of energy-efficient plant solutions. Achieving this goal requires an in-depth evaluation of a number of key factors, such as the architectural construction techniques, which need to be analyzed to ensure that energy-efficiency requirements are met. It is necessary to consider the intended functional use of the building, assessing how occupancy and internal activities affect overall energy consumption. An essential part of the decision-making process is the technical and economic feasibility of the solutions adopted. The cost of energy-efficiency measures needs to be balanced against the long-term benefits, both in terms of energy savings and reduced carbon emissions. Landscape restrictions must be respected, ensuring that interventions do not compromise the aesthetic and environmental integrity of the surroundings.
To ensure the success of the intervention, the following two fundamental technical requirements must be met at the request of the client:
-
Continuity of plant service, the building must maintain its productivity during the refurbishment work. This means that all plant operations must continue without interruption, so that work can continue without interruption;
-
Maintaining the existing distribution network, the current structure of the plant network must be maintained, with interventions limited to areas dedicated to energy production. This approach minimizes the environmental impact and structural changes by focusing only on the plant areas without affecting the working environment.
The upgrading process is not limited to identifying energy solutions that meet the minimum requirements to achieve “A1”-label certification but aims to optimize the energy balance of the building as a whole to ensure long-term sustainable energy consumption.
Compliance with the above-mentioned requirements is essential to ensure business continuity within the building complex, allowing workers to carry out their daily activities in optimal health and safety conditions. This implies the need for extremely detailed and accurate planning of the retraining operations, where there is no room for malfunctions or errors that could also lead to significant financial penalties for non-compliance. In this regard, the design of the intervention was developed using advanced BIM and Building Energy Modeling (BEM) tools. These digital tools prove crucial in accurately simulating the entire redevelopment process, offering detailed spatial and temporal analyses. Such energy simulations enable the anticipation of potential interferences or problems during the work, facilitating optimized resources and time management, and ensuring that renovation operations do not interfere with the daily work of staff.
The novelty of this study lies mainly in the integrated BIM–BEM approach and the adoption of advanced digital technologies to improve the energy efficiency of a large office building while maintaining business continuity. This study highlights the synergistic potential of digital modeling to improve project delivery and energy performance. Unlike traditional retrofit strategies, which often involve temporary disruption to operations, this approach ensures that the building remains fully operational during the energy upgrade. Given the urgency of meeting global energy-efficiency targets and reducing greenhouse gas emissions, the results of this study are particularly relevant for all of those involved in sustainable building redevelopment. By demonstrating the effectiveness of BIM–BEM integration, this research provides a practical and innovative model for improving energy efficiency in the built environment.
BIM integration with the energy model also allows for real-time monitoring of work progress and optimization of a building’s energy performance, helping to significantly reduce the risks associated with unforeseen technical issues. These digital models represent a modern and innovative approach to managing complex projects, offering complete control over the renovation process and minimizing the possibility of errors.

2. Materials and Methods

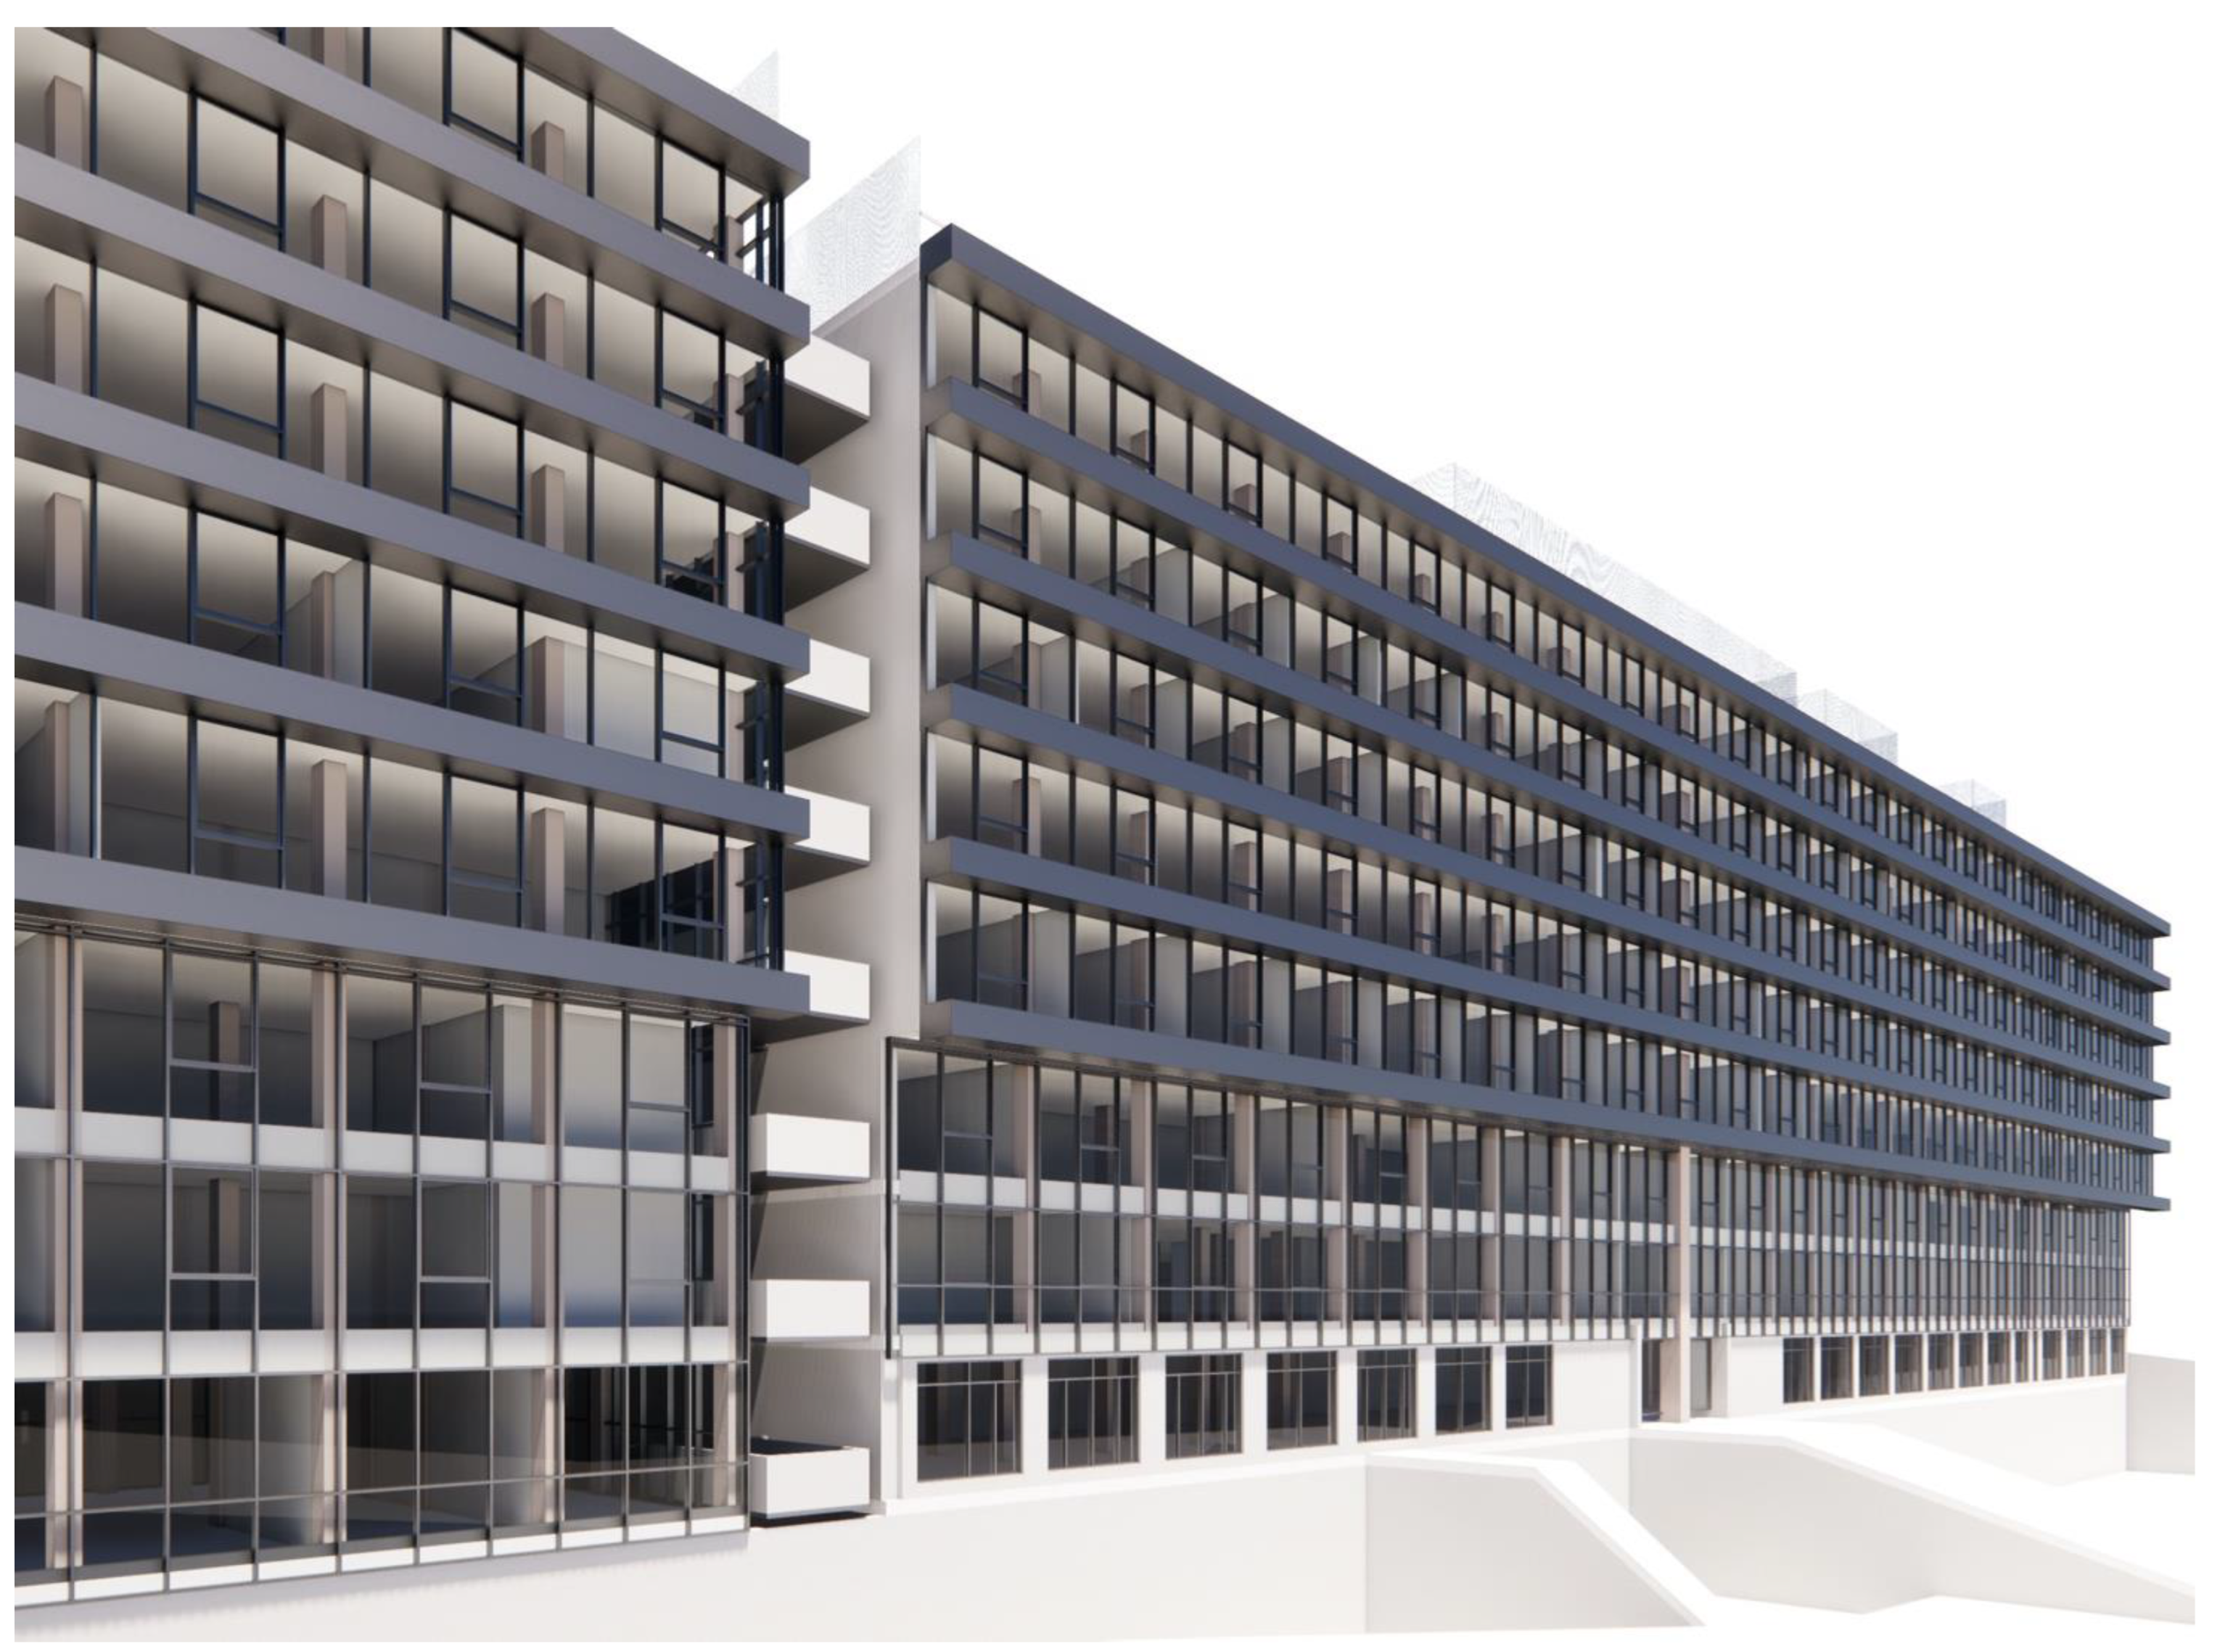
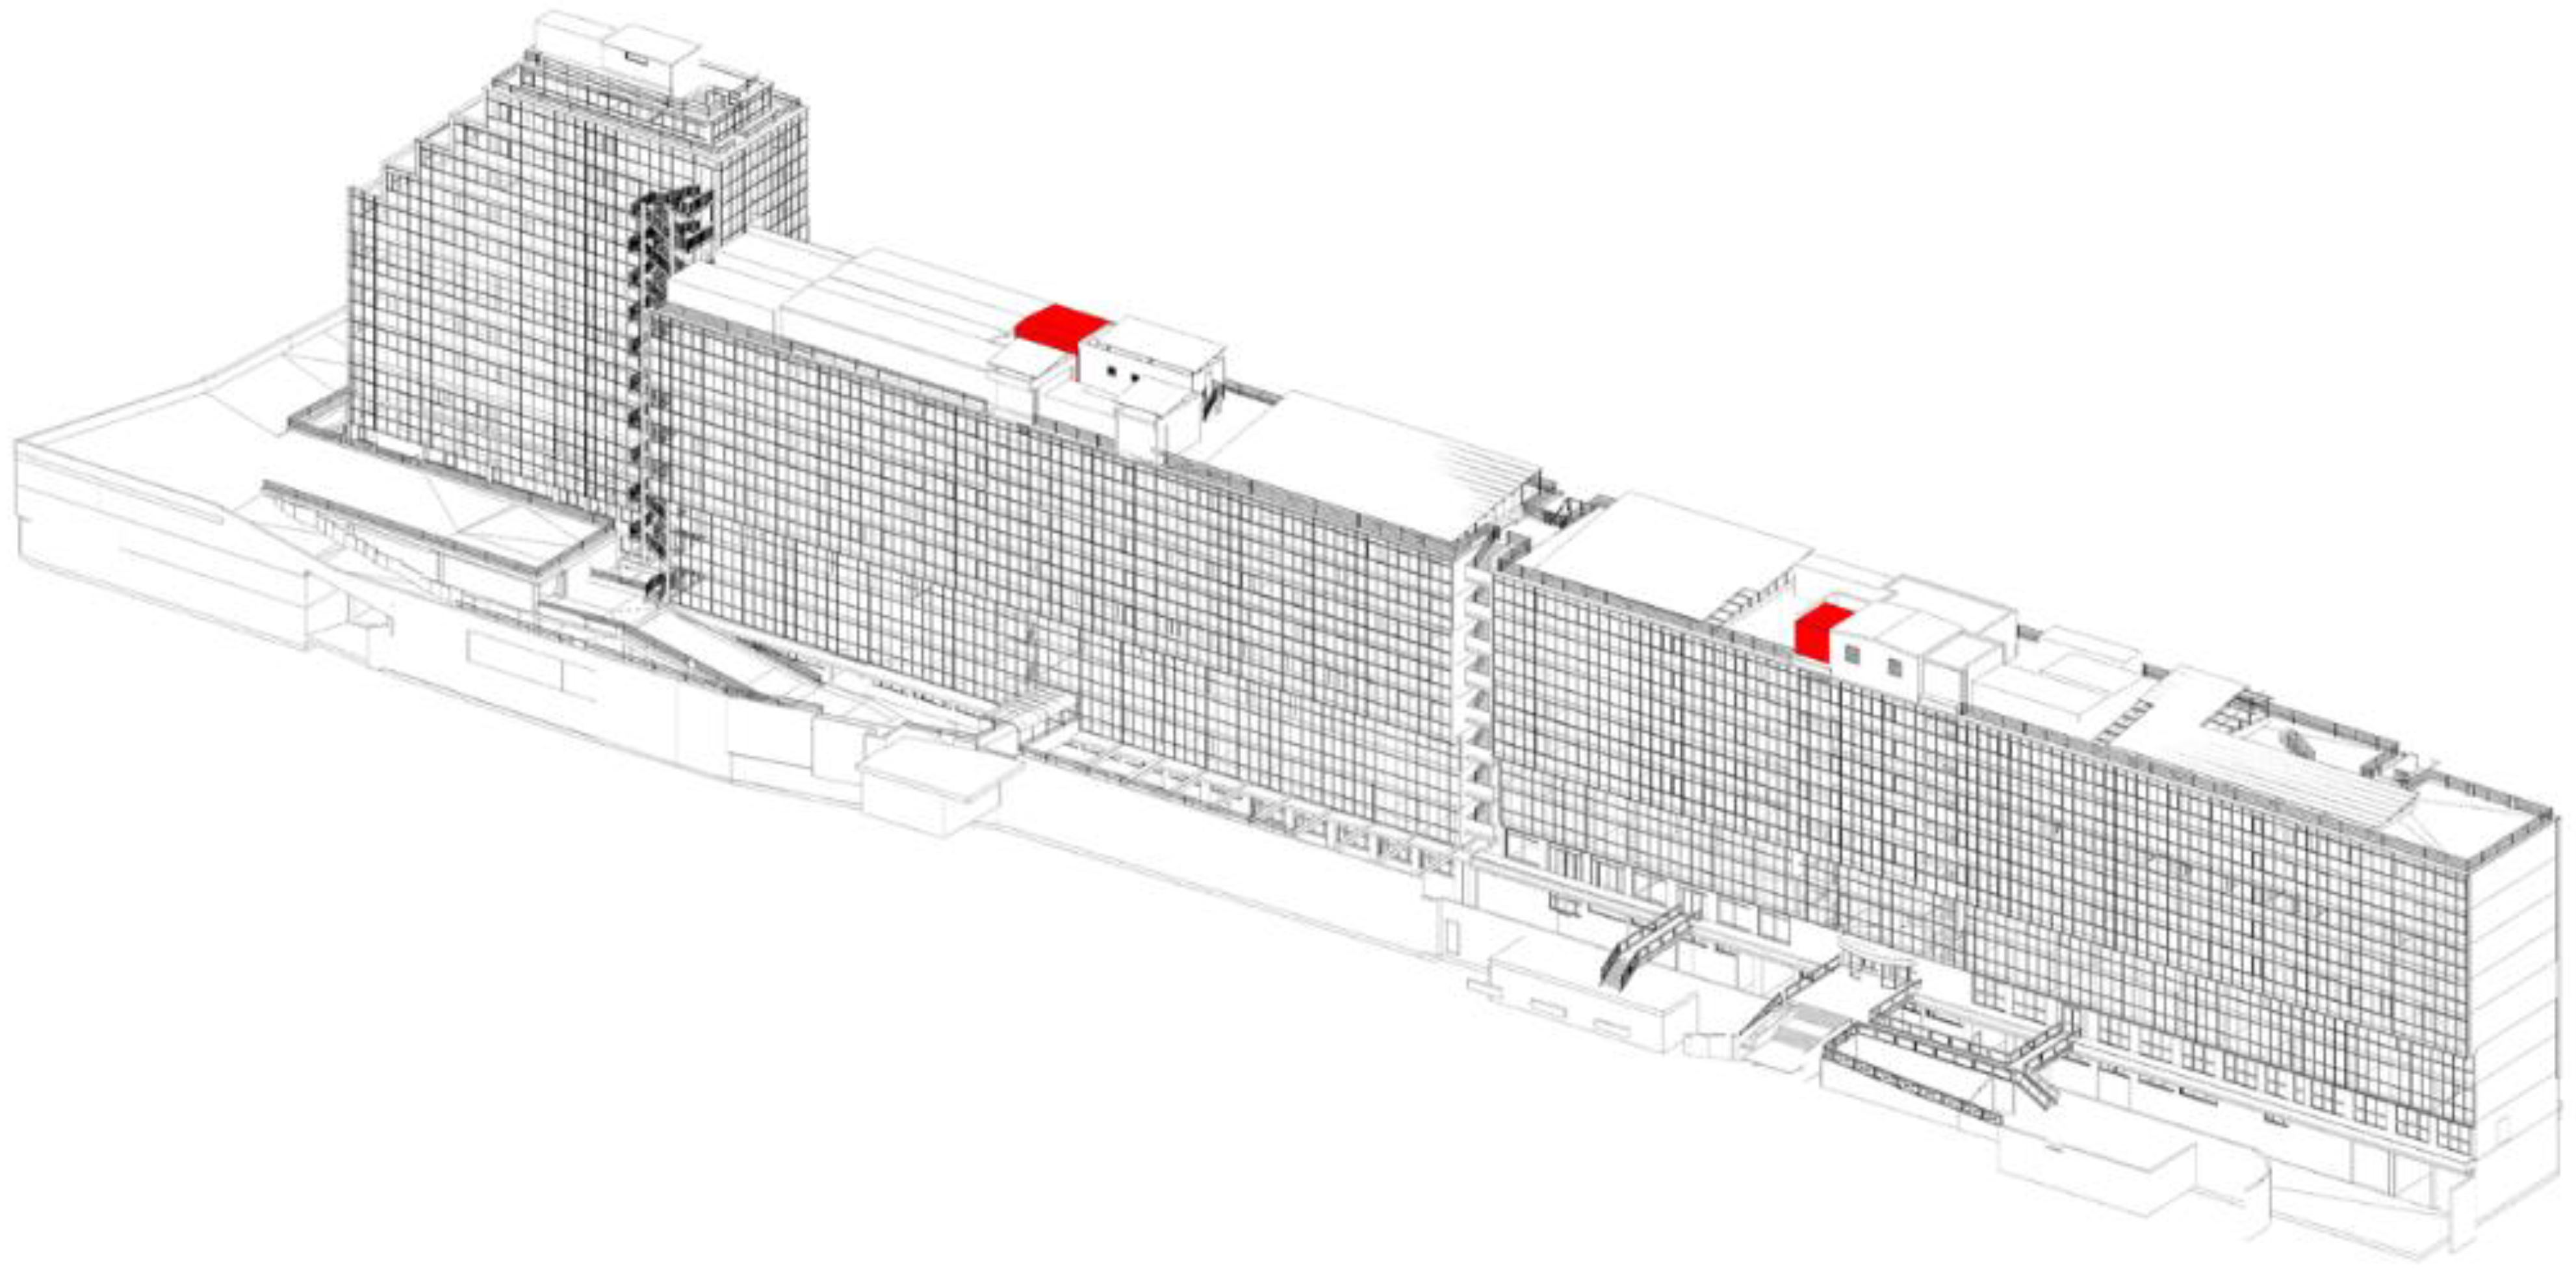
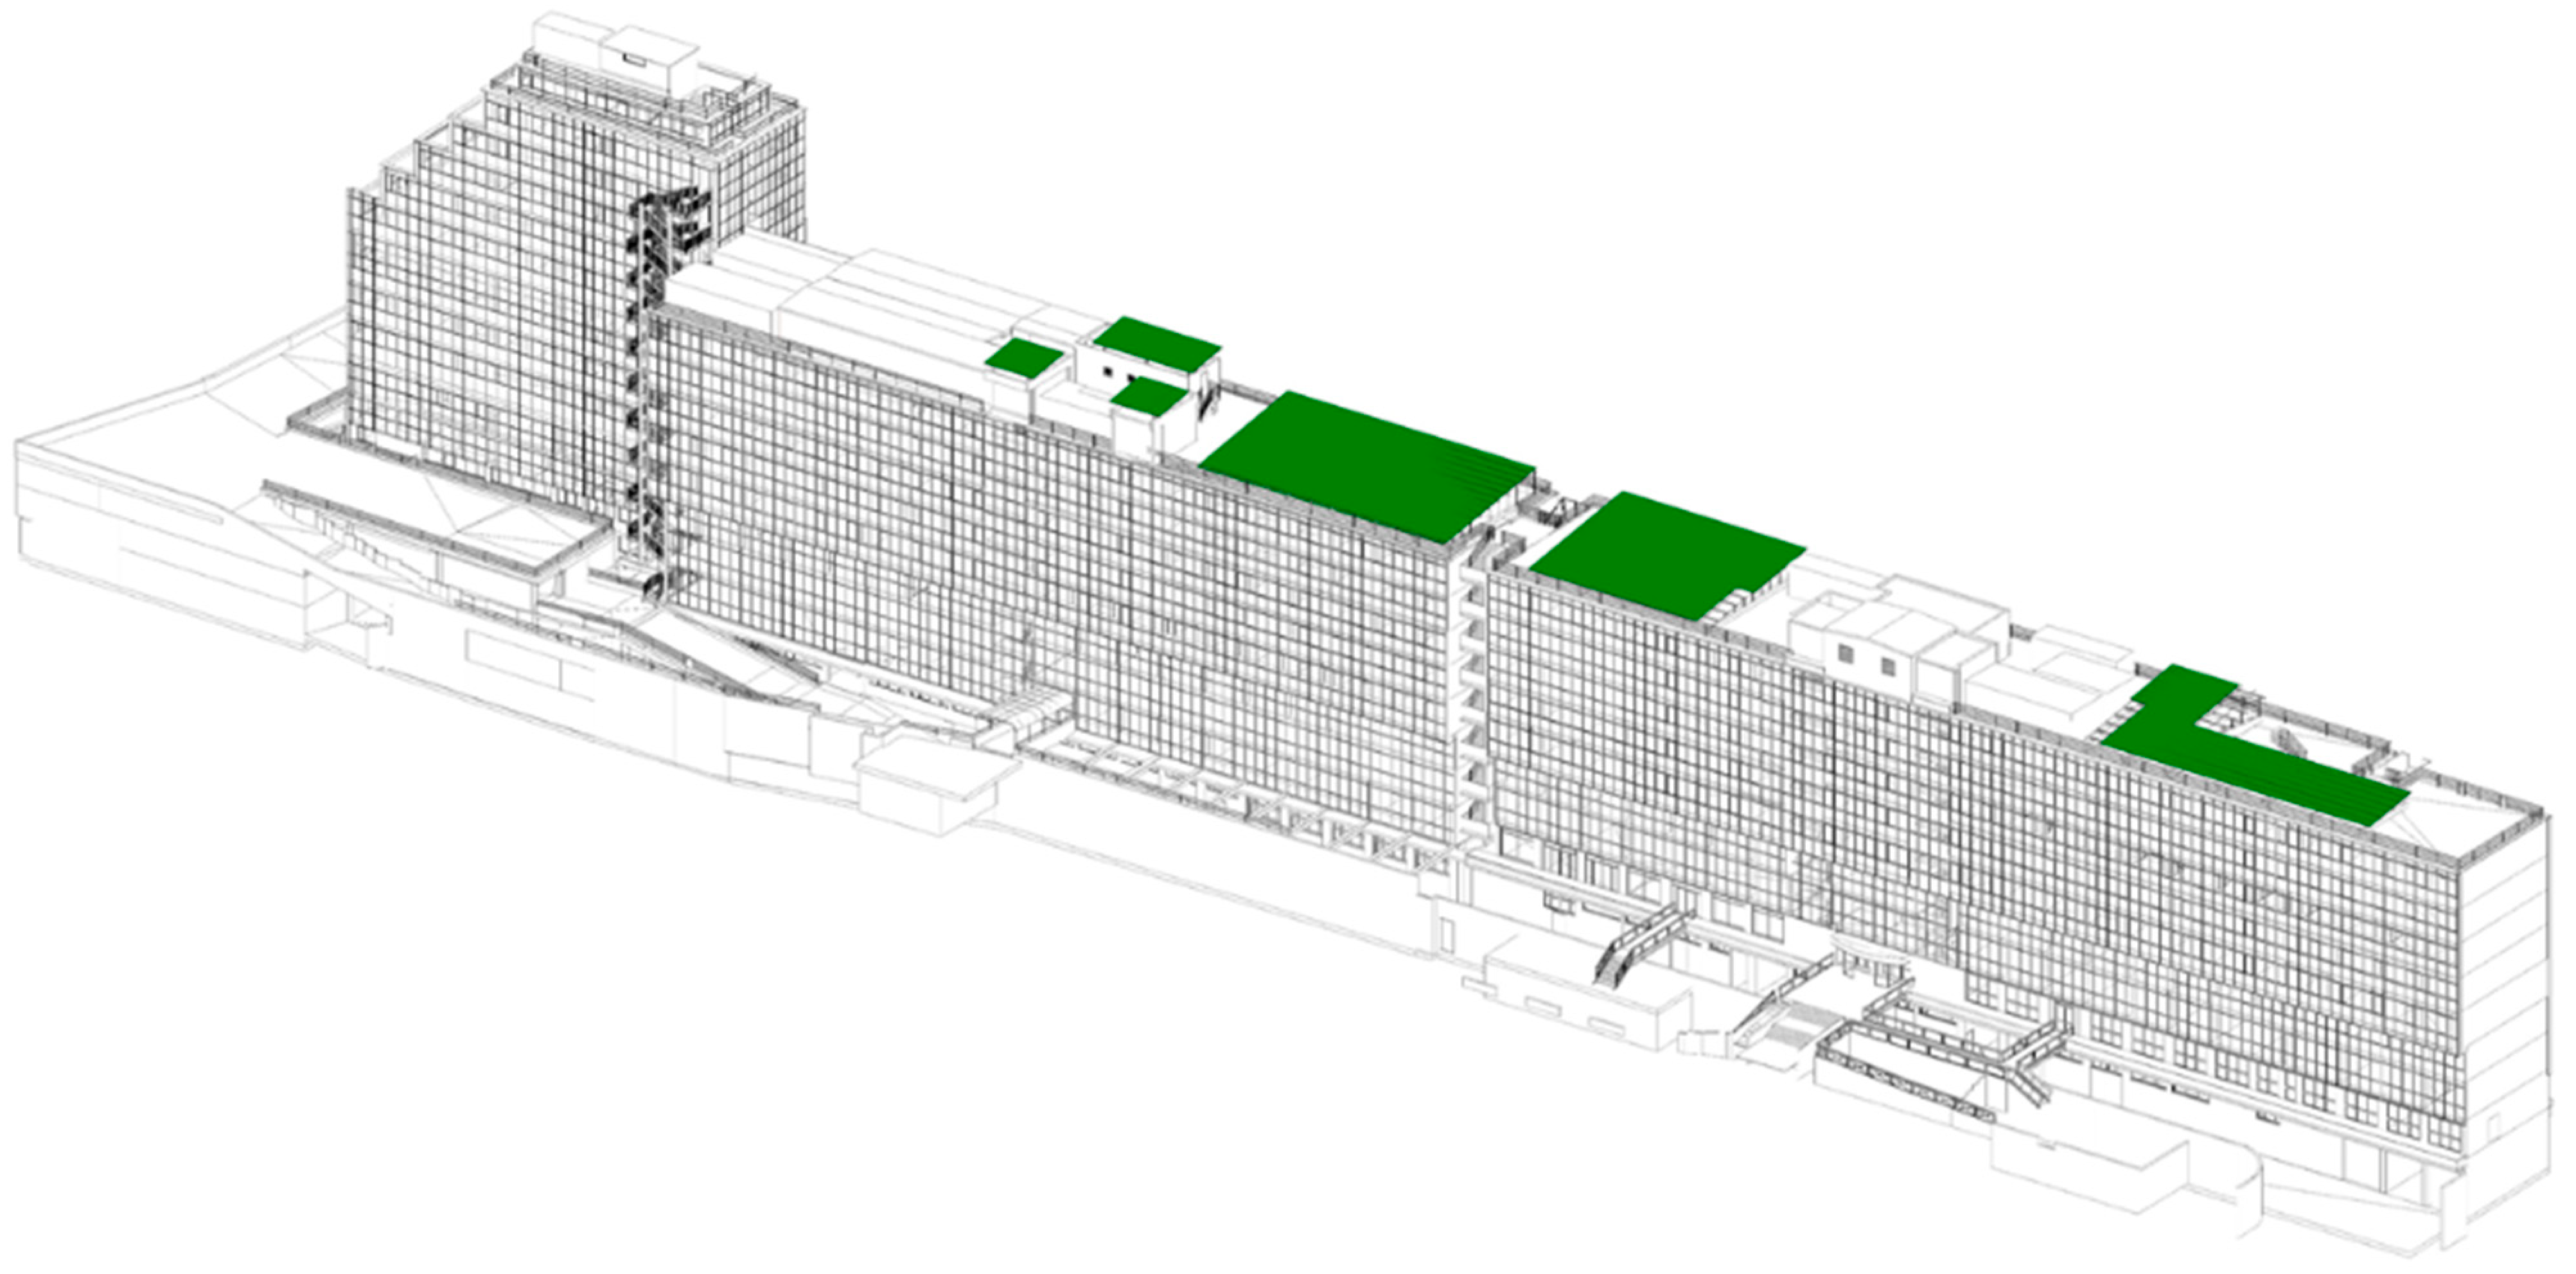
2.1. Characteristics of the Case Study Building

The application case deals with the energy requalification of an office building located in a semi-peripheral area of Rome (Figure 1). The complex consists of three building Bodies (A, B and C) (Figure 2), interconnected by a system of fire escapes. They occupy a total length of about 207 m and are perfectly exposed along the north–south axis of Bodies A and B, while along the east–west axis is Body C, with a total floor area of 19,050.57 square meters and a capacity of 59,541.06 cubic meters. Buildings A and B, connected by the fire escape system, have a compact east–west orientation, with the vertical connections in a central position, for a linear development of 75.93 m for Building A and 92.80 m for Building B. Both buildings have a basement, where the building body coincides with the reinforced concrete load-bearing structure up to floor III, with a depth of 12.76 m, while from floors IV to VII, the envelope system is placed in overhang, configuring a building body with a depth of 14.68 m.
The basement is located in a trench to provide access for vehicles. The trench follows the course of the land and configures access heights to the buildings at different levels on the main north and south frontages. Building C is located at the western end of Body A, with a staggered orientation of 8.56 m to the north. Building C is developed around the system of vertical links and has a terraced layout set back from the 5th floor. Building C is located at the western end of Body A, with a staggered orientation of 8.56 m to the north. Body C is developed around the system of vertical connections and has a terraced setback from floor 5.
The buildings that compose the compound are built with a load-bearing structure in reinforced concrete and concrete slabs. The external envelope consists of a curtain wall with an aluminum mullion system that is 50 mm thick and 120 mm deep, with a prevailing spacing of 1.00 m. The deflection of the mullions is a function of the height between floors, with a predominant horizontal spacing of 1.49 m. The envelope is divided into visible sections, which can also be opened at a height of approximately one meter from the slab extrados, as well as spandrels, in the under-window section, to conceal the floor slabs and for plant and furniture requirements.
Only in the fire escape corridor between Bodies A and B, as well as on the east façade of Body B, do the buildings have a fully opaque façade (Table 1). Based on the data collected, it was possible to calculate the performance of the current façade system from a thermal point of view.
The average global heat transfer (U) is 4.36 W/m2K (Figure 3). A very high value if compared to the legal limits in force (DM 26/06/2015), which generates poor indoor comfort conditions (Table 2). U was calculated using the following Formula (1) [38]:
U = 1 R = 1 R s i + S i λ i + S n λ n + R n + R a + R s e
where
  • Rsi is the boundary resistance of the internal surface of the structure [m2K/W];
  • S γ is the thermal resistance of one or more layers of homogenous material [m2K/W];
  • Rn is 1 C is the thermal resistance of layers of non-homogeneous material [m2K/W];
  • C is the thermal conductance [W/m2K];
  • Ra is the thermal resistance of the cavities [m2K/W];
  • Rse is the boundary resistance of the external surface of the structure [m2K/W];
  • λ is the thermal conductivity of the materials [W/mK];
  • s i is the thickness of the i-th layer of the wall [m].
The following was used for the heat transmission of the windows and doors [39]:
U w = A g   U g + A t   U t + 1 g   Ψ g A w
where
  • U w is the thermal transmittance of the window frame, expressed in W/(m2K);
  • A w is the area of the window frame or window compartment dimension considered, externally expressed in m2;
  • A g is the area of the glass, expressed in m2;
  • U g is the thermal transmittance of the glass, expressed in W/(m2K);
  • A t is the area of the window (frame), expressed in m2;
  • U t is the thermal transmittance of the frame, expressed in W/(m2K);
  • 1 g is the perimeter of the glass, expressed in m;
  • Ψ g is the linear thermal transmittance of the spacer, expressed in W/(mK).
Figure 3. Scheme of the current envelope system.
Buildings 15 00824 g003
Table 2. Design reference values for climate control systems in the municipality of Rome (UNI 10339).
Internal Project TemperatureExternal Project TemperatureInternal Relative HumidityExternal Relative Humidity
Winter project20 °C0 °C50%39.80%
Summer project26 °C34 °C50%50%
The simulations carried out using BIM, in fact, confirmed the high values of irradiation for the southern fronts, especially during the summer and intermediate seasons (Figure 4, Figure 5 and Figure 6). This condition, coupled with the absence of shading systems, with the exception of internal blinds, leads to an overloading of the air-conditioning systems.
There are two existing systems, one serving Buildings A and C, and one serving Building B (Table 3). Both plants operate in a similar way and are made up of a mixed primary air and fan coil system. The system is supplied with hot water and chilled water from the heating and cooling power plants. Temperature control is provided by fan coil units in individual rooms, while the humidity and air exchange are controlled via primary air ducts that run through corridors and common areas.
The air flow rates of existing aeraulic systems comply with the limit values of UNI 10339 (Table 4). Thus, the complex is fed by two heating plants and two cooling plants. The heating plants contain traditional boilers powered by methane gas, while the cooling plants house water/air refrigeration units powered by electricity. The plant is completed by the photovoltaic system that is installed on the roof for the production of electricity.
The air handling, heating and cooling units are all located on the roof of the buildings to optimize connections among the different parts of the system. The original system consisted of components dating back to the 1980s, which were completely replaced by complex maintenance in 2001 by the systems described above (Figure 7).

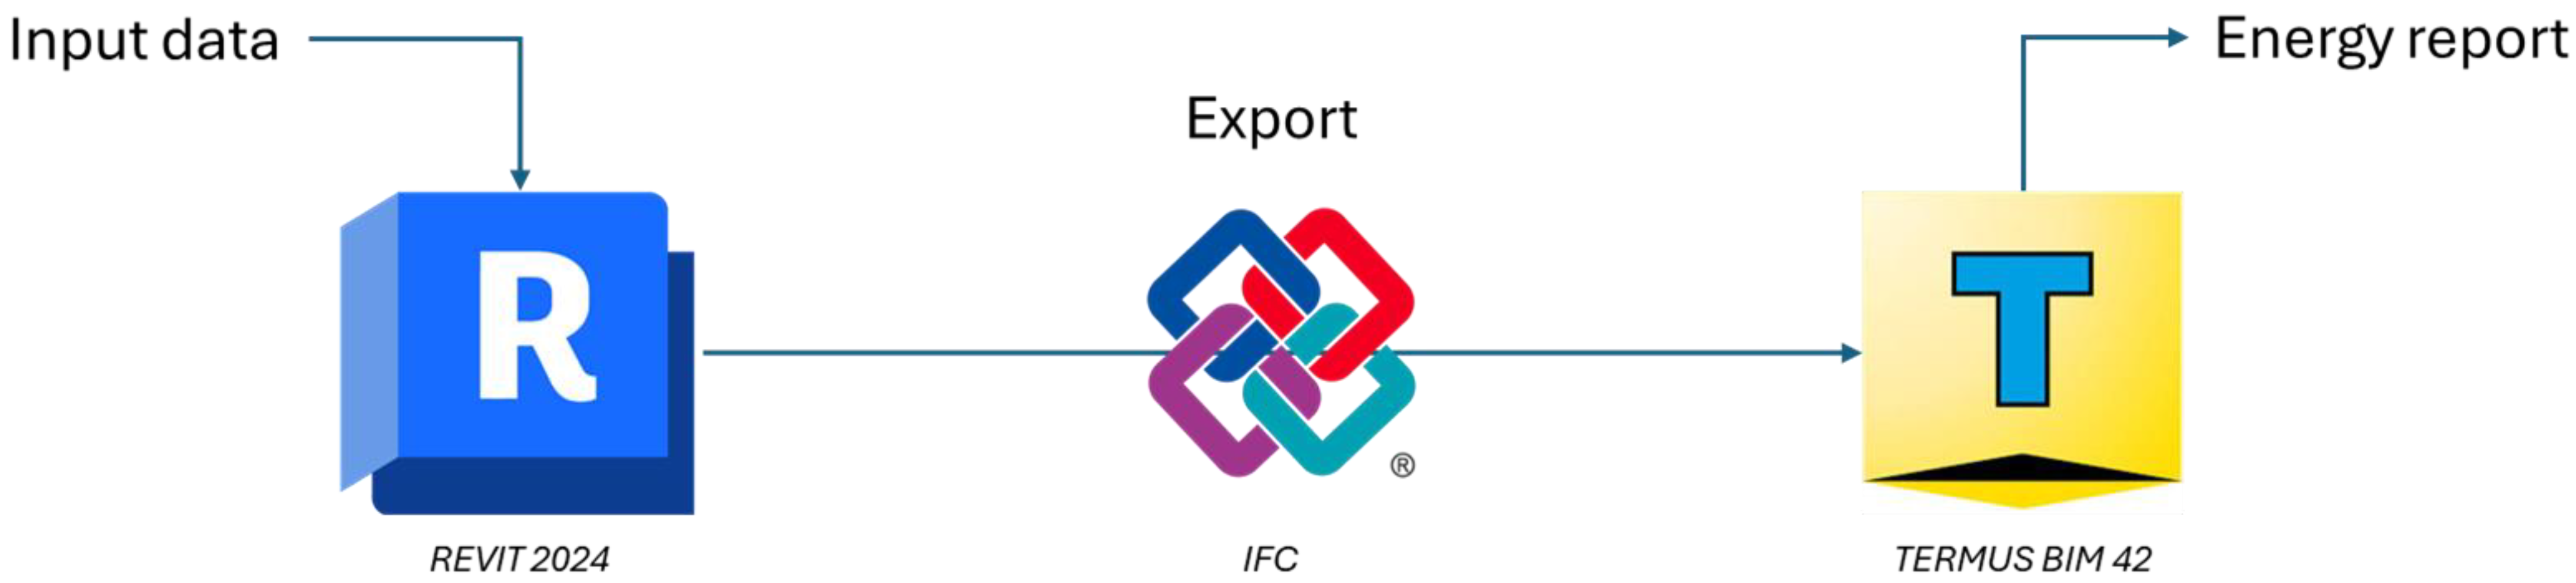
2.2. BIM Methodology

The methodology for the integrated use of Revit 2024 and Termus BIM 42 in the energy simulation of a building starts with the creation of the digital model of the building within Revit (Figure 8). At this stage, the building is modeled including all architectural, structural (not mandatory for energy calculations) and equipment components required for the energy analysis of the building.
It is important that each element of the building, such as walls, windows, roofs and floors, is accurately defined, ensuring a minimum Level of Detail (LOD) of 400. In the context of BIM, the concept of LOD is a fundamental parameter for ensuring consistency in the definition of model content throughout all project phases. The LOD refers not only to the level of graphical detail but also the level of development of the model elements, including both geometric information and non-graphic attributes. AIA Standard G202-2013, developed by the American Institute of Architects (AIA), classifies the level of development of BIM elements into the following five main categories [40]:
-
LOD 100: the element is represented schematically with no defined dimensional or material specifications;
-
LOD 200: approximate dimensions and the location are defined, with basic parameters;
-
LOD 300: the model shows the exact dimensions, shape and location, allowing for a more detailed analysis;
-
LOD 400: the model contains useful information for the manufacturing and assembly phases;
-
LOD 500 (as-built): the model corresponds to the work carried out, with elements verified in terms of the geometry, quantity and location.
The adoption of LOD standards in BIM improves communication among different project stakeholders, ensuring a common language and effective information management throughout the building lifecycle.
The digital model of the application case in this research was created at an LOD 500. To ensure an accurate energy analysis, the materials are entered with their thermophysical properties, so that once the digital model has been created, the software automatically provides the transmittance value of each element of the envelope. This value, which is the same as that calculated using the traditional methods described above, validates the energy model. Including the thermophysical properties of materials in the digital model also provides a detailed picture of the energy performance of each element of the building envelope. This approach facilitates the identification of critical areas where further optimization or alternative materials may be required to improve overall energy efficiency. The automation of the transmittance calculation enables rapid iteration of different design scenarios, making it easy to assess the impact of changes on the overall energy consumption of the building. The thermal spaces and zones are configured within the model so that they can be used later during the energy simulation in Termus BIM 42. At the end of this phase, the model is checked for consistency and completeness to ensure that all elements are correctly classified according to the Industry Foundation Classes (IFC) standard, which facilitates the exchange of data among BIM platforms.
The next step is to export the model created in Revit in IFC format, checking that all information on materials, energy properties and room geometry is retained. During this export, the options are carefully selected to ensure that the necessary energy parameters, such as wall thickness and thermal transmittance, are included in the exported file.
Within Termus BIM 42, a new project is created, and the IFC file previously exported from Revit 2024 is imported, checking that the building geometry, spaces and thermal zones are correctly represented. It is also important to check that they are compatible with the Termus BIM 42 energy simulation modules. At this point, the simulation parameters are defined in Termus BIM 42 by selecting the geographical location of the building and entering climatic data such as outdoor temperature and solar radiation. In addition, data related to the use of the building are entered, such as occupancy times, heating and cooling system settings, ventilation and internal inputs from lighting, appliances and people.
The building–plant system consists of “building envelopes”, the temperatures of which are controlled by heating/cooling systems. Each building envelope can be maintained at the pre-defined environmental requirements depending on its intended use [41]. The procedure to calculate the thermal energy demand used in Termus BIM 42 starts with definitions of certain reference parameters, including the delimitation of heated and unheated spaces within the building, the division of the building into different calculation zones and the collection of input data related to external climatic conditions.
Once all parameters are set, the energy simulation is started within Termus BIM 42, allowing the software to calculate the heat losses, heating and cooling loads and the total energy demand of the building. The results obtained provide detailed information on energy consumption, thermal losses, passive contributions and system efficiency. This makes it possible to assess the dynamic behavior of the building in relation to the climatic variations. The thermal energy requirements for heating and cooling are determined by means of an energy balance that considers the heat losses and thermal gains within the analyzed thermal zone, with the aim of maintaining the internal temperature of the heated rooms at the design value [41]. The following formula is used by the software for the requirements of the winter regime (3):
Q H , n d   = Q H , h t η H , g n × Q g n = Q H , t r + Q H , v e η H , g n × Q i n t + Q s o l
where
  • Q H , n d is the ideal heat energy demand of the building for heating;
  • Q H , h t is the total heat transfer for heating;
  • Q H , t r is the transmission heat transfer for heating;
  • Q H , v e is the ventilation heat transfer for heating;
  • Q g n are the total heat inputs;
  • Q i n t are the internal heat inputs;
  • Q s o l is the solar heat input;
  • η H , g n is the heat input use factor.
The following is used for the summer regime requirements (4):
Q C , n d   = Q g n η C , I s × Q C , h t = Q i n t + Q s o l η C , i s × Q C , t r + Q C , v e
where
  • Q C , n d is the ideal heat energy demand of the building for cooling;
  • Q C , h t is the total heat transfer for cooling;
  • Q C , t r is the transmission heat transfer for cooling;
  • Q C , v e is the ventilation heat transfer for cooling;
  • Q g n are the total heat inputs;
  • Q i n t are the internal heat inputs;
  • Q s o l is the solar heat input;
  • η C , I s is the heat input use factor.
Based on the simulation results, Termus BIM 42 classifies the building as an energy class, as required by current legislation, and generates an energy label [42]. This label shows the energy class of the building together with the estimated consumption in kWh per square meter per year. The final report also includes data on the energy requirements for heating, cooling and hot water, as well as the consumption of auxiliary systems.
This was performed first for the building in its starting condition (ante) and then for the building with the upgrades described above, digitally modeled (post) (Figure 9).
In this way, it is possible to simulate a forecast scenario to assess energy consumption after upgrading. These data, together with an economic assessment of the interventions, allow the client to assess the environmental and financial aspects of the project during the design phase.

3. Results and Discussion

The replacement of existing machines with high-efficiency air/water heat pumps can cover both winter and summer energy needs, as well as the production of domestic hot water (Figure 10). The use of electricity as the only primary energy source will completely eliminate the use of any fossil fuels such as methane gas. To complete the upgrading of the buildings, it will be necessary to produce a significant part of the electrical power required to run the heat pumps through a renewable source (Figure 11). The heat pumps, replacing the existing boilers and chillers, with a nominal power of 1 MW (Buildings A–C) and 0.7 MW (Building B), will be connected to distribution substations, using the heat transfer fluids in the existing vertical distribution piping (Table 5). Furthermore, the air distribution ducts serving the AHU will not be replaced as their substitution would not contribute to the building’s energy efficiency (Figure 12).
Air-to-water heat pumps use outside air as a heat source and operate on the heat transfer principle. This type of heat pump essentially consists of an outdoor unit, which extracts heat from the air using a refrigerant, and an indoor unit, which transfers this heat for use as domestic hot water or in underfloor heating systems. The efficiency of these systems is measured by the Coefficient of Performance (COP), which indicates the amount of heat produced in relation to the electrical energy consumed [43]. The use of photovoltaic panels to power heat pumps is an environmentally friendly solution to maximize energy independence. By converting the sun’s energy into electricity, photovoltaic solar panels can provide the energy needed to operate air-to-water heat pumps, reducing the amount of energy consumed from the grid [44]. One of the main benefits of using air-to-water heat pumps in combination with photovoltaics is the remarkable energy efficiency of the whole system. Heat pumps are devices that can transfer more thermal energy than they consume electrically. If this electrical consumption is covered by photovoltaic panels, the efficiency of the system increases even further. During daylight hours, solar energy can be fed directly into the heat pump, reducing or eliminating the need to draw from the grid and maximizing the use of clean energy. The combined use of these technologies makes a significant contribution to reducing carbon dioxide emissions. This is particularly important in the context of global efforts to mitigate climate change. The use of solar energy to power heat pumps reduces dependence on fossil fuels, thereby reducing greenhouse gas emissions [45].
However, the effectiveness of these systems is closely linked to climatic conditions. During the winter months, when sunshine hours are reduced and temperatures are lower, the efficiency of both photovoltaic panels and heat pumps can decrease. This may require additional use of grid energy, reducing energy independence and increasing running costs. The installation of air-to-water heat pumps and photovoltaic systems requires a significant initial investment. Although there are energy savings and tax incentives that can offset these costs over time, the payback period can vary depending on several factors, such as geographical location, access to government incentives and energy prices. The time required to recoup the investment can be long and may be a barrier for some users.
The use of BIM and BEM, through the creation of a digital twin, made it possible to create point simulations for the management of the façade technology system. In particular, it was possible to analyze the envelope and achieve a low global-heat-transfer value of 0.36 W/m2K for the building.
The building currently has an “E” energy label with an overall non-renewable primary energy requirement of 191.684 kWh/m2/year (Figure 13). The energy analysis carried out reveals a particular criticality during the winter season that leads to high gas consumption. Through the application of the efficiency measures on the plant system described above, it is possible to achieve a substantial improvement in the building’s energy performance, obtaining an overall non-renewable primary energy requirement of 76.053 kWh/m2/year. All redevelopment operations will guarantee the continuity of service thanks to the re-use of the existing plant distribution system and will comply with all regulatory principles concerning environmental impacts.
The energy analysis indicates a particular criticality in winter conditions, resulting from the high transmittance of the current envelope, which leads to a high consumption of gas for winter heating. The sum of the efficiency measures on the plant system, together with the installation of production systems from renewable sources, led to a substantial improvement in the building’s energy performance, reaching a total value of 76 kW/hm2/year, which allows it to attain a class A1 label.

3.1. Economic Assessment

The energy consumption ante operam is 191,684 kWh/m2/year (natural gas plus electricity), while for the post operam it is reduced to 76,053 kWh/m2/year (electricity). With a total surface area of 19,050.57 m2, the total energy consumption is 3,652,633.06 kWh/year ante operam and 1,449,024.49 kWh/year post operam, resulting in total energy savings of 2,203,608.57 kWh/year. Before the intervention, energy was mainly provided by methane (70%) and the rest by electricity. The environmental emission factors for the two energy sources were 0.202 kgCO2/kWh for methane and 0.233 kgCO2/kWh for electricity [46]. The ante operam CO2 emissions correspond to the sum of the methane and electricity emissions, i.e., a total of 772,875.11 kgCO2 or 772.87 tonnesCO2 (5).
m e t h a n e = 3,652,633.06 k W h y e a r × 0.7 × 0.202 k g C O 2 K w h = 517,691.71   K g C O 2
e l e c t r i c   e n e r g y = 3,652,633.06 k W h y e a r × 0.3 × 0.233 k g C O 2 K w h = 255,183.40   K g C O 2
t o t a l = 517,691.71   k g C O 2 + 255,183.40   k g C O 2 = 772,875.11   K g C O 2 = 772.87   t o n n e s C O 2  
After the redevelopment, the energy supply is exclusively electrical. Without taking into account the renewable energy produced by the new photovoltaic system, the pos operam emissions correspond to 33,762.71 kgCO2 (6).
e l e c t r i c   e n e r g y = 1,449,024.49 k W h y e a r × 0.233 k g C O 2 K w h = 377,622.70   K g C O 2 = 337.62   t o n n e s   C O 2
If the use of the energy produced by the photovoltaic system is taken into account, the reduction in greenhouse gases in the environment is even more pronounced and certainly proportional to the percentage of use. For example, in a scenario in which 50% of the energy demand is met by renewable sources, the CO2 emissions will be 168.81 tonnesCO2 (7).
1,449,024.49 k W h y e a r × 0.5 × 0.233 k g C O 2 K w h = 168,811.35   K g C O 2 = 168.81   t o n n e s   C O 2
The redevelopment work has resulted in a reduction in CO2 emissions of approximately 604.06 tons/year, a 78% reduction from the original levels (8).
772.87   t o n n e s C O 2 168.81   t o n n e s C O 2 = 604.06   t o n n e s C O 2
The use of digital systems proved to be fundamental in optimizing the decision-making process during the design phase of energy improvements. The use of a BIM model of the building made it possible to carry out point-by-point simulations of the management of the technological systems and the building envelope, facilitating the analysis of the overall energy performance and enabling the rapid identification of critical points in terms of energy consumption. This enabled the identification of optimal solutions to reduce overall energy demand and improve plant efficiency, thereby reducing the need for non-renewable primary energy. BIM offers a key advantage in managing complex project information, providing a clear visualization of the proposed technological solutions and facilitating the management of project information. Simplified, more efficient and less error-prone decision making was possible as simulations provided a solid basis for assessing the impact of energy interventions prior to implementation.
However, it is important to recognize some of the limitations of the research. Although BIM has greatly improved the ability to design and simulate interventions, the success of the proposed solutions is highly dependent on the quality of the input data and the accuracy of the available information on the existing building stock. Any deficiencies in the input data may negatively affect the accuracy of the simulations and, consequently, the prediction of the post-intervention energy performance. Another aspect that could limit the effectiveness of the interventions is the variability of the actual climate conditions compared to the historical climate data used in the simulations. The energy simulations are based on the average climatic conditions and unforeseen variations could affect the performance of the systems and the building envelope. Therefore, the integration of intelligent building monitoring and management systems, such as IoT devices integrated with a digital twin, should be considered to ensure continuous control of energy performance and the ability to dynamically adapt to climate variations. This research highlights the need for continued attention to data quality and the adaptability of energy solutions to real conditions.
The construction and operating costs of the power generation plants depend on various factors, mainly power and installation technology. The cost of the planned photovoltaic system (160 kWp), including inverter, switchgear and installation, is about 1800.00 EUR/kW, corresponding to a total of EUR 288,000.00. Supplying and installing the heat pumps costs around 300–350 EUR/kW. The power of the reversible heat pump system foreseen by the project is 1 MW for Buildings A–C and 0.7 MW for Body B; therefore, the cost of the intervention is around EUR 550,000.00 to which must be added the costs of dismissing the old system and connecting to new machines, in a first approximation of around EUR 250,000.00. In this context, it is crucial to discuss the economic feasibility of the proposed solutions, such as the installation of photovoltaic systems and heat pumps, taking into account both the initial investment costs and the long-term savings related to reduced energy consumption and greenhouse gas emissions. The adoption of these technologies can lead to significant reductions in energy costs through the autonomous production of energy from renewable sources and improvements in the efficiency of heating and cooling systems.
To assess the financial viability of this investment, a Return on Investment (ROI) can be calculated. The total initial cost, including the photovoltaic system and the heat pumps, is EUR 838,000.00, and the annual maintenance cost is 20% of the initial investment (EUR 167,600.00). The estimated annual energy saving is 2,203,608.57 kWh, which translates into annual financial savings of approximately EUR 440,721.71, assuming an average electricity price of EUR 0.20 per kWh [47]. Considering a system lifetime of 30 years, the total savings would amount to EUR 8,193,651.30.
Subtracting the initial investment from the total savings leads to a net gain of EUR 7,355,651.30, so the ROI was calculated as follows (9):
R O I = EUR 7,355,651.30 838,000.00 × 100 = 877.44 %
This ROI indicates a highly profitable investment and highlights the significant long-term benefits of implementing energy-efficient technologies in building infrastructure. The installation of photovoltaic systems reduces dependence on traditional energy sources, while high-efficiency heat pumps use a minimal amount of electricity to provide heating in winter and cooling in summer. Achieving an environmental balance through the integration of these technologies is essential, even if it requires an initial investment, as it contributes to a significant reduction in CO2 emissions and an improvement in living comfort.
A return-on-investment analysis was carried out to assess the economic viability of upgrading the building’s energy performance, taking into account key variables, such as system degradation, energy price fluctuations and maintenance costs.
Three scenarios were analyzed for the sensitivity analysis, as follows:
-
Baseline scenario: system degradation of 0.5% per year, no change in energy price and unchanged maintenance costs [48,49];
-
Optimistic scenario: system degradation of 0.3% per year, energy price increase of 2% per year and maintenance cost reduction of 10% [48,49];
-
Pessimistic scenario: system degradation of 0.7% per year, energy price reduction of 2% per year and maintenance cost increase of 10% [48,49].
The net present value of the annual savings was calculated using a discount rate of 5%, which represents the expected return on an alternative investment with a comparable level of risk. The discount rate is used to discount future cash flows, reflecting the principle that money available today is more valuable than the same amount available in the future [50]. The actual annual savings were adjusted for time-dependent maintenance costs using the following Formula (10):
S a v i n g y e a r = S a v i n g i n i t i a l × 1 d e g r a d a t i o n a n n u a l y e a r × 1 + e n e r g y   p r i c e   v a r i a t i o n y e a r  
The maintenance costs were updated according to time (11), as follows:
M a i n t e n a n c e   C o s t y e a r = M a i n t e n a n c e   C o s t i n i t i a l × M a i n t e n a n c e   i n c r e a s e   f a c t o r
The Net Present Value (NPV) was calculated as follows (12):
N P V = S a v i n g   y e a r M a i n t e n a n c e   C o s t y e a r 1 + d i s c o u n t   r a t e y e a r × 100
Finally, the ROI was determined as follows (13):
R O I = N P V I n i t i a l   i n v e s t m e n t I n i t i a l   i n v e s t m e n t × 100
The above analysis shows that the investment is cost effective in all scenarios considered. In particular:
-
In the baseline scenario, the ROI is 354.6%, indicating a significant return on the initial investment;
-
In the optimistic scenario, the ROI increases to 621.5% due to a combination of lower efficiency losses and higher energy prices;
-
In the pessimistic scenario, the investment remains profitable with an ROI of 159.6%, albeit reduced because of higher maintenance costs and lower energy prices.
These results confirm the solidity of the economic analysis and underline the importance of considering long-term dynamics in the decision-making process.

3.2. Comparison with the Literature

Comparing the results with other studies in the literature is complex, as each case has unique characteristics. However, a comparative analysis of the different systems described in the literature was carried out, taking into account aspects such as the type of system, intended use, size of the building analyzed and end functions fulfilled. Where possible, a direct comparison of results was made based on similarities in the climate data, system type and key performance indicators. Finally, differences, strengths and innovations compared to existing studies were highlighted. It is important to note that although many papers focus on integrated systems, where the main components are the heat pump and the PV system, the differences among the studies mainly concern the type of heat pump used and the size of the PV system.
The heat pumps discussed in the literature include single source and dual- or multiple-source heat pumps. A first analysis shows that one of the most studied systems is the geothermal heat pump [50,51]. In such configurations, the heat pump exploits ground heat, of which the temperature is more stable than that of air, acting as a source of low-temperature thermal energy. However, it has been observed that the continuous operation of the geothermal heat pump, particularly in regions characterized by extremely cold climates and a mismatch between the winter and summer thermal loads in favor of the former, causes a progressive decrease in the ground temperature over time, with a consequent negative impact on the system’s coefficient of performance (COP) [52]. In order to compensate for the drop in ground temperature, many studies have proposed the integration of the ground source heat pump with photovoltaic–thermal panels (the latter allow the simultaneous production of thermal and electrical energy; moreover, the presence of the solar thermal panel under the photovoltaic panel reduces the temperature of the latter, using the excess heat to heat water, thus avoiding the heating of the photovoltaic module, with a consequent improvement in efficiency). This coupling makes it possible to use the low-temperature heat produced by the panels to complement the energy extracted from the ground and maintain high system performance [53].
Zhang et al. aimed to achieve a zero-carbon building through energy-efficient strategies using air source heat pumps and renewable energy systems for heating, cooling and electricity generation. Dynamic simulations have shown, among other parameters, a 53% reduction in CO2 emissions when a heat pump system is used instead of traditional boiler and chiller systems [54]. Rabczak et al. show that the integration of a heat pump and photovoltaic system significantly reduces the external energy demand and operating costs, facilitating the energy self-sufficiency of residential buildings in Eastern Europe. The results show that a reduction in CO2 emissions of 756 kg is achieved with this type of intervention [55]. Oltarzeska et al. studied the application of a system combining air source heat pumps with photovoltaic panels in a commercial building, analyzing its performance in different climatic zones in Poland. Using simulations with TRNSYS 18 software, the study evaluated how variations in five parameters—area, efficiency, type and location of the PV panels, and control strategy of the heat pump—affect energy production and consumption. It also analyzed the panels’ abilities to meet the heat pump’s energy needs and provide thermal comfort, with a simplified assessment of operating and investment costs. The results show a reduction in energy consumption ranging from 36 to 62% depending on the scenario [56].
The results of the comparison [57,58,59] show that the proposed system represents a valid solution for decarbonization, ensuring improved performance compared to traditional plant systems, with significant reductions in electricity consumption and CO2 emissions, even in buildings with different uses, such as residential buildings [55]. It also shows that it is versatile and applicable not only in the Italian climatic context, but also in situations with different balance conditions between winter and summer thermal loads.

4. Conclusions

As a result of the work carried out, it can be stated that for a large building it is essential to increase the design of the technological systems. However, in order to meet stringent regulatory requirements and achieve energy efficiency results, the use of advanced digital and technological systems is indispensable. In fact, the use of virtual design systems makes it possible to visualize the simulation of the upgrading process and to study problems well in advance. In summary, the achievement of energy efficiency in the building complex under research was possible thanks to the following:
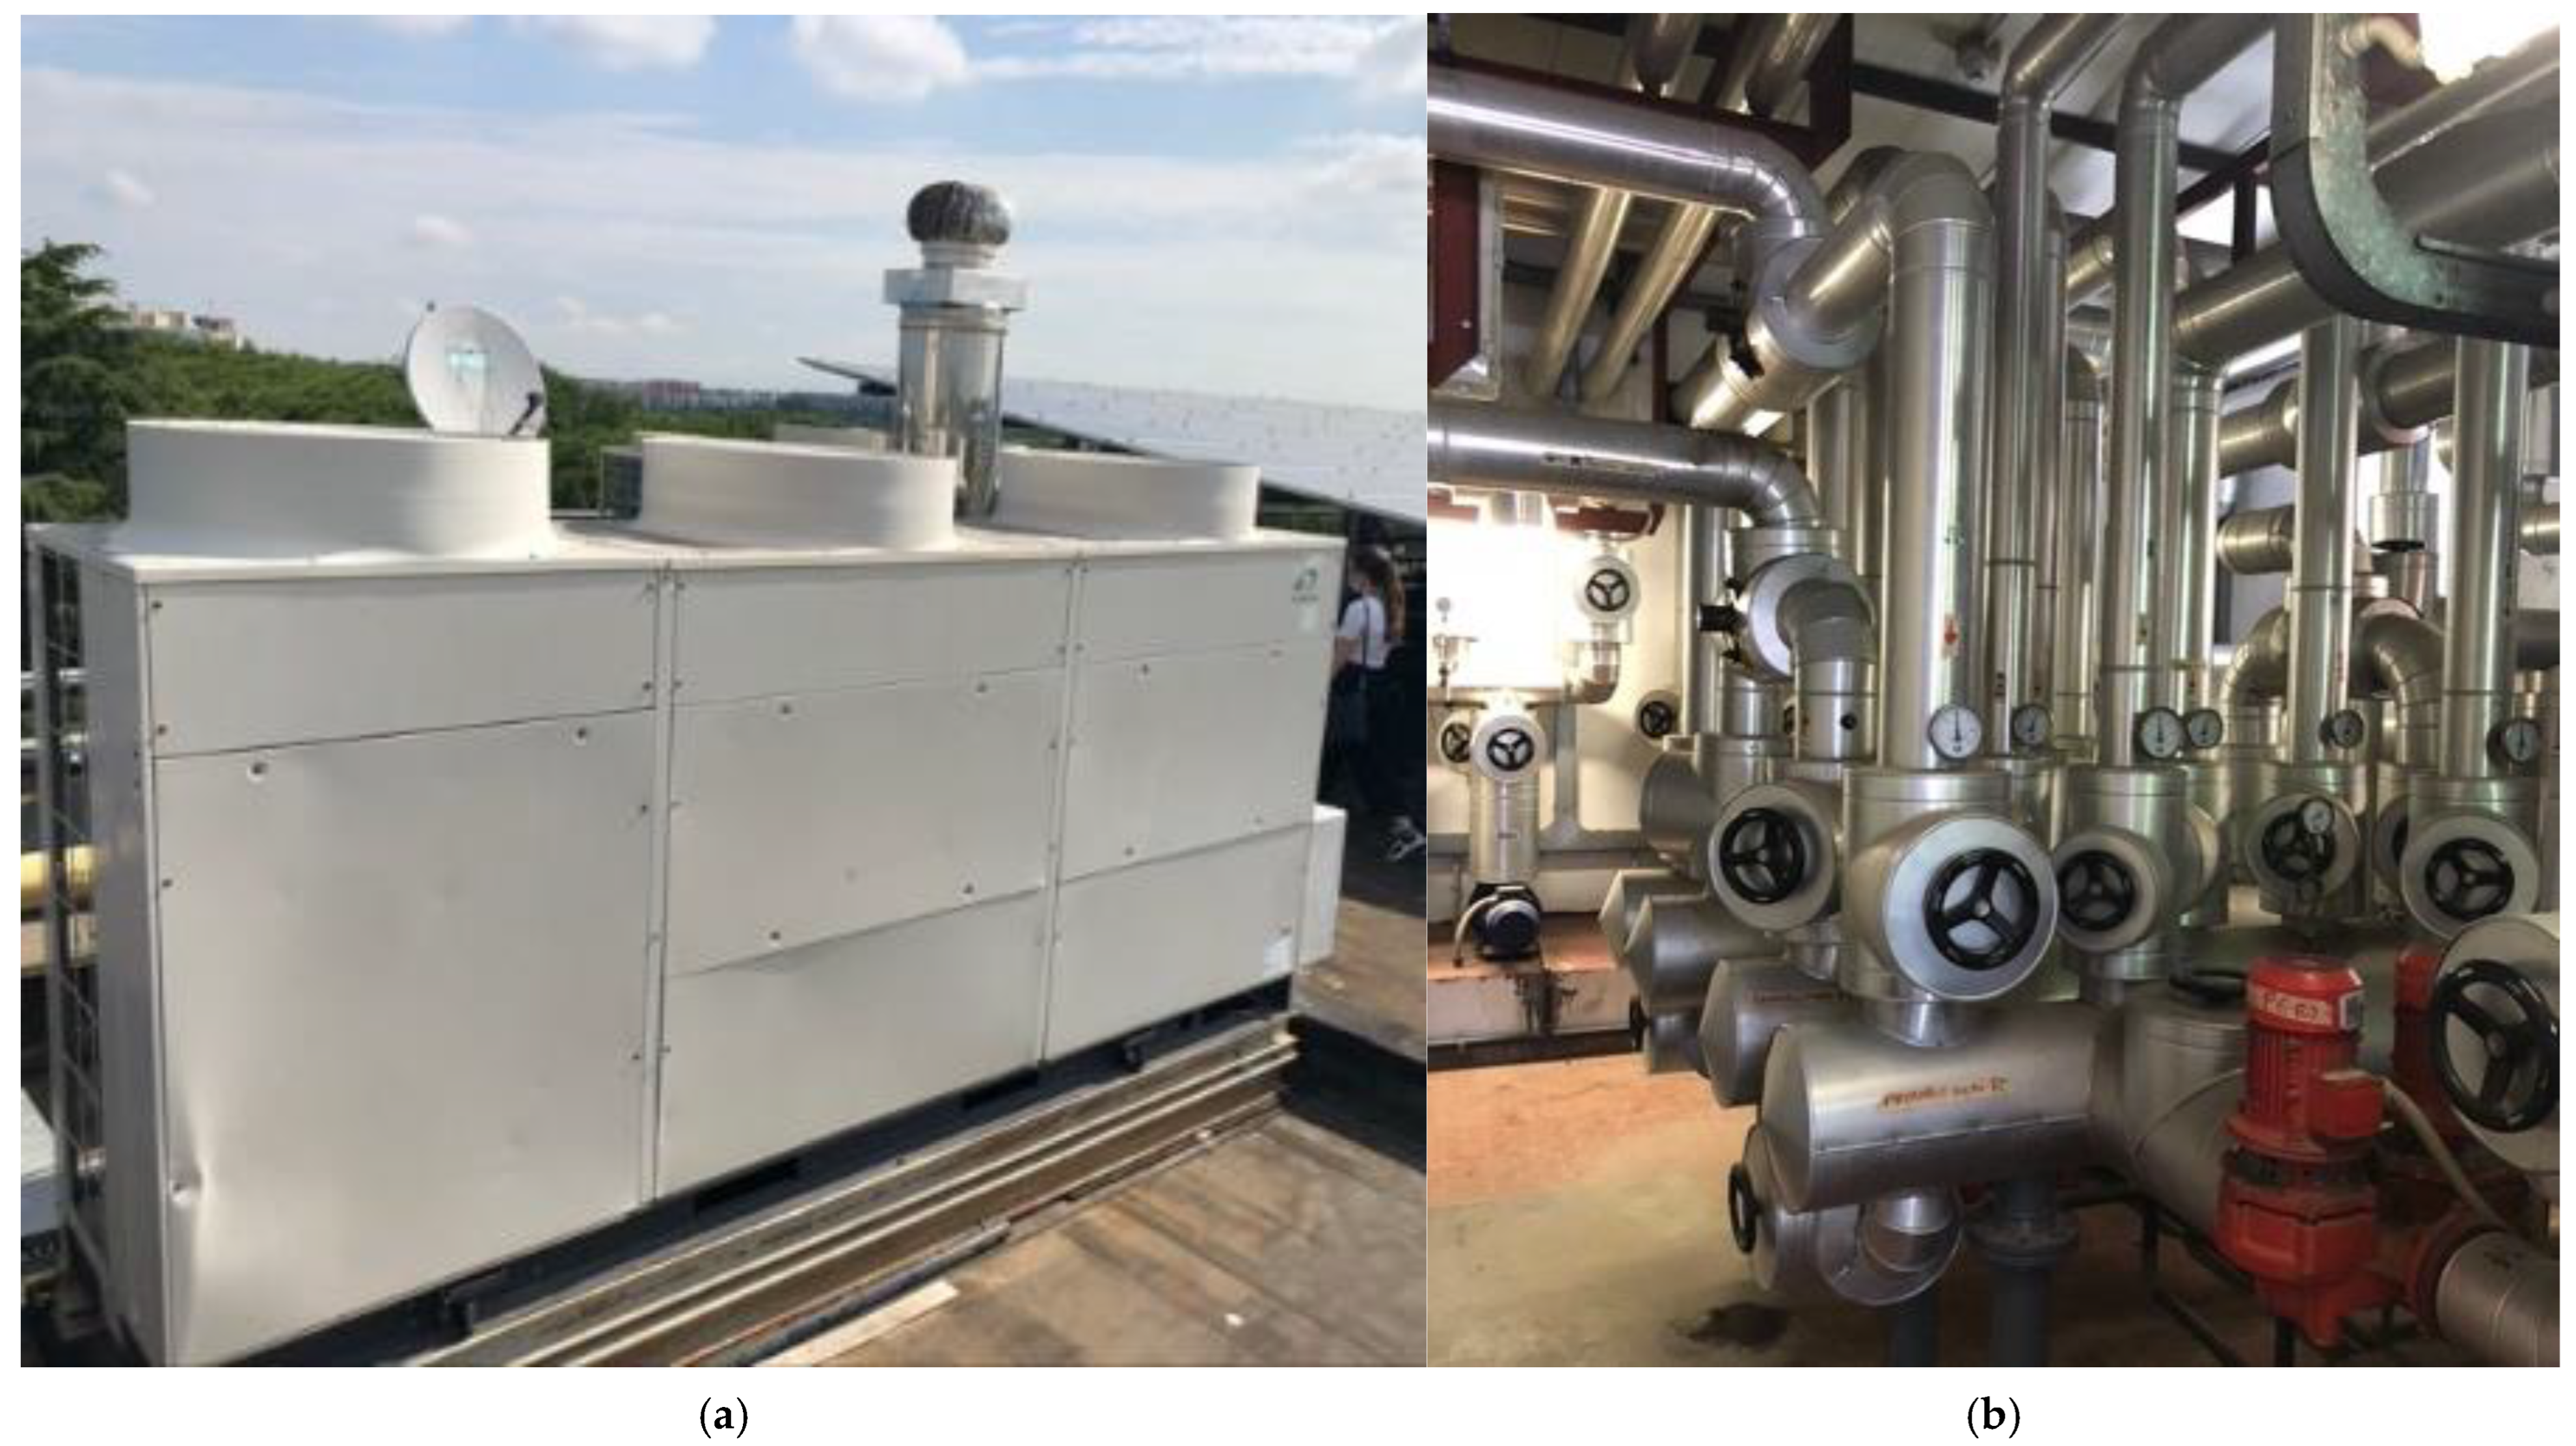
  • Replacement of obsolete AHUs with new, state-of-the-art machines with a double-heat-recovery system with adiabatic cooling and humidification;
  • Replacement of cooling units with high-efficiency heat pumps that reduce the greenhouse effect and powered by environmentally compatible fluid with a minimum GWP;
  • Replacement of methane boilers with CO2 recovery heat pumps, which extract renewable thermal energy contained in the atmosphere through the evaporator at low temperature;
  • Replacement of existing photovoltaic panels with new high-efficiency monocrystalline panels.
The sustainable redevelopment of the building resulted in a significant reduction in energy consumption of 2,203,608.57 kWh/year, or 60.3%, and a corresponding reduction in CO2 emissions of 604.06, or 78%, compared to previous levels.
It is expected that future research will concentrate on the advancement of building technologies and digital design systems, with a specific focus on the integration of state-of-the-art energy storage solutions. These innovations are crucial for enhancing the efficiency of energy storage and distribution from renewable sources, which is a pivotal aspect in achieving energy self-sufficiency and making a contribution to decarbonization. In conclusion, upgrading allows users of these buildings to enjoy a high level of environmental comfort and air quality thanks to the use of the best near zero-impact technologies by decreasing the use of fossil fuels.

Author Contributions

Conceptualization, G.P. and F.M.; methodology, G.P. and F.M.; software, G.P. and F.M.; validation, G.P. and F.M.; formal analysis, G.P. and F.M.; investigation, G.P. and F.M.; resources, G.P. and F.M.; data curation, G.P. and F.M.; writing—original draft preparation, F.M.; writing—review and editing, G.P. and F.M.; visualization, G.P. and F.M.; supervision, G.P.; project administration, G.P. and F.M. All authors have read and agreed to the published version of the manuscript.

Funding

The work was funded by Sapienza University Research Call 2022—CUP B89J21032850001.

Data Availability Statement

Data are contained within the article.

Conflicts of Interest

The authors declare no conflict of interest.

References

  1. Ciampittiello, M.; Marchetto, A.; Boggero, A. Water Resources Management under Climate Change: A Review. Sustainability 2024, 16, 3590. [Google Scholar] [CrossRef]
  2. Pancewicz, A.; Kurianowicz, A. Urban Greening in the Process of Climate Change Adaptation of Large Cities. Energies 2024, 17, 377. [Google Scholar] [CrossRef]
  3. Daxayani, C.; Ananthamoorthy, N.P.; Gokulnath, G. Navigating the Anthropocene: Addressing Global Challenges for the Environmental and Climate Change. In Global Challenges for the Environment and Climate Change; Idris, S., Ed.; IGI Global: Hershey, PA, USA, 2024; pp. 37–54. [Google Scholar] [CrossRef]
  4. Dokupilová, D.; Stojilovska, A.; Palma, P.; Gouveia, J.P.; Paschalidou, E.G.; Barrella, R.; Feenstra, M.; Horta, A.; Sánchez-Guevara, C.; Kádár, J.; et al. Exploring Energy Poverty in Urban and Rural Contexts in the Era of Climate Change: A Comparative Analysis of European Countries and Israel. Energies 2024, 17, 2939. [Google Scholar] [CrossRef]
  5. Tol, R.S.J. A meta-analysis of the total economic impact of climate change. Energy Policy 2024, 185, 113922. [Google Scholar] [CrossRef]
  6. Teske, S.; Pregger, T. Science-Based Industry Greenhouse Gas (GHG) Targets: Defining the Challenge. In Achieving the Paris Climate Agreement Goals; Teske, S., Ed.; Springer: Cham, Switzerland, 2022. [Google Scholar] [CrossRef]
  7. European Council. Paris Agreement on Climate Change. Available online: https://www.consilium.europa.eu/en/policies/climate-change/paris-agreement/ (accessed on 13 September 2024).
  8. The White House. Inflation Reduction Act. Available online: https://bidenwhitehouse.archives.gov/cleanenergy/inflation-reduction-act-guidebook/ (accessed on 13 September 2024).
  9. European Union External Action. China Carbon Neutrality in 2060. Available online: https://www.eeas.europa.eu/eeas/china-carbon-neutrality-2060-possible-game-changer-climate_en (accessed on 13 September 2024).
  10. Eurepan Union. Target for 2050. Available online: https://ec.europa.eu/info/energy-climate-change-environment/overall-targets-and-reporting/2050-targets_it (accessed on 11 January 2024).
  11. 6th Evaluation Report for Climate Change. Available online: https://www.ipcc.ch/2021/08/09/ar6-wg1-20210809-pr/ (accessed on 10 July 2024).
  12. European Commission. Energy Performance of Buildings Directive (EPBD). Available online: https://energy.ec.europa.eu/topics/energy-efficiency/energy-efficient-buildings/energy-performance-buildings-directive_en (accessed on 10 January 2025).
  13. Ministero Dello Sviluppo Economico: Piano Nazionale per L’efficienza Energetica (PAEE). 2017. Available online: https://www.efficienzaenergetica.enea.it/glossario-efficienza-energetica/lettera-p/paee.html (accessed on 28 February 2025).
  14. Piano Nazionale Ripresa e Resilienza (PNRR), Next Generation UE. 2021. Available online: https://www.italiadomani.gov.it/content/sogei-ng/it/it/home.html (accessed on 28 February 2025).
  15. European Parliament. Directive 2012/27/EU of the European Parliament and of the Council of 25 October 2012 on energy efficiency. Off. J. Eur. Union Dir. 2012, 315, 1–56. [Google Scholar]
  16. Direttiva 2009/28/CE del Parlamento Europeo e del Consiglio del 23 Aprile 2009 Sulla Promozione Dell’Uso Dell’Energia da Fonti Rinnovabili, Recante Modifica e Successiva Abrogazione Delle Direttive 2001/77/CE e 2003/30/CE. Available online: https://eur-lex.europa.eu/legal-content/IT/TXT/PDF/?uri=CELEX:02009L0028-20210701 (accessed on 8 March 2024).
  17. Ministero Dello Sviluppo Economico, Strategia per la Riqualificazione Energetica del Parco Immobiliare Nazionale. Available online: https://www.mimit.gov.it/images/stories/documenti/STREPIN_2020_rev_25-11-2020.pdf (accessed on 13 September 2024).
  18. European Union. Energy Performance of Buildings Directive. Available online: https://epb.center/epb-standards/energy-performance-buildings-directive-epbd/ (accessed on 13 September 2024).
  19. Nearly Zero Energy Buildings Definitions Across Europe. Episcope Project, Brussels. 2015. Available online: https://www.eumonitor.eu/9353000/1/j4nvk6yhcbpeywk_j9vvik7m1c3gyxp/vk6b8ag0qcmz (accessed on 14 August 2020).
  20. Mostafazadeh, F.; Eirdmousa, S.J.; Tavakolan, M. Energy, economic and comfort optimization of building retrofits considering climate change: A simulation-based NSGA-III approach. Energy Build. 2023, 280, 112721. [Google Scholar] [CrossRef]
  21. Şirin, C.; Goggins, J.; Hajdukiewicz, M. A review on building-integrated photovoltaic/thermal systems for green buildings. Appl. Therm. Eng. 2023, 229, 120607. [Google Scholar] [CrossRef]
  22. Calama-González, C.M.; Suárez, R.; León-Rodríguez, Á.L. Mitigation of climate change in Mediterranean existing social dwellings through numerical optimization of building stock models. Energy Build. 2022, 266, 112109. [Google Scholar] [CrossRef]
  23. Barone, G.; Vardopoulos, I.; Attia, S.; Vassilliades, C. Optimizing energy-efficient building renovation: Integrating double-skin façades with solar systems in the Mediterranean landscape. Energy Rep. 2024, 12, 2933–2945. [Google Scholar] [CrossRef]
  24. Galimshina, A.; Moustapha, M.; Hollberg, A.; Lasvaux, S.; Sudret, B.; Habert, G. Strategies for robust renovation of residential buildings in Switzerland. Nat. Commun. 2024, 15, 2227. [Google Scholar] [CrossRef]
  25. Li, K.; Zhong, W.; Zhang, T. Improving building retrofit Decision-Making by integrating passive and BIPV techniques with ensemble model. Energy Build. 2024, 323, 114727. [Google Scholar] [CrossRef]
  26. Piras, G.; Muzi, F.; Tiburcio, V.A. Digital Management Methodology for Building Production Optimization through Digital Twin and Artificial Intelligence Integration. Buildings 2024, 14, 2110. [Google Scholar] [CrossRef]
  27. Piras, G.; Agostinelli, S.; Muzi, F. Digital Twin Framework for Built Environment: A Review of Key Enablers. Energies 2024, 17, 436. [Google Scholar] [CrossRef]
  28. Oulefki, A.; Amira, A.; Kurugollu, F.; Soudan, B. Dataset of IoT-based energy and environmental parameters in a smart building infrastructure. Data Brief 2024, 56, 110769. [Google Scholar] [CrossRef] [PubMed]
  29. Li, J. Optimization strategy of property energy management based on artificial intelligence. Energy Inf. 2024, 7, 79. [Google Scholar] [CrossRef]
  30. Alexandrou, K.; Thravalou, S.; Artopoulos, G. Heritage-BIM for energy simulation: A data exchange method for improved interoperability. Build. Res. Inf. 2023, 52, 373–386. [Google Scholar] [CrossRef]
  31. Shehata, A.O.; Hassan, A.M.; Shahda, M.M.; Megahed, N.A. Green retrofitting of heritage buildings based on (3Ts) framework: An applied case study. Front. Archit. Res. 2024, 13, 776–798. [Google Scholar] [CrossRef]
  32. Alhammad, M.; Eames, M.; Vinai, R. Enhancing Building Energy Efficiency through Building Information Modeling (BIM) and Building Energy Modeling (BEM) Integration: A Systematic Review. Buildings 2024, 14, 581. [Google Scholar] [CrossRef]
  33. Autodesk. Green Building Studio. Available online: https://gbs.autodesk.com/gbs (accessed on 9 January 2025).
  34. Oktavian, G.H.; Wijatmiko, I.; Nainggolan, C.R.; Devia, Y.P.; Anwar, M.R. Energy Efficient Design of Building Based on Building Information Modelling (BIM). Int. J. Integr. Eng. 2024, 16, 31–38. [Google Scholar] [CrossRef]
  35. Maglad, A.M.; Houda, M.; Alrowais, R.; Khan, A.M.; Jameel, M.; Rehman, S.K.U.; Khan, H.; Javed, M.F.; Rehman, M.F. Bim-based energy analysis and optimization using insight 360 (case study). Case Stud. Constr. Mater. 2023, 18, e01755. [Google Scholar] [CrossRef]
  36. Mehraban, M.H.; Alnaser, A.A.; Sepasgozar, S.M.E. Building Information Modeling and AI Algorithms for Optimizing Energy Performance in Hot Climates: A Comparative Study of Riyadh and Dubai. Buildings 2024, 14, 2748. [Google Scholar] [CrossRef]
  37. Hmidah, N.A.; Bin Haron, N.A.; Hizami, A.A.; Law, T.H.; Altohami, A.B.A. Energy Consumption of Retrofitting Existing Public Buildings in Malaysia under BIM Approach: Pilot Study. Sustainability 2023, 15, 10293. [Google Scholar] [CrossRef]
  38. UNI EN ISO 6946:2018; Componenti ed Elementi per Edilizia—Resistenza Termica e Trasmittanza Termica—Metodi di Calcolo. Available online: https://store.uni.com/uni-en-iso-6946-2018 (accessed on 10 January 2025).
  39. UNI EN ISO 10077-1:2018; Prestazione Termica di Finestre, Porte e Chiusure Oscuranti—Calcolo Della Trasmittanza Termica—Parte 1. Available online: https://store.uni.com/uni-en-iso-10077-1-2018 (accessed on 10 January 2025).
  40. American Institute of Architects. AIA G202-2013 BIM Protocol. Available online: https://shop.aiacontracts.com/contract-documents/22466-project-building-information-modeling-protocol-form-vbs-project-edition (accessed on 4 June 2024).
  41. UNI/TS 11300-1:2014; Prestazioni Energetiche Degli Edifici—Parte 1: Determinazione del Fabbisogno di Energia Termica Dell’edificio per la Climatizzazione Estiva ed Invernale. Available online: https://store.uni.com/uni-ts-11300-1-2014 (accessed on 10 January 2025).
  42. Gazzetta Ufficiale Della Repubblica Italiana, LEGGE 9 Gennaio 1991, n. 10. Available online: https://www.gazzettaufficiale.it/eli/id/1991/01/16/091G0015/sg (accessed on 8 October 2024).
  43. Meng, X.; Zhou, X.; Li, Z. Review of the Coupled System of Solar and Air Source Heat Pump. Energies 2024, 17, 6045. [Google Scholar] [CrossRef]
  44. Zafaranchi, M.; Riddell, W.T.; Chan, N.B.; Saliba, E.; Leung, L. Evaluating the Environmental Impact of Heat Pump Systems: An Integrated Approach to Sustainable Building Operations. Energies 2025, 18, 388. [Google Scholar] [CrossRef]
  45. Januário, M.; Gomes, R.; Baptista, P.; Ferrão, P. Integrated Energy and Environmental Modeling to Design Cost-Effective Building Solutions at a Regional Level. Energies 2024, 17, 5730. [Google Scholar] [CrossRef]
  46. Istituto Superiore per la Protezione e la Ricerca Ambientale (ISPRA), Fattori di Emissione di CO2. Available online: https://www.isprambiente.gov.it/it/pubblicazioni/rapporti/fattori-di-emissione-di-co2-nel-settore-elettrico-e-analisi-della-decomposizione-delle-emissioni?utm_source=chatgpt.com (accessed on 9 January 2025).
  47. Autorità di Regolazione per Energia Reti e Ambiente (ARERA). Prezzi e tariffe. Available online: https://www.arera.it/area-operatori/prezzi-e-tariffe (accessed on 10 January 2025).
  48. Rhenals-Julio, J.D.; Martínez, H.A.; Oviedo, M.D.; Arango, J.F.; Fandiño JM, M. Economic Assessment of the Potential for Renewable Based Microgrids Generation Systems: An Application in a University Building. Int. J. Energy Econ. Policy 2024, 15, 206–212. [Google Scholar] [CrossRef]
  49. Stoyanov, L.; Zarkov, Z.; Milenov, V.; Bachev, I.; Lazarov, V. Experimental Study Of Photovoltaic Panels’ Degradation and Technology Evolution. In Proceedings of the 2024 9th International Conference on Energy Efficiency and Agricultural Engineering (EE&AE), Ruse, Bulgaria, 27–29 June 2024; pp. 1–5. [Google Scholar] [CrossRef]
  50. Lyócsa, Š.; Todorova, N. Forecasting of clean energy market volatility: The role of oil and the technology sector. Energy Econ. 2024, 132, 107451. [Google Scholar] [CrossRef]
  51. Yu, S.; Liu, X.; Li, R.; Yin, Z.; Chen, Z.; Han, F.; Li, S. Demand side management full season optimal operation potential analysis for coupled hybrid photovoltaic/thermal, heat pump, and thermal energy storage systems. J. Energy Storage 2024, 80, 110375. [Google Scholar] [CrossRef]
  52. Dannemand, M.; Sifnaios, I.; Tian, Z.; Furbo, S. Simulation and optimization of a hybrid unglazed solar photovoltaic-thermal collector and heat pump system with two storage tanks. Energy Convers. Manag. 2020, 206, 112429. [Google Scholar] [CrossRef]
  53. Franzoi, N.; Prada, A.; Verones, S.; Baggio, P. Enhancing PV self-consumption through energy communities in heating-dominated climates. Energies 2021, 14, 4165. [Google Scholar] [CrossRef]
  54. Zhang, X.; Ge, Y.; Patel, R.V. Renewable Energy Integration and Energy Efficiency Enhancement for a Net-Zero-Carbon Commercial Building. Buildings 2025, 15, 414. [Google Scholar] [CrossRef]
  55. Rabczak, S.; Mateichyk, V.; Smieszek, M.; Nowak, K.; Kolomiiets, S. Evaluating the Energy Efficiency of Combining Heat Pumps and Photovoltaic Panels in Eco-Friendly Housing. Appl. Sci. 2024, 14, 5575. [Google Scholar] [CrossRef]
  56. Ołtarzewska, A.; Krawczyk, D.A. Simulation and Performance Analysis of an Air-Source Heat Pump and Photovoltaic Panels Integrated with Service Building in Different Climate Zones of Poland. Energies 2024, 17, 1182. [Google Scholar] [CrossRef]
  57. Nicoletti, F.; Ramundo, G.; Arcuri, N. Optimal operating strategy of hybrid heat pump − boiler systems with photovoltaics and battery storage. Energy Convers. Manag. 2025, 323, 119233. [Google Scholar] [CrossRef]
  58. Woroniak, G.; Piotrowska-Woroniak, J.; Woroniak, A.; Owczarek, E.; Giza, K. Analysis of the Hybrid Power-Heating System in a Single-Family Building, along with Ecological Aspects of the Operation. Energies 2024, 17, 2601. [Google Scholar] [CrossRef]
  59. Vallati, A.; Di Matteo, M.; Sundararajan, M.; Muzi, F.; Fiorini, C.V. Development and optimization of an energy saving strategy for social housing applications by water source-heat pump integrating photovoltaic-thermal panels. Energy 2024, 301, 131531. [Google Scholar] [CrossRef]
Figure 1. Southeast view of the complex.
Buildings 15 00824 g001
Figure 2. South elevation of the complex (BIM model).
Buildings 15 00824 g002
Figure 4. Solar energy analysis (BIM model).
Buildings 15 00824 g004
Figure 5. Solar radiation and lighting: (a) summer; (b) winter.
Buildings 15 00824 g005
Figure 6. Solar radiation and building shading simulations (BIM model).
Buildings 15 00824 g006
Figure 7. (a) Picture of an AHU on a roof; (b) picture of a technical room on a roof.
Buildings 15 00824 g007
Figure 8. BIM methodology workflow.
Buildings 15 00824 g008
Figure 9. Visual rendering of the BIM model.
Buildings 15 00824 g009
Figure 10. Three-dimensional view: red indicates the hot water production system (BIM model).
Buildings 15 00824 g010
Figure 11. Three-dimensional view: green indicates the photovoltaic system (BIM model).
Buildings 15 00824 g011
Figure 12. Three-dimensional view: blue indicates the AHU (BIM model).
Buildings 15 00824 g012
Figure 13. Energy label improvement.
Buildings 15 00824 g013
Table 1. Transparency-to-opaqueness ratio for each façade.
OrientationTransparent Surface [%]Opaque Surface [%]
Building ASouth7921
North7921
Building BSouth7921
North7822
Building CSouth919
North919
East6337
West8812
Total opaque [m2]2075.49
Total transparent [m2]8301.97
Table 3. Details of the thermal system.
Heating
Generator 1
Heating
Generator 2
Cooling
Generator 1
Cooling
Generator 2
Buildings A–C
TypeNatural gas boilerNatural gas boilerRefrigeration unitRefrigeration unit
Nominal power [kW]684449
Heating/cooling capacity [kW]638409299.5299.5
Energy vectorMethaneMethaneElectricityElectricity
Installation year1999199920002000
Building B
TypeNatural gas boilerNatural gas boilerRefrigeration unitRefrigeration unit
Nominal power [kW]511260
Heating/cooling capacity [kW]465236237.5237.5
Energy vectorMethaneMethaneElectricityElectricity
Installation year1999199920012001
Table 4. Outdoor air flow in offices and similar buildings (UNI 10339).
Destination of UseCrowdingOutdoor Air Flow
pers/m2qae,p
(m3/h)/pers
qae,A
(m3/h)/m2
qae,V
(m3/h)/m3
Officessingle offices0.0640
open space0.1240
meeting rooms0.6036
CED0.0826
bathrooms, services 8
Table 5. Details of new thermal systems.
Heating
Generator
Cooling
Generator
Buildings A–C
TypeAir–water heat pump
Nominal power [kW]1050980
Heating/cooling capacity [kW]1030950
Energy vectorElectricity
Installation year2024
Building B
TypeAir–water heat pump
Nominal power [kW]725710
Heating/cooling capacity [kW]710700
Energy vectorElectricity
Installation year2024
Disclaimer/Publisher’s Note: The statements, opinions and data contained in all publications are solely those of the individual author(s) and contributor(s) and not of MDPI and/or the editor(s). MDPI and/or the editor(s) disclaim responsibility for any injury to people or property resulting from any ideas, methods, instructions or products referred to in the content.

