Article

Numerical Simulation Analysis of Lead Rubber Bearings (LRBs) Damage and Superstructure Response Under Near-Fault Earthquakes †

1
School of Management, Wuhan College, Wuhan 430212, China
2
Shanghai Jiuxuan Engineering Technology Co., Ltd., Shanghai 200090, China
3
School of Mechanics and Engineering Sciences, Shanghai University, Shanghai 200444, China
*
Author to whom correspondence should be addressed.
This paper is an extended version of our paper published in 2018 ICAEER Advances in Energy and Environment Research Conference, Guilin, China, 10–12 August 2018; p. 02017.
Buildings 2025, 15(5), 839; https://doi.org/10.3390/buildings15050839
Submission received: 31 January 2025 / Revised: 24 February 2025 / Accepted: 28 February 2025 / Published: 6 March 2025
(This article belongs to the Section Building Structures)

Abstract

:
Under the action of near fault earthquakes, the LRB bearings of long-period isolated buildings are prone to significant deformation and failure under compression shear conditions. Therefore, it is necessary to analyze the damage of LRB and its impact on the superstructure. Finite element analysis methodology was selected and Abaqus was used to simulate hysteresis curve of LRB and the separation between rubber layer and steel layer when horizontal deformation reaches 400%. A simplified four-stiffness isolation bearing model is proposed and applied to seismic isolation damage analysis on 8-story seismic structure under near-fault earthquakes. Damage on different positions and numbers of bearings are also compared. It concludes that under the compressive and shearing state, when the horizontal deformation of the isolator exceeds 300%, the stiffness enhancement section appears. Moreover, it is found that the damage of all LRBs show the most significant scale-up effect on acceleration and story drift.

1. Introduction

Earthquakes are frequent natural disasters threatening engineering structural safety. Considering the focal distance of near-fault earthquakes is less than 20km, fault sliding typically leads to larger peak seismic accelerations, longer periods, and more pronounced directional pulses [1,2]. According to ASCE’s seismic damage statistics and research, compared with far-fault earthquakes, near-fault earthquakes can cause larger base shear force, more powerful local deformation, and more significant story drift, resulting in more evident destruction to engineering structures [3,4,5,6].
For example, several notable earthquakes, such as the 1994 Northridge earthquake in Los Angeles and the 2023 Kahramanmaraş, Türkiye earthquake have caused extensive damage to buildings and bridge structures, as well as significant casualties. It has been reported that traditional seismic-resistant buildings show weak capacity on near-fault earthquake resistance, so structural vibration control methodologies were proposed and researched as alternatives, and passive control for seismic isolation was focused among them [7]. For passive control, basic seismic isolation installation is the most researched and applied methodology.
Base isolated technology involves the insertion of devices with a significantly lower horizontal stiffness than that of the building structure between the foundation and the superstructure. The method could extend the structural period and prevent the upward transmission of seismic energy, thereby achieving the aim to separate the superstructure from the seismic ground motion. Numerous seismically isolated buildings and bridges have been constructed both domestically and internationally, and their exemplary performance during seismic events has been well documented [8]. The goodness of seismic isolation is determined by isolation devices, and lead rubber bearings (LRBs) were widely reported and acknowledged as the most effective ones.
An LRB is a circular composite element, fabricated through high-temperature vulcanization, which integrates layers of rubber and steel plates with a lead core embedded at its center. This design endows the LRB with a substantial vertical load-bearing capacity while maintaining a relatively low horizontal stiffness. It is typically used to support the weight of the structure, establish a connection between foundations and superstructure, and cut off seismic horizontal motion energy transmission in an upward direction. For LRBs, mechanical properties have the most significant effect on seismic isolation performance. Amounts of theoretical and experimental investigations have been reported on the fundamental mechanical properties of LRBs, yielding a wealth of valuable insights [9,10]. Tsai and Malhotra [11,12] first made a correlation analysis on the collision of base isolated structures in 1997. They simplified the superstructure of a building as an elastic shear deformation rod and modeled the foundation pit using a spring-damper unit, thereby investigating the influence of multiple factors on the seismic response of the structure. In 2005, Yang Dixiong made a numerical analysis of two reinforced concrete frame structures, including six-story and eight-story [13]. Three sets of near-fault seismic waves were compared and they found when the displacement of the isolation layer exceeds the permissible range, it results in bearing damage in potentials. They concluded that effective protective measures are necessary to mitigate such risks. In 2018, Xie Yunfei and Liu Yang established an analytical model for seismic isolation structures to analyze structural damage [14] to investigate the damage performance and damage control mechanisms of such structures under near-fault earthquakes. They used the elasto-plastic time-history method to analyze the effectiveness of structural damage control. Yu Jiao [15] made a finite element analysis of a five-story seismic isolation structure via using near-fault pulse-type seismic motion as input and proposed a damage intensity index and a structural response control method. In 2021, Chen Junjie constructed a six-story frame model [16], which verified the significant efficacy of LRBs in reducing structural damage under the influence of near-fault earthquakes.
While basic isolation structures have thus far demonstrated resilience against damage during seismic events, their long-period characteristics make it possible for deformation when subjected to near-fault earthquakes. This vulnerability can lead to the structural base plate and supports exceeding their reserved clearance distances, and damage to the supports under intense near-fault seismic excitations may precipitate progressive collapse or overturning of the superstructure, with potentially catastrophic consequences design [17,18]. For example, although several hospitals with isolation design could stay in normal conditions in the Turkey earthquake in 2023, existing simulation studies show that the deformation and acceleration response of isolated structures under the action of this earthquake is far greater than that of normal earthquakes, and a large part of them will be severely damaged or even collapsed [19]. Given these considerations, it is essential to conduct research on the damage mechanisms of isolation bearings and the seismic response characteristics of the superstructure. Numerical simulation is a widely used and a helpful tool to reveal these mechanisms.
However, such reported works focus on the damage of the superstructure, and the numerical simulation of seismic isolation bearings is not so deeply researched and reported, and mainly focuses on the 4-6-story isolated structure. To fill the gap, this article concentrates on damage of a single seismic isolation bearing as the starting point, aiming to analyze the interlayer stiffness degradation phenomenon of the isolation bearings and the isolation layer following one or multiple isolation bearings, and further explore its influence on the response of the isolation layer and the superstructure. This article is described as the following. The second part proposes the materials and methods, mainly on finite element analysis. The third part discusses the simulation results, and the last part proposes the conclusions.

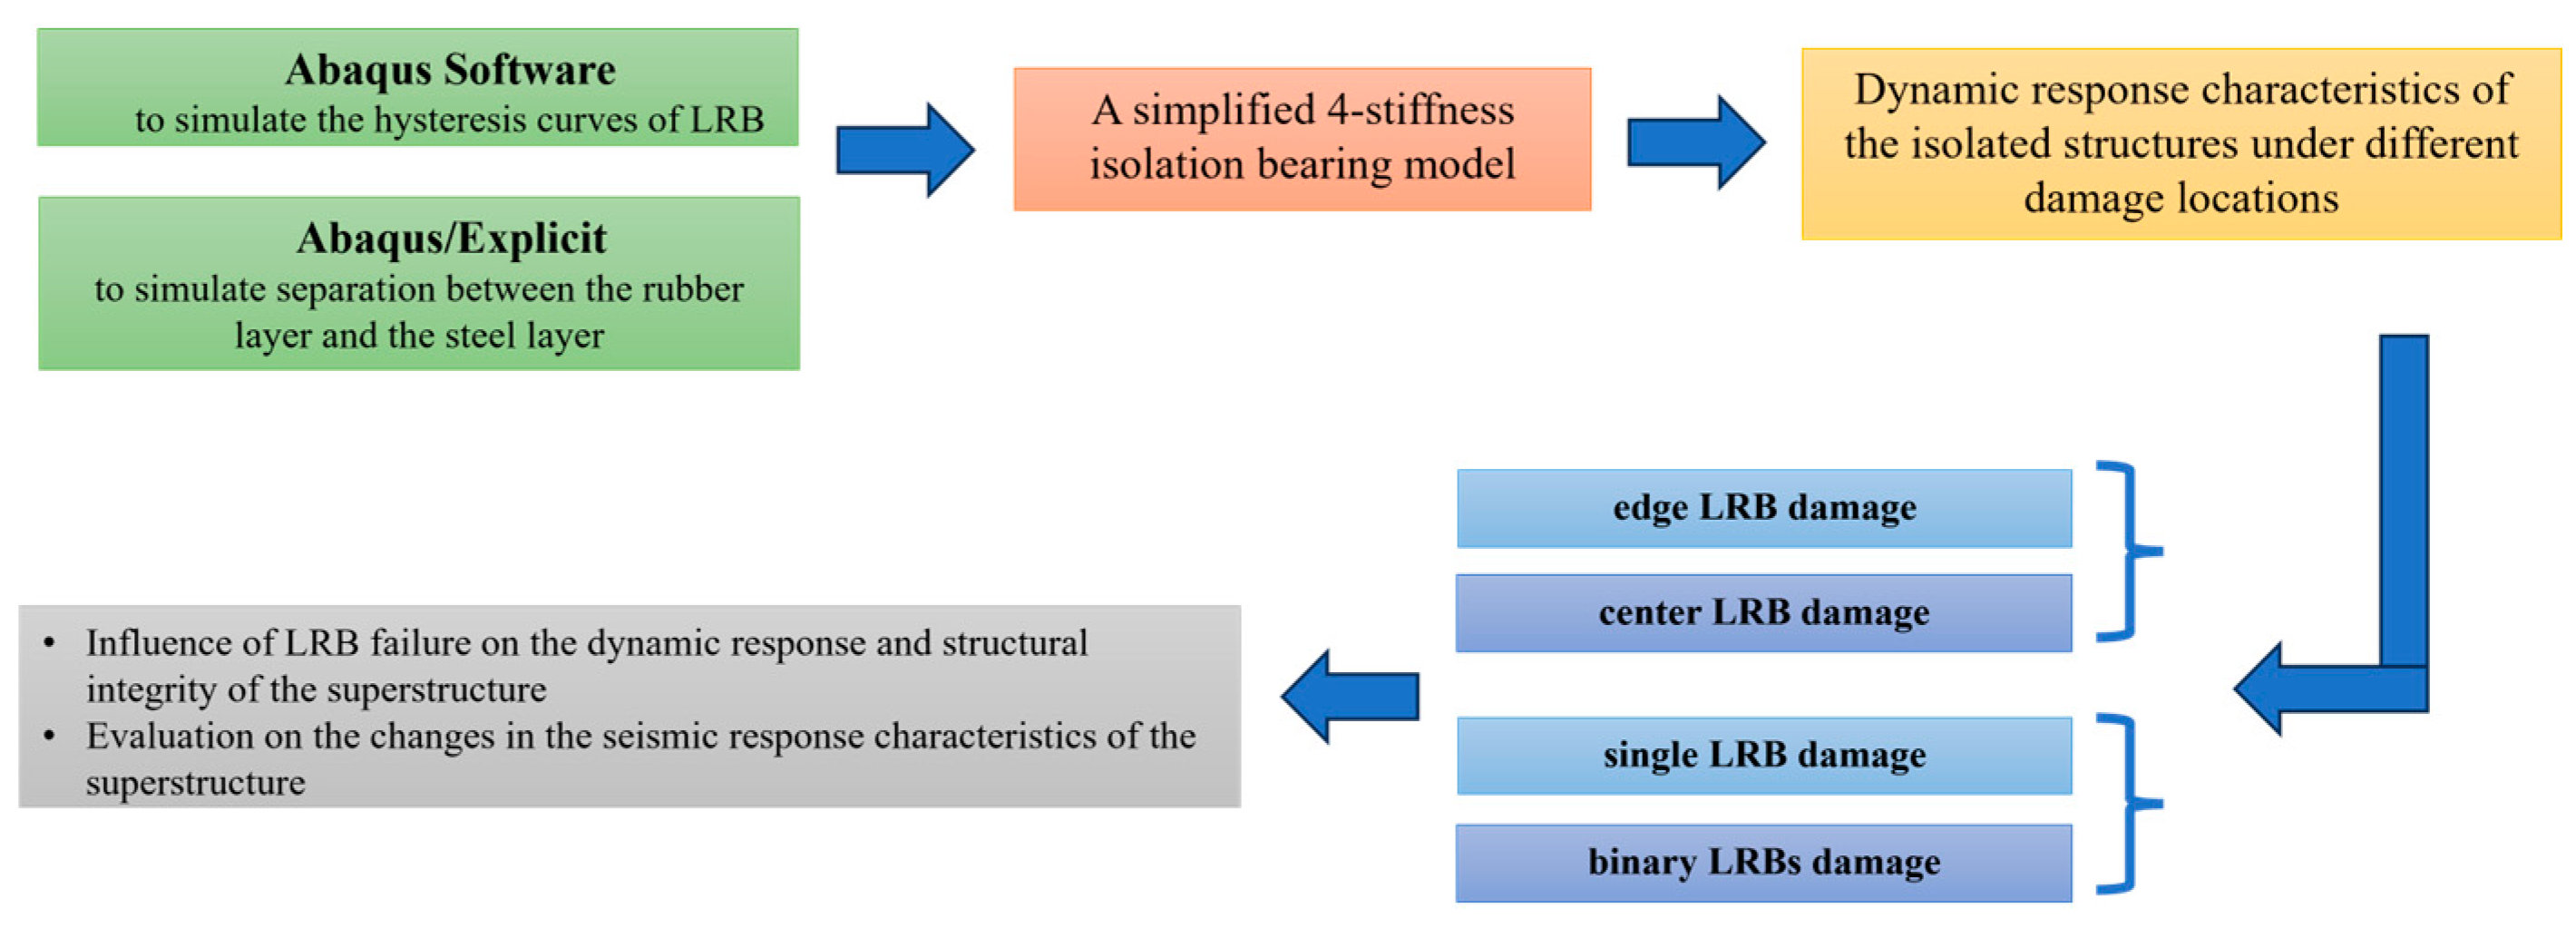
2. Materials and Methods: Finite Element Analysis Methodology for LRB Damage

To simulate LRB damage, finite element analysis was selected as the simulation method. Abaqus is a widely used software to make finite element analysis and was also selected in this study (Abaqus 6.11, CPU Xeon E5). By leveraging the advanced capabilities of Abaqus, researchers can gain deep insights into the mechanical behavior of LRBs under various loading conditions, contributing to the development of more robust seismic isolation systems.
Given the superior vertical stiffness of LRBs, which exhibit excellent compressive performance and can withstand vertical loads significantly exceeding the design stress, reaching up to 10 MPa or higher, the likelihood of compression limit failure is minimal in practical applications. So, among three types of damage: buckling damage under compressive stress, tensile damage under tensile stress, and horizontal deformation of the isolation bearing, this study focused on the last one. Considering the lead rubber seismic isolation bearings under compressive shear conditions, Abaqus/Standard is employed to simulate their horizontal mechanical behavior, and appropriate rubber material parameters are calibrated to accommodate large deformation scenarios.
In this study, the finite element analysis of LRBs under compression shear state as well as LRB failure was conducted in the first sequence. Through the two parts prior to simulation, the base seismic isolation shear deformation degree could be definite. Based on the definition, different positions of bearings were simulated and compared to show the effect on LRB damage. The pathway of finite element analysis in this work is illustrated in Figure 1.

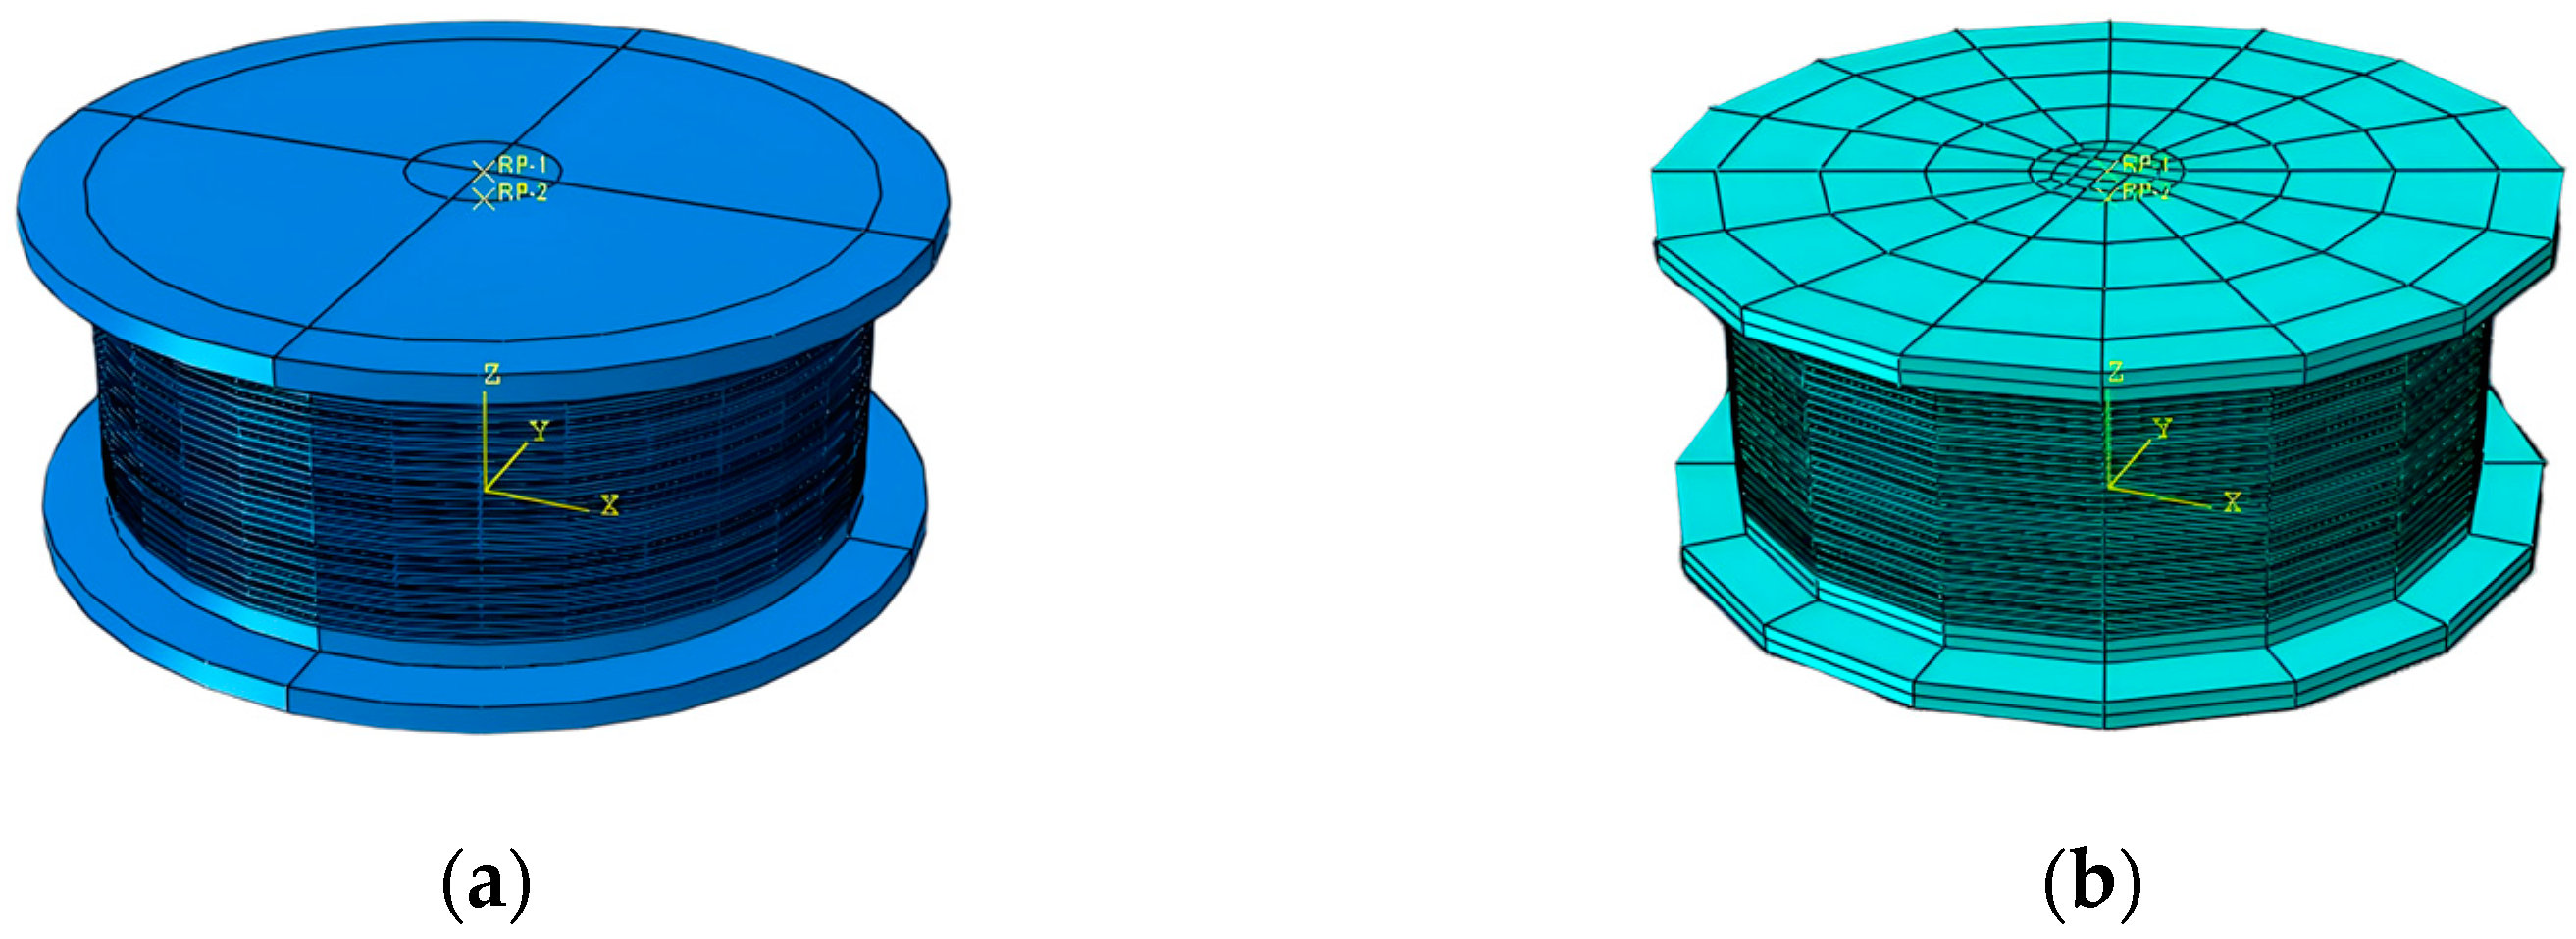
2.1. Finite Element Model Parameters

To investigate the performance of LRBs under compressive shear conditions, a finite element model of the LRB was established using Abaqus, and the simulation used the displacement loading method. In this study, the analysis focused on a 600 mm LRB (hereinafter referred to as LRB600), which has a shear modulus G of 0.39 MPa. The geometric design and parameters of the rubber bearing are detailed in Table 1.

2.1.1. Unit Definition

In accordance with the internal structure of the seismic isolation bearing, the eight-node three-dimensional linear solid element (C3D8) is employed to discretize the upper and lower connection plates, closure plates, steel plates, and lead cores. Given that rubber exhibits typical nonlinear material behavior with super-elastic characteristics, such as incompressibility, the hybrid C3D8 (C3D8H) is utilized in this study to accurately define the rubber layer.

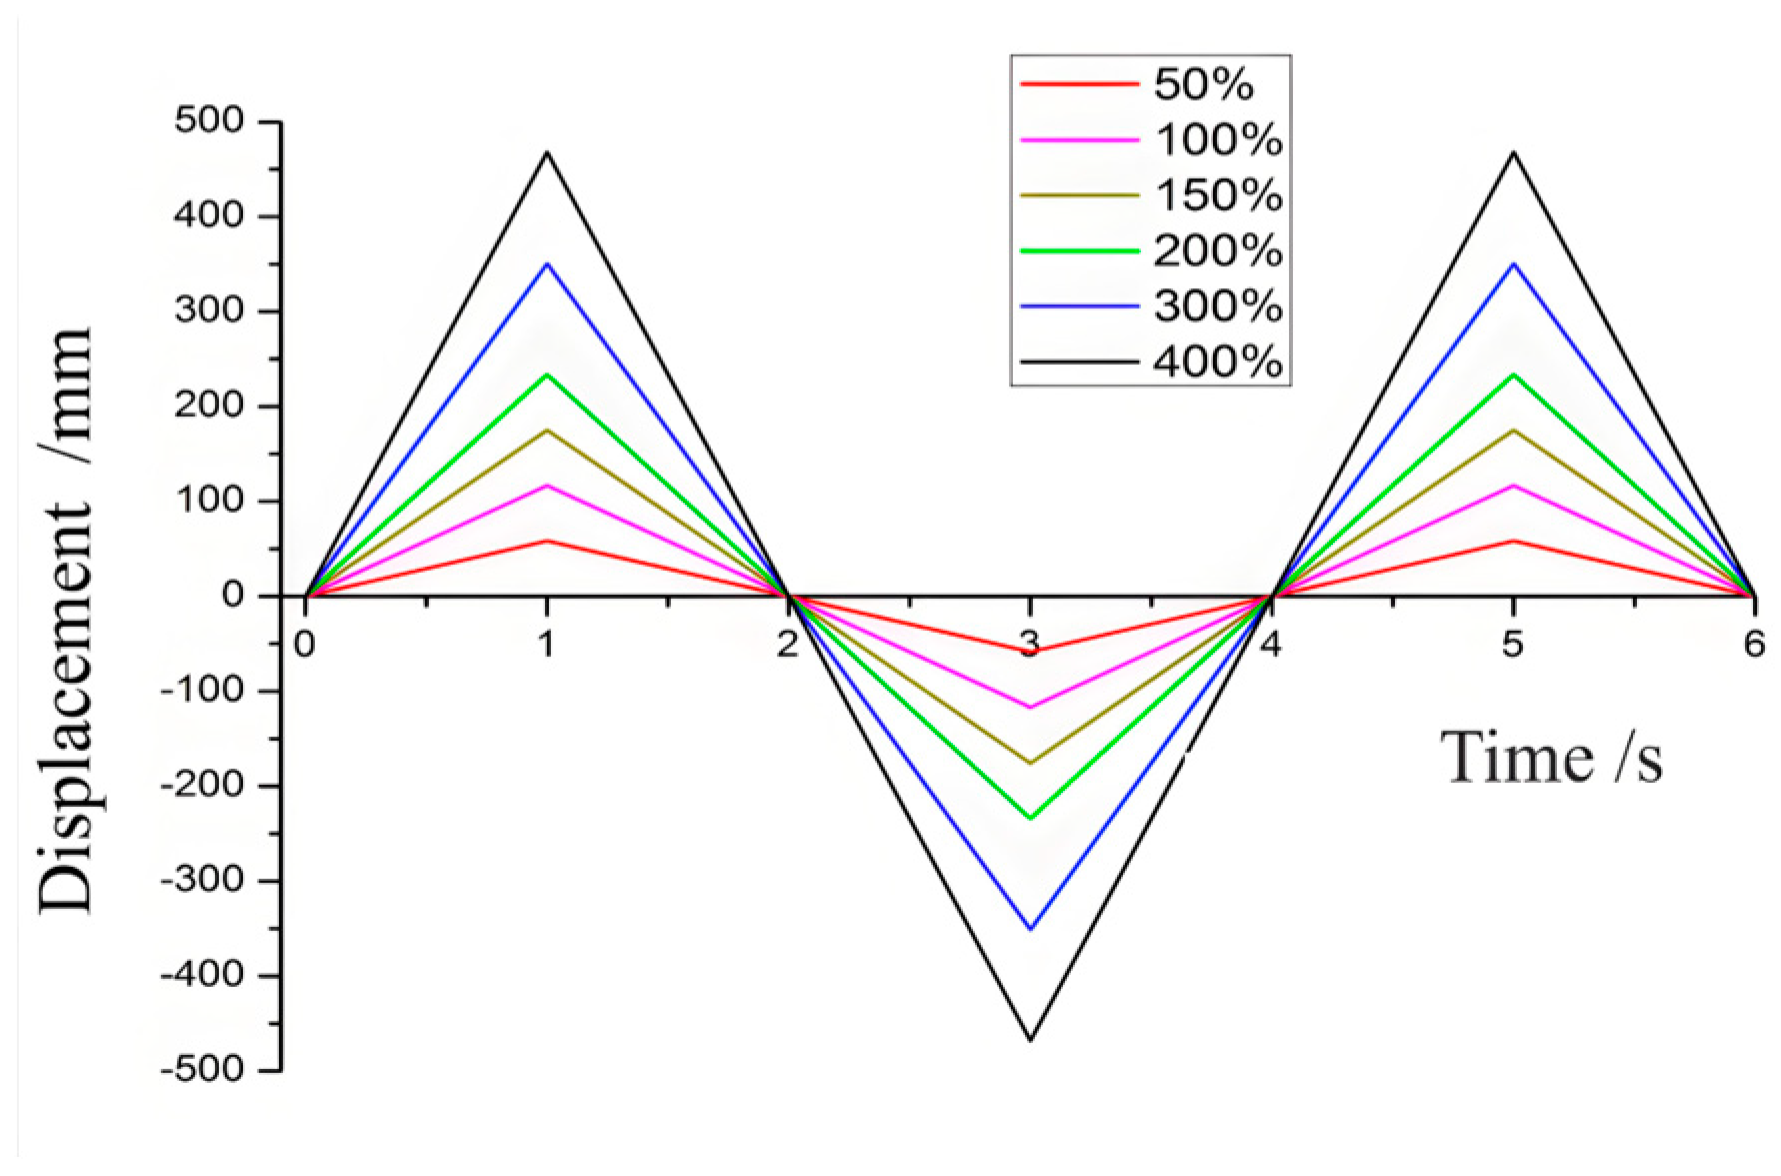
2.1.2. Calculation Equation of Compressive Shear State

When an LRB is subjected to a compressive shear state, the shear force increases with horizontal deformation while the horizontal stiffness remains stable until a certain deformation threshold is reached. Beyond this threshold, the horizontal stiffness gradually increases. This trend is attributed to the hardening behavior of the rubber material. Additionally, when the horizontal deformation reaches approximately 220 mm, a significant increase in stiffness is observed. At a horizontal deformation of δbr, the rubber layer is likely to rupture. At this deformation level, the bond strength between the steel sheet layer and the rubber layer is insufficient to withstand the destructive horizontal deformation, leading to detachment. The ultimate shear deformation δbr can be expressed using Equation (1).
δ m a x = D ( 1 σ σ c r )
In the formula, D represents the diameter of the rubber element in the LRB, which significantly influences the specification of the stable deformation capacity of the LRB [20].
The finite element model of the lead-seismic bearing is presented in Figure 2. A mesh sensitivity analysis revealed negligible accuracy variations across grid sizes of this model, so a medium mesh was adopted to balance computational efficiency and accuracy.

2.2. Material Selection and Parameters

In this study, three types of materials including rubber, steel plate, and lead are simulated and compared. Material parameters are listed as the following.
The stress–strain behavior of typical rubber materials is highly nonlinear and exhibits significant elasticity, rendering rubber a super-elastic material with virtually negligible compressibility. In Abaqus, the mechanical behavior of hyperelastic materials is not characterized by conventional parameters such as Young’s modulus and Poisson’s ratio. Instead, the stress–strain relationship is described through strain potential energy functions. Various models are available for this purpose, including the Ogden model, Arruda–Boyce model, Van der Waals model, Marlow model, polynomial model, and simplified models such as the Mooney–Rivlin (MR) model, Neo-Hookean model, Yeoh model, and reduced polynomial model.
In the simulation of seismic isolation bearings, the Mooney–Rivlin (MR) model is commonly employed to characterize the mechanical properties of rubber materials [21,22,23]. However, extensive validation and debugging have revealed that the MR model alone is insufficient to capture the stiffness hardening phenomenon observed in rubber under large deformations. Therefore, it is necessary to employ additional models to accurately simulate the damage state of isolation bearings. Based on the findings from reference [24] and the results of our debugging, a third-order polynomial model is selected for the simulation in this study. The polynomial form of the strain energy function is expressed as shown in Equation (2).
U = i + j = 1 N C i j ( I 1 ¯ 3 ) i ( I 2 ¯ 3 ) j + i = 1 N 1 D i ( J e l 1 ) 2 i
In the polynomial strain energy function, U represents the strain potential energy, Jel denotes the elastic volume ratio, and λ is the distortion measure in the material. The parameters N, Cij, and Di are material constants. Specifically, Cij characterizes the shear properties of the material, while Di describes the volumetric compressibility. In this study, rubber is modeled as a completely incompressible material; hence, all Di values are set to zero. The parameters used in the three-order model are shown in Table 2. The material parameters of steel plate and lead are summarized in Table 3, and stress–strain curves of the three materials are shown in Figure 3.

2.3. Contact and Constraint Settings

In this study, the Abaqus/Standard element is employed to analyze the mechanical properties of LRBs. In the compression shear state, the rubber of the LRB is tightly connected to the steel plate and generally does not detach due to material failure, so we use tie elements to simulate the contact surface between the steel plate and rubber. In order to approach the actual working state of the LRB, its bottom is fixed, and the loading plate at the top of the bearing is defined as a rigid body, allowing only one degree of freedom in the horizontal direction.

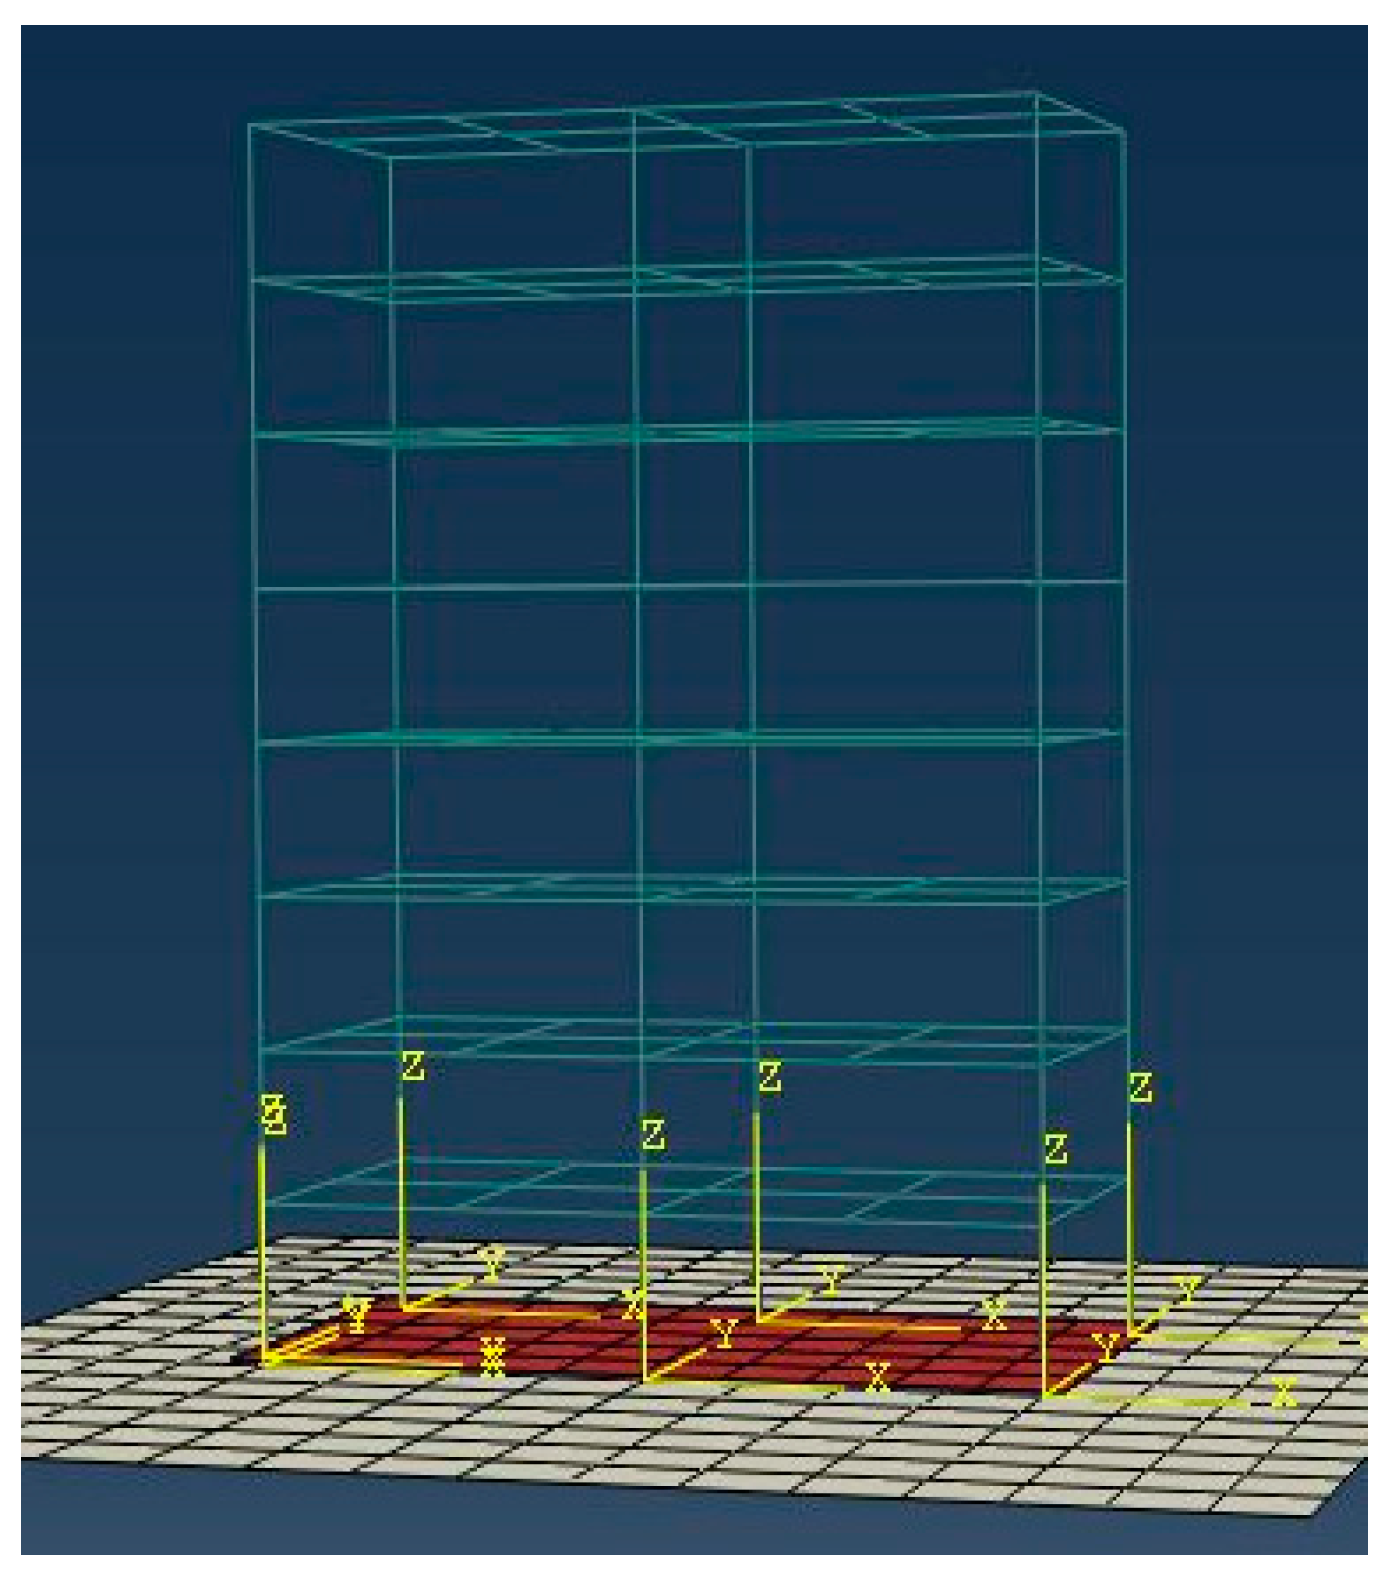
2.4. General Engineering Design

To examine the influence of damage to isolation bearings on the superstructure, a fundamental isolation frame structure model was developed using Abaqus. The design of basic seismic acceleration is specified as 0.3g, and the site category is classified as Class II.
The building has eight stories, each with a height of 3 m, resulting in a total height of 24 m, with a rectangular plan measuring 16 m in length and 8 m in width. The seismic fortification intensity is set at 8 degrees.
The beams and columns use the Elastic B31 space beam element to simulate, and the model of the superstructure is shown in Figure 4, and the main section size, concrete strength grade and material parameters are summarized in Table 4. The beams and columns use the B31 space beam element to simulate.
The structure incorporates seismic isolation design. Based on the design standards (GB/T 51408-2021) [25] for seismic isolation buildings, the surface pressures of all LRBs should be controlled within 10 MPa limitations. Six circular GZY400 isolation bearings (LRB400) were selected for the structural design [26], as illustrated in Figure 5. The fundamental mechanical properties of these bearings are summarized in Table 5. The LRB’s horizontal stiffness is provided in Table 6, and it is defined that when the horizontal displacement exceeds 350% achieving 0.28m, failure occurs and no longer provides stiffness. The data settings are related to the results of the previous study and will be detailed in the Results section.
The entire structural layout is depicted in Figure 6, where the green portion represents the superstructure, the red portion denotes the isolation upper plate, and the gray portion indicates the ground. After seismic isolation design, the natural vibration period of the building has been extended from 0.466s to 1.759 s, which can effectively reduce seismic response.

3. Results

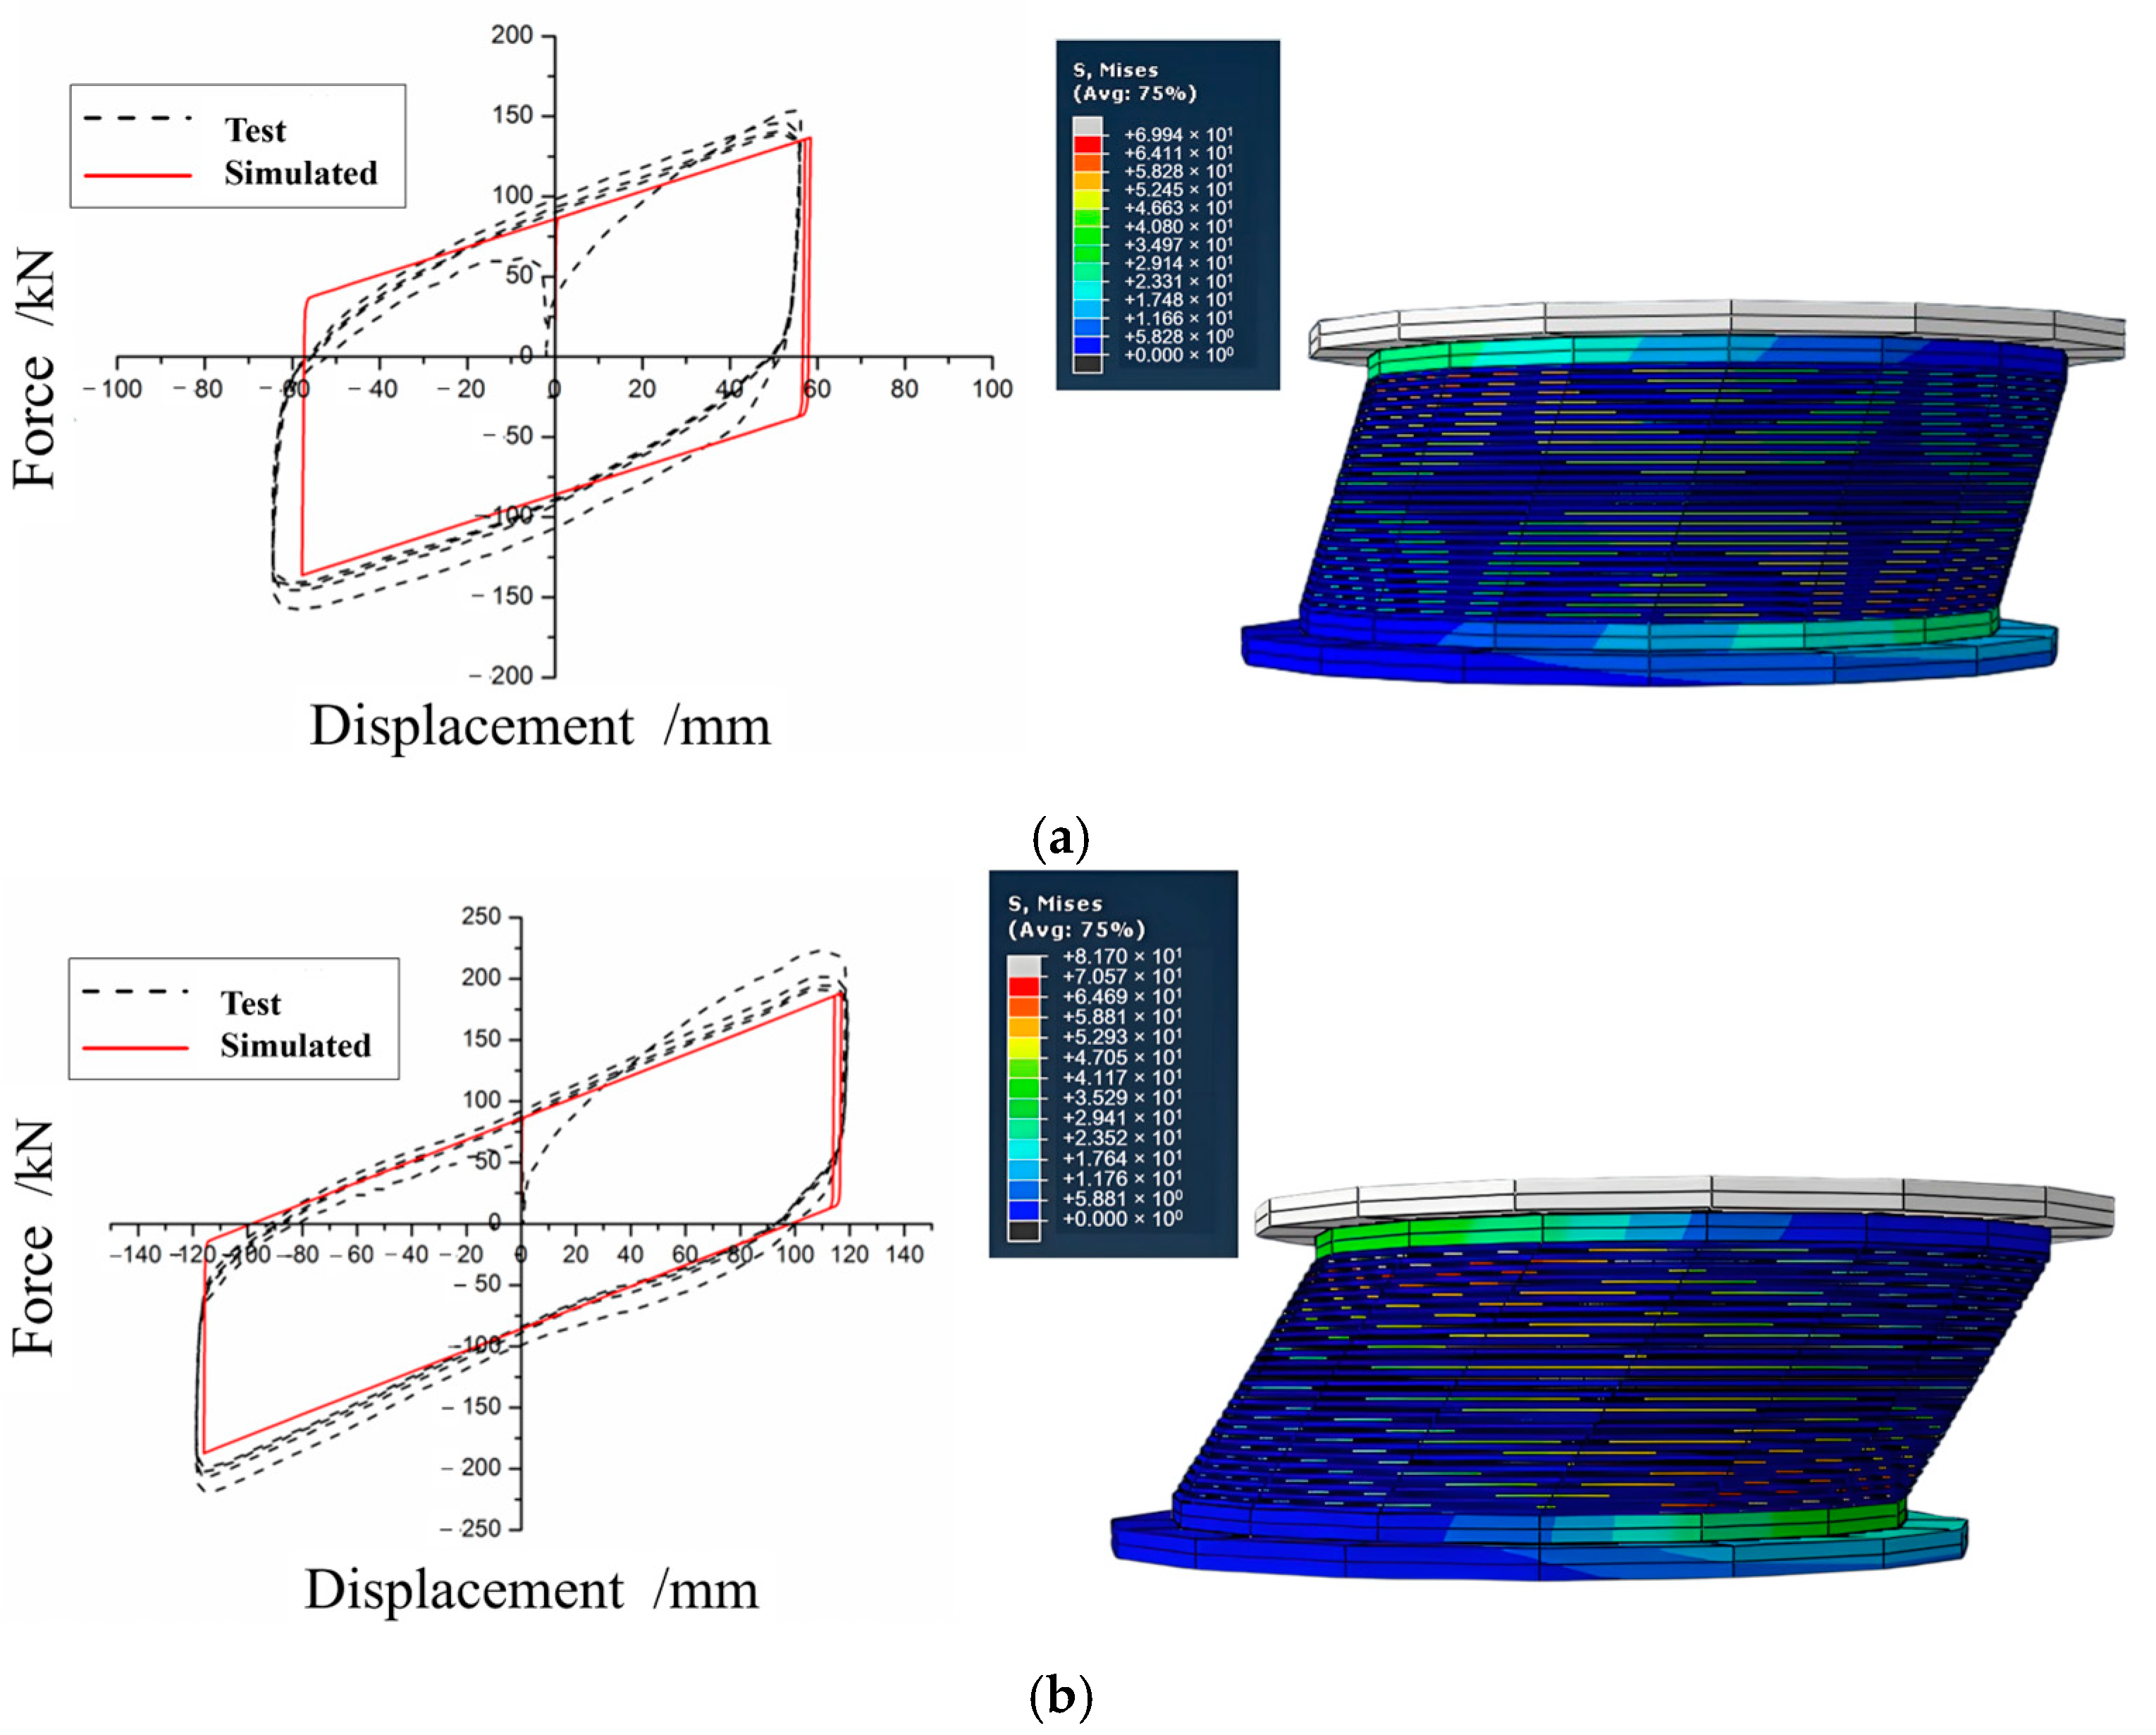
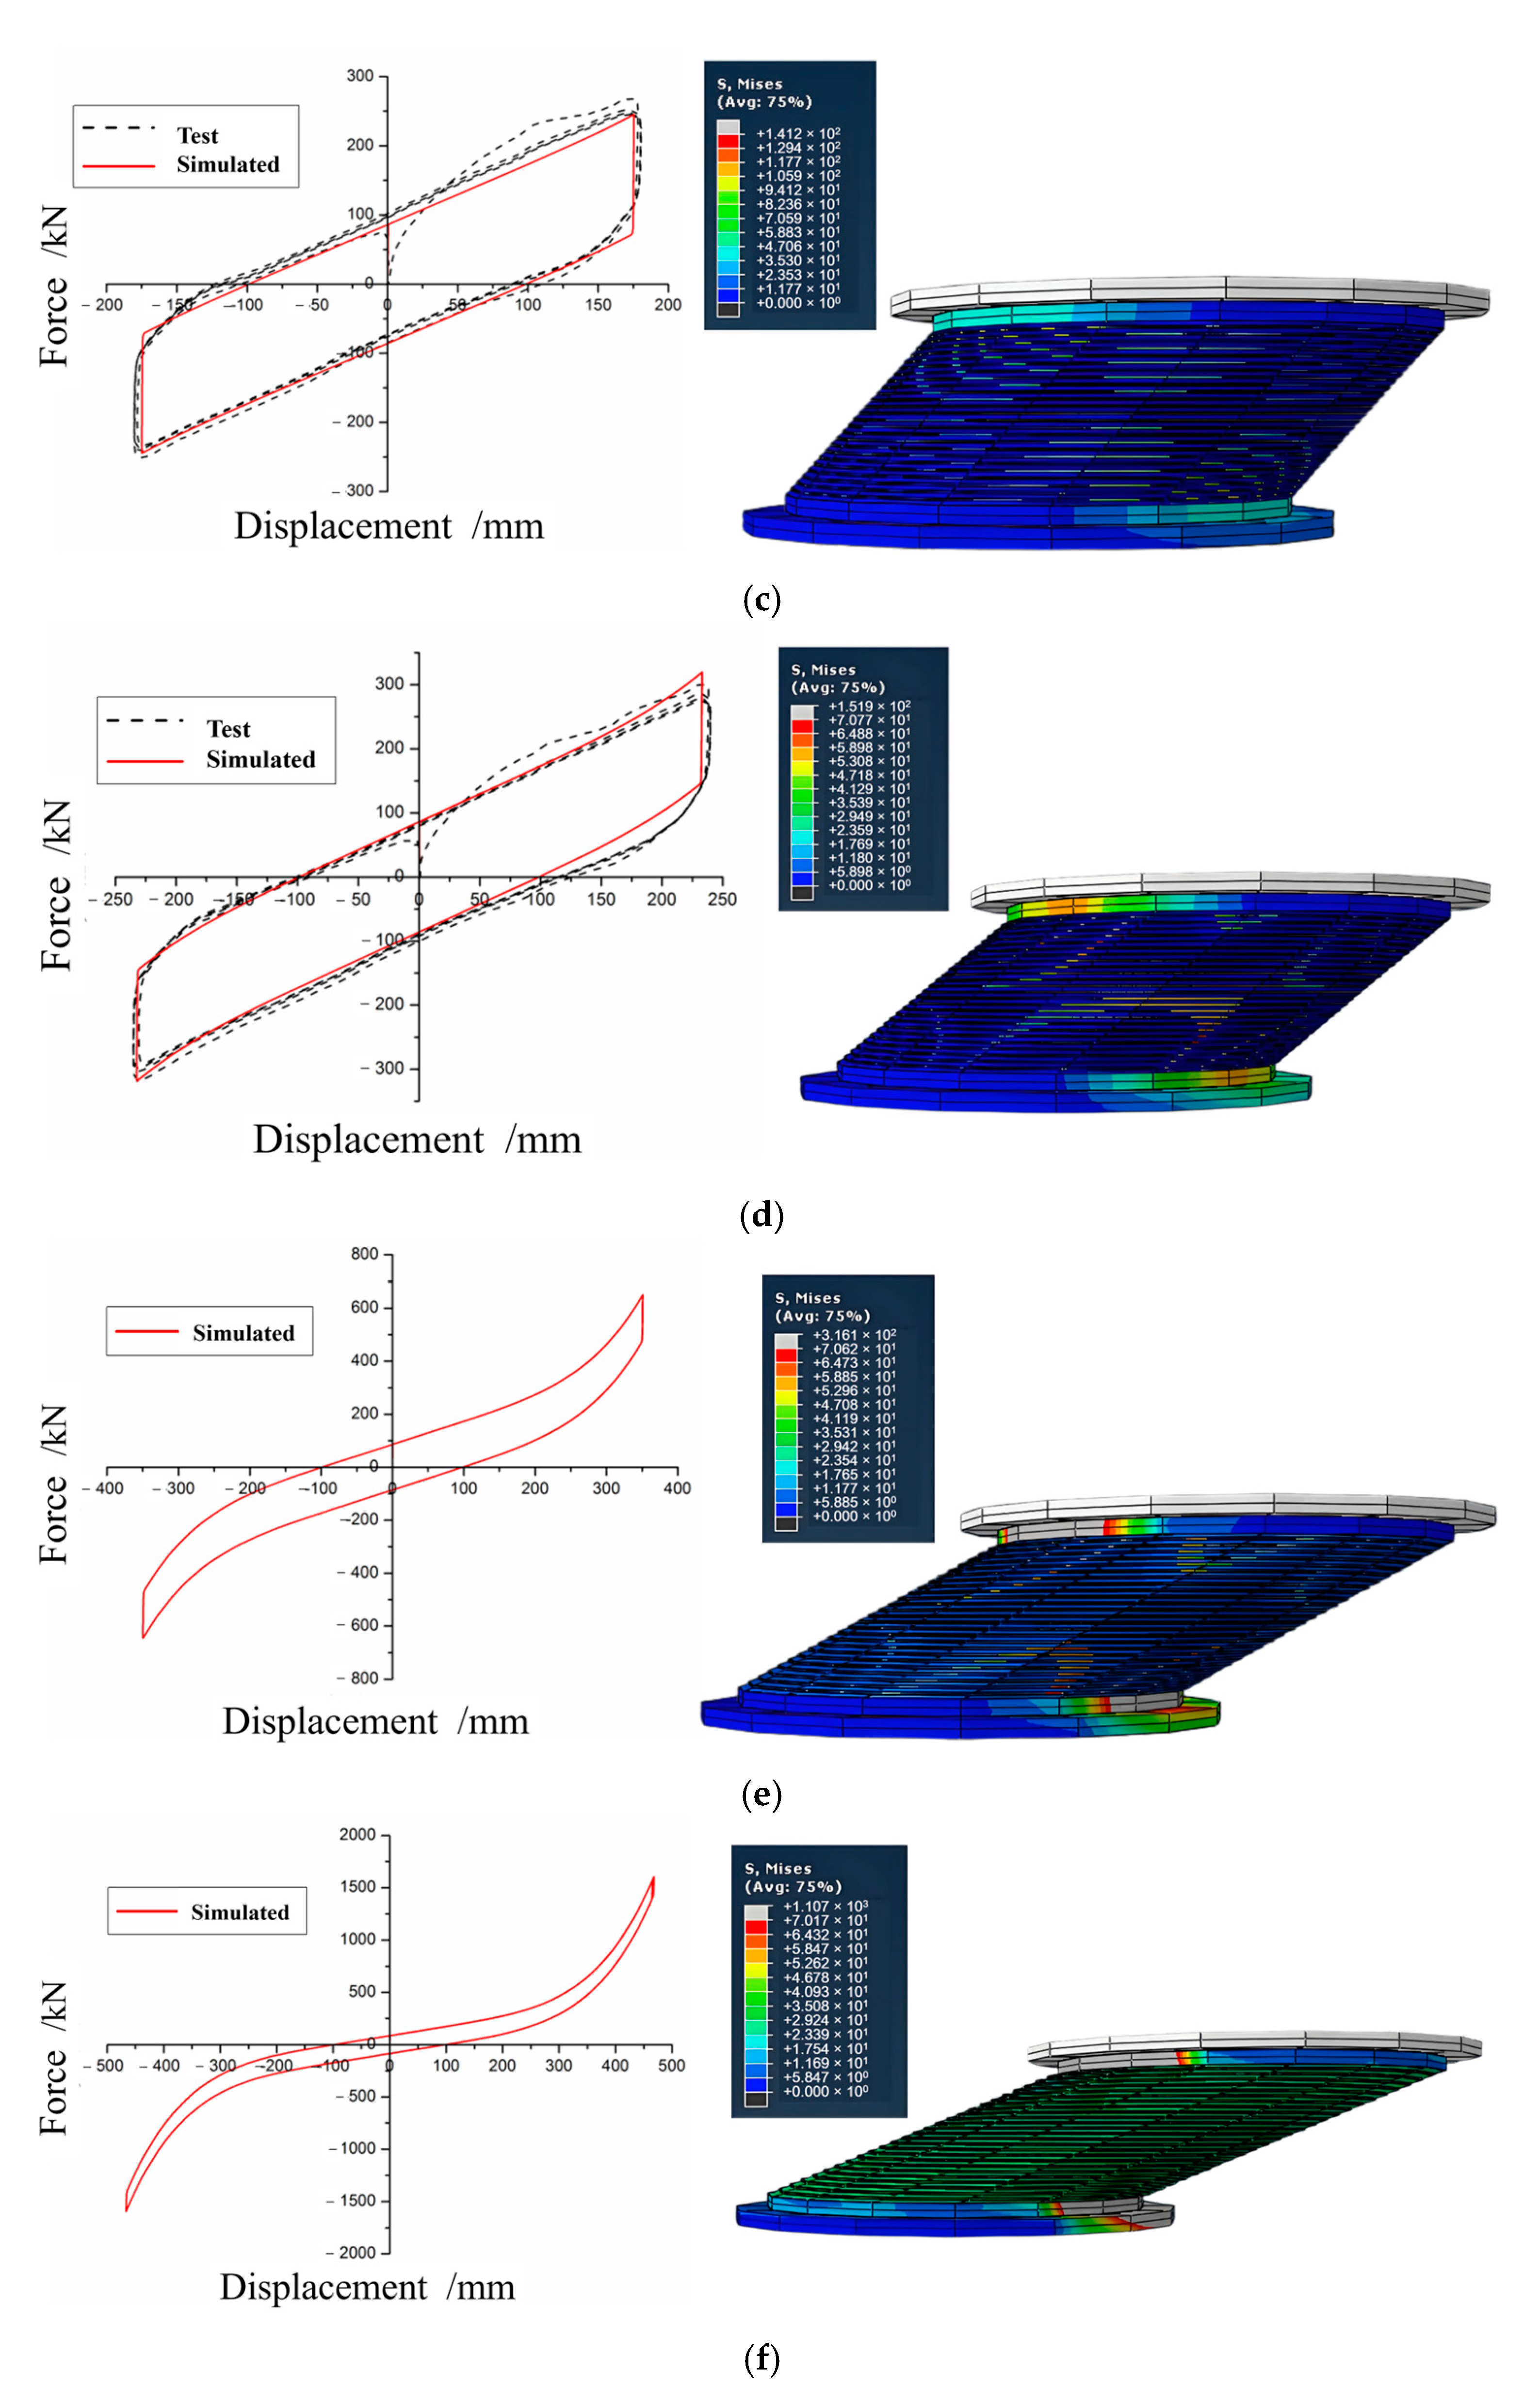
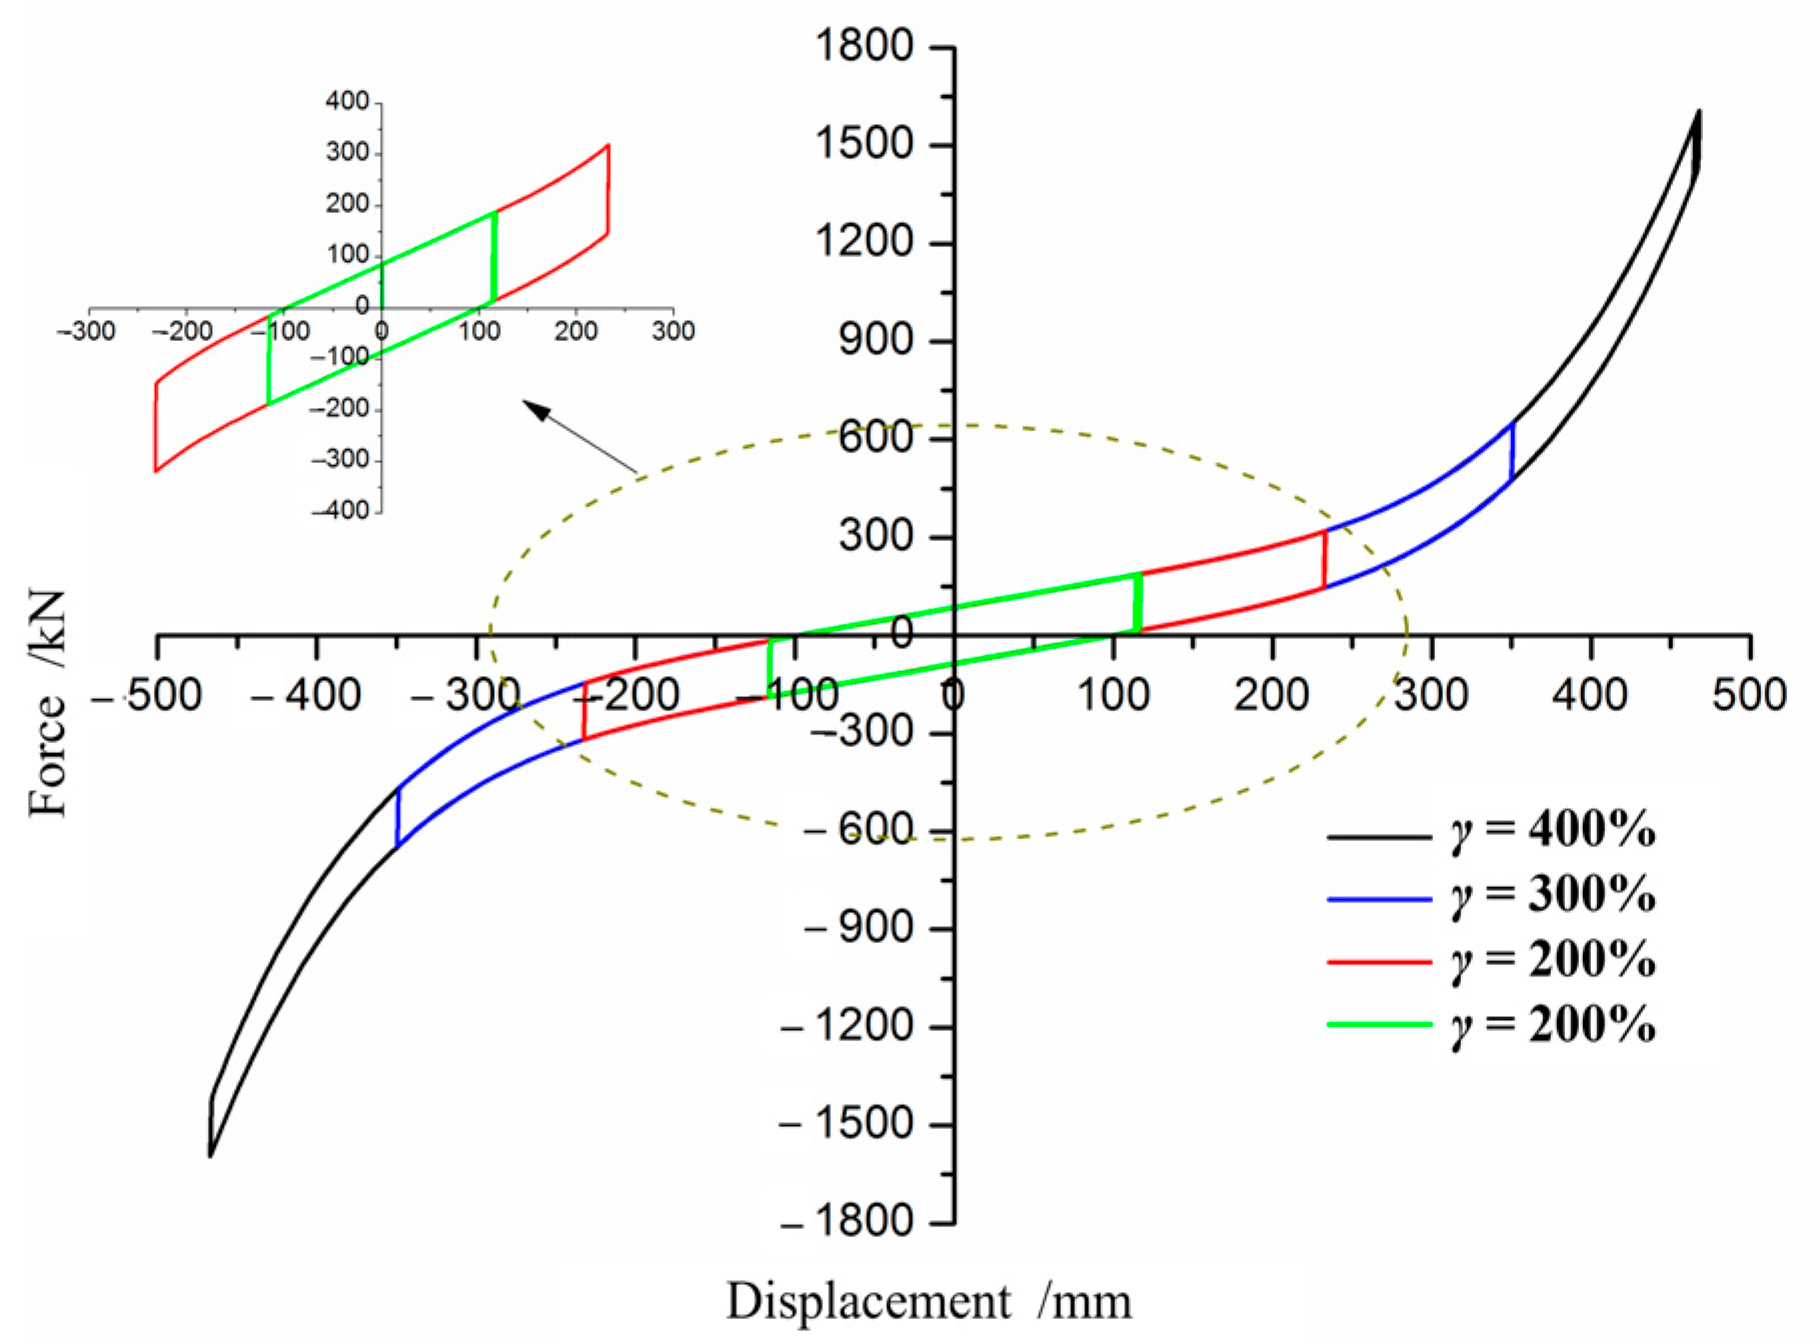
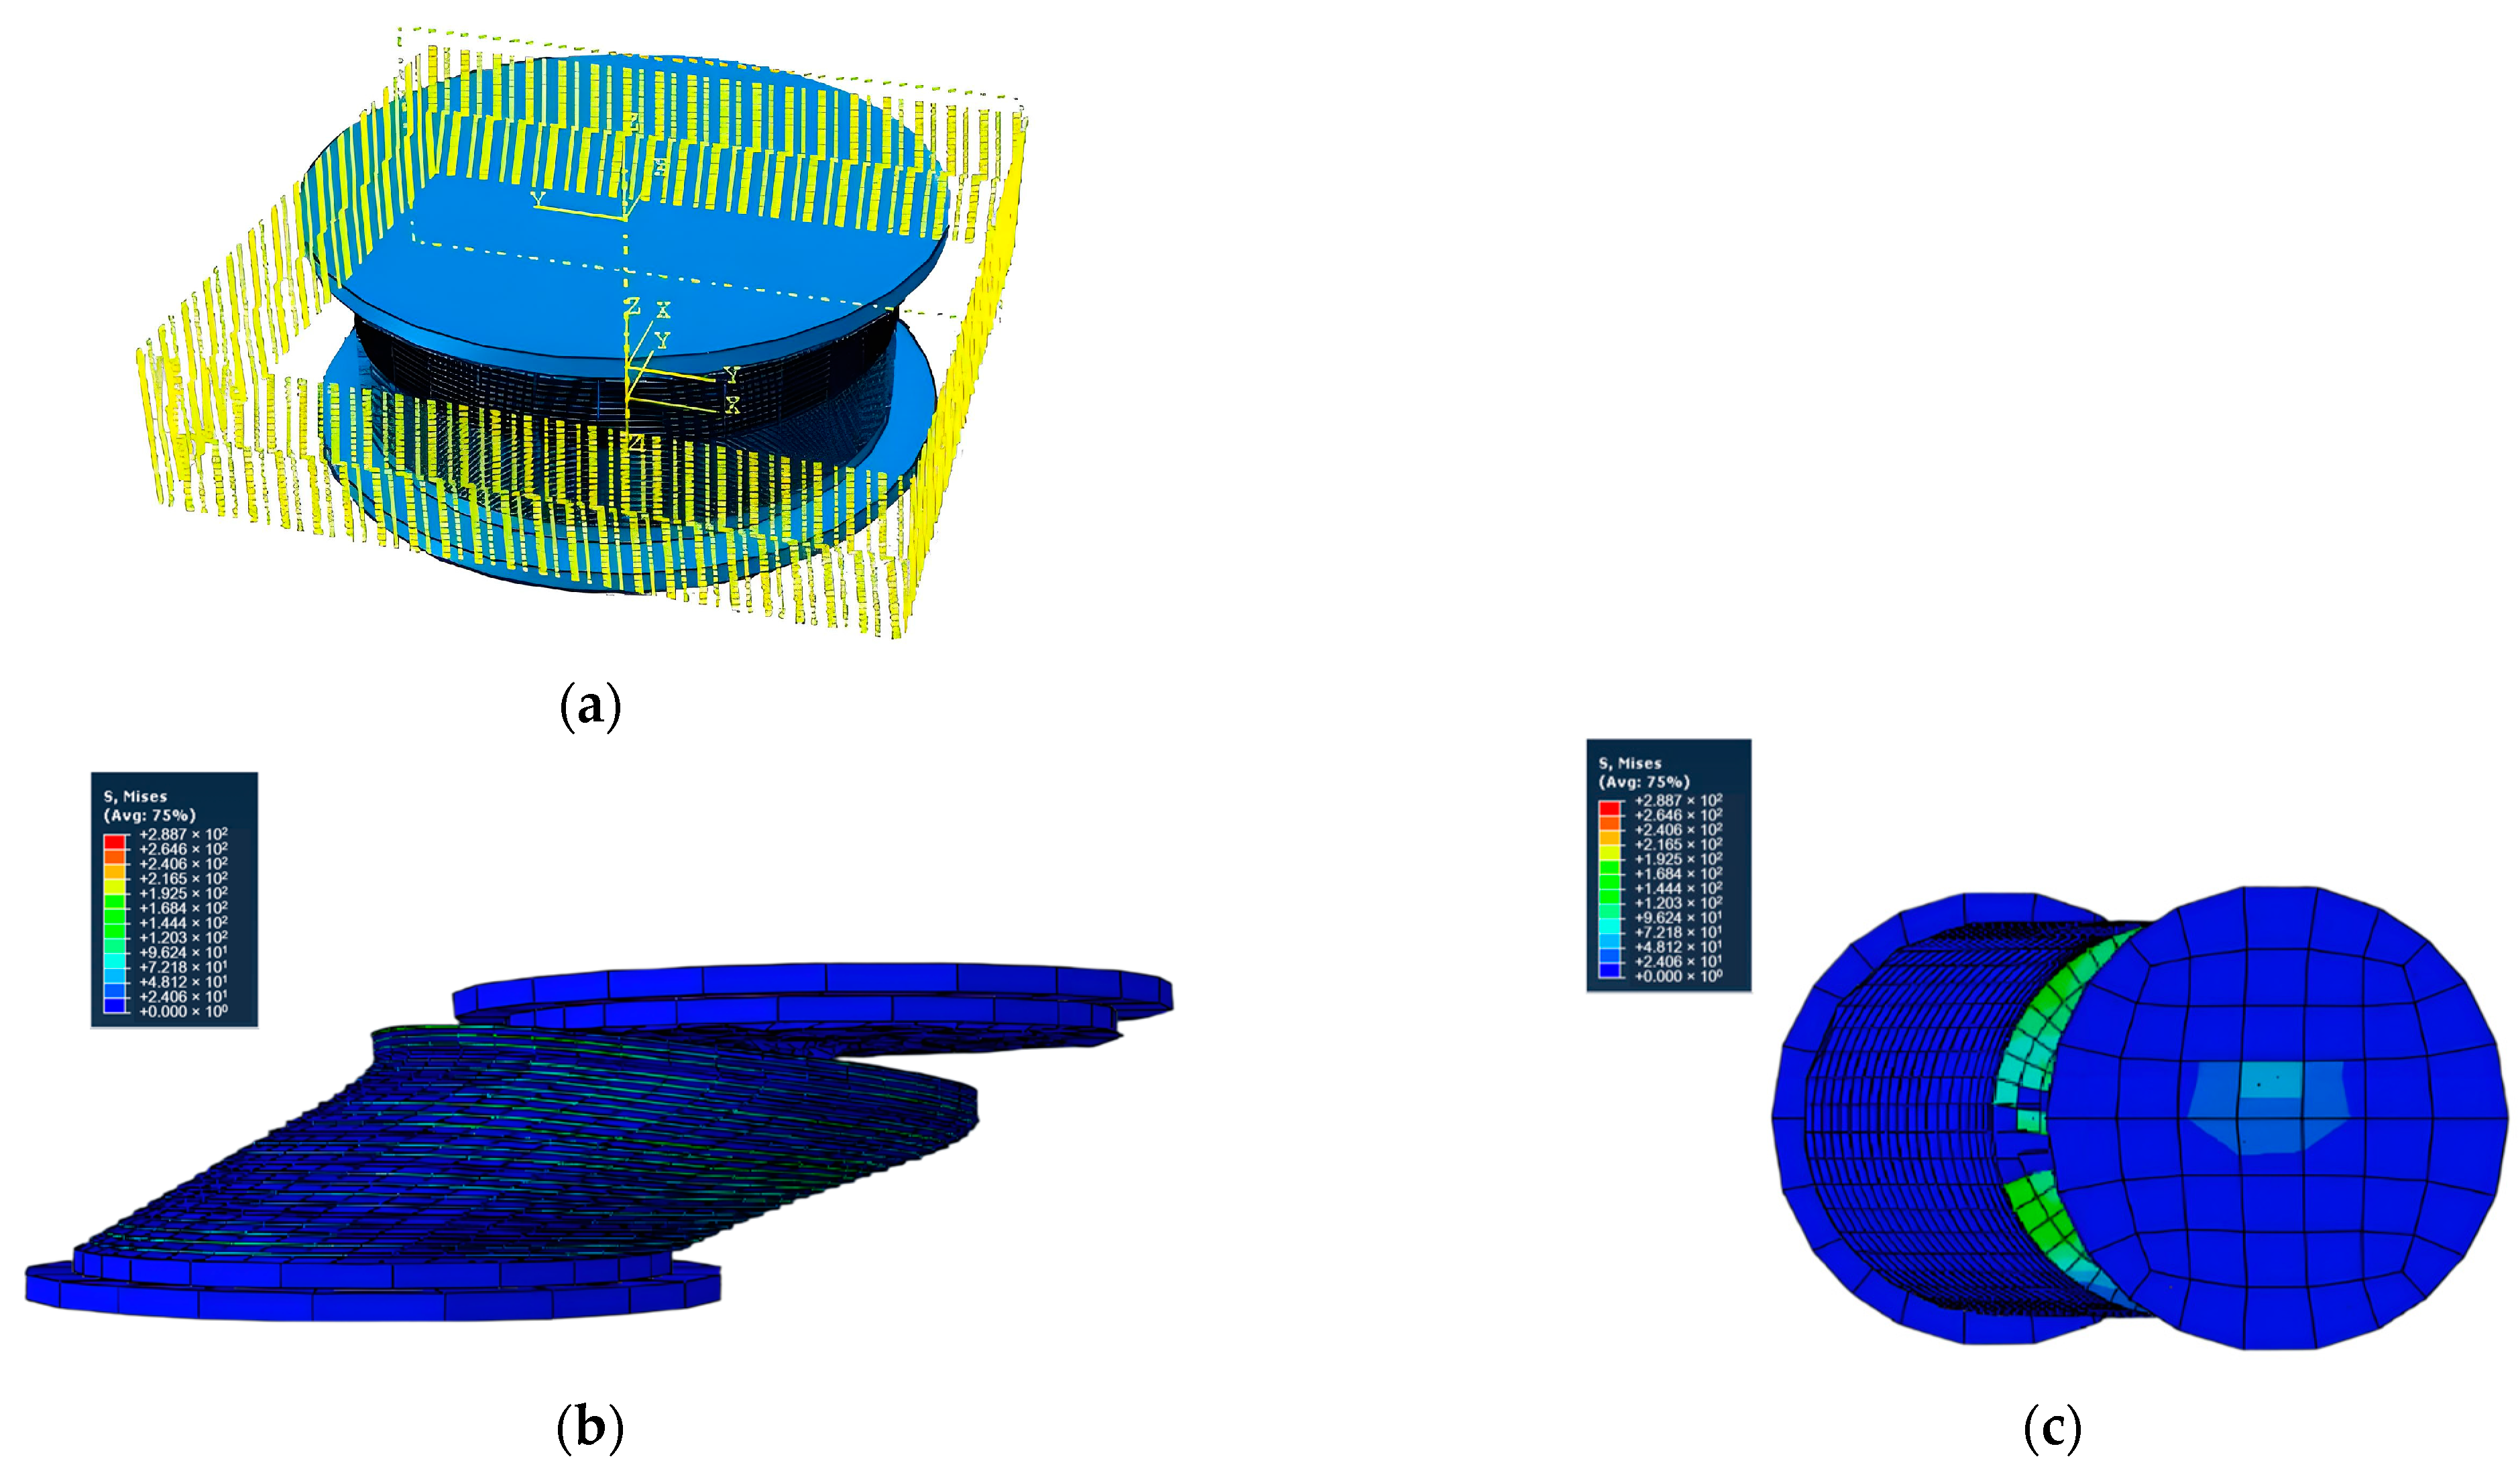
3.1. Finite Element Analysis Results of LRBs Under Compression Shear State

The displacement-controlled loading method is utilized to simulate the behavior of the isolation bearing under combined compressive and shear loading conditions. A vertical compressive stress of 12 MPa is applied, while horizontal shear strains of 50%, 100%, 150%, 200%, 300%, and 400% are imposed incrementally. The prescribed loading sequence is illustrated in Figure 7.
In Figure 8, the hysteretic curves and Abaqus simulation results for rubber isolation bearings under various deformation conditions are presented. The test data of Figure 8 refers to the Recommendation for the Design of Base Isolated Buildings, publicly reported in 2006 [27]. The data from the simulation and test are consistent.

3.2. Numerical Simulation of LRB Damage

Figure 9 provides a comprehensive summary of the hysteretic curves of the isolation bearings under various operating conditions depicted in Figure 8. The analysis reveals that under large deformation conditions, the isolation bearings exhibit pronounced stiffness hardening characteristics.
In addition, to simulate seismic isolation damage conditions under a compressive shear state, based on the findings from references [28,29], the four-stage constitutive relationship of an LRB in the horizontal direction can be established, as shown in Figure 10. A, B, C, and D, respectively, represent the elastic stage, yield stage, first strengthening stage, and second strengthening stage of the four-stage constitutive relationship of rubber-bearing damage. The stiffnesses of the four stages are recorded as K1, K2, K3, and K4, respectively, which can be used to simulate the damage of the LRB under compression shear state.
When the LBR exceeds 350%, achieving 0.28 m, it is found that the LBR is on damage condition. The detailed analysis model incorporating cohesive elements and material failure criteria is illustrated in Figure 11a. The final simulation results, depicting the failure modes and invalidation of the isolation bearing, are presented in Figure 11b,c.
Figure 12 presents a comparative analysis between the results obtained using Abaqus/Standard (which does not account for damage) and Abaqus/Explicit (which incorporates damage considerations).

3.3. Analysis of the Impact of Damage to LRBs on the Superstructure

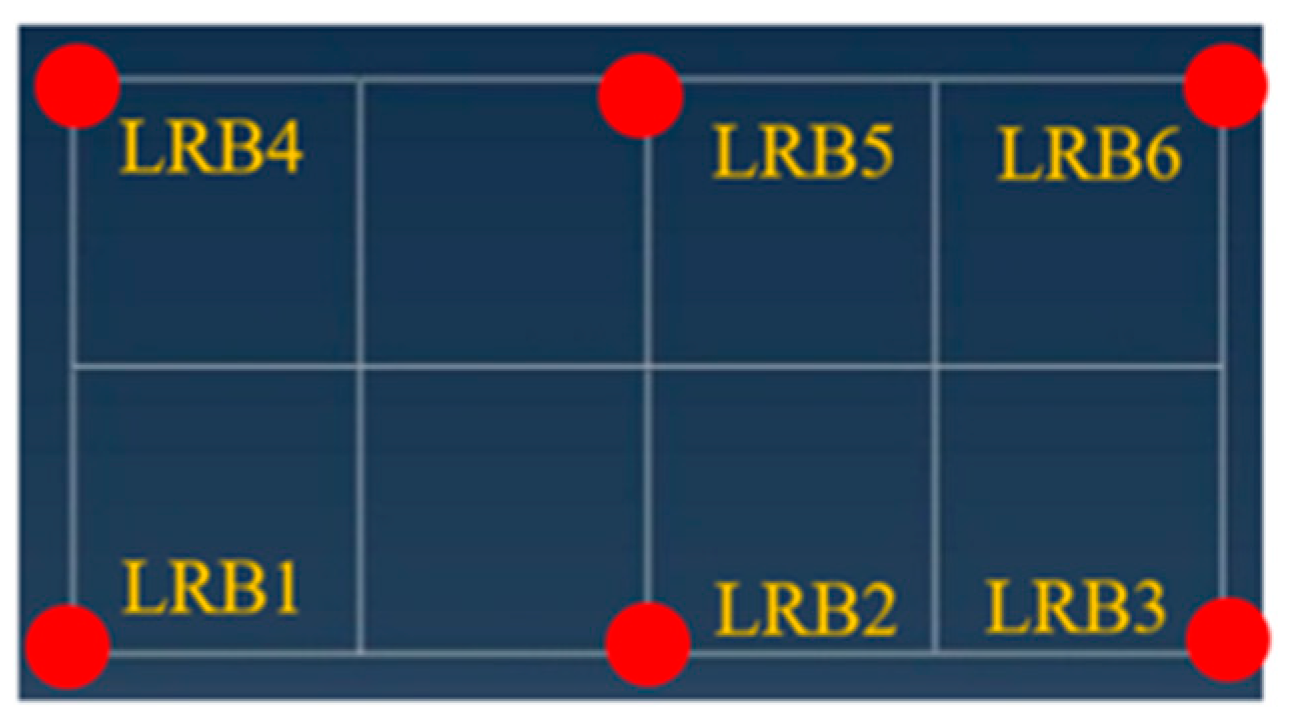
3.3.1. Working Condition

In the numerical simulation analysis, the El Centro wave was employed as the input ground motion. Characterized by a significant response in the mid-frequency band and a predominant period of 0.56 s, the El Centro wave is particularly suitable for Class II sites. Six distinct working conditions were considered in this study, as detailed in Table 7. The peak accelerations and story drift of each floor of the superstructure were meticulously calculated and analyzed to assess the seismic performance under varying conditions.

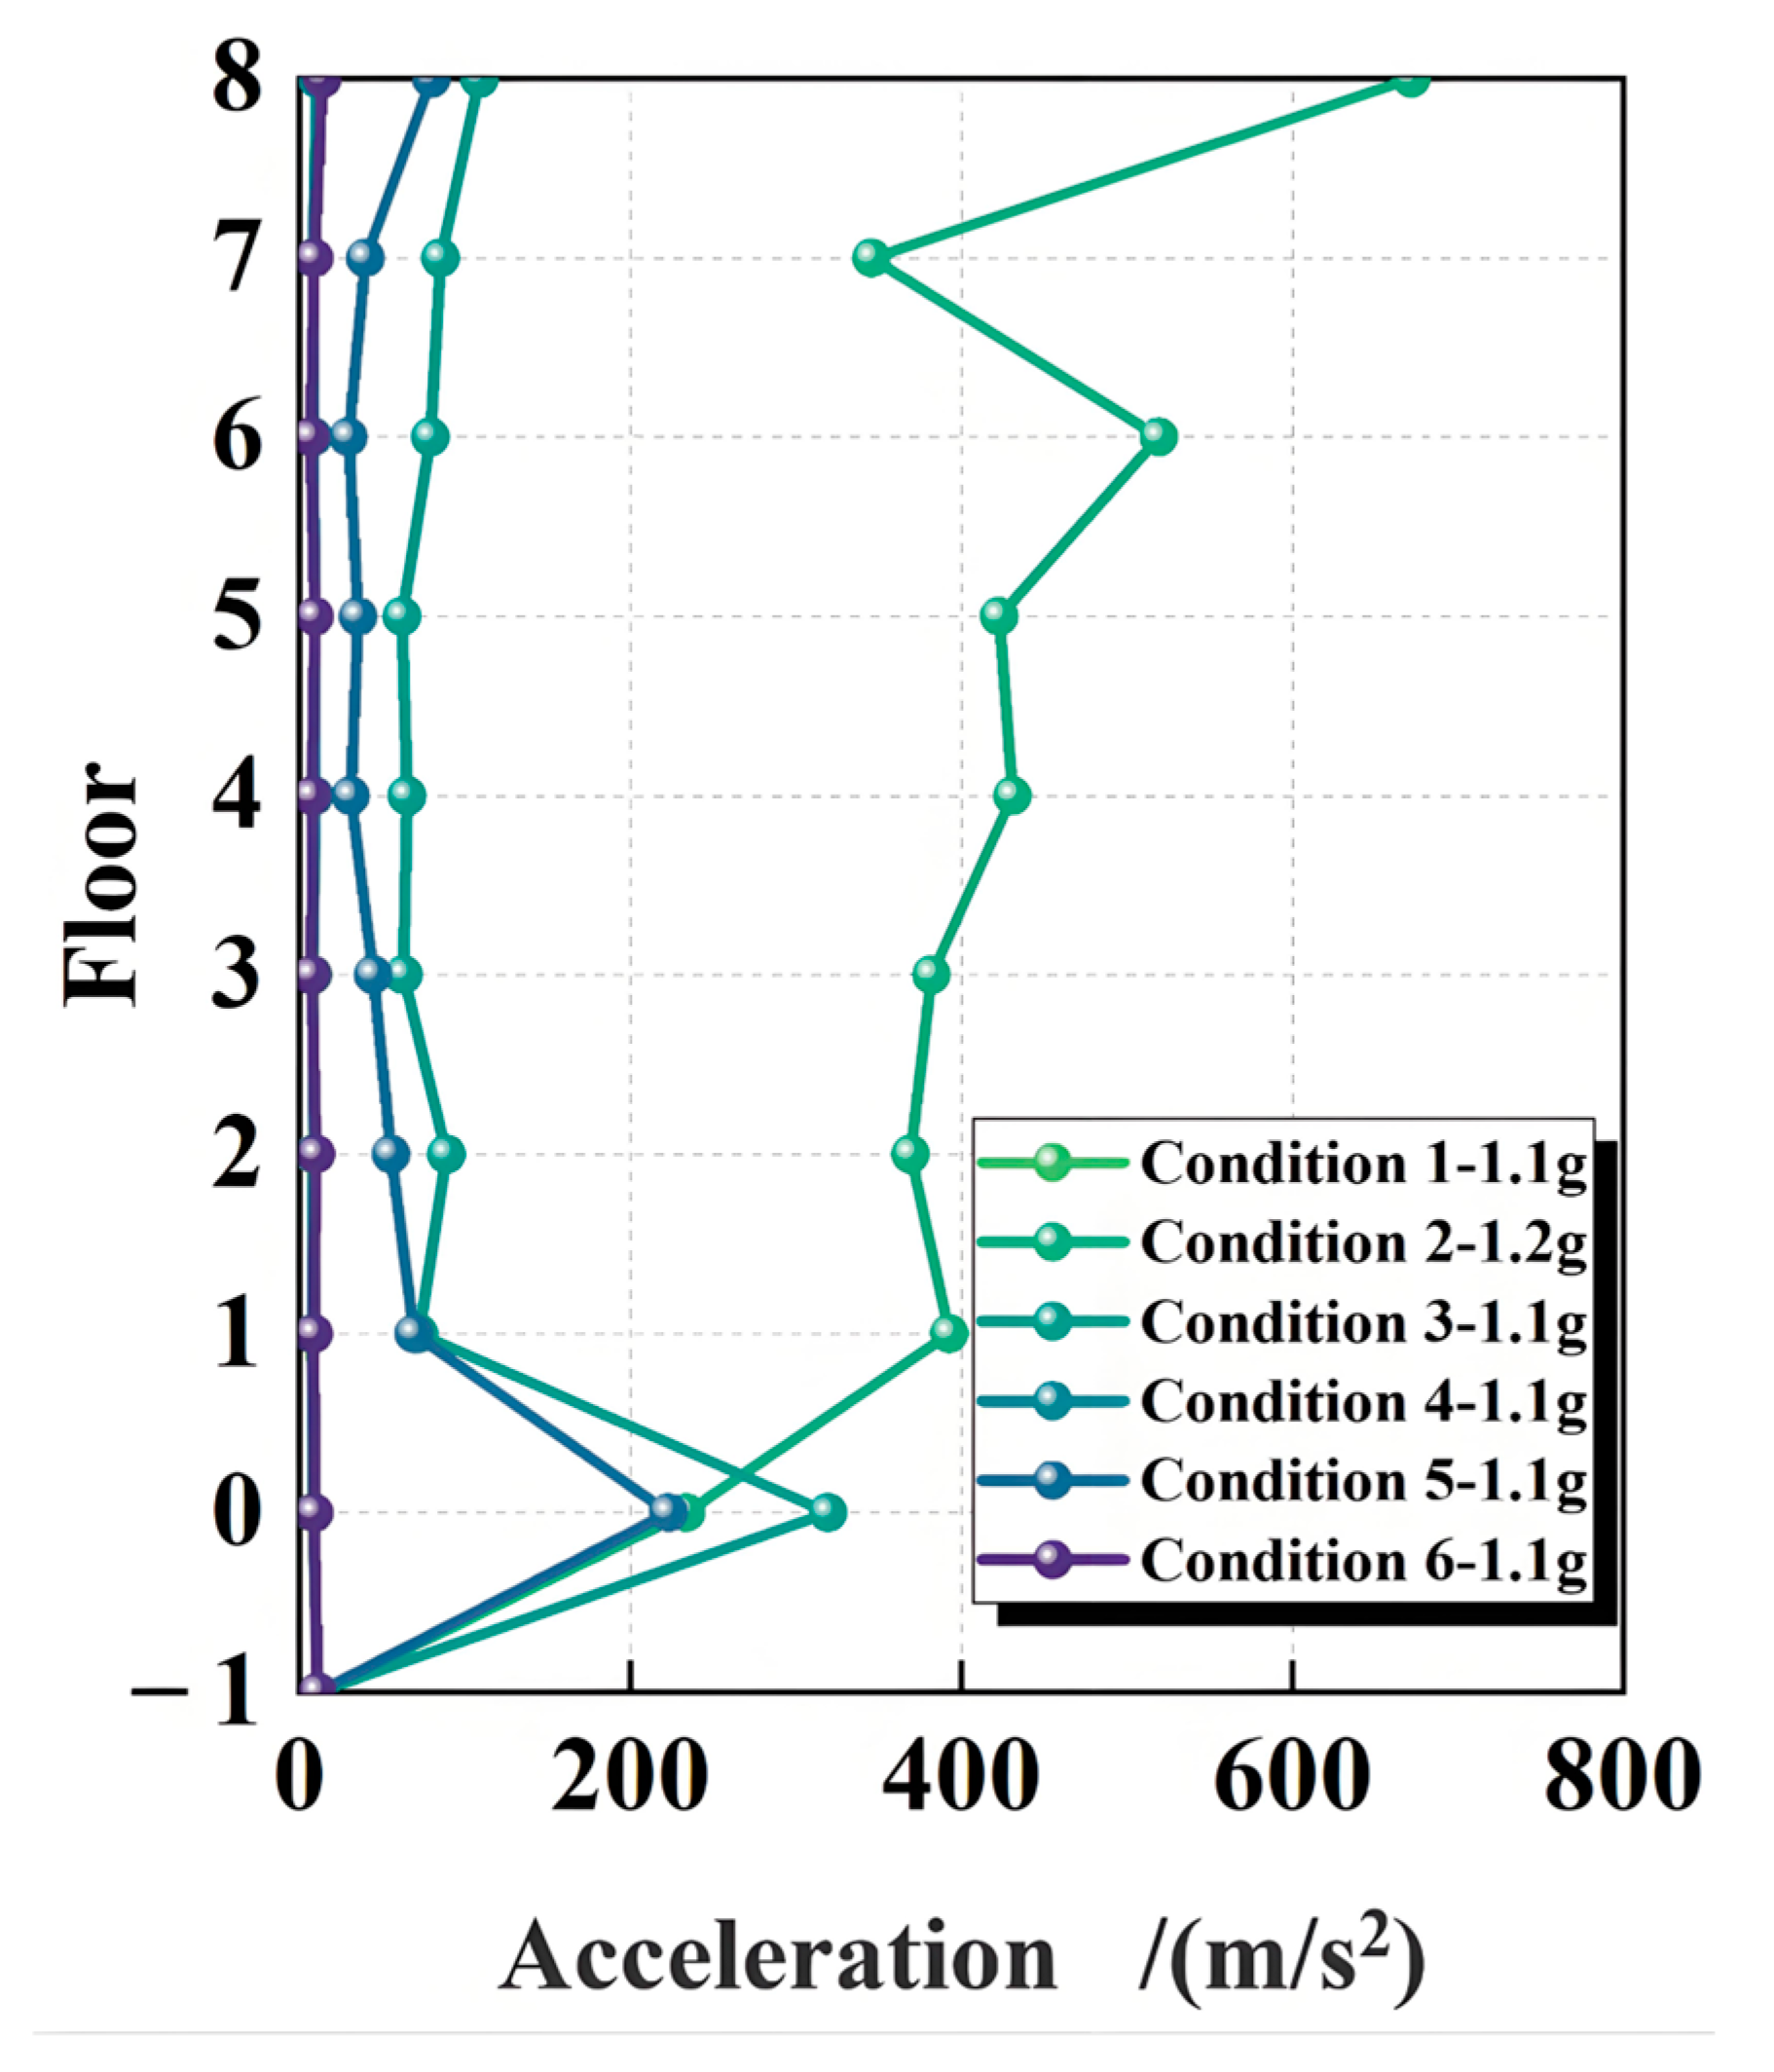
3.3.2. Peak Acceleration Results

The acceleration response curves of the top floor of the superstructure under various working conditions are depicted in Figure 13. Additionally, the peak accelerations of each floor are presented in Table 8 and summarized in Figure 14. The −1F represents the ground, 0F represents the isolation layer, 1F represents the 1st floor, and the subsequent ones are similar to 1F’s meanings.

3.3.3. Story Drift Results

The average story drift of each floor under various conditions are presented in Table 9 and summarized in Figure 15. The −1–0F means ground-isolation layer, 0–1F means isolation layer-1F, 1–2F means 1F–2F, and the subsequent ones are similar to 1–2F’s meaning.

4. Discussion

4.1. LRBs Under Compression Shear State

Compared with experimental data, the third-order polynomial model performs A goodness fit of simulation on the hysteresis characteristics of LRBs under small horizontal deformations (shear deformations ranging from 50% to 200%), as shown in subfigures (a–d) of Figure 8. Additionally, under large horizontal deformations (shear deformations ranging from 200% to 400%), the model accurately captures the stiffness hardening phenomenon observed in rubber under large deformation conditions.

4.2. LRB Damage

The simulation results in Figure 9 indicate that bond failure occurs in the LRB at a horizontal shear strain of approximately 400% (corresponding to a shear deformation of 468 mm). The horizontal force at the time of failure is found to be close to the previously analyzed value of 1607.08 kN.
In Figure 10, as shown in the context of the constitutive model for the isolation bearings, K1 represents the elastic stiffness of the isolation bearing prior to yielding, K2 denotes the post-yield stiffness, K3 corresponds to the stiffness of the first strengthening segment (shear strain ranging from 200% to 300%), and K4 is the stiffness of the second strengthening segment (shear strain ranging from 300% to 350%). Considering the manufacturing tolerances of actual isolation bearings and the safety requirements of isolated structures, it is assumed that when the shear strain of the isolation bearing exceeds 350%, the bearing is considered to have sustained damage and is deemed to have withdrawn from service, no longer providing horizontal stiffness.
As shown in Figure 11, to simulate the failure modes of cohesive elements and the overall failure of isolation bearings under compressive shear conditions, cohesive elements are employed to replicate the vulcanization interface between the rubber and steel plate layers of the actual isolation bearings. Given that cohesive element failure necessitates the use of dynamic analysis modules [30,31], the Abaqus/Explicit module, which utilizes explicit integration schemes, is selected for this computational simulation. In the geometric model, firstly, a bonding zone is initially defined between the rubber layer and the steel plate layer. The thickness of this bonding zone, which corresponds to the thickness of the cohesive element, is determined based on the influence of inertial forces in dynamic simulations. In this study, the thickness of the cohesive element is set to 0.2 mm. Secondly, the defining failure criteria for materials, respectively, are bonding zone, iron, rubber and lead.
Figure 12 illustrates that the two simulation approaches, Abaqus/Standard (without damage consideration) and Abaqus/Explicit (with damage consideration), yield fundamentally consistent results. The observed fluctuations in the curves are attributed to the transition from a fully tied connection to a partially damaged state. Specifically, under the condition that material failure is considered, the LRB sustains damage when the horizontal force reaches 1554.69 kN. This value exhibits an error of approximately 3.3% when compared to the simulation results obtained without considering damage.

4.3. Comparison of Peak Acceleration

When compared to an isolated structure with no damage on isolation bearings, the peak amplification factor of the top-floor acceleration is found to be the highest, reaching 673.03 m/s2 when the isolation layer collapses completely. Specifically, regarding the location of damage to the isolation bearings, the amplification factors are as follows: when one and two isolation bearings are damaged at the corner, the amplification factors are 10.26 and 7.53 times, respectively. In contrast, when one and two isolation bearings in the middle are damaged, the amplification factors are 1.02 and 1.31 times, respectively. Furthermore, the principle of amplification factors was also found to be similar in each floor of the general structure. Moreover, damage on the edge position has a more intense impact on each floor’s (including the top floor) acceleration of the superstructure compared to damage at the center position. Moreover, the binary corner damage shows slower acceleration than the single one; nevertheless, the binary damage in the center position shows no obvious acceleration change.

4.4. Comparison of Story Drift

Compared to an isolated structure with no damage to the isolation bearings, the displacement of the isolation layer is amplified by a factor of 1.21 with all the LRB damage. For other layers, the failure effects of two isolation bearings at the corner positions are the most significant, with amplification factors ranging from 1.9 to 3.52 times. The impact of the failure of corner isolation bearings on the story drift of the entire structure is greater than that of the failure of middle isolation bearings. Additionally, at both corner and middle positions, the impact of the failure of a single isolation bearing on the story drift of the structure is smaller than that of the failure of two isolation bearings.
This analysis highlights the complex interplay between bearing failure and structural response, emphasizing the need for detailed analysis to understand the dynamic behavior of isolated structures under seismic loading. In seismic isolation design, it is recommended to focus on safeguarding the normal operation of the edge LRB under compressive shear conditions to prevent premature failure and a significant deterioration in the overall seismic performance of the structure. While the failure of the intermediate LRB has a relatively minor impact on acceleration, their condition monitoring and maintenance remain equally crucial. Therefore, in the development of design and maintenance strategies for seismic isolation systems, the performance characteristics and potential failure modes of both the edge and intermediate LRB should be comprehensively evaluated and integrated into the overall strategy.
Future research endeavors could focus on investigating the influence of diverse LRB layout configurations on the seismic performance of structures. Additionally, the development of more precise numerical models to anticipate the response of LRBs under intricate seismic excitations is warranted.

5. Conclusions

This article conducted research on LRB damage and superstructure response under near-fault earthquakes. The finite element analysis method was used and applied.
(1)
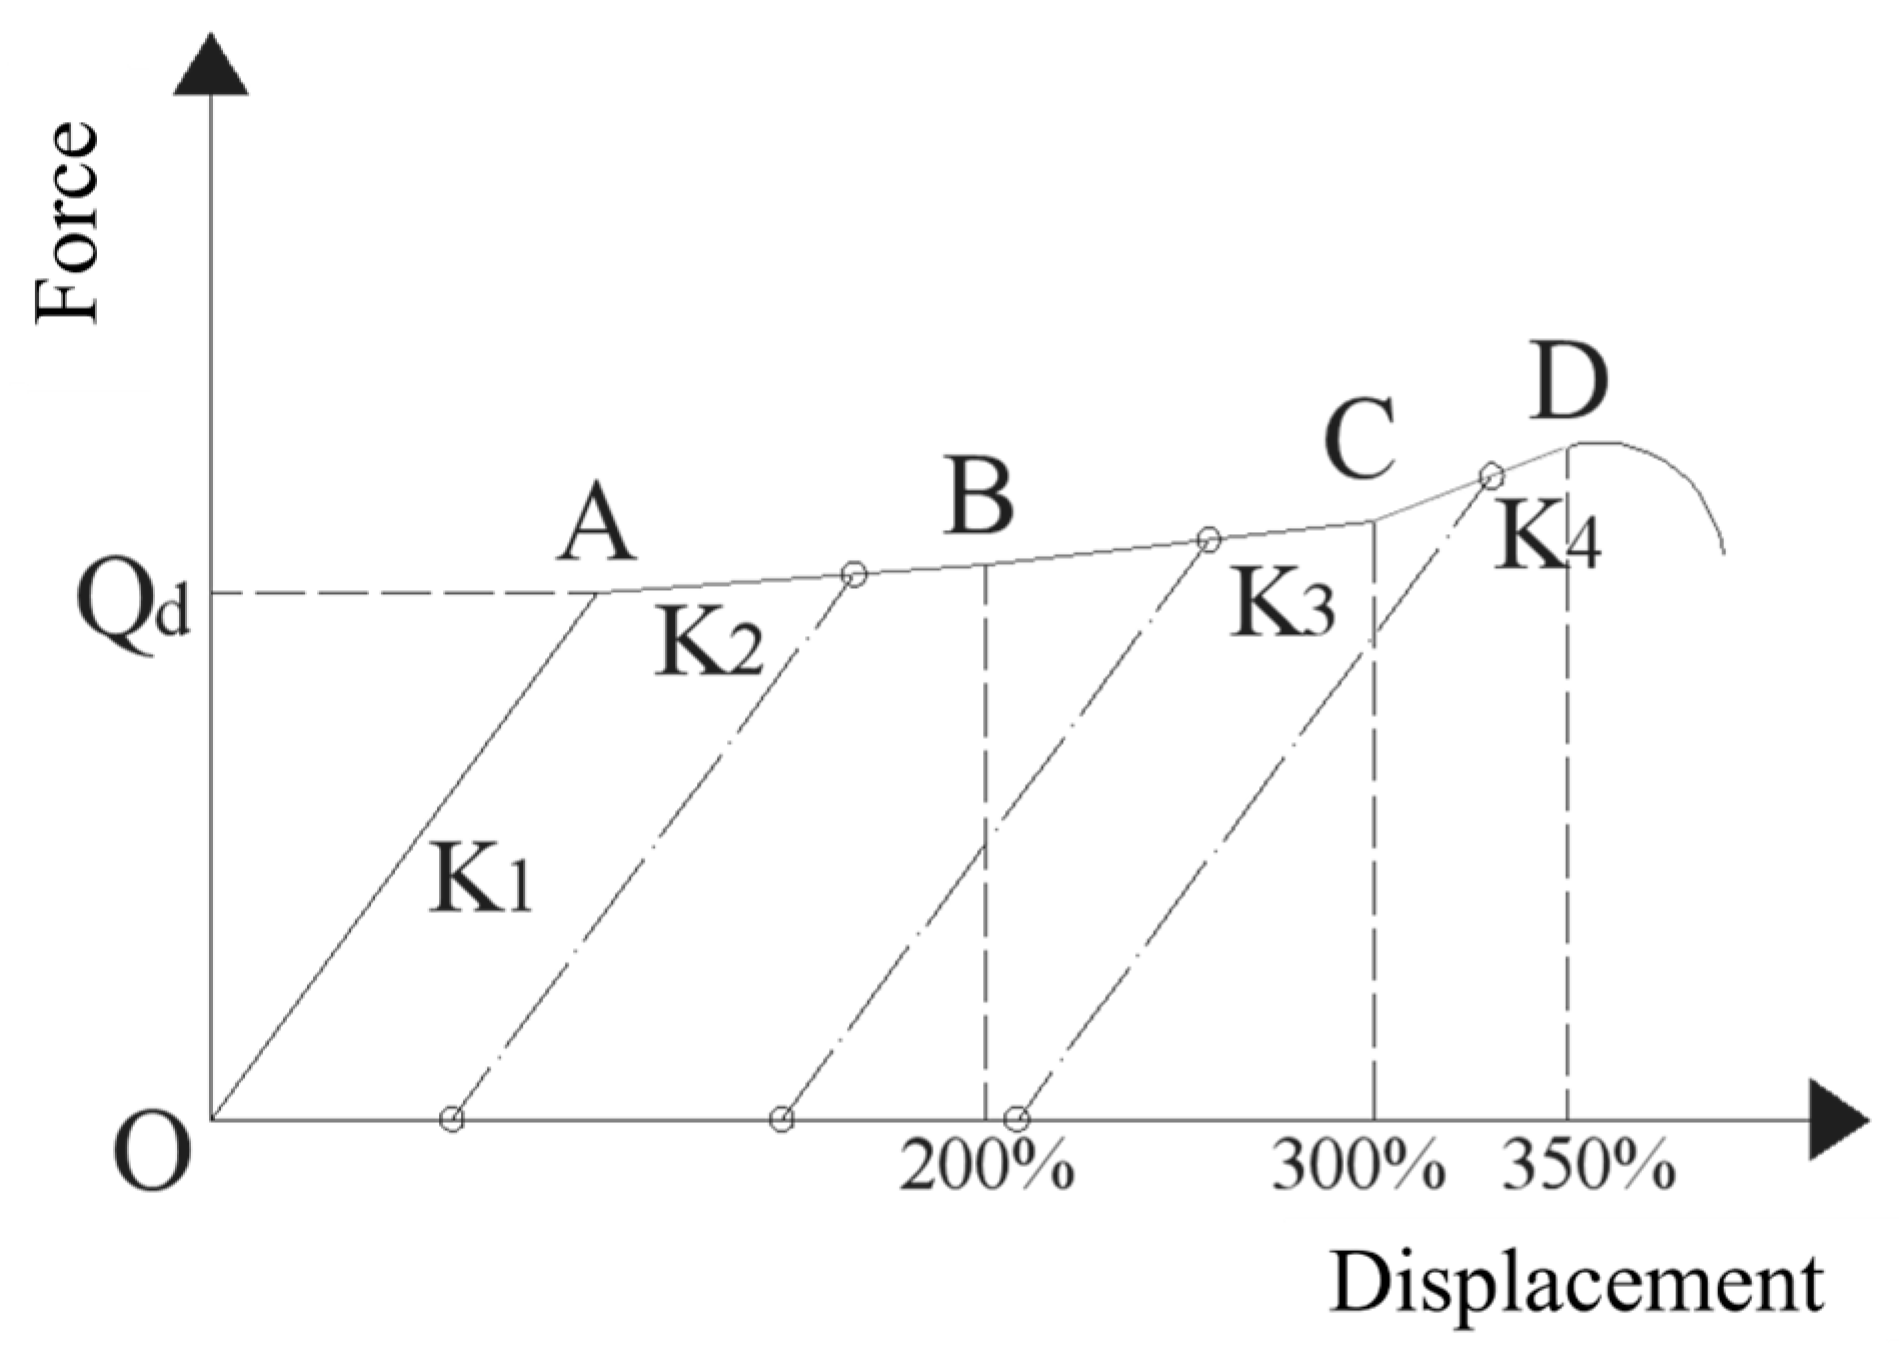
The numerical simulation results show that under the compressive and shearing state, when the horizontal deformation of the isolator exceeds 300%, the stiffness enhancement section appears.
(2)
It is found that in comparison with seismic isolation structure without any damage, the damage of all LRBs show the most significant scale-up effect on acceleration. Edge-bearing damage shows greater damage than the center position. For edge bearing, the single edge damage shows more powerful damage than binary. In the center position, the damage effect shows the reverse effect.
(3)
The seismic isolation structure damage on story drift was simulated. Similar to the effect on acceleration, the edge-bearing damage is larger than the center position damage. While for edge and center position bearings, the single edge bearing also shows a larger story drift than binary.
(4)
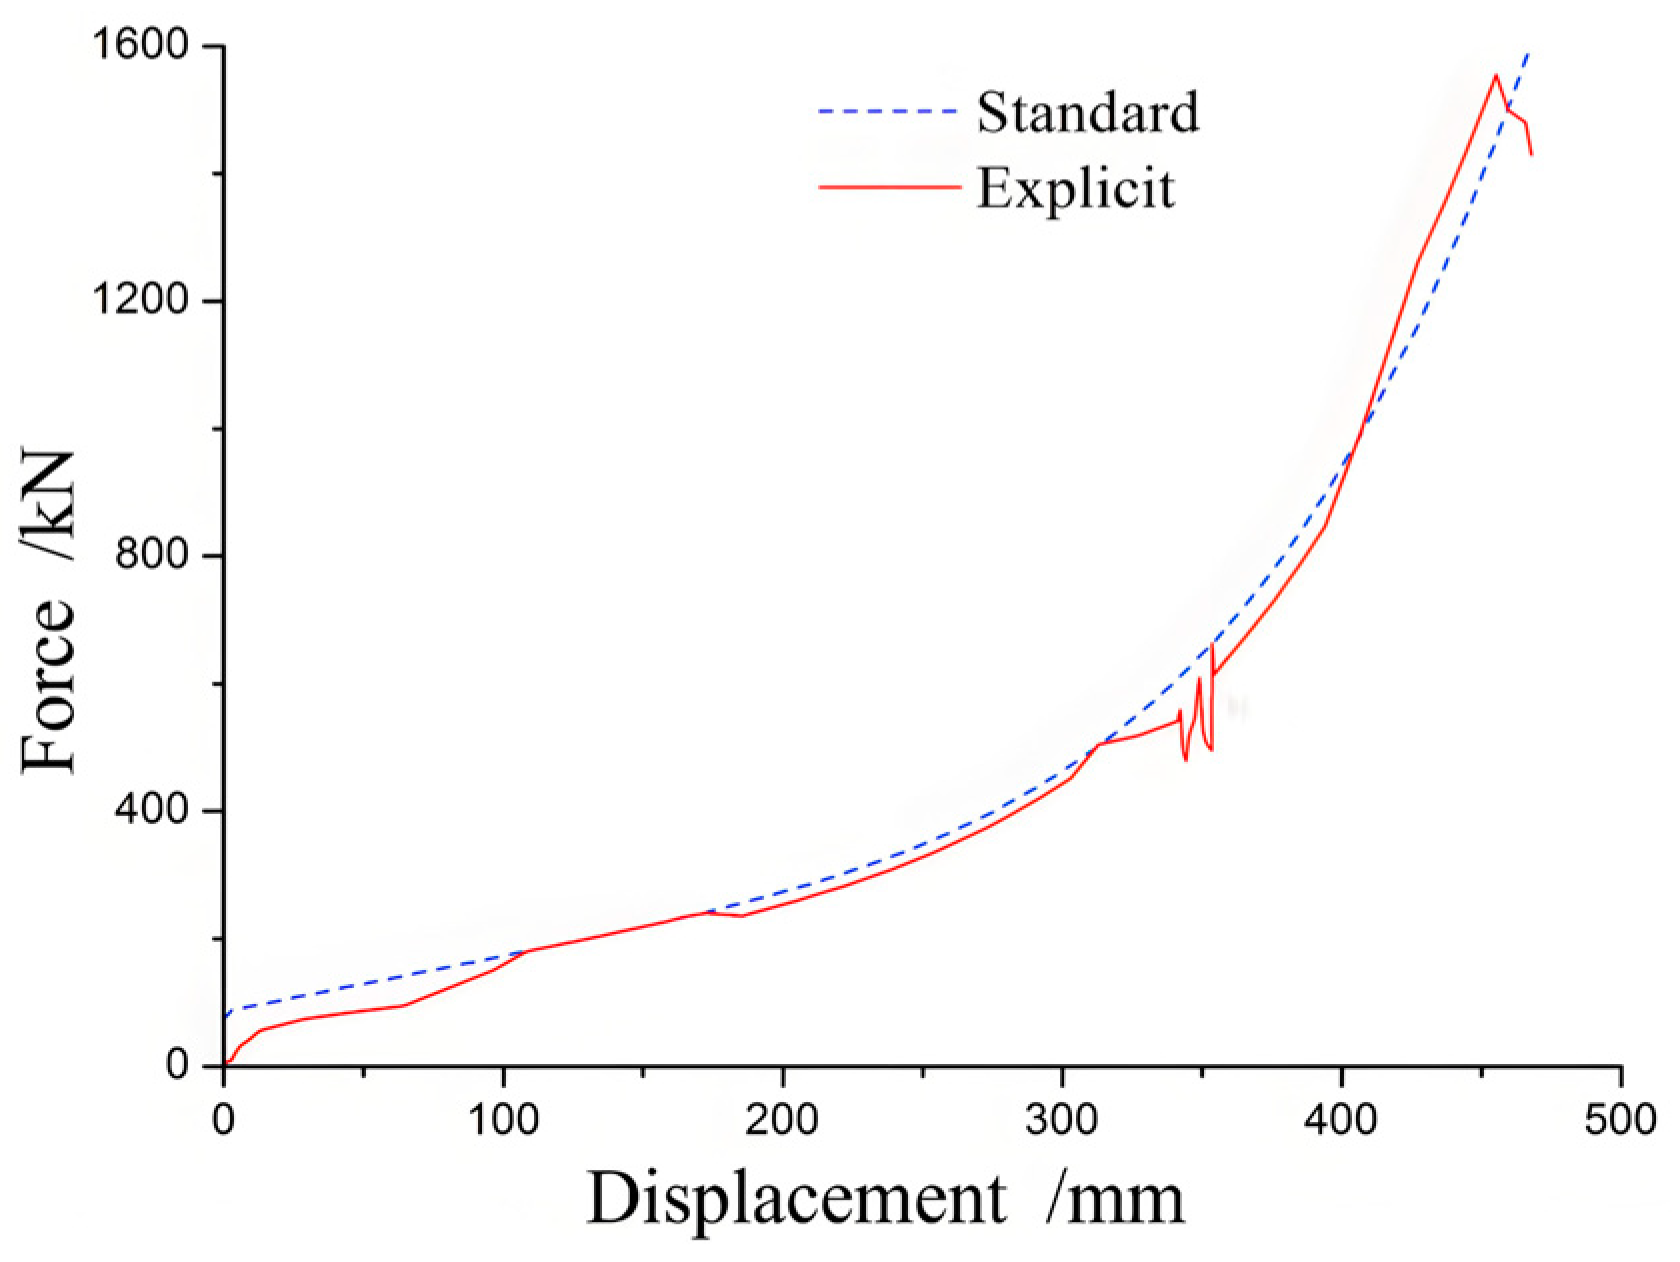
For finite element analysis, it is found that the polynomial model performs better than the traditional Mooney–Rivlin (MR) model in the simulation of rubber reinforcement during the large deformation of LRBs. To simulate more accurately, it is recommended to use the tie element and select the reasonable parameters to deal with the bond between the rubber layer and the steel plate. If the appropriate accuracy is selected, the hysteresis performance of the lead rubber bearing in large horizontal deformations could be simulated with accepted accuracy, which fits well with the experimental data.
While there are limitations of this study such as the impact of the complexity of superstructures on the performance of isolation layers. The coupling effect of base seismic isolation damage and soil was not considered, which may have some impact on the simulation results [32]. In some instances, the failure of intermediate bearings perhaps results in decreasing interlayer displacement, which could be caused by a decrease in stiffness after structural damage. These points are not included in this study and should be researched in the future.

Author Contributions

Conceptualization, Y.R. and R.W.; Methodology, Y.R., R.W. and W.L.; Software, Y.R. and R.W.; Writing—original draft, Y.R.; Writing—review & editing, Y.R., R.W., W.H. and W.L. All authors have read and agreed to the published version of the manuscript.

Funding

The funder of this study is Hubei Provincial Department of Education, and the funding number is B2019334.

Data Availability Statement

The original contributions presented in this study are included in the article. Further inquiries can be directed to the corresponding author.

Conflicts of Interest

Author Ruidong Wang was employed by the company Shanghai Jiuxuan Engineering Technology Co., Ltd. The remaining authors declare that the research was conducted in the absence of any commercial or financial relationships that could be construed as a potential conflict of interest.

References

  1. Dora, F. Response of frames seismically protected with passive systems in near-field areas. Int. J. Struct. Eng. 2014, 5, 326–345. [Google Scholar]
  2. Mavroeidis, G.P. A mathematical representation of near-fault ground motions. Bull. Seismol. Soc. Am. 2003, 93, 1099–1131. [Google Scholar] [CrossRef]
  3. Dora, F. On the seismic response of protected and unprotected middle-rise steel frames in far-field and near-field areas. Shock. Vib. 2014, 2014, 393870. [Google Scholar]
  4. Jitendra, G.; Kumar, G.P. Comparative analysis of T-shaped base isolated building under far-fault and near-fault earthquake. Asian J. Civ. Eng. Build. Hous. 2024, 25, 2333–2344. [Google Scholar]
  5. ASCE. Post-Earthquake Damage Assessment. In Guidelines for Seismic Evaluation & Design of Petrochemical Facilities; ASCE: Reston, VA, USA, 2011. [Google Scholar]
  6. Weni, L.; Loh, C.; Wan, S. Dynamic responses of bridges subjected to near-fault ground motions. J. Chin. Inst. Eng. 2020, 23, 455–464. [Google Scholar]
  7. Fulin, Z. Seismic Control of Engineering Structures; Earthquake Publishing House: Beijing, China, 1997; pp. 2–16. [Google Scholar]
  8. Robinson, W.H. Lead-rubber hysteretic bearings suitable for protecting structures during earthquakes. Earthq. Eng. Struct. Dynamics 1982, 10, 593–604. (In Chinese) [Google Scholar] [CrossRef]
  9. Wenfu, H.; Wenguang, L.; Da, H. Flat ring phenomenon and restoring force model of hysteresis curve of lead rubber bearings. J. Zhengzhou Univ. 2006, 27, 71–74. (In Chinese) [Google Scholar]
  10. Wenguang, L.; Fulin, Z. Basic mechanical properties of lead core laminated rubber isolation. Earthq. Eng. Eng. Vib. 1999, 19, 93–99. (In Chinese) [Google Scholar]
  11. Tsai, H.C. Dynamic analysis of base-isolated shear beams bumping against stops. Earthq. Eng. Struct. Dyn. 1997, 26, 515–528. [Google Scholar] [CrossRef]
  12. Malhotra, P.K. Dynamics of seismic impacts in base-isolated buildings. Earthq. Eng. Struct. Dyn. 1997, 26, 797–813. [Google Scholar] [CrossRef]
  13. Yang, D.X.; Li, G.; Cheng, G.D. Seismic analysis of base-isolated structures subjected to near-fault pulse-like ground motions. Earthq. Eng. Eng. Vib. 2005, 25, 119–124. (In Chinese) [Google Scholar]
  14. Yunfei, X.; Yang, L.; Wenfu, H. Research on damage control of isolation systems under near fault earthquakes. Vib. Impact 2018, 37, 183–189+216. (In Chinese) [Google Scholar]
  15. Jiao, Y. Damage Modes and Control of Isolated Structures Under Near Fault Earthquake Action. Ph.D. Thesis, Xi’an University of Technology, Xi’an, China, 2019. (In Chinese). [Google Scholar]
  16. Junjie, C. Seismic Response Analysis and Isolation Effect Study of RC Frame Structures Under Multidimensional Near-Field Earthquake Action. Ph.D. Thesis, North University of China, Taiyuan, China, 2021. (In Chinese). [Google Scholar]
  17. Heaton, T.H.; Hall, J.F.; Wald, D.J. Response of High-rise and Base Isolated Buildings to a Hypothetical MW 7∙0 Blind Thrust Earthquake. Science 1995, 267, 206–211. [Google Scholar] [CrossRef] [PubMed]
  18. Yang, D.X.; Li, G.; Cheng, G.D. Integrated Dynamic optimum design of base-isolated structure subjected to near-fault pulse-like ground motions. J. Build. Struct. 2006, 27, 42–49. (In Chinese) [Google Scholar]
  19. Yuxiang, W.; Kun, Y.; Boyu, Z. Seismic performance analysis of base-isolated Structures based on the direct design method under Extreme earthquakes: A case study of 2023 Turkey earthquake. Eng. Mech. 2024, S1, 104–111. (In Chinese) [Google Scholar]
  20. Yuhong, M.; Guifeng, Z.; Ning, Z.H. Static performance correction of lead rubber isolation bearings based on earthquake simulation vibration table test. Earthq. Eng. Eng. Vib. 2019, 39, 78–85. [Google Scholar]
  21. Mingjun, Z.; Wenjing, W.; Zhengnan, C.; Lijun, W. Determination of Mechanical Constants of Rubber Mooney-Rivlin Model. Rubber Ind. 2003, 50, 263–265. [Google Scholar]
  22. Meng, L. Determination of Material Constants of Rubber Mooney-Rivlin Model. Rubber Ind. 2011, 58, 241–245. [Google Scholar]
  23. Zhixiong, Y.; Li, L.; Sufei, N.; Yicheng, J. Explicit Finite Element Study of Mechanical Parameters of Lead-rubber Bearing. Earthq. Resist. Eng. Retrofit. 2006, 28, 53–60. (In Chinese) [Google Scholar]
  24. Lichu, F. Bridge Seismic Resistance; Tongji University Press: Shanghai, China, 2001; pp. 35–36. (In Chinese) [Google Scholar]
  25. Ministry of Housing and Urban-Rural Development. Standard for Seismic Isolation Design of Buildings GB/T 51408-2021; China Planning Press: Beijing, China, 2021.
  26. Yue, R.; Ruidong, W.; Wenguang, L.; Wenfu, H. Numerical Simulation Analysis of Collapse Process of Isolated Structure in Strong Earthquakes. In Proceedings of the ICAEER Advances in Energy and Environment Research Conference, Guilin, China, 10–12 August 2018; p. 02017. [Google Scholar]
  27. Wenguang, L. Recommendation for the Design of Base Isolated Buildings; Earthquake Publishing House: Beijing, China, 2006; pp. 137–140. (In Chinese) [Google Scholar]
  28. Endo, M.; Uryu, M.; Imazuka, Y.; Yamazaki, T.; Yoshida, S.; Nakanishi, R. Fragility Evaluation of Base-Isolated Building Part1: Evaluation of Fragility Curve Considering Bumping Against Retaining Wall; Architectural Institute of Japan: Tokyo, Japan, 2007; Volume 30, pp. 941–942. [Google Scholar]
  29. Manabu, L. Fragility Evaluation of Base-Isolated Building Part2: Evaluation of Fragility Curve Considering Bumping Against Retaining Wall; Architectural Institute of Japan: Tokyo, Japan, 2007; Volume 30, pp. 943–944. [Google Scholar]
  30. Zhijian, H. Research on Seismic Response Calculation Method for Seismic and Isolation Structures Based on Random Vibration Time Domain Explicit Method. Ph.D. Thesis, South China University of China, Guangzhou, China, 2019. (In Chinese). [Google Scholar]
  31. Zhuo, Z. Finite Element Analysis and Application Based on Abaqus; Tsinghua University Press: Beijing, China, 2009; pp. 56–59. (In Chinese) [Google Scholar]
  32. Asgarkhani, N.; Kazemi, F.; Jankowski, R. Machine learning-based prediction of residual drift and seismic risk assessment of steel moment-resisting frames considering soil-structure interaction. Comput. Struct. 2003, 289, 107181. [Google Scholar] [CrossRef]
Figure 1. Diagram of methodology.
Buildings 15 00839 g001
Figure 2. Finite element model of lead isolation bearing. (a) Assembly model; (b) Grid model.
Buildings 15 00839 g002
Figure 3. Stress–strain curves. (a) Rubber; (b) Lead; (c) Steel.
Buildings 15 00839 g003
Figure 4. Superstructure model.
Buildings 15 00839 g004
Figure 5. LRB400 arrangement plan.
Buildings 15 00839 g005
Figure 6. Isolated structure finite element model.
Buildings 15 00839 g006
Figure 7. Simulation loading curve.
Buildings 15 00839 g007
Figure 8. Comparison of hysteresis curve of LRB600: (a) Hysteresis curve and deformation of LRB600 under γ = 50%; (b) Hysteresis curve and deformation of LRB600 under γ = 100%; (c) Hysteresis curve and deformation of LRB600 under γ = 150%; (d) Hysteresis curve and deformation of LRB600 under γ = 200%; (e) Hysteresis curve and deformation of LRB600 under γ = 300%; (f) Hysteresis curve and deformation of LRB600 under γ = 400%.
Buildings 15 00839 g008aBuildings 15 00839 g008b
Figure 9. Comparison of hysteresis curve of LRB600.
Buildings 15 00839 g009
Figure 10. Horizontal direction constitutive relation of LRB.
Buildings 15 00839 g010
Figure 11. Destruction analysis model and results: (a) LRB analysis model; (b) Side view of LRB destruction; (c) Top view of LRB destruction.
Buildings 15 00839 g011
Figure 12. Comparison of Abaqus/Standard and Abaqus/Explicit.
Buildings 15 00839 g012
Figure 13. Acceleration curve of the top layer of the superstructure. (a) Top-layer acceleration curve in working condition 1; (b) Top-layer acceleration curve in working condition 2; (c) Top-layer acceleration curve in working condition 3; (d) Top-layer acceleration curve in working condition 4; (e) Top-layer acceleration curve in working condition 5; (f) Top-layer acceleration curve in working condition 6.
Buildings 15 00839 g013
Figure 14. Peak acceleration of each floor.
Buildings 15 00839 g014
Figure 15. Story drift of each floor.
Buildings 15 00839 g015
Table 1. Structural parameters of rubber bearings.
ModelDiameter
mm
Lead Diameter
mm
Internal Rubber Materials
n·tr/mm
Internal
Steel Plate
n·ts/mm
Height in Total
mm
S1S2
LRB60060012026 × 4.5 mm = 11725 × 3 mm = 7527633.335.13
Table 2. Polynomial three-order model parameters.
Rubber
Model
C10
MPa
C01
MPa
C20
MPa
C11
MPa
C02
MPa
C30
MPa
C21
MPa
C12
MPa
C03
MPa
Polynomial0.193407−0.0001449−0.00080730.0001794−0.000003450.000692790.1934070.0001794−0.00000345
Table 3. Material parameters of steel plate and lead.
MaterialElastic Modulus
GPa
Poisson’s RatioYield Stress
Mpa
Tangent Modulus
Mpa
Steel plate206.000.30235.00
Lead16.460.4413.50
Table 4. Section size and materials of beams and columns.
TypeSection Size
mm × mm
Material Strength GradeElastic Modulus
GPa
Frame beam400 × 850concreteC3030
Secondary beam400 × 750concreteC3030
Frame column600 × 600concreteC3030
Table 5. Parameters of fundamental mechanical properties.
TypeQuantityAxial
Force
kN
Surface Pressure
MPa
Yield
Force
kN
Post-Yielding
Stiffness
kN/mm
Vertical Compression
Stiffness
kN/mm
Vertical Tensile
Stiffness
kN/mm
LRB4004596.654.7542.7240.8481816.300233.150
LRB4002827.216.5842.7240.8481816.300233.150
Table 6. Horizontal stiffness of LRB400.
TypeA
(Elastic Stage)
B
(Yielding Stage)
C
(First Reinforcement Stage)
D
(Second Reinforcement Stage)
Force/kN42.724176.083278.568449.375
Displacement (mm)3.877161.200241.800282.100
TypeK1K2K3K4
Stiffness (kN/mm)11.0190.8481.2724.238
Table 7. Working conditions.
Working
Condition
Peak
Acceleration
Failure
Bearing
Failure
Location
Horizontal
Deformation
11.1gnoneno300–350%
21.2gallwhole>350%
31.1g1edge>350%
41.1g2center>350%
51.1g1, 4edge>350%
61.1g2, 5center>350%
Table 8. Peak acceleration of each floor.
Working
Condition
Peak Acceleration of Each Floor/(m/s2)
−1F
(Ground)
0F
(−Isolation Layer)
1F2F3F
111.008.097.538.428.53
212.00233.87392.76369.24381.96
311.00319.5472.4589.0063.15
411.008.737.349.228.04
511.00223.0369.3055.6644.72
611.009.168.7310.347.40
Working
condition
Peak acceleration of each floor/(m/s2)
4F5F6F7F8F
19.509.458.488.3010.62
2430.99422.83519.38345.81672.03
365.1362.2879.2685.43108.96
49.509.458.488.3010.78
531.1335.7729.7540.1979.94
67.859.296.899.0813.99
Table 9. Story drift of each floor.
Working
Condition
Story Drift of Each Floor/mm
−1–0F
(Ground-Isolation Layer)
0–1F
(Isolation Layer-1F)
1–2F2–3F
1275.598.5916.3518.19
2332.5624.3617.2125.06
3294.958.8817.6720.37
4293.647.7715.9218.98
5305.9417.8829.8035.17
6297.348.1315.3518.13
Working
condition
Story drift of each floor/mm
3–4F4–5F5–6F6–7F7–8F
118.2917.0014.8711.497.92
222.8021.1520.6918.3822.24
319.5017.1815.6814.3212.87
418.6216.8014.8711.497.92
534.6631.8730.2629.1227.87
617.4816.8015.2012.198.47
Disclaimer/Publisher’s Note: The statements, opinions and data contained in all publications are solely those of the individual author(s) and contributor(s) and not of MDPI and/or the editor(s). MDPI and/or the editor(s) disclaim responsibility for any injury to people or property resulting from any ideas, methods, instructions or products referred to in the content.

