
Exploring the Impact of Daytime and Nighttime Campus Lighting on Emotional Responses and Perceived Restorativeness


Abstract
1. Introduction
1.1. College Students’ Mental Health in China
1.2. Campus Scenery and Mental Health
1.2.1. Built Environments and Mental Health
1.2.2. Campus Landscape and Students’ Mental Health
1.2.3. Daytime and Nighttime Scenery
1.3. Integrating Multiple Methodologies for the Study of Walking Experiences
1.4. Research Contribution
- (1)
- An examination of the impact of different lighting scenarios on college students’ emotional and restorative perceptions.
- (2)
- The development and validation of a mixed-method framework for nighttime landscape evaluation.
2. Material and Methods
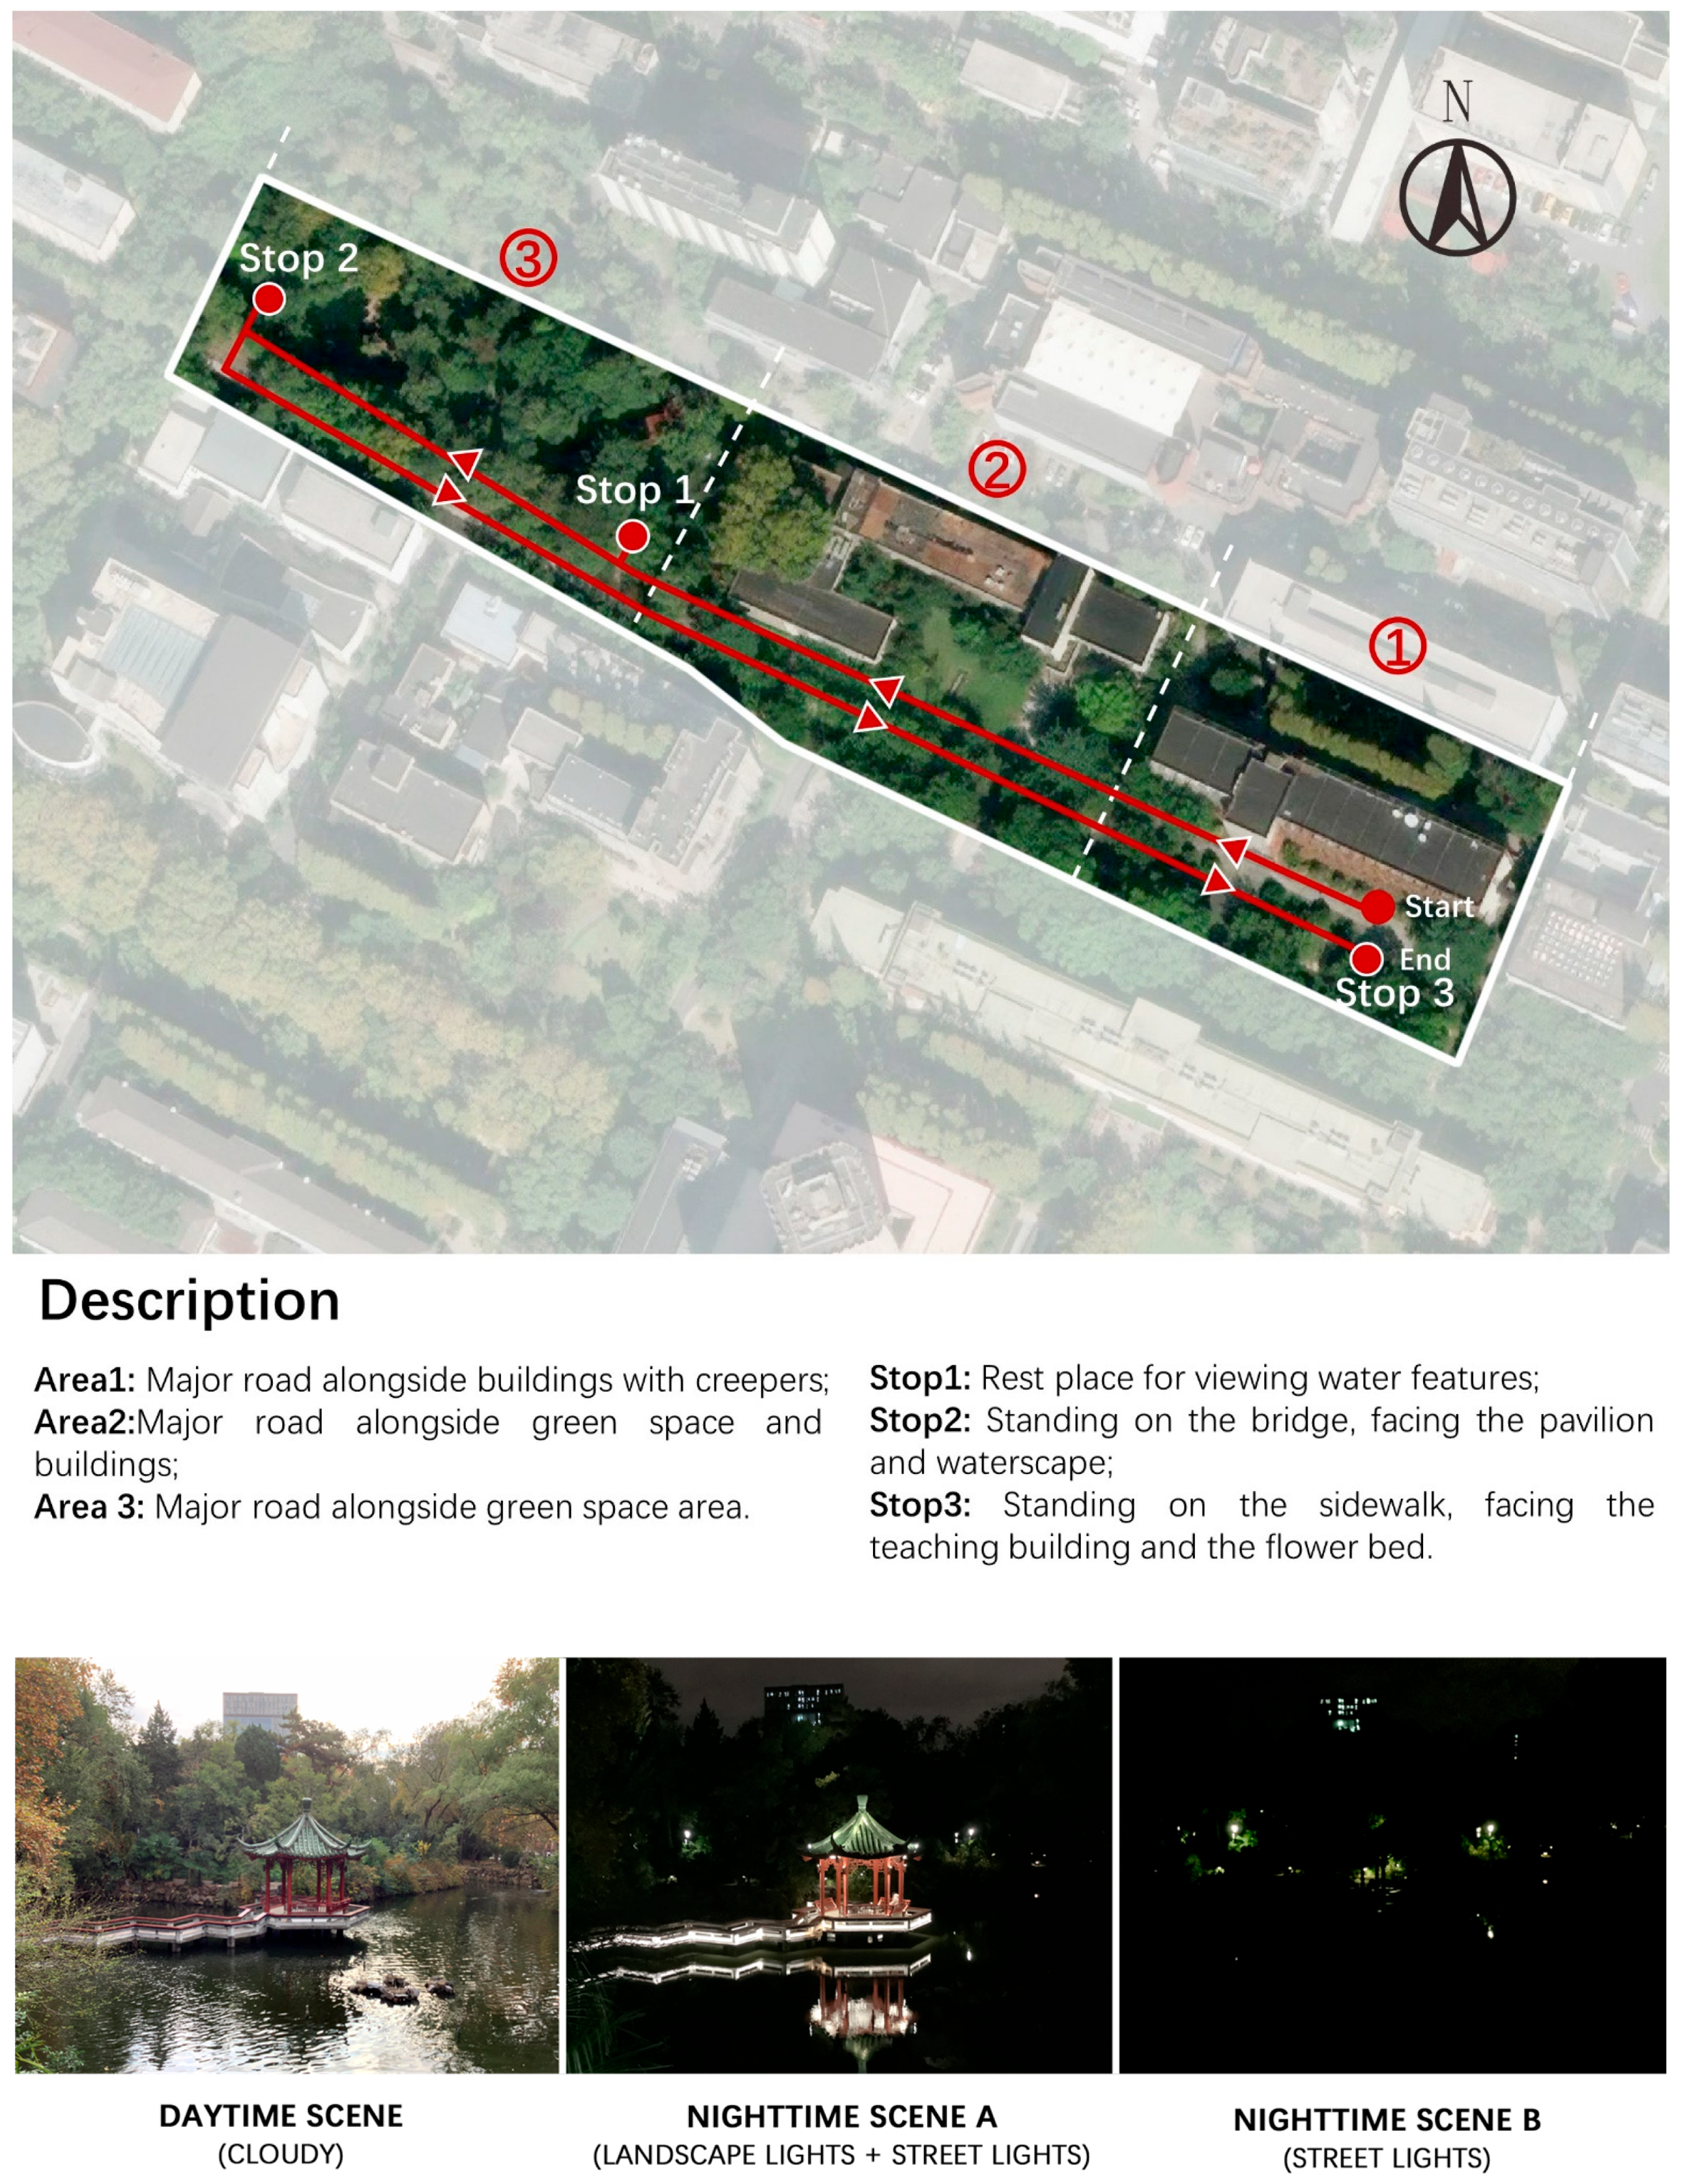
2.1. Study Site
2.2. Participants
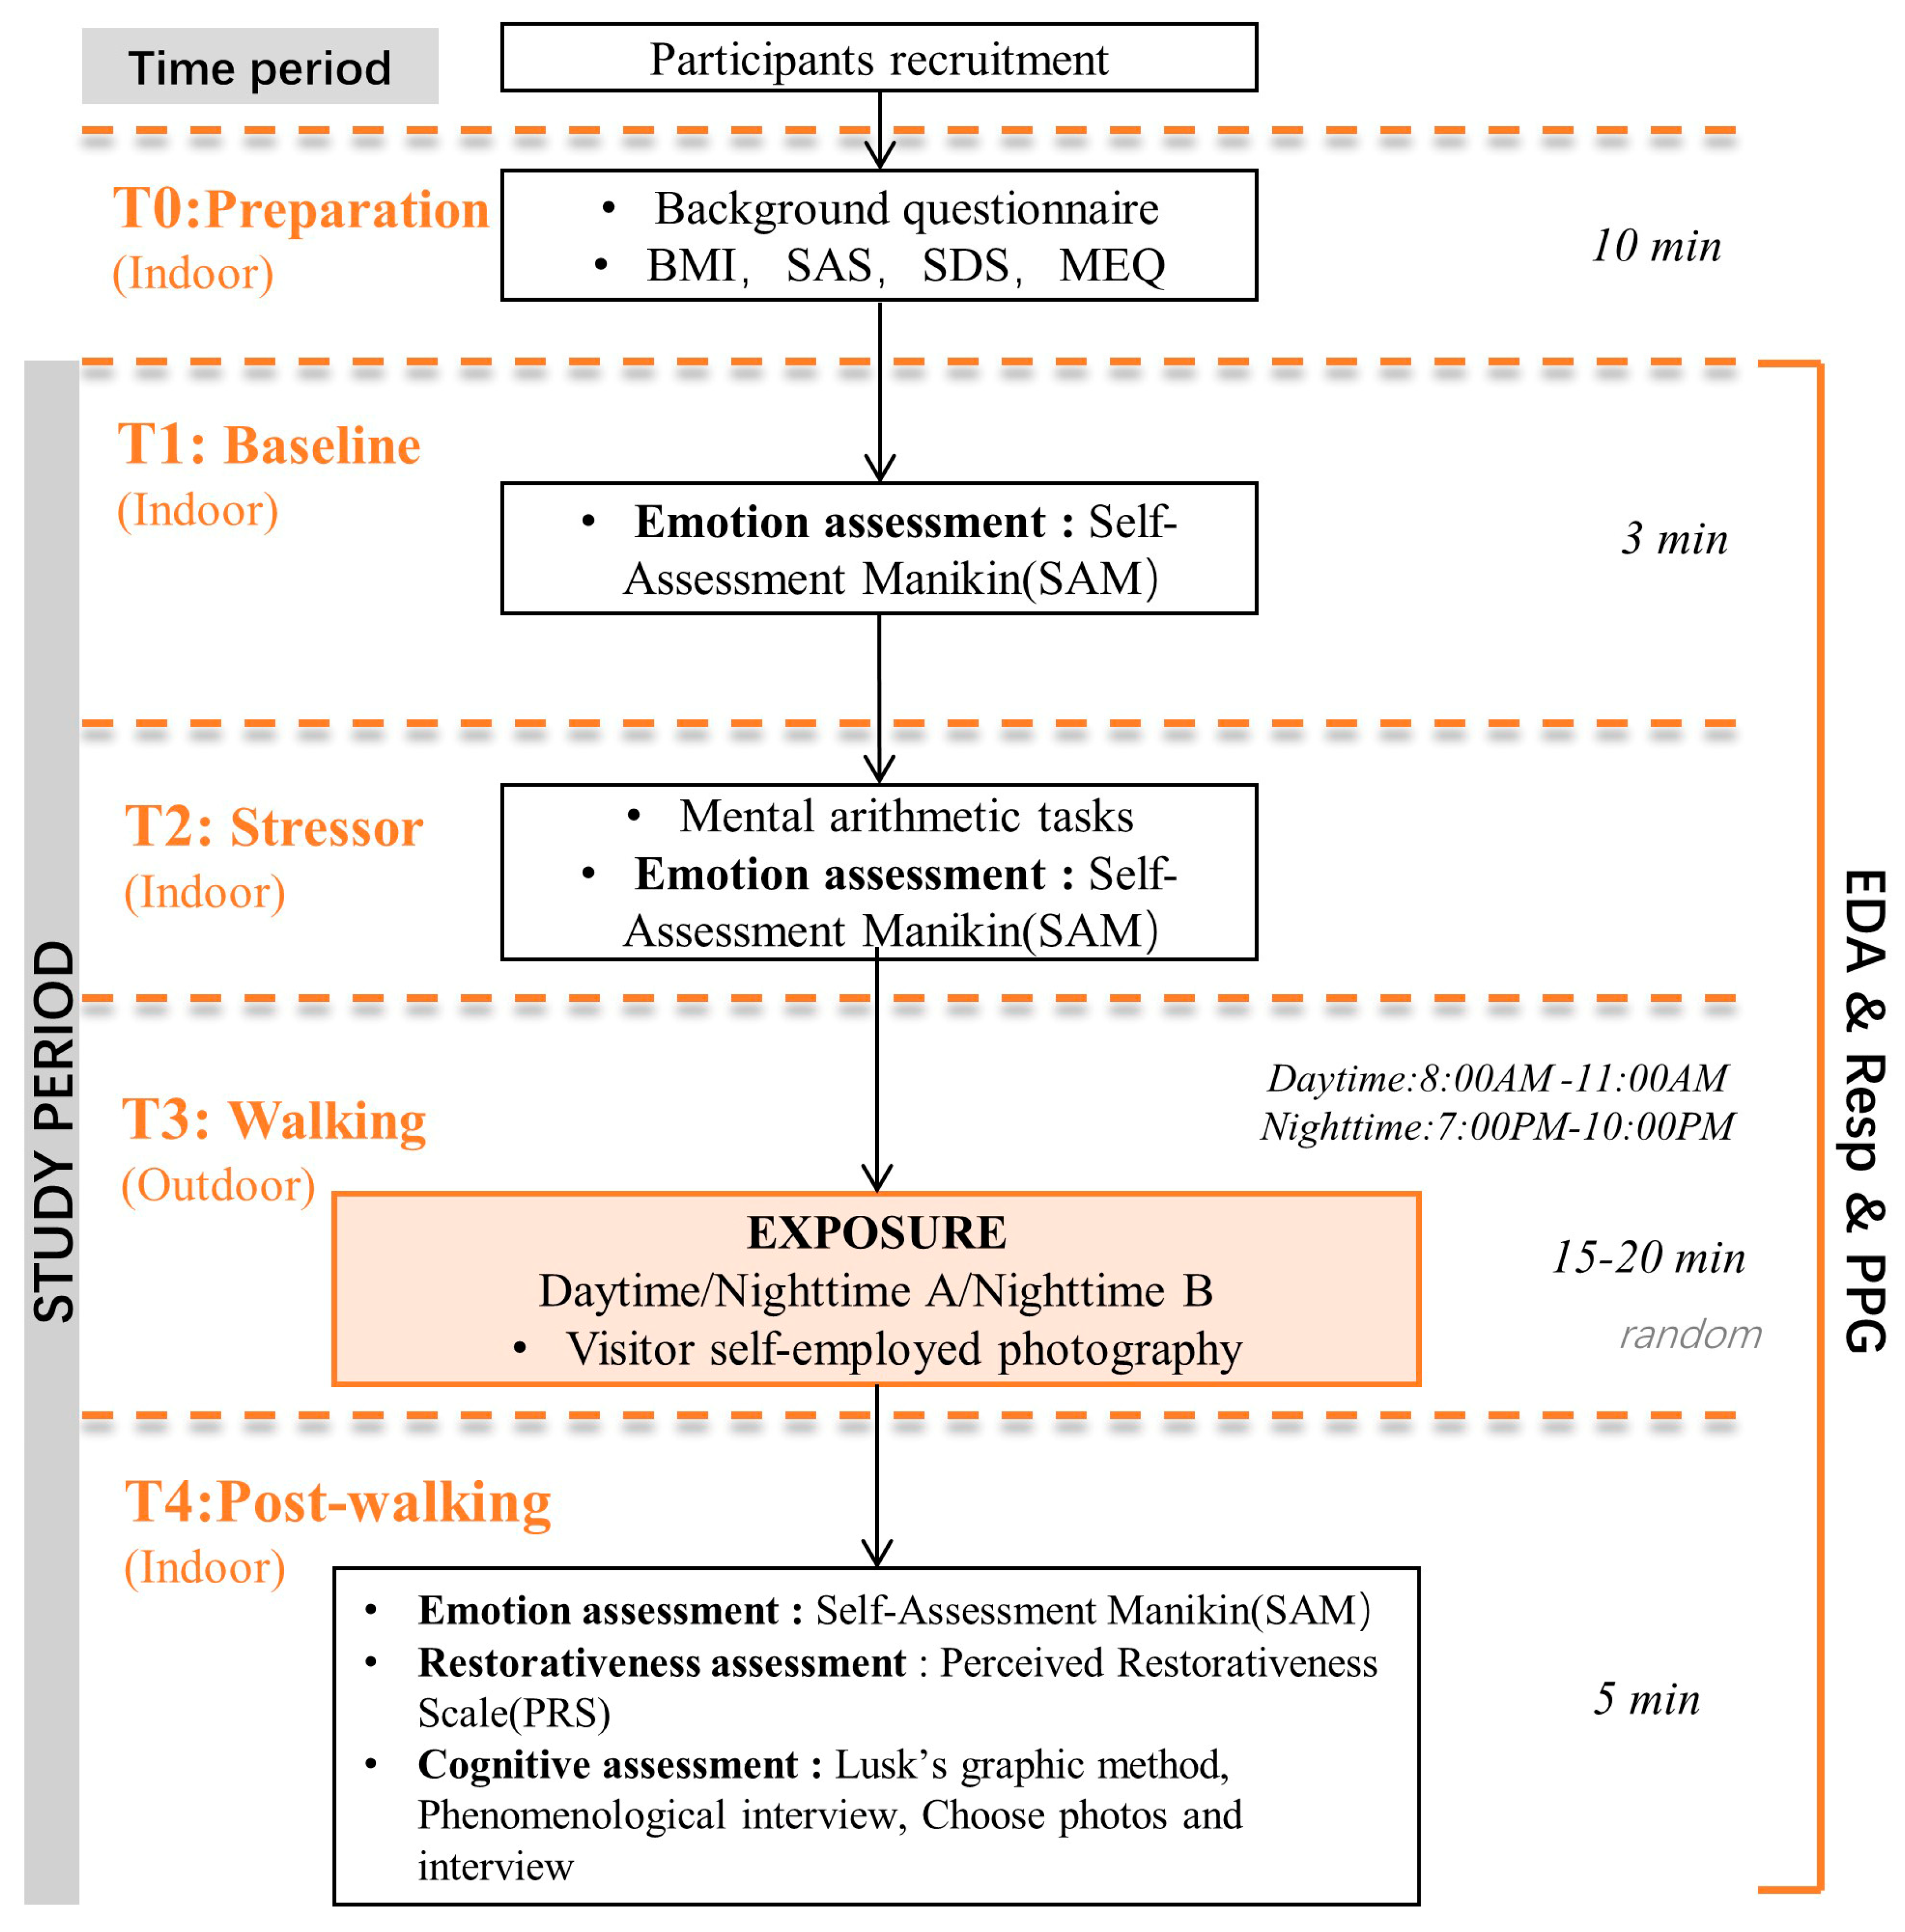
2.3. Study Process
2.4. Measures
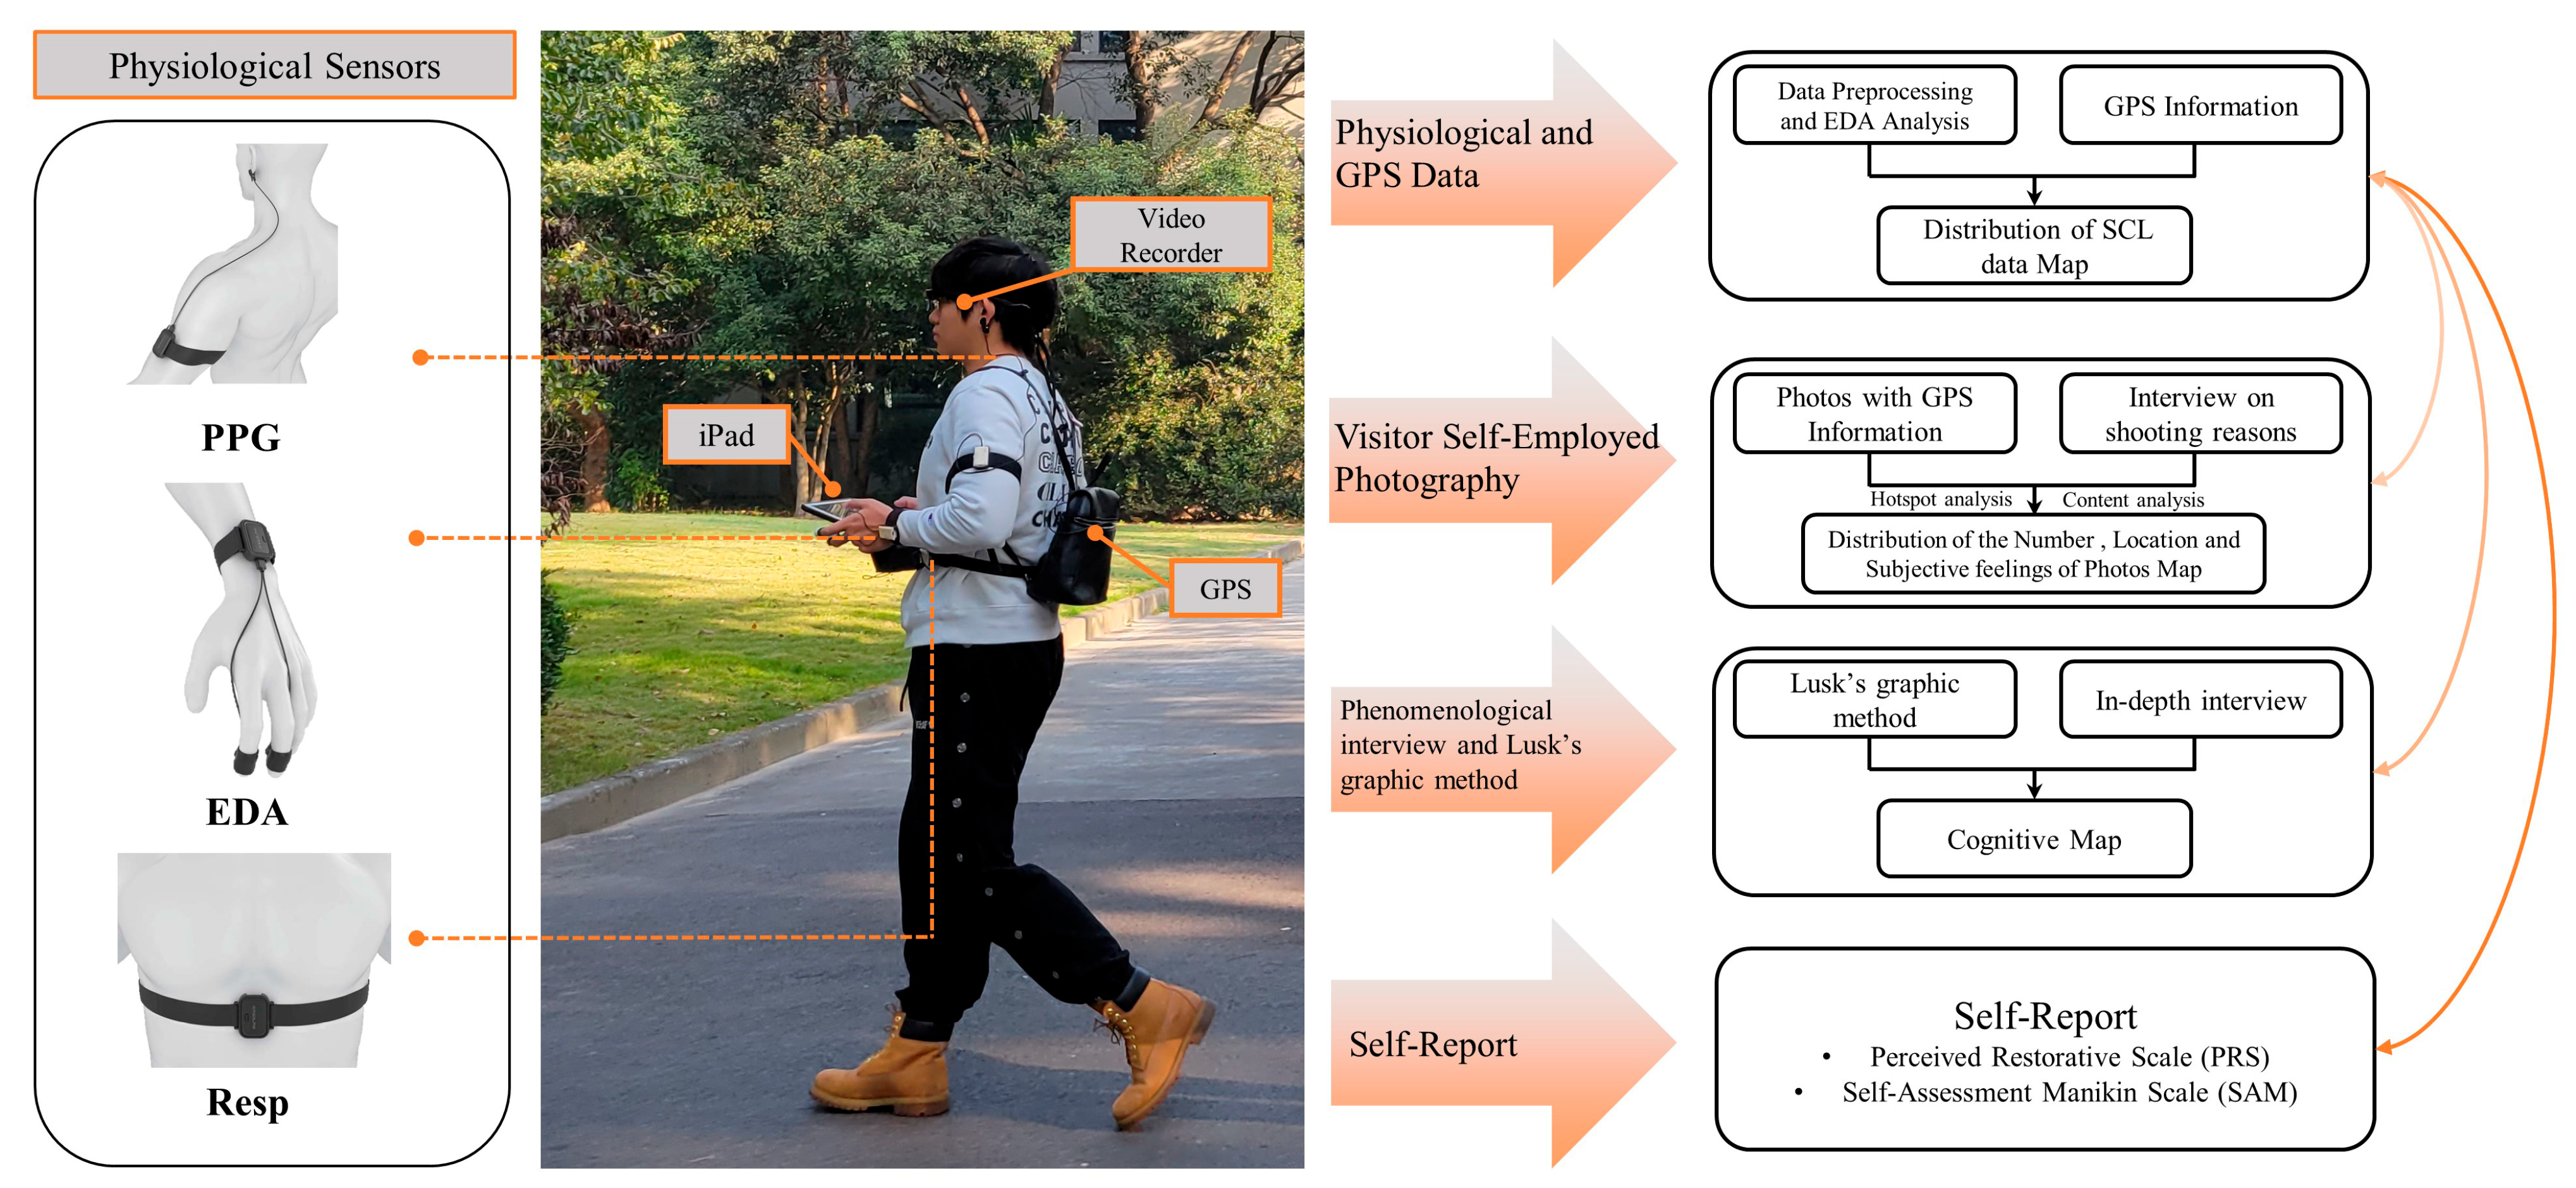
2.4.1. Biosensing Measures
- The pulse wave (PPG): monitored by a sensor located at earlobe with 2048 Hz sampling rate.
- Skin conductance (SC): measured by two sensors on fingers with 256 Hz sampling rate.
- Respiration (Resp): measured at abdomen with 2048 Hz sampling rate.
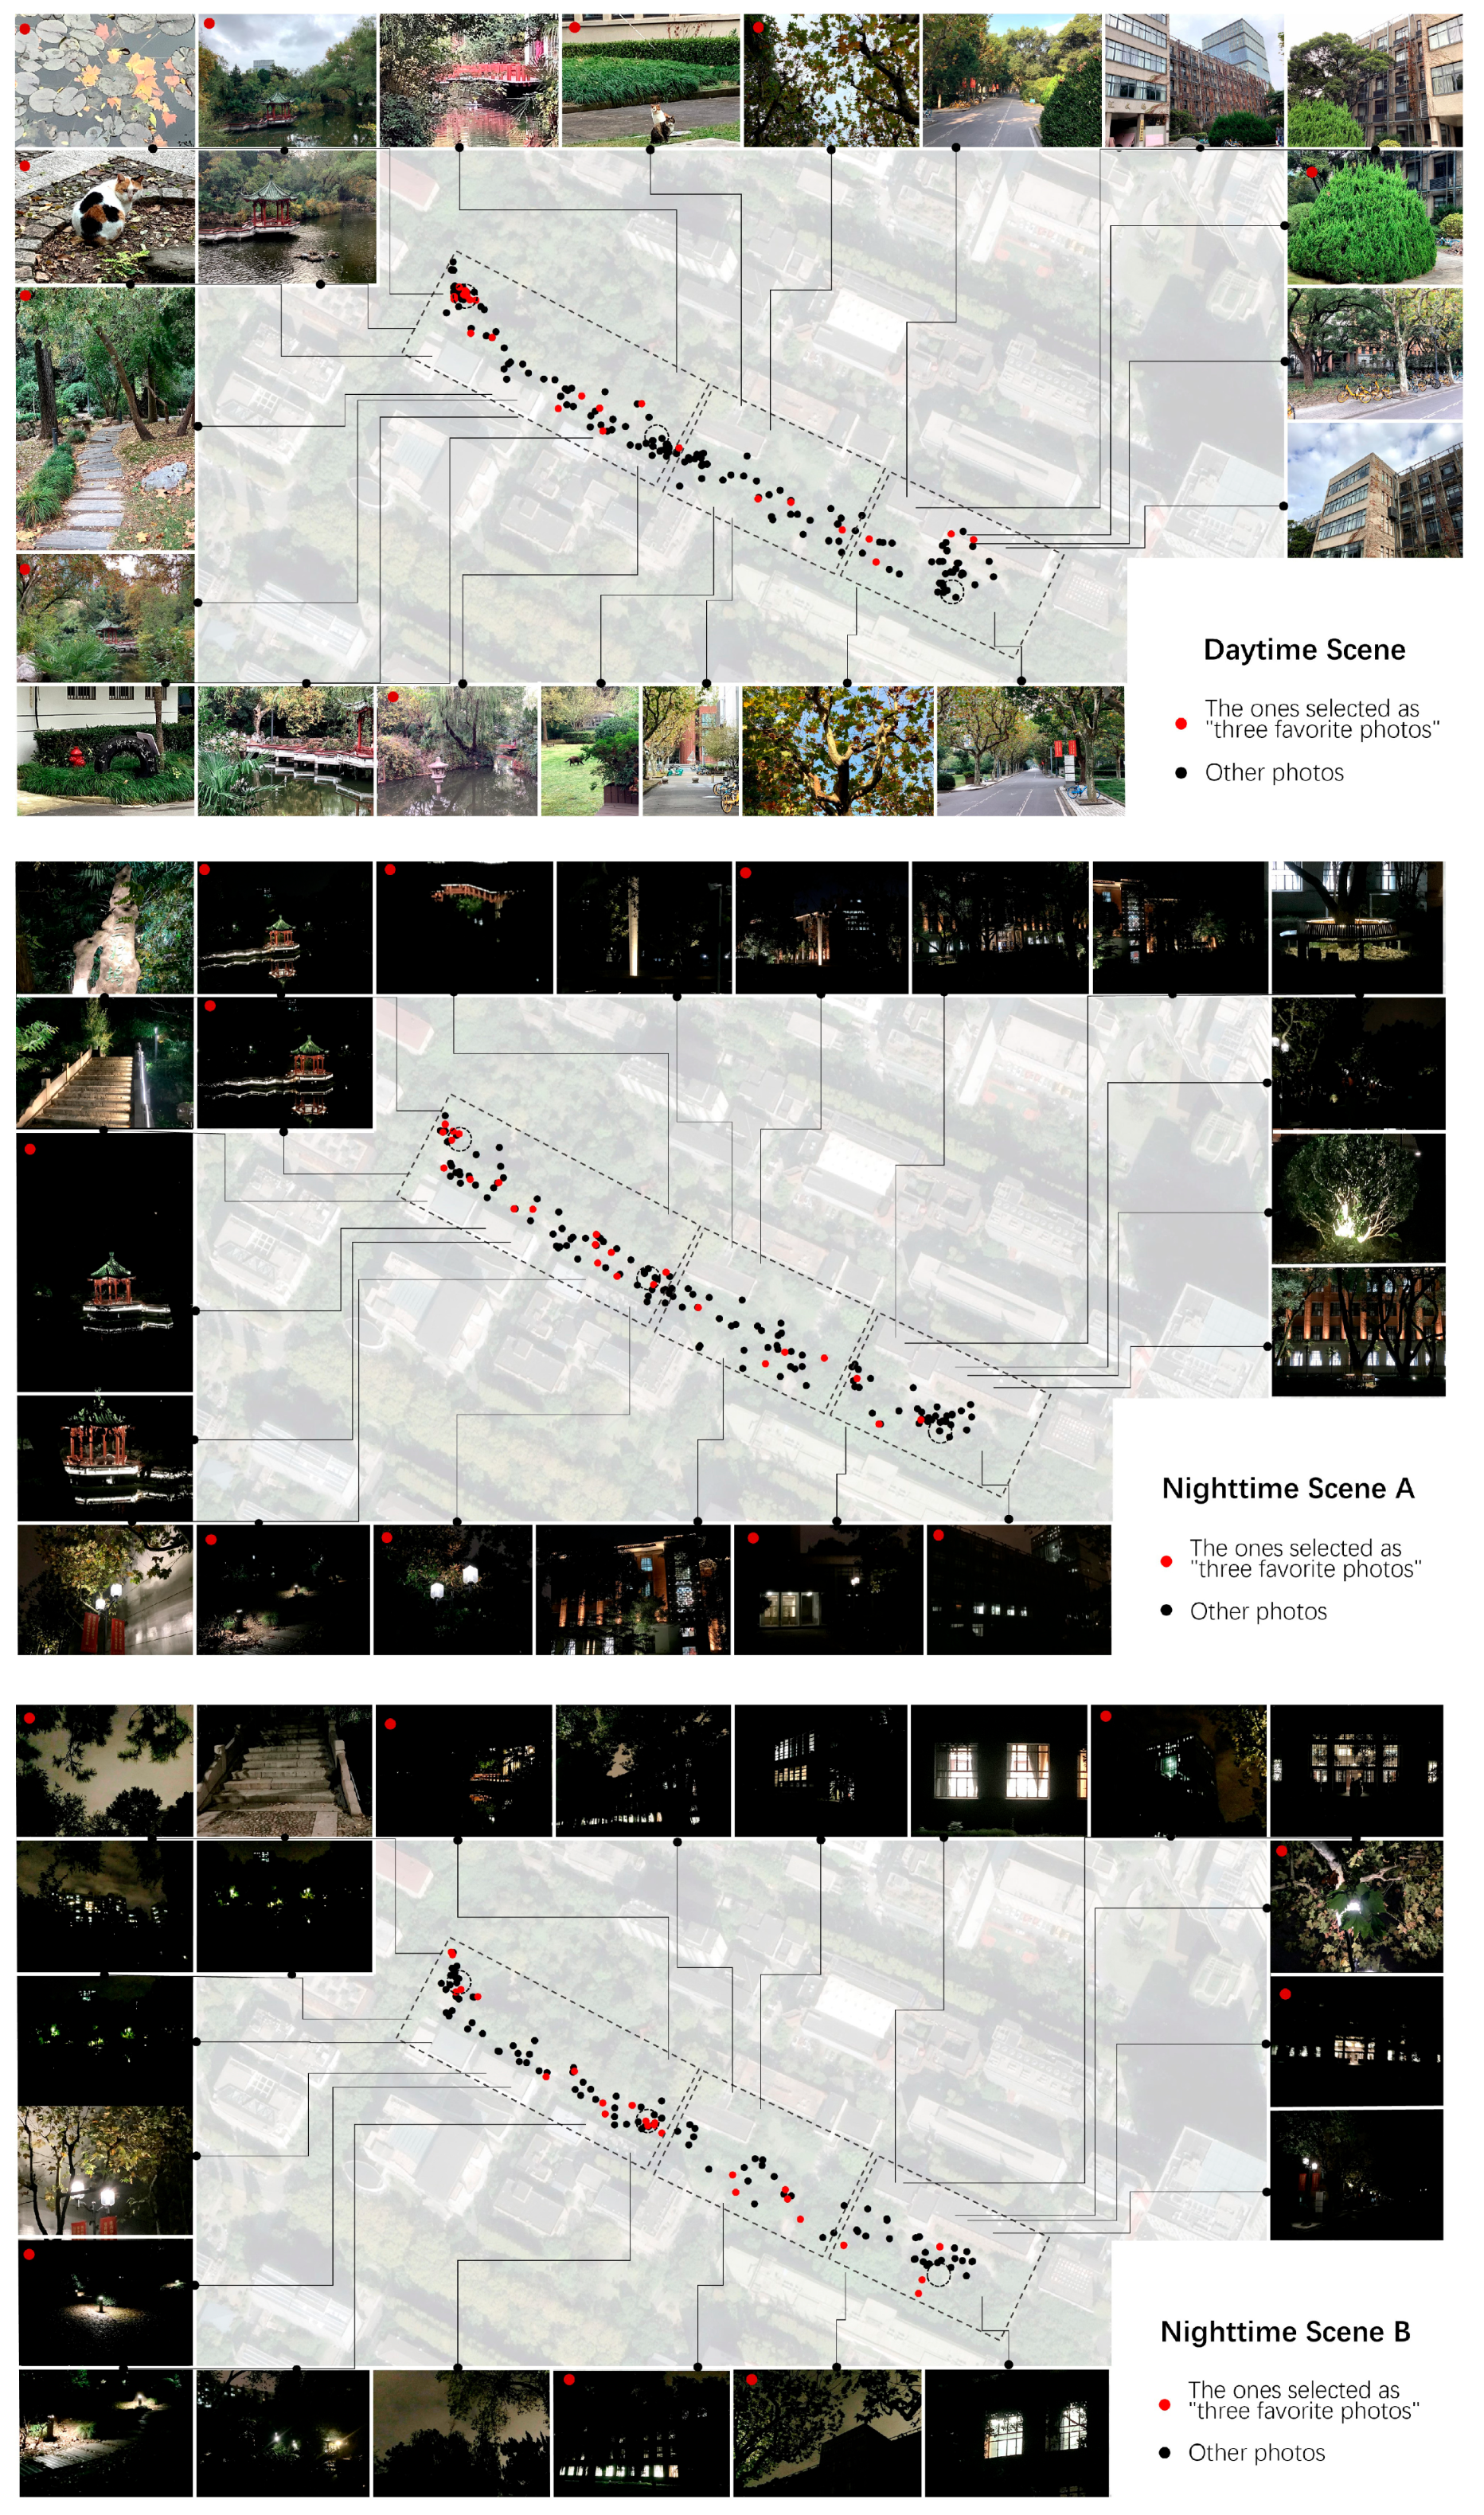
2.4.2. Visitor-Employed Photography
- (1)
- Hot spot analysis (HS): Participants’ exploration time and number of photographs taken were statistically compared across the three scenarios. Kernel density analysis was then applied to identify Perceptually Exciting Nodes (PENs).
- (2)
- Content Analysis (CA): The photographs and corresponding perceptual descriptions from interviews were analyzed using text coding methods to classify the photos and associated perceptions.
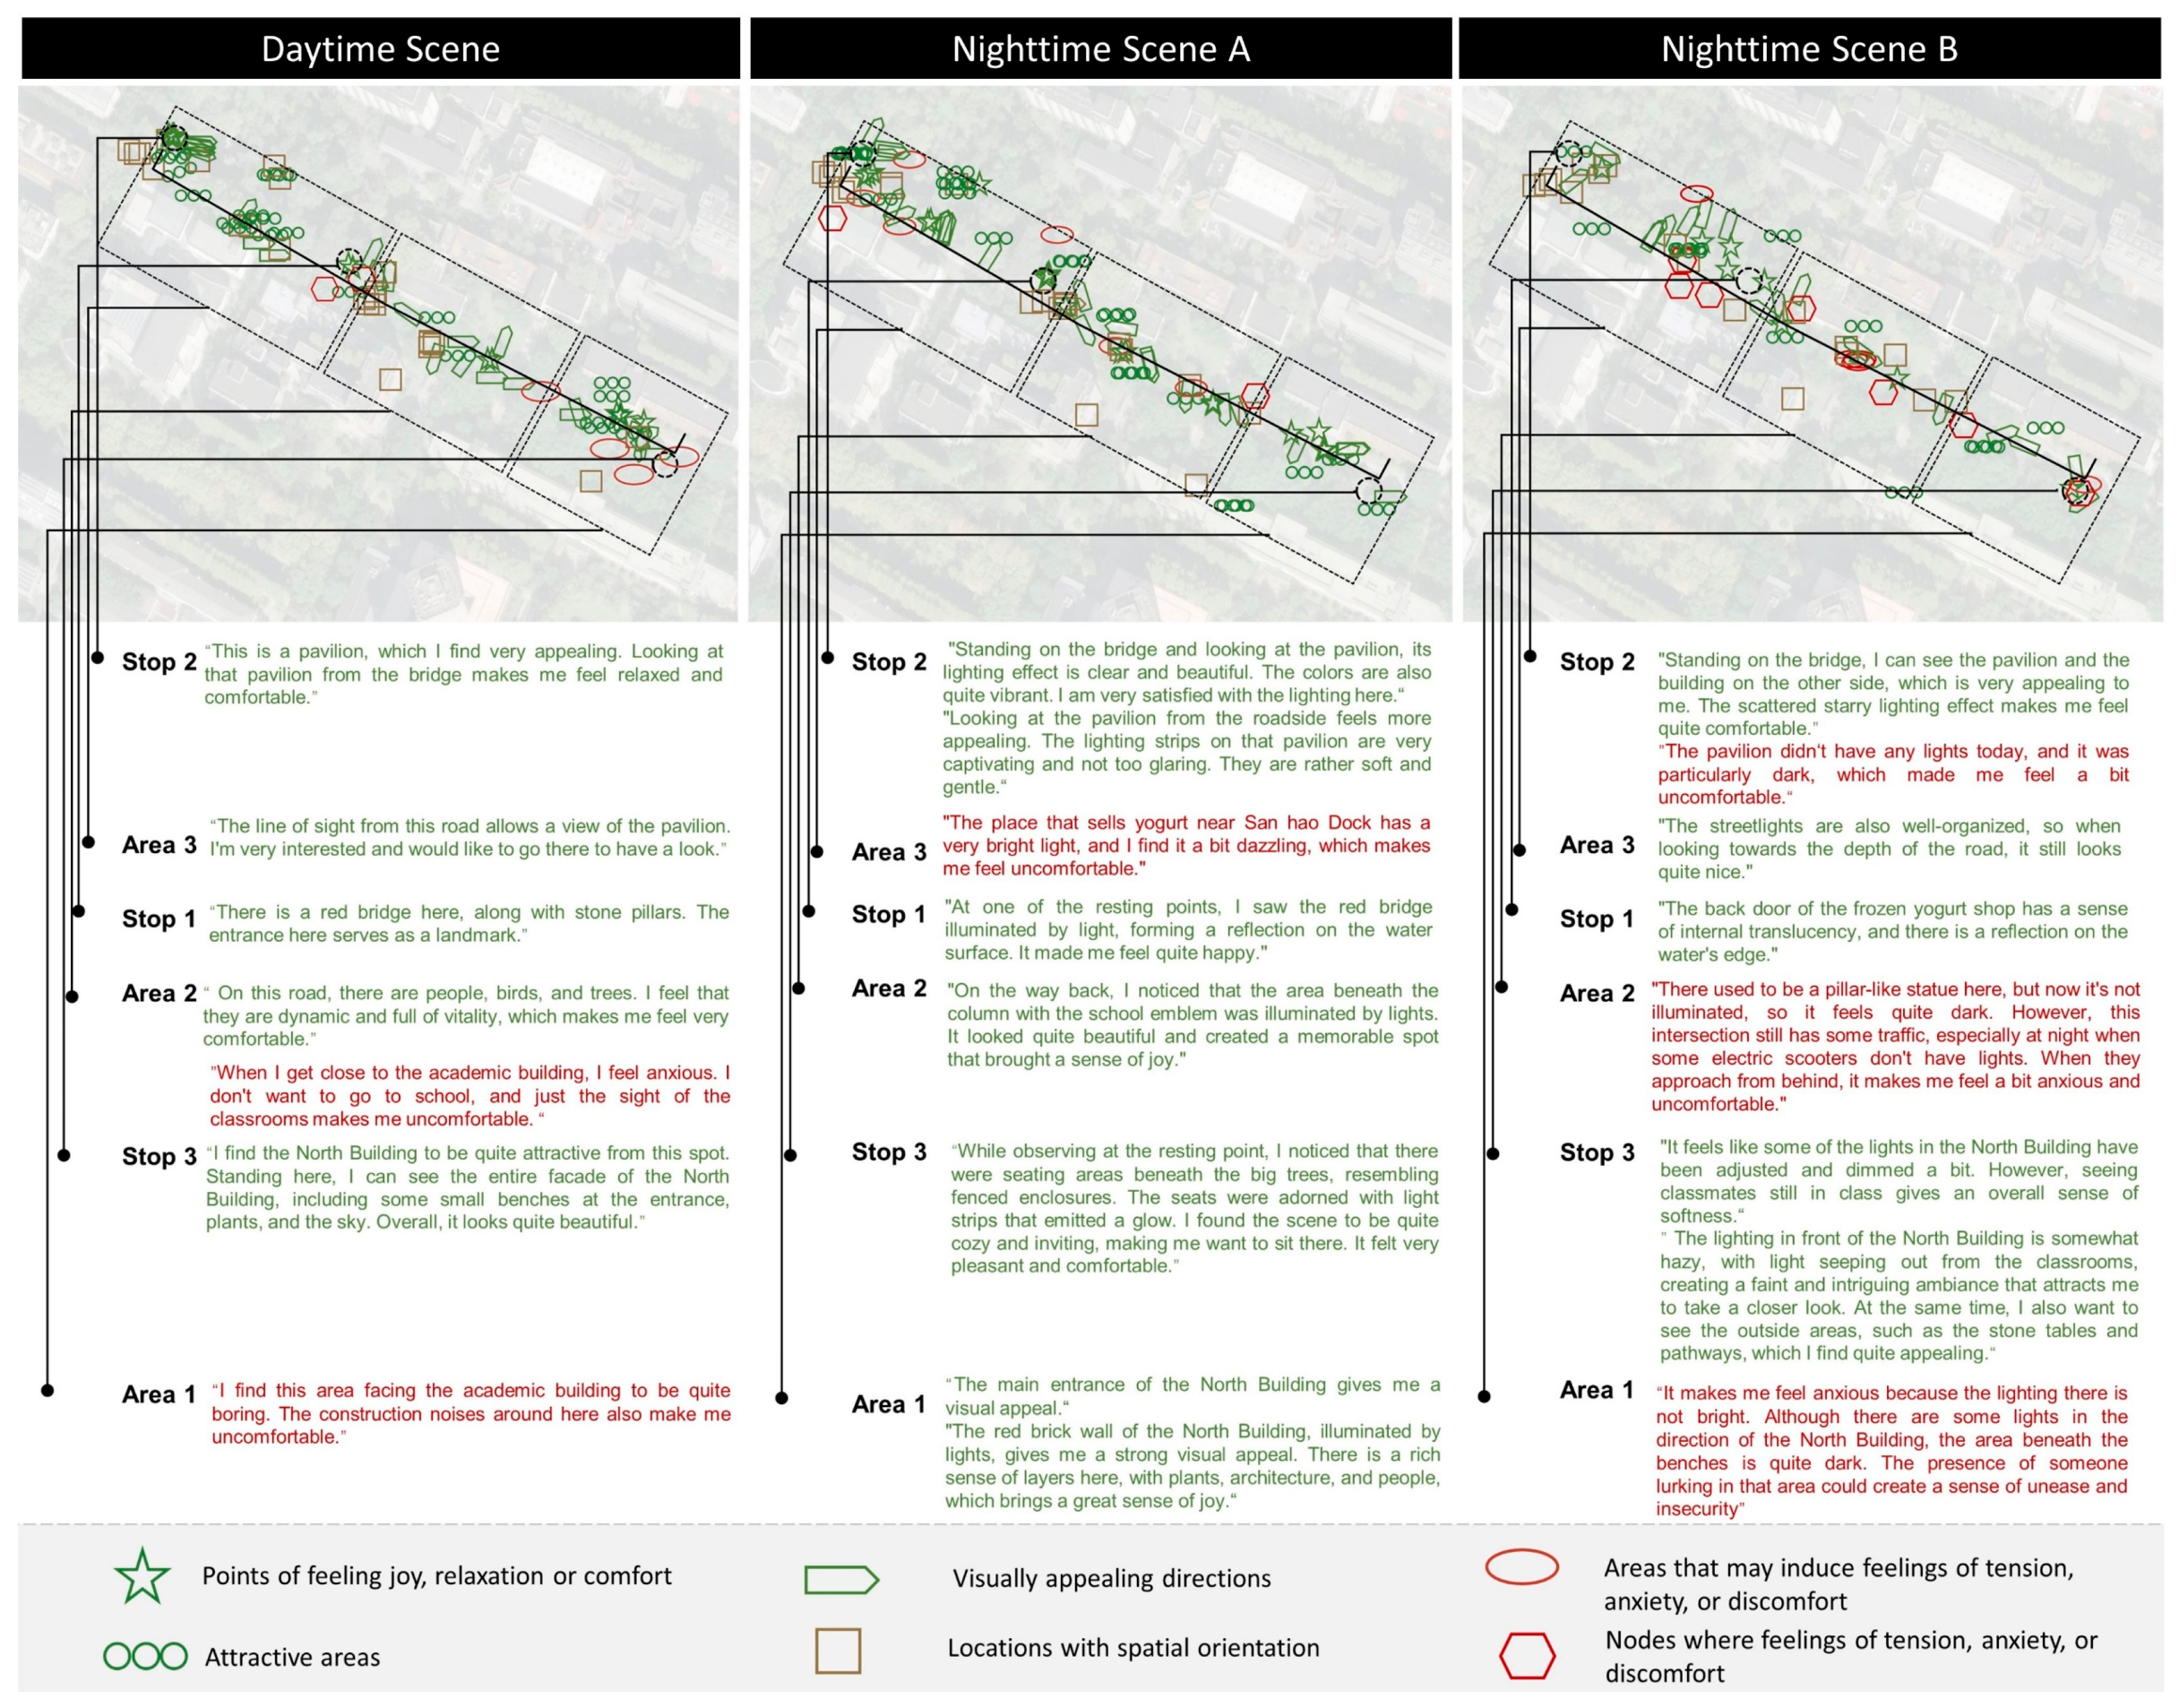
2.4.3. Phenomenological Interview and Lusk’s Graphic Method
2.4.4. Self-Report
3. Results
3.1. Skin Conductance Measures
3.2. Phenomenological Interview and Lusk’s Graphic Method
3.3. Visitor-Employed Photography
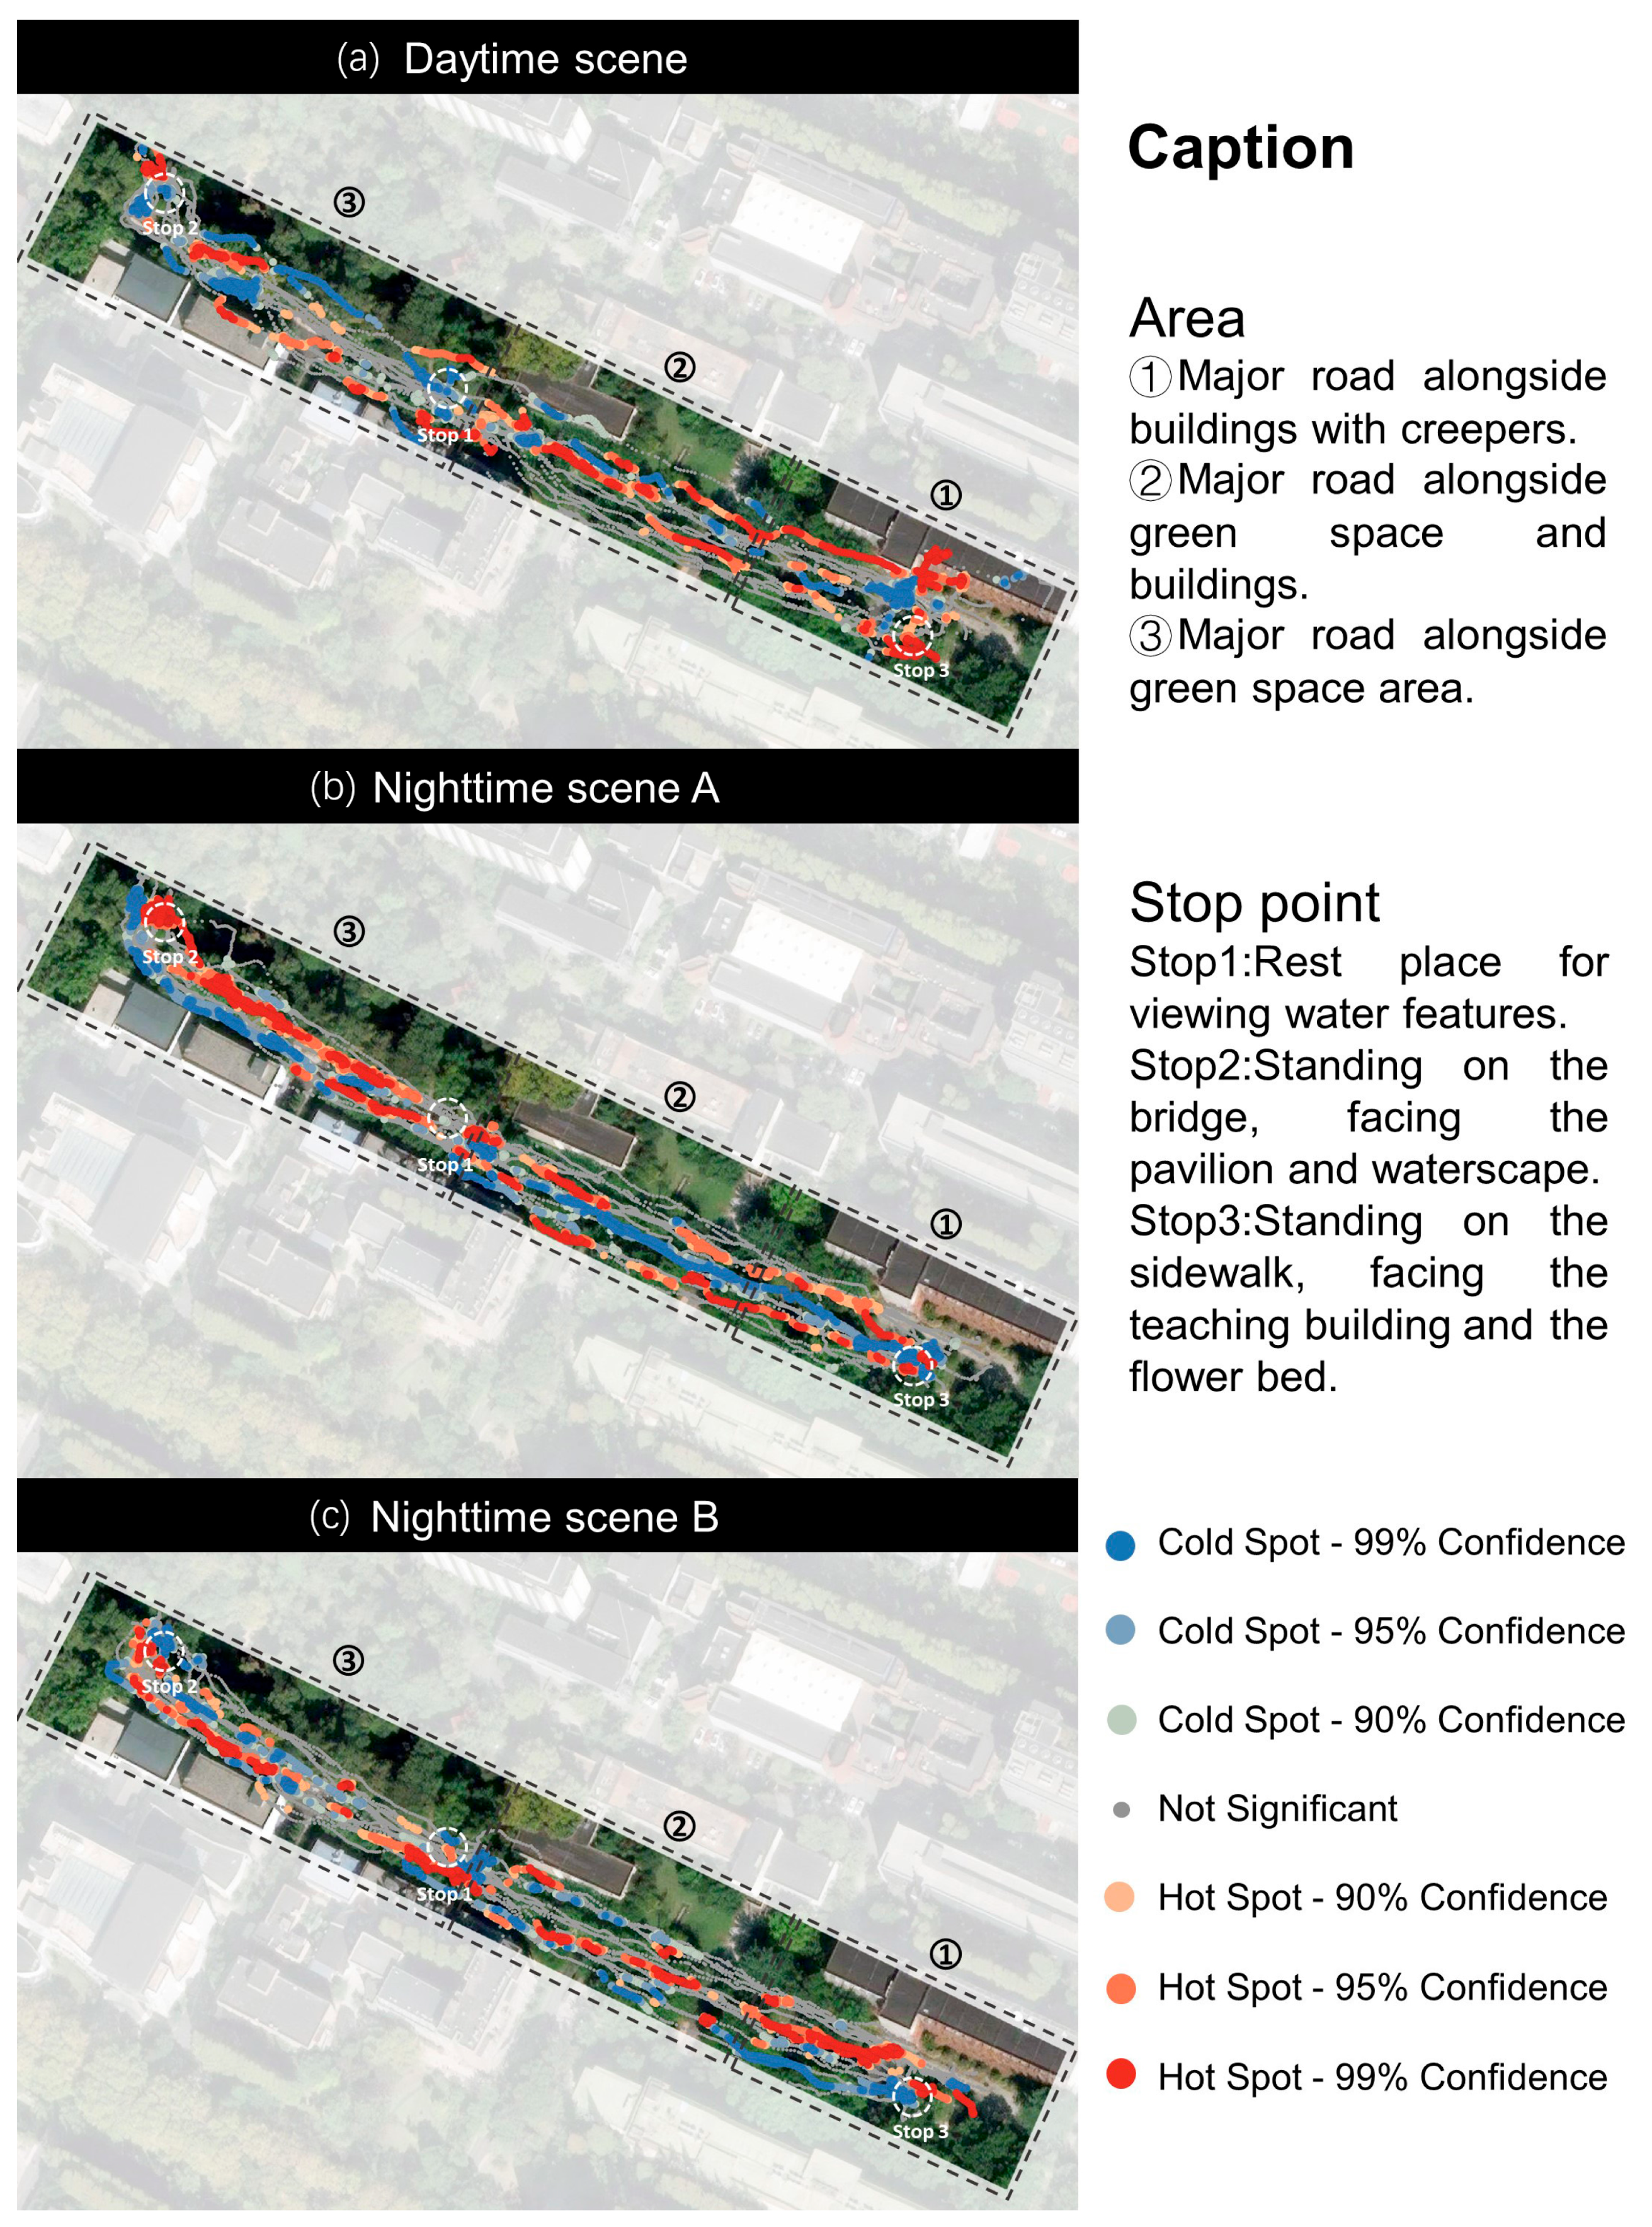
3.3.1. Hot Spot Analysis
3.3.2. Content Analysis
- (1)
- Comprehensive Visual Perception Photos reflect the participants’ perception of specific campus locations. The category is further divided into the following:
“The yellow leaves scattered among the green ones look beautiful. The sky isn’t very blue, but I find the background color quite appealing”.(Daytime Scene, Participant 7)
“The lighting on the steps evokes a sense of tranquility and comfort, with the overall scene appearing bright and inviting”.(Nighttime Scene A, Participant 1)
- (2)
- Emotional Response Photos capture the participants’ emotional associations with scenes that are not directly tied to the physical attributes of the scene but are analogously linked. For example, observing lush vegetation might evoke a sense of vitality and energy.
“This greenery is quite interesting; its round, plump shape is adorable, exuding vibrancy and an upward growth spirit”.(Daytime Scene, Participant 3)
- (3)
- Unique Observational Photos capture distinctive elements noticed by the participants during their walks, differing significantly from their daily experiences, such as uniquely designed signs.
“This billboard is innovative, cute, and quite interesting”.(Daytime Scene, Participant 5)
- (4)
- Imaginative and Reflective Photos refer to images that stimulate the participants’ imagination or evoke personal memories. For example, the warm, dim glow of light through a window at night might recall cozy family gatherings by the fireplace.
“This light makes me feel very cozy; it’s dim but not gloomy, just very serene. It reminds me of sitting by the fireplace with family gathered around”.(Nighttime Scene B, Participant 2)
3.4. Self-Report
3.4.1. PRS
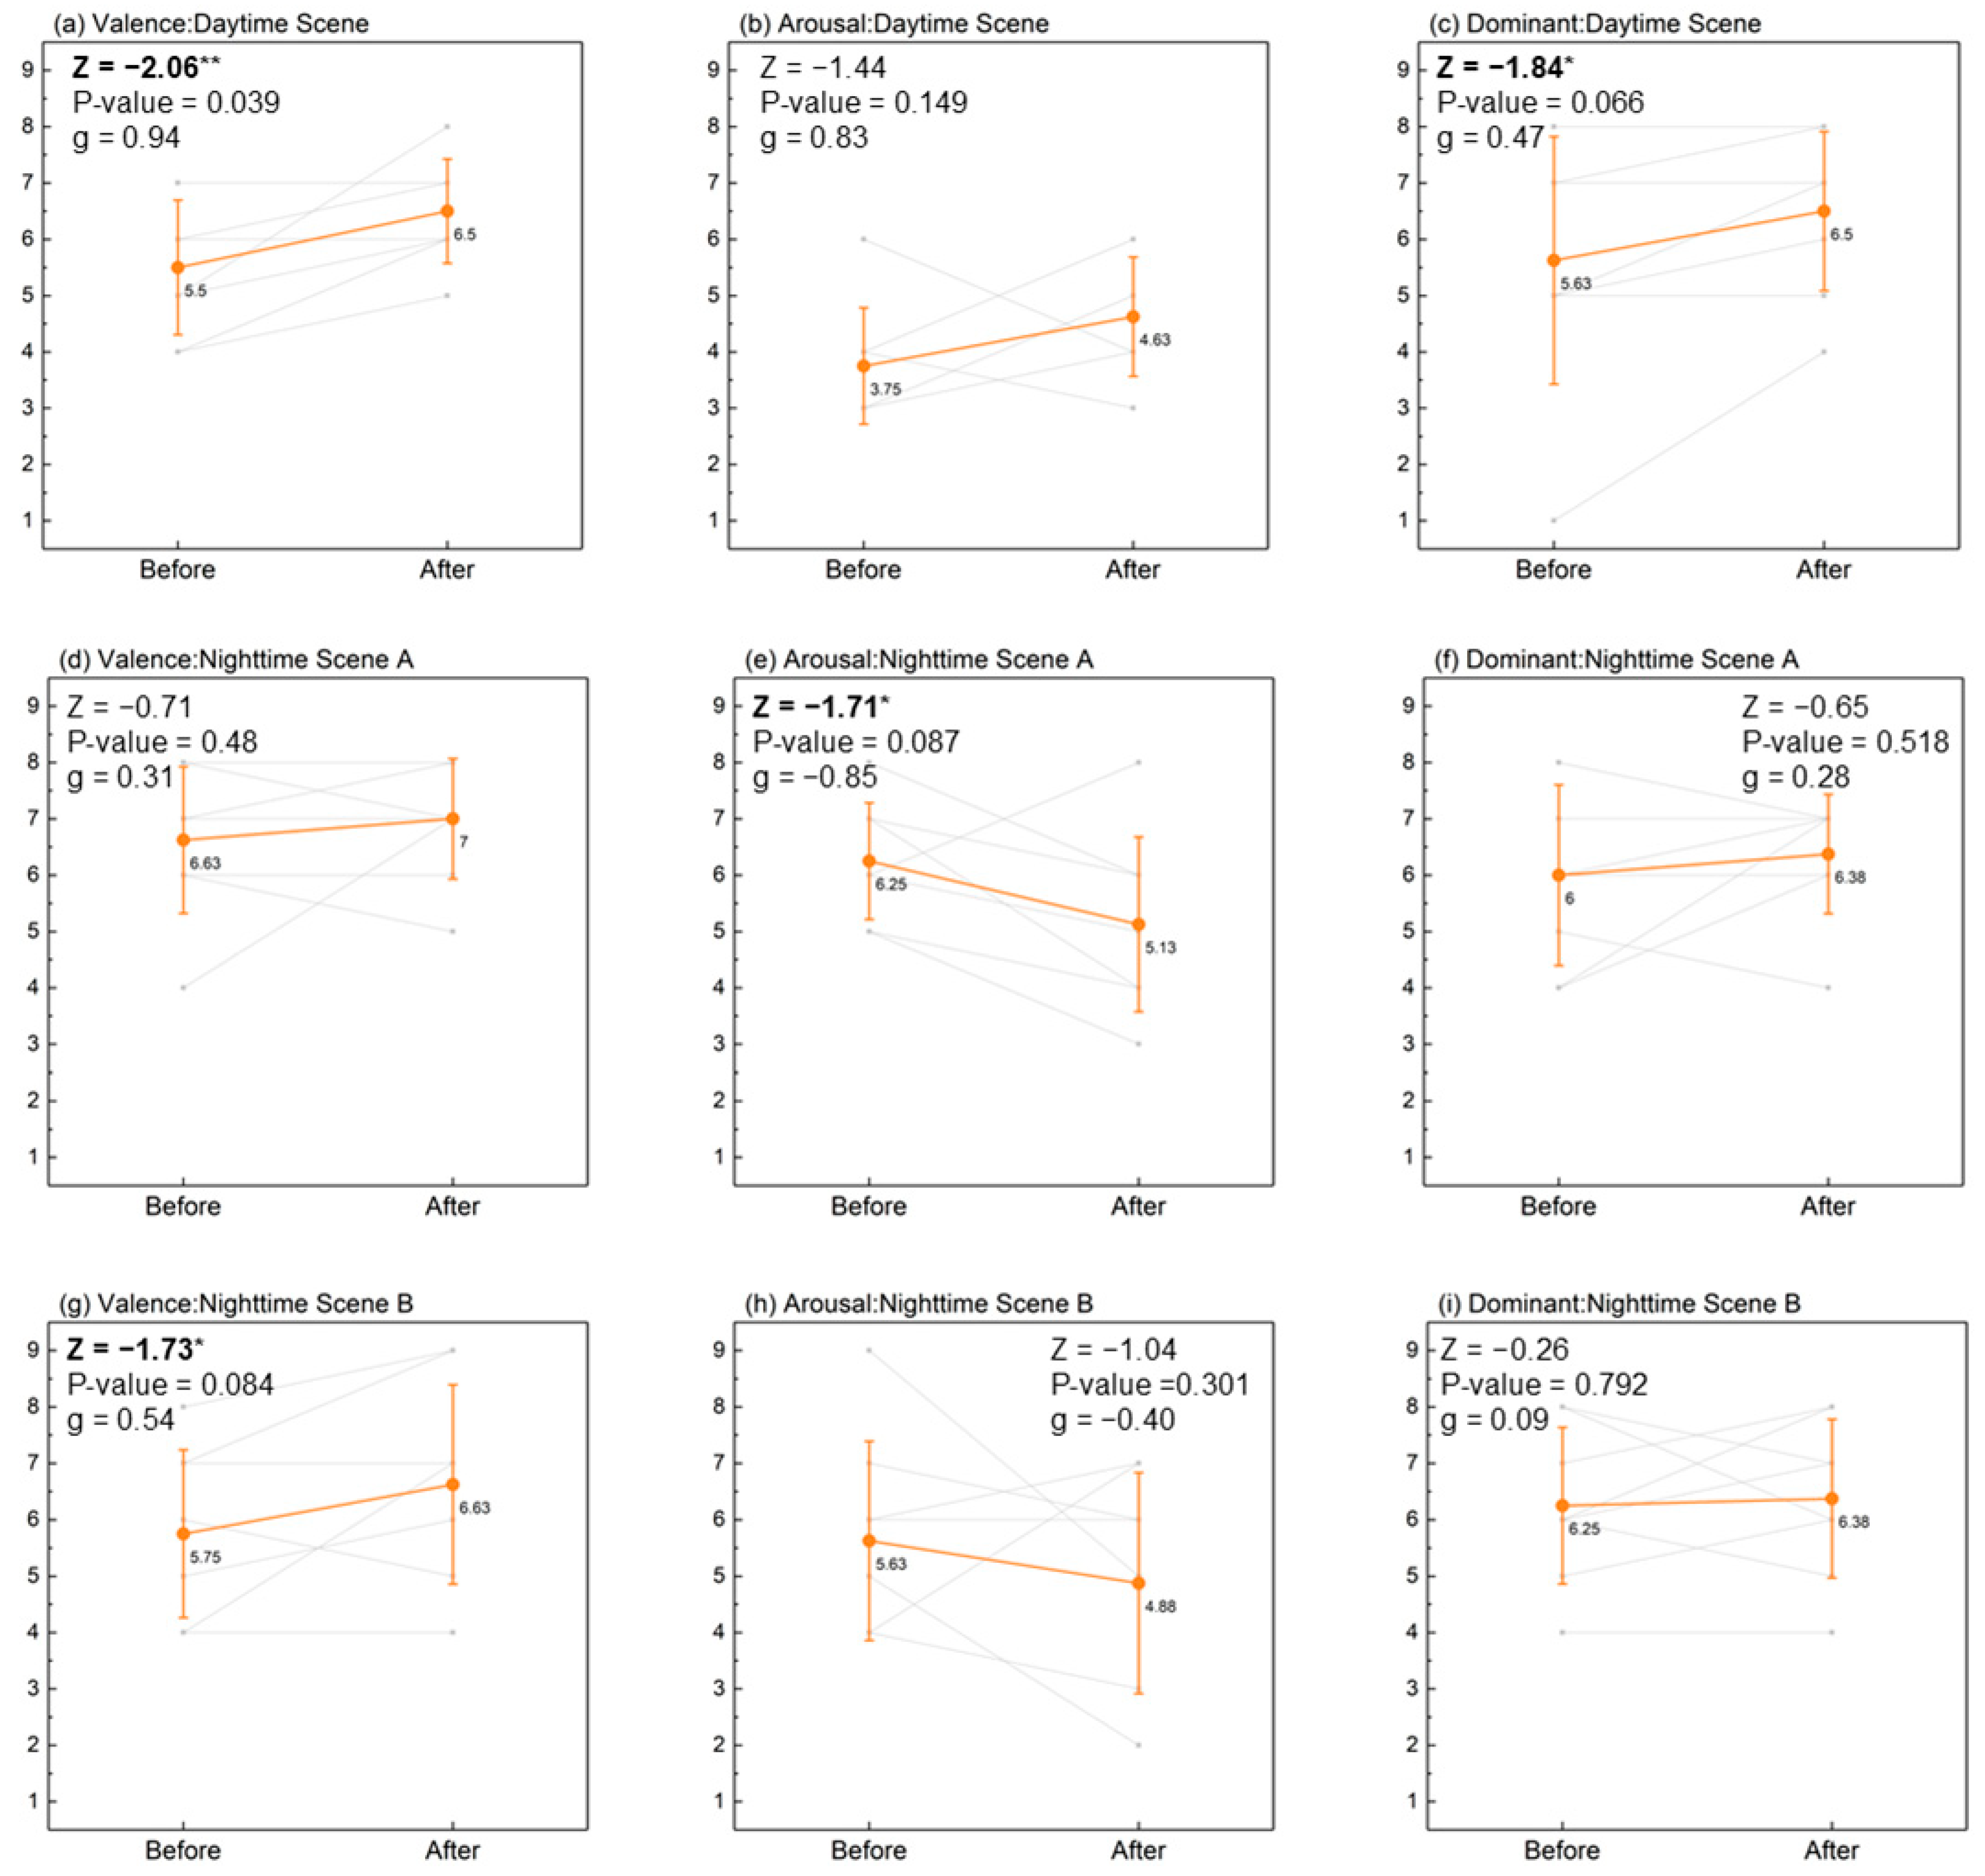
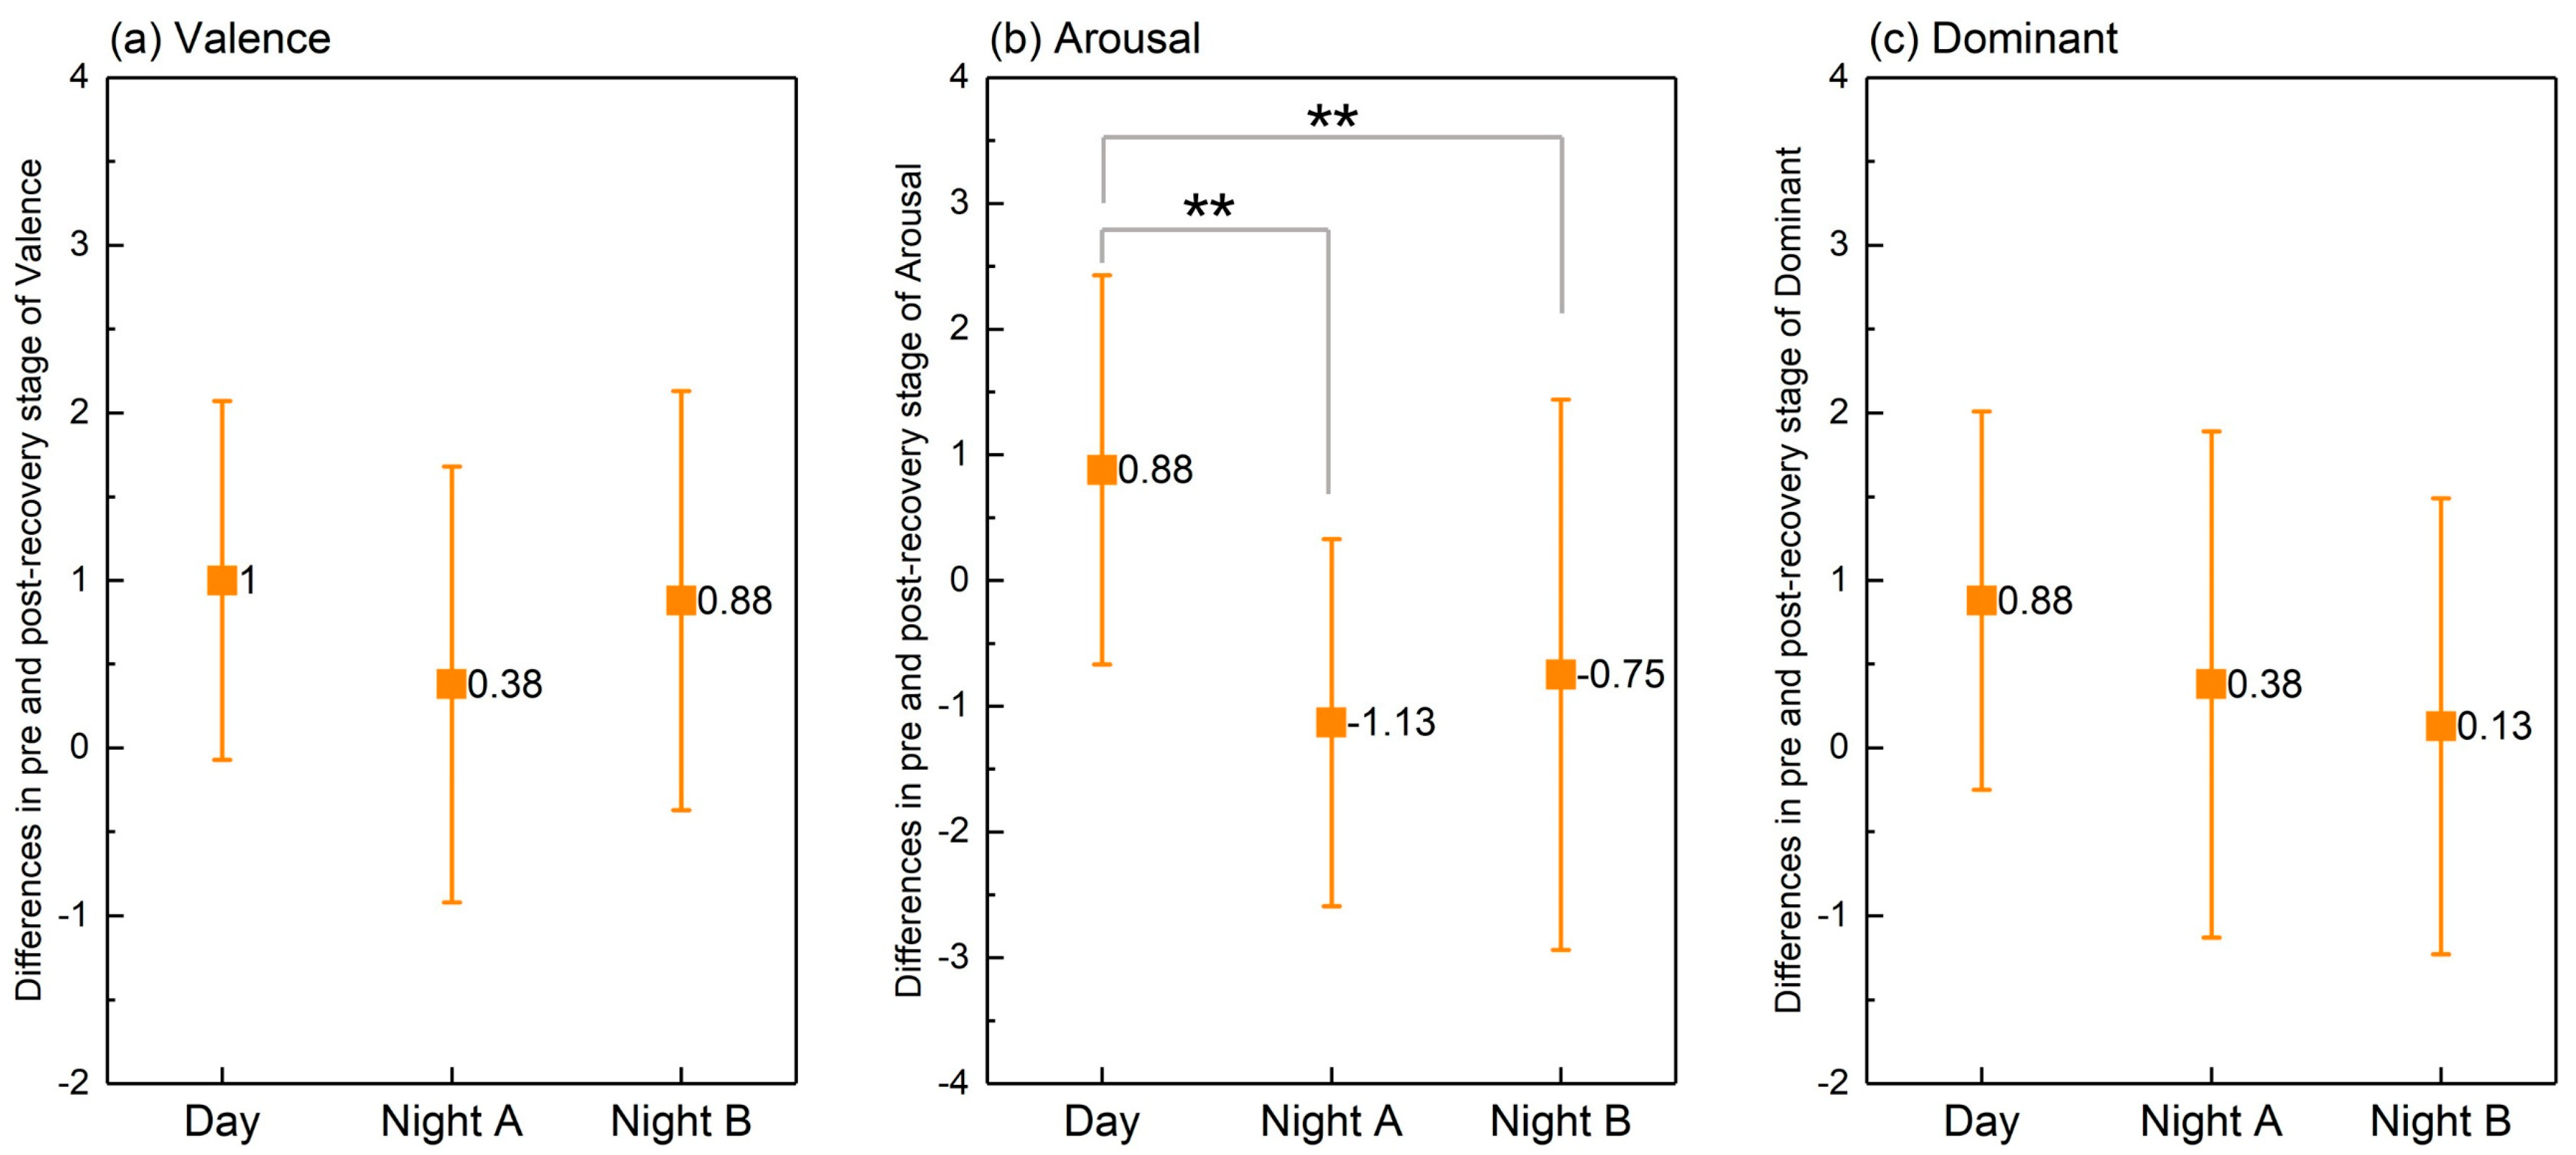
3.4.2. SAM Scale
3.5. Integrated Analysis of SCL Measurement and Two Traditional Methods
- (1)
- Emotional Patterns Along the Walking Path
- (2)
- Comparisons of Stopping Points
- (1)
- Emotional State Before and After Adding Landscape Lighting:Comparing nighttime scene A and nighttime scene B showed that adding landscape lighting improved both the valence and arousal. At Stop 1, where only downlights were installed, the lighting change was minimal, and no significant differences were observed. At Stop 2 and 3, the landscape lighting increased arousal (from cold to hot spots), and improved valence (fewer negative and more positive labels).
- (2)
- Emotional State Between Daytime Scene and Nighttime Scene A:At Stop 2, the landscape lighting significantly increased arousal compared to that in the daytime, while valence remained positive without significant changes. The results from in-depth interviews revealed that the emotional enhancement was attributed to the pavilion’s landscape lighting at Stop 2, which increased the scene’s attractiveness. At Stop 3, compared to the daytime, nighttime scene A showed fewer hot spots (indicating less stress) and more positive labels (reflecting improved valence).

4. Discussion
4.1. Relationship Between Outdoor Environmental Features and Emotional Response
4.2. Impact of Nighttime Lighting Design on Emotion and Restorative Perception
4.3. Causes of Differences in Perceptions of Daytime and Nighttime Landscapes
4.4. Limitations
4.5. Future Research
5. Conclusions
- (1)
- An examination of the impact of different lighting scenarios on emotional and restorative perceptions:The findings revealed that nighttime scene A (with landscape lighting) scored higher on the PRS compared to other scenarios, indicating a greater restorative potential, while the SAM scale showed a significant decrease in arousal levels after walking in nighttime scene A, suggesting a calmer emotional state. The SCL measurements further demonstrated that the addition of landscape lighting enhanced positive emotions, though it also increased arousal levels in some cases. The phenomenological interviews and Lusk’s graphic method supported these results, showing that both the daytime scene and nighttime scene A evoked more positive responses compared to nighttime scene B (with street lighting only), and in certain cases, well-designed campus landscape lighting even surpassed the restorative potential of daytime spaces.
- (2)
- The proposal of a novel approach to evaluate the effect of campus lighting environments combined with multi-source data:By integrating SCL measurements, self-report tools, and Lusk’s graphic method, this study expands traditional evaluation approaches and develops a novel framework for assessing daytime and nighttime environments from an emotional perspective. This method enhances the evaluation of emotional and restorative perceptions and provides a new theoretical foundation for understanding the psychological impacts of lighting. The framework has broad potential for evaluating nighttime lighting quality, offering a practical tool for designing emotionally supportive campus environments.
- (3)
- Elucidation of the differences between and causes of emotional and restorative perceptions in daytime and nighttime scenarios:Based on the mixed-method approach, this study revealed that the factors influencing the participants’ emotional perceptions of daytime and nighttime landscapes primarily included the overall environmental brightness, color and light perception, visual element exposure, and visual acuity. To enhance the positive emotional and restorative impacts of nighttime landscapes on college students, improvements can be made by illuminating positive elements (e.g., natural landscapes and architectural features) and reducing glare.
Supplementary Materials
Author Contributions
Funding
Institutional Review Board Statement
Data Availability Statement
Acknowledgments
Conflicts of Interest
Abbreviations
| Attention Restoration Theory | ART |
| Stress Reduction Theory | SRT |
| Evidence-Based Design | EBD |
| Self-Rating Anxiety Scale | SAS |
| Self-Rating Depression Scale | SDS |
| Morningness-Eveningness Questionnaire | MEQ |
| Electrodermal Activity | EDA |
| Skin conductance level | SCL |
| Perceived Restorativeness Scale | PRS |
| Self-Assessment Manikin Emotion scale | SAM |
| Hot Spot | HS |
| Perceptually Exciting Node | PEN |
| Content Analysis | CA |
References
- Casey, S.M.; Varela, A.; Marriott, J.P.; Coleman, C.M.; Harlow, B.L. The Influence of Diagnosed Mental Health Conditions and Symptoms of Depression and/or Anxiety on Suicide Ideation, Plan, and Attempt among College Students: Findings from the Healthy Minds Study, 2018–2019. J. Affect. Disord. 2022, 298, 464–471. [Google Scholar] [CrossRef]
- Conteh, I.; Yan, J.; Dovi, K.S.; Bajinka, O.; Massey, I.Y.; Turay, B. Prevalence and Associated Influential Factors of Mental Health Problems among Chinese College Students during Different Stages of COVID-19 Pandemic: A Systematic Review. Psychiatry Res. Commun. 2022, 2, 100082. [Google Scholar] [CrossRef] [PubMed]
- Li, D.; Sullivan, W.C. Impact of Views to School Landscapes on Recovery from Stress and Mental Fatigue. Landsc. Urban. Plan. 2016, 148, 149–158. [Google Scholar] [CrossRef]
- Li, H.; Du, J.; Chow, D. Perceived Environmental Factors and Students’ Mental Wellbeing in Outdoor Public Spaces of University Campuses: A Systematic Scoping Review. Build. Environ. 2024, 265, 112023. [Google Scholar] [CrossRef]
- Chen, Z.; Schulz, S.; Qiu, M.; Yang, W.; He, X.; Wang, Z.; Yang, L. Assessing Affective Experience of In-Situ Environmental Walk via Wearable Biosensors for Evidence-Based Design. Cogn. Syst. Res. 2018, 52, 970–977. [Google Scholar] [CrossRef]
- Lusk, A.C. Guidelines for Greenways: Determining the Distance to, Features of, and Human Needs Met by Destinations on Multi-Use Corridors; University of Michigan: Ann Arbor, MI, USA, 2002. [Google Scholar]
- Birenboim, A.; Dijst, M.; Scheepers, F.E.; Poelman, M.P.; Helbich, M. Wearables and Location Tracking Technologies for Mental-State Sensing in Outdoor Environments. Prof. Geogr. 2019, 71, 449–461. [Google Scholar] [CrossRef]
- Bolouki, A. Exploring the Association between Self-Reported and Objective Measures in Search of the Restorative Quality of Natural Environments: A Systematic Review. Int. J. Environ. Health Res. 2023, 33, 1316–1330. [Google Scholar] [CrossRef]
- Zhang, Z.; Amegbor, P.M.; Sigsgaard, T.; Sabel, C.E. Assessing the Association between Urban Features and Human Physiological Stress Response Using Wearable Sensors in Different Urban Contexts. Health Place. 2022, 78, 102924. [Google Scholar] [CrossRef]
- Buizza, C.; Bazzoli, L.; Ghilardi, A. Changes in College Students Mental Health and Lifestyle During the COVID-19 Pandemic: A Systematic Review of Longitudinal Studies. Adolesc. Res. Rev. 2022, 7, 537–550. [Google Scholar] [CrossRef]
- Salimi, N.; Gere, B.; Talley, W.; Irioogbe, B. College Students Mental Health Challenges: Concerns and Considerations in the COVID-19 Pandemic. J. Coll. Stud. Psychother. 2023, 37, 39–51. [Google Scholar] [CrossRef]
- Gao, L.; Xie, Y.; Jia, C.; Wang, W. Prevalence of Depression among Chinese University Students: A Systematic Review and Meta-Analysis. Sci. Rep. 2020, 10, 15897. [Google Scholar] [CrossRef] [PubMed]
- Yang, X.; Geng, Y. Corona Virus Anxiety and Chinese Students’ Cognitive, Affective, and Behavioral Engagement, and Academic Resilience: Correlations and Perceptions. BMC Psychol. 2024, 12, 107. [Google Scholar] [CrossRef] [PubMed]
- Beemer, C.J.; Stearns-Yoder, K.A.; Schuldt, S.J.; Kinney, K.A.; Lowry, C.A.; Postolache, T.T.; Brenner, L.A.; Hoisington, A.J. A Brief Review on the Mental Health for Select Elements of the Built Environment. Indoor Built Environ. 2021, 30, 152–165. [Google Scholar] [CrossRef]
- Kaplan, S. The Restorative Benefits of Nature: Toward an Integrative Framework. J. Environ. Psychol. 1995, 15, 169–182. [Google Scholar] [CrossRef]
- Ulrich, R.S.; Simons, R.F.; Losito, B.D.; Fiorito, E.; Miles, M.A.; Zelson, M. Stress Recovery during Exposure to Natural and Urban Environments. J. Environ. Psychol. 1991, 11, 201–230. [Google Scholar] [CrossRef]
- Russell, J.A. A Circumplex Model of Affect. J. Personal. Social. Psychol. 1980, 39, 1161–1178. [Google Scholar] [CrossRef]
- Yerkes, R.M.; Dodson, J.D. The Relation of Strength of Stimulus to Rapidity of Habit Formation. J. Comp. Neurol. Psychol. 1908, 18, 459–482. [Google Scholar] [CrossRef]
- Kaplan, R.; Kaplan, S. The Experience of Nature: A Psychological Perspective; The experience of nature: A psychological perspective; Cambridge University Press: New York, NY, USA, 1989; p. 340. ISBN 0-521-34139-6. [Google Scholar]
- Komossa, F.; Wartmann, F.M.; Kienast, F.; Verburg, P.H. Comparing Outdoor Recreation Preferences in Peri-Urban Landscapes Using Different Data Gathering Methods. Landsc. Urban. Plan. 2020, 199, 103796. [Google Scholar] [CrossRef]
- Kweon, B.-S.; Ellis, C.D.; Lee, J.; Jacobs, K. The Link between School Environments and Student Academic Performance. Urban. For. Urban. Green. 2017, 23, 35–43. [Google Scholar] [CrossRef]
- Van den Bogerd, N.; Coosje Dijkstra, S.; Koole, S.L.; Seidell, J.C.; de Vries, R.; Maas, J. Nature in the Indoor and Outdoor Study Environment and Secondary and Tertiary Education Students’ Well-Being, Academic Outcomes, and Possible Mediating Pathways: A Systematic Review with Recommendations for Science and Practice. Health Place. 2020, 66, 102403. [Google Scholar] [CrossRef]
- Mason, L.; Ronconi, A.; Scrimin, S.; Pazzaglia, F. Short-Term Exposure to Nature and Benefits for Students’ Cognitive Performance: A Review. Educ. Psychol. Rev. 2022, 34, 609–647. [Google Scholar] [CrossRef]
- Hajrasouliha, A. Campus Score: Measuring University Campus Qualities. Landsc. Urban. Plan. 2017, 158, 166–176. [Google Scholar] [CrossRef]
- Chen, J.; Shi, H.; Pan, W.; Sun, D. Characterizing the Supportive Environment of Informal Spaces on Cold Region University Campuses to Enhance Social Interaction Behavior. Buildings 2024, 14, 1529. [Google Scholar] [CrossRef]
- Jiang, M.; Hassan, A.; Chen, Q.; Liu, Y. Effects of Different Landscape Visual Stimuli on Psychophysiological Responses in Chinese Students. Indoor Built Environ. 2020, 29, 1006–1016. [Google Scholar] [CrossRef]
- Baur, J. Campus Community Gardens and Student Health: A Case Study of a Campus Garden and Student Well-Being. J. Am. Coll. Health 2022, 70, 377–384. [Google Scholar] [CrossRef]
- Zhang, P.; He, Q.; Chen, Z.; Li, X.; Ma, J. An Empirical Study on the Promotion of Students’ Physiological and Psychological Recovery in Green Space on Campuses in the Post-Epidemic Era. Int. J. Environ. Res. Public Health 2023, 20, 151. [Google Scholar] [CrossRef]
- Zheng, Z.; Chen, L.; Zeng, M.; Liu, W.; Chen, H. The Influence of Urban Campus Landscape on College Students’ Exercise Participation and Mental Health: An Approach Using Deep Learning and Street View Images. Int. J. Archit. Res. Archnet 2024, ahead of print. [Google Scholar] [CrossRef]
- Asim, F.; Chani, P.S.; Shree, V. Impact of COVID-19 Containment Zone Built-Environments on Students’ Mental Health and Their Coping Mechanisms. Build. Environ. 2021, 203, 108107. [Google Scholar] [CrossRef]
- Asim, F.; Chani, P.S.; Shree, V.; Rai, S. Restoring the Mind: A Neuropsychological Investigation of University Campus Built Environment Aspects for Student Well-Being. Build. Environ. 2023, 244, 110810. [Google Scholar] [CrossRef]
- Gulwadi, G.B.; Mishchenko, E.D.; Hallowell, G.; Alves, S.; Kennedy, M. The Restorative Potential of a University Campus: Objective Greenness and Student Perceptions in Turkey and the United States. Landsc. Urban. Plan. 2019, 187, 36–46. [Google Scholar] [CrossRef]
- Liu, Q.; Zhu, Z.; Zeng, X.; Zhuo, Z.; Ye, B.; Fang, L.; Huang, Q.; Lai, P. The Impact of Landscape Complexity on Preference Ratings and Eye Fixation of Various Urban Green Space Settings. Urban. For. Urban. Green. 2021, 66, 127411. [Google Scholar] [CrossRef]
- Wang, R.; Jiang, W.; Lu, T. Landscape Characteristics of University Campus in Relation to Aesthetic Quality and Recreational Preference. Urban. For. Urban. Green. 2021, 66, 127389. [Google Scholar] [CrossRef]
- He, H.; Zhang, T.; Zhang, Q.; Rong, S.; Jia, Y.; Dong, F. Exploring the Impact of Campus Landscape Visual Elements Combination on Short-Term Stress Relief among College Students: A Case from China. Buildings 2024, 14, 1340. [Google Scholar] [CrossRef]
- Foellmer, J.; Kistemann, T.; Anthonj, C. Academic Greenspace and Well-Being — Can Campus Landscape Be Therapeutic? Evidence from a German University. Wellbeing Space Soc. 2021, 2, 100003. [Google Scholar] [CrossRef]
- Zhang, J.; Li, Y. The Impact of Campus Outdoor Space Features on Students’ Emotions Based on the Emotion Map. Int. J. Environ. Res. Public Health 2023, 20, 4277. [Google Scholar] [CrossRef]
- Peng, Y.-L.; Li, Y.; Cheng, W.-Y.; Wang, K. Evaluation and Optimization of Sense of Security during the Day and Night in Campus Public Spaces Based on Physical Environment and Psychological Perception. Sustainability 2024, 16, 1256. [Google Scholar] [CrossRef]
- Jedon, R.; Haans, A.; de Kort, Y. Proposing a Research Framework for Urban Lighting: The Alertness, Arousal and Anxiety Triad. Light. Res. Technol. 2022, 14771535221122139. [Google Scholar] [CrossRef]
- Jedon, R.; Haans, A.; Kort, Y. de The Effect of Non-Uniform Urban Illumination upon Pedestrians’ Alertness and Sense of Safety. IOP Conf. Ser. Earth Environ. Sci. 2022, 1099, 012010. [Google Scholar] [CrossRef]
- Huang, H.; Zhang, B.; Cheng, J.; Sun, Y. Psychological and Visual Perception of Campus Lightscapes Based on Lightscape Walking Evaluation: A Case Study of Chongqing University in China. Buildings 2024, 14, 753. [Google Scholar] [CrossRef]
- Ashihara, Y. The Aesthetic Townscape; MIT Press: Cambridge, MA, USA, 1983; ISBN 978-0-262-01069-6. [Google Scholar]
- Ulrich, R. Biophilic Theory and Research for Healthcare Design. In Biophilic Design: The Theory, Science, and Practice of Bringing Buildings to Life; Wiley: Hoboken, NJ, USA, 2008; pp. 87–106. [Google Scholar]
- Aan het Rot, M.; Moskowitz, D.S.; Young, S.N. Exposure to Bright Light Is Associated with Positive Social Interaction and Good Mood over Short Time Periods: A Naturalistic Study in Mildly Seasonal People. J. Psychiatr. Res. 2008, 42, 311–319. [Google Scholar] [CrossRef]
- Boomsma, C.; Steg, L. Feeling Safe in the Dark: Examining the Effect of Entrapment, Lighting Levels, and Gender on Feelings of Safety and Lighting Policy Acceptability. Environ. Behav. 2014, 46, 193–212. [Google Scholar] [CrossRef]
- Johansson, M.; Pedersen, E.; Maleetipwan-Mattsson, P.; Kuhn, L.; Laike, T. Perceived Outdoor Lighting Quality (POLQ): A Lighting Assessment Tool. J. Environ. Psychol. 2014, 39, 14–21. [Google Scholar] [CrossRef]
- Johansson, M.; Rosén, M.; Küller, R. Individual Factors Influencing the Assessment of the Outdoor Lighting of an Urban Footpath. Light. Res. Technol. 2011, 43, 31–43. [Google Scholar] [CrossRef]
- Peña-García, A.; Hurtado, A.; Aguilar-Luzón, M.C. Considerations about the Impact of Public Lighting on Pedestrians’ Perception of Safety and Well-Being. Saf. Sci. 2016, 89, 315–318. [Google Scholar] [CrossRef]
- Rahm, J.; Johansson, M. Assessing the Pedestrian Response to Urban Outdoor Lighting: A Full-Scale Laboratory Study. PLoS ONE 2018, 13, e0204638. [Google Scholar] [CrossRef]
- Wänström Lindh, U.; Jägerbrand, A.K. Perceived Lighting Uniformity on Pedestrian Roads: From an Architectural Perspective. Energies 2021, 14, 3647. [Google Scholar] [CrossRef]
- Lis, A.; Zienowicz, M.; Kukowska, D.; Zalewska, K.; Iwankowski, P.; Shestak, V. How to Light up the Night? The Impact of City Park Lighting on Visitors’ Sense of Safety and Preferences. Urban. For. Urban. Green. 2023, 89, 128124. [Google Scholar] [CrossRef]
- Lis, A.; Zienowicz, M.; Kącki, Z.; Iwankowski, P.; Kukowska, D.; Shestak, V. Park Lighting after Dark—Is It a Route or a Place? How People Feel in Park Nightscapes (Experiment). Landsc. Urban. Plan. 2024, 248, 105098. [Google Scholar] [CrossRef]
- Fotios, S.; Monteiro, A.L.; Uttley, J. Evaluation of Pedestrian Reassurance Gained by Higher Illuminances in Residential Streets Using the Day–Dark Approach. Light. Res. Technol. 2019, 51, 557–575. [Google Scholar] [CrossRef]
- Cheon, S.; Han, S.; Kim, M.; Kwon, Y. Comparison between Daytime and Nighttime Scenery Focusing on Restorative and Recovery Effect. Sustainability 2019, 11, 3326. [Google Scholar] [CrossRef]
- Zhao, J.; Liu, G.; Li, X. Comparison of the Restorative Quality of Green Spaces between the Evening and Daytime. Proc. Inst. Civil. Eng. Urban. Des. Plan. 2023, 176, 65–76. [Google Scholar] [CrossRef]
- Li, Y.; Wu, S.; Qiu, J.; Wei, T. Sustainable University Campuses: Temporal and Spatial Characteristics of Lightscapes in Outdoor Spaces. Sustainability 2024, 16, 7355. [Google Scholar] [CrossRef]
- Hu, B.; Zhao, J. Factors Promoting Nature-Based Outdoor Recreation during the Daytime and Evening. J. Outdoor Recreat. Tour. 2022, 40, 100572. [Google Scholar] [CrossRef]
- Del-Negro, D.D.S. The Effects of Artificial Lighting on Urban Legibility and Wayfinding. Doctoral Dissertation, University College London, London, UK, 2016. [Google Scholar]
- Ebbensgaard, C.L.; Edensor, T. Walking with Light and the Discontinuous Experience of Urban Change. Trans. Inst. Br. Geogr. 2021, 46, 378–391. [Google Scholar] [CrossRef]
- Zhang, Z.; Sun, T.; Fisher, T.; Wang, H. The Relationships between the Campus Built Environment and Walking Activity. Sci. Rep. 2024, 14, 20330. [Google Scholar] [CrossRef]
- Zhang, Z.; Fisher, T.; Wang, H. Walk Score, Environmental Quality and Walking in a Campus Setting. Land 2023, 12, 732. [Google Scholar] [CrossRef]
- Liao, B.; Zhu, J. Exploring the Causal Relationship between Campus Walkability and Affective Walking Experience: Evidence from 7 Major Tertiary Education Campuses in China. J. Urban. Manag. 2025. [Google Scholar] [CrossRef]
- Healey, J.A.; Picard, R.W. Detecting Stress during Real-World Driving Tasks Using Physiological Sensors. IEEE Trans. Intell. Transp. Syst. 2005, 6, 156–166. [Google Scholar] [CrossRef]
- Perwira, S.A.; Dewancker, B.; Herjuno, D. Pilot Study of the Emotion Cognition Based on Visual Experience: A Case Study of Roadside Buildings in the Orio-Hibikino Area. Front. Archit. Res. 2024, 13, 1113–1126. [Google Scholar] [CrossRef]
- Buttazzoni, A.; Parker, A.; Minaker, L. Investigating the Mental Health Implications of Urban Environments with Neuroscientific Methods and Mobile Technologies: A Systematic Literature Review. Health Place. 2021, 70, 102597. [Google Scholar] [CrossRef]
- Torku, A.; Chan, A.P.C.; Yung, E.H.K.; Seo, J. The Influence of Urban Visuospatial Configuration on Older Adults’ Stress: A Wearable Physiological-Perceived Stress Sensing and Data Mining Based-Approach. Build. Environ. 2021, 206, 108298. [Google Scholar] [CrossRef]
- Yiyan, C.; Zheng, C.; Ming, D.U. Designing Attention—Research on Landscape Experience Through Eye Tracking in Nanjing Road Pedestrian Mall (Street) in Shanghai. Landsc. Archit. Front. 2022, 10, 52–70. [Google Scholar] [CrossRef]
- Benita, F.; Tunçer, B. Exploring the Effect of Urban Features and Immediate Environment on Body Responses. Urban. For. Urban. Green. 2019, 43, 126365. [Google Scholar] [CrossRef]
- Birenboim, A.; Ben-Nun Bloom, P.; Levit, H.; Omer, I. The Study of Walking, Walkability and Wellbeing in Immersive Virtual Environments. Int. J. Environ. Res. Public Health 2021, 18, 364. [Google Scholar] [CrossRef]
- CJJ 45-2015; Standard for Lighting Design of Urban Road. Ministry of Housing and Urban-Rural Development of the People’s Republic of China: Beijing, China, 2015.
- Kaplan, R. The Small Experiment: Achieving More with Less; Environmental Design Research Association: St. Paul, MN, USA, 1996. [Google Scholar]
- Ushiyama, K.; Ogawa, T.; Ishii, M.; Ajisaka, R.; Sugishita, Y.; Ito, I. Physiologic Neuroendocrine Arousal by Mental Arithmetic Stress Test in Healthy Subjects. Am. J. Cardiol. 1991, 67, 101–103. [Google Scholar] [CrossRef]
- Osnes, B.; Berrefjord, S.R.; Poless, P.G.; Sigrist, C.; Koenig, J.; Sørensen, L. Low Heart Rate Variability Is Associated with a Negativity Valence Bias in Interpreting Ambiguous Emotional Expressions. Emotion 2023, 23, 1040–1047. [Google Scholar] [CrossRef]
- Jacobs, S.C.; Friedman, R.; Parker, J.D.; Tofler, G.H.; Jimenez, A.H.; Muller, J.E.; Benson, H.; Stone, P.H. Use of Skin Conductance Changes during Mental Stress Testing as an Index of Autonomic Arousal in Cardiovascular Research. Am. Heart J. 1994, 128, 1170–1177. [Google Scholar] [CrossRef]
- Ben, M.; Lachiri, Z. Emotion Classification in Arousal Valence Model Using MAHNOB-HCI Database. Int. J. Adv. Comput. Sci. Appl. 2017, 8. [Google Scholar] [CrossRef]
- Sd, K. Autonomic Nervous System Activity in Emotion: A Review. Biol. Psychol. 2010, 84, 394–421. [Google Scholar] [CrossRef]
- Shoval, N.; Schvimer, Y.; Tamir, M. Tracking Technologies and Urban Analysis: Adding the Emotional Dimension. Cities 2018, 72, 34–42. [Google Scholar] [CrossRef]
- Bornioli, A.; Parkhurst, G.; Morgan, P.L. The Psychological Wellbeing Benefits of Place Engagement during Walking in Urban Environments: A Qualitative Photo-Elicitation Study. Health Place. 2018, 53, 228–236. [Google Scholar] [CrossRef] [PubMed]
- Wang, H.; Luo, S.; Furuya, K. What Attracts Tourists to Press the Shutter in Cultural Heritage Tourism? An Analysis of Visitor-Employed Photography and Visual Attributes: A Case Study on Japan’s Kairakuen Garden. Tour. Recreat. Res. 2024, 49, 1483–1499. [Google Scholar] [CrossRef]
- Shrestha, T.; Di Blasi, Z.; Cassarino, M. Natural or Urban Campus Walks and Vitality in University Students: Exploratory Qualitative Findings from a Pilot Randomised Controlled Study. Int. J. Environ. Res. Public Health 2021, 18, 2003. [Google Scholar] [CrossRef] [PubMed]
- Hartig, T.; Kaiser, F.; Bowler, P. Further Development of a Measure of Perceived Environmental Restorativeness; Uppsala University: Uppsala, Sweden, 1997. [Google Scholar]
- Bradley, M.M.; Lang, P.J. Measuring Emotion: The Self-Assessment Manikin and the Semantic Differential. J. Behav. Ther. Exp. Psychiatry 1994, 25, 49–59. [Google Scholar] [CrossRef]
- Xiang, L.; Cai, M.; Ren, C.; Ng, E. Modeling Pedestrian Emotion in High-Density Cities Using Visual Exposure and Machine Learning: Tracking Real-Time Physiology and Psychology in Hong Kong. Build. Environ. 2021, 205, 108273. [Google Scholar] [CrossRef]
- Herzog, T.R.; Rector, A.E. Perceived Danger and Judged Likelihood of Restoration. Environ. Behav. 2009, 41, 387–401. [Google Scholar] [CrossRef]
- Völker, S.; Kistemann, T. “I’m Always Entirely Happy When I’m Here!” Urban Blue Enhancing Human Health and Well-Being in Cologne and Düsseldorf, Germany. Social. Sci. Med. 2013, 78, 113–124. [Google Scholar] [CrossRef]
- Nikunen, H.; Korpela, K.M. The Effects of Scene Contents and Focus of Light on Perceived Restorativeness, Fear and Preference in Nightscapes. J. Environ. Plan. Manag. 2012, 55, 453–468. [Google Scholar] [CrossRef]
- Zhu, B.-W.; Feng, C.-W.; Xiong, L.; Zheng, W.-Q.; Wang, G.-Q.; Zhang, X.; Tzeng, G.-H. Rule Sets for Identifying Conditional Attributes of Campus Green Spaces with Enhanced Mental Restoration Effect. J. Urban. Plan. Dev. 2025, 151, 04024069. [Google Scholar] [CrossRef]
- Li, X.; Lu, Y.; Zhang, Z.; Wang, J.; Pan, H.; Zhang, Q. The Visual Effects of Flower Colors on University Students’ Psycho-Physiological Responses. J. Food Agric. Environ. 2012, 10, 1294–1300. [Google Scholar]
- Huang, W.-J.; Wang, P. “All That’s Best of Dark and Bright”: Day and Night Perceptions of Hong Kong Cityscape. Tour. Manag. 2018, 66, 274–286. [Google Scholar] [CrossRef]
- Stanhope, J.; Liddicoat, C.; Weinstein, P. Outdoor Artificial Light at Night: A Forgotten Factor in Green Space and Health Research. Environ. Res. 2021, 197, 111012. [Google Scholar] [CrossRef] [PubMed]
- Zhao, J.; Deng, S.; Sha, B.; Wang, S. Collaborative Design of Landscape and Lighting to Improve Visitors’ Satisfaction with Nightscapes. Landsc. Res. 2025, 1–15. [Google Scholar] [CrossRef]
- Stone, T. Re-Envisioning the Nocturnal Sublime: On the Ethics and Aesthetics of Nighttime Lighting. Topoi 2021, 40, 481–491. [Google Scholar] [CrossRef]
- Moyes, H.; Rigoli, L.; Huette, S.; Montello, D.R.; Matlock, T.; Spivey, M.J. Darkness and the Imagination: The Role of Environment in the Development of Spiritual Beliefs. In The Oxford Handbook of Light in Archaeology; Papadopoulos, C., Moyes, H., Eds.; Oxford University Press: Oxford, UK, 2021; ISBN 978-0-19-878821-8. [Google Scholar]
- Ma, Y.; Zhang, J.; Yang, X. Effects of Audio-Visual Environmental Factors on Emotion Perception of Campus Walking Spaces in Northeastern China. Sustainability 2023, 15, 15105. [Google Scholar] [CrossRef]
- Berkouk, D.; Bouzir, T.A.K.; Boucherit, S.; Khelil, S.; Mahaya, C.; Matallah, M.E.; Mazouz, S. Exploring the Multisensory Interaction between Luminous, Thermal and Auditory Environments through the Spatial Promenade Experience: A Case Study of a University Campus in an Oasis Settlement. Sustainability 2022, 14, 4013. [Google Scholar] [CrossRef]


| Source | Sample Size | Measure Times (per Participant) | Study Area | Participant Group | Measurement Methods | Subject |
|---|---|---|---|---|---|---|
| Study 1 [5]: | 4 | 3 times, each lasting for 15 min | Campus road | Students | Phenomenological interview Psychological scales Biosensing measures (ECG, EEG, EMG, SC, skin temperature, respiration) | Affective experience during walking |
| Study 2 [66]: | 10 | 15 min | Urban streets (totaling 570 m) | Older adults | Biosensing measures (HRV) Isovist analysis Subjective questionnaire | Stress during walking |
| Study 3 [67]: | 7 | 40 min | Commercial streets (totaling 400 m) | Students and employees | Eye-tracking data Visitor-employed photography In-depth interview | Attention and landscape experience |
| Study 4 [68]: | 10 | 2 rounds, each lasting for 10 min | A road near a residential area | Female students | Skin conductance Skin tempreture Subjective questionnaires | Body responses |
| Study 5 [69]: | 4 | 2 rounds | Road in VR (totaling 140 m) | Volunteer colleagues | Skin conductance Heart rate variability Gait sensor | Walkability and well-being |
| Participant | Gender | Age (Years) | Body Mass Index (BMI) | Self-Rating Anxiety Scale (SAS) | Self-Rating Depression Scale (SDS) | Morningness-Eveningness Questionnaire (MEQ) | Major |
|---|---|---|---|---|---|---|---|
| 1 | Male | 18 | 18.94 | 31 | 35 | 44 | Computer Science |
| 2 | Male | 18 | 20.05 | 33 | 40 | 55 | Transportation |
| 3 | Male | 21 | 22.09 | 31 | 30 | 51 | Civil Engineering |
| 4 | Female | 18 | 19.57 | 23 | 22 | 44 | Public Administration |
| 5 | Female | 18 | 18.22 | 30 | 37 | 41 | Law |
| 6 | Female | 18 | 23.72 | 41 | 50 | 49 | Architecture |
| 7 | Female | 18 | 18.37 | 42 | 42 | 33 | Environmental Science |
| 8 | Male | 20 | 24.30 | 39 | 46 | 44 | Physics |
| Comprehensive Visual Perception Photos | Emotional Response Photos | Unique Observational Photos | Imaginative and Reflective Photos | ||
|---|---|---|---|---|---|
| Color and Light Perception | Total Environmental Perception | ||||
| Daytime | 9 | 6 | 4 | 3 | 2 |
| Nighttime scene A | 13 | 4 | 1 | 3 | 3 |
| Nighttime scene B | 15 | 3 | 1 | 1 | 4 |
Disclaimer/Publisher’s Note: The statements, opinions and data contained in all publications are solely those of the individual author(s) and contributor(s) and not of MDPI and/or the editor(s). MDPI and/or the editor(s) disclaim responsibility for any injury to people or property resulting from any ideas, methods, instructions or products referred to in the content. |
© 2025 by the authors. Licensee MDPI, Basel, Switzerland. This article is an open access article distributed under the terms and conditions of the Creative Commons Attribution (CC BY) license (https://creativecommons.org/licenses/by/4.0/).
Share and Cite
Zeng, X.; Zhang, B.; Chen, S.; Lin, Y.; Haans, A. Exploring the Impact of Daytime and Nighttime Campus Lighting on Emotional Responses and Perceived Restorativeness. Buildings 2025, 15, 872. https://doi.org/10.3390/buildings15060872
Zeng X, Zhang B, Chen S, Lin Y, Haans A. Exploring the Impact of Daytime and Nighttime Campus Lighting on Emotional Responses and Perceived Restorativeness. Buildings. 2025; 15(6):872. https://doi.org/10.3390/buildings15060872
Chicago/Turabian StyleZeng, Xianxian, Bing Zhang, Shenfei Chen, Yi Lin, and Antal Haans. 2025. "Exploring the Impact of Daytime and Nighttime Campus Lighting on Emotional Responses and Perceived Restorativeness" Buildings 15, no. 6: 872. https://doi.org/10.3390/buildings15060872
APA StyleZeng, X., Zhang, B., Chen, S., Lin, Y., & Haans, A. (2025). Exploring the Impact of Daytime and Nighttime Campus Lighting on Emotional Responses and Perceived Restorativeness. Buildings, 15(6), 872. https://doi.org/10.3390/buildings15060872