Article

Regulating Indoor Comfortable Temperature Limits for Sustainable Architectural Design in Mediterranean Climates

by
Salar Salah Muhy Al-Din
1,* and
Burcin Saltik
2
1
Department of Interior Architecture and Environmental Design, Faculty of Design, Arkin University of Creative Arts and Design, N. Cyprus via Mersin-Turkey, 99320 Kyrenia, Cyprus
2
Department of Industrial Design, Faculty of Design, Arkin University of Creative Arts and Design, N. Cyprus via Mersin-Turkey, 99320 Kyrenia, Cyprus
*
Author to whom correspondence should be addressed.
Buildings 2025, 15(6), 899; https://doi.org/10.3390/buildings15060899
Submission received: 7 February 2025 / Revised: 5 March 2025 / Accepted: 8 March 2025 / Published: 13 March 2025
(This article belongs to the Section Building Energy, Physics, Environment, and Systems)

Abstract

:
This study investigates sustainable living through minimizing environment impact, including energy efficiency, while supporting the well-being and thermal comfort in Mediterranean dwellings, specifically in Cyprus. This research highlights the need to define indoor temperature ranges that promote energy efficiency and occupants’ thermal comfort, considering the topographic variation in the Mediterranean climate. This study aims to promote sustainable building design by improving the occupants’ well-being in Mediterranean climates. This study uses the predicted mean votes index to determine thermal comfort limits by analyzing acceptable temperature ranges in 150 residences across different topographic areas of Kyrenia, Northern Cyprus, in summer and winter. The findings indicate that optimal interior air temperatures in the study area are 28.9 °C for summer and 20.2 °C for winter. Topographic variations highlight the importance of land elevation and microclimate differences in achieving suitable indoor thermal temperature conditions. The acceptable interior temperature range during summer in the mountainous region is wider (between 24.1 °C and 28.9 °C), while the winter range is broader in the coastal region (20.2 °C to 23 °C). This study provides novel region-specific indoor temperature guidelines for Mediterranean climates, emphasizing topographic differences and their influence on thermal comfort. The guidelines assist designers and policymakers in enhancing sustainable design in Mediterranean climates.

1. Introduction

Buildings consume half of their end-use energy for heating and cooling in order to ensure thermal comfort [1]. In practice, thermal comfort is defined as an absence of thermal discomfort [2]. Occupants who are uncomfortable with their inner space thermal surroundings are more likely to act in abnormal ways with lower potential to achieve their tasks and work [3,4]. In terms of sustainable design, architects and engineers need to consider and assess thermal comfort to ensure building occupants’ comfort while reducing energy usage [5].
Although many environmental factors affect indoor thermal comfort, like relative humidity and wind speed, air temperature inside the building is one of the main factors [6]. Air temperature is a crucial factor in assessing whether the indoor of a building is warm, cool, or thermally comfortable [7].
Active systems, or Heating, Ventilation, and Air Conditioning (HVAC) systems, were introduced and widely employed to satisfy standard thermal conditions and offer occupants a high level of thermal comfort [8]. Understanding the indoor accepted temperature ranges is one of the crucial requirements in designing HVAC systems inside the buildings to enable thermal comfort, energy-efficient HVAC systems, and sustainable design [9].
Therefore, defining a range of air temperatures that promote thermal comfort is essential for designing comfortable interior environments and has a significant effect on energy usage. Designers can considerably minimize energy use by properly sizing and selecting HVAC systems that maintain thermal neutrality while consuming less energy [10].
Environmental variables (air temperature, relative humidity, and wind speed) change due to the climatic characteristics and the diversity of topography and elevation above mean sea level [11]. This leads to changes in the level of indoor accepted temperature for achieving thermal comfort.
Previous studies addressed the differences in the ranges of indoor acceptable temperature limits in different climatic zones and revealed that the neutral temperature range or accepted temperature limits inside buildings were 22 °C to 28 °C in the hot and humid climate of Bangkok [12], from 22.5 to 30.6 °C in the composite climate of north India [13], and 20.2 to 20.9 °C in the temperate oceanic climate (Cfb) of Coventry, UK [14]. Moreover, the neutral temperature range ranged from 17.0 to 30.0 °C in Japanese subtropical indoors.
Furthermore, a comparison among previous studies also demonstrated the effect of the elevation above mean sea level on the accepted indoor temperature ranges.
In the hot and dry climate of the Garmian region in northern Iraq, where the elevation is 210 m above mean sea level and higher than the middle and southern parts, the range of indoor acceptable temperature was from 19.4 to 29.2 °C [9]. Whereas, in the rest of Iraq with a lower elevation (35 to 15 m) above sea level, the range was 25–35 °C [15]. Moreover, in the same climate in Shiraz city in Iran, which is above mean sea level by 1570 m, the range of accepted indoor temperature was from 22.0 to 25.0 °C [16]. These studies show that within the same climatic characteristics, the increase in the land height above mean sea level decreases the accepted temperature limits inside the buildings.
The unique characteristics of the Mediterranean climate in Cyprus are that it has hot and dry summers and mild and wet winters and different topographic regions with different microclimates, making this balance challenging for the designers. Therefore, in the current study, Kyrenia in North Cyprus, with its various topography and microclimate, has been selected as a study area. There is a lack of studies on the influence of topography and landforms on acceptable indoor temperature limits in Mediterranean climates.
This study tries to explore the effect of various landforms and topography in the Mediterranean climate of North Cyprus on indoor acceptable thermal temperature ranges for maintaining thermal comfort inside buildings. This is through developing indoor thermal comfort guidelines for residential buildings as the dominant building sector in the Mediterranean climate of Northern Cyprus [17]. This study aims to improve sustainable design criteria in buildings by enhancing occupants’ well-being and productivity in Mediterranean climates. This is through determining the threshold of acceptable temperature for maintaining thermal comfort and energy efficiency inside the buildings for summer and winter in this region while considering the various topography and regional landforms. This study tries to explore whether the indoor accepted temperature limits are changing according to topography and landforms in the Mediterranean climates and to what extent it can be significant in sustainable design. This research employs the predicted mean vote and predicted percentage of dissatisfied (PMV-PPD) index by looking at human and environmental factors, which can help to comprehend permanent thermal well-being within the frame of sustainability. This approach enhances energy efficiency and aligns with global sustainability targets, meeting the urgent need for climate-responsive architectural design in regions experiencing severe climatic changes [5].

2. Materials and Methods

2.1. Thermal Comfort Evaluation in Residential Buildings Through PMV-PPD Index

Thermal comfort is one of the most important needs for building occupants since it has a substantial impact on their overall comfort, health, and productivity [15]. The widely accepted international definition of thermal comfort is provided by ASHRAE Standard 55, which states, “Thermal comfort is the condition of mind that expresses satisfaction with the thermal environment” [6].
Residential buildings are known as common places to rest. Thermal comfort levels in residential buildings significantly impact occupants’ mental and physical well-being. For example, extreme temperatures in the house can cause various issues (sweating, fatigue, and skin allergies). As a result, an acceptable and comfortable indoor atmosphere should be regarded as essential to enhance occupants’ comfort, health, and well-being [18].
Previous research has concentrated on residential buildings, using field measurements and questionnaires to anticipate how people will react in certain circumstances within the buildings and at temperatures at which they will be comfortable. These temperatures are also known as ‘indoor accepted temperature’ or ‘indoor neutral temperature’. Ref. [19] observed that 90% of occupants accepted an interior air temperature between 22.0 and 25.9 °C. Ref. [20] showed the appropriate indoor temperature range of 10.2–22.9 °C, while [21] identified 25.6 °C (summer) and 19.8 °C (winter) as the average comfort temperatures. Residential buildings frequently provide a broader range of comfort or suitable environments for residents than offices [22,23], educational [24,25], or medical buildings [26,27]. This could be related to different thermal comfort requirements, less predictable activities, and more options for coping with the existing thermal environment [28].
Thermal comfort analysis can be carried out objectively or subjectively [29]. The focus of this study will be to objectively assess thermal comfort.
Therefore, objectively, thermal comfort can be evaluated depending on several factors, including environmental factors, air temperature, air velocity, relative humidity, mean radiant temperature, human factors, occupants’ activity levels, and clothing choices [30,31,32,33]. The PMV/PPD model, based on heat balance, is the most often used objective approach for evaluating thermal comfort [34,35]. This model has been approached because it is a well-known model and widely applied in active-mode and mixed-mode buildings (defined in the American National Standards Institute—ANSI/ASHRAE Standard 55) [6]. However, the free-running mode uses the adaptive method [32].

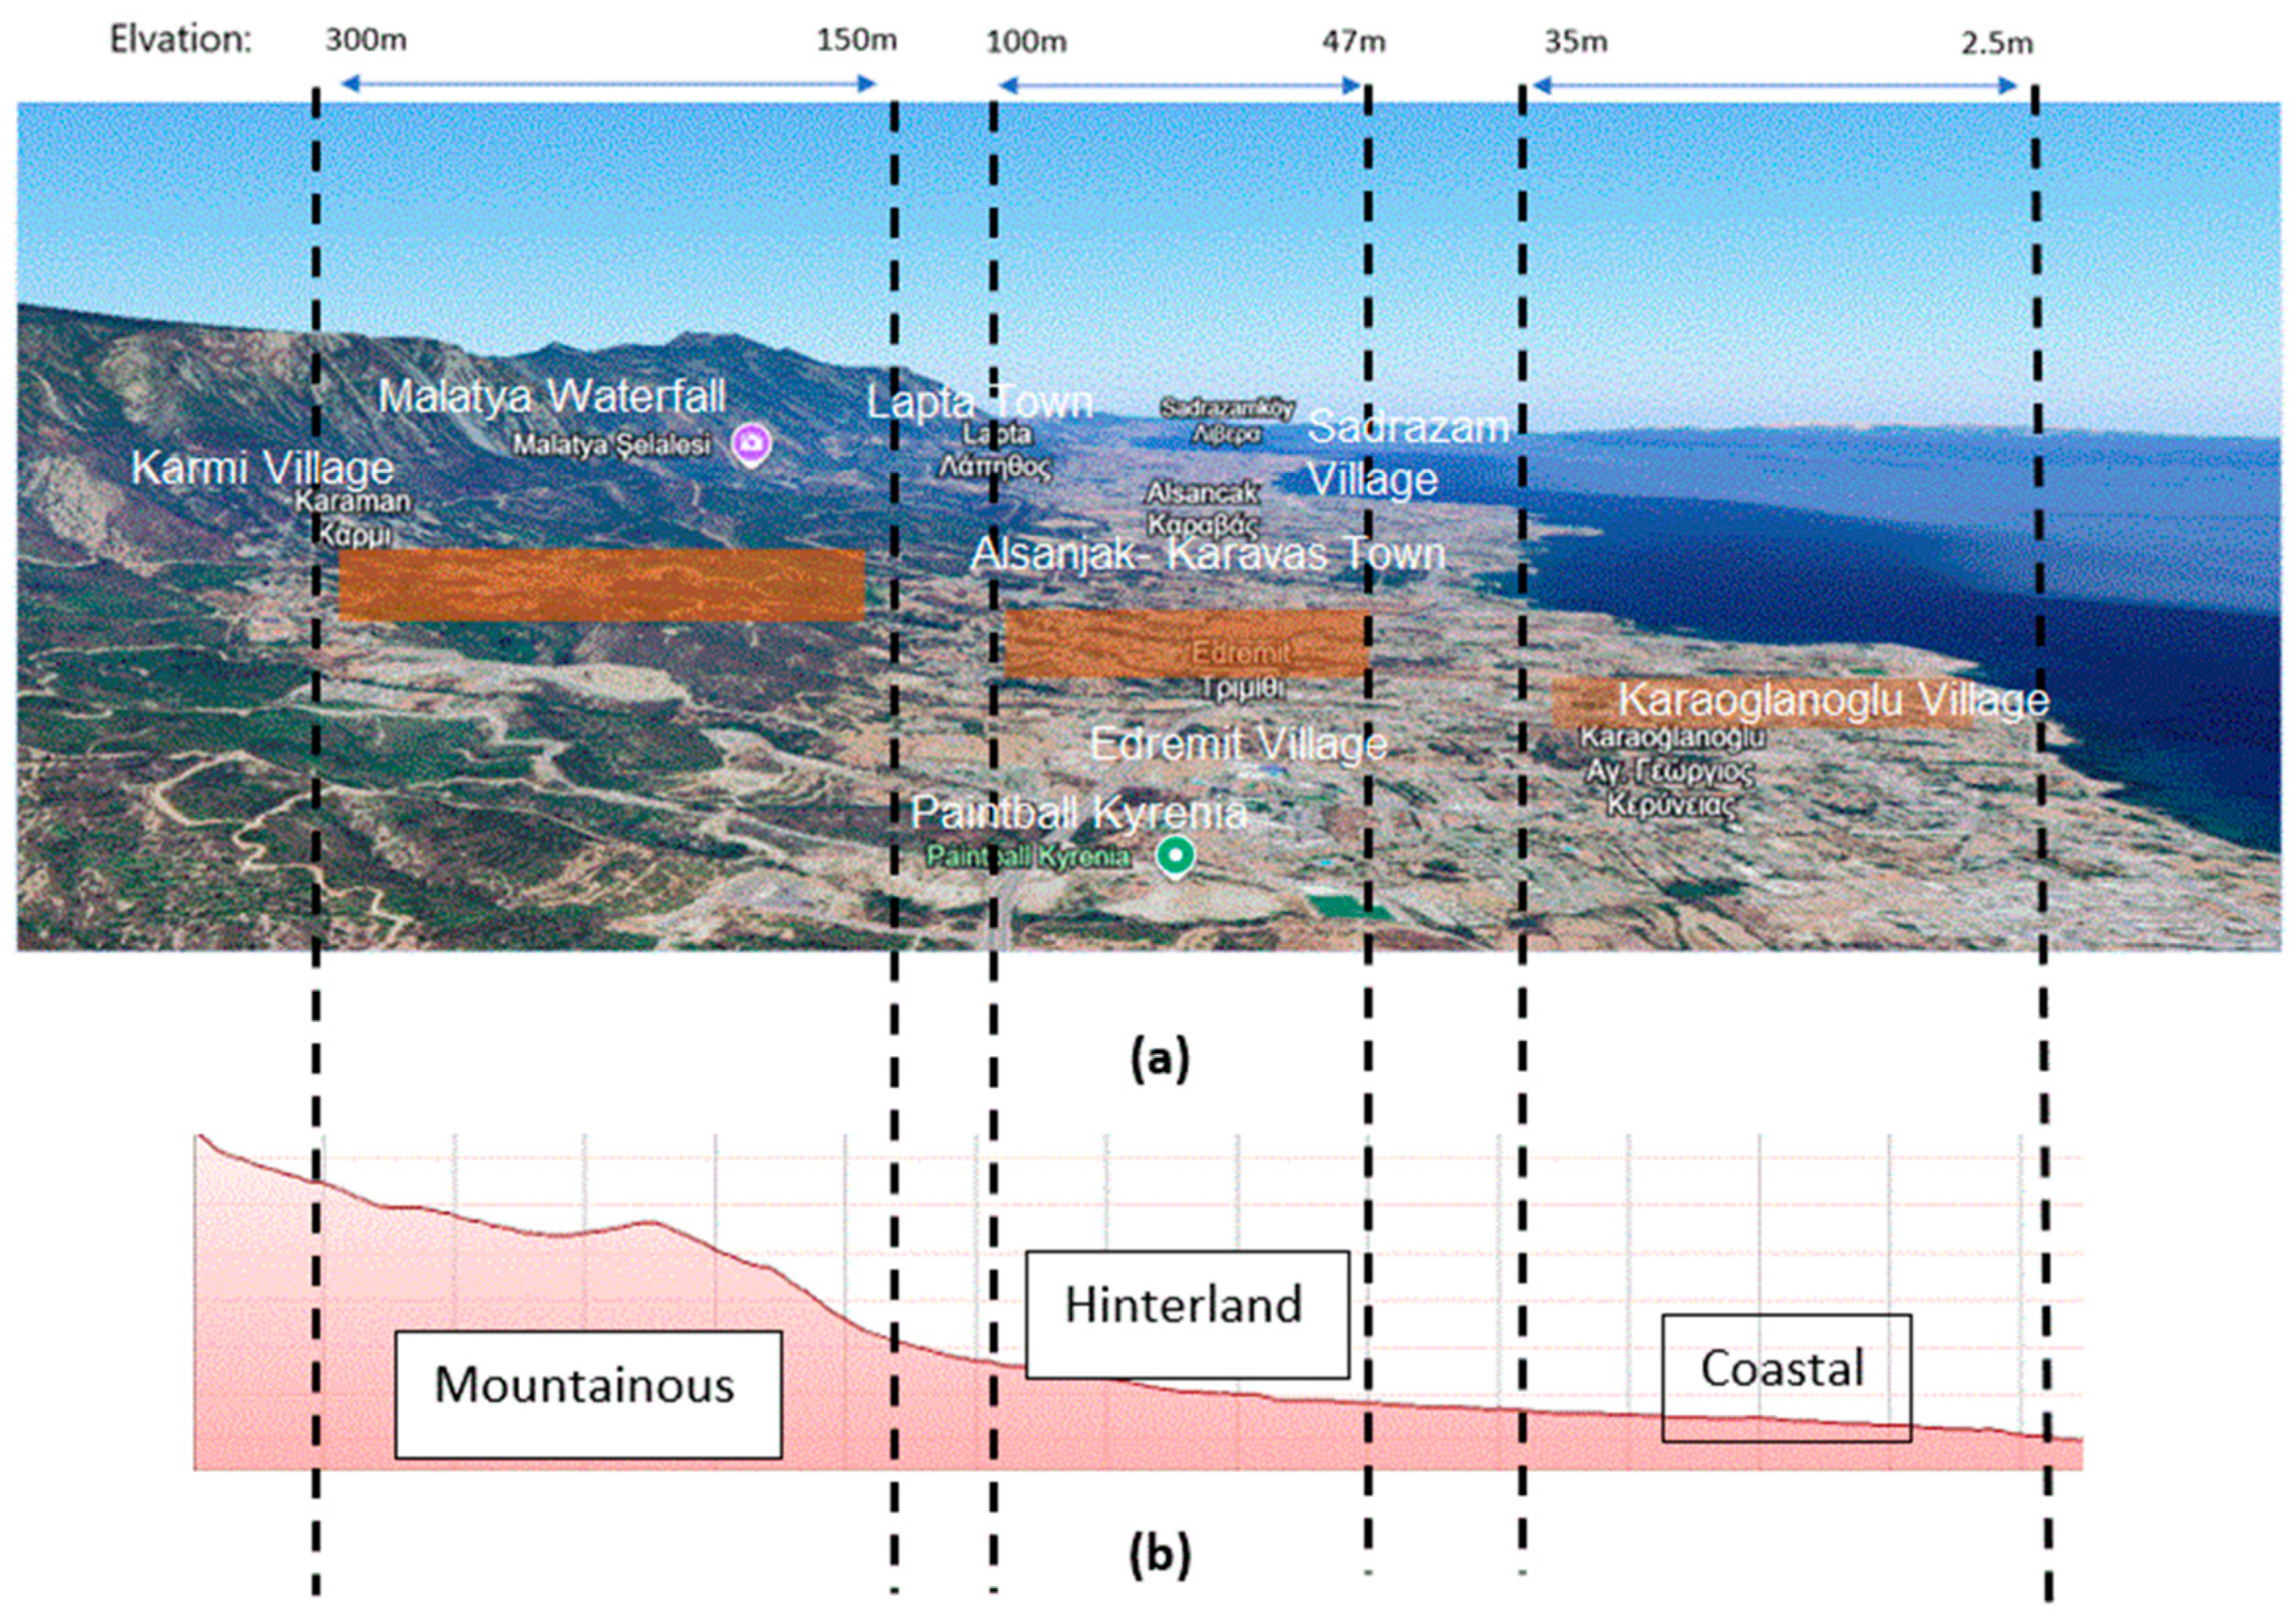
2.2. The Relationship Between Topography and Air Temperature in Shaping Building Sustainability

One of the main factors influencing how comfortable a person feels is air temperature [36], according to the widely accepted ASHRAE Standard 55 [6].
It is important to mention that elevation above mean sea level influences air temperature, leading to cooler conditions on northern slopes compared to southern slopes throughout the day in the Northern Hemisphere [37]. Moreover, landforms substantially influence air temperature [38]. In arid regions, particularly those under high pressure, the temperature can decrease by nearly 1 °C for every 100 m of elevation [39]. In addition, elevation influences thermal comfort, resulting in a temperature decrease of 0.8 °C for every 100 m increase in elevation. Refs. [40,41] found that the comfort temperature in a study of high-altitude residential buildings in India did not meet the ASHRAE criteria. As a result, they suggested a new comfort zone for areas with a comparable cold climate.
According to [42], in Cyprus, considering the geography and height, temperatures decrease by around 5 °C per 1000 m, along with maritime influences that result in colder summers and milder winters. The study highlighted that higher elevations witness cooler temperatures, which affects indoor thermal comfort and building design. In a study [43] in Turkey, it was determined that the 1179 m elevation difference between two sites led to physiological equivalent temperature (PET) decreases of 0.5 °C for each 100 m.
Therefore, the effect of topography is one of the factors that should be investigated and understood when indoor thermal comfort is a goal.
In the same context, air temperature affects human performance [31]. Many academics attempted to formulate a quantifiable correlation between temperature and human performance; for example, Ref. [44] indicated that performance dropped by 2% with a 1 °C increase in the 25–32 °C temperature range. In another study, Ref. [45] showed no such change in the 21–25 °C temperature range.
Refs. [46,47] found that call center personnel performed worse when the temperature exceeded 25 degrees Celsius. Ref. [48] designed three chamber environments with effective temperatures of 24 °C, 27 °C, and 30 °C. The findings indicated that the optimal temperature for most types of mental work was 24 °C, while for perceptual tasks, a reverse U-curve was identified, with the highest performance at 27 °C. Ref. [49] studied the relationship between time to finish a task and air temperature and discovered that at 26.7 °C, the task took the longest to complete while having the lowest rate of error.
Nonetheless, several studies have demonstrated that air temperature can indirectly affect human performance by influencing the frequency of symptoms of Sick Building Syndrome or air quality satisfaction [50,51].
Furthermore, Ref. [52] emphasizes how crucial air temperature is to thermal comfort models. They point out that temperature variations from the ideal range can cause discomfort, which raises energy use as residents try to adjust the setting using heating or cooling equipment. It is important to note that HVAC systems constitute a minimum of 50% of a building’s energy consumption to ensure a comfortable and acceptable indoor climate. Refs. [53,54] corroborate this, revealing that the utilization of air conditioning (AC) often increases average residential electricity consumption by 11%. Furthermore, AC greenhouse gas emissions will lead to a 0.5 °C rise in global temperatures. Refs. [55,56] indicate that energy usage for heating has consistently risen alongside developments in the building sector and a focus on indoor environmental quality.
Thus, through this review of literature, the importance of air temperature inside buildings on sustainability can be recognized through its effects on well-being, occupant productivity, and energy consumption in buildings.

2.2.1. The Relationship Between Accepted Thermal Temperature Limits and Energy Efficiency

Numerous field studies indicate that substantial energy savings can be achieved by increasing the cooling temperature setting and decreasing the heating temperature setting [15,57,58,59]. In the same context, the energy consumption of HVAC systems can frequently be lowered by 10% by an increase in indoor temperature of 1 K [60]. Within this context, the term “acceptable thermal temperature limits” (ATTLs) is the comfortable thermal state that generally describes the situation when the body perceives the thermal environment as being free of excessive warmth or cold [9]. Within this condition, the occupants will experience neutrality of thermal conditions. International standards such as ASHRAE 55 [6] and ISO 7730 [2] state that the temperature within buildings is within the acceptable range of 22.2 °C to 26 °C.
Previous studies demonstrated that the building occupants accepted thermal temperature (neutral temperatures) change according to the climatic zones. For example, in hot regions, neutral temperatures exceeded those in colder areas, and winter neutral temperatures were lower than summer temperatures within the same location [61,62]. This finding is frequently used in debates about indoor environments, where attempts are made to develop building and space designs that keep users at a comfortable temperature limit without requiring excessive heating or cooling. Moreover, studies showed that the residents’ satisfaction rises when they directly regulate thermal settings, such as the thermostat [63,64].
Therefore, in architectural and engineering fields, achieving an ATTL is crucial for designing sustainable buildings that provide energy efficiency and occupant thermal comfort [65].
The neutrality of thermal conditions might vary according to personal factors, such as the clothing worn by persons and the activities, in addition to the environmental factors such as humidity, air movement, and air temperature [66,67]. Since the environmental factors change according to the location on the planet and climatic zone [11], the ATTL changes according to the topography and the height from sea level.

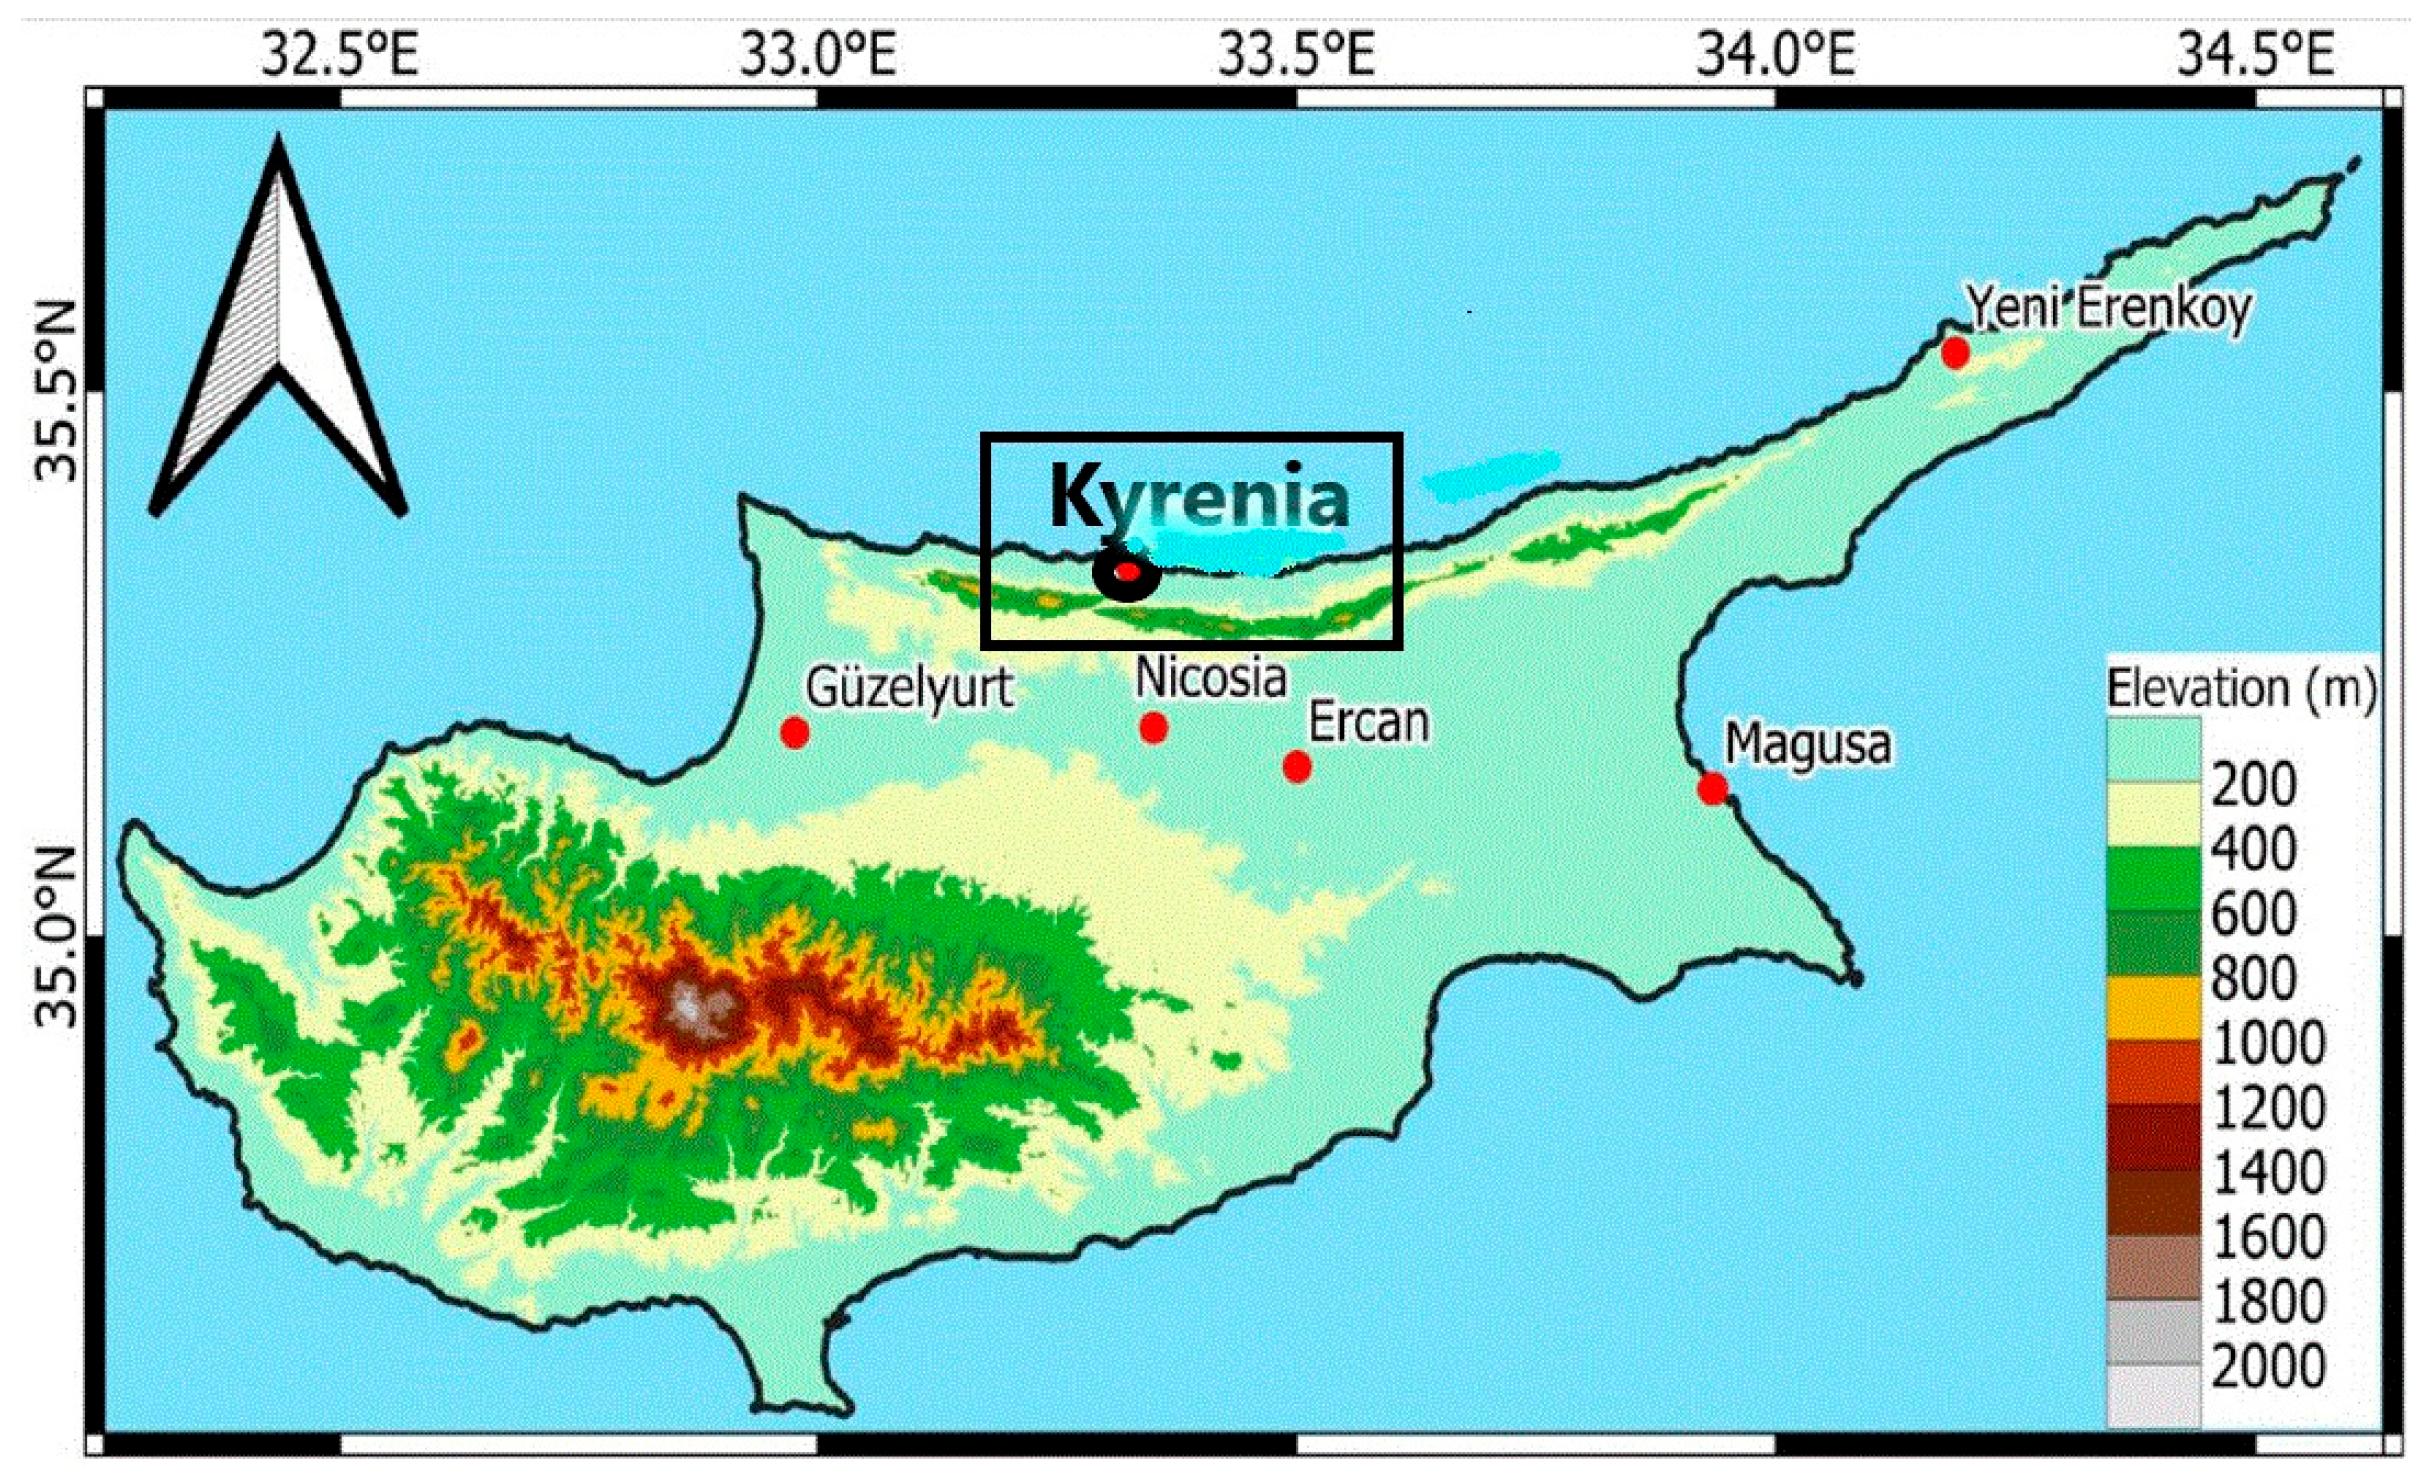
2.2.2. Mediterranean Climatic Characteristics of the Study Area

The Mediterranean climate, classified as Csa/Csb in the Köppen system, represents a distinct subtype of subtropical climate [68]. The regions surrounding the Mediterranean Sea constitute the most extensive area exhibiting this climatic type. Regions characterized by Mediterranean climates typically experience moderate winters and exceedingly warm summers. Due to their proximity to large bodies of water, regions with a Mediterranean climate typically experience moderate temperatures with a relatively narrow range between winter lows and summer highs [69]. However, daily temperature fluctuations in summer can be significant due to dry and clear conditions, except along the immediate coasts [70].
Cyprus is located in the eastern Mediterranean Basin, between the latitudes of 34° and 36° N and the longitudes of 32° and 35° E [71]. Cyprus exhibits a quintessential eastern Mediterranean climate, marked by chilly to mild rainy winters and extended warm to hot dry summers [72]. In Cyprus, especially in inland regions during the summer months, the disparity between the highest daytime and lowest overnight temperatures is particularly noticeable. These daily variations in temperature vary from 8 to 10 °C in the lowlands and 5 to 6 °C in the mountains during the winter, up to 16 °C on the middle plain and 9 to 12 °C elsewhere during the summer [42,73]. The average daily temperature in July and August is between 29 °C in the central plain and 22 °C in the mountains, while the average maximum temperature during these months is between 36 °C and 27 °C. The average day temperature in January is 10 °C on the central plain and 3 °C in the mountainous areas, with average low temperatures of 0 °C and 5 °C, respectively. Relative humidity is strongly influenced by elevation above mean sea level and distance from the shore. Throughout the year, winter days and nights have humidity levels between 65% and 95%. Cyprus’s diverse topography produces microclimatic effects in different places. As a result, these characteristics must be taken into account when assessing the thermal comfort of buildings [42,73].
Kyrenia is situated along the northern coast of Cyprus, in the center of the island. The city is located at an elevation ranging from 2.5 m above sea level in the northern coastal area to approximately 300 m on the slopes of the Kyrenia mountain range, also known as (Beşparmak), in the southern region [40]. The geographical location is latitude 35.34° N and longitude 33.32° E. The average temperature is 10 °C in January, the coldest month, and 29 °C in July, the warmest month. In hilly regions, rainfall ranges from 750 mm to 500 mm, with winter and occasional summer precipitation. The Kyrenia Mountains receive the most rainfall, ranging from 750 to 1110 mm, due to their elevation. The case studies are selected within Kyrenia, a Mediterranean city, located between mountain chains of ‘Beshbarmak’ from the south and the Mediterranean Sea from the north. Figure 1 displays a map of Cyprus along with the study area [74].

2.3. Methodology

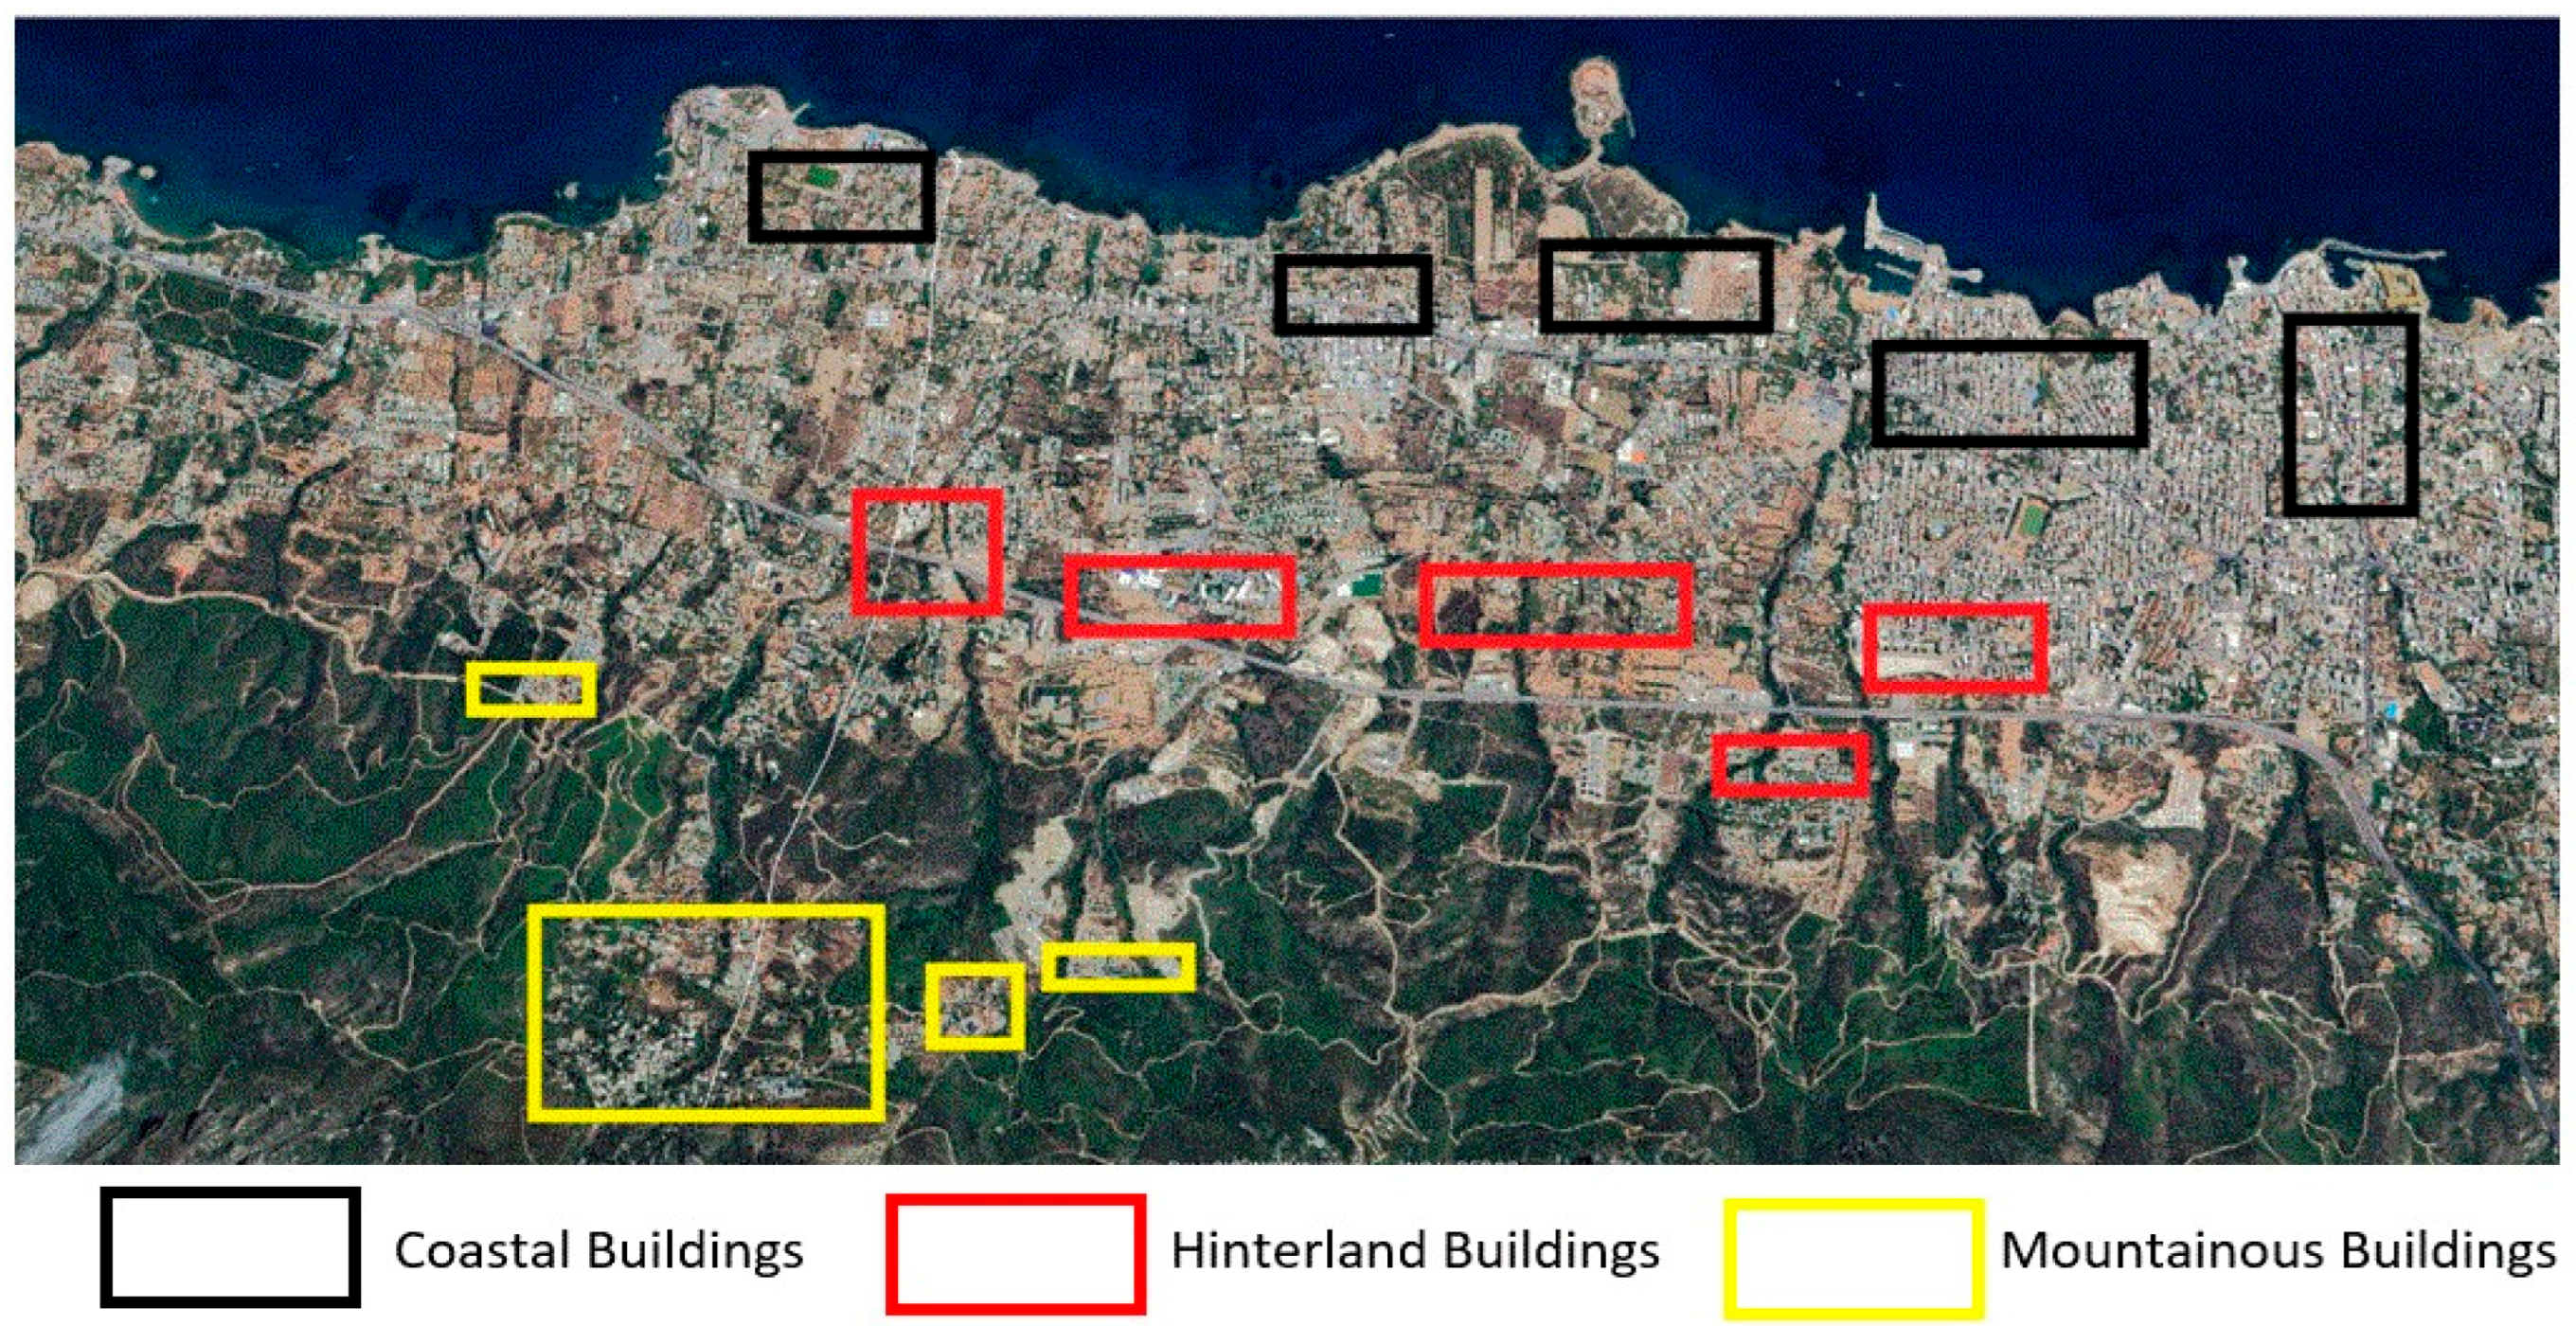
2.3.1. Criteria for Applied Method and Case Studies

This research employed a quantitative methodology and utilized comparative analysis to derive its conclusions. This was accomplished by gathering data from the site through direct observation to assess thermal comfort levels within the chosen case study buildings. Consequently, a case study methodology was adopted in the present research. See Figure 2.
This study employed comparative analysis to determine acceptable thermal temperature limits within residential buildings across various topographic and microclimatic regions during summer and winter. One hundred fifty existing residential buildings have been selected as case studies in Kyrenia. These buildings represent a variety of residential typologies, including apartment complexes and detached and semi-detached houses.
Kyrenia has been selected for this study, because of its various topographic characteristics that fall into three categories: mountainous, coastal, and hinterland (see Figure 3a). Therefore, coastal areas are recognized in the current study as the lands that are alongside the coastal frontline, and their elevation is between 2.5 m and 35 m above mean sea level. In the same context, hinterlands are the lands that are adjacent to the coastal land, and their elevations are between 47 and 100 m, while the mountainous area is the one that is above 150 m and lower than 300 m above sea level. See Figure 3b.
Fifty case study buildings were selected from each of the aforementioned topographic regions in different parts (see Figure 4), and they were limited to residential buildings. Furthermore, these case studies are limited to the first three floors to neutralize extra factors associated with height development, such as wind speed.
The buildings use mixed-mode systems, and at least one of the active heating or cooling systems (fans or air conditioners for summer and air conditioners or heaters for winter) was functional during the observation time. The convenience sampling technique was utilized for sample selection due to this study’s nature and circumstances. Additionally, direct observation was the approach used for collecting data. The measurements were taken at consistent times of the day (11:00 to 14:00) throughout the observation periods, which spanned around one month in summer and one month in winter, which are the region’s two extreme seasons in Mediterranean climates. Daytime was selected to involve solar radiation and shading factors during the observations. The observations were conducted in the family lounges or sitting rooms because they are the most frequently occupied spaces by family members as a gathering place.
In order to neutralize the stratification factors, globe temperature observations were made at a height of 1.0 to 1.3 m above the ground and at least 1.5 m away from walls or windows. Each observation lasted between 20 and 30 min to reach equilibrium with the indoor environment before the observations were taken, and observations were performed more than one time to obtain more accurate measurements.

2.3.2. Tools for Data Collection and Evaluation

This study tried to explore the relationship between acceptable indoor temperature limits and topographical variations within Mediterranean climates. The Center for the Built Environment (CBE) Thermal Comfort Tool-2020-Version: 2.5.6 [75] was provided as a computer tool for measuring the empirical variables involved in the calculation to evaluate PMV-PPD in this study. The following parameters were found in the process of each observation:
  • GT: It stands for globe temperature (with a globe diameter of 40 mm); ASHRAE-55 states that the measurement must be taken at least one meter from the walls.
  • ATi and RHi: The building’s interior air temperature and relative humidity, respectively, as measured by the CBE Thermal Comfort Tool’s Psychrometric (air temperature) method.
  • Airspeed (As): The airspeed in the buildings was measured in meters per second using an anemometer.
  • Clothing insulation was taken into consideration as 0.5 to 1.0 (clo) for summer and winter, respectively. These values reflect the typical indoor clothing insulation level in the summer and winter, according to ASHRAE Standards-55.
  • Metabolic rate (Met) or the rate of activity: It is determined based on the observation area, and according to the site observation and ASHRAE-55, it was considered (1 Met) as a seated and quiet activity level. See Table 1.
It is important to mention that the probability sampling method was applied in this study. This method is commonly applied in quantitative research like the current study to produce results representative of the whole population. Stratified random sampling was utilized because the samples were divided into three main regions with the same number of residential buildings in each region randomly. The selection was random because access to the residential buildings was not always available and depended on the cooperation of the occupants. The selection of sample units from every region was based on the researcher’s judgment and the fundamental justification of their research [76]. To achieve credible statistical results, a sample of 30–50 case studies per region was sufficient for analyzing thermal comfort across different environments, for normality in sample distribution and a stable sample mean [76].

3. Findings

This study involved 300 sets of measurements, with 150 conducted in each season (summer and winter), covering 150 case study buildings. As previously mentioned, there are fifty measurement sets in each topographic region during the summer (July) and the same number of observations in winter (January). The goal was to evaluate the thermal comfort conditions inside these buildings based on their landform using the PMV-PPD index. The results showed different findings between summer and winter.

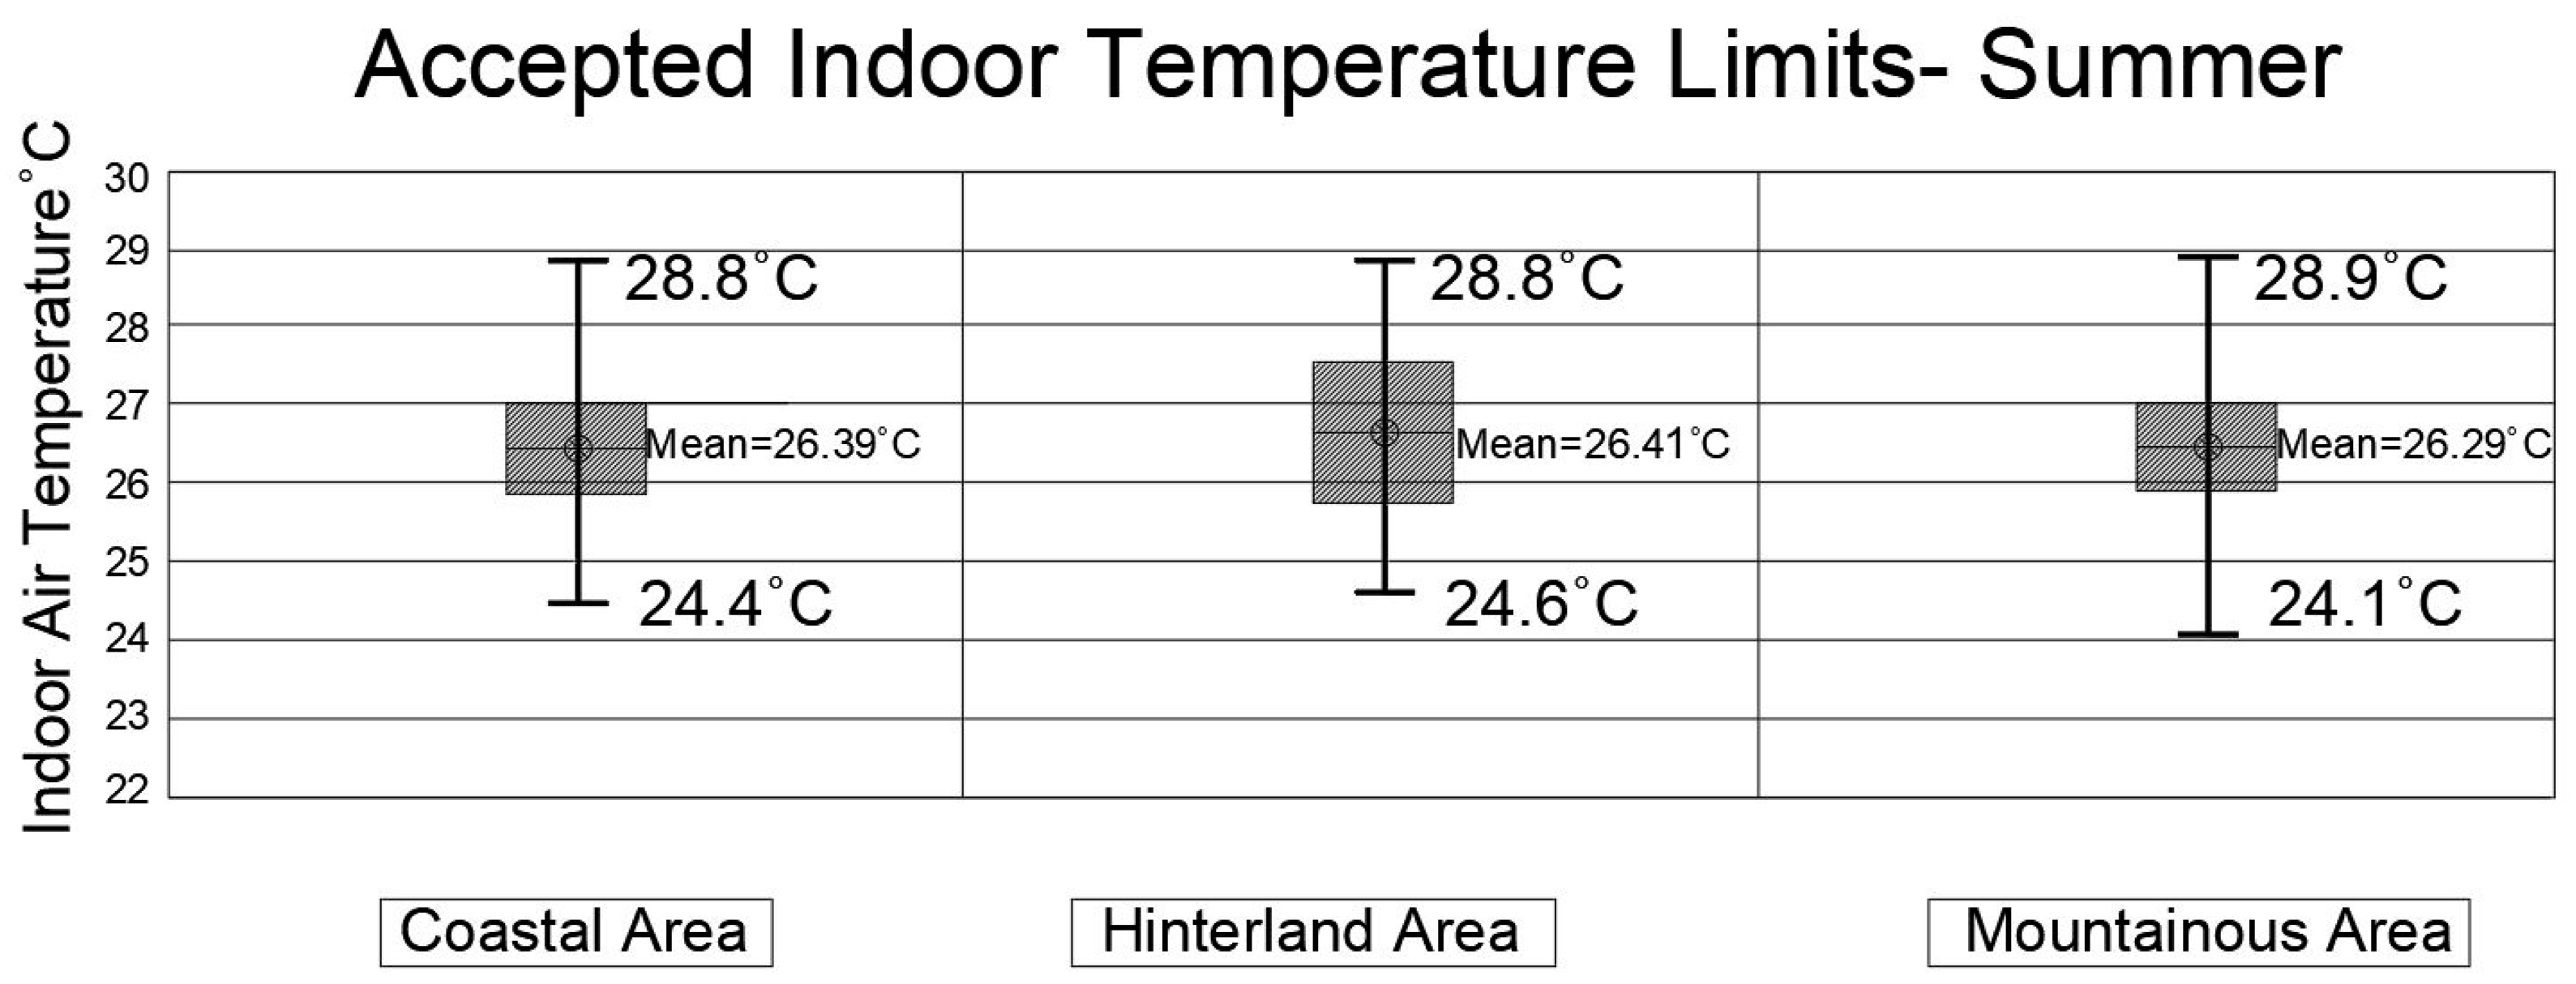
3.1. Findings from the Summer Data Collection

As previously stated, 150 sets of observations in each season were acquired to assess thermal comfort within the buildings in the study area. Therefore, thermal comfort conditions in case study buildings have been evaluated in each topographic region—coastal, hinterland, and mountainous—separately, based on fifty buildings in each of the regions within the city of Kyrenia. The evaluation has been made based on the PMV-PPD index in summer and winter. It is important to mention that the measured outside temperature in the coastal region during the observation periods was between 33 °C and 36.5 °C, and in the hinterlands, it was between 33.5 °C and 37 °C, while in the mountainous region, it was between 30.5 °C and 34 °C.
  • Coastal area
Throughout summer (July), various observations indicated acceptable indoor thermal temperature limit conditions within buildings, depending on their location (coastal, hinterland, and mountainous) and the distinct microclimatic conditions of Kyrenia.
The data presented in Table 2 indicate that twenty-seven residential buildings out of fifty witnessed neutral thermal conditions inside the buildings in the coastal area.
  • Hinterland area
Fifty other case studies have been observed in terms of thermal comfort evaluation, and neutrality has been found in twenty-two buildings out of fifty. See Table 3.
  • Mountainous area
The last fifty observations have been performed in the mountainous region, and the neutrality in thermal comfort was within thirty-three buildings out of fifty, which is the widest range within the three regions (coastal, hinterland, and mountainous). See Table 4.
The results shown in Table 2, Table 3 and Table 4 indicate that the inner thermal neutrality varies across different regions. The result of the observations from different dwellings in different topographic regions within the study area in the hot season (July) demonstrates different percentages of thermal neutrality conditions inside the buildings. For example, the percentage of buildings with thermal neutrality in the coastal area was 54%, and in the hinterland, it was 44%, while in the mountainous region, it was 76%. Moreover, the range of acceptable indoor air temperature varied too. The acceptable indoor air temperature for attaining thermal neutrality in coastal dwellings ranged from 24.4 °C to 28.8 °C, whereas for hinterland buildings, it was between 24.6 °C and 28.8 °C. In the same context, mountainous regions need inside air temperatures ranging from 24.1 °C to 28.9 °C to achieve thermal neutrality. As a result, this required figuring out the maximum interior temperature required to create a thermally acceptable atmosphere in a variety of topographical locations with varying summertime microclimatic conditions. For instance, after obtaining neutral thermal conditions, the allowable air temperature range within residential buildings in the mountains showed a greater range. Additionally, the greatest temperature in this region (28.9 °C) might create a thermoneutral atmosphere. Furthermore, there were regional variations in the relative humidity, which has a major impact on thermal comfort conditions [77]. Relative humidity in thermal neutrality ranged from 50% to 75% in the coastal region, 54% to 70% in the hinterland, and 38% to 58% in the mountainous region, which was lower than in other areas. It is also critical to note that the orientation of the buildings has an impact on both the airspeed (Va) and the globe temperature (TG), which was directly impacted by the radiation and has a major impact on the PMV-PPD index results [77]. Nonetheless, the findings suggested that active systems may be adjusted to a greater temperature, which would reduce the energy needed to cool them. This suggests that the mountainous region is more adaptable than the others and offers a good variety of summertime thermoneutral climatic conditions (see Figure 5).
It is worth mentioning that the average predicted percentage of dissatisfied (PPD) inside buildings within acceptable indoor temperature ranges in summer was higher in the coastal area, where it was 6.6%, while in the hinterland and mountainous areas, it was 5.8%.

3.2. Findings from the Winter Observations

During the winter (January), another 150 observations inside 150 residential buildings were made with the same process of observation used in summer to evaluate thermal comfort conditions applying the PMV-PPD index. The temperature outside during the observation periods was between 10.5 °C and 17.5 °C in coastal areas and between 10 °C and 17.5 °C in the hinterlands, whereas it was between 8.5 °C and 15 °C in mountainous areas. However, the results demonstrated the following:
  • Coastal area
The same fifty buildings selected in the summer were selected again in winter, and the observations were made in wintertime to evaluate thermal comfort conditions. The observations showed that thirty buildings were in the condition of indoor thermal neutrality out of fifty buildings, as seen in Table 5.
  • Hinterland area
Table 6 demonstrates thermal comfort conditions in the selected case study buildings in the hinterlands in winter. The results identified neutral thermal conditions inside twenty-nine buildings out of fifty buildings in this area.
  • Mountainous area
A thermal comfort evaluation was conducted in the mountainous region, and only twenty-three residential buildings out of the selected fifty dwellings arrived at a neutral thermal condition during the winter (January). See Table 7.
The results demonstrated that the highest percentage of thermal neutrality inside the buildings was in the coastal area, at 60%, and the percentage was 58% for the hinterlands, while it was only 46% in the mountainous region. Additionally, the results showed varying ranges of inner air temperature for reaching thermally neutral conditions inside the buildings throughout the winter (January), as shown in Table 5, Table 6 and Table 7. It is important to mention that the interior accepted air temperature range for arriving at thermal neutrality for the residential buildings in the coastal area was between 20.2 and 23.0 degrees Celsius. In the same context, the same type of buildings in the hinterland had temperatures between 21 and 22.6 degrees Celsius. Additionally, the acceptable indoor temperature ranged from 21.2 °C to 22.3 °C in dwellings located in mountainous areas.
In the three research regions, the relative humidity was determined in each region under the neutral thermality condition inside the buildings in the various topography and microclimatic circumstances, showing varying ranges. The coastline region had the largest range of relative humidity, ranging from 61% to 79%, while the hinterland regions had a lesser range, ranging from 62% to 73%. Nonetheless, mountainous areas had the lowest humidity range within the thermal neutrality of the buildings, ranging from 58% to 67%.
The results showed that, in the coastal location, the minimum air temperature needed to reach a thermally neutral level within the building during the winter was 20.2 °C. In order to maintain a better range of acceptable thermal temperature conditions in the winter, the minimum needed air temperature for the heating active systems in each topographic zone was determined. See Figure 6.
However, the average PPDs within buildings at accepted interior temperature limits throughout winter were close to each other in all the regions. In both coastal and hinterland regions, PPD was 7.8%, while it was slightly lower, 7.6%, in the mountainous area.
The statistical analysis of mean differences employed a one-way ANOVA test to examine statistically significant differences among the means of three or more independent groups, referred to as the null hypothesis, during summer and winter. The findings demonstrated that the wintertime results across the three groups in the three locations (coastal, hinterland, and mountainous) indicate an f-ratio value of 0.3682. The p-value is 0.693207. The result reveals that there is no significance at p < 0.05. This suggests that there are no significant statistical differences between the groups. In the same context, in the summertime, the f-ratio value is 0.11334. The p-value is 0.892989. This finding is not significant at p < 0.05. Once more, the findings indicate that there are no statistically significant differences between the groups throughout the summer.
However, the practical utility of data is sometimes determined by factors other than statistical significance. The data nevertheless offer crucial contextual insights about temperature behavior in different places, even if the differences are not statistically significant. Furthermore, the results offer a comprehensive understanding of the range of required air temperature to achieve a neutral thermal condition in each region of the study area.

4. Discussion

The outcomes of the observations and evaluations for one hundred fifty residential buildings in different regions with different elevations above sea level in Kyrenia demonstrate different results. See Table 8.
As shown in Table 8, the maximum acceptable indoor air temperature in summer for maintaining thermal neutrality was 28.9 °C, and the lowest air temperature was 24.1 °C, and they were within the mountainous region. This indicates more flexibility in maintaining thermal comfort inside the buildings with less energy consumption of active cooling systems. Due to the height of the region—altitude [78], which is between 150 m and 300 m above sea level—a lower indoor relative humidity range in neutral thermal conditions was observed, and it was between 38% and 58%. Moreover, the highest percentage of buildings with thermally neutral indoor conditions was in the mountainous region too, and it was 76%. It is important to mention that the lower average PPD was in mountainous and hinterland regions, at 5.8%, while the highest was in the coastal area, at 6.6%. The coastal area demonstrated narrower limits of acceptable air temperature for achieving thermal neutrality, between 24.4 and 28.8 °C, while the narrowest range was in the hinterland area (24.6 °C to 28.8 °C). Despite the higher relative humidity inside the coastal region buildings, which was reflected in the PPD, which was the highest (6.6%), the percentage of the buildings that met thermal neutrality was higher than in hinterland region buildings. This is because the range of the acceptable indoor air temperature for reaching thermal neutrality was wider in the coastal area (24.4 °C to 28.8 °C) than in the hinterland region (24.6 °C to 28.8 °C).
Practically, the energy usage in buildings will increase as the minimum temperature required for thermal neutrality rises. Empirically, the mountainous region will use less energy for cooling due to its broader acceptable indoor temperature range (24.1 °C to 28.9 °C) and lower indoor humidity (38–58%). Less active cooling is required since 76% of the building has reached thermal neutrality. The coastline and hinterland areas, on the other hand, will need more energy for precise cooling to ensure comfort because their temperature ranges are smaller for thermal neutrality. As a result, during the hot season, the mountainous area will use less energy for cooling than other areas.
In winter, the upper and lower air temperatures required to maintain thermal neutrality inside the buildings were 23 °C and 20.9 °C, respectively, in the coastal area with the lowest elevation above sea level (2.5 m to 35 m). Therefore, the highest relative humidity inside a building with neutral thermal conditions was registered in this region, and it was 75%. Moreover, 60% of the selected buildings were within the condition of thermal neutrality, and this was the highest percentage when compared with the hinterland region (58%) and the mountainous region (46%). The acceptable interior air temperature for reaching thermal neutrality in the hinterland region was limited between 21 °C and 22.6 °C, and for the mountainous region, it was between 21.2 °C and 22.3 °C. This demonstrates that the higher energy consumed in mountainous areas in the winter for heating to reach thermal comfort conditions is based on the minimum air temperature degree required to arrive at thermal neutrality.
The coastal zone requires less heating energy to maintain thermal comfort due to the higher relative humidity and lower temperature requirements (high: 23 °C, low: 20.9 °C). However, buildings will require more energy to achieve and maintain these conditions during the cold winter months in the mountainous zone, where the minimum allowable temperature range is much lower (21.2 °C to 22.3 °C). The cooler outside temperatures in the mountainous and hinterland areas are the main cause of the increased need for heating, which raises the energy costs of heating systems to maintain inside thermal neutrality and make up for the temperature differential. As a result, these areas would require more energy and incur higher operating costs than the coastal area.
Several studies in Mediterranean climates about the indoor air temperature range to implement thermal conditions in the buildings have been reviewed and found quite in line with the results of the current study. A study on residential buildings in Cyprus found that the upper and lower air temperatures for achieving thermal neutrality in summer were between 28.5 °C and 31.5 °C [79]. In another study, the neutral temperature in the hot Mediterranean climate (Csa) was found to be between 20 °C and 26 °C [80]. In an office building in the Mediterranean climate of Izmir, Turkey, the neutral thermal temperature was 19.4 °C for summer and 22.4 °C for winter [81].
Identifying the upper and lower air temperatures for arriving at thermal neutrality inside a building, in addition to the other indicators, is a good guideline for architects and heating and cooling specialists. It can help them make more precise decisions to prevent excessive energy consumption to reduce thermal discomfort within buildings and enhance productivity, indoor environments, and the general health of inhabitants.
Furthermore, the current study’s outcomes contain several empirical suggestions for regulating and controlling interior temperatures in different topographic regions in the Mediterranean climates of Cyprus. Although there are small differences in the indoor accepted temperature among the different regions, the result helps to create energy-efficient building designs and improve thermal comfort. The main purpose of this research is to create more sustainable, energy-efficient, and thermally comfortable inner spaces in residential buildings.

5. Conclusions

This study aimed to develop a more accurate thermal comfort evaluation for regions with different elevations above sea level in the Mediterranean climate of Kyrenia, Northern Cyprus. A case study technique was employed to obtain the results, and one hundred fifty residences were selected from three primary regions of the study area: coastal, hinterland, and mountainous, each with varying altitudes above sea level, as illustrated in Figure 3. The chosen buildings utilized a mixed-mode system, with one heating or cooling system operational during the observation period. The PMV-PPD index has been used to assess thermal comfort conditions within buildings in the summer (July) and winter (January).
To achieve this, office work using software (CBE Thermal Comfort Tool-2020) and direct observations at the site were carried out. The goal of this study was to determine the highest and lowest indoor temperatures in buildings with neutral thermal conditions.
The findings indicated that the maximum indoor air temperatures over the summer and the winter were 28.9 °C and 20.9 °C, respectively. These temperature ranges reflect the total inner temperature limitations needed to provide neutral thermal conditions in the Northern Cyprus region of Kyrenia.
Despite the slight differences in indoor acceptable temperature, the outcomes demonstrated that there is a significant effect of the topography and the elevation above sea level on the indoor acceptable thermal temperature ranges to arrive at thermal neutrality. For instance, the mountainous region demonstrated the best topographic area in terms of thermal comfort tolerance within neutral thermal conditions and showed a wider range of acceptable indoor air temperatures in summer, which was between 28.9 °C and 24.1 °C. However, in terms of energy efficiency, the mountainous region in summer was the best with higher air temperature tolerance, and the hinterland and coastal regions were next because the upper temperatures of coastal and hinterland areas were the same. In winter, the coastal area was the best in terms of thermal neutrality achievement through the broader range of temperatures and had a lower indoor acceptable temperature for achieving thermal neutrality, which consumes less energy when active systems are used. Also, a higher percentage of thermal neutrality has been found in this region, with 60% of the total selected dwellings. However, the next was the hinterland region, and the mountainous region showed lower tolerance for thermal neutrality inside the buildings and a higher requirement for heating to reach thermal comfort. Nevertheless, the lowest PPD was found in the mountainous region because of its lower range of relative humidity inside the buildings compared with other regions, as seen in Table 8.
These findings apply to dwellings in the research region and offer novel criteria for active heating and cooling system design. Significantly, understanding interior accepted temperature limits for reaching thermal comfort during the design stage helps engineers and architects create spaces that maximize comfort, reduce energy consumption, and align with the needs and preferences of building occupants. This is accomplished by modifying the active cooling and heating systems within the precise ranges of indoor acceptable temperatures, which usually vary according to the season, the topography, or the elevation above sea level. Extra empirical studies are required to evaluate the amount of reduction in energy consumption for heating and cooling during the application of the findings of the current study.
However, it is worth mentioning that the suggested guideline of this study may vary for other typologies of buildings like commercial, public, and industrial buildings because of the design, building materials, and even HVAC systems. Moreover, the impact of the climate in different climatic zones can be another challenge that limits the results of the current study, which needs to be addressed in future studies as well. Therefore, future studies should focus on examining these types of buildings. In the same context, shading or solar radiation effects can greatly reduce active system demands and improve buildings’ energy efficiency while maintaining residents’ thermal comfort [82,83]. Therefore, future studies should monitor globe temperature (GT), which combines the effects of solar radiation and air temperature [77], within buildings related to various topographic regions. This will help us understand the impact of shading and solar radiation on thermal neutrality evaluation by comparing the findings with those of the current study. On the other hand, finding the relationship between mean radiant temperature (MRT) and the air temperature can give a good indicator of the effect of shading or solar radiation on thermal comfort conditions inside buildings with respect to the orientation of the buildings. Moreover, studying the occupants’ perception of thermal comfort along with the PMV-PPD approach will help in obtaining more realistic outcomes by investigating thermal comfort objectively and subjectively and comparing the results.

Author Contributions

Conceptualization, S.S.M.A.-D. and B.S.; methodology. S.S.M.A.-D.; validation, S.S.M.A.-D.; investigation, S.S.M.A.-D. and B.S.; data curation, S.S.M.A.-D.; writing—original draft preparation, S.S.M.A.-D.; writing—review and editing, S.S.M.A.-D.; funding acquisition, S.S.M.A.-D. and B.S. All authors have read and agreed to the published version of the manuscript.

Funding

This research received no external funding.

Data Availability Statement

The original contributions presented in this study are included in the article. Further inquiries can be directed to the corresponding author.

Conflicts of Interest

The authors declare no conflicts of interest.

References

  1. Lombard, L.P.; Ortiz, J.; Pout, C. A review on buildings energy consumption information. Energy Build. 2008, 40, 394–398. [Google Scholar] [CrossRef]
  2. ISO 7730-2005; Ergonomics of the Thermal Environment-Analytical Determination and Interpretation of Thermal Comfort Using Calculation of the PMV and PPD Indices and Local Thermal Comfort Criteria. International Organization for Standardization: Geneva, Switzerland, 2005. Available online: https://www.iso.org/obp/ui/en/#!iso:std:39155:en (accessed on 30 November 2024).
  3. Ormandy, D.; Ezratty, V. Thermal discomfort and health: Protecting the susceptible from excess cold and excess heat in housing. Adv. Build. Energy Res. 2015, 10, 84–98. [Google Scholar] [CrossRef]
  4. Elshater, A.; Abusaada, H.; Alfiky, A.; El-Bardisy, N.; Elmarakby, E.; Grant, S. Workers’ Satisfaction Vis-à-vis Environmental and Socio-Morphological Aspects for Sustainability and Decent Work. Sustainability 2022, 14, 1699. [Google Scholar] [CrossRef]
  5. Muhy Al-Din, S.S.; Ahmad Nia, H.; Rahbarianyazd, R. Enhancing Sustainability in Building Design: Hybrid Approaches for Evaluating the Impact of Building Orientation on Thermal Comfort in Semi-Arid Climates. Sustainability 2023, 15, 15180. [Google Scholar] [CrossRef]
  6. ASHRAE Standard 55-2020; Thermal Environmental Conditions for Human Occupancy. American Society of Heating, Refrigerating and Air-Conditioning Engineers [ASHRAE]: Atlanta, GA, USA, 2020.
  7. Jeong, B. Assessing indoor air temperature settings in residential buildings during the COVID-19 era. Build. Environ. 2024, 265, 112034. [Google Scholar] [CrossRef]
  8. Homod, R.Z.; Almusaed, A.; Almssad, A.; Jaafar, M.K.; Goodarzi, M.; Sahari, K.S. Effect of different building envelope materials on thermal comfort and air-conditioning energy savings: A case study in Basra city, Iraq. J. Energy Storage 2021, 34, 101975. [Google Scholar] [CrossRef]
  9. Muhy Al-Din, S.S.; Nia, H.A.; Rahbarianyazd, R. Towards Sustainable Living through Thermoneutral Temperature Management in Subtropical Steppe Climates. Sustainability 2024, 16, 5699. [Google Scholar] [CrossRef]
  10. Szokolay, S.V. Introduction to Architectural Science: The Basis of Sustainable Design; Elsevier: Amsterdam, The Netherlands, 2008. [Google Scholar] [CrossRef]
  11. Brawm, G.Z.; Dekay, M. Sun, Wind & Light—Architectural Design Strategies, 2nd ed.; John Wiley & Sons: Hoboken, NJ, USA, 2001. [Google Scholar]
  12. Busch, J.F. Thermal responses to the Thai office environment. ASHRAE Trans. 1990, 96, 859–872. [Google Scholar]
  13. Singh, S. Seasonal evaluation of adaptive use of controls in multi-storied apartments: A field study in composite climate of north India. Int. J. Sustain. Built Environ. 2016, 5, 83–98. [Google Scholar] [CrossRef]
  14. Korsavi, S.S.; Montazami, A. Children’s thermal comfort and adaptive behaviours; UK primary schools during non-heating and heating seasons. Energy Build. 2020, 214, 109857. [Google Scholar] [CrossRef]
  15. Al-Hafith, O.; Satish, B.K.; Wilde, P.D.; Korsavi, S.S. Impact of Energy-consuming Air Conditioning Systems on People’s Thermal Comfort and Preferences: Comparative Study of Iraq and Gulf Cooperation Council Countries. J. Archit. Environ. Struct. Eng. Res. 2024, 7, 1–19. [Google Scholar] [CrossRef]
  16. Haddad, S.; Osmond, P.; King, S. Revisiting thermal comfort models in Iranian classrooms during the warm season. Build. Res. Inf. 2016, 45, 457–473. [Google Scholar] [CrossRef]
  17. Safakli, O.V. An overview of the construction sector in Northern Cyprus. Afr. J. Bus. Manag. 2011, 5, 13383–13387. [Google Scholar] [CrossRef]
  18. Adunola, A.O.; Ajibola, K. Factors significant to thermal comfort within residential neighborhoods of Ibadan metropolis and preferences in adult residents’ use of spaces. SAGE Open 2016, 6, 2158244015624949. [Google Scholar] [CrossRef]
  19. Han, J.; Zhang, G.; Zhang, Q.; Zhang, J.; Liu, J.; Tian, L.; Zheng, C.; Hao, J.; Lin, J.; Liu, Y.; et al. Field study on occupants’ thermal comfort and residential thermal environment in a hot-humid climate of China. Build. Environ. 2007, 42, 4043–4050. [Google Scholar] [CrossRef]
  20. Yu, W.; Li, B.; Yao, R.; Wang, D.; Li, K. A study of thermal comfort in residential buildings on the Tibetan Plateau, China. Build. Environ. 2017, 119, 71–86. [Google Scholar] [CrossRef]
  21. Rijal, H.B.; Yoshida, K.; Humphreys, M.A.; Nicol, J.F. Development of an adaptive thermal comfort model for energy-saving building design in Japan. Archit. Sci. Rev. 2020, 64, 109–122. [Google Scholar] [CrossRef]
  22. Nicol, J.; Raja, I.A.; Allaudin, A.; Jamy, G.N. Climatic variations in comfortable temperatures: The Pakistan projects. Energy Build. 1999, 30, 261–279. [Google Scholar] [CrossRef]
  23. Nicol, F.; Humphreys, M. Maximum temperatures in European office buildings to avoid heat discomfort. Sol. Energy 2007, 81, 295–304. [Google Scholar] [CrossRef]
  24. Jindal, A. Thermal comfort study in naturally ventilated school classrooms in composite climate of India. Build. Environ. 2018, 142, 34–46. [Google Scholar] [CrossRef]
  25. Shrestha, M.; Rijal, H.B.; Kayo, G.; Shukuya, M. A field investigation on adaptive thermal comfort in school buildings in the temperate climatic region of Nepal. Build. Environ. 2021, 190, 107523. [Google Scholar] [CrossRef]
  26. Nematchoua, M.K.; Ricciardi, P.; Reiter, S.; Asadi, S.; Demers, C.M. Thermal comfort and comparison of some parameters coming from hospitals and shopping centers under natural ventilation: The case of Madagascar Island. J. Build. Eng. 2017, 13, 196–206. [Google Scholar] [CrossRef]
  27. Azizpour, F.; Moghimi, S.; Lim, C.H.; Mat, S.; Salleh, E.; Sopian, K. A thermal comfort investigation of a facility department of a hospital in hot-humid climate: Correlation between objective and subjective measurements. Indoor Built Environ. 2013, 22, 836–845. [Google Scholar] [CrossRef]
  28. Peeters, L.; de Dear, R.; Hensen, J.; D’haeseleer, W. Thermal comfort in residential buildings: Comfort values and scales for building energy simulation. Appl. Energy 2009, 86, 772–780. [Google Scholar] [CrossRef]
  29. Nikolopoulou, M. Outdoor Thermal Comfort. Front. Biosci. 2011, 3, 1552–1568. [Google Scholar] [CrossRef]
  30. Parsons, K. Human Thermal Environment: The Effects of Hot, Moderate, and Cold Environments on Human Health, Comfort and Performance; Taylor & Francis: New York, NY, USA, 2022; ISBN 0-415-23793-9. [Google Scholar]
  31. Cui, W.; Cao, G.; Park, J.H.; Ouyang, Q.; Zhu, Y. Influence of indoor air temperature on human thermal comfort, motivation and performance. Build. Environ. 2013, 68, 114–122. [Google Scholar] [CrossRef]
  32. Reiter, S.; De Herde, A. Quantitative and qualitative criteria for comfortable urban public spaces. In Research in Building Physics; Carmeliet, J., Hens, H., Vermeir, G., Eds.; CRC Press: Boca Raton, FL, USA, 2003; pp. 1001–1011. [Google Scholar] [CrossRef]
  33. Setaih, K.; Hamza, N.; Townshend, T. Assessment of outdoor thermal comfort in urban microclimate in hot arid areas. In Proceedings of the 13th International Conference of International Building Performance Simulation Association, Chambery, France, 25–28 August 2013. [Google Scholar] [CrossRef]
  34. Zheng, P.; Yao, R.; Toftum, J.; Liu, S.; Kalmár, F.; Li, B. Evaluation methods and factors influencing the thermal comfort of children—A comprehensive literature review. J. Build. Eng. 2024, 95, 110063. [Google Scholar] [CrossRef]
  35. Gilani, S.I.u.H.; Khan, M.H.; Pao, W. Thermal Comfort Analysis of PMV Model Prediction in Air Conditioned and Naturally Ventilated Buildings. Energy Procedia 2015, 75, 1373–1379. [Google Scholar] [CrossRef]
  36. Fanger, P.O. Thermal Comfort: Analysis and Applications in Environmental Engineering; Danish Technical Press: Copenhagen, Denmark, 1970; ISBN 978-87-571-0341-0. [Google Scholar]
  37. Peng, X.; Wu, W.; Zheng, Y.; Sun, J.; Hu, T.; Wang, P. Correlation analysis of land surface temperature and topographic elements in Hangzhou, China. Sci. Rep. 2020, 10, 10451. [Google Scholar] [CrossRef]
  38. Whiteman, C.D.; Haiden, T.; Pospichal, B.; Eisenbach, S.; Steinacker, R. Minimum Temperatures, Diurnal Temperature Ranges, and Temperature Inversions in Limestone Sinkholes of Different Sizes and Shapes. J. Appl. Meteorol. 2004, 43, 1224–1236. [Google Scholar] [CrossRef]
  39. Givoni, B.; Reinhold, V.N. Passive and Low Energy Cooling of Building; John Wiley & Sons, Inc.: Hoboken, NJ, USA, 1994. [Google Scholar]
  40. Muhy Al-Din, S.; Iranfare, M.; Surchi, Z. Building Thermal Comfort Basedon Envelope Development: Criteria for selecting right case study in Kyrenia-North Cyprus. Energy Procedia 2017, 115, 80–91. [Google Scholar] [CrossRef]
  41. Thapa, S. Thermal comfort in high altitude Himalayan residential houses in Darjeeling, India-An adaptive approach. Indoor Built Environ. 2020, 29, 84–100. [Google Scholar] [CrossRef]
  42. Katafygiotou, M.C.; Serghides, D.K. Bioclimatic chart analysis in three climate zones in Cyprus. Indoor Built Environ. 2014, 24, 746–760. [Google Scholar] [CrossRef]
  43. Yilmaz, S.; Akif Irmak, M.; And Matzarakis, A. The Importance of Thermal Comfort in Different Elevation for City Planning. Glob. NEST J. 2013, 15, 408–420. [Google Scholar] [CrossRef]
  44. Seppanen, O.; Fisk, W.J.; Faulkner, D. Cost benefit analysis of the night-time ventilative cooling in office building. In Proceedings of the Healthy Buildings 2003 Conference (Vol. 3). Indoor Environment Group, Sustainable Energy Department, Energy Analysis and Environmental Impacts Division, Singapore, 7–11 December 2003; Available online: https://escholarship.org/uc/item/3j82f642 (accessed on 18 January 2025).
  45. Tanabe, S.I.; Nishihara, N.; Haneda, M. Performance evaluation measures for workplace productivity. In Proceedings of the 6th International Conference on Indoor Air Quality, Ventilation and Energy Conservation in Buildings: Sustainable Built Environment, Sendai, Japan, 28–31 October 2007; pp. 663–670. Available online: https://www.researchgate.net/publication/267934542_Performance_evaluation_measures_for_workplace_productivity (accessed on 10 December 2024).
  46. Berglund, L.G.; Gonzalez, R.R.; Gagge, A.P. Predicting human performance decrement from thermal discomfort and ET. In Proceedings of the 5th International Conference on Indoor Air Quality and Climate, Toronto, ON, Canada, 29 July–3 August 1990; Volume 1, pp. 215–220, “Human Health, Comfort and Performance”. Available online: https://www.aivc.org/resource/predicting-human-performance-decrement-thermal-discomfort-and-et (accessed on 13 November 2024).
  47. Niemela, R.; Hannula, M.; Rautio, S.; Reijula, K.; Railio, J. The effect of air temperature on labour productivity in call centres-a case study. Energy Build. 2022, 34, 759–764. [Google Scholar] [CrossRef]
  48. Johansson, C.R. Mental and Perceptual Performance in Heat; Svensk Byggtjänst: Stockholm, Sweden, 1975. [Google Scholar]
  49. Pepler, R.D. Temperature and learning, an experiment study. ASHRAE Trans. 1968, 74, 211–219. [Google Scholar] [CrossRef]
  50. Fang, L.; Wyon, D.P.; Clausen, G.; Fanger, P.O. Impact of indoor air temperature and humidity in an office on perceived air quality, SBS symptoms and performance. Indoor Air 2004, 14, 74–81. [Google Scholar] [CrossRef]
  51. Seppänen, O.A.; Fisk, W.J.; Mendell, M.J. Association of ventilation rates and CO2 concentrations with health andother responses in commercial and institutional buildings. Indoor Air 1999, 9, 226–252. [Google Scholar] [CrossRef]
  52. De Dear, R.J.; Brager, G.S. Thermal comfort in naturally ventilated buildings: Revisions to ASHRAE Standard 55. Energy Build. 2002, 34, 549–561. [Google Scholar] [CrossRef]
  53. Wu, Z.; Li, N.; Wargocki, P.; Peng, J.; Li, J.; Cui, H. Field study on thermal comfort and energy saving potential in 11 split air-conditioned office buildings in Changsha, China. Energy 2019, 182, 471–482. [Google Scholar] [CrossRef]
  54. Barreca, A.; Clay, K.; Deschenes, O.; Greenstone, M.; Shapiro, J.S. Adapting to climate change: The remarkable decline in the US temperature-mortality relationship over the twentieth century. J. Political Econ. 2016, 124, 105–159. [Google Scholar] [CrossRef]
  55. World Economic Forum Annual Meeting|World Economic Forum. Available online: https://www.weforum.org/events/world-economic-forum-annual-meeting-2019/sessions/strategic-outlook-on-the-future-of-energy/ (accessed on 16 December 2024).
  56. Chang, C.; Zhu, N.; Yang, K.; Yang, F. Data and analytics for heating energy consumption of residential buildings: The case of a severe cold climate region of China. Energy Build. 2018, 172, 104–115. [Google Scholar] [CrossRef]
  57. Almasri, R.A.; Alshitawi, M.S. Electricity consumption indicators and energy efficiency in residential buildings in GCC countries: Extensive review. Energy Build. 2022, 255, 111664. [Google Scholar] [CrossRef]
  58. Dincer, I.; Rosen, M.A. Energy, environment and sustainable development. Appl. Energy 1999, 64, 427–440. [Google Scholar] [CrossRef]
  59. Lamsal, P.; Bajracharya, S.B.; Rijal, H.B. A Review on Adaptive Thermal Comfort of Office Building for Energy-Saving Building Design. Energies 2023, 16, 1524. [Google Scholar] [CrossRef]
  60. Nicol, J.F.; Humphreys, M.A.; Roaf, S. Adaptive Thermal Comfort: Principles and Practice; Routledge, Taylor & Francis Group: London, UK; New York, NY, USA, 2012. [Google Scholar] [CrossRef]
  61. Wang, Z. A field study of the thermal comfort in residential buildings in Harbin. Build. Environ. 2006, 41, 1034–1039. [Google Scholar] [CrossRef]
  62. Donnini, G.; Molina, J.; Martello, C.; Lai, D.H.C.; Lai, H.K.; Chang, C.; Laflamme, M.; Van Nguyen, H.P.E.; Haghighat, F. Field study of occupant comfort and office thermal environments in a cold climate. ASHRAE Trans. 1996, 102, 795–802. [Google Scholar]
  63. Zhang, H.; Arens, E.; Kim, D.E.; Buchberger, E.; Bauman, F.; Huizenga, C. Comfort, perceived air quality, and work performance in a low power task- ambient conditioning system. Build. Environ. 2009, 45, 29–39. [Google Scholar] [CrossRef]
  64. Humphreys, M.A.; Nicol, J.F. Understanding the adaptive approach to thermal comfort. ASHRAE Trans. 1998, 104, 991–1004. [Google Scholar]
  65. Hawila, A.W. Integrating Occupants’ Thermal Comfort in the Design of Energy-Efficient Buildings. Ph.D. Thesis, University of Technology-ICD-UTT, Troyes, France, 2019. Available online: https://www.researchgate.net/publication/359440615_L%E2%80%99integration_du_confort_thermique_des_occupants_dans_la_conception_des_batiments_performants (accessed on 8 January 2025).
  66. Mishra, A.K.; Ramgopal, M. Thermal comfort in undergraduate laboratories-A field study in Kharagpur, India. Build. Environ. 2014, 71, 223–232. [Google Scholar] [CrossRef]
  67. Indraganti, M. Using the adaptive model of thermal comfort for obtaining indoor neutral temperature: Findings from a field study in Hyderabad, India. Build. Environ. 2010, 45, 519–536. [Google Scholar] [CrossRef]
  68. Peel, M.C.; Finlayson, B.L.; McMahon, T.A. Updated world map of the Köppen-Geiger climate classification. Hydrol. Earth Syst. Sci. 2007, 11, 1633–1644. [Google Scholar] [CrossRef]
  69. Sundseth, K. Natura 2000 in the Mediterranean Region. European Communities. 2009. Available online: https://kykpee.org/wp-content/uploads/2015/08/natura_2000_in_the_mediterranean_region_en.pdf (accessed on 8 January 2025).
  70. Causone, F.; Pietrobon, M.; Pagliano, L.; Erba, S. A high-performance home in the Mediterranean climate: From the design principle to actual measurements. Energy Procedia 2017, 140, 67–79. [Google Scholar] [CrossRef]
  71. Bey, E.; Turkes, M.; Hamed, M.M. Long-term air temperature trends in North Cyprus. Theor. Appl. Climatol. 2024, 155, 1113–1122. [Google Scholar] [CrossRef]
  72. Lingis, P.; Michaelides, S.C. Teleconnection patterns of the Siberian Anticyclone and precipitation over Cyprus. Atmos Res. 2009, 94, 663–674. [Google Scholar] [CrossRef]
  73. Cyprus Meteorological Department. Department of Meteorology. Retrieved from The Climate of Cyprus. 2014. Available online: http://www.moa.gov.cy/moa/ms/ms.nsf/Dmlcyclimate_en/DMLcyclimate_en (accessed on 12 January 2025).
  74. Elkiran, G.; Nourani, V.; Elvis, O.; Abdullahi, J. Impact of climate change on hydro-climatological parameters in North Cyprus:Application of artificial intelligence-based statistical downscaling models. J. Hydroinformatics 2021, 23, 1395–1415. [Google Scholar] [CrossRef]
  75. Tartarini, F.; Schiavon, S.; Cheung, T.; Hoyt, T. CBE Thermal Comfort Tool: Online tool for thermal comfort calculations and visualizations. SoftwareX 2020, 12, 100563. [Google Scholar] [CrossRef]
  76. Makwana, D.; Engineer, P.; Dabhi, A.; Chudasama, H. Sampling Methods in Research: A Review. Int. J. Trend Sci. Res. Dev. 2023, 7, 762–768. Available online: https://archive.org/details/httpswww.ijtsrd.com.commedicineayurvedic57470sampling-methods-in-research-a-reviewdhaval-makwana (accessed on 18 February 2025).
  77. Amen, M.Z.; Afara, A.; Muhy-Al-Din, S.S. The Persuasibility of Globe Thermometer in Predicting Indoor Thermal Comfort Using Non-standard Globe Diameter: Row Houses of Semi-Arid Climates as case studies. Civ. Eng. Arch. 2024, 12, 425–435. [Google Scholar] [CrossRef]
  78. Turgut, E.T.; Usanmaz, O. An Analysis of Vertical Profiles of Wind and Humidity Based On Long-Term Radiosonde Data in Turkey. Anadolu Univ. J. Sci. Technol. Appl. Sci. Eng. 2016, 17, 830–844. [Google Scholar] [CrossRef]
  79. Ozarisoy, B.; Altan, H. Regression forecasting of “neutral” adaptive thermal comfort: A field study investigation in the south-eastern Mediterranean climate of Cyprus. Build. Environ. 2021, 202, 108013. [Google Scholar] [CrossRef]
  80. Labdaoui, K.; Mazouz, S.; Reiter, S.; Teller, J. Thermal perception in outdoor urban spaces under the Mediterranean climate of Annaba, Algeria. Urban Clim. 2021, 39, 100970. [Google Scholar] [CrossRef]
  81. Turhan, C.; Akkurt, G. Assessment of Thermal Comfort Preferences in Mediterranean Climate: A University Office Building Case. Therm. Sci. 2018, 22, 2177–2187. [Google Scholar] [CrossRef]
  82. Pérez-Carramiñana, C.; González-Avilés, Á.B.; Castilla, N.; Galiano-Garrigós, A. Influence of Sun Shading Devices on Energy Efficiency, Thermal Comfort and Lighting Comfort in a Warm Semi-Arid Dry Mediterranean Climate. Buildings 2024, 14, 556. [Google Scholar] [CrossRef]
  83. Jega, A.I.; Muhy Al-Din, S.S. Implication of Shading Passive Strategies in Buildings of Hot and Humid Climates for Energy Optimization: Lessons from Vernacular Dwellings in Nigeria. J. Salut. Archit. 2023, 2, 50–69. [Google Scholar] [CrossRef]
Figure 1. Kyrenia within the topographic map of Cyprus, showing the geographical characteristics [71].
Buildings 15 00899 g001
Figure 2. The outline of the research methodology.
Buildings 15 00899 g002
Figure 3. (a) Kyrenia city (bird’s eye) with its various topographies; (b) the land-form analysis of topographic regions, coastal, hinterland, and mountainous regions with specific elevations within the context of this study.
Buildings 15 00899 g003
Figure 4. The location of the selected case study buildings with different building groups in the three different landforms.
Buildings 15 00899 g004
Figure 5. The acceptable indoor temperature in different topographic regions in the Mediterranean climates of Kyrenia in summer.
Buildings 15 00899 g005
Figure 6. The wintertime acceptable indoor temperature in Kyrenia’s Mediterranean climates across various topographic locations.
Buildings 15 00899 g006
Table 1. The tools and specific values for the required variables to be applied in the CBE Thermal Comfort Tool to evaluate PMV-PPD in this study.
No.The VariablesObservation Tool Location of the ObservationMetabolic Rate (Met) (Seated and Quiet)Clo SummerClo Winter
Environmental
1Indoor Globe Temperature (GT)Glob thermometer EXTECH-H30 (globe diameter: 40 mm)Family Lounge
2Indoor Air Temperature (ATi) The weather station “HAMA” electronic setFamily Lounge
3Indoor Relative Humidity (RHi)The weather station “HAMA” electronic setFamily Lounge
4Airspeed (Vs)Anemometer model DA02Family Lounge
Personal
5The activity level and Insulation level of clothing Family Lounge1.0 0.51.0
Table 2. The number of case studies in the neutral thermal state inside the buildings in the coastal area during the warm season.
No.GTATiAvMRTRHiPMVPPDSensation
126.4270.125.863%0.256%Neutral
224.926.50.1623.065%−0.48%Neutral
325.2250.1125.462%−0.277%Neutral
425.926.80.125.070%0.135%Neutral
526270.1724.660%−0.125%Neutral
625.6260.0825.363%0.025%Neutral
725.825.60.126.065%0.025%Neutral
827.126.70.0827.458%0.510%Neutral
927.427.20.1425.352%0.4910%Neutral
102728.70.1424.964%0.439%Neutral
1126.9280.125.864%0.469%Neutral
1226.626.30.1126.958%0.226%Neutral
1327.2270.0827.451%0.4910%Neutral
1424.924.40.0425.250%−0.459%Neutral
152525.80.0824.359%−0.236%Neutral
162627.50.124.563%0.125%Neutral
1726.325.90.0526.659%0.196%Neutral
1825.524.70.0623.053%−0.216%Neutral
1926.328.80.1822.768%0.015%Neutral
2025.626.20.1522.367%−0.125%Neutral
2126.6260.0927.260%0.327%Neutral
2227.326.90.0622.150%0.55%Neutral
2325.825.10.126.560%−0.035%Neutral
2426.225.70.126.575%0.256%Neutral
2525.424.80.0725.957%−0.196%Neutral
2626.726.10.0627.161%0.347%Neutral
2725.626.90.0924.466%0.045%Neutral
Table 3. The neutral thermal state inside the case study buildings in the hinterland area in the warm season.
No.GTATiAvMRTRHiPMVPPDSensation
126.227.50.1624.560%0.005%Neutral
224.726.10.0823.555%−0.347%Neutral
325.526.20.124.857%−0.145%Neutral
426.628.30.1124.856%0.246%Neutral
526.5280.1324.864%0.226%Neutral
626.428.80.1225.370%0.297%Neutral
726.6280.0725.555%0.48%Neutral
825.527.40.0324.654%0.125%Neutral
924.825.90.0424.256%−0.256%Neutral
1025.525.40.0525.658%−0.15%Neutral
112524.60.0925.464%−0.266%Neutral
1226.125.40.0426.562%0.095%Neutral
1325.5260.125.060%−0.125%Neutral
1425.826.20.1525.359%−0.095%Neutral
152626.30.1225.754%0.065%Neutral
1625.225.70.0624.866%−0.15%Neutral
1725.324.90.0925.760%−0.186%Neutral
1826.326.20.0826.458%0.216%Neutral
1925.925.80.0426.064%0.115%Neutral
2025.625.20.0625.956%−0.115%Neutral
2126.926.50.0727.261%0.459%Neutral
2225.926.70.125.162%0.065%Neutral
Table 4. The state of thermal neutrality in buildings located in the mountainous area during the summer.
No.GTATiAvMRTRHiPMVPPDSensation
127.4270.1227.850%0.429%Neutral
226.2260.126.457%0.15%Neutral
326.3280.1625.752%−0.045%Neutral
425.926.20.0625.746%−0.025%Neutral
526.426.50.0526.350%0.136%Neutral
625.826.70.1524.753%−0.155%Neutral
726.926.50.0727.246%0.317%Neutral
826.126.40.0925.851%0.065%Neutral
925.4270.1423.452%−0.297%Neutral
1026.626.30.1226.950%0.125%Neutral
1125.625.20.0825.951%−0.155%Neutral
1227.2270.127.444%0.368%Neutral
132726.50.1327.649%0.246%Neutral
1424.425.80.0923.156%−0.4910%Neutral
1526.325.50.1127.145%−0.015%Neutral
1624.924.80.072543%−0.469%Neutral
1726.826.80.0626.855%0.388%Neutral
1826.226.80.1125.652%0.045%Neutral
1926.325.90.0926.740%0.035%Neutral
202625.70.0826.343%−0.045%Neutral
2126.3270.0525.839%0.15%Neutral
2226.627.70.1525.244%0.045%Neutral
2326.326.50.0726.148%0.135%Neutral
2426.125.70.0626.447%0.015%Neutral
2526.425.90.1126.949%0.065%Neutral
2625.124.10.082647%−0.418%Neutral
2726.8280.1224.745%0.176%Neutral
2825.826.60.112550%−0.125%Neutral
2926.626.10.0927.152%0.246%Neutral
3026.325.90.1326.856%0.035%Neutral
3126.125.50.127.258%0.166%Neutral
322726.30.0827.638%0.266%Neutral
3326.425.90.126.953%0.145%Neutral
3426.828.90.1124.658%0.358%Neutral
3525.325.20.0725.448%−0.266%Neutral
3625.625.30.0825.954%−0.15%Neutral
3726.125.70.1226.557%−0.025%Neutral
Table 5. The state of neutral indoor thermal environment in buildings positioned in coastal areas during winter.
No.GTATiAvMRTRHiPMVPPDSensation
120.621.4020.675%−0.48%Neutral
220.721.50.0220.477%−0.398%Neutral
320.920.9020.969%−0.4910%Neutral
420.621.3020.671%−0.449%Neutral
520.921.8020.973%−0.317%Neutral
621.121.70.0120.970%−0.358%Neutral
72223021.578%0.065%Neutral
820.221.10.012078%−0.510%Neutral
920.620.9020.673%−0.510%Neutral
102121.602161%−0.419%Neutral
1121.622.3021.676%−0.125%Neutral
1220.921.4020.972%−0.388%Neutral
132121.902170%−0.37%Neutral
142121.602168%−0.378%Neutral
1521.622021.667%−0.246%Neutral
1620.520.9020.575%−0.4910%Neutral
1721.822.3021.879%−0.085%Neutral
1820.321020.376%−0.4910%Neutral
1920.720.9020.771%−0.510%Neutral
2022.222.6022.278%0.015%Neutral
2121.121.7021.174%−0.37%Neutral
2220.821.1020.867%−0.4810%Neutral
2321.522021.574%−0.26%Neutral
2420.921.9020.965%−0.358%Neutral
2520.421.6020.466%−0.459%Neutral
2622.523.0022.576%0.105%Neutral
2720.421.8020.469%−0.48%Neutral
2821.722.5021.776%−0.085%Neutral
2921.322021.370%−0.256%Neutral
302121.402172%−0.378%Neutral
Table 6. Thermal neutrality inside buildings in the hinterland area in winter.
No.GTATiAvMRTRHiPMVPPDSensation
121.922.6021.973%−0.065%Neutral
220.921.7020.962%−0.48%Neutral
320.721020.768%−0.510%Neutral
421.121.5021.167%−0.388%Neutral
521.422.1021.470%−0.226%Neutral
62121.602164%−0.398%Neutral
721.321.9021.368%−0.287%Neutral
820.721.3020.765%−0.4710%Neutral
921.221.7021.262%−0.378%Neutral
1021.121.4021.170%−0.388%Neutral
1121.522.1021.571%−0.26%Neutral
122121.802168%−0.337%Neutral
1320.821.5020.862%−0.459%Neutral
1421.121.6021.163%−0.398%Neutral
1521.221.4021.269%−0.378%Neutral
1620.621.5020.662%−0.4710%Neutral
1721.922.5021.972%−0.085%Neutral
1820.921.5020.966%−0.418%Neutral
1920.521.5020.564%−0.4710%Neutral
202121.302167%−0.418%Neutral
2121.421.8021.464%−0.317%Neutral
2220.721.3020.762%−0.4910%Neutral
2321.622.1021.671%−0.196%Neutral
2420.521.5020.568%−0.449%Neutral
2521.121.8021.166%−0.337%Neutral
262121.402165%−0.429%Neutral
2721.322021.363%−0.37%Neutral
2821.822.3021.869%−0.155%Neutral
2920.821.5020.866%−0.429%Neutral
Table 7. Indoor thermoneutral temperature ranges inside buildings in the mountainous area in winter.
No.GTATiAvMRTRHiPMVPPDSensation
12121.802163%−0.378%Neutral
221.322021.365%−0.287%Neutral
320.721.6020.758%−0.478%Neutral
420.921.7020.962%−0.48%Neutral
521.421.9021.464%−0.37%Neutral
620.521.4020.563%−0.4910%Neutral
720.921.2020.961%−0.4910%Neutral
820.821.5020.862%−0.459%Neutral
921.622021.665%−0.256%Neutral
1020.821.6020.864%−0.429%Neutral
1121.421.9021.463%−0.37%Neutral
1221.622.2021.667%−0.26%Neutral
1321.521.7021.562%−0.337%Neutral
1421.822.1021.866%−0.26%Neutral
1521.221.8021.265%−0.337%Neutral
1620.921.5020.964%−0.429%Neutral
172121.402163%−0.439%Neutral
1821.922.2021.966%−0.176%Neutral
1921.622.3021.667%−0.196%Neutral
2020.921.8020.963%−0.388%Neutral
2121.121.7021.164%−0.368%Neutral
2221.121.6021.161%−0.48%Neutral
2321.522021.565%−0.266%Neutral
Table 8. The effect of topography on acceptable temperature, relative humidity, and predicted percentage of dissatisfied inside the buildings in the study area.
No.RegionMax. Neutral thermal Temperature (°C)Min.
Neutral Thermal Temperature
(°C)
Percentage of Indoor Thermal Neutrality Within Total Number of BuildingsRelative Humidity Ranges Inside the BuildingsPPD
Summer
1Coastal24.428.854%50% to 75%6.6%
2Hinterland24.628.844%54% to 70%5.8%
3Mountainous24.128.976%38% to 58%5.8%
Winter
1Coastal20.92360%61% to 79%7.8%
2Hinterland2122.658%62% to 73%7.8%
3Mountainous21.222.346%58% to 67%7.6%
Disclaimer/Publisher’s Note: The statements, opinions and data contained in all publications are solely those of the individual author(s) and contributor(s) and not of MDPI and/or the editor(s). MDPI and/or the editor(s) disclaim responsibility for any injury to people or property resulting from any ideas, methods, instructions or products referred to in the content.

