Abstract
In the process of deepening the strategy of rural revitalization in China, the transformation of rural houses is an important part of promoting rural revitalization. Rural houses are the living places of the majority of rural residents, and there have been problems of poor thermal comfort and high energy consumption in the Xuzhou area for a long time. At present, the starting point of domestic research on the transformation of rural houses is mostly single-objective optimization of thermal comfort or energy conservation, and few studies involve these two aspects at the same time. In this study, based on field investigation, questionnaire surveys, software simulation, orthogonal testing, and other research methods, an adaptive thermal comfort model for rural residents in the Xuzhou area was established, and the factors affecting the indoor thermal comfort and energy consumption of the rural houses were simulated. In order to jointly improve indoor thermal comfort and reduce energy consumption in rural houses, an optimal transformation scheme suitable for existing rural houses in the Xuzhou area was proposed. By comparing the data of indoor thermal comfort and annual energy consumption of a typical rural house before and after the transformation, and then estimating the cost required for the transformation of the house, the advantages of the transformation scheme in terms of effectiveness and economy were verified.
1. Introduction
Given the increasingly urgent issue of climate change, carbon reduction has become a key focus in global governance [1]. As an important measure to improve the ecological environment and accelerate the transformation to a green economy, the goal of “double carbon” (shorthand for carbon peaking and carbon neutrality) is promoting energy conservation and emissions reduction in various fields [2]. In this context, the 19th National Congress of the Communist Party of China proposed that the implementation of the concept of “green livability” is an important guarantee for the strategy of rural revitalization and development, and it especially emphasized that the energy conservation and emissions reduction of rural houses should be the focus of rural construction reform [3]. In recent years, in order to speed up the improvement of residents’ housing conditions in rural areas, the government of Jiangsu Province issued the Special Action Plan for the Improvement of Rural Housing Conditions in March 2022, which proposes the need to pay attention to the transformation of rural houses for energy conservation, and to take into account the improvement of residential comfort. Xuzhou City, as one of the central cities of the three metropolitan areas in Jiangsu Province, is listed as the pilot area for the improvement of rural houses in northern Jiangsu. With the continuous growth of the rural economy in Xuzhou City, rural residents’ requirements for residential comfort are also increasing, and their expectations for housing have expanded from the past demand of “having a house to live in” to the pursuit of a comfortable indoor environment. Through an investigation, it was found that the existing rural houses in Xuzhou are mostly built independently by local construction teams according to their experience, lacking any corresponding technical guidance. As a result, the thermal performance of the building envelope of rural houses is poor, and a lot of energy is consumed in winter and summer to meet the comfortable indoor temperature requirements of the human body.
In recent years, with the continuous advancement of energy-saving and emissions reduction policies in China, the energy-saving renovation of rural residences has attracted widespread attention from both academia and policymakers. Existing literature reviews indicate that research on energy conservation in rural housing primarily focuses on aspects such as the assessment of current energy-saving status, exploration of potential, technological measures, and policy support analysis [4]. First, regarding the energy-saving status and potential of rural residences, studies show that although rural housing faces deficiencies in energy efficiency, there is substantial potential for energy savings [5]. Traditional housing, due to outdated design and materials, results in high energy consumption, while optimized design and the use of new materials are considered key to enhancing energy efficiency. Improving the thermal insulation of external walls and upgrading windows’ energy-efficiency levels are effective measures for tapping into energy-saving potential [6]. Secondly, research on energy-saving renovation strategies focuses on technological measures. Scholars have proposed various energy-saving renovation plans, including the installation of efficient heating systems, the optimization of building envelopes, and the application of renewable energy technologies. Improvements in novel insulation materials and heating systems have been proven to effectively reduce energy consumption. With the popularization of green buildings, low energy consumption, and ecological design concepts in urban buildings, the transformation and improvement of human thermal comfort and the energy conservation efficiency of buildings has become a research hotspot in the academic circle. In terms of improving the thermal comfort of rural houses, the study of foreign scholar M·Missoum [7] showed that, in the process of building rural houses, measures such as enhancing the thermal performance of exterior walls and other parts of the building envelope, increasing the area of exterior windows, adding shading facilities, and selecting appropriate orientation are conducive to improving the thermal comfort and energy efficiency of rural houses. UllarAlev [8] and his team studied the transformation of rural houses in the Baltic Sea region through software simulations and field investigations, and they pointed out that improving the airtightness of the building envelope of rural houses has an important impact on the enhancement of indoor thermal comfort and reduction in energy consumption. The research of Sarkar Amitava [9] emphasizes that the addition of insulation facilities to walls and roofs can effectively improve the thermal comfort of a living room in cold winters and hot summers, and it can also significantly reduce the energy consumption of buildings during the heating process. Aimilios Michael [10] and colleagues conducted a study focusing on rural residences in Cyprus, primarily exploring how natural ventilation affects the indoor thermal environment in summer. They compared different window-opening methods and ventilation strategies, demonstrating that the building envelope plays a crucial role in optimizing the indoor thermal environment and reducing energy consumption in rural homes. M. Césaire Hema [11] and colleagues examined the impact of wall system designs, primarily using Compressed Earth Blocks (CEBs), on the indoor thermal comfort of naturally ventilated homes. Simulation results indicated that the profile of thermal discomfort varies with different wall designs and architectural spaces. According to the characteristics of various climate zones and the current situation of local villagers’ thermal adaptation, domestic scholars have carried out studies from the perspectives of spatial form and building envelope. For instance, Bao Chunxiao [12] and other scholars proposed a set of measures to optimize indoor thermal comfort by studying the structural characteristics of rural houses in cold regions, such as reducing the shape coefficient, optimizing the spatial layout, and improving the thermal performance of the building envelope. Pan Xin and Wei Shule [13] studied rural houses in areas characterized by hot summers and cold winters, and they advocated improving the plane layout of buildings, making full use of vertical natural ventilation, and strengthening the thermal performance of exterior walls and other thermal insulation facilities to improve indoor thermal comfort. Shi Chen [14] took rural houses in Nantong City as the research object and conducted software simulations, finding that the duration of indoor thermal comfort could be increased by 123 hours through adding XPS insulation boards to the exterior walls, thermal ceilings and tiger windows to the roofs, and additional sunshine rooms to the rural houses. Shao Shiyuan [15] conducted an analysis of the indoor thermal comfort of rural residences in eastern Hebei using software simulation methods, focusing on the building envelope and floor plan layout. The research findings indicated that, to improve indoor thermal comfort, rural homes in this region need to undergo functional layout optimization and adopt appropriate insulation materials. Liu Ping [16] and colleagues, through their research and analysis, found that the rational selection of building materials and optimization of architectural structure can effectively enhance the thermal insulation capacity of rural homes. For example, using materials with better thermal performance or adopting rational floor plan designs can significantly improve the indoor thermal environment to some extent. In terms of the energy conservation of rural houses, Andre Feliks Setiawan et al. [17] used eQUEST(3.63b) software to simulate and quantify the impact of different types of roof structure, exterior window glass, and shading methods on the energy consumption of 2-story residential buildings in Indonesia. The results showed that the contribution to the energy consumption, from large to small, was shading methods, types of window glass, and roof structure, providing a reference for the design of houses for energy conservation. L.D. Danny Harvey [18] reduced buildings’ energy consumption by 50–75% by improving the physical design of residential buildings, enhancing the insulation efficiency of their building envelope, and improving the efficiency of energy-use devices in the Toronto area. Fesanghary [19] established a multi-objective optimization model to seek the optimal building envelope design strategy for minimizing energy consumption in the whole life-cycle of a typical rural house in the southern United States, and then simulated energy consumption at different stages of rural houses, so as to find the balance point of building envelope design. Moreover, the influence of various design factors (such as material selection and structure) on energy consumption was systematically evaluated to provide a practical reference for the design of rural houses. Shams Amiri [20] discovered through both simulation and field measurements that the building envelope, the floor plan design, and the indoor activity patterns of the occupants all influence buildings’ energy consumption. Chandel [21] and colleagues explored the effectiveness of applying passive solar technology in Indian residences. Their research highlighted that increasing external shading devices to block direct sunlight, installing solar air heaters, and maximizing the use of natural ventilation can better optimize the indoor thermal environment and improve the thermal comfort of living spaces. In China, the development and practical application of energy conservation in rural houses is relatively slow, and the relevant standards are difficult to fully implement. Compared with Western countries, China still has a certain gap in the development of building materials for energy conservation and renewable energy technologies for rural houses. By learning from foreign advanced experience and successful cases, in combination with regional characteristics and economic conditions, scholars have discussed the optimization of the spatial design of rural houses, application of passive energy-saving technology, and renovation schemes for the building envelope system [22,23,24,25].
In summary, current international and domestic scholars mainly carry out research on the indoor thermal comfort and energy conservation of rural houses through field investigations, software simulations, and other technical means. These studies fully consider regional characteristics and show high adaptability and flexibility. However, domestic studies have the following shortcomings: Firstly, research on indoor thermal comfort and the transformation of rural houses for energy conservation in cold areas often focuses on environmental climate conditions in winter, paying less attention to the summer climate. Secondly, most studies on the transformation of rural houses focus on energy conservation, and there have been few studies on the quantitative analysis of indoor thermal comfort and energy conservation effects. Moreover, there have also been few studies on the thermal comfort and transformation of rural houses for energy conservation in the Xuzhou area. In view of China’s vast territory and diverse climate, the lifestyles of rural residents and the economic development in different regions vary significantly. As a cold area, Xuzhou cannot simply imitate the practice of other areas when transforming existing rural houses, instead needing to explore regional energy conservation technology that is suitable for rural houses in Xuzhou according to the local environment, climate, and development situation. Therefore, this study mainly discusses how to reduce energy consumption, create a comfortable and livable indoor environment, and achieve the green and sustainable development of rural houses in Xuzhou by enhancing the thermal performance of the building envelope and adopting measures of building shading and solar houses (closed warming galleries), so as to provide a reference for the transformation of rural houses in similar areas.
While previous studies have predominantly focused on either improving thermal comfort or reducing energy consumption in rural housing, this study uniquely integrates both aspects. By employing a combination of field investigations, questionnaire surveys, software simulations, and orthogonal testing, we have established an adaptive thermal comfort model tailored for rural residents in the Xuzhou area. This integrated approach enables us to propose an optimal renovation scheme that simultaneously enhances indoor thermal comfort and reduces energy consumption. In contrast to earlier studies, our research provides detailed quantitative analyses of pre- and post-renovation performance, thereby offering comprehensive insights that contribute marginally and significantly to the existing literature.
2. Research Object and Methods
2.1. Research Object
2.1.1. Geographical Location and Climate Characteristics
Xuzhou, a prefecture-level city of Jiangsu Province, is located in the southeast of the North China Plain and the northwest of Jiangsu Province. It covers a total area of 11,765 km2 and borders Shandong, Henan, and Anhui. In Xuzhou, the Beijing–Shanghai Railway and the Lanzhou–Lianyungang Railway intersect, and the Beijing–Hangzhou Grand Canal connects the north and south. The highway system is complete, reaching Beijing and Tianjin in the north, Shanghai in the south, Gansu in the west, and Huaihai in the east. Hence, Xuzhou enjoys the reputation of “the thoroughfare of the five provinces”, and it is a very important transportation hub city in China, as well as being the gateway city of East China and the Yangtze River Delta economic circle.
China’s thermal building design zones are divided based on air temperature as a reference factor. That is, perfect national thermal building design zoning is conducted mainly according to the average temperature in the coldest and hottest months of the year and the number of days with an annual average temperature no more than 5 °C and no less than 25 °C. Presently, China has five primary climate regions, including a region with hot summers and cold winters, a severe cold region, a region with hot summers and warm winters, a cold region, and a mild region [26]. Due to the vast territory of China, the area of each first-level thermal division is very large, and there are large differences in the average temperature in the coldest month between different regions of the same thermal division. Therefore, in the new Thermal Design Code for Civil Building (GB 50176-2016) [27] issued by the Ministry of Housing and Urban-Rural Development in 2016, the 5 first-level thermal design zones are further subdivided into 11 second-level sub-zones according to the difference in heating degree days (HDD18) and cooling degree days (CDD26). Xuzhou belongs to cold region B in terms of thermal design. However, Xuzhou is located right on the boundary line between the cold region and the region with hot summers and cold winters, so the climate of Xuzhou is obviously cold and dry in winter and hot and humid in summer to a certain degree. These unique climate characteristics make it a difficult task to improve the thermal comfort of building spaces and reduce energy consumption in rural houses in Xuzhou, and it is necessary to ensure efficient heating in winter and high-quality heat protection in summer.
2.1.2. Selection of a Typical Case
According to the requirements of the Opinions on the Overall Promotion of Village Planning, as well as the current situation, future development trends, and improvement prospects of villages, existing villages in China are classified into “gathering and upgrading villages”, “characteristic protection villages”, “urban and suburban integration villages”, “relocation and withdrawal villages”, and “other general villages”. Among these, due to the large population, complete functions, and infrastructure of “gathering and upgrading villages”, such villages are also the main object of rural revitalization. Therefore, it is of great significance to explore the thermal comfort degree of typical houses and promote the energy-saving renovation of buildings for the development of houses for energy conservation in such villages (Figure 1). We found that the kinds of houses in these villages can be divided into three typical shapes in terms of plane layout, namely, “one-”, “L-”, and “U-shaped” houses. Since more than 80% of rural houses are “L-shaped”, this architectural shape was selected as a typical case for research.
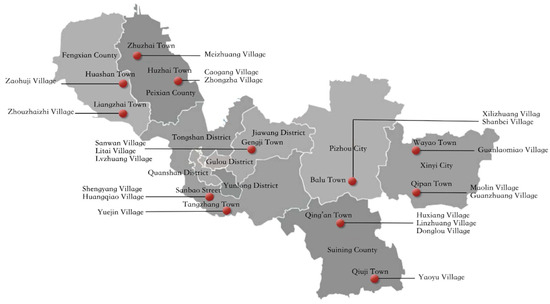
Figure 1.
Location of the research villages.
2.2. Research Methods
2.2.1. Field Measurement and Questionnaire Survey
Compared with other areas, rural residents in Xuzhou have obvious differences in their daily living habits, thermal experience, and requirements for indoor thermal comfort. Thus, direct copying of the results of research on thermal comfort in other areas may lead to inaccurate conclusions. In order to further understand the actual needs of rural residents for thermal comfort in Xuzhou, a field survey on the thermal comfort of existing rural houses was carried out from 11 to 16 July 2023 (summer) and from 5 to 10 January 2024 (winter). The physical data on the indoor thermal environment of rural houses were recorded through actual measurements, and the thermal sensation of residents was determined through questionnaires about thermal comfort. The linear regression method was used for statistical analysis of the data. Our aim was to build an adaptive thermal comfort model for existing rural houses in the Xuzhou area, and to provide a basis for improving their thermal comfort levels and transform them for energy conservation.
According to the provisions of the Evaluation Standard for Indoor Thermal Environment in Civil Buildings (GB/T 50785-2012) [28] and the Standard of Test Methods for Thermal Environment of Building (JGJ/T 347-2014) [29], the distance between the measuring instrument and subject should be kept within 0.5 m. When the subject is sitting, the distance between the instrument and the ground should be 0.6 m. When the subject is standing, the instrument should be 1.5 m away from the ground. The instrument should be arranged away from cold and heat sources that interfere with its test accuracy. In the steady-state environment, the thermal comfort of villagers was surveyed through questionnaires, and the on-site data of the physical environment measured by the instrument were recorded in the process of our investigations. In order to further enhance the accuracy of the test data, all recorded data were read after the instrument was turned on and left for 10 minutes. Indoor thermal comfort was measured by using a JT-2020 multi-functional environmental tester (Xian Yima Optoelec Co., Ltd., Xi’an, China) to obtain the data of air temperature, black-ball temperature, relative humidity, breeze wind speed, and other environmental indicators. In addition, the measuring accuracy and error range of the instrument met the requirements of the specification, ensuring the reliability and accuracy of the data.
2.2.2. Software Simulation Method
Firstly, based on the data of a typical rural house in the Xuzhou area, the baseline model was established by using Sware’s BECH2024 (HVAC energy consumption simulation) software and ITES2020 (indoor thermal evaluation software), and the relevant simulation parameters were set. Secondly, according to the analysis of the current situation and optimization strategies, we determined that the thermal insulation performance of the roofs and exterior walls, the glass material of exterior windows, the window-to-wall ratio of buildings, shading facilities, and the design of closed warming galleries are the main factors affecting the indoor thermal comfort and the annual energy consumption of rural houses. Finally, the software was used to conduct a single-factor analysis to study the influence of the above factors on the proportion of rural houses with standard indoor thermal comfort and energy consumption in the heating season and cooling season. The strategies for the optimization and transformation of single factors were proposed to enhance indoor thermal comfort and reduce energy consumption.
2.2.3. Orthogonal Test Method
Orthogonal testing was used to conduct multi-factor and multi-level analysis of the single-factor simulation results. The weight of the influence of different factors on indoor thermal comfort and annual energy consumption was calculated by means of mean and range analysis, and the theoretical optimal combination of transformation strategies was determined. The simulation results of intuitive optimal combinations of transformation strategies obtained by the orthogonal test were compared with that of the theoretical optimal combination. Based on the goal of reducing the annual energy consumption of rural houses as much as possible, on the premise of improving indoor thermal comfort levels, the optimal combination of transformation strategies for existing rural houses in the Xuzhou area was screened. Through software simulation, the baseline model was transformed according to the optimal combination scheme, and the indoor thermal comfort and annual energy consumption data of rural houses before and after the transformation were compared. Moreover, the cost of transforming rural houses was estimated to verify the effectiveness and economic advantages of the transformation scheme.
3. Study on the Indoor Thermal Comfort of a Typical Rural House
3.1. Evaluation Indicators of Thermal Comfort
- (1)
- PMV-PPD index
Thermal comfort is usually influenced by six factors, which can be divided into human and environmental factors. Human factors include individual clothing’s thermal resistance and human metabolic rate. Environmental factors include the average radiation temperature, air temperature, air flow velocity, and relative humidity [30]. In a stable environment, the predicted mean vote (PMV), which is regarded as the most authoritative indicator of thermal comfort, combines human and environmental factors affecting thermal comfort to predict the average thermal sensation. According to Professor Fanger’s heat balance equation, PMV is calculated as follows:
where W is the mechanical work done by human activities (W), M is the human energy metabolic rate (W/m2), Pa is the partial water vapor pressure of air around the human body (KPa), ta is the air temperature around the human body (°C), tcl is the outer surface temperature of the human body (°C), tmrt is the average radiant temperature of the internal surface of a room (°C), fcl is the garment surface coefficient, and hc is the convective heat transfer coefficient (W/(m2·K)).
ASHRAE’s seven-level thermal sensation grading method can be used to evaluate the thermal sensation of the human body in a specific thermal environment. According to Table 1, PMV is 0 when the human thermal sensation is moderate.

Table 1.
Measurement form of PMV.
Because of individual differences, it is impossible for the PMV model to evaluate a thermal environment accurately. Professor Fanger proposed another measure—PPD (predicted percentage dissatisfied). This indicator predicts respondents’ evaluation of a thermal environment by calculating their dissatisfaction with the thermal environment. The relationship between PMV and PPD is shown as follows:
As shown in Figure 2, when the indoor thermal environment has been in the most ideal comfort state, the PMV is 0, and 5% of respondents are dissatisfied with the thermal environment. According to the ISO 7730 standard, when 10% of respondents are dissatisfied with the thermal environment, 90% of participants consider that it is a comfortable thermal environment, and the PMV is between −0.5 and 0.5. According to the Evaluation Standard for Indoor Thermal Environment in Civil Buildings (GB/T 50785-2012) [28], as the voting value of PMV ranges from −1 to 1, about 75% of participants are satisfied with this thermal environment.
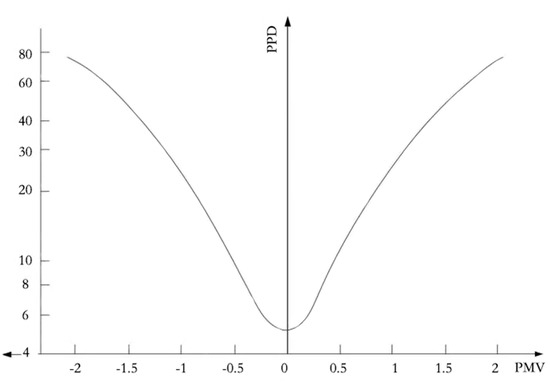
Figure 2.
Plot of PMV versus PPD.
- (2)
- Operating temperature TOP
As the difference between the air temperature and average radiation temperature is less than 4 °C, and the indoor wind speed is no more than 0.2 m/s, the operating temperature can accurately evaluate and predict the thermal comfort of naturally ventilated buildings. In this case, operating temperature can be regarded as the average of air temperature and average radiation temperature:
where Ta is the air temperature around the human body (°C) and Tmrt is the average radiation temperature of the environment (°C).
- (3)
- Mean thermal sensation (MTS)
When a field questionnaire survey on thermal comfort is carried out, the subjective thermal sensation vote (TSV) and mean thermal sensation (MTS) are usually used to describe human thermal sensation [19]. The TSV represents the subjective score of the human body at a certain temperature while the MTS is the average voting score of the TSV in a given temperature range. Compared with the TSV, the MTS has a more significant linear relationship with TOP, so the MTS-TOP model is applied more frequently in the evaluation of the comfort of a thermal environment. The temperature frequency method [20] is usually used to construct the linear relationship between MTS and TOP, and the formula is as follows:
A larger value of R2 indicates a stronger correlation between MTS and TOP.
3.2. Questionnaire Data
A total of 400 questionnaires on thermal comfort were distributed, including 200 questionnaires in summer and 200 questionnaires in winter. There were 195 valid questionnaires in summer and 193 valid questionnaires in winter. The contents of the questionnaires include the basic information, clothing, and activity status of the respondents. The clothing resistance and metabolic rate of the respondents were calculated by referring to the data reference tables in [31,32]. In addition, regarding the quantification of respondents’ subjective thermal sensation, the evaluation quantification table (Table 2) was developed by referring to ASHRAE Standard 55-2017. In order to ensure that the respondents correctly understood the questionnaire’s contents and scale levels, detailed explanations were given for each scale during the survey to eliminate possible misdirection. Finally, the questionnaire data passed the reliability and validity tests and were used for further analysis.
Table 2.
Questionnaire evaluation quantitative scale of thermal comfort.
3.3. Analysis of Survey Results of Thermal Comfort
3.3.1. Summer Thermal Comfort
- (1)
- Statistics of measured data
The statistical data of the summer thermal environment in existing rural houses in the Xuzhou area are shown in Table 3.
Table 3.
Summer thermal environment testing statistics.
- (2)
- Analysis of subjective votes of summer thermal comfort
From the polling results of thermal comfort in Figure 3, it can be seen that the respondents generally had a low evaluation of summer comfort. The evaluation of subjective thermal comfort was highly consistent with the measured indoor physical data, highlighting the deficiency of thermal comfort inside rural houses, and emphasizing the urgent need to improve this situation.
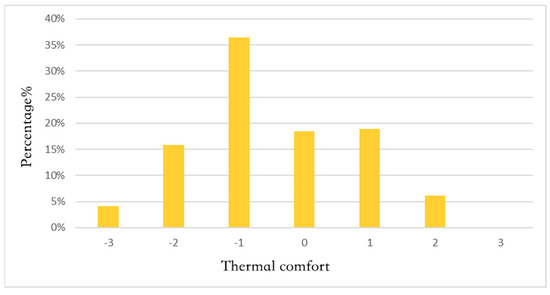
Figure 3.
Poll distribution frequency of summer indoor thermal comfort.
3.3.2. Winter Thermal Comfort
- (1)
- Statistics of measured data
The statistical data of the winter thermal environment in existing rural houses in the Xuzhou area are shown in Table 4.
Table 4.
Winter thermal environment testing statistics.
- (2)
- Analysis of subjective votes of winter thermal comfort
According to the polling results of thermal comfort in Figure 4, most of the respondents felt that their indoor thermal comfort in winter was not good. The indoor thermal comfort in winter cannot reach the level expected by the residents, so it is necessary to take measures to improve it.
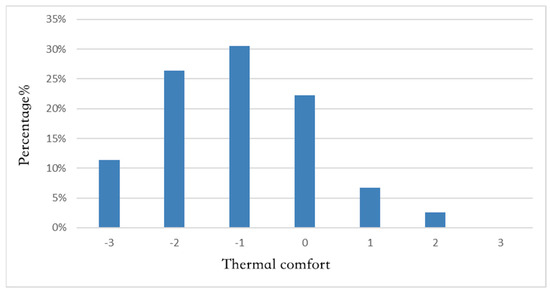
Figure 4.
Poll distribution frequency of winter indoor thermal comfort.
3.4. Analysis of Adaptive Thermal Comfort of Residents Living in Rural Houses
In order to improve the accuracy of the data analysis, the temperature frequency method was used to process the data collected from the field investigations and questionnaires. The indoor operating temperature (TOP) was divided into several intervals every 0.5 °C. The average operating temperature in various intervals was taken as the independent variable, while the values of MTS and PMV in the intervals were taken as the dependent variables to obtain MTS-TOP and PMV-TOP models by linear regression analysis.
- (1)
- Establishment of the MTS-TOP model
The models of the relationship between the MTS and TOP of indoor respondents in rural houses in Xuzhou in summer and winter are shown in Figure 5 and Figure 6, respectively.
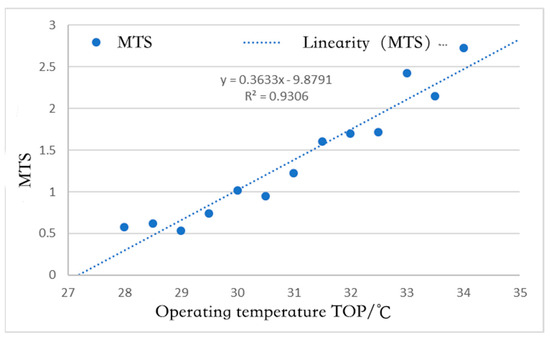
Figure 5.
Mean summer thermal sensation–operating temperature model.
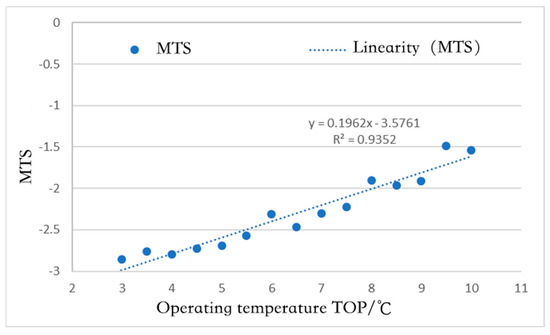
Figure 6.
Mean winter thermal sensation–operating temperature model.
- (2)
- Establishment of PMV-TOP model
The models of the relationship between the PMV and TOP of indoor respondents in rural houses in Xuzhou in summer and winter are shown in Figure 7 and Figure 8, respectively.
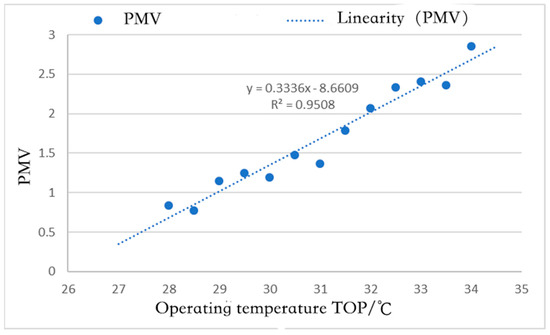
Figure 7.
Summer predicted mean vote–operating temperature model.

Figure 8.
Winter predicted mean vote–operating temperature model.
- (3)
- Comparison between the MTS-TOP and PMV-TOP models
It can be seen from Figure 9 and Figure 10 that a change in the indoor operating temperature would lead to a change in the mean thermal sensation (MTS) and predicted mean vote (PMV) in rural houses. The linear trend shows that the indoor operating temperature has a significant effect on the indoor thermal comfort of rural houses. In winter and summer, the corresponding values of the MTS model were significantly different from those of the PMV model in the same range of operating temperatures. Compared with the PMV model, the MTS model was closer to the comfortable state at the same operating temperature (y = 0). The respondents have lived in the rural areas of Xuzhou for a long time, and they have developed a certain ability to adapt to the high temperatures in summer and cold weather in winter. The ranges of thermal neutral temperature and acceptable temperature in winter and summer obtained by the MTS and PMV models are shown in Table 5.
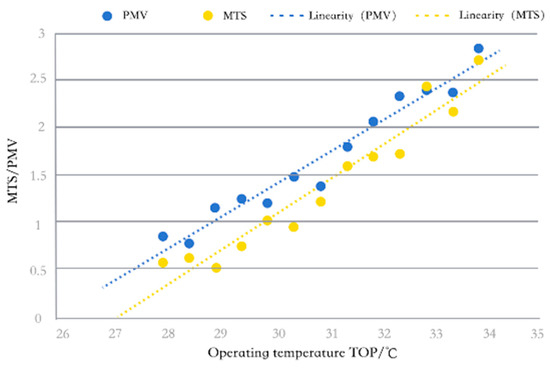
Figure 9.
Comparison of summer MTS–operating temperature model and PMV–operating temperature model.

Figure 10.
Comparison of winter MTS–operating temperature model and PMV–operating temperature model.
Table 5.
Statistics of intervals of thermal neutral temperature and acceptable temperature obtained by MTS-TOP and PMV-TOP models.
3.5. Indoor Adaptive Thermal Comfort Model of Rural Houses
Compared with the PMV model, the MTS model considers the respondents’ adaptability to the local climate more. In order to analyze the thermal sensation of rural residents in Xuzhou more comprehensively and accurately, the MTS model was selected to construct the adaptive thermal comfort model. The method was as follows: the outdoor temperature TO was divided into several intervals of 1 °C. The temperature frequency method was used to analyze the MTS values collected from the thermal comfort questionnaires and the indoor environmental parameter TOP values obtained from the field test within each interval of 1 °C, and the thermal neutral temperature Tn in each interval of 1 °C was calculated. The adaptive thermal comfort model of rural residents in Xuzhou was constructed by combining the thermal neutral temperature Tn and outdoor temperature TO in each interval of 1 °C. The thermal neutral temperature Tn refers to a specific state, in which the human body neither feels cold nor overheated, thus achieving a comfortable optimal state. The human body requires the least energy to regulate its temperature in a thermally neutral state. Figure 11 shows the simultaneous distribution of winter and summer thermal neutral temperature Tn and outdoor temperature To for rural houses in the interval of 1 °C, and the equation of the adaptive thermal comfort model is as follows:

Figure 11.
Regression analysis of indoor thermal neutral temperature Tn and outdoor temperature To in a rural house.
According to the studies of De Dear [33] and Nicol [34], 90% of respondents can accept a maximum temperature difference of 2.5 °C on the basis of neutral temperature, while 80% of respondents can accept a maximum temperature difference of 3.5 °C on the basis of neutral temperature. Figure 12 shows the indoor thermal comfort zones corresponding to different outdoor temperatures of rural houses in the Xuzhou area.
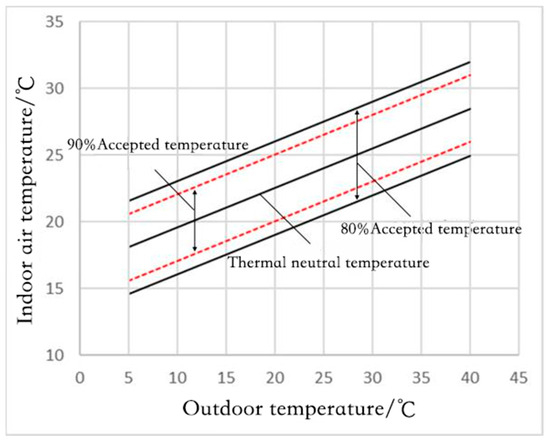
Figure 12.
Indoor thermal comfort zones of rural houses in Xuzhou.
4. Analysis of Single-Factor Simulation of Thermal Comfort and Energy Conservation with the Baseline Model
4.1. Establishment and Parameter Setting of the Baseline Model
4.1.1. Establishment of the Baseline Model
According to the field investigations, the rural houses in Xuzhou are mostly two-story, “four-room”, and “L-shaped” buildings, so this type was selected for the simulation and analysis of the baseline model. In this study, a two-story independent brick–concrete house in Meizhuang Village, Peixian County was selected, covering a land area of 300.82 m2 and a building area of 248.88 m2. The floor plan of the baseline model can be seen in Figure 13, and the detailed parameters of the building envelope are shown in Table 6.

Figure 13.
Floor plan of the baseline model.
Table 6.
Envelope construction details and thermal parameters of the baseline model.
4.1.2. Setting of Simulation Parameters
The indoor thermal environment of rural houses is affected by many factors, including the daily activities of residents, the electrical equipment used, and the external climate. Among these, the external climate has a greater influence on the indoor thermal environment. To make simulation results more scientific and accurate, it is necessary to consider the optimal setting of outdoor climate parameters such as temperature and humidity, along with residents’ living and rest conditions, when a model is established, so as to more truly reflect the changing rules of the indoor thermal environment of rural houses.
- (1)
- Setting of external interference parameters
Xuzhou’s meteorological data, obtained from the Dedicated Meteorological Data Set for Analysis of Building Thermal Environment in China, were used as external interference parameters in Sware’s (2020) software. To verify the accuracy of the simulation results, the measured data of average temperature in different months in Xuzhou in 2023 were compared with the monthly average temperatures simulated by the software in the same period (Figure 14). Through the comparison of these data, the accuracy of the software in simulating the average temperature of Xuzhou in different months was verified, providing a scientific basis for the subsequent simulation of the indoor thermal environment.

Figure 14.
Comparison of measured monthly average temperatures in Xuzhou and the monthly average temperatures simulated by the software.
- (2)
- Setting of internal interference parameters
In the simulation of the indoor thermal environment of rural houses, the human body and electrical equipment are the main sources of heat. Based on the records of rooms’ frequency and duration of residential activities in the typical rural house during the survey, the indoor parameters in the simulation were set; that is, the occupancy of each room and the use of lighting facilities are shown in Table 7 and Table 8, respectively.
Table 7.
Room occupancy rates on an hourly basis.
Table 8.
Illumination utilization rate.
The survey showed that central heating is not adopted in rural areas of Xuzhou, and most residents in rural areas use split air conditioning for cooling in summer (from 1 June to 1 September) and heating in winter (from 1 December to 1 March). According to the Design Standard of Thermo-Environment and Energy Conservation for Residential Buildings in Jiangsu Province, the interior design temperature is 26 °C in summer and 18 °C in winter, which is within the range of indoor thermal comfort temperature, so the interior design temperatures in summer and winter were adopted. The simulation calculation of the proportion of annual indoor thermal comfort reaching the standard was completed under the condition of natural ventilation, and the indoor air exchange frequency was 0.5 times/h. The simulation calculation of annual energy consumption was completed under the condition of air conditioning, and the indoor air exchange frequency was 1.0 times/h [35].
4.2. Simulation Evaluation Indicators
4.2.1. Evaluation of Indoor Thermal Comfort
ITES was used to calculate the proportion of indoor thermal comfort reaching the standard under the condition of natural ventilation, and according to the thermal comfort temperature range of the adaptive thermal comfort model, the ratio of the rural house’s hours within the temperature range to the annual operating hours was calculated [36]. The indoor hourly temperature of each room in the rural house throughout the year was simulated, and the variation in indoor temperature during typical winter and summer days (the winter solstice and summer solstice) was simulated.
4.2.2. Evaluation of Energy Conservation
BECH(2024) software was used to simulate energy consumption in the heating and cooling seasons, along with the annual energy consumption and energy conservation rate of the rural house when air conditioning is turned on. The energy conservation rate is the ratio of the difference in annual energy consumption before and after the transformation of the baseline model to the annual energy consumption before the transformation. Combined with the default outdoor monthly average temperature of the simulation software, based on the adaptive thermal comfort model, the acceptable temperature intervals of 80% of residents were calculated (Table 9).
Table 9.
Thermal comfort temperature intervals for rural houses based on Tn-To modeling.
In order to systematically compare the influence of different single factors on indoor thermal comfort and annual energy consumption, the proportion of annual indoor thermal comfort reaching the standard, thermal comfort hours, variation in hourly temperature in the winter and summer solstices, and energy consumption for heating and cooling were simulated and analyzed (Table 10).
Table 10.
Baseline model simulation data.
4.3. Single-Factor Simulation Analysis of the Baseline Model
4.3.1. Transformation of the Exterior Walls
The heat transfer coefficient of the exterior walls in the baseline model was 2.014 W/(m2·k), and the thermal inertia index was 3.753, which are not in line with the requirements of the standard. In the process of transforming the exterior walls, the external thermal insulation form was selected, and the thermal insulation layer was added. In order to select the most suitable insulation material for the exterior walls of rural houses in Xuzhou, the control variable method was adopted to keep the thickness of the insulation layer unchanged at 30 mm, and four common thermal insulation materials were selected. The thermal parameters of different insulation materials for the exterior walls are shown in Table 11. According to the simulation results (Table 12), the effect of adding PUR insulation boards to the exterior walls was the best, followed by XPS insulation boards. The area of the exterior walls of the building occupied the largest proportion in the outer building envelope. Although the insulation effect of XPS insulation boards was slightly inferior to that of PUR insulation boards, the price of the former is much lower. On the whole, XPS insulation boards should be used for the transformation of the exterior walls.
Table 11.
Thermal parameters of different exterior wall insulation materials.
Table 12.
Simulation statistics of adding different insulation materials to exterior walls.
In the process of transforming the thermal insulation of the exterior walls, the effect of energy conservation not only depends on the type of materials used but is also closely related to the thickness of the materials. In this study, XPS insulation boards within the thickness range of 30~150 mm, with 30 mm as the step, were compared and simulated to determine the optimal thickness. The specific thermal parameters are shown in Table 13. The simulation results (Table 14) show that the improvement effect of the indoor thermal environment and the effect of energy conservation would gradually weaken with the increase in the thickness of the XPS insulation boards. When the thickness exceeded 90 mm, the annual energy consumption could be reduced to a certain extent, but the change range was small, and the proportion of annual indoor thermal comfort reaching the standard was not increased. The increase in the thickness will inevitably increase the difficulty and cost of construction, so the thickness of XPS insulation boards used as insulation materials for the exterior walls of rural houses in the Xuzhou area should be between 60 mm and 90 mm.
Table 13.
Thermal parameters of XPS insulation boards with different thicknesses.
Table 14.
Comparison of simulation data for different thicknesses of exterior XPS insulation boards.
4.3.2. Transformation of the Roofs
The baseline model used precast reinforced concrete as roof boarding, but this kind of roof boarding has high thermal conductivity and provides poor living comfort. To select the most suitable roof insulation material for rural houses in Xuzhou, the control variable method was adopted in the simulation process for roof insulation materials. That is, the thickness of the insulation layer was unchanged (30 mm), and the type of insulation material was changed. The thermal parameters of different roof insulation materials are shown in Table 15. The simulation results (Table 16) reveal that the addition of PUR insulation boards to the roofs had the best effect, followed by XPS insulation boards. The external environment that the roofs need to deal with is more complex than that of the exterior walls, and the area is smaller. PUR insulation boards have good waterproofness, corrosion resistance, aging resistance, and other characteristics. We concluded that it is appropriate to choose PUR insulation boards as the insulation material for the transformation of roofs of rural houses in the Xuzhou area.
Table 15.
Thermal parameters of different insulation materials for roofs.
Table 16.
Simulation statistics for the addition of different insulation materials to the roofs.
In the process of transforming the thermal insulation of the roofs, different thicknesses of the same material will also affect the indoor thermal comfort and energy conservation of the rural house. In this study, PUR insulation boards within the thickness range of 30~150 mm, with 30 mm as the step, were simulated to select the optimal thickness. The specific thermal parameters are shown in Table 17. The simulation results (Table 18) show that, with the increase in the thickness of the insulation boards, the growth rate of the energy conservation effect and the improvement of the indoor thermal environment provided by the PUR insulation boards slowed down. When the thickness was over 90 mm, the annual energy consumption could be reduced to a certain extent, but the change range was small, and the proportion of annual indoor thermal comfort reaching the standard was not improved. Increasing the thickness of the PUR insulation boards will inevitably increase the difficulty and cost of construction. Considering both the transformation effect and the economic effect, the thickness of PUR insulation boards used as insulation materials for the roofs should be 60~90 mm.
Table 17.
Thermal parameters of PUR insulation boards with different thicknesses.
Table 18.
Simulation statistics for different thicknesses of PUR insulation boards.
4.3.3. Transformation of the Exterior Windows
In order to solve the problem of serious energy consumption loss from the exterior windows of rural houses in the Xuzhou area, the control variable method was adopted to simulate the glazing types of the exterior windows. That is, the glazing types were changed, while the other parameters were unchanged. The thermal parameters of the exterior windows’ glazing are shown in Table 19. The simulation results reveal (Table 20) that the improvement of indoor thermal comfort and annual energy consumption by different types of exterior window glazing was influenced by both the heat transfer coefficient and shading coefficient. By comparing the simulation data and economic data, the effect was the best when three-layer insulating glazing filled with air between the different layers was used.
Table 19.
Thermal parameters of different glazing types for external windows.
Table 20.
Simulation statistics for different exterior window glazing types.
4.3.4. Transformation of Window-to-Wall Ratio
According to the needs of indoor heat gain, lighting, and ventilation, the south-facing window-to-wall ratio should not be too small. The south-facing window-to-wall ratio of the baseline model was 0.29, meeting the requirement of the standard. In the calculation of the south-facing window-to-wall ratio, the simulation was carried out with 0.1 as the step, and in accordance with the range of 0.25–0.45 required by the standard. The simulation parameters are shown in Table 21. The simulation results (Table 22) show that the south-facing window-to-wall ratio had little influence on the energy conservation effect. Combined with factors such as lighting, ventilation, energy consumption, and thermal comfort, the optimal south-facing window-to-wall ratio of the rural house should be 0.35.
Table 21.
Simulation parameters for south-facing window-to-wall ratio.
Table 22.
Simulated statistics of south-facing window-to-wall ratio.
Many factors, such as lighting and ventilation, should be considered comprehensively when the north-facing window-to-wall ratio is designed. In the initial model, the north-facing window-to-wall ratio was 0.2, meeting the requirement of the standard. In the calculation of the north-facing window-to-wall ratio, the simulation was carried out with 0.1 as the step, the north-facing window-to-wall ratio was changed from 0.1 to 0.3. The simulation parameters can be seen in Table 23. The simulation results (Table 24) reveal that, on the one hand, although increasing the north-facing window-to-wall ratio can enhance the indoor temperature in winter, it will also increase the indoor temperature in summer, which means that the energy consumption in the cooling season will be increased. On the other hand, thermal comfort is improved to some extent, but the increase is small. This improvement effect is limited, and the thermal environment problem existing in rural houses cannot really be solved. When the north-facing window-to-wall ratio was 0.1, the annual energy consumption decreased, but the proportion of annual thermal comfort reaching the standard declined noticeably. In summary, combined with the needs for lighting and ventilation, the optimal north-facing window-to-wall ratio should be 0.2.
Table 23.
Simulation parameters for north-facing window-to-wall ratio.
Table 24.
Simulated statistics of north-facing window-to-wall ratio.
4.3.5. Shading Transformation
The middle three windows of the baseline building model are located in the corridor under the eaves, and there is no need to set shading boards. The four windows on the left and right sides were mainly designed. In order to determine the most suitable length of shading boards for rural houses in Xuzhou, five lengths of shading boards were designed, with a step of 0.2 m, and only the length of the shading boards was changed during the simulation process. The simulation results for south-facing shading boards are shown in Table 25. Considering the lighting and the effect of energy consumption, the length of south-facing shading boards should be 0.8 m.
Table 25.
Simulated statistics for south-facing shading boards.
4.3.6. Transformation of Closed Warming Galleries
Since there are room doors at both ends of the corridors in the baseline model, the depth of the warming galleries was set to the corridor depth of 1.5 m. From the transformation of the exterior windows, we found that the south-facing glass most suitable for rural houses in Xuzhou was three-layer insulating glazing, so the glass of the warming galleries was set as three-layer insulating glazing. In the simulation of closed warming galleries, three working conditions were set, namely, first-floor closed warming galleries, second-floor closed warming galleries, and first- and second-floor closed warming galleries. According to the simulation results (Table 26), closed warming galleries can not only improve indoor comfort but also greatly reduce the energy consumption in the heating season, thus improving the energy consumption effect of the rural house. In summary, for existing rural houses with corridors in the Xuzhou area, both first- and second-floor corridors should be closed to form warming galleries.
Table 26.
Simulation statistics of closed warming galleries.
5. Transformation of the Baseline Model for Energy Conservation Under the Guidance of Thermal Comfort
5.1. Analysis of Multi-Factor Transformation Strategies Based on an Orthogonal Test
5.1.1. Design of Orthogonal Test Scheme
- (1)
- Determination of influencing factors and their levels
The south-facing mobile horizontal shading boards of the baseline model should be open in summer and closed in winter, which can reduce energy consumption in the cooling season, so it cannot be applied to year-round simulations. The north-facing window-to-wall ratio had little effect on the indoor thermal comfort level and annual energy consumption. Therefore, when the orthogonal test table was designed, the length of south-facing mobile horizontal shading boards and the north-facing window-to-wall ratio were not considered. In the orthogonal test of this study, five key factors, including the thickness of XPS insulation boards on the exterior walls, the thickness of PUR insulation boards on the roofs, the type of glass in the exterior windows, the south-facing window-to-wall ratio, and the location of closed warming galleries, were selected. Combined with the simulation results of the single factors, four levels were selected for each factor (Table 27).
Table 27.
Values for the five factors and four levels of the baseline model.
- (2)
- Orthogonal table selection
According to the above data, the orthogonal test design of five factors and four levels was adopted. After SPSS Statistics 24 analysis, the L16(45) orthogonal table was selected for the experimental design, and a total of 16 experiments were carried out.
- (3)
- Listing the test plan
Each factor and level corresponded to the orthogonal table shown in Table 28. As shown in Table 29, the 16 groups of test schemes were simulated successively, and the test results were recorded.
Table 28.
Orthogonal test table L16(45) for integrated rural house rehabilitation.
Table 29.
Multi-factor combination test program.
5.1.2. Analysis of Orthogonal Test Results
- (1)
- Combination of intuitive optimal transformation strategies
According to the simulation results of 16 groups of test schemes (Table 30), the proportion of indoor thermal comfort reaching the standard throughout the year was the highest in group 4, and the combination form of its transformation scheme was A1 + B4 + C4 + D4 + E4. In group 14, the annual energy consumption was the lowest, while the energy conservation rate was the highest, and the combination form of its transformation scheme was A4 + B2 + C3 + D1 + E4.
Table 30.
Statistics of simulation data of multi-factor combination test.
- (2)
- Combination of theoretical optimal transformation strategies
Kj is the sum of the test results at the level of j under the same conditions, and j represents the order of the levels; is the mean of the summation results. The range value R = max-min, where max and min respectively represent the maximum and minimum of the summation mean of the experimental results of each round at the level of j under the same conditions. To analyze the influence weights of different factors on the test results, the analysis of means and ranges was carried out for 16 groups of test results. The range value R reflects the influence of factors on the test results, and the larger the range value, the greater the influence. By ordering the range values, the primary and secondary relationships of various factors can be determined. In addition, according to the size of the mean, the theoretical optimal level of each factor can be inferred.
The analysis results of the means and ranges of the simulation results for annual thermal comfort hours and annual energy consumption are shown in Table 31 and Table 32, respectively.
Table 31.
Mean and range analysis of simulation results for annual thermal comfort hours.
Table 32.
Mean and range analysis of simulated data on annual energy consumption.
The theoretical optimal combination of transformation strategies based on thermal comfort is as follows: for the roofs, 80 mm PUR insulation boards are used; for the external walls, 70 mm XPS insulation boards are used; for the exterior windows, three-layer insulating glazing is used; the south-facing window-to-wall ratio is 0.35; closed warming galleries are adopted on the first and second floors. The theoretical optimal combination of transformation strategies based on annual energy consumption is as follows: for the roofs, 90 mm PUR insulation boards are used; for the external walls, 90 mm XPS insulation boards are used; for the exterior windows, three-layer insulating glazing is used; the south-facing window-to-wall ratio is 0.2; closed warming galleries are also adopted on the first and second floors.
- (3)
- Optimal combination of transformation strategies
According to the importance of the mean and range of each factor for indoor thermal comfort, the theoretical optimal combination of transformation strategies is A2 + B3 + C4 + D4 + E4, which was recorded as test 17. Based on the importance of the mean and range of each factor for annual energy consumption, the theoretical optimal combination of transformation strategies is A4 + B4 + C4 + D1 + E4, which was recorded as test 18. The simulation results of the transformation strategy combinations of tests 4, 14, 17, and 18 were compared. The transformation contents and simulation results of the four groups of experiments are shown in Table 33 and Table 34.
Table 33.
Comparison of pilot programs.
Table 34.
Statistics of simulated combinations of intuitively optimal and theoretically optimal strategies.
According to the thermal comfort level, the effect of energy conservation, economic factors, and other factors of transformation of the rural house, experiment 17 (A2 + B3 + C4 + D4 + E4) was finally selected as the optimal combination of transformation strategies for existing rural houses in the Xuzhou area. That is, 70 mm XPS insulation boards are used for the external walls, 80 mm PUR insulation boards are used for the roofs, three-layer insulating glazing is used for the exterior windows, the south-facing window-to-wall ratio is 0.35, the north-facing window-to-wall is 0.2, the length of the south-facing mobile horizontal shading boards is 0.8 m, the first- and second-floor eaves are closed to form warming galleries with a depth of 1.5 m, and three-layer insulating glazing is used for the warming galleries.
5.2. Transformation Strategies of the Baseline Model and Their Application
5.2.1. Transformation Strategies
The data from the single-factor simulations and the results of the orthogonal test were integrated to not only improve indoor thermal comfort but also minimize energy consumption. The specific transformation strategies are as shown in Figure 15.
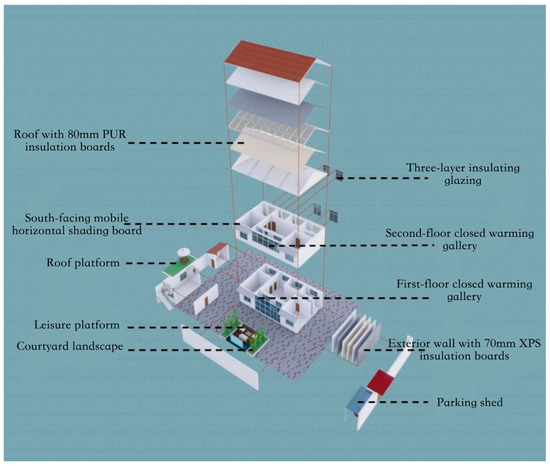
Figure 15.
Rural house retrofit strategies explained.
- (1)
- Transformation of the building envelope
First, 70 mm XPS insulation boards are added to the external walls of the rural house; this form of external insulation is used to effectively reduce the heat loss of the house. The roofs of the house are equipped with 80 mm PUR insulation boards, and the form of internal insulation is adopted. The outside windows of the house use three-layer insulating glazing (5 + 6A + 5 + 6A + 5).
- (2)
- Window-to-wall ratio
According to the economic factor of transformation of the window-to-wall ratio, the transformation of the south-facing window-to-wall ratio cannot be carried out in view of the difference between the original south-facing window-to-wall ratio of 0.29 and the optimal south-facing window-to-wall ratio of 0.35. The north-facing window-to-wall ratio has little impact on the indoor thermal comfort and annual energy consumption of the rural house. In order to consider lighting and ventilation, two new windows are added to the kitchen and dining room after the transformation of the rural house in the north, and the north-facing window-to-wall ratio is 0.24.
- (3)
- South-facing mobile horizontal shading boards
After the transformation, the elderly bedroom and kitchen on the first floor, as well as the master bedroom and second bedroom on the second floor, adopt mobile horizontal outdoor shading boards on the south-facing windows. The length of the shading boards is 0.8 m. They are opened in summer and closed in winter, which can effectively reduce the energy consumption for summer cooling.
- (4)
- Closed warming galleries
The first- and second-floor eaves are closed to form warming galleries, with a depth of 1.5 m. Three-layer insulating glazing is used for the warming galleries. A window that can be opened is set on the south side of the warming galleries to accelerate indoor heat loss in summer and keep the interior warm in winter.
- (5)
- Optimization of spatial layout
The kitchen, dining room, toilet, and other frequently used spaces are transformed inside the main room to improve the convenience of farmers’ lives under different weather conditions. The storage room of the main room of the rural house is mainly used for the storage of farm tools and daily necessities, and the original storage room is changed to the location of the original kitchen and dining room for the storage of farm tools. A small storage room is built in the main room for the stacking of living debris. The kitchen and dining room are located on the north side of the living room on the first floor, not occupying the south space, and the functional layout is more compact and reasonable. A study is added on the north side of the master bedroom on the second floor, which can reduce the depth of the bedroom and the energy consumed for heating and cooling.
- (6)
- Building a platform on the roof of the wing room
The west wing room of the rural house is changed into a storage room, without the need for thermal insulation. The roof of the wing room is changed to a flat roof, and the planting roof is set to increase the leisure and drying space of the rural house.
- (7)
- Courtyard optimization
A parking shed is built in the courtyard space, which is convenient for farmers to park their vehicles. Tree ponds, flower ponds, fishponds, and leisure areas are built in the middle of the courtyard, which can not only increase the fun in the daily lives of farmers, but also adjust the air humidity and temperature in the environment and improve the microclimate environment of the courtyard.
5.2.2. Transformation Practice and Simulation Analysis
Related parameters were set according to the Design Standard for Energy Efficiency of Rural Residential Buildings [37]. BECH and ITES were used to simulate the indoor thermal comfort and annual energy consumption of the transformed rural house. The internal and external disturbance parameters of the model were the same as those set in the baseline model above. The simulation results are shown in Table 35.
Table 35.
Comparison of simulation results before and after the renovation of the rural house.
The optimal combination of transformation strategies was applied to the transformation of the rural house. After the transformation, the proportion of thermal comfort reaching the standard increases by 1.98%. The indoor average temperature rises by 1.87 °C on the winter solstice and decreases by 0.36 °C on the summer solstice. The energy consumption is 5011 kWh in the heating season and 2191 kWh in the cooling season. The annual energy consumption is 7202 kWh, and the energy conservation rate is 70.07%. The estimated cost of transforming the rural house is CNY 66,810, and the annual electric bill for heating and cooling can theoretically be reduced by CNY 8430 (Table 36).
Table 36.
Pre-estimated cost of transforming the rural house.
6. Discussion
Our findings demonstrate that the adaptive thermal comfort model developed in this study exhibits notable improvements over traditional models by incorporating both field data and simulation results. Unlike previous research that focused solely on either thermal comfort or energy efficiency, our integrated approach reveals that simultaneous optimization can lead to significant energy savings while enhancing indoor comfort. Our results indicate an energy conservation rate of over 70%, alongside a measurable increase in thermal comfort levels. These differences highlight the added value and practical implications of our research in the context of rural housing renovation.
The present development situation, indoor thermal environment, and thermal comfort of existing rural houses in the Xuzhou area were analyzed by literature review, field investigation, and questionnaire surveys, while software simulations, orthogonal testing, and other technical means were used to improve the indoor thermal comfort of rural houses and reduce their annual energy consumption. The optimal scheme suitable for the transformation of existing rural houses in the Xuzhou area was obtained, providing guiding opinions for the transformation and construction of local houses. The proposed renovation strategies not only provide theoretical and practical guidance for the energy-saving renovation of rural homes in Xuzhou but also offer insights for regions with similar climatic characteristics, thereby improving buildings’ energy efficiency and promoting sustainable development.
- Significant energy-saving potential and urgent renovation needs: This study reveals the considerable energy-saving potential of rural homes in Xuzhou under current climatic conditions. By systematically optimizing the building envelope, window-to-wall ratio, shading systems, and spatial and functional layouts, energy consumption can be significantly reduced while improving living comfort. The findings underscore the urgent need for energy-saving renovations to align with carbon neutrality goals and achieve a sustainable development path. Luo Yu [38] focused on typical rural homes in Xuzhou, exploring energy consumption factors through field surveys, software simulations, and orthogonal experiments. His research proposed near-zero-energy-consumption renovation strategies, which were successfully implemented in selected rural homes in the area, enabling them to meet near-zero energy targets. This laid a foundation for theoretical and case studies in near-zero energy research for Xuzhou’s rural homes. Compared to his research, this study further emphasizes energy-saving renovation strategies driven by thermal comfort, focusing not only on the need to reduce energy consumption but also on the human-centered demand for thermal comfort in renovations.
- Effectiveness of comprehensive renovation strategies: This study proposes the optimal renovation strategies for existing rural homes in Xuzhou, which have been proven effective in maximizing the reduction in annual energy consumption while improving indoor thermal comfort. Based on the research-derived strategies, practical renovations were carried out, comparing the indoor thermal comfort and total annual energy consumption before and after renovation, along with estimating the renovation costs. Xie Chao [39] and colleagues, through field surveys and questionnaires combined with optimization methods such as genetic algorithms, developed an energy consumption simulation system with carbon emissions, cost, and thermal comfort as optimization goals. Their research identified the optimal renovation solutions for Xuzhou’s rural homes, resulting in reduced energy consumption, lower renovation costs, and improved indoor thermal environments. This study not only provides a reference for energy-efficient building design in Xuzhou but also offers scientific evidence for other rural areas with similar climatic conditions and economic development levels. Compared to their study, this research lacks an in-depth discussion of renovation costs, but there is a high degree of consistency in the formulation of renovation strategies. The research methods also provide valuable insights and guidance for further refining this study.
Although some results have been achieved, because of limited personal experience and experiments, there are still some shortcomings that need to be further improved in this study.
- Limitations of the study’s scope
This study focuses on a specific type of rural housing in the Xuzhou area and lacks a comprehensive examination of rural dwellings across different geographic, climatic, and cultural contexts. As a result, the generalizability of the findings is limited, and their application to broader national contexts may be challenging. Rural housing varies significantly in building materials, architectural styles, and resident behaviors across different regions. Ignoring these regional differences could lead to ineffective energy-saving retrofit strategies.
- 2.
- Missing and inaccurate data
In the field of rural housing energy retrofitting research, there is a lack of systematic, long-term data support. This study relies on short-term field measurements and small-scale surveys, which do not fully capture the comprehensive thermal comfort conditions and their variations over time. Additionally, the data collection capacity in rural areas is relatively weak, and the absence of effective monitoring tools further compromises the accuracy and representativeness of the data.
- 3.
- Insufficient theoretical framework
The retrofit measures proposed in this study primarily focus on technical aspects and largely overlook interdisciplinary perspectives from fields such as sociology and psychology. Thermal comfort is not only a physical quantity but is also influenced by residents’ lifestyles, cultural backgrounds, and socioeconomic conditions. The lack of consideration for these factors may result in retrofit strategies that do not align with the actual needs and preferences of the residents.
- 4.
- Inadequate policy support
While both national and local governments have provided some support for the energy retrofitting of rural housing, policy implementation at the grassroots level often lacks specificity and flexibility. Many existing policies fail to effectively incentivize farmers to participate in energy-saving retrofitting projects, leading to difficulties in project implementation. Moreover, insufficient funding and weak technical support may also constrain the practical application of the research findings.
Future research should explore practical directions to address these gaps, including expanding the research scope, improving data collection and monitoring, adopting multidisciplinary approaches, and investigating policy and incentive mechanisms.
- Expanding the research scope
Future studies should cover a broader range of regions, including rural housing types in different climatic zones and cultural contexts. By comparing and analyzing retrofitting experiences across diverse areas, energy-saving design principles and technical solutions suitable for different environments can be extracted.
- 2.
- Enhancing data collection and monitoring
Establishing a systematic, long-term monitoring mechanism is essential for collecting comprehensive data on energy consumption, indoor thermal comfort, and resident satisfaction in retrofitted rural housing. Utilizing IoT technologies and big data analytics to continuously monitor changes in energy use and comfort in rural housing can provide a valuable data foundation for subsequent research.
- 3.
- Multidisciplinary integrated research
Incorporating research methodologies from sociology, psychology, and other humanities disciplines into the study of rural housing energy retrofitting is necessary. Investigating how residents’ lifestyles, values, and energy behaviors influence energy-saving actions can help design more user-centered retrofit strategies, thus improving residents’ engagement and satisfaction.
- 4.
- Policy and incentive mechanism research
Future research should explore energy retrofitting policies and incentive mechanisms tailored to rural areas. Investigating how financial subsidies, tax incentives, and other measures can encourage farmers’ participation in energy-saving retrofitting projects is crucial. Additionally, promoting collaboration between government bodies, research institutions, and businesses will be essential in advancing energy retrofitting in rural housing.
7. Conclusions
- In this study, the mean thermal sensation (MTS) and predicted mean vote (PMV) models applicable to rural residents in Xuzhou in summer and winter were established by regression analysis. Through comparative analysis, we found that the MTS model can more accurately reflect the adaptability of local residents to the thermal environment. In the analysis of the MTS model, the thermal neutral temperature in summer was 27.19 °C, and 80% of people thought that the range of comfortable temperature was 24.85~29.53°C. The thermal neutral temperature in winter was 18.23 °C, and 80% of people thought that the comfortable temperature ranged from 13.89 °C to 22.56 °C. The relationship model between the thermal neutral temperature and outdoor temperature was established by linear regression analysis, and the adaptive thermal comfort model suitable for rural residents in Xuzhou was obtained as follows: Tn = 0.2967To + 16.609 (15.92 < Tn < 28.04, R2 = 0.9905).
- Through BECH and ITES in Sware, the exterior wall insulation materials and their thickness, roof insulation materials and their thickness, thermal performance of exterior window glazing, north- and south-facing window-to-wall ratios, shading strategies, and closed warming galleries were simulated and analyzed, and single-factor optimization strategies for the transformation of thermal comfort and energy conservation of existing rural houses in Xuzhou were proposed. Considering both the improvement effect and cost, XPS insulation boards with a thickness of 60~90 mm should be adopted to transform the insulation of the exterior walls. For the insulation transformation of the roofs, it is advisable to use PUR insulation boards with a thickness of 60~90 mm. The application of three-layer insulating glazing to the exterior windows can not only improve indoor thermal comfort but also achieve a significant energy conservation effect, and the cost performance is higher when air is used in the spaces between the glass layers. The south-facing window-to-wall ratio of the rural house should be designed as 0.35, and the optimal north-facing window-to-wall ratio is 0.2. Mobile horizontal outdoor shading boards should be set on the south-facing windows, with a length of 0.8 m. They should be opened in summer and closed in winter. When the eaves are closed to form warming galleries, three-layer insulating glazing should be used, and the effect is the best when the first- and second-floor eaves are closed to form warming galleries.
- Through the orthogonal test method, the simulation data of multi-factor comprehensive transformation were analyzed, and the optimal combination of transformation strategies suitable for existing rural houses in Xuzhou was summarized as follows: for the external walls, 70 mm XPS insulation boards are used; for the roofs, 80 mm PUR insulation boards are used; for the exterior windows, three-layer insulating glazing is used; the south-facing window-to-wall ratio is 0.35, and the north-facing window-to-wall ratio is 0.2; closed warming galleries are adopted on the first and second floors, with a depth of 1.5 m, and three-layer insulating glazing is used. Based on indoor thermal comfort, the importance of various influencing factors is ranked as follows: type of exterior window glass > closed warming galleries > south-facing window-to-wall ratio > thickness of XPS insulation boards of the exterior walls > thickness of PUR insulation boards of the roofs. Based on annual energy consumption, the importance of various influencing factors is ranked as follows: closed warming galleries > type of exterior window glass > thickness of XPS insulation boards of the exterior walls > thickness of PUR insulation boards of the roofs > south-facing window-to-wall ratio.
- The optimal renovation strategies were applied to the transformation of a typical rural house in Meichuang Village, Peixian County. After the transformation, the proportion of thermal comfort reaching the standard throughout the year increased to 33.24%. The indoor average temperature of the master bedroom was 6.37 °C on the winter solstice and 26.16°C on the summer solstice. The energy consumption was 5011 kWh in the heating season and 2191 kWh in the cooling season. The annual energy consumption was 7202 kWh, and the energy conservation rate was 70.07%. The estimated cost of transforming the rural house was CNY 66,810, and the annual electric bill for heating and cooling could theoretically be reduced by CNY 8430.
Although this study focuses on rural houses in the Xuzhou area, the methodologies and renovation strategies developed herein have broad applicability. The adaptive thermal comfort model and energy-efficient retrofit solutions presented in this paper can be adapted for rural buildings in other countries with similar climatic conditions. This research not only contributes to the local context but also offers a valuable framework for global efforts aimed at reducing energy consumption and improving indoor environmental quality in rural residential buildings.
Author Contributions
Conceptualization, X.L.; Methodology, X.L. and Y.Z.; Software, X.L. and Y.H.; Formal analysis, Y.H. and Z.Y.; Investigation, X.L. and Z.Y.; Data Curation, X.L. and Y.Z.; Writing—Original Draft Preparation, X.L., Y.Z. and Y.H.; Writing—Review and Editing, X.L. and X.J. All authors have read and agreed to the published version of the manuscript.
Funding
This research was funded by the Major Research Fund Project of Jiangsu Collaborative Innovation Center for Building Energy Efficiency and Construction Technology (No. SJXTZD2105); Foundation for Young Doctors of Jiangsu Collaborative Innovation Center for Building Energy Saving and Construction Technology (No. SJXTBS2126); Technology Project of Construction System in Jiangsu Province (No. 2024ZD025).
Institutional Review Board Statement
Not applicable.
Informed Consent Statement
This study is a low-risk questionnaire survey. All participants provided oral consent after being fully informed about the research purpose, procedures, data processing, and confidentiality measures. Since this study was conducted in a public setting, it was not feasible to obtain written informed consent; however, all respondents confirmed that their participation was voluntary and informed.
Data Availability Statement
The original contributions presented in this study are included in the article. Further inquiries can be directed to the corresponding author.
Conflicts of Interest
The authors declare no conflicts of interest.
References
- Zhang, Y.; Yang, Y.; Ye, W.; Chen, M.; Gu, X.; Li, X.; Jiang, P.; Liu, L. Assessing and gauging the carbon emission efficiency in China in accordance with the sustainable development goals. Sci. Rep. 2024, 14, 25993. [Google Scholar] [CrossRef] [PubMed]
- Zhang, Y.; Yao, G.; Qian, Z. Research on energy-saving renovation of rural buildings with sunrooms in Zhangbei area based on orthogonal experimental simulation. Chin. Overseas Archit. 2024, 1–12. Available online: http://kns.cnki.net/kcms/detail/43.1255.tu.20240809.1145.002.html (accessed on 18 December 2024).
- Chen, Y.; Wu, G. Design practice of solar house assembly in hot summer and cold winter area. Archit. Technol. 2024, 55, 6–8. [Google Scholar]
- Zhao, Y.; Yao, G. Research on Energy-Saving Potential and Renovation Strategies for Rural Residences in Xuzhou Under the Dual Carbon Goals. Urban. Archit. 2025, 22, 137–141. [Google Scholar] [CrossRef]
- Zhang, Y. Research on the Energy-Saving Potential and Policy System of Building in China. Master’s Thesis, Beijing Institute of Technology, Beijing, China, 2015. [Google Scholar]
- Huang, H.; Cheng, F.; Su, Y.; Yao, L.; Hu, J. Analysis of Energy-Saving Potential and Countermeasures in China Under the Carbon Peak Goal. Strateg. Study CAE 2021, 23, 81–91. [Google Scholar] [CrossRef]
- Missoum, M.; Hamidat, A.; Loukarfi, L.; Abdeladim, K. Impact of rural housing energy performance improvement on the energy balance in the North-West of Algeria. Energy Build. 2014, 85, 374–388. [Google Scholar] [CrossRef]
- Alev, U.; Eskola, L.; Arumagi, E.; Jokisalo, J.; Donarelli, A.; Siren, K.; Broström, T.; Kalamees, T. Renovation alternatives to improve energy performance of historic rural houses in the Baltic Sea region. Energy Build. 2014, 77, 58–66. [Google Scholar] [CrossRef]
- Sarkar, A.; Bose, S. Exploring impact of opaque building envelope components on thermal and energy performance of houses in lower western Himalayans for optimal selection. J. Build. Eng. 2016, 7, 170–182. [Google Scholar] [CrossRef]
- Michael, A.; Demosthenous, D.; Philokyprou, M. Natural ventilation for cooling in mediterranean climate: A case study in vernacular architecture of Cyprus. Energy Build. 2017, 144, 333–345. [Google Scholar] [CrossRef]
- Hema, M.C.; Messan, A.; Lawane, A.; Van Moeseke, G. Impact of the Design of Walls Made of Compressed Earth Blocks on the Thermal Comfort of Housing in Hot Climate. Buildings 2020, 10, 157. [Google Scholar] [CrossRef]
- Chunxiao, B.; Chenglong, Z.; Linbo, B. Study on optimization strategy of indoor thermal comfort for rural housings in cold region. Archit. Cult. 2023, 7, 26–27. [Google Scholar]
- Pan, X.; Wei, S. Research on design strategies of thermal comfort of rural residential buildings in hot summer and cold winter areas. Rural. Sci. Technol. 2018, 39–41. [Google Scholar]
- Shi, C. Research on Energy-Saving Renovation of Existing Rural Houses in Nantong Based on Indoor Thermal Comfort. Master’s Thesis, China University of Mining and Technology, Xuzhou, China, 2023. [Google Scholar]
- Shao, S. Research on Energy-Saving Renovation Strategies for Rural Residences in Eastern Hebei Based on Thermal Comfort. Master’s Thesis, Hebei University of Technology, Tianjin, China, 2021. [Google Scholar]
- Liu, P.; Zhang, Q.; Zhong, K.; Wei, Y.; Wang, Q. Climate Adaptation and Indoor Comfort Improvement Strategies for Buildings in High-Cold Regions: Empirical Study from Ganzi Region, China. Sustainability 2022, 14, 576. [Google Scholar] [CrossRef]
- Setiawan, A.F.; Huang, T.L.; Tzeng, C.T.; Lai, C.M. The effects of envelope design alternatives on the energy consumption of residential houses in Indonesia. Energies 2015, 8, 2788–2802. [Google Scholar] [CrossRef]
- Harvey, L.D.D. Reducing energy use in the buildings sector: Measures, costs, and examples. Energy Effic. 2009, 2, 139–163. [Google Scholar] [CrossRef]
- Fesanghary, M.; Asadi, S.; Geem, Z.W. Design of low-emission and energy-efficient residential buildings using a multi-objective optimization algorithm. Build. Environ. 2012, 49, 245–250. [Google Scholar] [CrossRef]
- Shams Amiri, S. On the Developmenet of Multi-Linear Regression Analysis to Assess Energy Consumption in the Early Stages of Building Design. Ph. D. Thesis, Texas A&M University—Kingsville, Kingsville, TX, USA, 2014. [Google Scholar]
- Chandel, S.S.; Sarkar, A. Performance assessment of a passive solar building for thermal comfort and energy saving in a hilly terrain of India. Energy Build. 2015, 86, 873–885. [Google Scholar] [CrossRef]
- Yue, X.; Luo, H.; Gao, Y.; Wang, S. Present Situation and Energy-Saving Retrofitting Strategy of ExistingRural Residential Buildings in Tianjin: On Huifeng West Village. Build. Energy Effic. 2020, 48, 57–61. [Google Scholar]
- Zhu, S.; Wang, G. Analysis on influencing factors and indoor thermal comfort of existing rural houses energy saving renovation in Qinhuangdao area. Sichuan Build. Sci. 2022, 48, 81–89. [Google Scholar]
- Rui, J.; Zhang, H.; Shi, C.; Pan, D.; Chen, Y.; Du, C. Survey on the Indoor Thermal Environment and Passive Design of Rural Residential Houses in the HSCW Zone of China. Sustainability 2019, 11, 6471. [Google Scholar] [CrossRef]
- Li, D.; An, X.; Li, H. Energy-Saving Retrofitting of Existing Rural Residential Buildings in Hot Summer and Cold Winter Zone: Taking the rural residence of Deyang City, Sichuan Province as an Example. Build. Energy Effic. 2020, 48, 81–86. [Google Scholar]
- Zhen, M. Research on Energy Saving Design of Rural Housing in Northeast China. Ph.D. Thesis, Harbin Institute of Technology, Harbin, China, 2016. [Google Scholar]
- GB 50176-2016; Thermal Design Code for Civil Building. China Architecture & Building Press: Beijing, China, 2016.
- GB/T 50785-2012; Evaluation Standard for Indoor Thermal Environment in Civil Buildings. China Architecture & Building Press: Beijing, China, 2012.
- Xu, X. Research on Thermal Comfort of Underground Atrium of Commercial Complex. Master’s Thesis, China University of Mining and Technology, Xuzhou, China, 2020. [Google Scholar]
- Chen, C. Research on Winter Thermal Comfort of Functional Districts of a Comprehensive Shopping Mall in Hot Summer and Warm Winter Areas. Master’s Thesis, South China University of Technology, Guangzhou, China, 2016. [Google Scholar]
- Wei, R.; Xu, W. Thermal Environment; Tongji University Press: Shanghai, China, 1994. [Google Scholar]
- Jia, H. Man and Built Environment; Beijing University of Technology Press: Beijing, China, 2001. [Google Scholar]
- De Dear, R.J.; Brager, G.S. Thermal comfort in naturally ventilated buildings: Revisions to ASHRAE Standard 55. Energy Build. 2002, 34, 549–561. [Google Scholar] [CrossRef]
- Nicol, J.F.; Humphreys, M.A. Adaptive thermal comfort and sustainable thermal standards for buildings. Energy Build. 2002, 34, 563–572. [Google Scholar] [CrossRef]
- GB/T 50378-2014; Assessment Standard for Green Building. China Architecture & Building Press: Beijing, China, 2014.
- Li, H.; Zhang, R.; Feng, G.; Huang, K.; Cao, C. Comparison of air conditioning load between a designed nearly zero-energy building and a common building in cold region. Build. Energy Effic. 2015, 43, 10–12. [Google Scholar]
- GB/T 50824-2013; Design Standard for Energy Efficiency of Rural Residential Buildings. China Architecture & Building Press: Beijing, China, 2013.
- Luo, Y. Research on Near-Zero Energy Consumption Renovation Strategies for Rural Residences in Xuzhou Area. Master’s Thesis, China University of Mining and Technology, Xuzhou, China, 2022. [Google Scholar] [CrossRef]
- Xie, C.; Yao, G.; Han, C. Energy-Saving Renovation Strategies for Rural Homes in Xuzhou Based on Multi-Objective Optimization: A Comprehensive Evaluation of Carbon Emissions, Costs, and Thermal Comfort. China Overseas Archit. 2025, 1–14. Available online: http://kns.cnki.net/kcms/detail/43.1255.tu.20250113.1140.002.html (accessed on 23 January 2025).


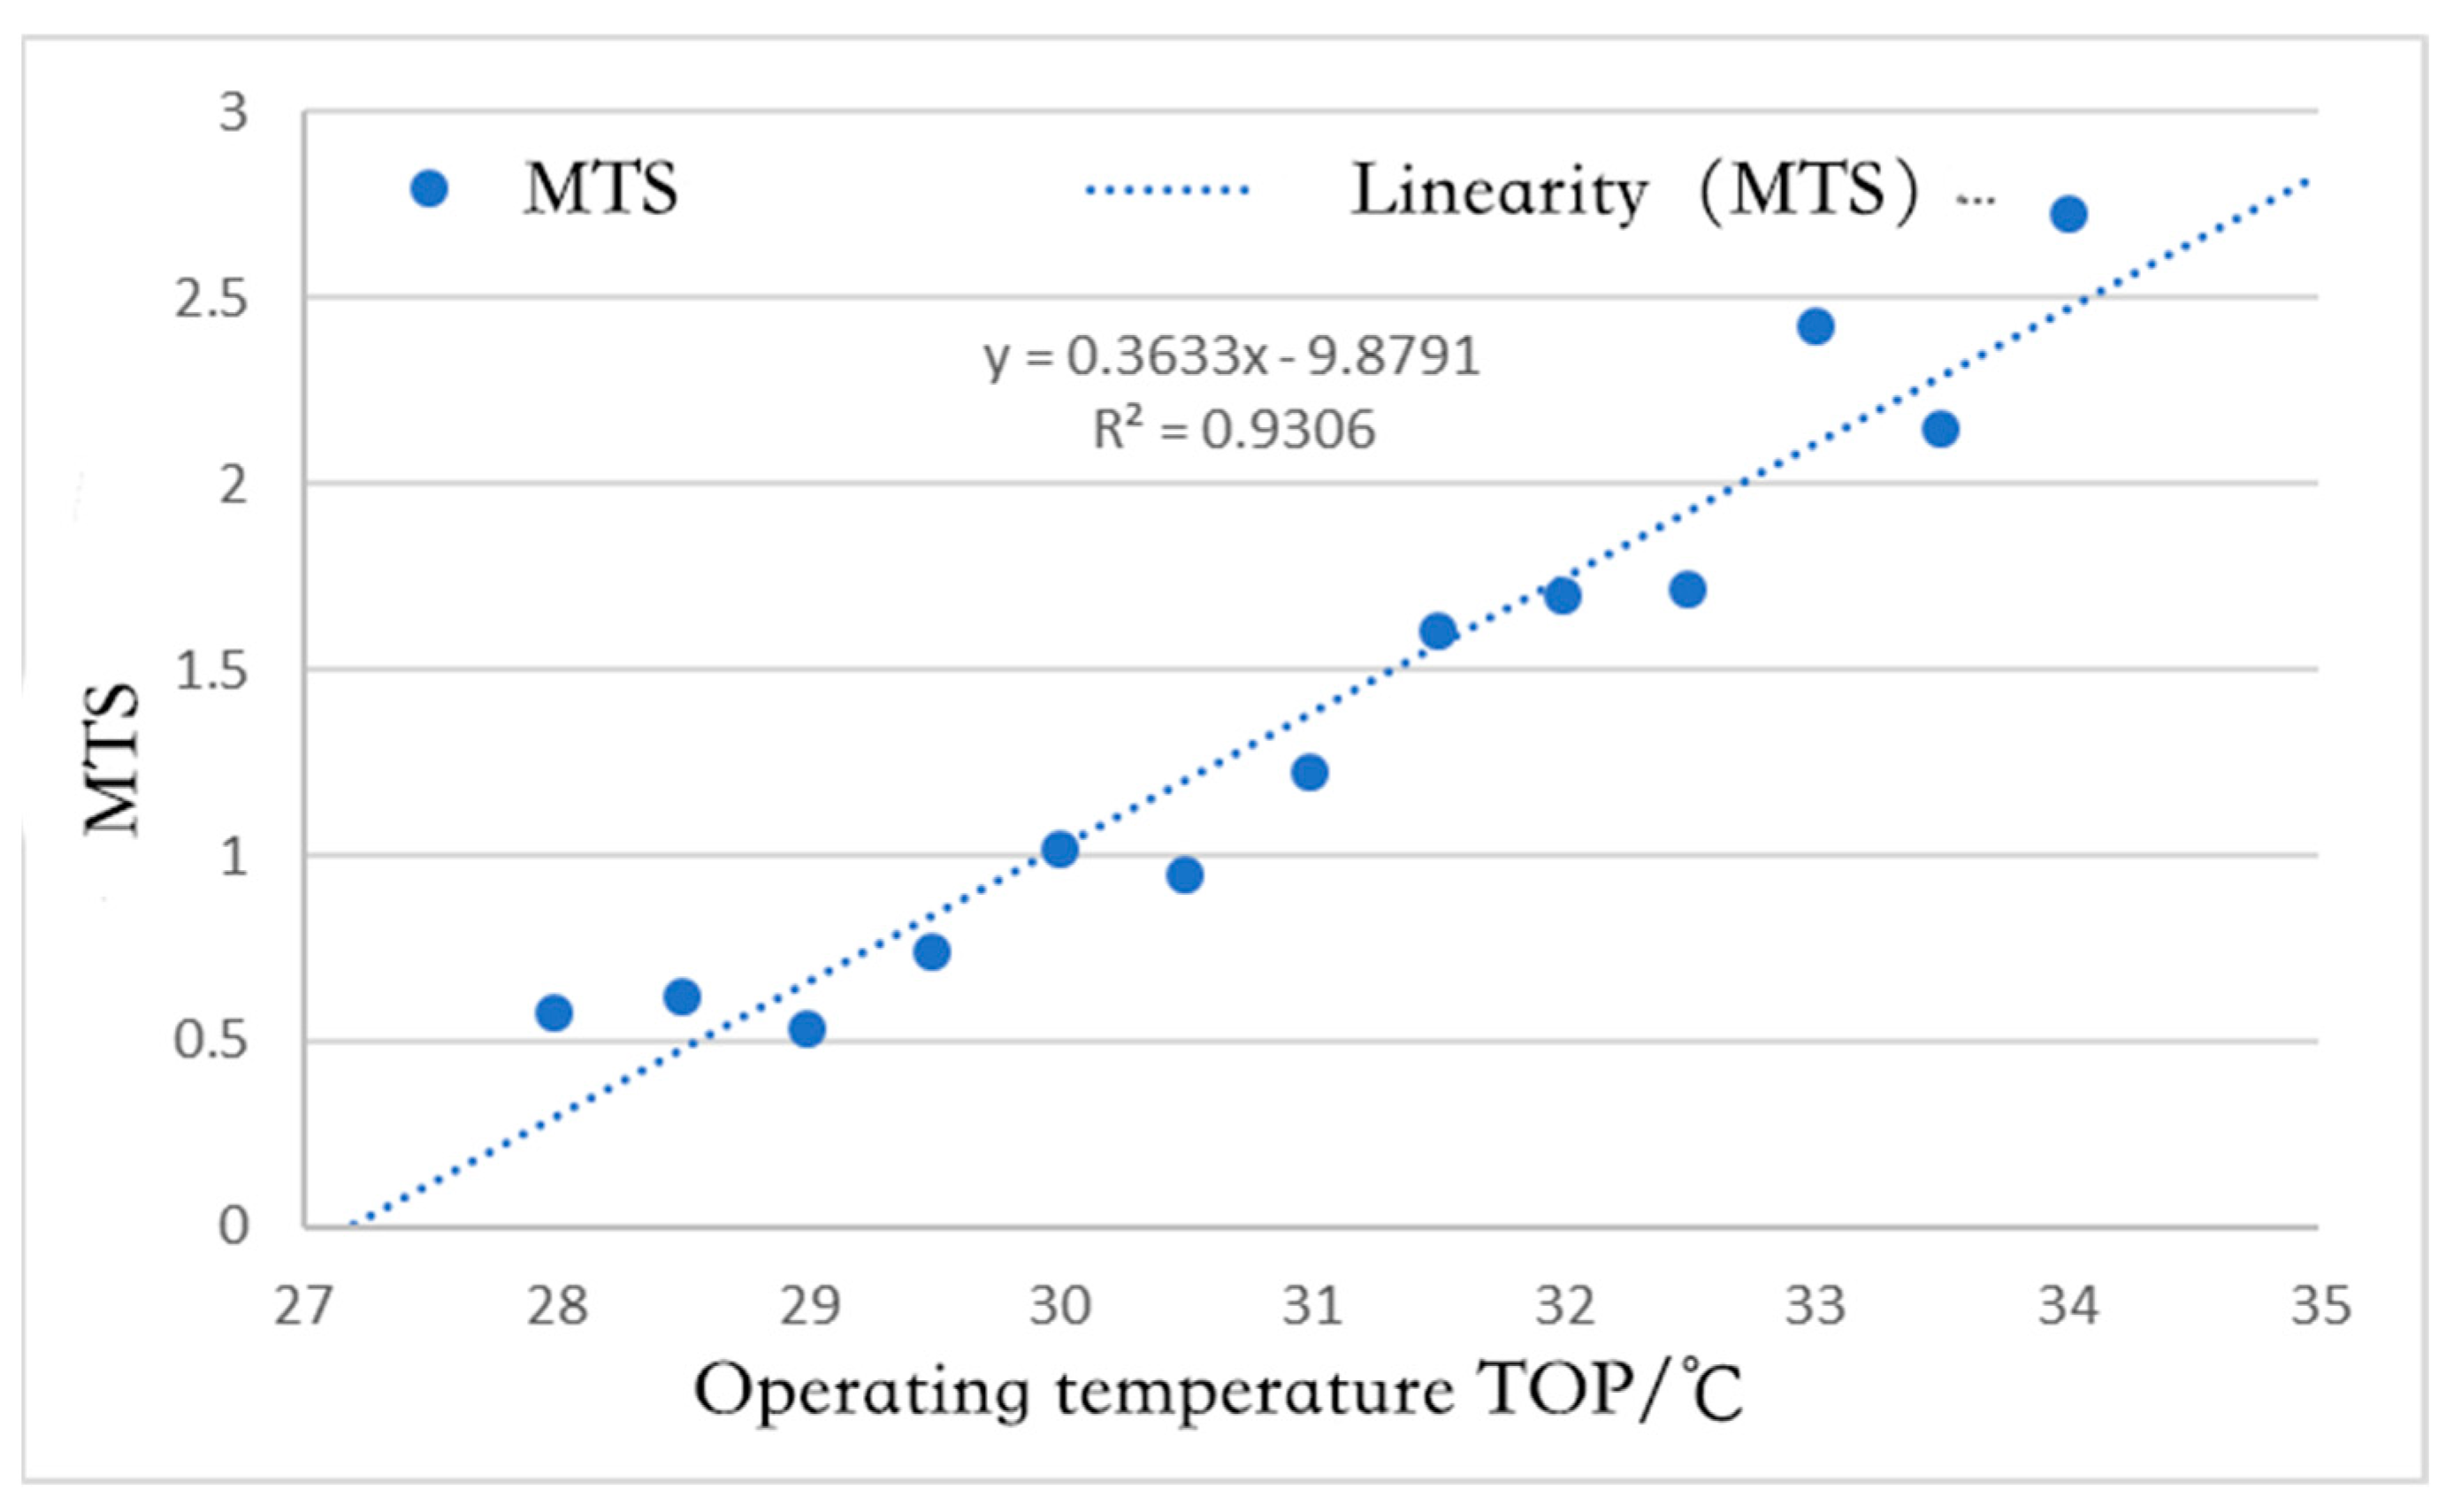
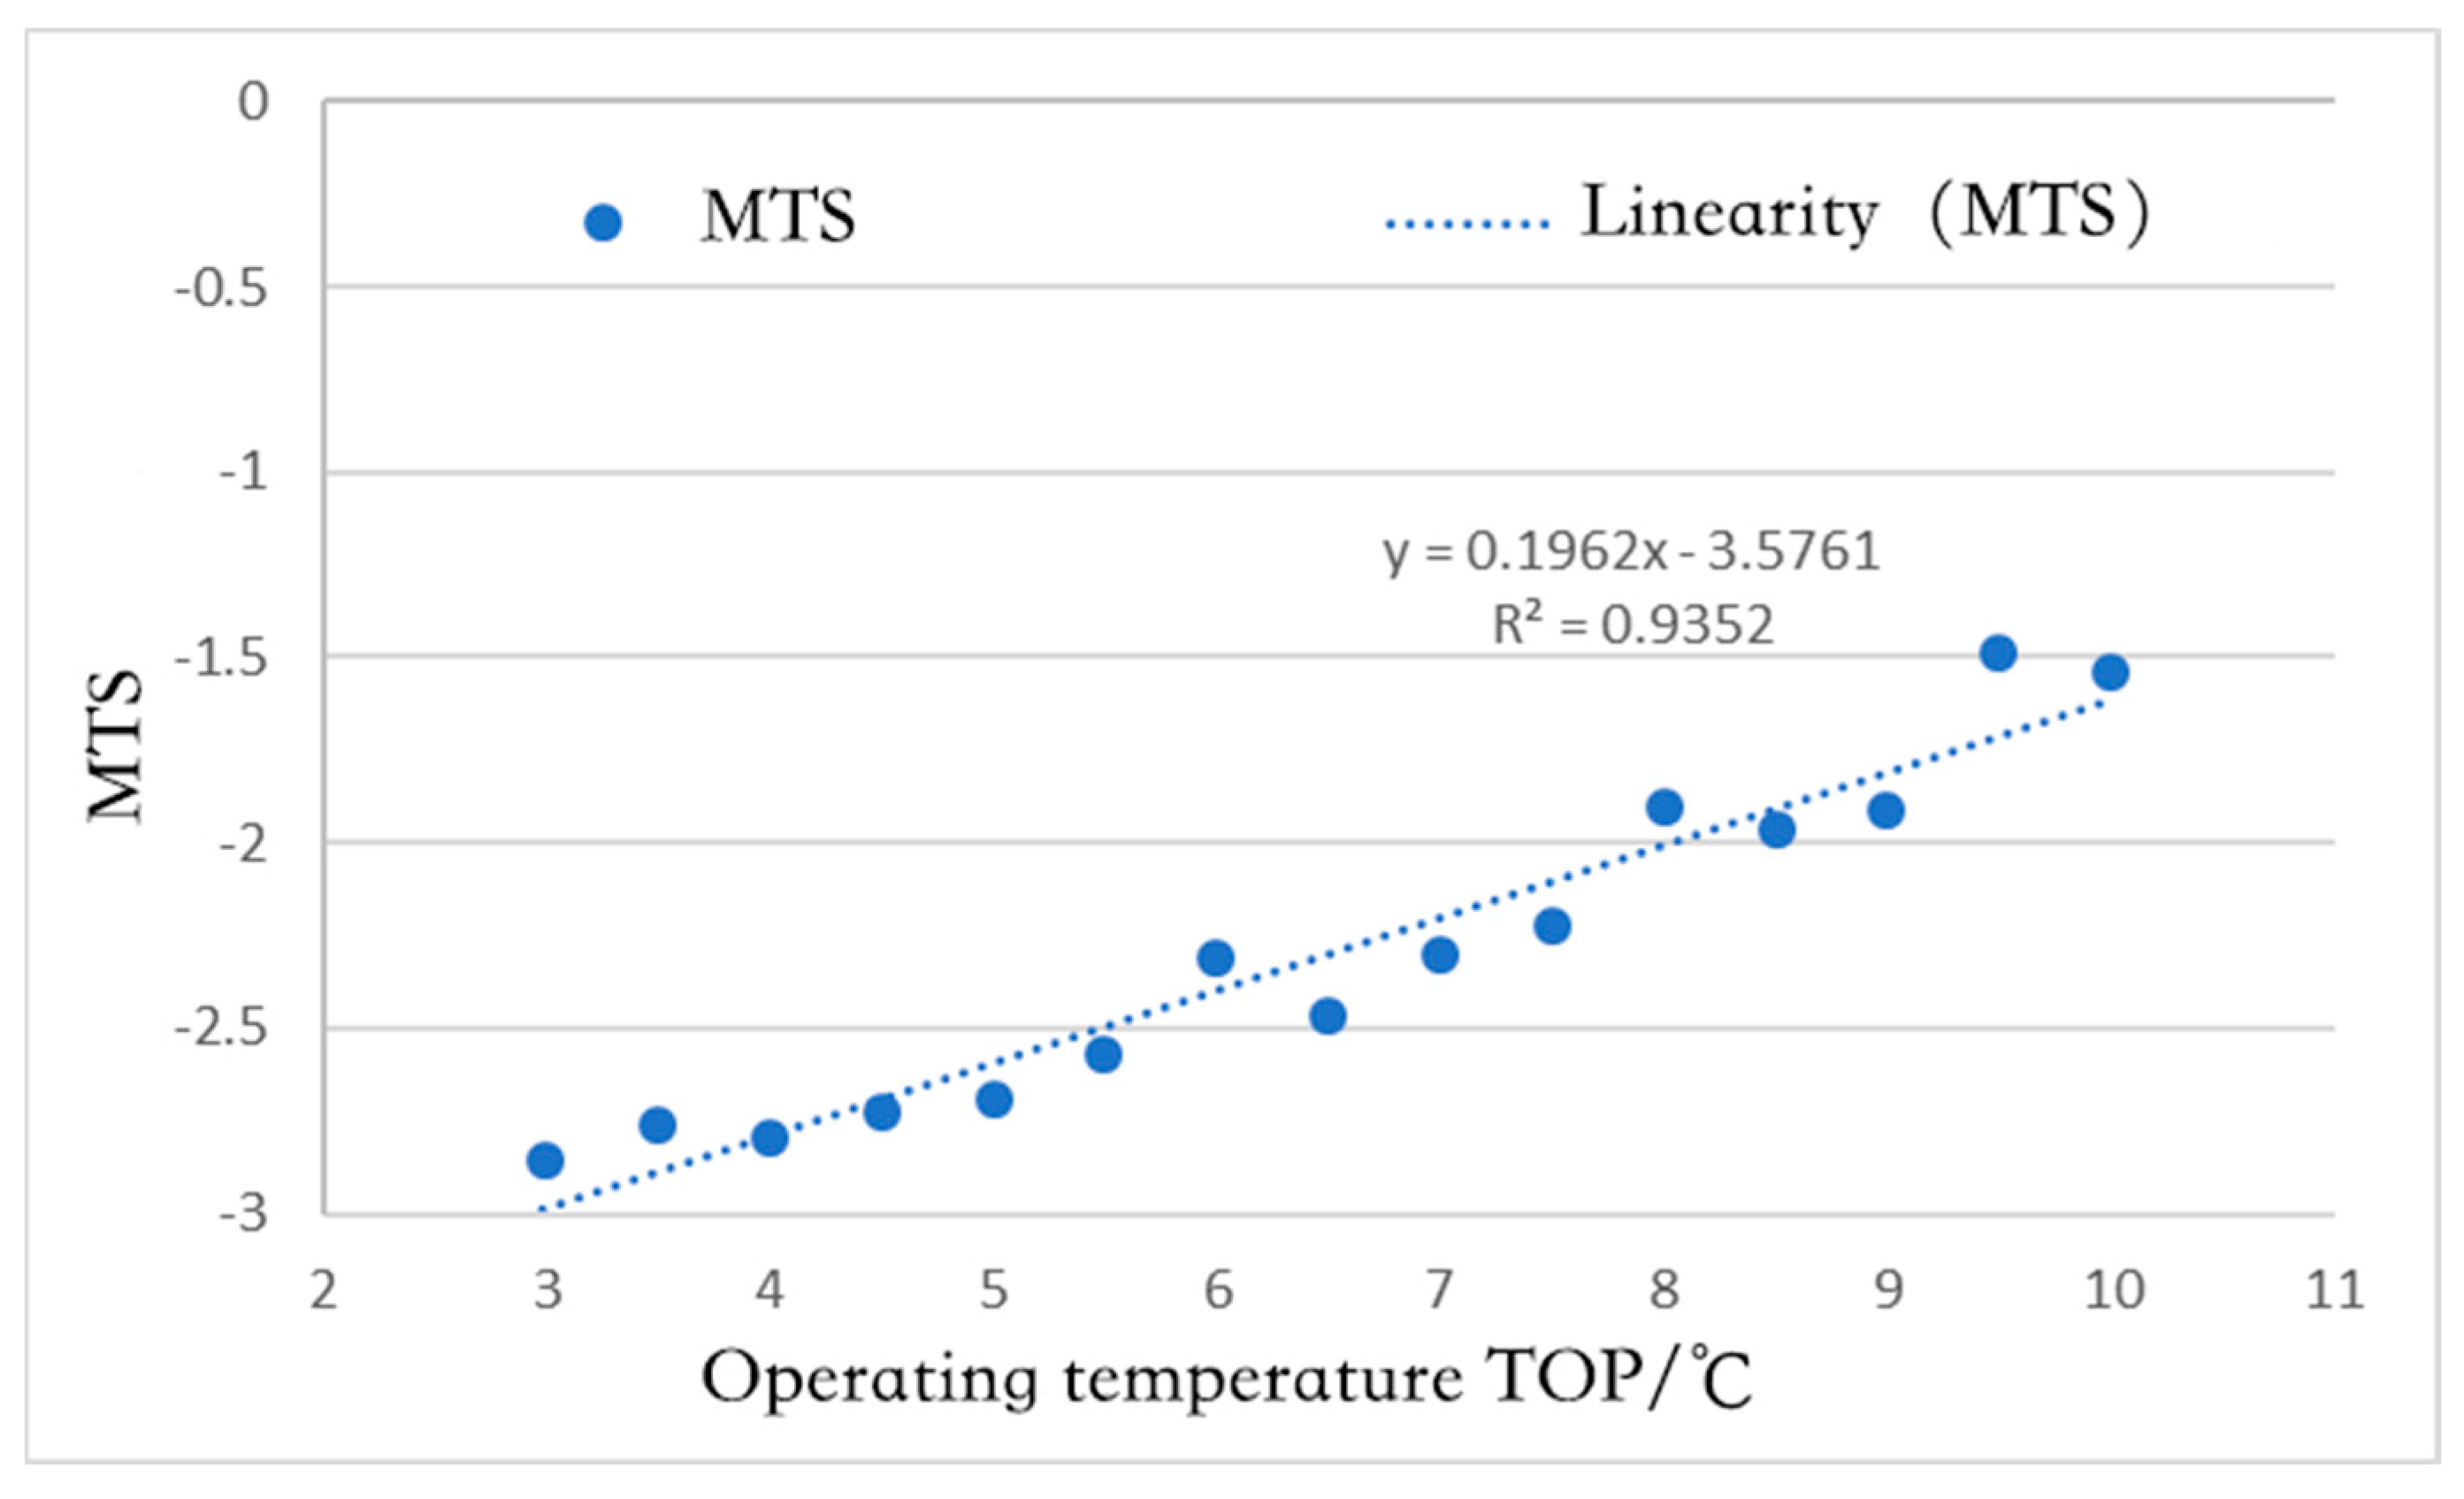
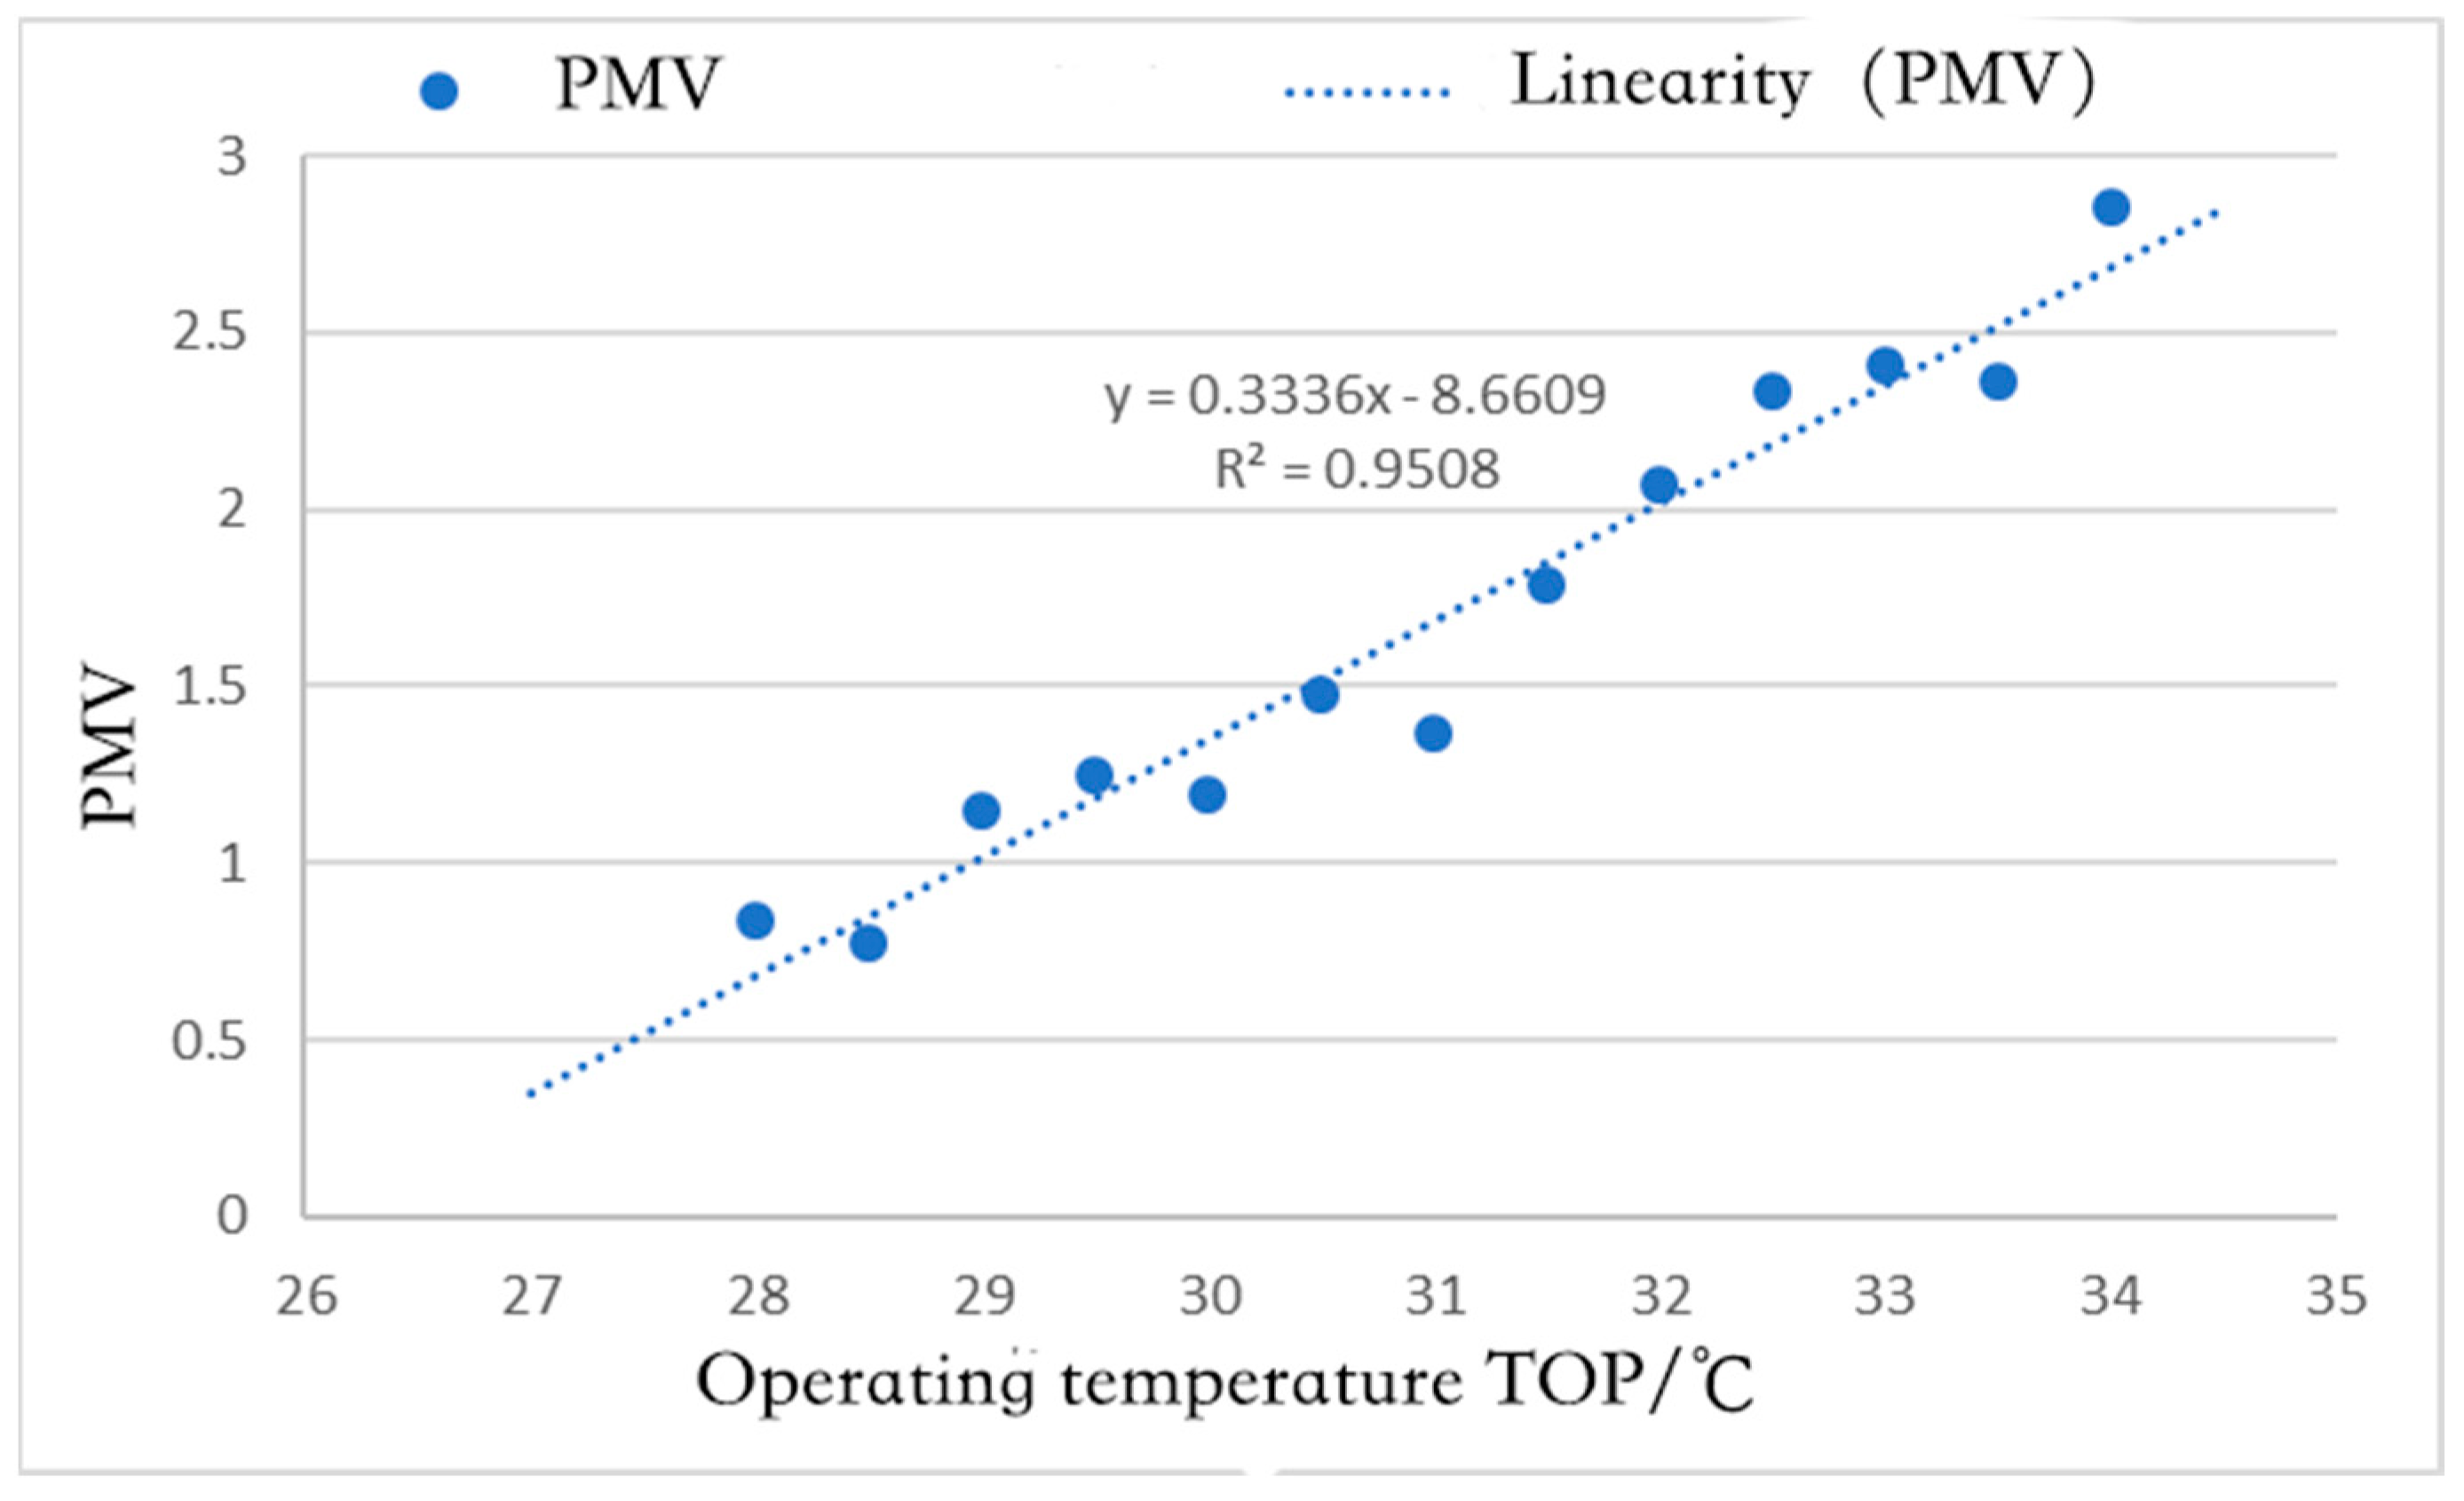
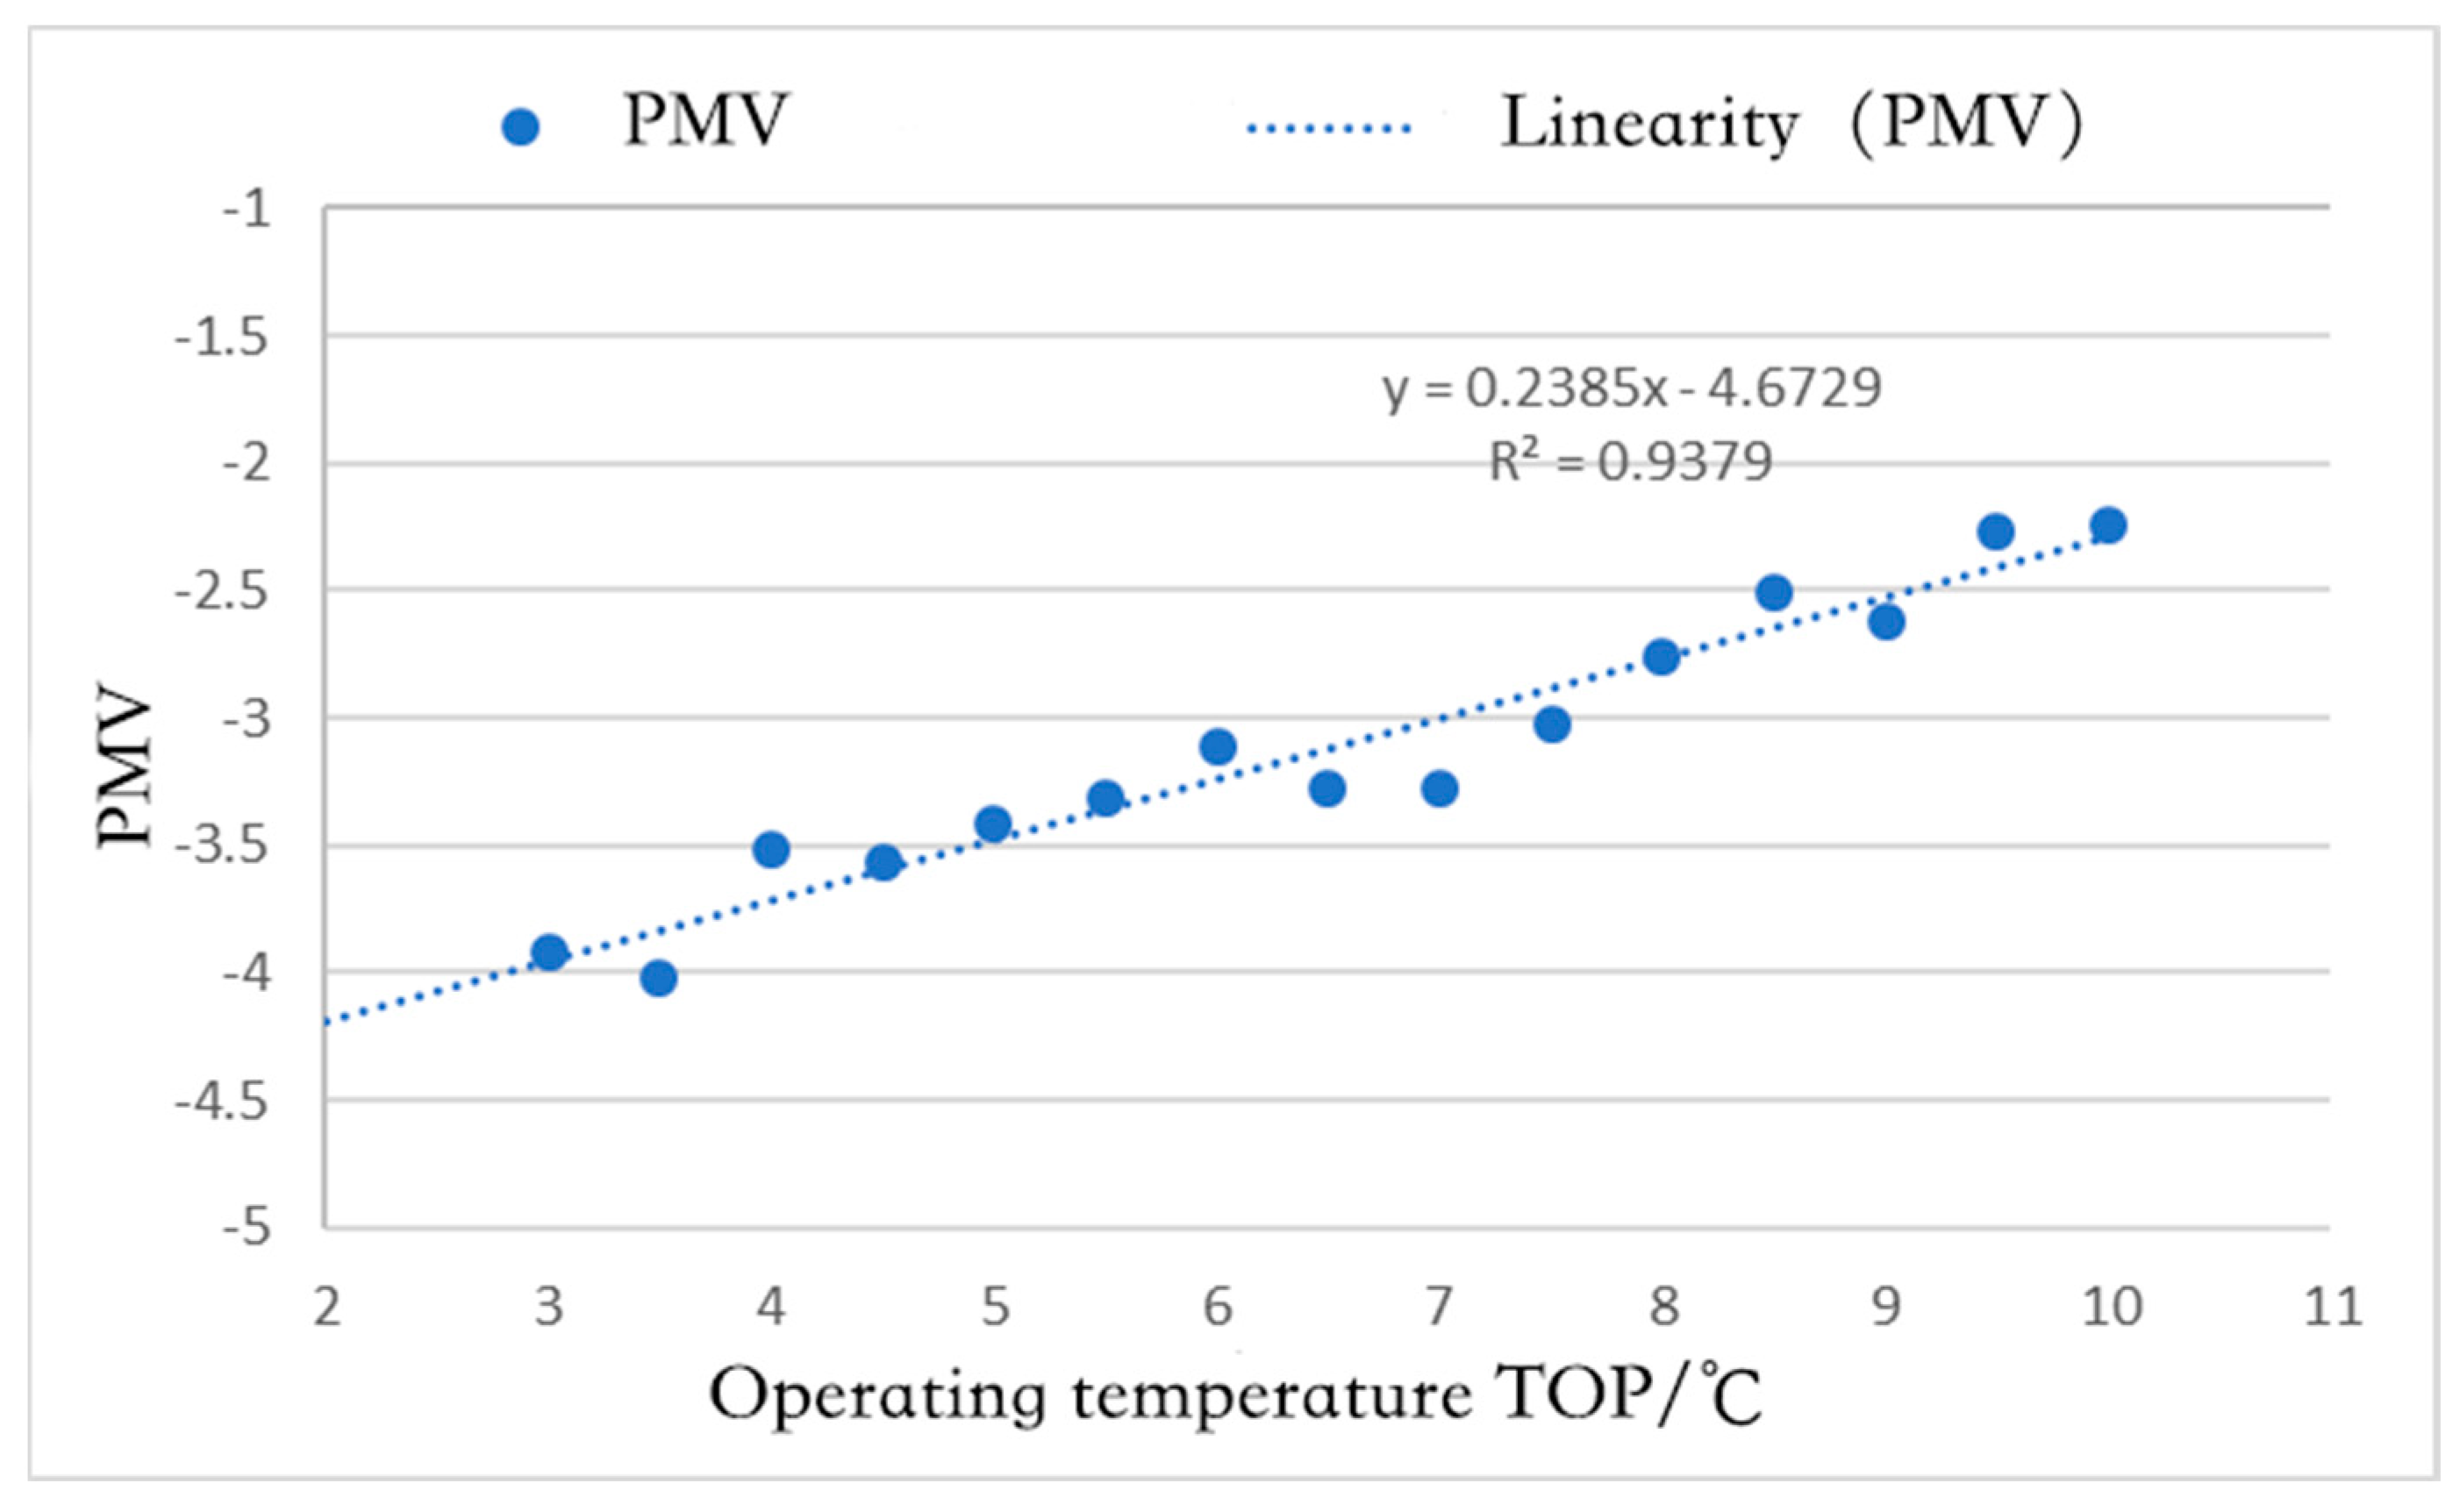

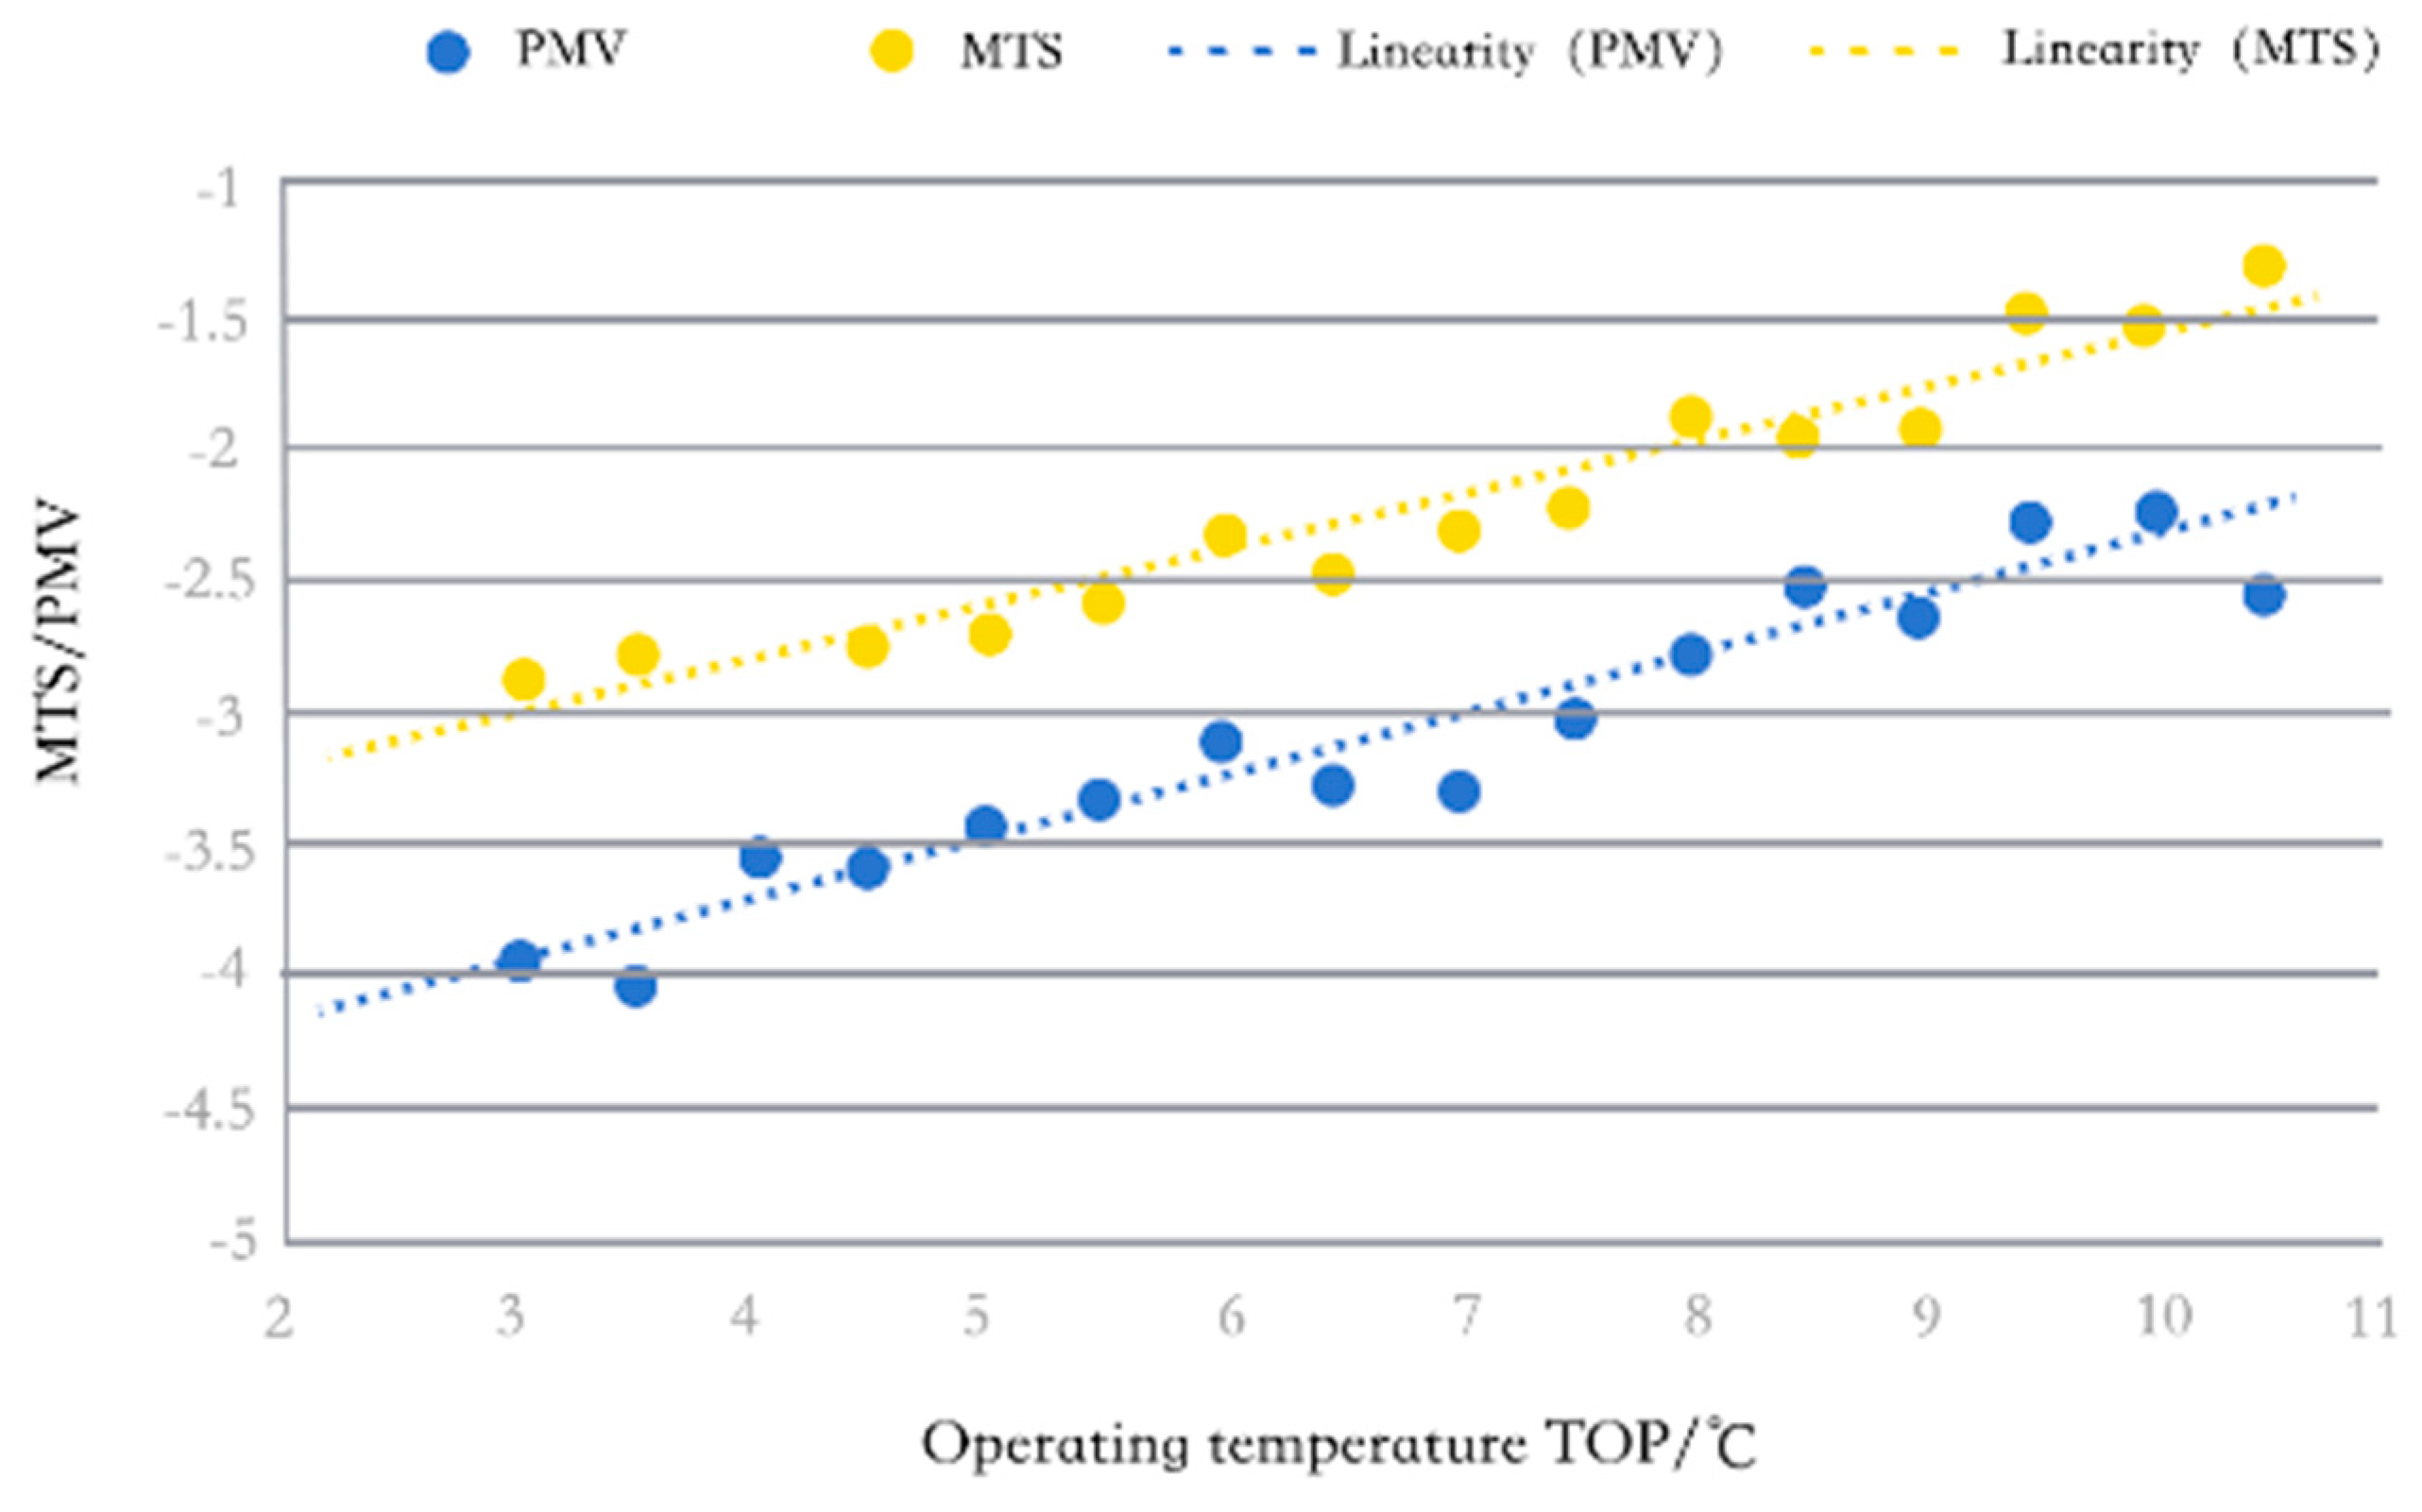
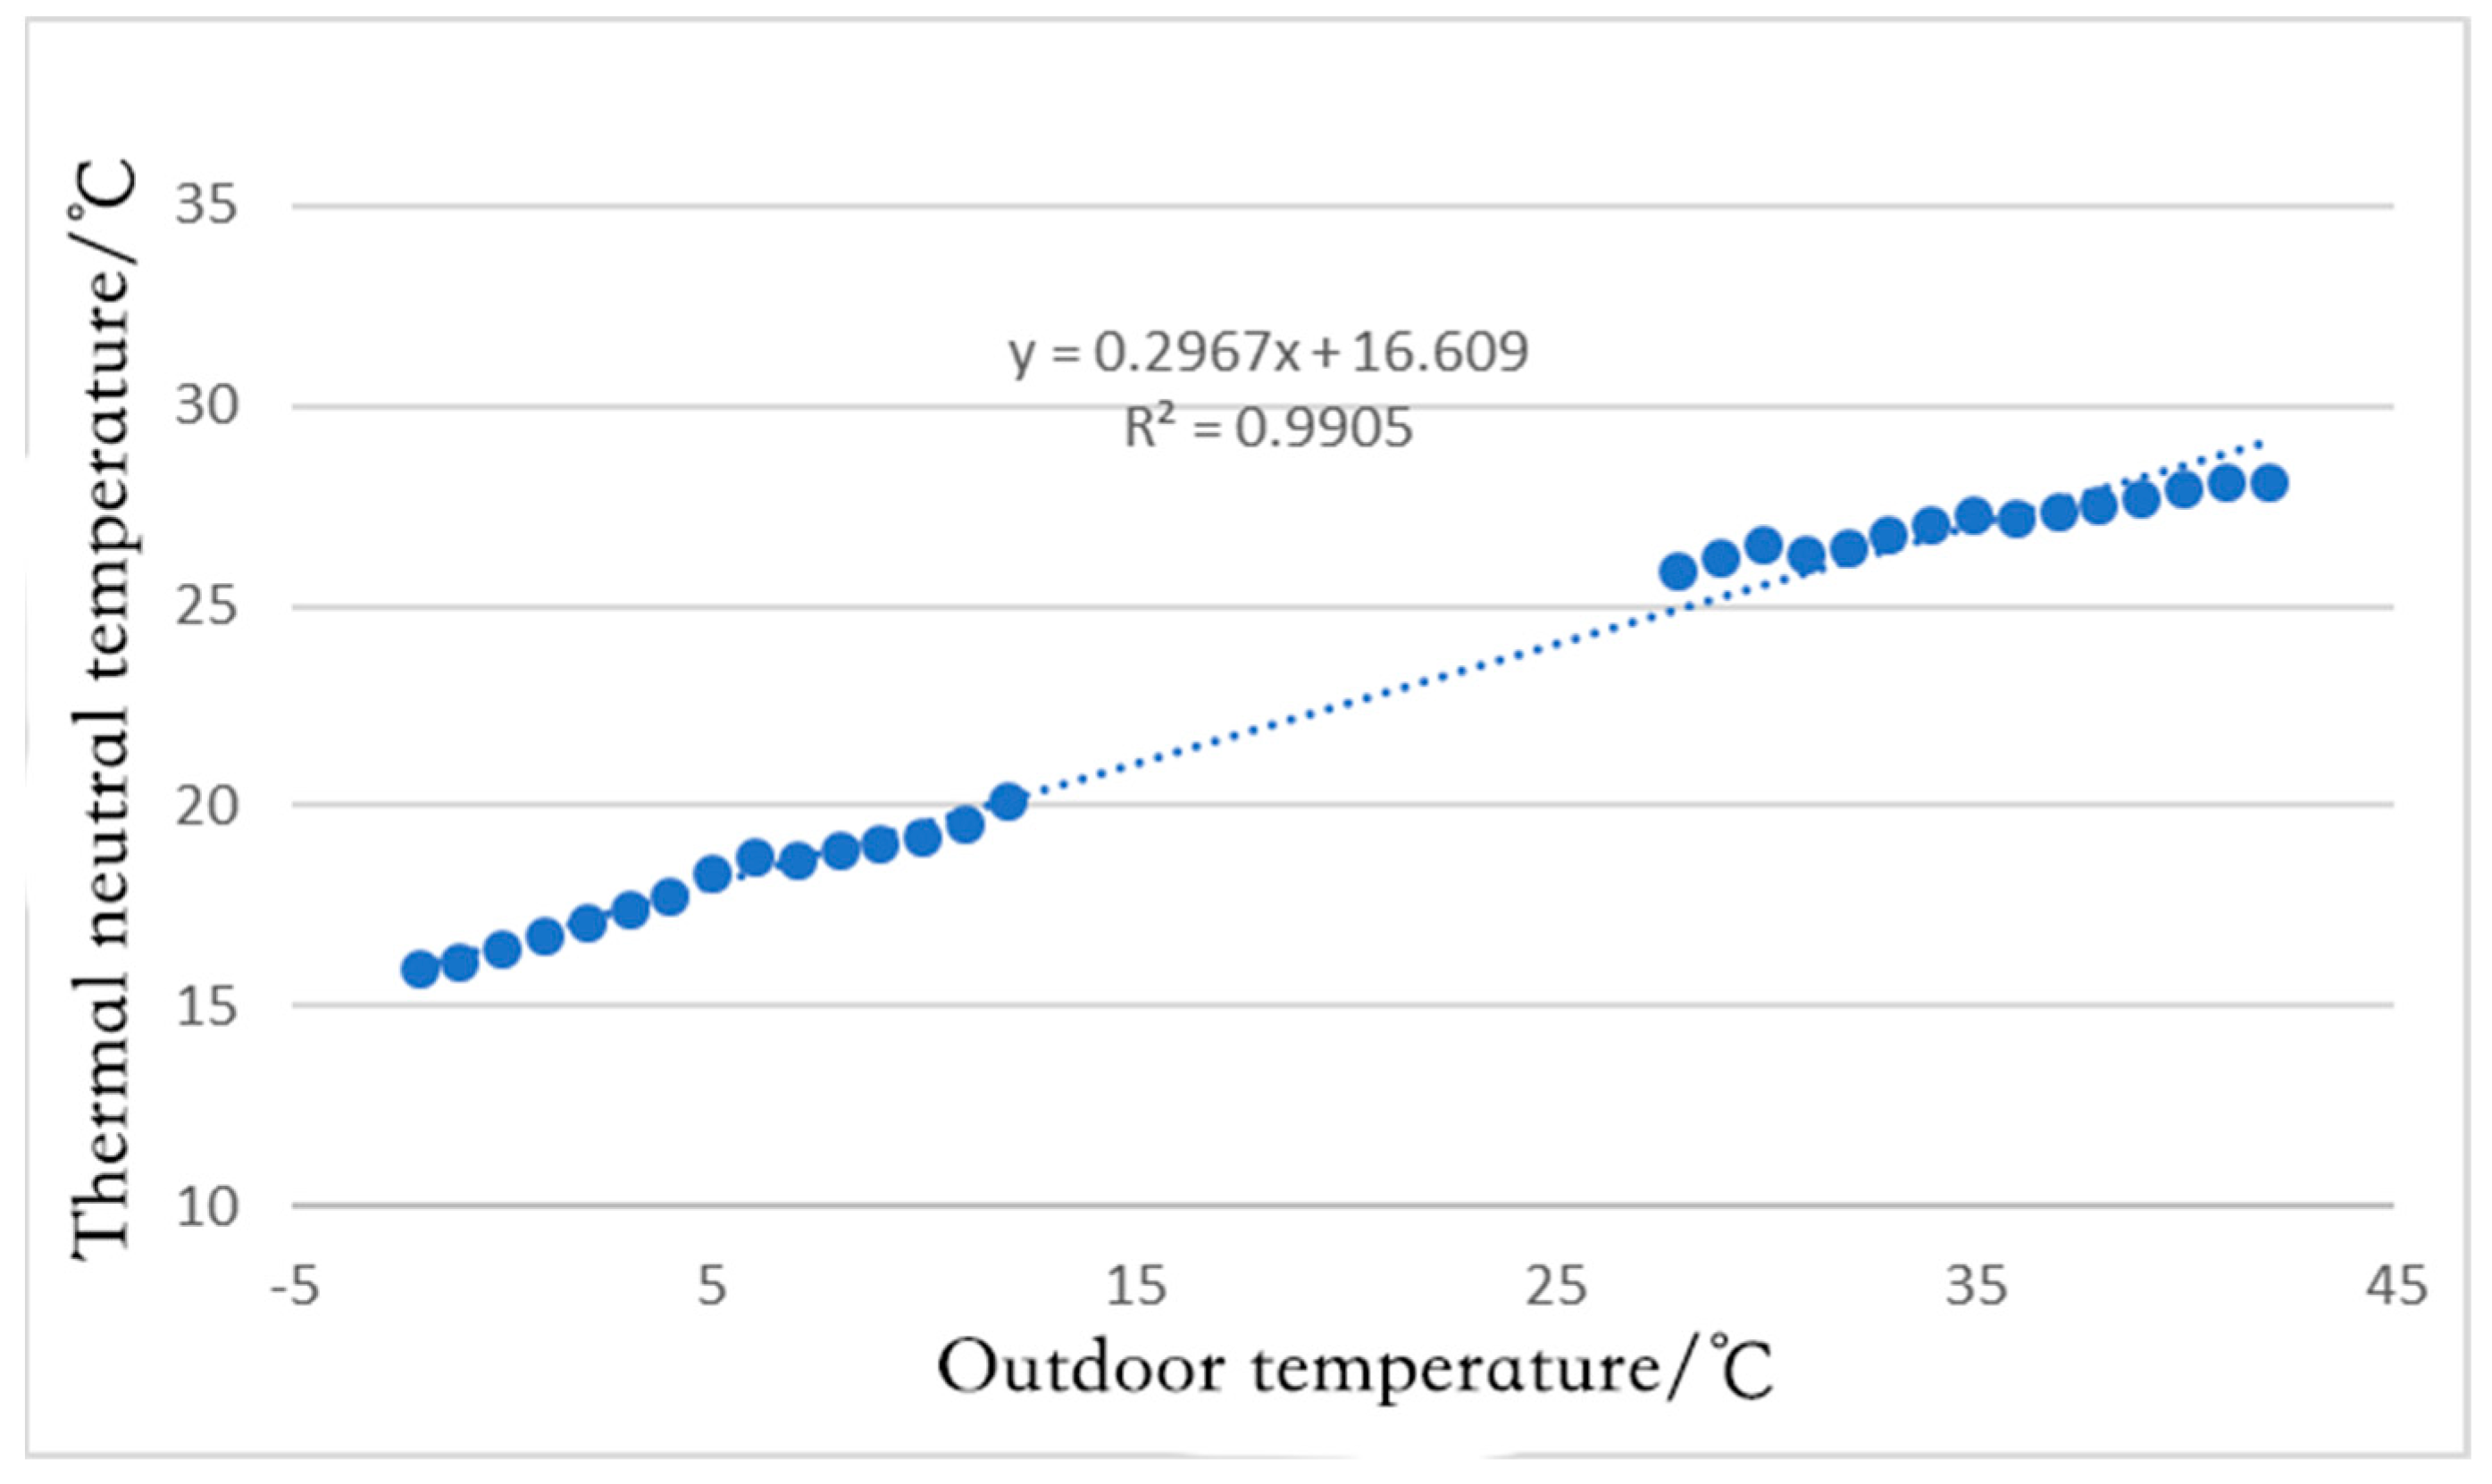
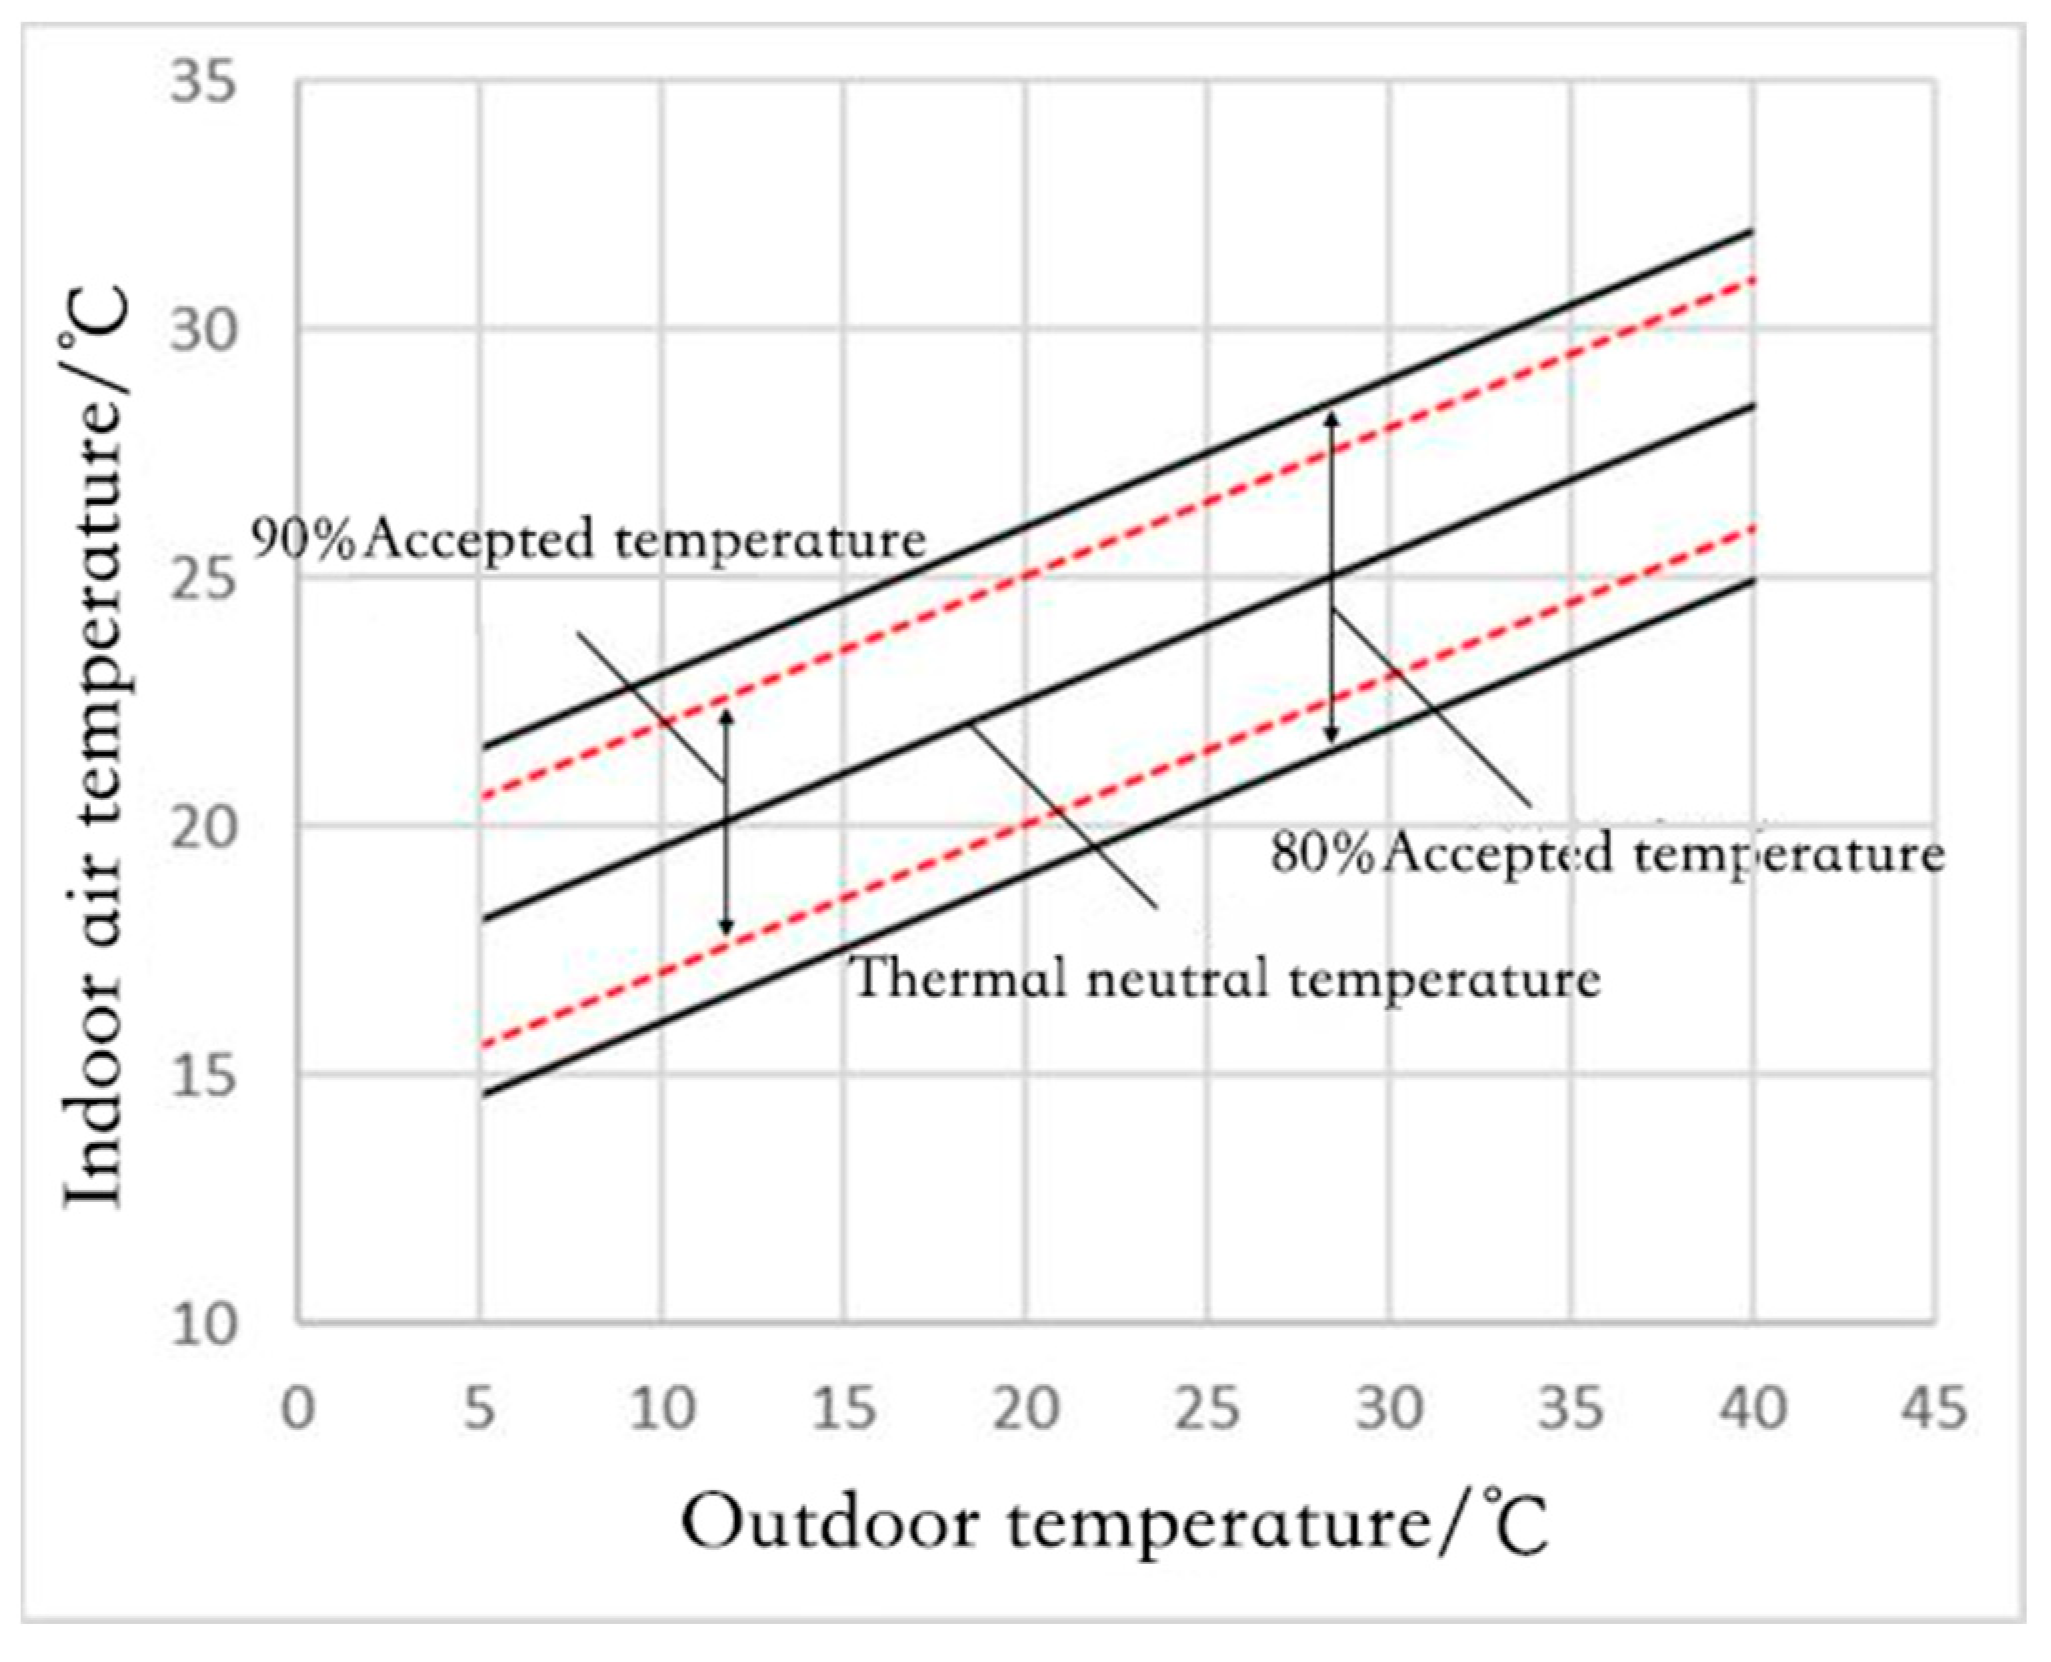

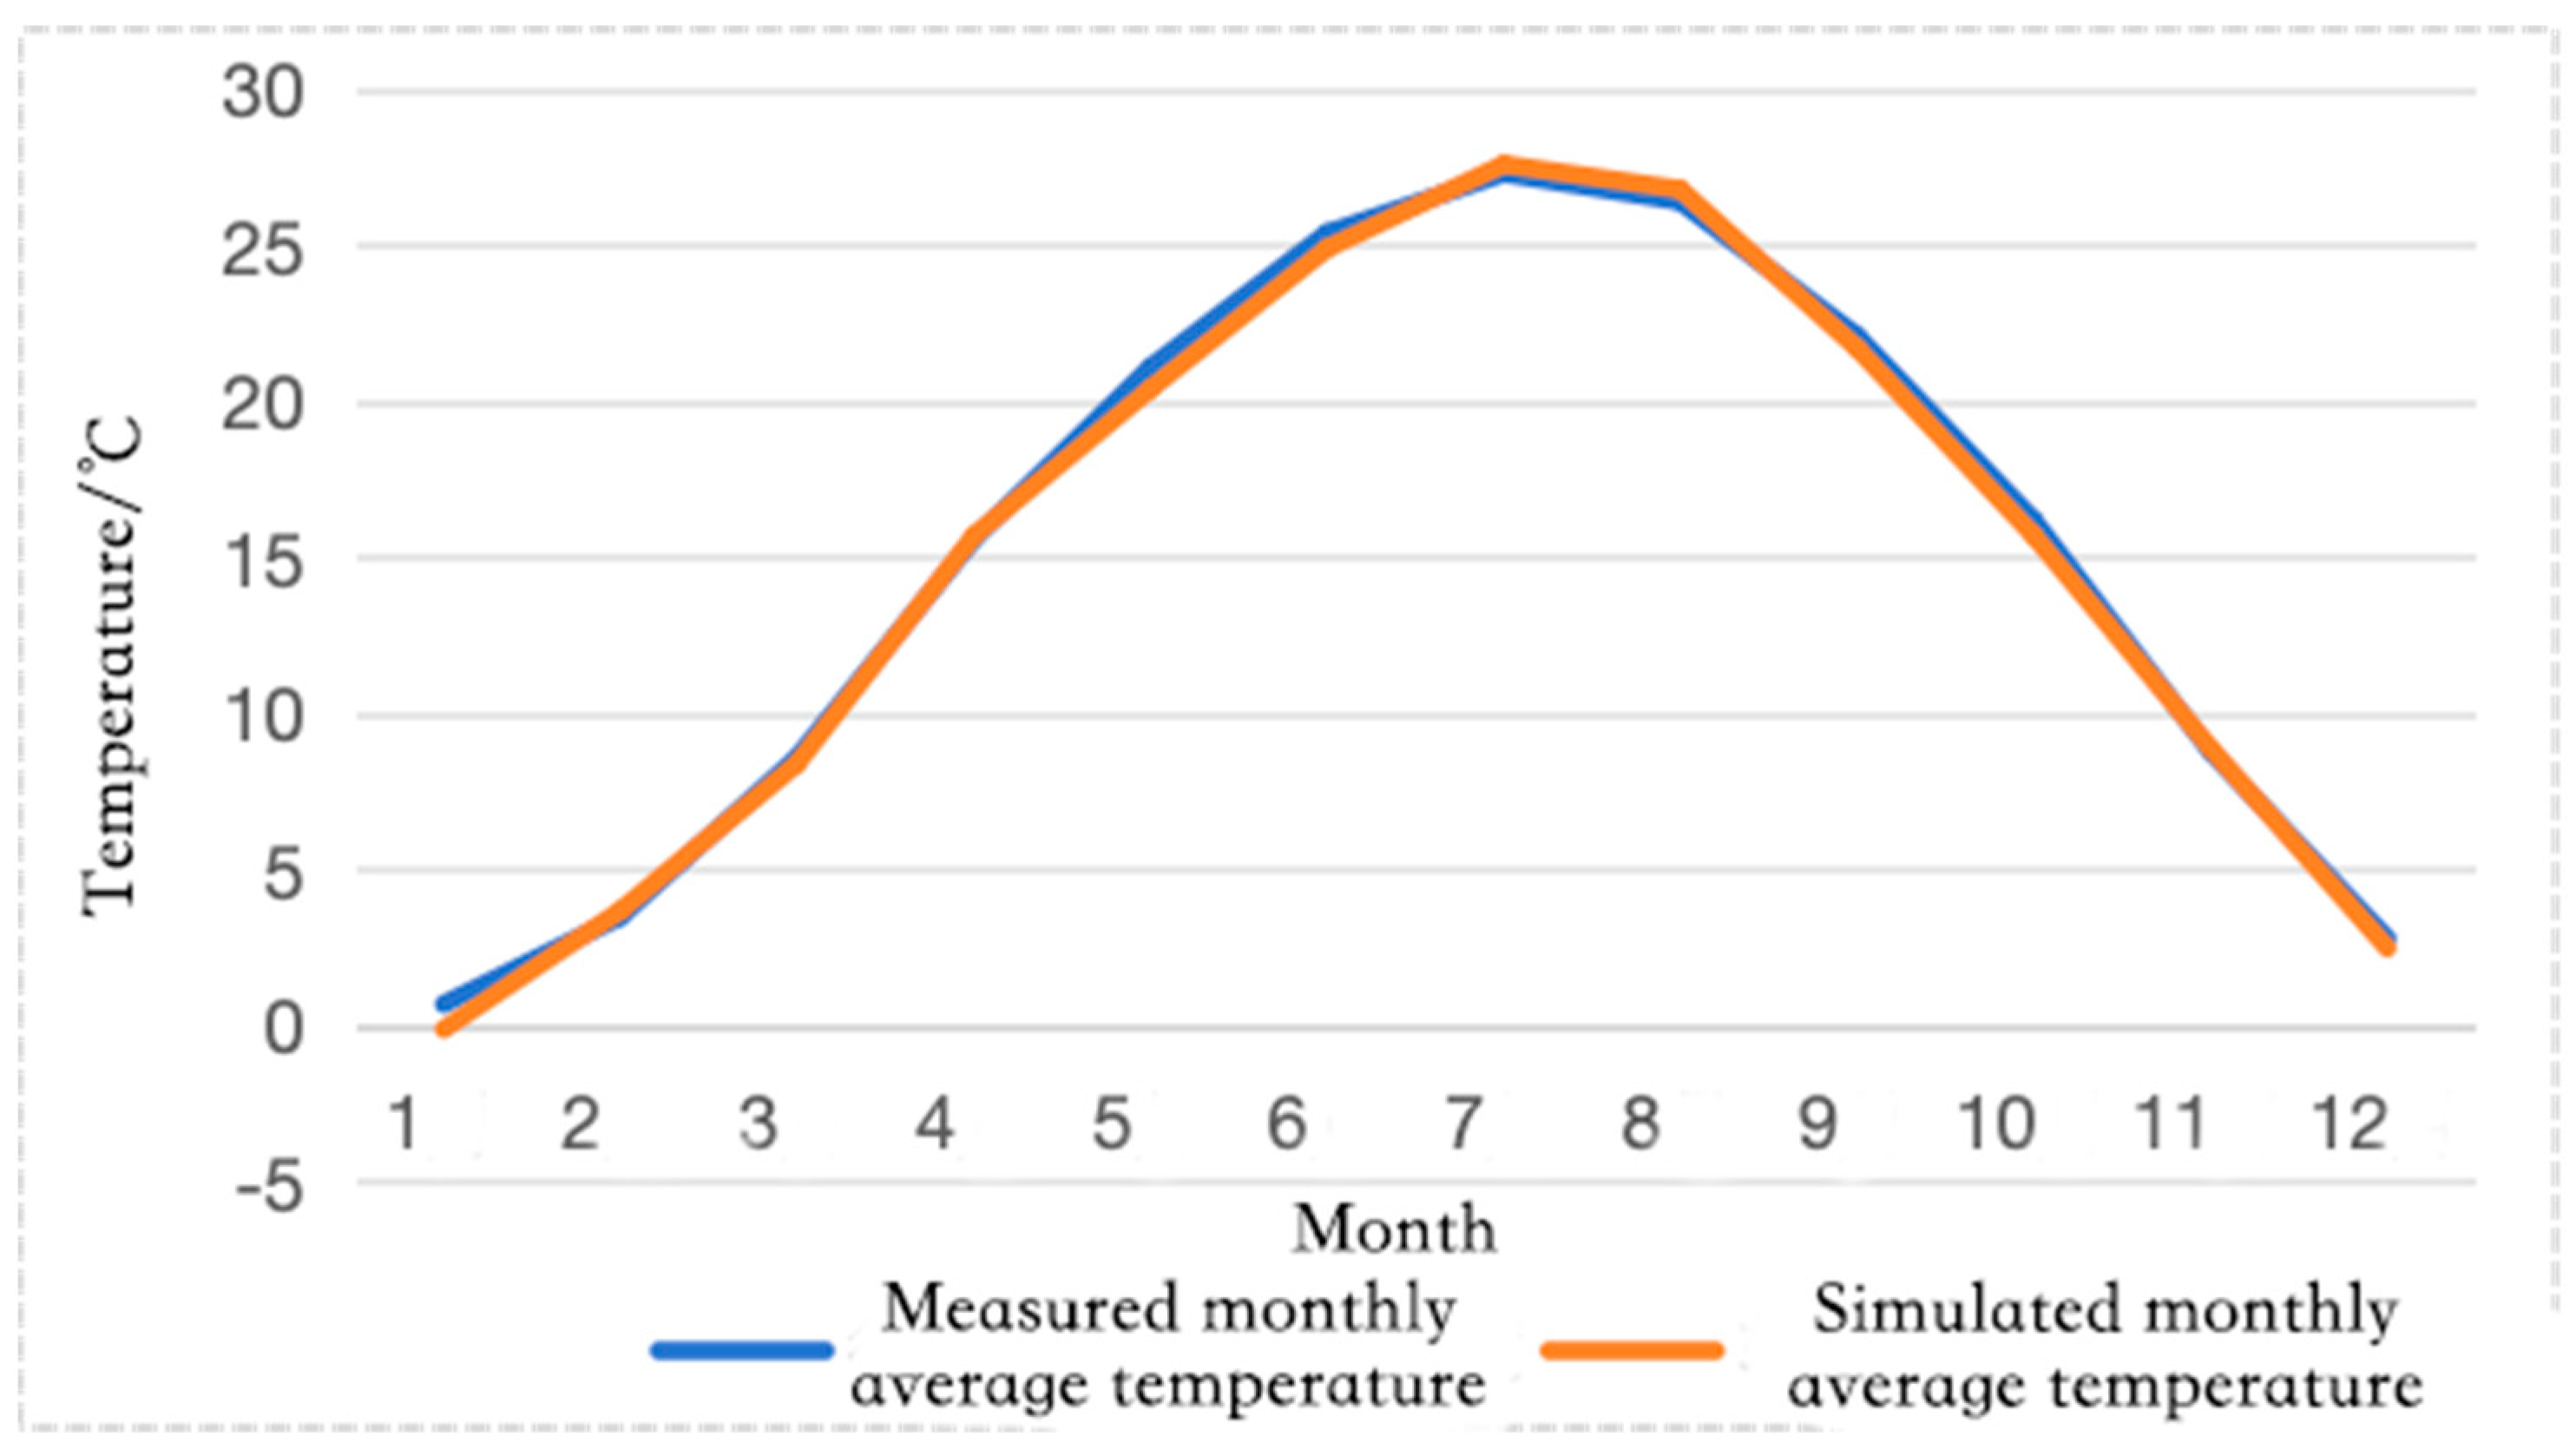
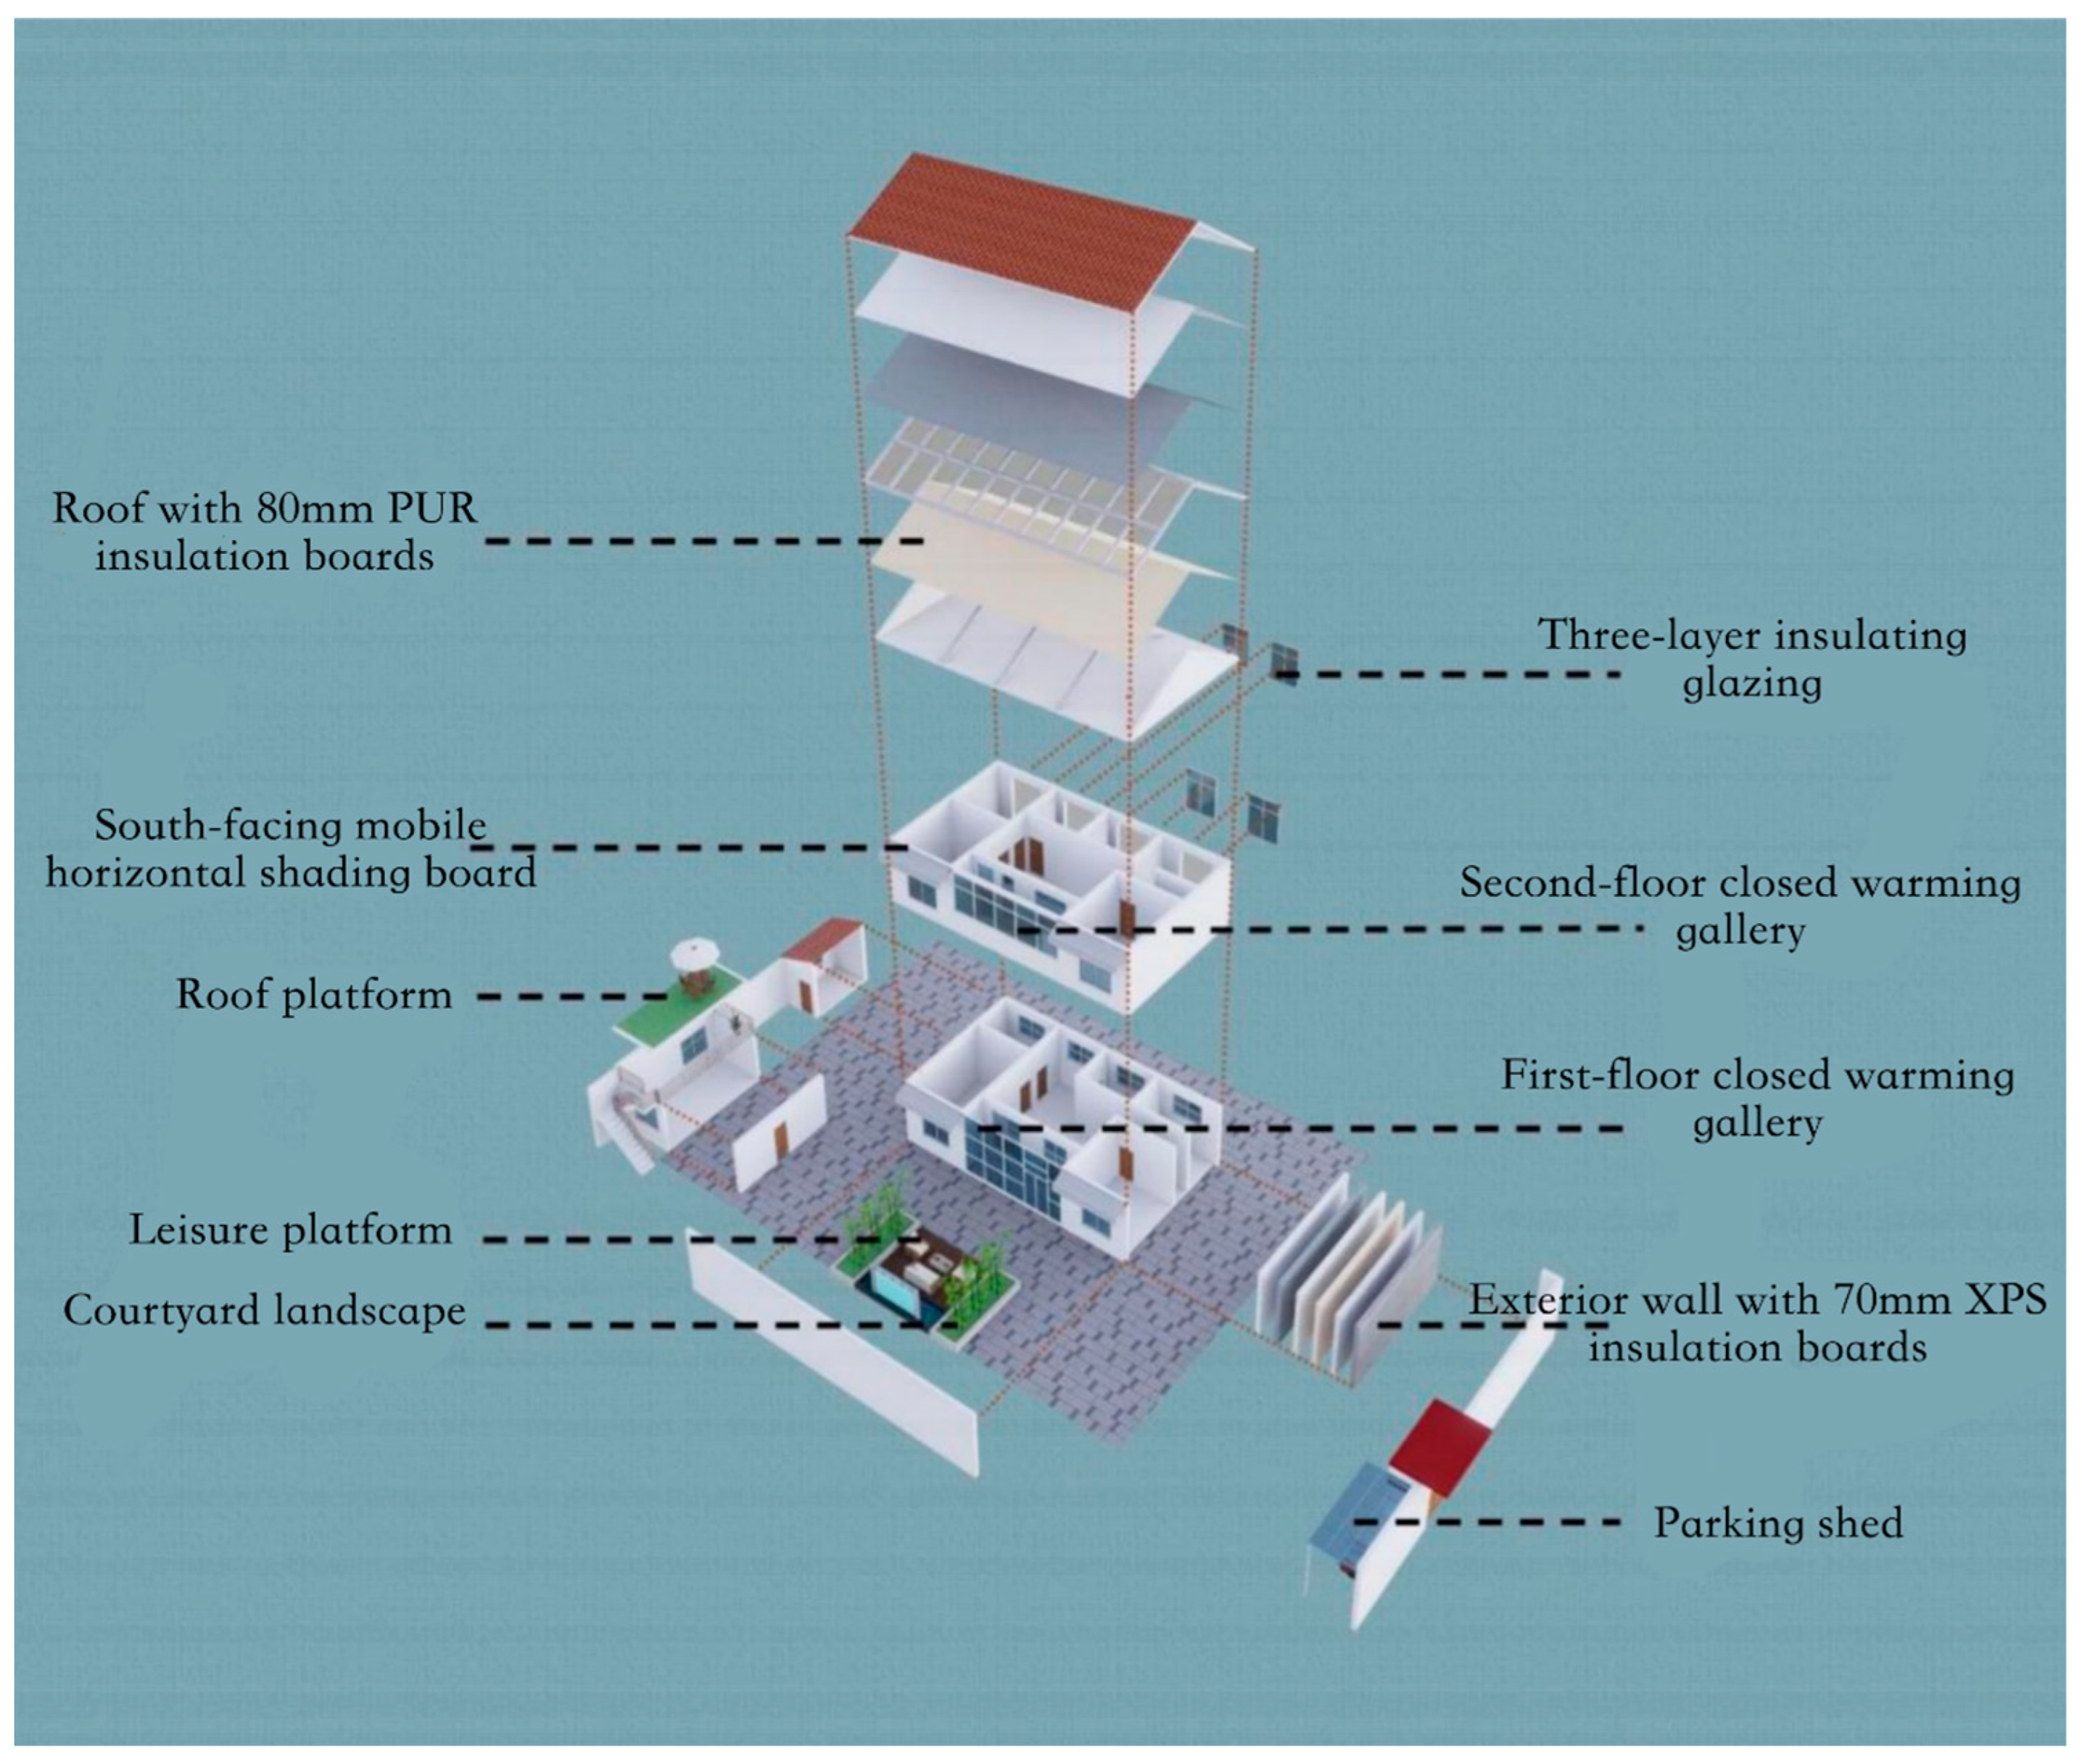
Disclaimer/Publisher’s Note: The statements, opinions and data contained in all publications are solely those of the individual author(s) and contributor(s) and not of MDPI and/or the editor(s). MDPI and/or the editor(s) disclaim responsibility for any injury to people or property resulting from any ideas, methods, instructions or products referred to in the content. |
© 2025 by the authors. Licensee MDPI, Basel, Switzerland. This article is an open access article distributed under the terms and conditions of the Creative Commons Attribution (CC BY) license (https://creativecommons.org/licenses/by/4.0/).