
Transformation of Rural Low-Carbon Houses Under the Guidance of Thermal Comfort: A Case Study of the Xuzhou Area


Abstract
:1. Introduction
2. Research Object and Methods
2.1. Research Object
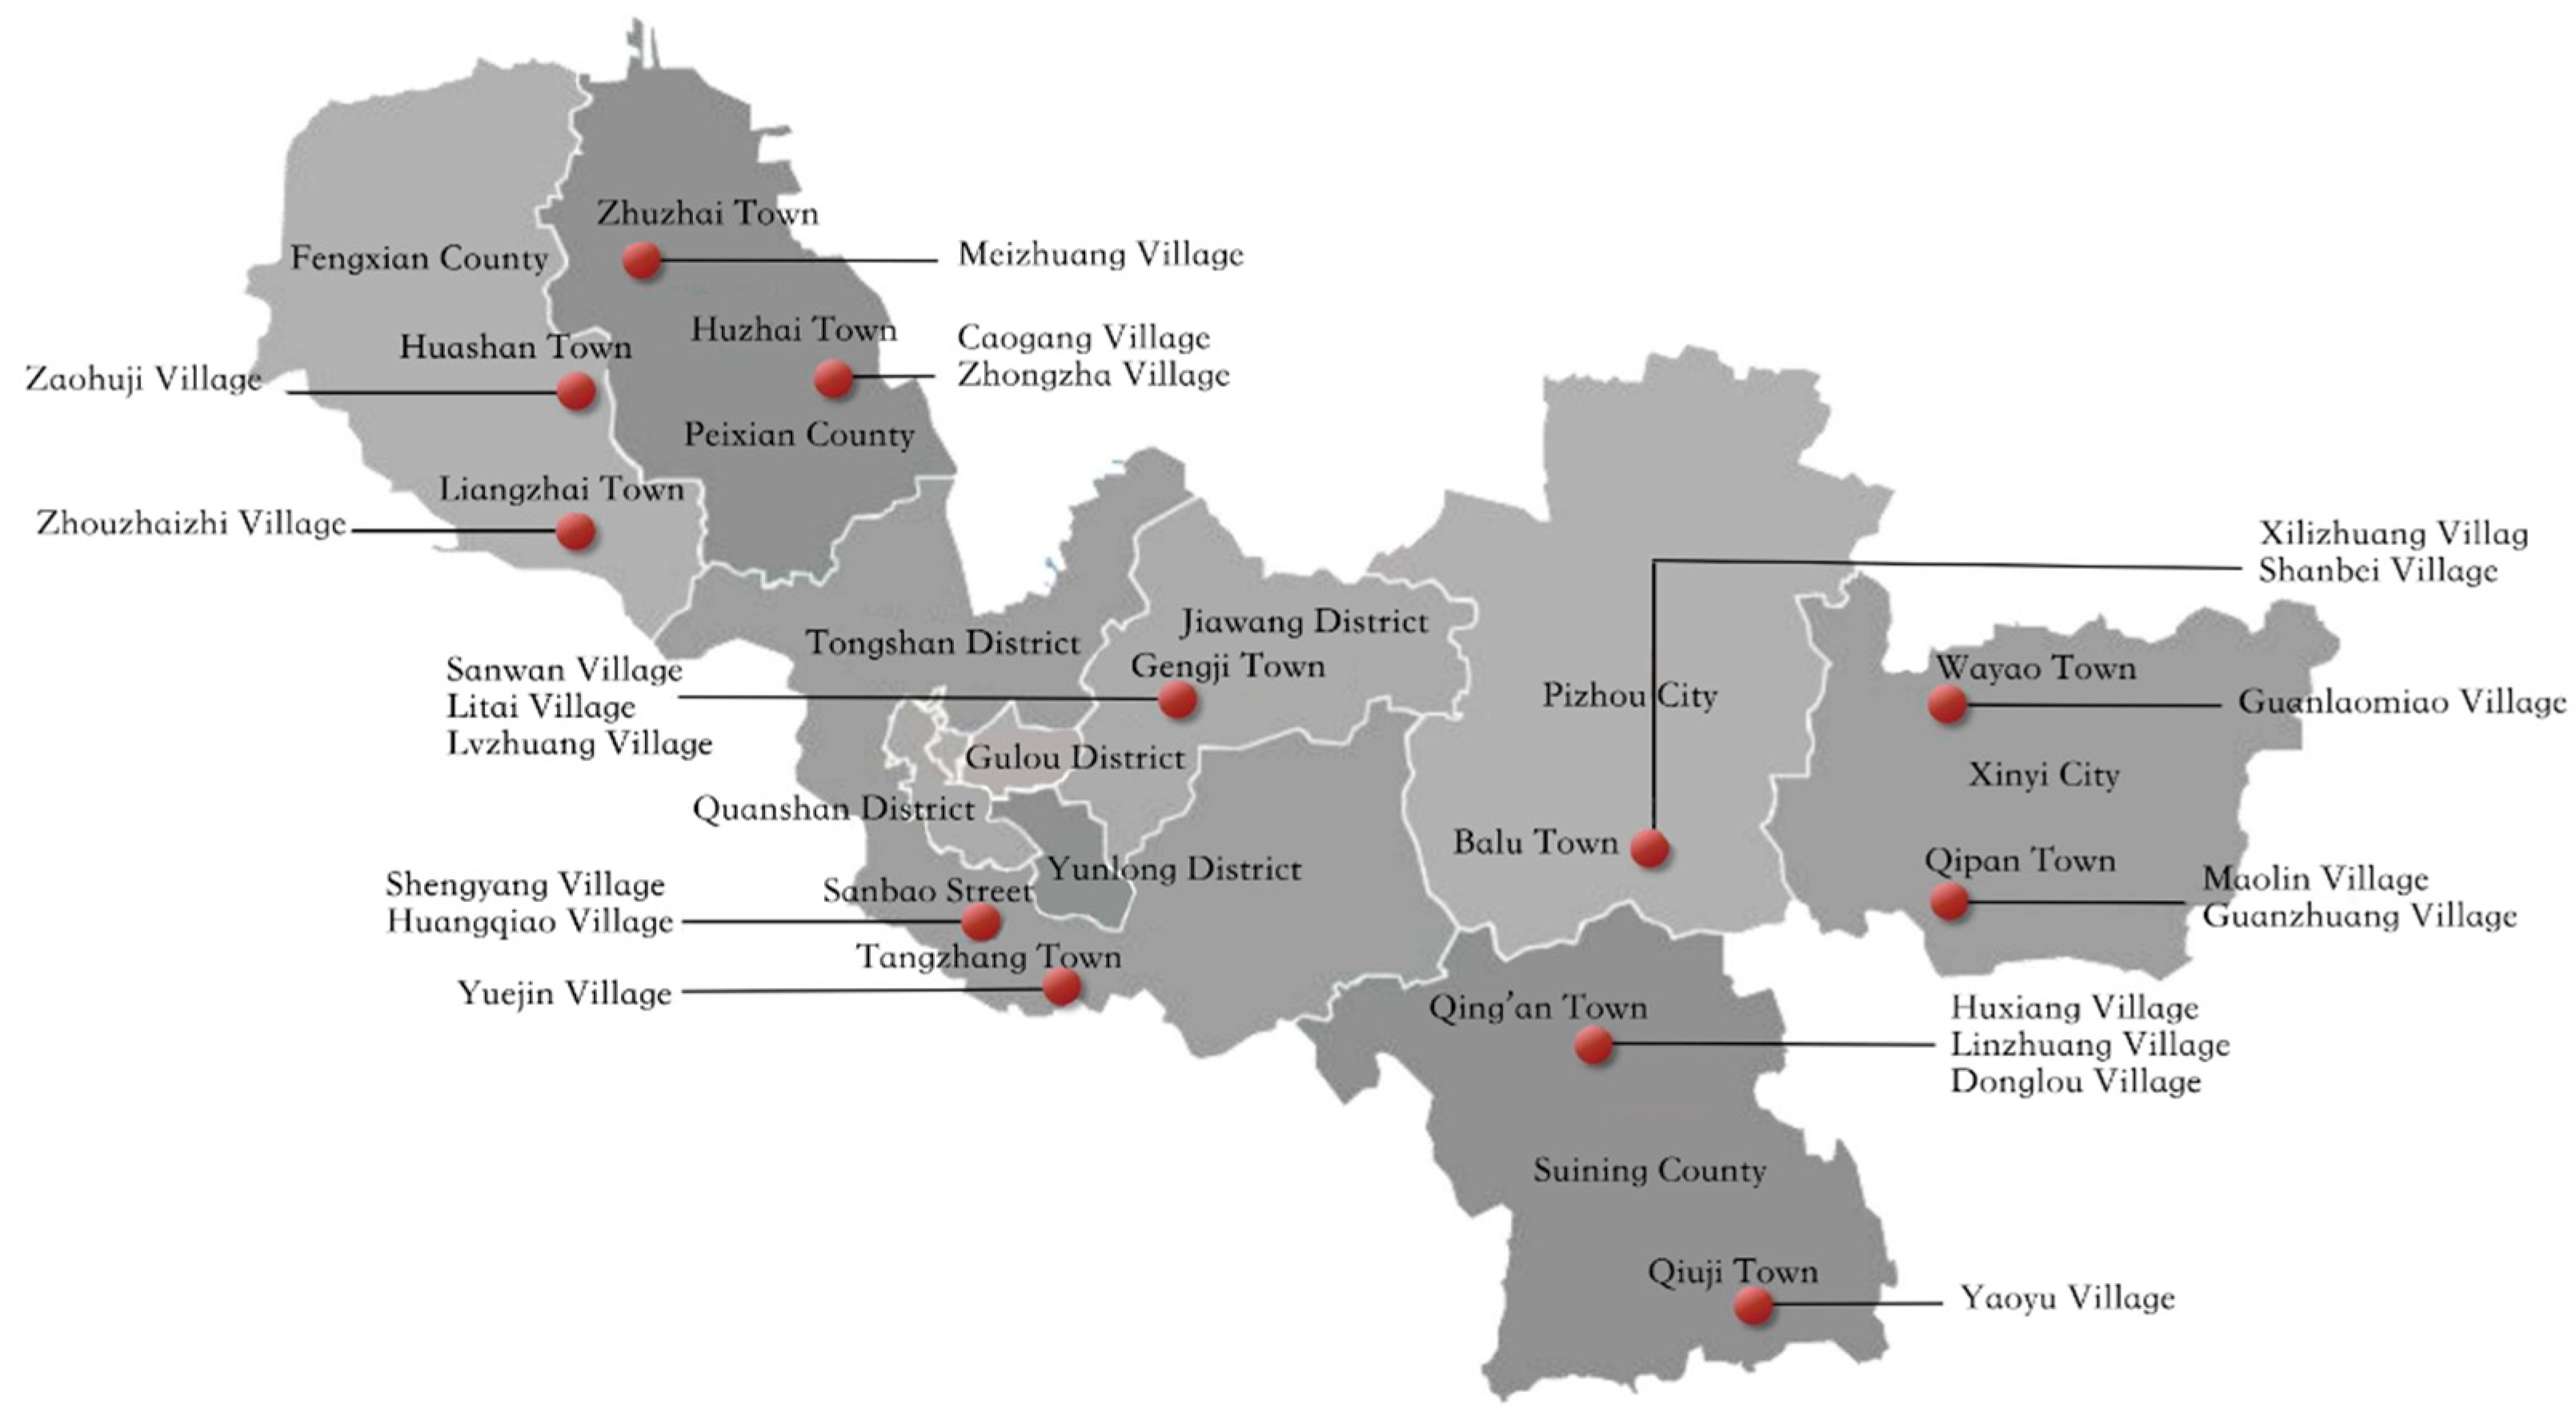
2.1.1. Geographical Location and Climate Characteristics
2.1.2. Selection of a Typical Case
2.2. Research Methods
2.2.1. Field Measurement and Questionnaire Survey
2.2.2. Software Simulation Method
2.2.3. Orthogonal Test Method
3. Study on the Indoor Thermal Comfort of a Typical Rural House
3.1. Evaluation Indicators of Thermal Comfort
- (1)
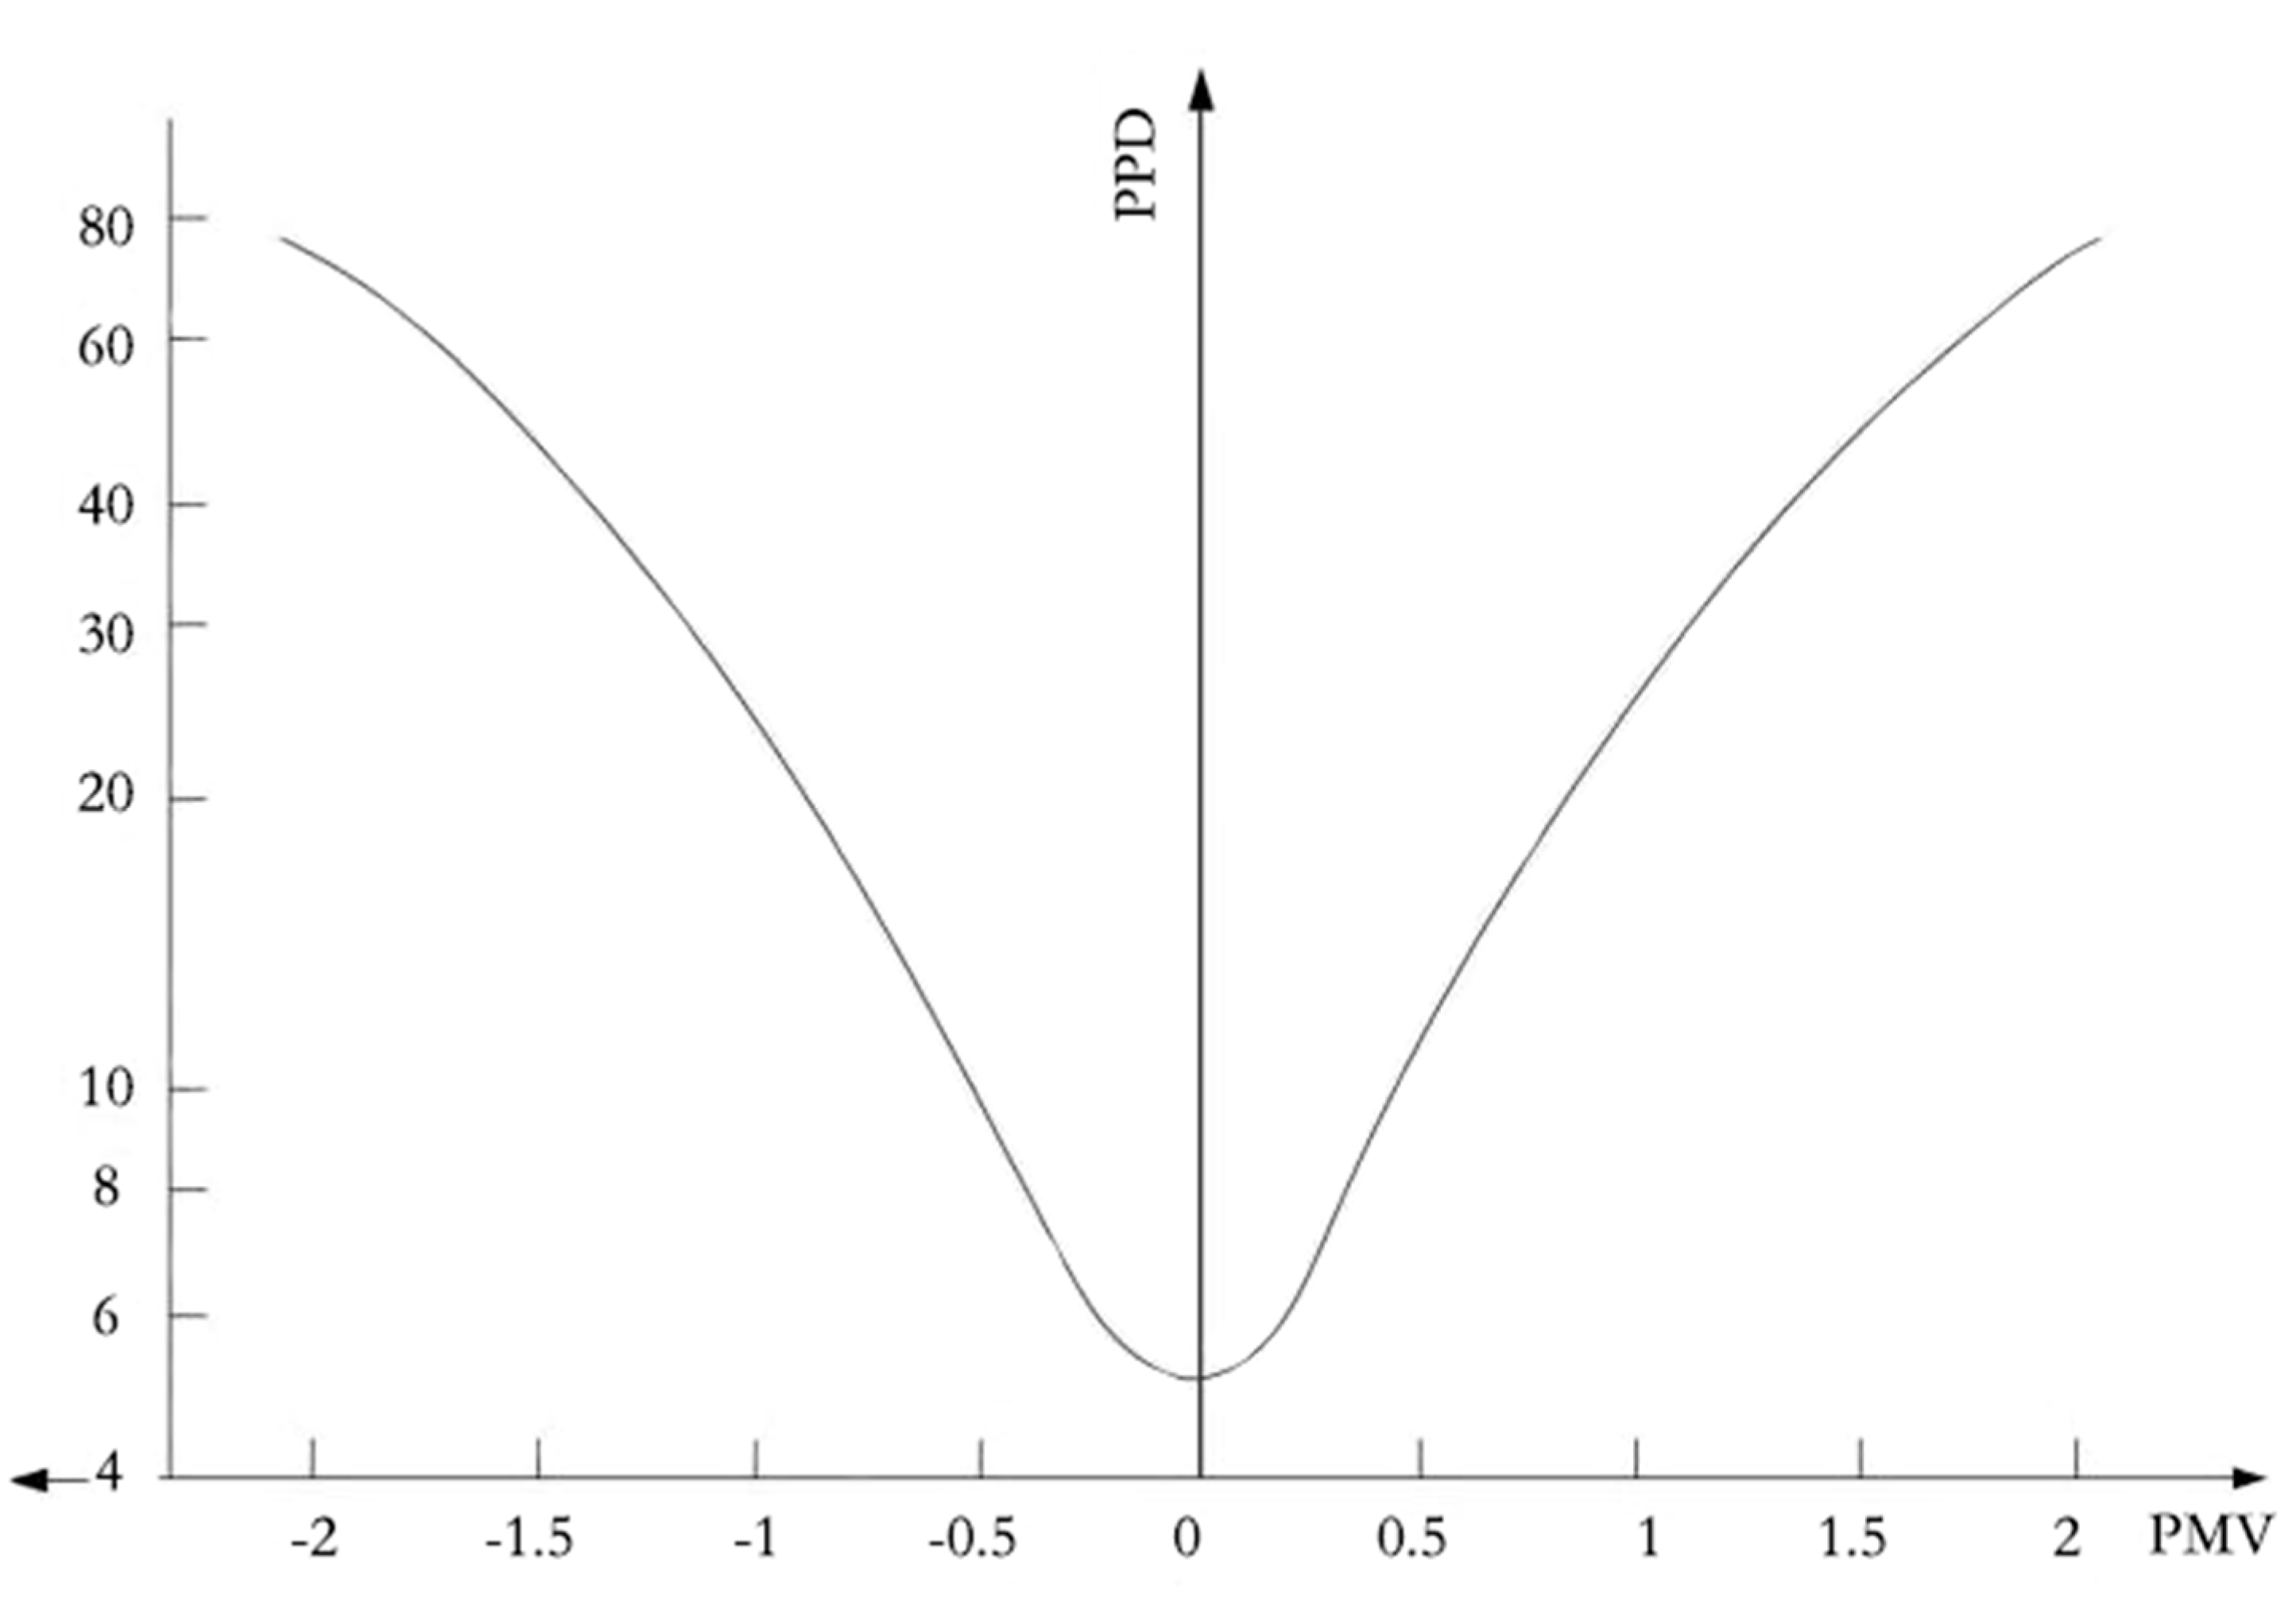
- PMV-PPD index
- (2)
- Operating temperature TOP
- (3)
- Mean thermal sensation (MTS)
3.2. Questionnaire Data
3.3. Analysis of Survey Results of Thermal Comfort
3.3.1. Summer Thermal Comfort
- (1)
- Statistics of measured data
- (2)
- Analysis of subjective votes of summer thermal comfort
3.3.2. Winter Thermal Comfort
- (1)
- Statistics of measured data
- (2)
- Analysis of subjective votes of winter thermal comfort
3.4. Analysis of Adaptive Thermal Comfort of Residents Living in Rural Houses
- (1)
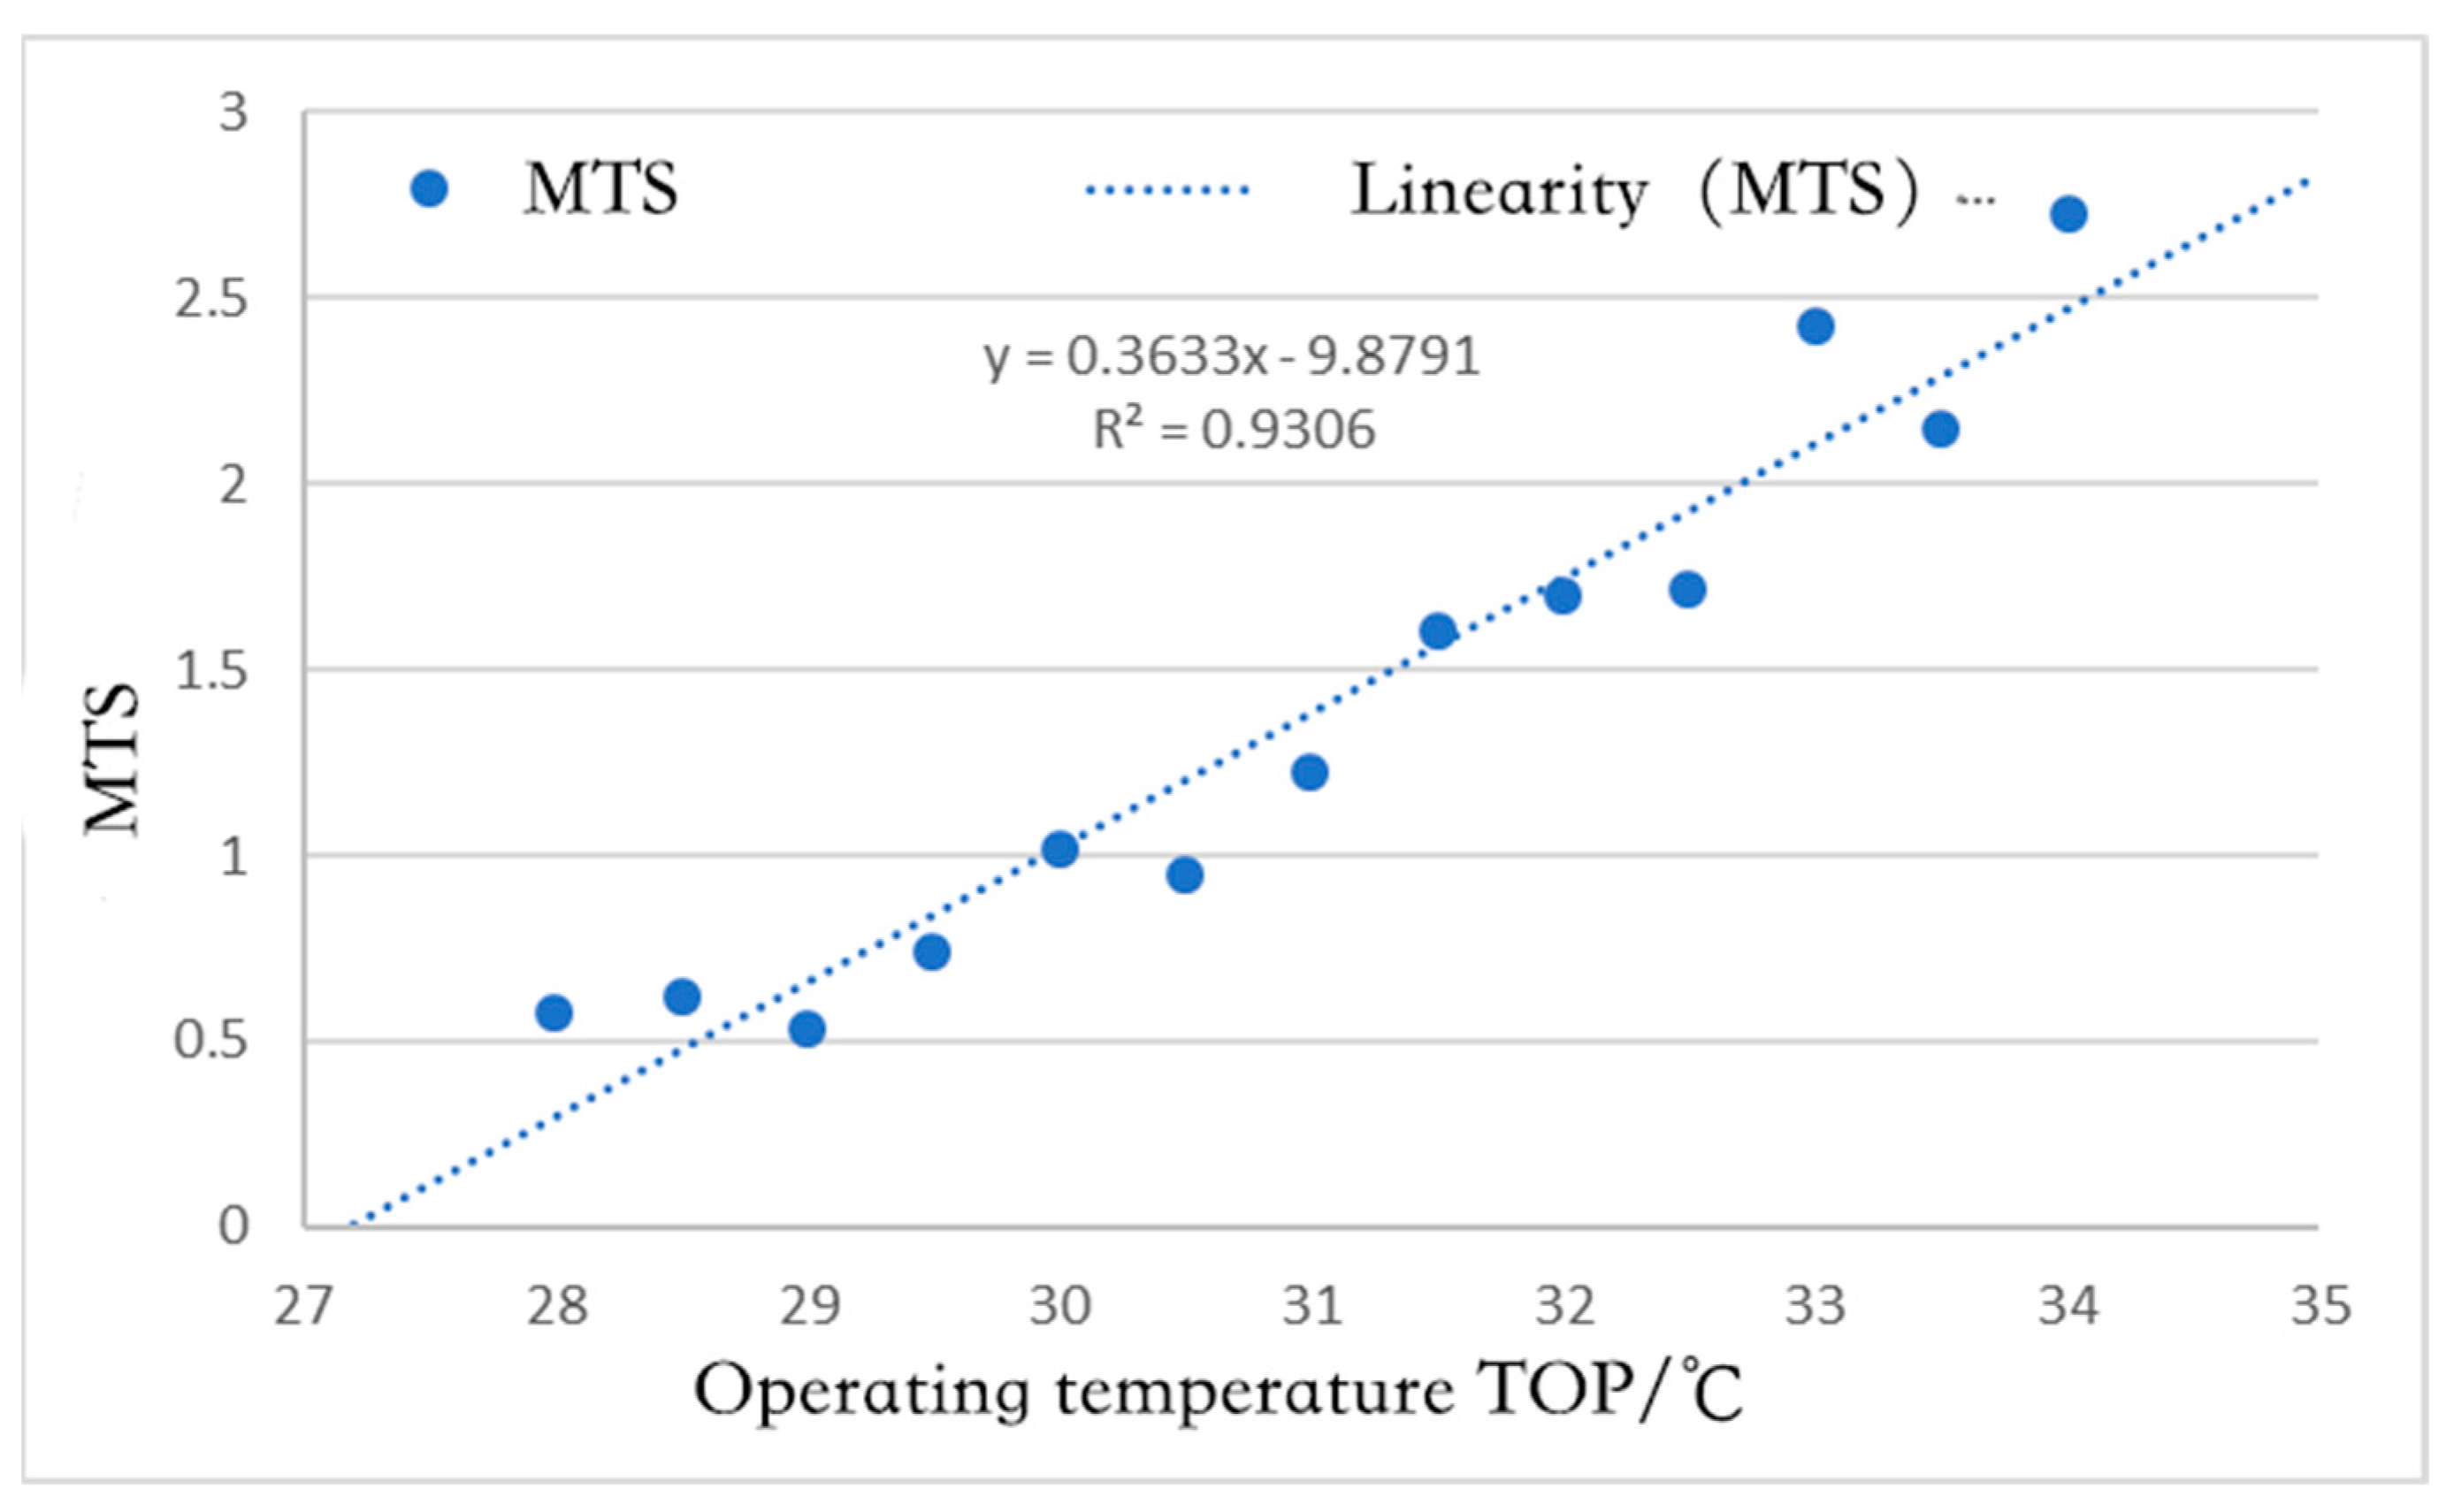
- Establishment of the MTS-TOP model
- (2)
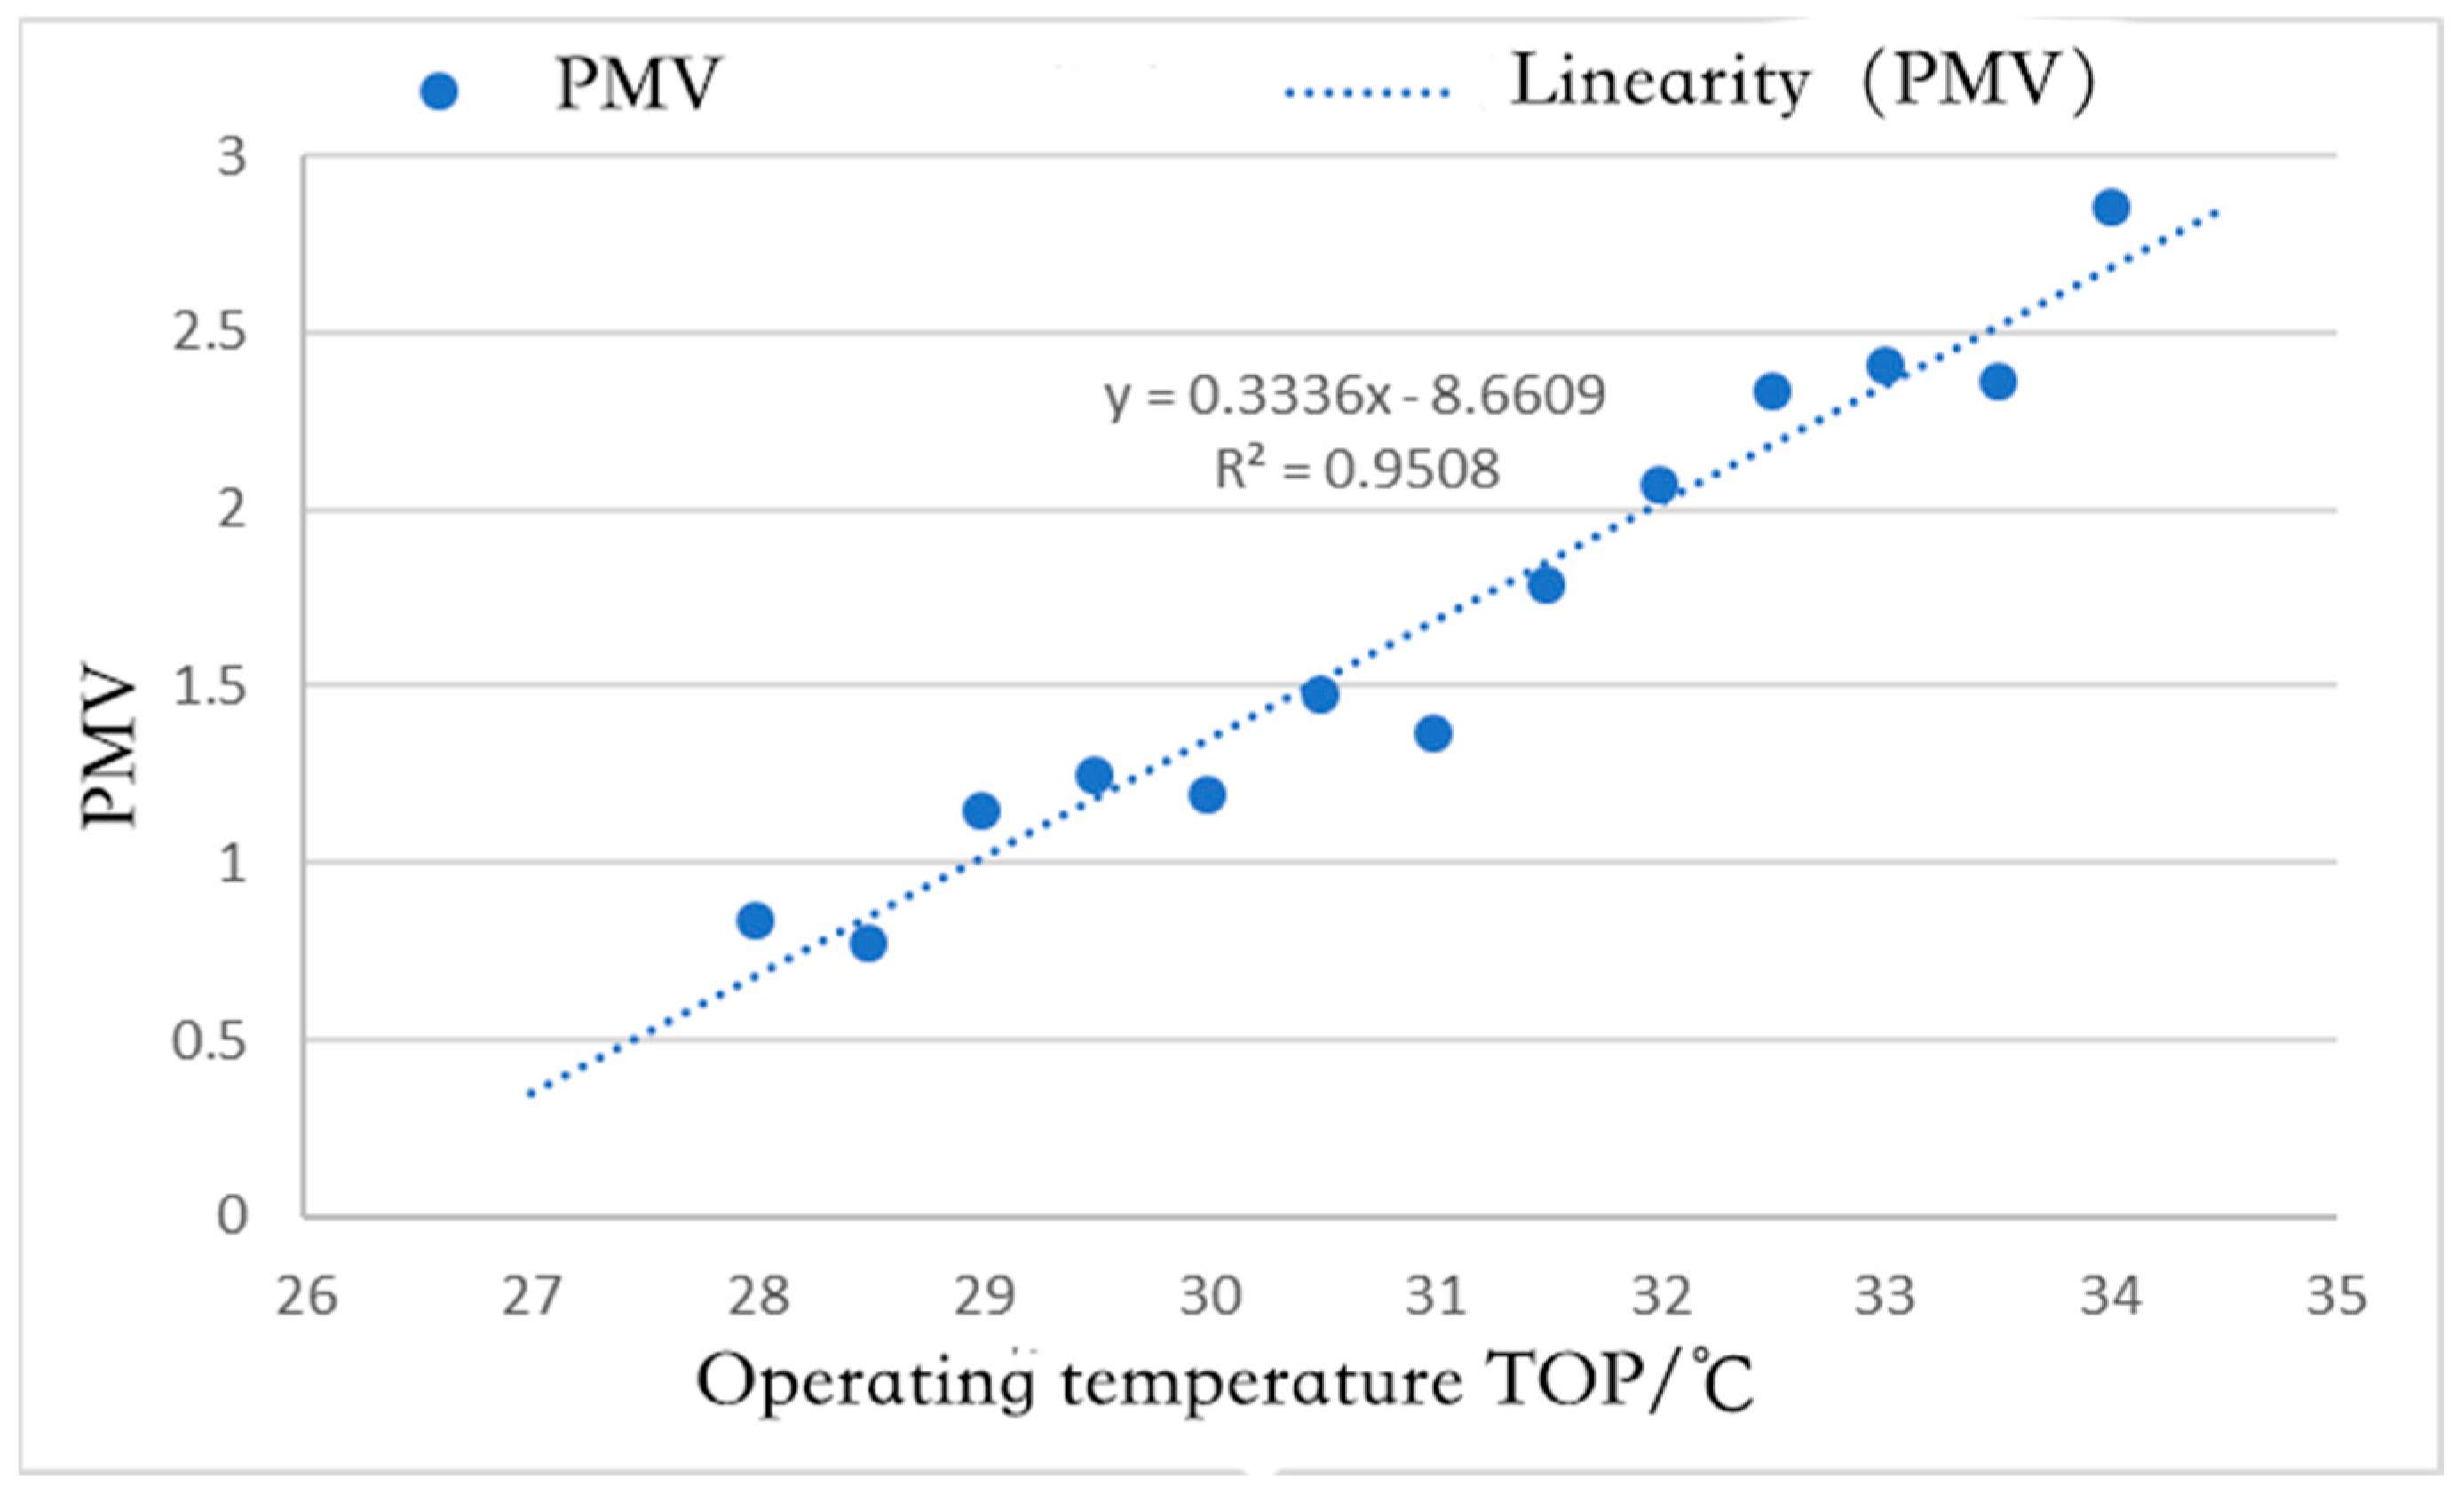
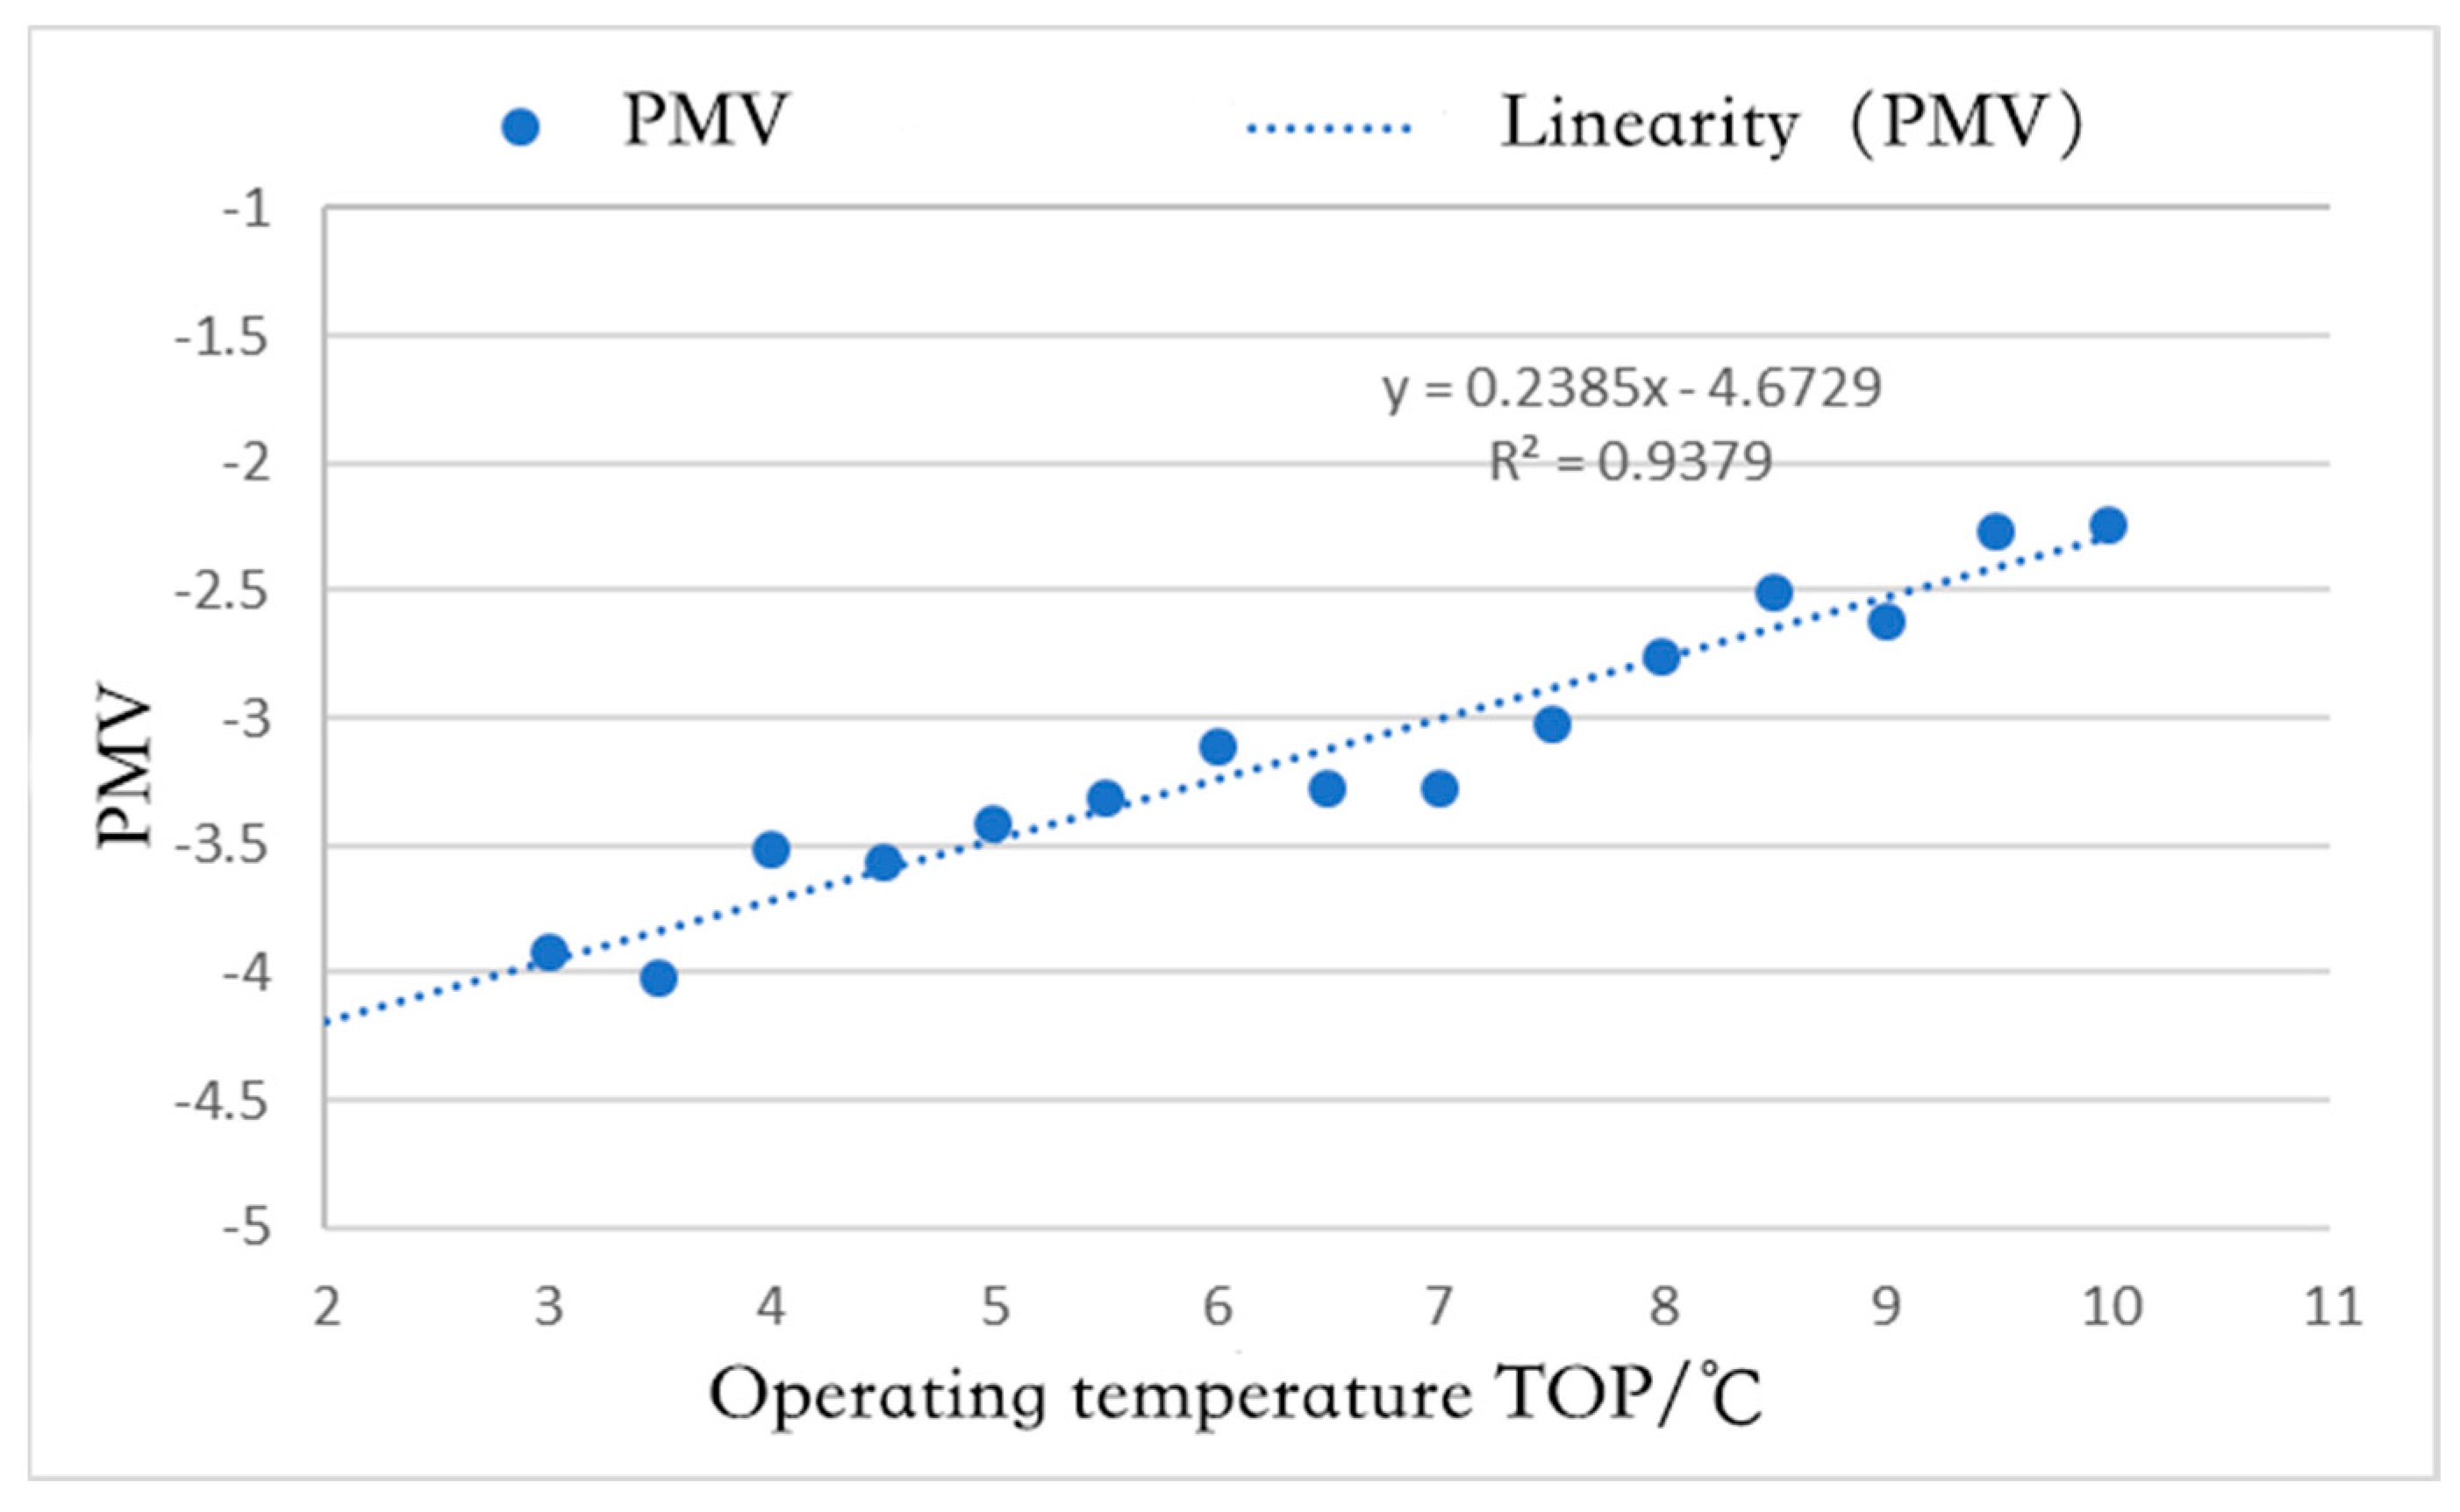
- Establishment of PMV-TOP model
- (3)
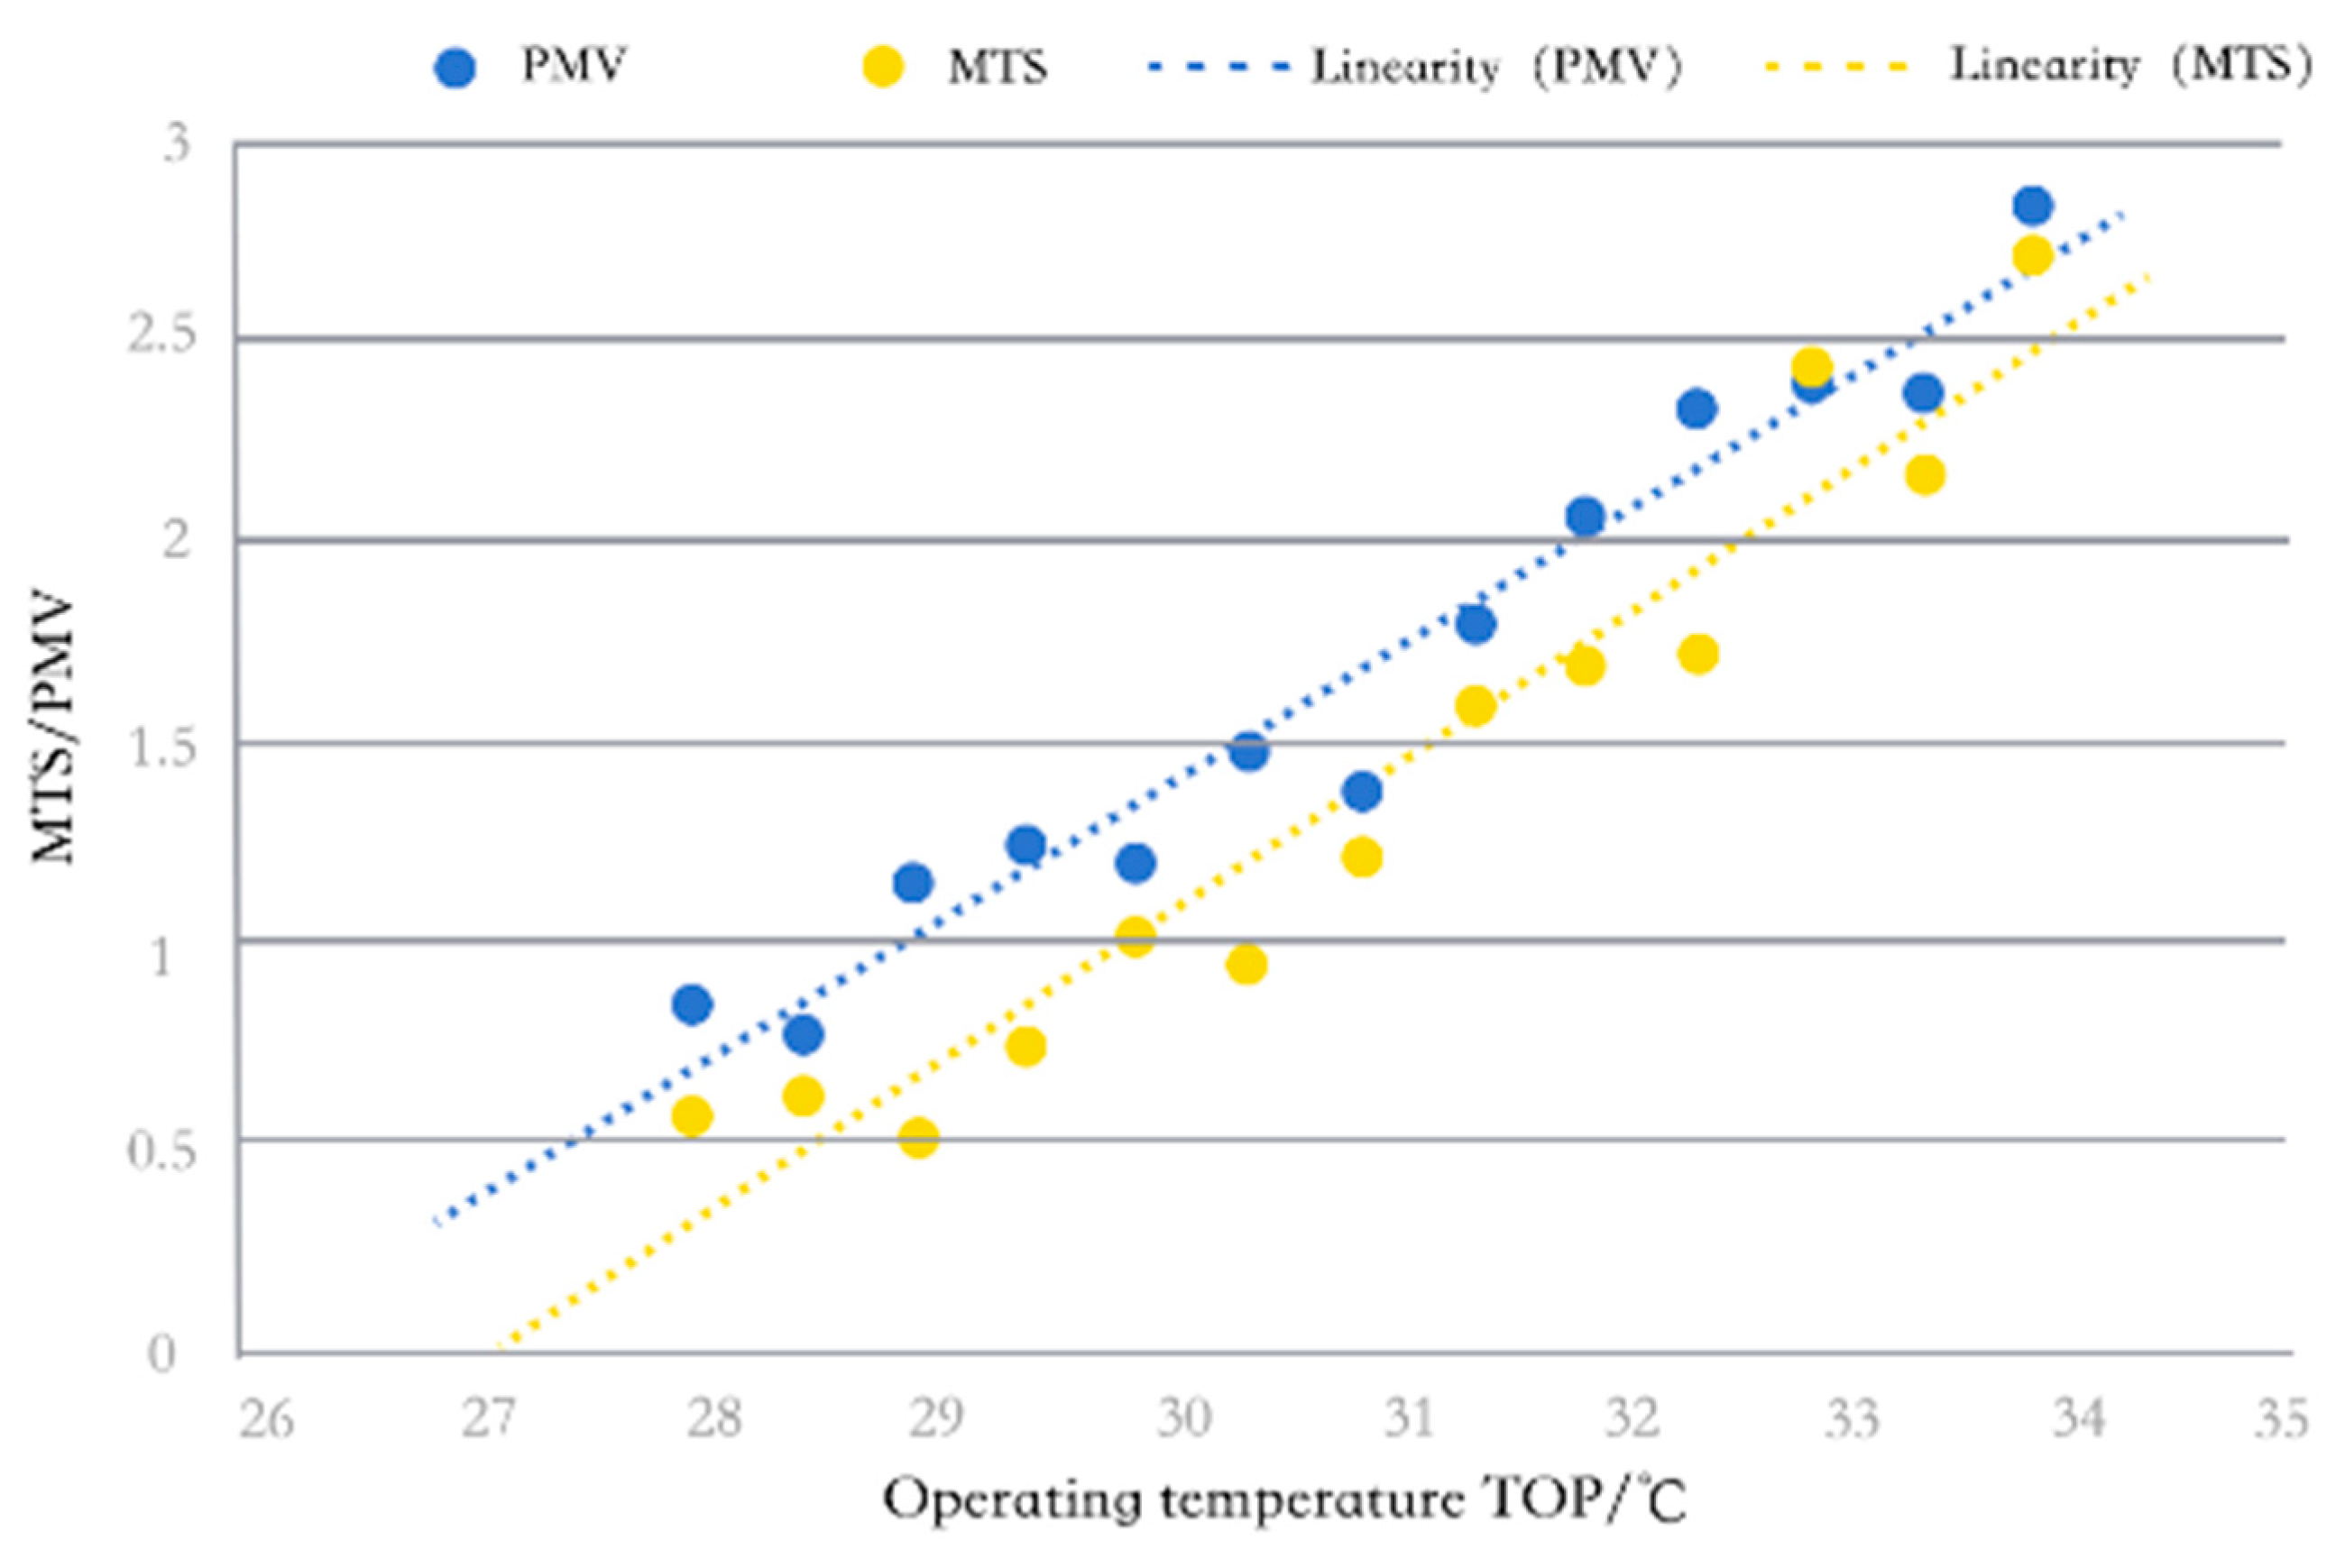
- Comparison between the MTS-TOP and PMV-TOP models
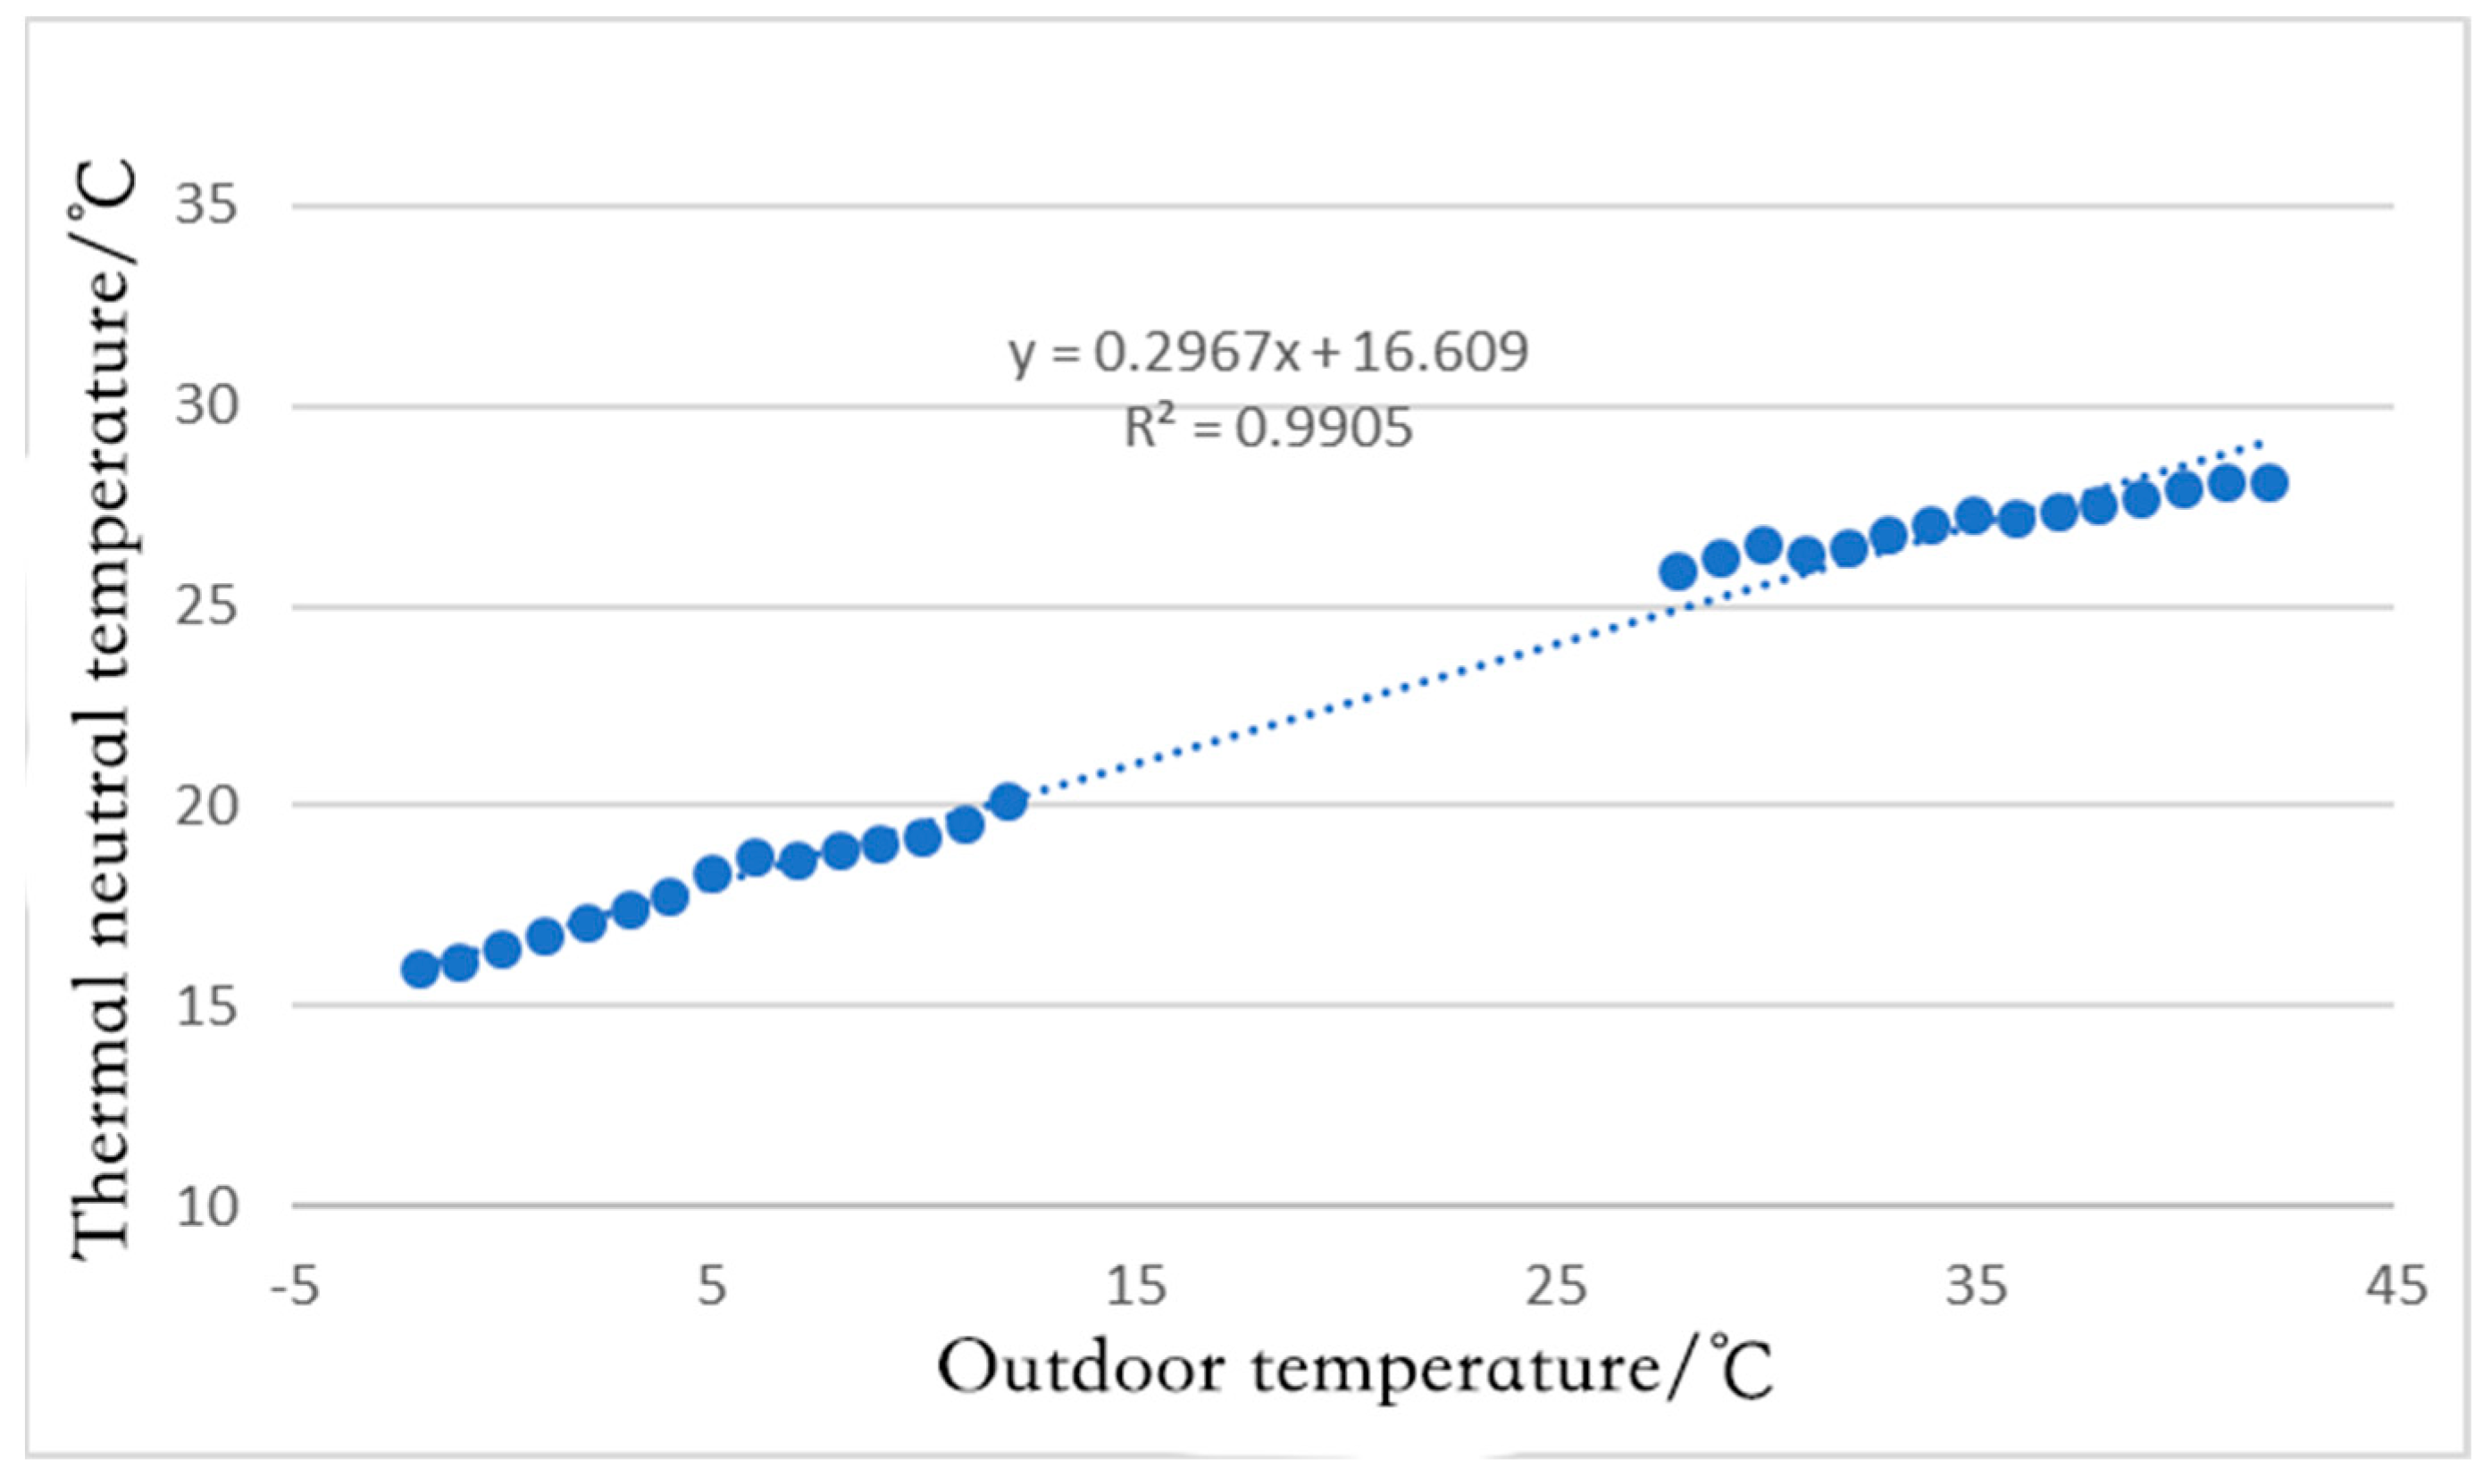
3.5. Indoor Adaptive Thermal Comfort Model of Rural Houses
4. Analysis of Single-Factor Simulation of Thermal Comfort and Energy Conservation with the Baseline Model
4.1. Establishment and Parameter Setting of the Baseline Model
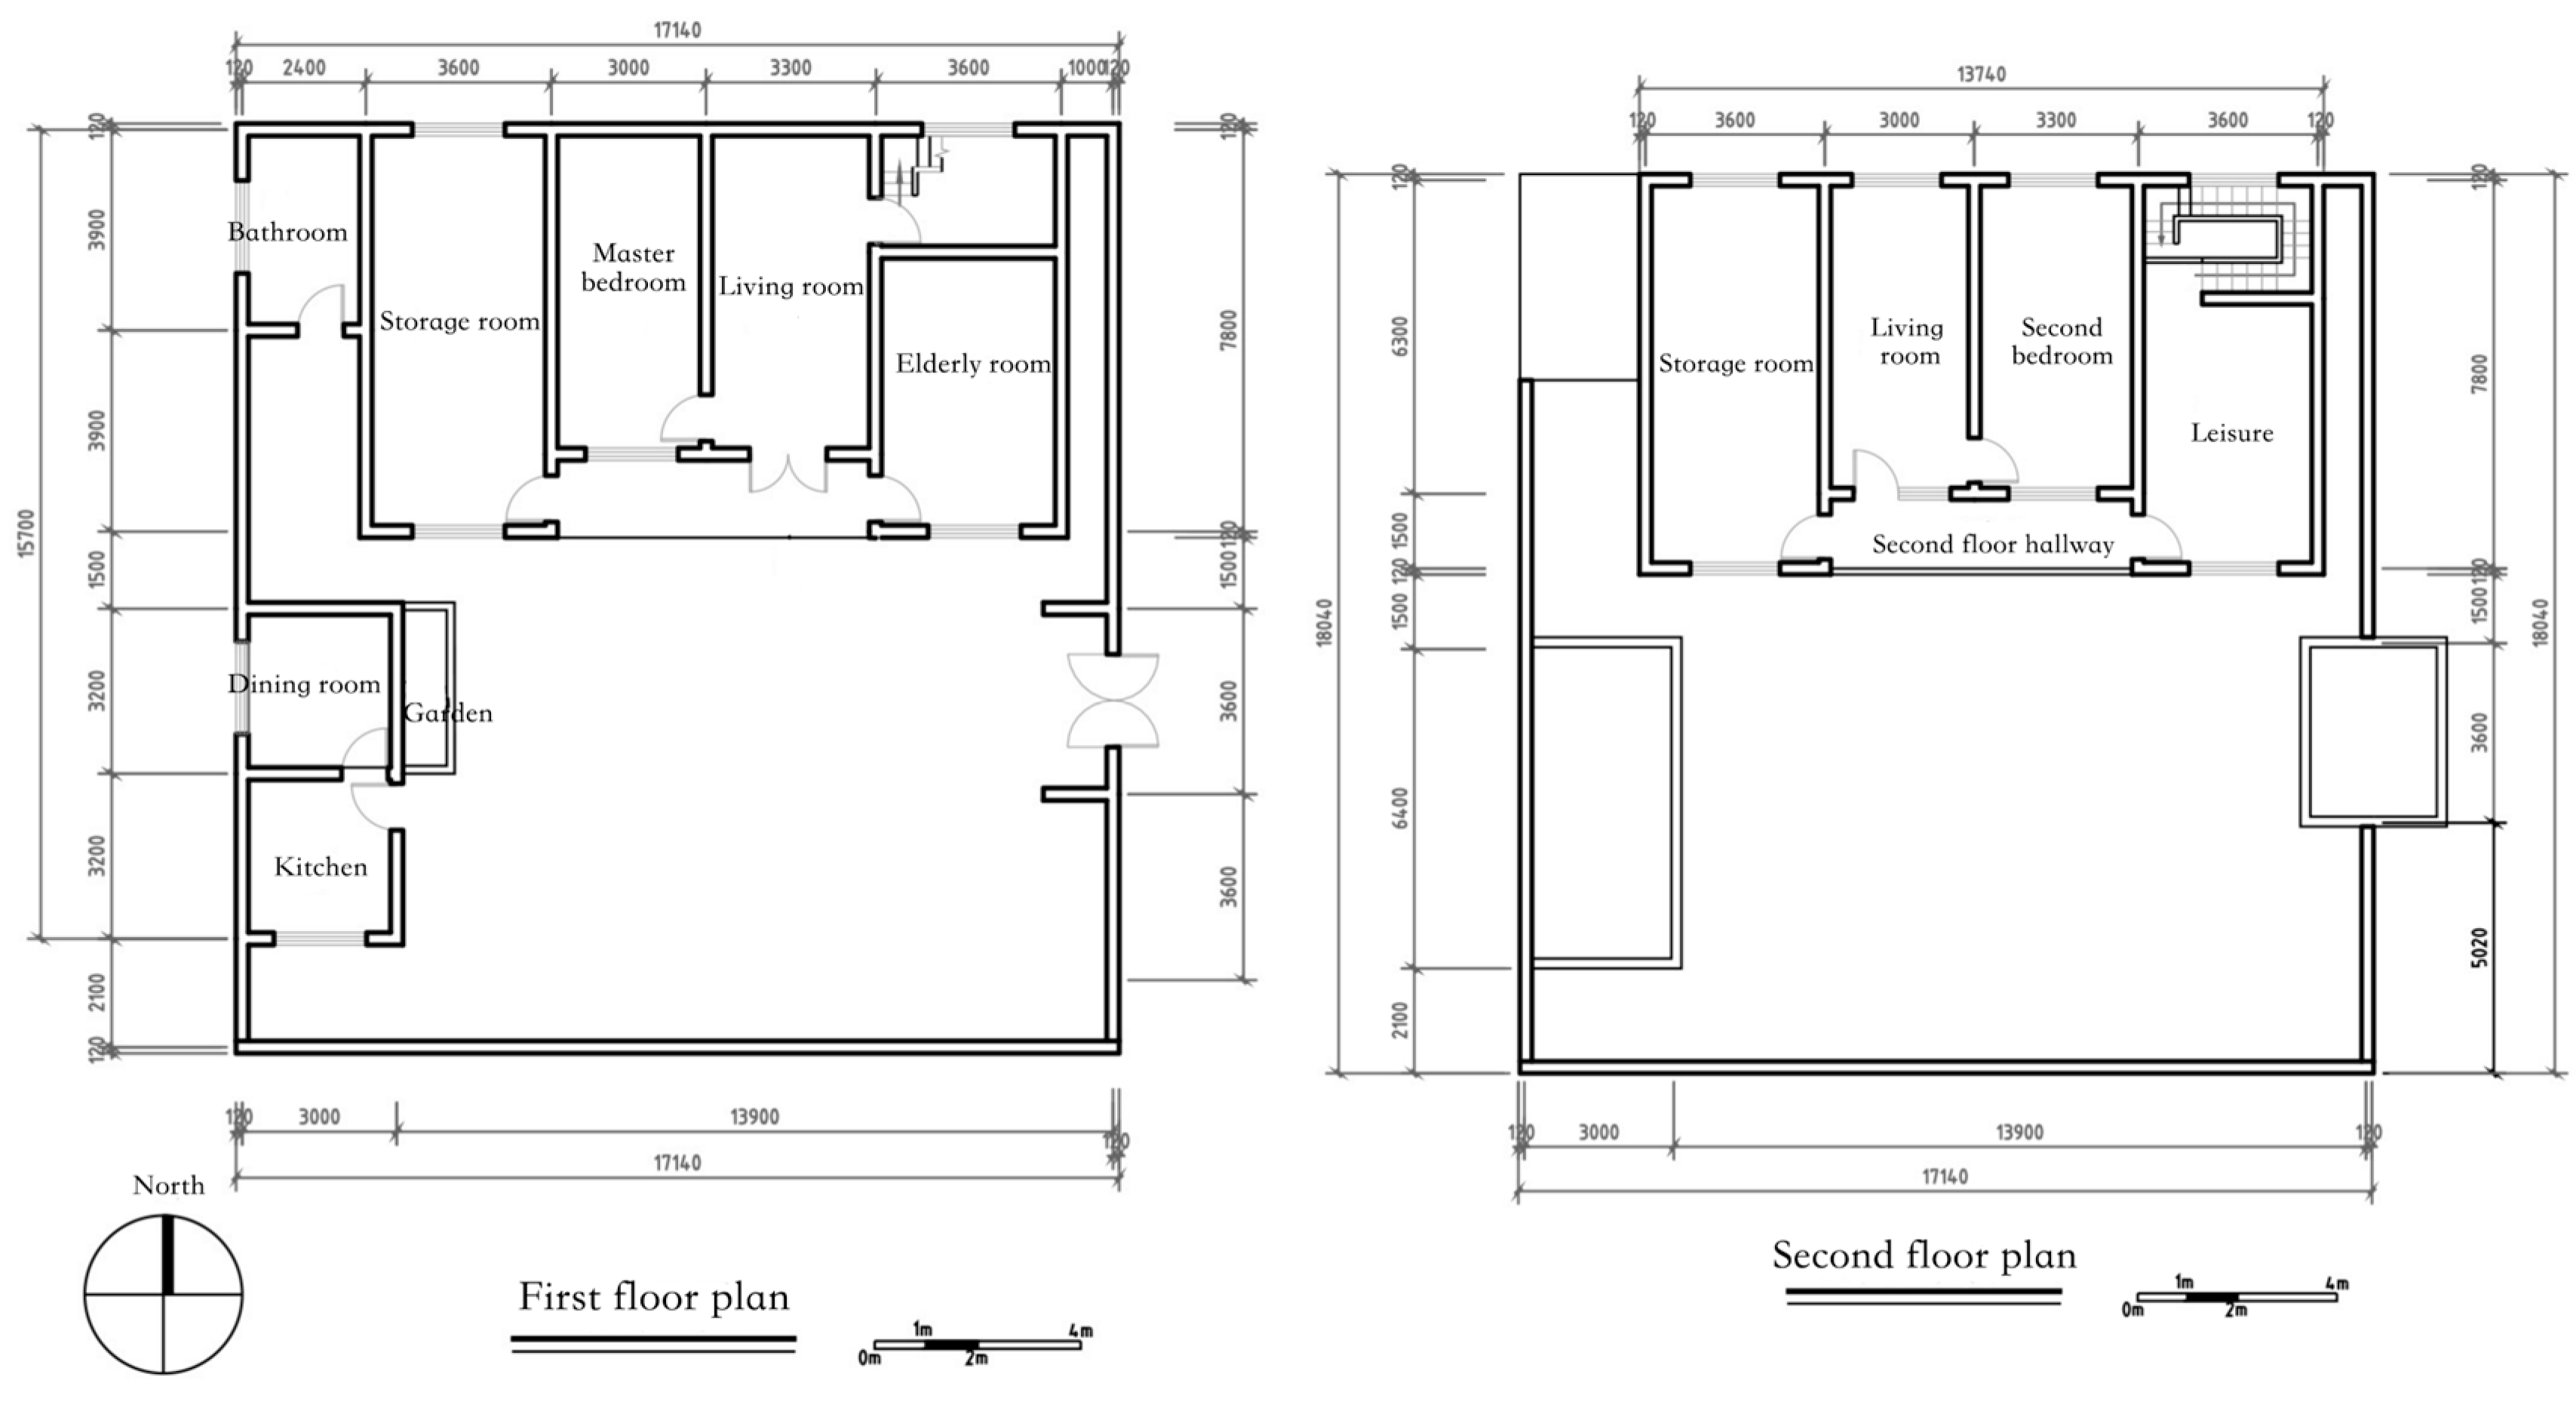
4.1.1. Establishment of the Baseline Model
4.1.2. Setting of Simulation Parameters
- (1)
- Setting of external interference parameters
- (2)
- Setting of internal interference parameters
4.2. Simulation Evaluation Indicators
4.2.1. Evaluation of Indoor Thermal Comfort
4.2.2. Evaluation of Energy Conservation
4.3. Single-Factor Simulation Analysis of the Baseline Model
4.3.1. Transformation of the Exterior Walls
4.3.2. Transformation of the Roofs
4.3.3. Transformation of the Exterior Windows
4.3.4. Transformation of Window-to-Wall Ratio
4.3.5. Shading Transformation
4.3.6. Transformation of Closed Warming Galleries
5. Transformation of the Baseline Model for Energy Conservation Under the Guidance of Thermal Comfort
5.1. Analysis of Multi-Factor Transformation Strategies Based on an Orthogonal Test
5.1.1. Design of Orthogonal Test Scheme
- (1)
- Determination of influencing factors and their levels
- (2)
- Orthogonal table selection
- (3)
- Listing the test plan
5.1.2. Analysis of Orthogonal Test Results
- (1)
- Combination of intuitive optimal transformation strategies
- (2)
- Combination of theoretical optimal transformation strategies
- (3)
- Optimal combination of transformation strategies
5.2. Transformation Strategies of the Baseline Model and Their Application
5.2.1. Transformation Strategies
- (1)
- Transformation of the building envelope
- (2)
- Window-to-wall ratio
- (3)
- South-facing mobile horizontal shading boards
- (4)
- Closed warming galleries
- (5)
- Optimization of spatial layout
- (6)
- Building a platform on the roof of the wing room
- (7)
- Courtyard optimization
5.2.2. Transformation Practice and Simulation Analysis
6. Discussion
- Significant energy-saving potential and urgent renovation needs: This study reveals the considerable energy-saving potential of rural homes in Xuzhou under current climatic conditions. By systematically optimizing the building envelope, window-to-wall ratio, shading systems, and spatial and functional layouts, energy consumption can be significantly reduced while improving living comfort. The findings underscore the urgent need for energy-saving renovations to align with carbon neutrality goals and achieve a sustainable development path. Luo Yu [38] focused on typical rural homes in Xuzhou, exploring energy consumption factors through field surveys, software simulations, and orthogonal experiments. His research proposed near-zero-energy-consumption renovation strategies, which were successfully implemented in selected rural homes in the area, enabling them to meet near-zero energy targets. This laid a foundation for theoretical and case studies in near-zero energy research for Xuzhou’s rural homes. Compared to his research, this study further emphasizes energy-saving renovation strategies driven by thermal comfort, focusing not only on the need to reduce energy consumption but also on the human-centered demand for thermal comfort in renovations.
- Effectiveness of comprehensive renovation strategies: This study proposes the optimal renovation strategies for existing rural homes in Xuzhou, which have been proven effective in maximizing the reduction in annual energy consumption while improving indoor thermal comfort. Based on the research-derived strategies, practical renovations were carried out, comparing the indoor thermal comfort and total annual energy consumption before and after renovation, along with estimating the renovation costs. Xie Chao [39] and colleagues, through field surveys and questionnaires combined with optimization methods such as genetic algorithms, developed an energy consumption simulation system with carbon emissions, cost, and thermal comfort as optimization goals. Their research identified the optimal renovation solutions for Xuzhou’s rural homes, resulting in reduced energy consumption, lower renovation costs, and improved indoor thermal environments. This study not only provides a reference for energy-efficient building design in Xuzhou but also offers scientific evidence for other rural areas with similar climatic conditions and economic development levels. Compared to their study, this research lacks an in-depth discussion of renovation costs, but there is a high degree of consistency in the formulation of renovation strategies. The research methods also provide valuable insights and guidance for further refining this study.
- Limitations of the study’s scope
- 2.
- Missing and inaccurate data
- 3.
- Insufficient theoretical framework
- 4.
- Inadequate policy support
- Expanding the research scope
- 2.
- Enhancing data collection and monitoring
- 3.
- Multidisciplinary integrated research
- 4.
- Policy and incentive mechanism research
7. Conclusions
- In this study, the mean thermal sensation (MTS) and predicted mean vote (PMV) models applicable to rural residents in Xuzhou in summer and winter were established by regression analysis. Through comparative analysis, we found that the MTS model can more accurately reflect the adaptability of local residents to the thermal environment. In the analysis of the MTS model, the thermal neutral temperature in summer was 27.19 °C, and 80% of people thought that the range of comfortable temperature was 24.85~29.53°C. The thermal neutral temperature in winter was 18.23 °C, and 80% of people thought that the comfortable temperature ranged from 13.89 °C to 22.56 °C. The relationship model between the thermal neutral temperature and outdoor temperature was established by linear regression analysis, and the adaptive thermal comfort model suitable for rural residents in Xuzhou was obtained as follows: Tn = 0.2967To + 16.609 (15.92 < Tn < 28.04, R2 = 0.9905).
- Through BECH and ITES in Sware, the exterior wall insulation materials and their thickness, roof insulation materials and their thickness, thermal performance of exterior window glazing, north- and south-facing window-to-wall ratios, shading strategies, and closed warming galleries were simulated and analyzed, and single-factor optimization strategies for the transformation of thermal comfort and energy conservation of existing rural houses in Xuzhou were proposed. Considering both the improvement effect and cost, XPS insulation boards with a thickness of 60~90 mm should be adopted to transform the insulation of the exterior walls. For the insulation transformation of the roofs, it is advisable to use PUR insulation boards with a thickness of 60~90 mm. The application of three-layer insulating glazing to the exterior windows can not only improve indoor thermal comfort but also achieve a significant energy conservation effect, and the cost performance is higher when air is used in the spaces between the glass layers. The south-facing window-to-wall ratio of the rural house should be designed as 0.35, and the optimal north-facing window-to-wall ratio is 0.2. Mobile horizontal outdoor shading boards should be set on the south-facing windows, with a length of 0.8 m. They should be opened in summer and closed in winter. When the eaves are closed to form warming galleries, three-layer insulating glazing should be used, and the effect is the best when the first- and second-floor eaves are closed to form warming galleries.
- Through the orthogonal test method, the simulation data of multi-factor comprehensive transformation were analyzed, and the optimal combination of transformation strategies suitable for existing rural houses in Xuzhou was summarized as follows: for the external walls, 70 mm XPS insulation boards are used; for the roofs, 80 mm PUR insulation boards are used; for the exterior windows, three-layer insulating glazing is used; the south-facing window-to-wall ratio is 0.35, and the north-facing window-to-wall ratio is 0.2; closed warming galleries are adopted on the first and second floors, with a depth of 1.5 m, and three-layer insulating glazing is used. Based on indoor thermal comfort, the importance of various influencing factors is ranked as follows: type of exterior window glass > closed warming galleries > south-facing window-to-wall ratio > thickness of XPS insulation boards of the exterior walls > thickness of PUR insulation boards of the roofs. Based on annual energy consumption, the importance of various influencing factors is ranked as follows: closed warming galleries > type of exterior window glass > thickness of XPS insulation boards of the exterior walls > thickness of PUR insulation boards of the roofs > south-facing window-to-wall ratio.
- The optimal renovation strategies were applied to the transformation of a typical rural house in Meichuang Village, Peixian County. After the transformation, the proportion of thermal comfort reaching the standard throughout the year increased to 33.24%. The indoor average temperature of the master bedroom was 6.37 °C on the winter solstice and 26.16°C on the summer solstice. The energy consumption was 5011 kWh in the heating season and 2191 kWh in the cooling season. The annual energy consumption was 7202 kWh, and the energy conservation rate was 70.07%. The estimated cost of transforming the rural house was CNY 66,810, and the annual electric bill for heating and cooling could theoretically be reduced by CNY 8430.
Author Contributions
Funding
Institutional Review Board Statement
Informed Consent Statement
Data Availability Statement
Conflicts of Interest
References
- Zhang, Y.; Yang, Y.; Ye, W.; Chen, M.; Gu, X.; Li, X.; Jiang, P.; Liu, L. Assessing and gauging the carbon emission efficiency in China in accordance with the sustainable development goals. Sci. Rep. 2024, 14, 25993. [Google Scholar] [CrossRef] [PubMed]
- Zhang, Y.; Yao, G.; Qian, Z. Research on energy-saving renovation of rural buildings with sunrooms in Zhangbei area based on orthogonal experimental simulation. Chin. Overseas Archit. 2024, 1–12. Available online: http://kns.cnki.net/kcms/detail/43.1255.tu.20240809.1145.002.html (accessed on 18 December 2024).
- Chen, Y.; Wu, G. Design practice of solar house assembly in hot summer and cold winter area. Archit. Technol. 2024, 55, 6–8. [Google Scholar]
- Zhao, Y.; Yao, G. Research on Energy-Saving Potential and Renovation Strategies for Rural Residences in Xuzhou Under the Dual Carbon Goals. Urban. Archit. 2025, 22, 137–141. [Google Scholar] [CrossRef]
- Zhang, Y. Research on the Energy-Saving Potential and Policy System of Building in China. Master’s Thesis, Beijing Institute of Technology, Beijing, China, 2015. [Google Scholar]
- Huang, H.; Cheng, F.; Su, Y.; Yao, L.; Hu, J. Analysis of Energy-Saving Potential and Countermeasures in China Under the Carbon Peak Goal. Strateg. Study CAE 2021, 23, 81–91. [Google Scholar] [CrossRef]
- Missoum, M.; Hamidat, A.; Loukarfi, L.; Abdeladim, K. Impact of rural housing energy performance improvement on the energy balance in the North-West of Algeria. Energy Build. 2014, 85, 374–388. [Google Scholar] [CrossRef]
- Alev, U.; Eskola, L.; Arumagi, E.; Jokisalo, J.; Donarelli, A.; Siren, K.; Broström, T.; Kalamees, T. Renovation alternatives to improve energy performance of historic rural houses in the Baltic Sea region. Energy Build. 2014, 77, 58–66. [Google Scholar] [CrossRef]
- Sarkar, A.; Bose, S. Exploring impact of opaque building envelope components on thermal and energy performance of houses in lower western Himalayans for optimal selection. J. Build. Eng. 2016, 7, 170–182. [Google Scholar] [CrossRef]
- Michael, A.; Demosthenous, D.; Philokyprou, M. Natural ventilation for cooling in mediterranean climate: A case study in vernacular architecture of Cyprus. Energy Build. 2017, 144, 333–345. [Google Scholar] [CrossRef]
- Hema, M.C.; Messan, A.; Lawane, A.; Van Moeseke, G. Impact of the Design of Walls Made of Compressed Earth Blocks on the Thermal Comfort of Housing in Hot Climate. Buildings 2020, 10, 157. [Google Scholar] [CrossRef]
- Chunxiao, B.; Chenglong, Z.; Linbo, B. Study on optimization strategy of indoor thermal comfort for rural housings in cold region. Archit. Cult. 2023, 7, 26–27. [Google Scholar]
- Pan, X.; Wei, S. Research on design strategies of thermal comfort of rural residential buildings in hot summer and cold winter areas. Rural. Sci. Technol. 2018, 39–41. [Google Scholar]
- Shi, C. Research on Energy-Saving Renovation of Existing Rural Houses in Nantong Based on Indoor Thermal Comfort. Master’s Thesis, China University of Mining and Technology, Xuzhou, China, 2023. [Google Scholar]
- Shao, S. Research on Energy-Saving Renovation Strategies for Rural Residences in Eastern Hebei Based on Thermal Comfort. Master’s Thesis, Hebei University of Technology, Tianjin, China, 2021. [Google Scholar]
- Liu, P.; Zhang, Q.; Zhong, K.; Wei, Y.; Wang, Q. Climate Adaptation and Indoor Comfort Improvement Strategies for Buildings in High-Cold Regions: Empirical Study from Ganzi Region, China. Sustainability 2022, 14, 576. [Google Scholar] [CrossRef]
- Setiawan, A.F.; Huang, T.L.; Tzeng, C.T.; Lai, C.M. The effects of envelope design alternatives on the energy consumption of residential houses in Indonesia. Energies 2015, 8, 2788–2802. [Google Scholar] [CrossRef]
- Harvey, L.D.D. Reducing energy use in the buildings sector: Measures, costs, and examples. Energy Effic. 2009, 2, 139–163. [Google Scholar] [CrossRef]
- Fesanghary, M.; Asadi, S.; Geem, Z.W. Design of low-emission and energy-efficient residential buildings using a multi-objective optimization algorithm. Build. Environ. 2012, 49, 245–250. [Google Scholar] [CrossRef]
- Shams Amiri, S. On the Developmenet of Multi-Linear Regression Analysis to Assess Energy Consumption in the Early Stages of Building Design. Ph. D. Thesis, Texas A&M University—Kingsville, Kingsville, TX, USA, 2014. [Google Scholar]
- Chandel, S.S.; Sarkar, A. Performance assessment of a passive solar building for thermal comfort and energy saving in a hilly terrain of India. Energy Build. 2015, 86, 873–885. [Google Scholar] [CrossRef]
- Yue, X.; Luo, H.; Gao, Y.; Wang, S. Present Situation and Energy-Saving Retrofitting Strategy of ExistingRural Residential Buildings in Tianjin: On Huifeng West Village. Build. Energy Effic. 2020, 48, 57–61. [Google Scholar]
- Zhu, S.; Wang, G. Analysis on influencing factors and indoor thermal comfort of existing rural houses energy saving renovation in Qinhuangdao area. Sichuan Build. Sci. 2022, 48, 81–89. [Google Scholar]
- Rui, J.; Zhang, H.; Shi, C.; Pan, D.; Chen, Y.; Du, C. Survey on the Indoor Thermal Environment and Passive Design of Rural Residential Houses in the HSCW Zone of China. Sustainability 2019, 11, 6471. [Google Scholar] [CrossRef]
- Li, D.; An, X.; Li, H. Energy-Saving Retrofitting of Existing Rural Residential Buildings in Hot Summer and Cold Winter Zone: Taking the rural residence of Deyang City, Sichuan Province as an Example. Build. Energy Effic. 2020, 48, 81–86. [Google Scholar]
- Zhen, M. Research on Energy Saving Design of Rural Housing in Northeast China. Ph.D. Thesis, Harbin Institute of Technology, Harbin, China, 2016. [Google Scholar]
- GB 50176-2016; Thermal Design Code for Civil Building. China Architecture & Building Press: Beijing, China, 2016.
- GB/T 50785-2012; Evaluation Standard for Indoor Thermal Environment in Civil Buildings. China Architecture & Building Press: Beijing, China, 2012.
- Xu, X. Research on Thermal Comfort of Underground Atrium of Commercial Complex. Master’s Thesis, China University of Mining and Technology, Xuzhou, China, 2020. [Google Scholar]
- Chen, C. Research on Winter Thermal Comfort of Functional Districts of a Comprehensive Shopping Mall in Hot Summer and Warm Winter Areas. Master’s Thesis, South China University of Technology, Guangzhou, China, 2016. [Google Scholar]
- Wei, R.; Xu, W. Thermal Environment; Tongji University Press: Shanghai, China, 1994. [Google Scholar]
- Jia, H. Man and Built Environment; Beijing University of Technology Press: Beijing, China, 2001. [Google Scholar]
- De Dear, R.J.; Brager, G.S. Thermal comfort in naturally ventilated buildings: Revisions to ASHRAE Standard 55. Energy Build. 2002, 34, 549–561. [Google Scholar] [CrossRef]
- Nicol, J.F.; Humphreys, M.A. Adaptive thermal comfort and sustainable thermal standards for buildings. Energy Build. 2002, 34, 563–572. [Google Scholar] [CrossRef]
- GB/T 50378-2014; Assessment Standard for Green Building. China Architecture & Building Press: Beijing, China, 2014.
- Li, H.; Zhang, R.; Feng, G.; Huang, K.; Cao, C. Comparison of air conditioning load between a designed nearly zero-energy building and a common building in cold region. Build. Energy Effic. 2015, 43, 10–12. [Google Scholar]
- GB/T 50824-2013; Design Standard for Energy Efficiency of Rural Residential Buildings. China Architecture & Building Press: Beijing, China, 2013.
- Luo, Y. Research on Near-Zero Energy Consumption Renovation Strategies for Rural Residences in Xuzhou Area. Master’s Thesis, China University of Mining and Technology, Xuzhou, China, 2022. [Google Scholar] [CrossRef]
- Xie, C.; Yao, G.; Han, C. Energy-Saving Renovation Strategies for Rural Homes in Xuzhou Based on Multi-Objective Optimization: A Comprehensive Evaluation of Carbon Emissions, Costs, and Thermal Comfort. China Overseas Archit. 2025, 1–14. Available online: http://kns.cnki.net/kcms/detail/43.1255.tu.20250113.1140.002.html (accessed on 23 January 2025).


| PMV Value | −3 | −2 | −1 | 0 | 1 | 2 | 3 |
|---|---|---|---|---|---|---|---|
| Thermal sensation | Cold | Cool | Slightly cold | Moderate | Slightly warm | Warm | Hot |
| Evaluation Element | Evaluation Scale | |||||||
|---|---|---|---|---|---|---|---|---|
| −3 | −2 | −1 | 0 | +1 | +2 | +3 | ||
| Comprehensive evaluation | Thermal comfort | Very uncomfortable | Uncomfortable | Slightly uncomfortable | Moderate | Slightly comfortable | Comfortable | Very comfortable |
| Thermal acceptance | — | Fully rejecting | Just rejecting | — | Just accepting | Fully accepting | — | |
| Environmental expectation | Temperature expectation | — | — | Decrease | Invariant | Increase | — | — |
| Humidity expectation | — | — | Decrease | Invariant | Increase | — | — | |
| Wind speed expectation | — | — | Decrease | Invariant | Increase | — | — | |
| Subjective sensation | Thermal sensation | Cold | Cool | Slightly cold | Moderate | Slightly warm | Warm | Hot |
| Wet sensation | Very humid | Humid | Slightly humid | Moderate | Slightly dry | Dry | Very dry | |
| Wind sensation | Very gentle | Gentle | Slightly gentle | Moderate | Slightly strong | Strong | Very strong | |
| Parameter | Minimum | Maximum | Average | ||
|---|---|---|---|---|---|
| Summer | Indoor | Air temperature | 27.70 °C | 33.30 °C | 30.46 °C |
| Relative humidity | 55.67% | 72.38% | 68.35% | ||
| Air velocity | 0.00 m/s | 0.56 m/s | 0.04 m/s | ||
| Black-ball temperature | 27.62 °C | 33.34 °C | 30.48 °C | ||
| Operating temperature | 27.61 °C | 33.28 °C | 30.47 °C | ||
| Outdoor | Air temperature | 27.40 °C | 41.80 °C | 32.73 °C | |
| Relative humidity | 52.18% | 93.26% | 78.64% |
| Parameter | Minimum | Maximum | Average | ||
|---|---|---|---|---|---|
| Winter | Indoor | Air temperature | 3.28 °C | 10.36 °C | 6.87 °C |
| Relative humidity | 52.58% | 80.71% | 63.42% | ||
| Air velocity | 0.02 m/s | 0.38 m/s | 0.05 m/s | ||
| Black-ball temperature | 3.29 °C | 10.32 °C | 6.85 °C | ||
| Operating temperature | 3.28 °C | 10.34 °C | 6.86 °C | ||
| Outdoor | Air temperature | −2.63 °C | 11.25 °C | 4.24 °C | |
| Relative humidity | 21.80% | 91.63% | 47.21% |
| Model | MTSsummer-TOP | PMVsummer-TOP | MTSwinter-TOP | PMVwinter-TOP |
|---|---|---|---|---|
| Average operating temperature Top | 30.47 °C | 6.86 °C | ||
| Thermal neutral temperature Tn | 27.19 °C | 25.96 °C | 18.23 °C | 19.59 °C |
| 80% acceptable thermal comfort interval | 24.85~29.53 °C | 23.41~28.51 °C | 13.89~22.56 °C | 16.03~23.16 °C |
| 90% acceptable thermal comfort interval | 25.82~28.57 °C | 24.46~27.46 °C | 15.68~20.78 °C | 17.50~21.69 °C |
| Building Envelope | Material (From Outside to Inside) | Thickness δ (mm) | Heat Conductivity Coefficient | Bulk Heat Transfer Coefficient K |
|---|---|---|---|---|
| [W/(m·K)] | [W/(m2·K)] | |||
| Pitched roof + smothered roof | Red tiles | 20 | 0.810 | 1.951 |
| Tile hanging strip | — | — | ||
| Cement mortar | 10 | 0.930 | ||
| Reinforced concrete | 100 | 1.740 | ||
| Reinforced concrete purlins | — | — | ||
| Air interlayer | — | 0.200 | ||
| Reinforced concrete floor | 100 | 1.740 | ||
| Lime cement mortar | 20 | 0.870 | ||
| Outer wall | Tile finish | 10 | 1.500 | 2.016 |
| Cement mortar | 20 | 0.930 | ||
| Solid clay brick | 240 | 0.810 | ||
| Cement mortar | 20 | 0.930 | ||
| Interior wall | Lime cement mortar | 20 | 0.870 | 2.031 |
| Solid clay brick | 240 | 0.810 | ||
| Lime cement mortar | 20 | 0.870 | ||
| Floor | Cement mortar | 20 | 0.930 | 3.992 |
| Reinforced concrete floor | 100 | 1.740 | ||
| Cement mortar | 20 | 0.930 | ||
| Exterior window | Single-glass aluminum alloy exterior window | — | — | 6.400 |
| Outer door | Wooden door | — | — | 2.500 |
| Time (h) | Occupancy Rate of the Master Bedroom (%) | Occupancy Rate of the Elderly Bedroom (%) | Occupancy Rate of the First-Floor Living Room (%) | Occupancy Rate of the Second Bedroom (%) | Occupancy Rate of the Second-Floor Living Room (%) | Occupancy Rate of the Dining Bedroom (%) |
|---|---|---|---|---|---|---|
| 1 | 100 | 100 | 0 | 100 | 0 | 0 |
| 2 | 100 | 100 | 0 | 100 | 0 | 0 |
| 3 | 100 | 100 | 0 | 100 | 0 | 0 |
| 5 | 100 | 100 | 0 | 100 | 0 | 0 |
| 6 | 100 | 50 | 50 | 100 | 0 | 50 |
| 7 | 50 | 50 | 50 | 50 | 30 | 100 |
| 8 | 50 | 0 | 100 | 50 | 30 | 50 |
| 9 | 0 | 0 | 100 | 0 | 30 | 0 |
| 10 | 0 | 0 | 100 | 0 | 0 | 0 |
| 11 | 50 | 0 | 50 | 0 | 0 | 50 |
| 12 | 50 | 0 | 0 | 0 | 30 | 100 |
| 13 | 50 | 0 | 0 | 50 | 30 | 50 |
| 14 | 0 | 0 | 0 | 0 | 30 | 50 |
| 15 | 0 | 0 | 100 | 0 | 0 | 0 |
| 17 | 0 | 0 | 100 | 0 | 0 | 0 |
| 18 | 0 | 0 | 100 | 0 | 0 | 50 |
| 19 | 50 | 0 | 50 | 0 | 30 | 100 |
| 20 | 50 | 50 | 50 | 0 | 30 | 50 |
| 21 | 100 | 50 | 30 | 50 | 30 | 0 |
| 22 | 100 | 100 | 30 | 100 | 30 | 0 |
| 23 | 100 | 100 | 30 | 100 | 30 | 0 |
| 24 | 100 | 100 | 0 | 100 | 0 | 0 |
| Time (h) | Utilization Rate (%) | Time (h) | Utilization Rate (%) |
|---|---|---|---|
| 1 | 0 | 13 | 0 |
| 2 | 0 | 14 | 0 |
| 3 | 0 | 15 | 0 |
| 5 | 50 | 17 | 0 |
| 6 | 50 | 18 | 50 |
| 7 | 0 | 19 | 100 |
| 8 | 0 | 20 | 100 |
| 9 | 0 | 21 | 100 |
| 10 | 0 | 22 | 100 |
| 11 | 0 | 23 | 50 |
| 12 | 0 | 24 | 0 |
| Month | Outdoor Monthly Average Temperature (°C) | Thermal Comfort Temperature Interval (°C) |
|---|---|---|
| 1 | −0.1 | 13.1~20.1 |
| 2 | 3.7 | 14.2~21.2 |
| 3 | 8.4 | 15.6~22.6 |
| 4 | 15.7 | 17.8~24.8 |
| 5 | 20.4 | 19.2~26.2 |
| 6 | 24.9 | 20.5~27.5 |
| 7 | 27.6 | 21.3~28.3 |
| 8 | 26.8 | 21.1~28.1 |
| 9 | 21.7 | 19.5~26.5 |
| 10 | 15.7 | 17.8~24.8 |
| 11 | 8.9 | 15.7~22.7 |
| 12 | 2.5 | 13.9~20.9 |
| Heating Demand (kWh) | Cooling Demand (kWh) | Annual Energy Consumption (kWh) | Number of Thermal Comfort Hours | Proportion of Thermal Comfort Reaching the Standard | Indoor Average Temperature on the Summer Solstice (°C) | Indoor Average Temperature on the Winter Solstice (°C) |
|---|---|---|---|---|---|---|
| 15,961 | 8101 | 24,062 | 2738 | 31.26% | 26.52 | 4.50 |
| Thermal Insulation Material | No Thermal Insulation | 30 mm Rock Wool Insulation Board | 30 mm XPS Insulation Board | 30 mm EPS Insulation Board | 30 mm PUR Insulation Board |
|---|---|---|---|---|---|
| Thermal conductivity coefficient λ (W/m·K) | — | 0.045 | 0.030 | 0.041 | 0.024 |
| Heat storage coefficient K (W/m2·K) | — | 0.750 | 0.540 | 0.360 | 0.290 |
| Thermal resistance of the main body R ((m2·K)/W) | 0.347 | 0.878 | 1.365 | 0.975 | 1.615 |
| Thermal inertness indicator of the main body D | 3.753 | 4.487 | 4.527 | 4.251 | 4.350 |
| Heat transfer coefficient of the main body K (W/m2·K) | 2.014 | 0.973 | 0.660 | 0.889 | 0.567 |
| Thermal Insulation Material | Heating Demand (kWh) | Cooling Demand (kWh) | Annual Energy Consumption (kWh) | Energy Conservation Rate | Proportion of Thermal Comfort Reaching the Standard | Indoor Average Temperature on the Winter Solstice (°C) | Indoor Average Temperature on the Summer Solstice (°C) |
|---|---|---|---|---|---|---|---|
| No thermal insulation | 15,961 | 8101 | 24,062 | — | 31.26% | 4.5 | 26.52 |
| Rock wool insulation board | 12,999 | 6812 | 19,811 | 17.67% | 31.54% | 4.85 | 26.40 |
| EPS insulation board | 12,594 | 6649 | 19,243 | 20.03% | 31.55% | 4.92 | 26.42 |
| XPS insulation board | 12,462 | 6597 | 19,059 | 20.79% | 31.57% | 5.18 | 26.39 |
| PUR insulation board | 12,308 | 6536 | 18,844 | 21.69% | 31.58% | 5.48 | 26.38 |
| Thickness δ (mm) | 0 | 30 | 60 | 90 | 120 | 150 |
|---|---|---|---|---|---|---|
| Thermal conductivity coefficient λ (W/m·K) | — | 0.030 | 0.030 | 0.030 | 0.030 | 0.030 |
| Heat storage coefficient K (W/m2·K) | — | 0.540 | 0.540 | 0.540 | 0.540 | 0.540 |
| Thermal resistance of the main body R (m2·K)/W | 0.345 | 1.365 | 2.365 | 3.365 | 4.365 | 5.365 |
| Thermal inertness indicator of the main body D | 3.639 | 4.527 | 5.067 | 5.607 | 6.147 | 6.687 |
| Heat transfer coefficient of the main body K (W/m2·K) | 2.020 | 0.660 | 0.398 | 0.284 | 0.221 | 0.181 |
| Thickness of Thermal Insulation Materials | Heating Demand (kWh) | Cooling Demand (kWh) | Annual Energy Consumption (kWh) | Energy Conservation Rate | Proportion of Thermal Comfort Reaching the Standard | Indoor Average Temperature on the Winter Solstice (°C) | Indoor Average Temperature on the Summer Solstice (°C) |
|---|---|---|---|---|---|---|---|
| 0 | 15,961 | 8101 | 24,062 | — | 31.26% | 4.5 | 26.52 |
| 30 | 12,462 | 6597 | 19,059 | 20.79% | 31.57% | 5.18 | 26.39 |
| 60 | 11,607 | 6271 | 17,878 | 25.70% | 31.58% | 5.20 | 26.35 |
| 90 | 11,238 | 6134 | 17,372 | 27.80% | 31.59% | 5.32 | 26.33 |
| 120 | 11,029 | 6061 | 17,090 | 28.98% | 31.59% | 5.33 | 26.33 |
| 150 | 10,896 | 6012 | 16,908 | 29.73% | 31.59% | 5.33 | 26.33 |
| Thermal Insulation Material | No Thermal Insulation | 30 mm Rock Wool Insulation Board | 30 mm XPS Insulation Board | 30 mm EPS Insulation Board | 30 mm PUR Insulation Board |
|---|---|---|---|---|---|
| Thermal conductivity coefficient λ (W/m·K) | — | 0.045 | 0.030 | 0.041 | 0.024 |
| Heat storage coefficient K (W/m2·K) | — | 0.750 | 0.540 | 0.360 | 0.290 |
| Thermal resistance of the main body R ((m2·K)/W) | 0.104 | 0.647 | 1.134 | 0.697 | 1.384 |
| Thermal inertness indicator of the main body D | 1.512 | 1.936 | 2.212 | 1.936 | 2.035 |
| Heat transfer coefficient of the main body K (W/m2·K) | 3.942 | 1.255 | 0.779 | 1.181 | 0.652 |
| Thermal Insulation Material | Heating Demand (kWh) | Cooling Demand (kWh) | Annual Energy Consumption (kWh) | Energy Conservation Rate | Proportion of Thermal Comfort Reaching the Standard | Indoor Average Temperature on the Winter Solstice (°C) | Indoor Average Temperature on the Summer Solstice (°C) |
|---|---|---|---|---|---|---|---|
| No thermal insulation | 15,961 | 8101 | 24,062 | — | 31.26% | 4.5 | 26.52 |
| Rock wool insulation board | 12,943 | 6233 | 19,176 | 20.31% | 31.60% | 4.66 | 26.43 |
| EPS insulation board | 12,661 | 6052 | 18,713 | 22.23% | 31.63% | 4.71 | 26.38 |
| XPS insulation board | 12,570 | 6003 | 18,573 | 22.81% | 31.64% | 4.79 | 26.34 |
| PUR insulation board | 12,501 | 5960 | 18,451 | 23.32% | 31.65% | 4.91 | 26.30 |
| Thickness of PUR Insulation Boards δ (mm) | 0 | 30 | 60 | 90 | 120 | 150 |
|---|---|---|---|---|---|---|
| Thermal conductivity coefficient λ (W/m·K) | — | 0.024 | 0.024 | 0.024 | 0.024 | 0.024 |
| Heat storage coefficient K (W/m2·K) | — | 0.290 | 0.290 | 0.290 | 0.290 | 0.290 |
| Thermal resistance of the main body R ((m2·K)/W) | 0.104 | 1.384 | 2.634 | 3.884 | 5.134 | 6.384 |
| Thermal inertness indicator of the main body D | 1.512 | 2.035 | 2.397 | 2.760 | 3.122 | 3.485 |
| Heat transfer coefficient of the main body K (W/m2·K) | 3.942 | 0.652 | 0.359 | 0.248 | 0.189 | 0.153 |
| Thickness of Thermal Insulation Materials | Heating Demand (kWh) | Cooling Demand (kWh) | Annual Energy Consumption (kWh) | Energy Conservation Rate | Proportion of Thermal Comfort Reaching the Standard | Indoor Average Temperature on the Winter Solstice (°C) | Indoor Average Temperature on the Summer Solstice (°C) |
|---|---|---|---|---|---|---|---|
| 0 | 15,961 | 8101 | 24,062 | — | 31.26% | 4.5 | 26.52 |
| 30 | 12,501 | 5960 | 18,451 | 23.32% | 31.65% | 4.91 | 26.30 |
| 60 | 11,999 | 5638 | 17,637 | 26.70% | 31.67% | 4.99 | 26.23 |
| 90 | 11,808 | 5522 | 17,330 | 27.98% | 31.68% | 5.11 | 26.14 |
| 120 | 11,701 | 5458 | 17,159 | 28.69% | 31.69% | 5.14 | 26.10 |
| 150 | 11,633 | 5419 | 17,052 | 29.13% | 31.69% | 5.14 | 26.10 |
| Glazing Type | Single-Layer Glazing | Ordinary Insulating Glazing | Low-e Insulating (Air) Glazing | Low-e Insulating (Argon) Glazing | Three-Layer Insulating Glazing |
|---|---|---|---|---|---|
| Material and thickness (mm) | 6 | 6 + 12A + 6 | 6Low-e + 12A + 6 | 6Low-e + 12Ar + 6 | 5 + 6A + 5 + 6A + 5 |
| Heat transfer coefficient W/(m2·K) | 6.400 | 3.200 | 2.700 | 2.400 | 2.100 |
| Shading coefficient | 0.750 | 0.690 | 0.500 | 0.500 | 0.740 |
| Thermal Insulation Material | Heating Demand (kWh) | Cooling Demand (kWh) | Annual Energy Consumption (kWh) | Energy Conservation Rate | Proportion of Thermal Comfort Reaching the Standard | Indoor Average Temperature on the Winter Solstice (°C) | Indoor Average Temperature on the Summer Solstice (°C) |
|---|---|---|---|---|---|---|---|
| Single-layer glazing | 15,961 | 8101 | 24,062 | — | 31.26% | 4.5 | 26.52 |
| Ordinary insulating glazing | 14,613 | 7987 | 22,600 | 6.08% | 31.49% | 4.93 | 26.50 |
| Low-e insulating (air) glazing | 15,022 | 7562 | 22,584 | 6.14% | 31.35% | 4.65 | 26.41 |
| Low-e insulating (argon) glazing | 14,832 | 7566 | 22,398 | 6.92% | 31.37% | 4.68 | 26.42 |
| Three-layer insulating glazing | 13,755 | 8117 | 21,872 | 9.10% | 31.55% | 5.08 | 26.51 |
| Window-to-Wall Ratio | Wall Area | Window Area | Window Size (Width × Height)/m |
|---|---|---|---|
| 0.29 (initial) | 90.45 | 27.14 | 2.00 × 2.10 |
| 0.25 | 90.45 | 22.61 | 1.70 × 2.00 |
| 0.35 | 90.45 | 31.66 | 2.20 × 2.25 |
| 0.45 | 90.45 | 40.70 | 2.40 × 2.60 |
| South-Facing Window-to-Wall Ratio | Heating Demand (kWh) | Cooling Demand (kWh) | Annual Energy Consumption (kWh) | Energy Conservation Rate | Proportion of Thermal Comfort Reaching the Standard | Indoor Average Temperature on the Winter Solstice (°C) | Indoor Average Temperature on the Summer Solstice (°C) |
|---|---|---|---|---|---|---|---|
| 0.29 (initial) | 15,961 | 8101 | 24,062 | — | 31.26% | 4.5 | 26.52 |
| 0.25 | 15,997 | 8032 | 24,029 | 0.14% | 31.29% | 4.42 | 26.48 |
| 0.35 | 15,757 | 8223 | 23,980 | 0.34% | 31.30% | 4.7 | 26.60 |
| 0.45 | 15,679 | 8535 | 24,214 | −0.63% | 31.32% | 4.83 | 26.68 |
| North-Facing Window-to-Wall Ratio | 0.2 (Initial) | 0.1 | 0.3 |
|---|---|---|---|
| Wall area | 90.45 | 90.45 | 90.45 |
| Window area | 18.09 | 9.05 | 27.14 |
| Window size (width × height)/m | 1.50 × 2.00 | 1.00 × 1.50 | 2.00 × 2.25 |
| North-Facing Window-to-Wall Ratio | Heating Demand (kWh) | Cooling Demand (kWh) | Annual Energy Consumption (kWh) | Energy Conservation Rate | Proportion of Thermal Comfort Reaching the Standard | Indoor Average Temperature on the Winter Solstice (°C) | Indoor Average Temperature on the Summer Solstice (°C) |
|---|---|---|---|---|---|---|---|
| 0.2 (initial) | 15,961 | 8101 | 24,062 | — | 31.26% | 4.50 | 26.52 |
| 0.1 | 15,767 | 7929 | 23,696 | 1.52% | 31.16% | 4.49 | 26.50 |
| 0.3 | 16,148 | 8284 | 24,432 | −1.54% | 31.28% | 4.51 | 26.55 |
| Length of South-Facing Shading Boards | Cooling Demand (kWh) | Energy Conservation Rate in the Cooling Season | Proportion of Thermal Comfort Reaching the Standard | Indoor Average Temperature on the Summer Solstice (°C) |
|---|---|---|---|---|
| 0 | 8101 | — | 31.26% | 26.52 |
| 0.2 | 8006 | 1.17% | 31.32% | 26.45 |
| 0.4 | 7933 | 2.07% | 31.36% | 26.41 |
| 0.6 | 7882 | 2.70% | 31.40% | 26.38 |
| 0.8 | 7854 | 3.05% | 31.42% | 26.35 |
| 1 | 7844 | 3.17% | 31.42% | 26.34 |
| Warming Galleries | Heating Demand (kWh) | Cooling Demand (kWh) | Annual Energy Consumption (kWh) | Energy Conservation Rate | Proportion of Thermal Comfort Reaching the Standard | Indoor Average Temperature on the Winter Solstice (°C) | Indoor Average Temperature on the Summer Solstice (°C) |
|---|---|---|---|---|---|---|---|
| Open | 15,961 | 8101 | 24,062 | — | 31.26% | 4.5 | 26.52 |
| First-floor closed | 15,073 | 8329 | 23,402 | 2.74% | 31.33% | 5.07 | 26.38 |
| Second-floor closed | 15,364 | 7706 | 23,070 | 4.12% | 31.30% | 4.71 | 26.45 |
| First- and second-floor closed | 14,126 | 7966 | 22,112 | 8.10% | 31.37% | 5.53 | 26.38 |
| Level | Thickness of XPS Insulation Boards on the Exterior Walls (mm) | Thickness of PUR Insulation Boards on the Roofs (mm) | Type of Glass in the Exterior Windows | South-Facing Window-to-Wall Ratio | Warming Galleries |
|---|---|---|---|---|---|
| 1 | 60 | 60 | Ordinary insulating glazing | 0.20 | Open |
| 2 | 70 | 70 | Low-e insulating (air) glazing | 0.25 | First-floor closed |
| 3 | 80 | 80 | Low-e insulating (argon) glazing | 0.30 | Second-floor closed |
| 4 | 90 | 90 | Three-layer insulating glazing | 0.35 | First- and second-floor closed |
| No. | A | B | C | D | E |
|---|---|---|---|---|---|
| 1 | 1 | 1 | 1 | 1 | 1 |
| 2 | 1 | 2 | 2 | 2 | 2 |
| 3 | 1 | 3 | 3 | 3 | 3 |
| 4 | 1 | 4 | 4 | 4 | 4 |
| 5 | 2 | 1 | 2 | 3 | 4 |
| 6 | 2 | 2 | 1 | 4 | 3 |
| 7 | 2 | 3 | 4 | 1 | 2 |
| 8 | 2 | 4 | 3 | 2 | 1 |
| 9 | 3 | 1 | 3 | 4 | 2 |
| 10 | 3 | 2 | 4 | 3 | 1 |
| 11 | 3 | 3 | 1 | 2 | 4 |
| 12 | 3 | 4 | 2 | 1 | 3 |
| 13 | 4 | 1 | 4 | 2 | 3 |
| 14 | 4 | 2 | 3 | 1 | 4 |
| 15 | 4 | 3 | 2 | 4 | 1 |
| 16 | 4 | 4 | 1 | 3 | 2 |
| No. | A: Thickness of XPS Insulation Boards on the Exterior Walls (mm) | B: Thickness of PUR Insulation Boards on the Roofs (mm) | C: Type of Glass in the Exterior Windows | D: South-Facing Window-to-Wall Ratio | E: Closed Warming Galleries |
|---|---|---|---|---|---|
| 1 | 60 | 60 | Ordinary insulating glazing | 0.2 | Open |
| 2 | 60 | 70 | Low-e insulating (air) glazing | 0.25 | First floor |
| 3 | 60 | 80 | Low-e insulating (argon) glazing | 0.3 | Second floor |
| 4 | 60 | 90 | Three-layer insulating glazing | 0.35 | First and second floors |
| 5 | 70 | 60 | Low-e insulating (air) glazing | 0.3 | First and second floors |
| 6 | 70 | 70 | Ordinary insulating glazing | 0.35 | Second floor |
| 7 | 70 | 80 | Three-layer insulating glazing | 0.2 | First floor |
| 8 | 70 | 90 | Low-e insulating (argon) glazing | 0.25 | Open |
| 9 | 80 | 60 | Low-e insulating (argon) glazing | 0.35 | First floor |
| 10 | 80 | 70 | Three-layer insulating glazing | 0.3 | Open |
| 11 | 80 | 80 | Ordinary insulating glazing | 0.25 | First and second floors |
| 12 | 80 | 90 | Low-e insulating (air) glazing | 0.2 | Second floor |
| 13 | 90 | 60 | Three-layer insulating glazing | 0.25 | Second floor |
| 14 | 90 | 70 | Low-e insulating (argon) glazing | 0.2 | First and second floors |
| 15 | 90 | 80 | Low-e insulating (air) glazing | 0.35 | Open |
| 16 | 90 | 90 | Ordinary insulating glazing | 0.3 | First floor |
| No. | Proportion of Indoor Thermal Comfort Reaching the Standard | Annual Heating Demand (kWh) | Annual Cooling Demand (kWh) | Annual Energy Consumption (kWh) | Energy Conservation Rate |
|---|---|---|---|---|---|
| 1 | 32.17% | 5452 | 2516 | 7968 | 66.89% |
| 2 | 32.19% | 4952 | 2446 | 7398 | 69.25% |
| 3 | 32.25% | 5170 | 1824 | 6994 | 70.93% |
| 4 | 32.90% | 3181 | 2813 | 5994 | 75.09% |
| 5 | 32.43% | 4473 | 2093 | 6566 | 72.71% |
| 6 | 32.47% | 4771 | 2280 | 7051 | 70.70% |
| 7 | 32.67% | 3499 | 2639 | 6138 | 74.49% |
| 8 | 32.18% | 5126 | 2023 | 7149 | 70.29% |
| 9 | 32.30% | 4430 | 2485 | 6915 | 71.26% |
| 10 | 32.54% | 3920 | 2613 | 6533 | 72.85% |
| 11 | 32.49% | 3732 | 2424 | 6156 | 74.42% |
| 12 | 32.10% | 5092 | 1553 | 6645 | 72.38% |
| 13 | 32.60% | 3910 | 2199 | 6109 | 74.61% |
| 14 | 32.25% | 4019 | 1852 | 5871 | 75.60% |
| 15 | 32.25% | 4984 | 2086 | 7070 | 70.62% |
| 16 | 32.44% | 3850 | 2704 | 6554 | 72.76% |
| Group | A: Thickness of XPS Insulation Boards on the Exterior Walls | B: Thickness of PUR Insulation Boards on the Roofs | C: Type of Glass in the Exterior Windows | D: South-Facing Window-to-Wall Ratio | E: Closed Warming Galleries |
|---|---|---|---|---|---|
| K1 | 14,181.250 | 14,180.000 | 14,187.500 | 14,146.250 | 14,141.250 |
| K2K2 | 14,207.500 | 14,175.000 | 14,122.500 | 14,176.250 | 14,191.250 |
| K3K3 | 14,172.500 | 14,197.500 | 14,122.500 | 14,198.750 | 14,171.250 |
| K4K4 | 14,185.000 | 14,193.750 | 14,313.750 | 14,225.000 | 14,242.500 |
| 2836.250 | 2836.000 | 2837.500 | 2829.250 | 2828.250 | |
| 2841.500 | 2835.000 | 2824.500 | 2835.250 | 2838.250 | |
| 2834.500 | 2839.500 | 2824.500 | 2839.750 | 2834.250 | |
| 2837.000 | 2838.750 | 2862.750 | 2845.000 | 2848.500 | |
| R | 7.000 | 4.500 | 38.250 | 15.750 | 20.250 |
| Group | A: Thickness of XPS Insulation Boards on the Exterior Walls | B: Thickness of PUR Insulation Boards on the Roofs | C: Type of Glass in the Exterior Windows | D: South-Facing Window-to-Wall Ratio | E: Closed Warming Galleries |
|---|---|---|---|---|---|
| K1 | 35,442.500 | 34,447.500 | 34,661.250 | 33,277.500 | 35,900.000 |
| K2 | 33,630.000 | 33,566.250 | 34,598.750 | 33,515.000 | 33,756.250 |
| K3 | 32,811.250 | 32,947.500 | 33,661.250 | 33,308.750 | 33,498.750 |
| K4 | 32,005.000 | 32,927.500 | 30,967.500 | 33,787.500 | 30,733.750 |
| 7088.500 | 6889.500 | 6932.250 | 6655.500 | 7180.000 | |
| 6726.000 | 6713.250 | 6919.750 | 6703.000 | 6751.250 | |
| 6562.250 | 6589.500 | 6732.250 | 6661.750 | 6699.750 | |
| 6401.000 | 6585.500 | 6193.500 | 6757.500 | 6146.750 | |
| R | 687.500 | 304.000 | 738.750 | 102.000 | 1033.250 |
| No. | Thickness of XPS Insulation Boards on the Exterior Walls (mm) | Thickness of PUR Insulation Boards on the Roofs (mm) | Type of Glass in the Exterior Windows | South-Facing Window-to-Wall Ratio | Closed Warming Galleries |
|---|---|---|---|---|---|
| 4 | 60 | 90 | Three-layer insulating glazing | 0.35 | First and second floors |
| 14 | 90 | 70 | Low-e insulating (argon) glazing | 0.2 | First and second floors |
| 17 | 70 | 80 | Three-layer insulating glazing | 0.35 | First and second floors |
| 18 | 90 | 90 | Three-layer insulating glazing | 0.2 | First and second floors |
| No. | Proportion of Indoor Thermal Comfort Reaching the Standard | Annual Heating Demand (kWh) | Annual Cooling Demand (kWh) | Annual Energy Consumption (kWh) | Energy Conservation Rate |
|---|---|---|---|---|---|
| 4 | 32.90% | 3181 | 2813 | 5994 | 75.09% |
| 14 | 32.25% | 4019 | 1852 | 5871 | 75.60% |
| 17 | 32.91% | 3022 | 2782 | 5804 | 75.88% |
| 18 | 32.78% | 2916 | 2394 | 5310 | 77.93% |
| Heating Demand (kWh) | Cooling Demand (kWh) | Annual Energy Consumption (kWh) | Energy Conservation Rate | Proportion of Thermal Comfort Reaching the Standard | Indoor Average Temperature on the Winter Solstice (°C) | Indoor Average Temperature on the Summer Solstice (°C) | |
|---|---|---|---|---|---|---|---|
| Before transformation | 15,961 | 8101 | 24,062 | — | 31.26% | 4.50 | 26.52 |
| After the transformation | 5011 | 2191 | 7202 | 70.07% | 33.24% | 6.37 | 26.16 |
| Transformation Type | Transformation Content | Estimated Cost (CNY) | Note |
|---|---|---|---|
| Space | Interior space | 11,800 | External door: 1 set × CNY 1000 Sliding glass door: 1 set × CNY 1200 Wooden door: 2 sets × CNY 800 |
| Closed warming galleries | 11,502 | Area of warming galleries: 25.56 m2 Unit price: CNY 450/m2 | |
| Other space | 6000 | — | |
| Exterior wall | 70 mm XPS insulation board | 10,392 | Area of exterior walls: 247.42 m2 Unit price: CNY 600/m3 |
| Roof | 80 mm PUR insulation boards | 12,373 | Area of roofs: 110.47 m2 Unit price: CNY 1400/m2 |
| Exterior window | Plastic steel window Three-layer insulating glazing (5 + 6A + 5 + 6A + 5) | 8354 | Area of exterior windows: 26.23 m2 Unit price: CNY 320/m2 |
| Shading | South-facing mobile horizontal shading board | 839 | Area: 5.76 m2 Unit price: CNY 200/m2 |
| Outdoor space | Parking shed | 2500 | 1 |
| Tree pool | 1000 | 1.5 m × 4.7 m (2) | |
| Fishpond | 800 | 1.2 m × 4.6 m (1) | |
| Leisure platform (plastic flooring) | 1450 | 4.6 m × 3.5 m (1) CNY 90/m2 | |
| Total cost | 66,810 | Not including labor cost |
Disclaimer/Publisher’s Note: The statements, opinions and data contained in all publications are solely those of the individual author(s) and contributor(s) and not of MDPI and/or the editor(s). MDPI and/or the editor(s) disclaim responsibility for any injury to people or property resulting from any ideas, methods, instructions or products referred to in the content. |
© 2025 by the authors. Licensee MDPI, Basel, Switzerland. This article is an open access article distributed under the terms and conditions of the Creative Commons Attribution (CC BY) license (https://creativecommons.org/licenses/by/4.0/).
Share and Cite
Liu, X.; Zhang, Y.; He, Y.; Yin, Z.; Ji, X. Transformation of Rural Low-Carbon Houses Under the Guidance of Thermal Comfort: A Case Study of the Xuzhou Area. Buildings 2025, 15, 942. https://doi.org/10.3390/buildings15060942
Liu X, Zhang Y, He Y, Yin Z, Ji X. Transformation of Rural Low-Carbon Houses Under the Guidance of Thermal Comfort: A Case Study of the Xuzhou Area. Buildings. 2025; 15(6):942. https://doi.org/10.3390/buildings15060942
Chicago/Turabian StyleLiu, Xinyu, Yuan Zhang, Yukun He, Ziyan Yin, and Xiang Ji. 2025. "Transformation of Rural Low-Carbon Houses Under the Guidance of Thermal Comfort: A Case Study of the Xuzhou Area" Buildings 15, no. 6: 942. https://doi.org/10.3390/buildings15060942
APA StyleLiu, X., Zhang, Y., He, Y., Yin, Z., & Ji, X. (2025). Transformation of Rural Low-Carbon Houses Under the Guidance of Thermal Comfort: A Case Study of the Xuzhou Area. Buildings, 15(6), 942. https://doi.org/10.3390/buildings15060942