Abstract
The application of building retrofitting solutions targeting improved energy efficiency and thermal comfort is significantly influenced by environmental and climate conditions. This study aims to automate a reliable dataset and enhance the predictability of the post-retrofit performance of the buildings. The proposed hybrid methodology utilises physics-based and data-driven methods to evaluate a range of retrofitting scenarios across diverse UK climate zones and validates an automated dataset with real-time data collected via IoT (Internet of things)-based sensors. This hybrid method enables a comprehensive assessment of retrofitting solutions’ impacts on building performance. The collected data create a reliable dataset and serve as the foundation for training machine learning (ML) prediction models and support decisions in retrofit strategies. The findings reveal that in cool–humid climates, the air source heat pumps significantly perform better when compared to 58 heating systems in terms of the balance of energy efficiency and thermal comfort. Moreover, Water Source Heat Pumps (WSHPs) are recommended for colder regions. As a result, zone-specific retrofitting strategies with seasonal adjustments are recommended for achieving optimum energy efficiency and thermal comfort.
1. Introduction
Buildings worldwide are responsible for 33% of greenhouse gas emissions and 40% of energy consumption [1]. European policy has been implemented with the aim of a 27% improvement in energy efficiency by 2030 and has focused on making new buildings more energy efficient [2]. However, new buildings account for only 1% of the total building stock in Europe, and 99% are existing buildings. Hence, retrofitting existing residential buildings is one of the main factors in achieving significant energy savings in Europe and provides a realistic and feasible approach for reducing carbon emissions and energy consumption [3]. By implementing energy efficiency measures, not only are energy consumption and CO2 emissions significantly reduced [4], but also, the thermal comfort of the occupants improves [5]. Several methods have been developed to aid in the decision-making process when selecting appropriate solutions with multiple objectives. Most of these methods rely on a simulation-based analysis called the physics-based method (White-box models), in which programming languages are employed to create optimisation algorithms [6]. This method, often referred to as a physics-based or engineering prediction model and used as a form of simulation software, relies on the fundamental principles of building physics and environmental features to simulate the detailed energy dynamics of buildings. Using a suitable energy simulation tool based on the objective of the project helps the retrofitting process by finding efficient solutions to control building systems. Popular energy simulation tools include DOE-2 (https://www.doe2.com), Equest (https://www.doe2.com/equest), EnergyPlus (https://energyplus.net), TRNSYS (https://www.trnsys.com) and IES-VE (https://www.iesve.com) [7]. Moreover, data-driven methods (Black-box models) are statistical methods for predicting building energy consumption and performance. These models operate using input data, relying on empirical data to identify patterns and relationships without requiring an in-depth understanding of the building’s physical systems or geographical features [8]. This method, by collecting building data from multiple databases, facilitates the development of innovative and efficient solutions through mathematical and computational techniques [9]. In this context, simulation tools, such as Rhinoceros 3D (https://www.rhino3d.com) and its parametric design plugin, Grasshopper, are frequently used in the early stages of building design for creating and testing parametric models. Rhinoceros 3D, often referred to as Rhino, is a powerful 3D modelling platform that facilitates the creation of complex building geometries for simulations [10]. Several studies have utilised Rhino to model building designs for performance analysis, such as the development of a three-dimensional parametric model of residential buildings [11], educational buildings [12] and commercial buildings [13]. Additionally, for retrofitting residential buildings, Rhinoceros has been used to model and integrate building systems, such as renewable energy technologies for energy optimisation [14]. Grasshopper, a graphical algorithm editor integrated with Rhino, is widely employed to create parametric building models and connect them with simulation tools [10]. This platform allows for the efficient exploration of various design solutions without needing formal coding skills. For instance, Grasshopper has been used to define design parameters for daylight simulations and energy performance evaluations using tools, such as EnergyPlus, and the Grasshopper plugins Ladybug (https://www.ladybug.tools) and Honeybee (https://www.ladybug.tools/honeybee.html) [15,16]. Ladybug and Honeybee, when used with Grasshopper, allow for an integrated analysis approach by enabling detailed simulations of daylighting, energy consumption and building performance. For instance, Ladybug is employed for microclimate and solar radiation analysis [17]. Additionally, Honeybee integrates energy and daylighting models; specifically, these models include those from EnergyPlus. Together, they optimise building designs [18] and improve heating and cooling efficiency for both energy conservation and occupant comfort [19]. These tools are particularly useful for simulating environmental conditions across different climates and making them essential for optimising retrofitting strategies in various regions. Energy simulation tools, such as EnergyPlus, can be seamlessly integrated with Rhino/Grasshopper models, providing a dynamic thermal building simulation environment to calculate annual energy demands and perform a detailed energy analysis based on real-time climate data. This integration allows for the comprehensive optimisation of energy-efficient designs adapted to specific climate zones and building uses.
Numerous studies have explored retrofitting solutions by integrating physics-based and data-driven methods to enhance thermal comfort and reduce energy consumption. Far and Far (2019) emphasised the effectiveness of thermal retrofit techniques and simulated seven different residential building envelope designs as case studies conducted in Sydney, Australia [20]. This study used FirstRate5 software (https://www.fr5.com.au) as a thermal comfort modelling tool to analyse the operational energy required for heating and cooling in existing buildings, finding that the payback period was less than three years [20]. Similarly, Neves-Silva and Camarinha-Matos (2022) proposed a simulation-based decision support system that leverages actual building usage data to optimise retrofitting strategies, balancing both energy efficiency and financial feasibility [21]. The effectiveness of the process was validated based on a real case developed within the EnPROVE project [21]. Luo et al. (2014) combined measured data using instrumentation with physics-based simulation outputs using TRNSYS 17 software to identify cost-effective retrofit measures in office buildings [22]. This study highlights the importance of integrating real-world data with modelling tools to obtain reliable outcomes. In this study, sensors were installed in an office building to monitor pre- and post-retrofit system operation and were combined with simulated data. The results demonstrated the importance of understanding the current conditions of the building, as well as the applicability of interventions to achieve a successful retrofitting solution [22]. Nutkiewicz and Jain (2020) integrated physics-based simulation and data-driven methods to model urban retrofitting standards based on 52 case studies in California [23]. The findings of the study showed the potential of the integrated simulation and data-driven approach to predict future building energy consumption and improve urban energy modelling, as well as retrofitting analysis methods [23]. Despite these advancements, a significant gap remains in the comprehensive integration of both physics-based and data-driven analyses across diverse retrofitting scenarios and climate conditions [24]. Existing studies often focus on either simulation models or data-driven approaches, which limits the reliability, robustness and generalisability of their findings. Moreover, validation findings derived from hybrid techniques using real-time collected data are not incorporated, despite being crucial to ensuring the practical applicability of retrofitting solutions. This study aims to address these gaps by conducting a hybrid analysis that combines physics-based modelling and data-driven techniques to identify optimal retrofitting solutions for buildings across various climate conditions. The proposed methodology will be validated using IoT-collected data to ensure both theoretical validity and real-world applicability. This approach not only addresses the limitations of previous studies but also contributes to the development of reliable datasets to create a solid foundation for machine learning prediction models as a future study.
The structure of this paper is as follows. Section 2 details the Methodology as three main steps: physics-based analysis, data automation and data-driven analysis and IoT-based validation. Section 3 presents the case study, which focuses on the selected semi-detached house in London, its physical characteristics and the climate conditions considered for simulations. Section 4 covers the results and discussion. It includes an energy performance analysis for different climate zones, a thermal comfort evaluation using the PMV model and a data-driven analysis of retrofitting scenarios focused on heating system efficiency. Section 5 elaborates on IoT-based data validation and describes the case studies, the thermal comfort monitoring methodology and a comparative analysis of IoT-collected and simulated data. Section 6 highlights the limitations and future work. Finally, Section 7 provides the conclusion, summarising key findings of the study.
2. Methodology
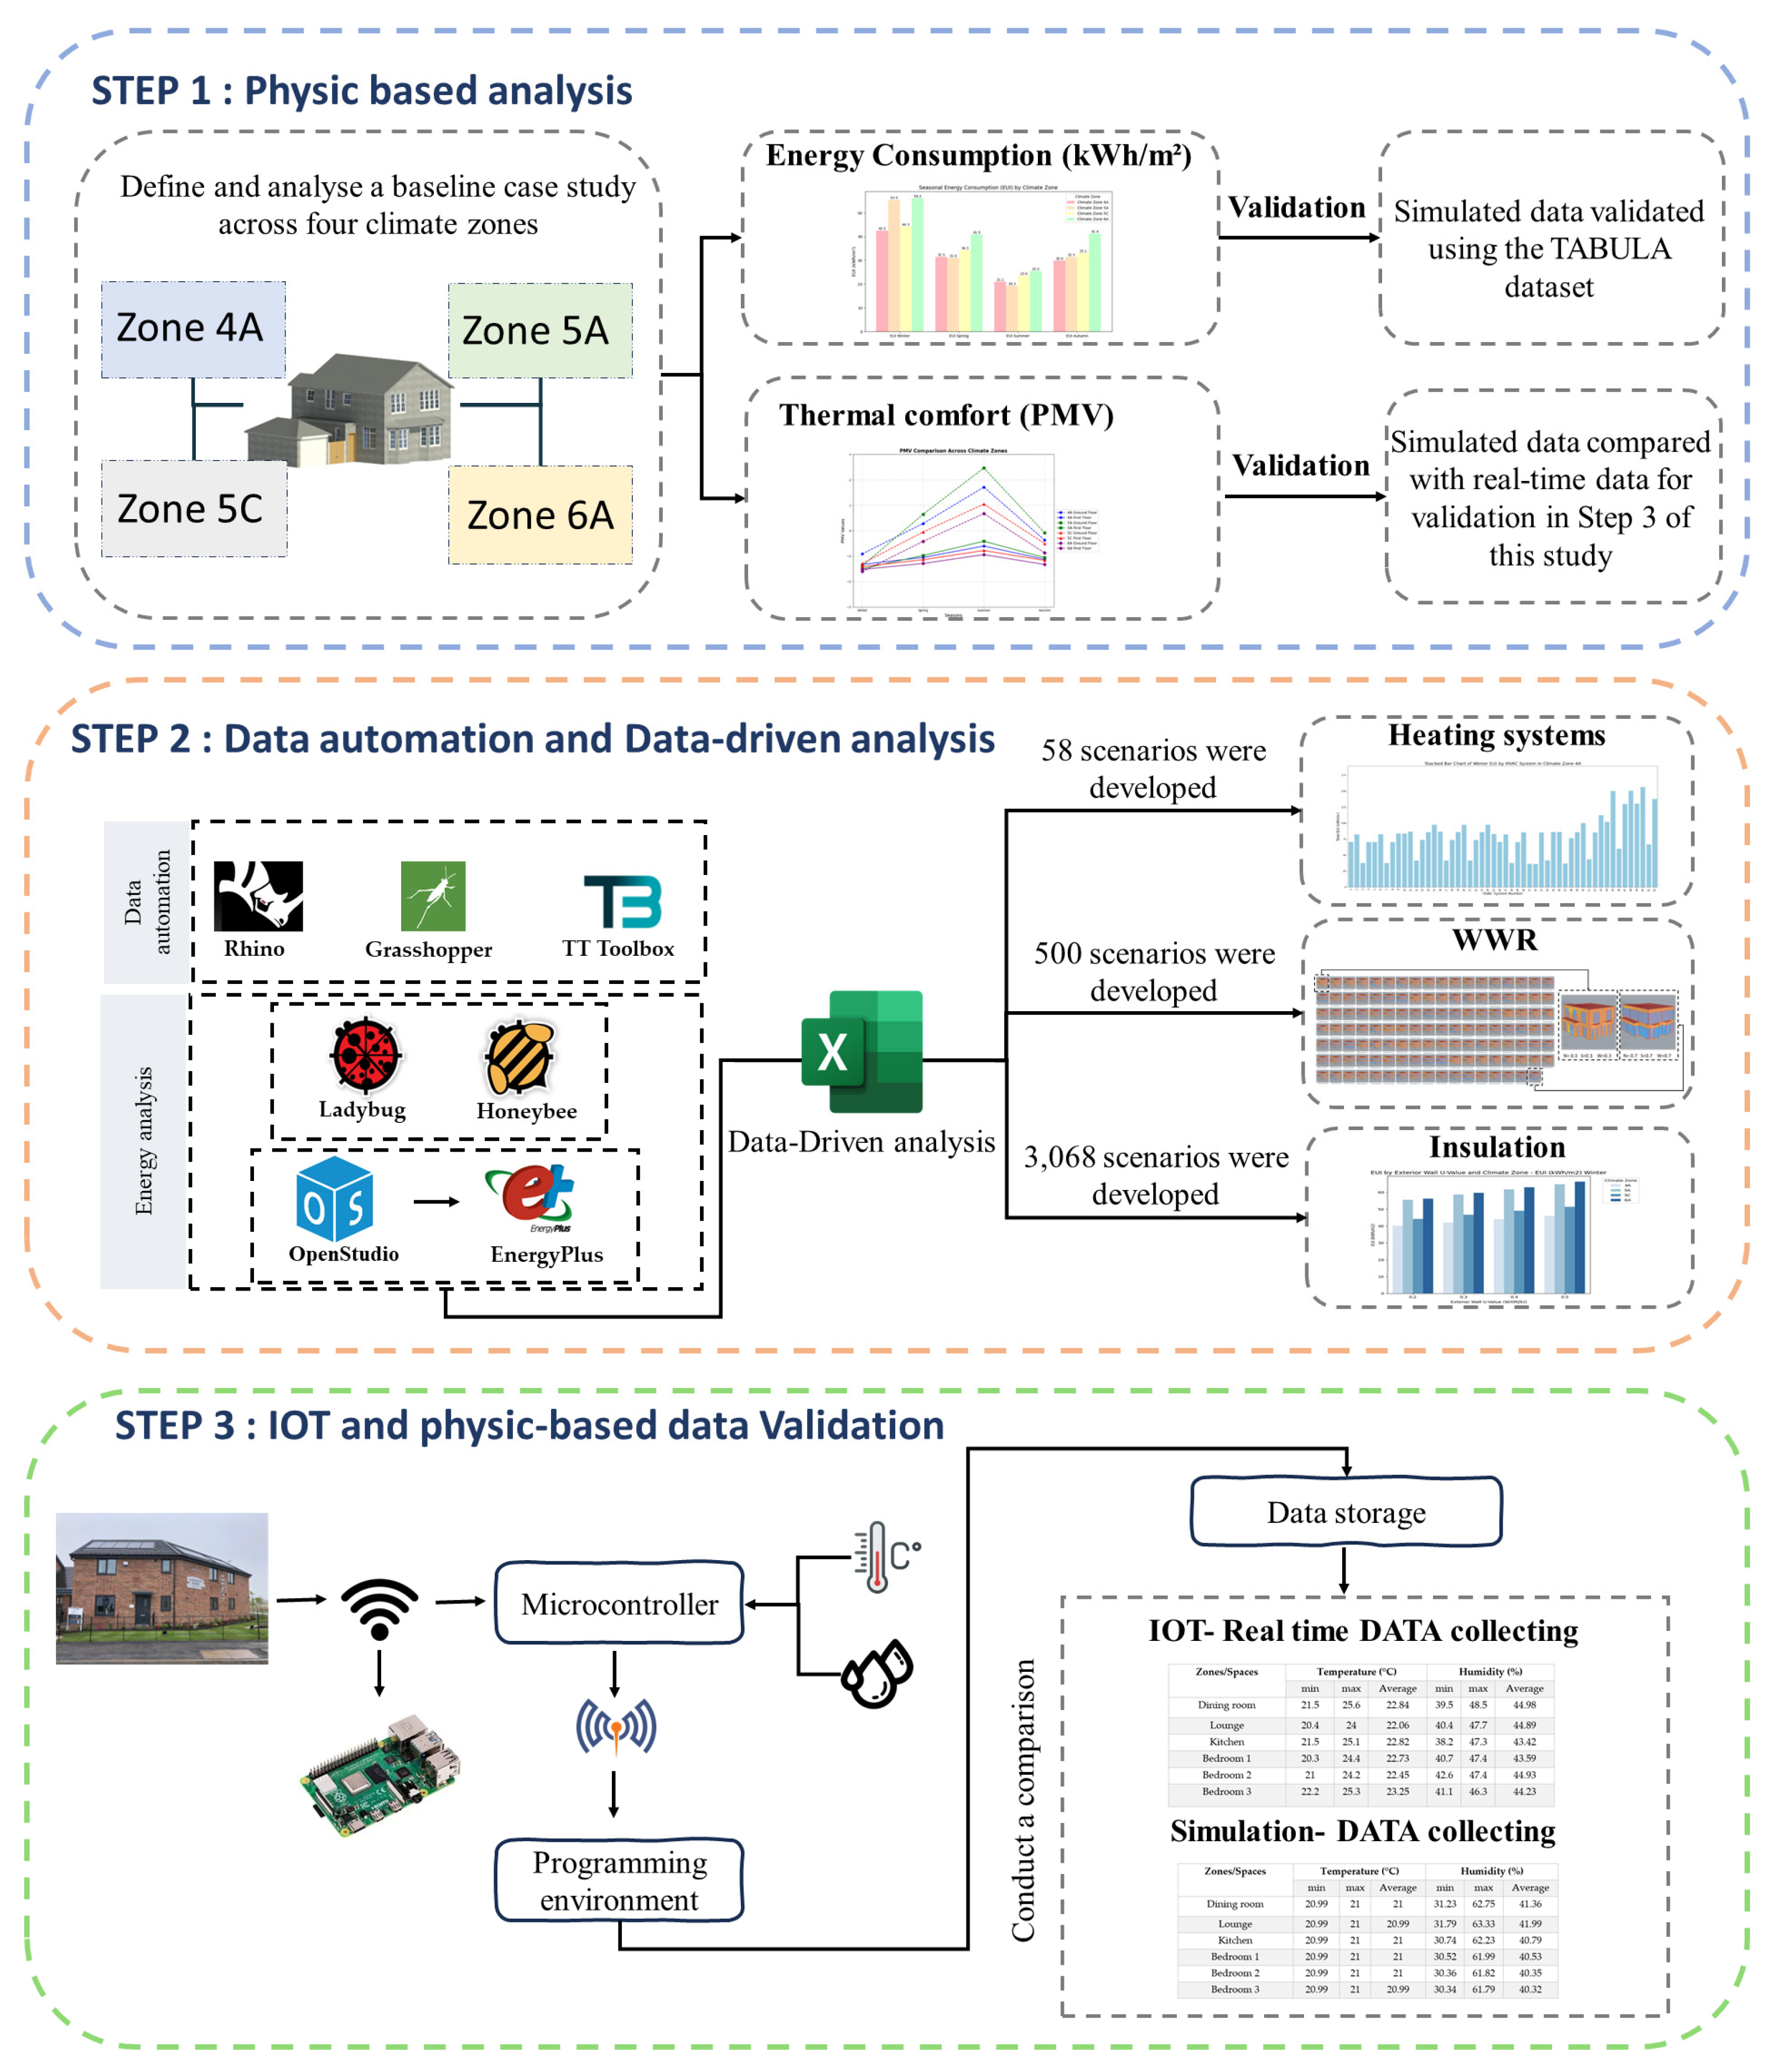
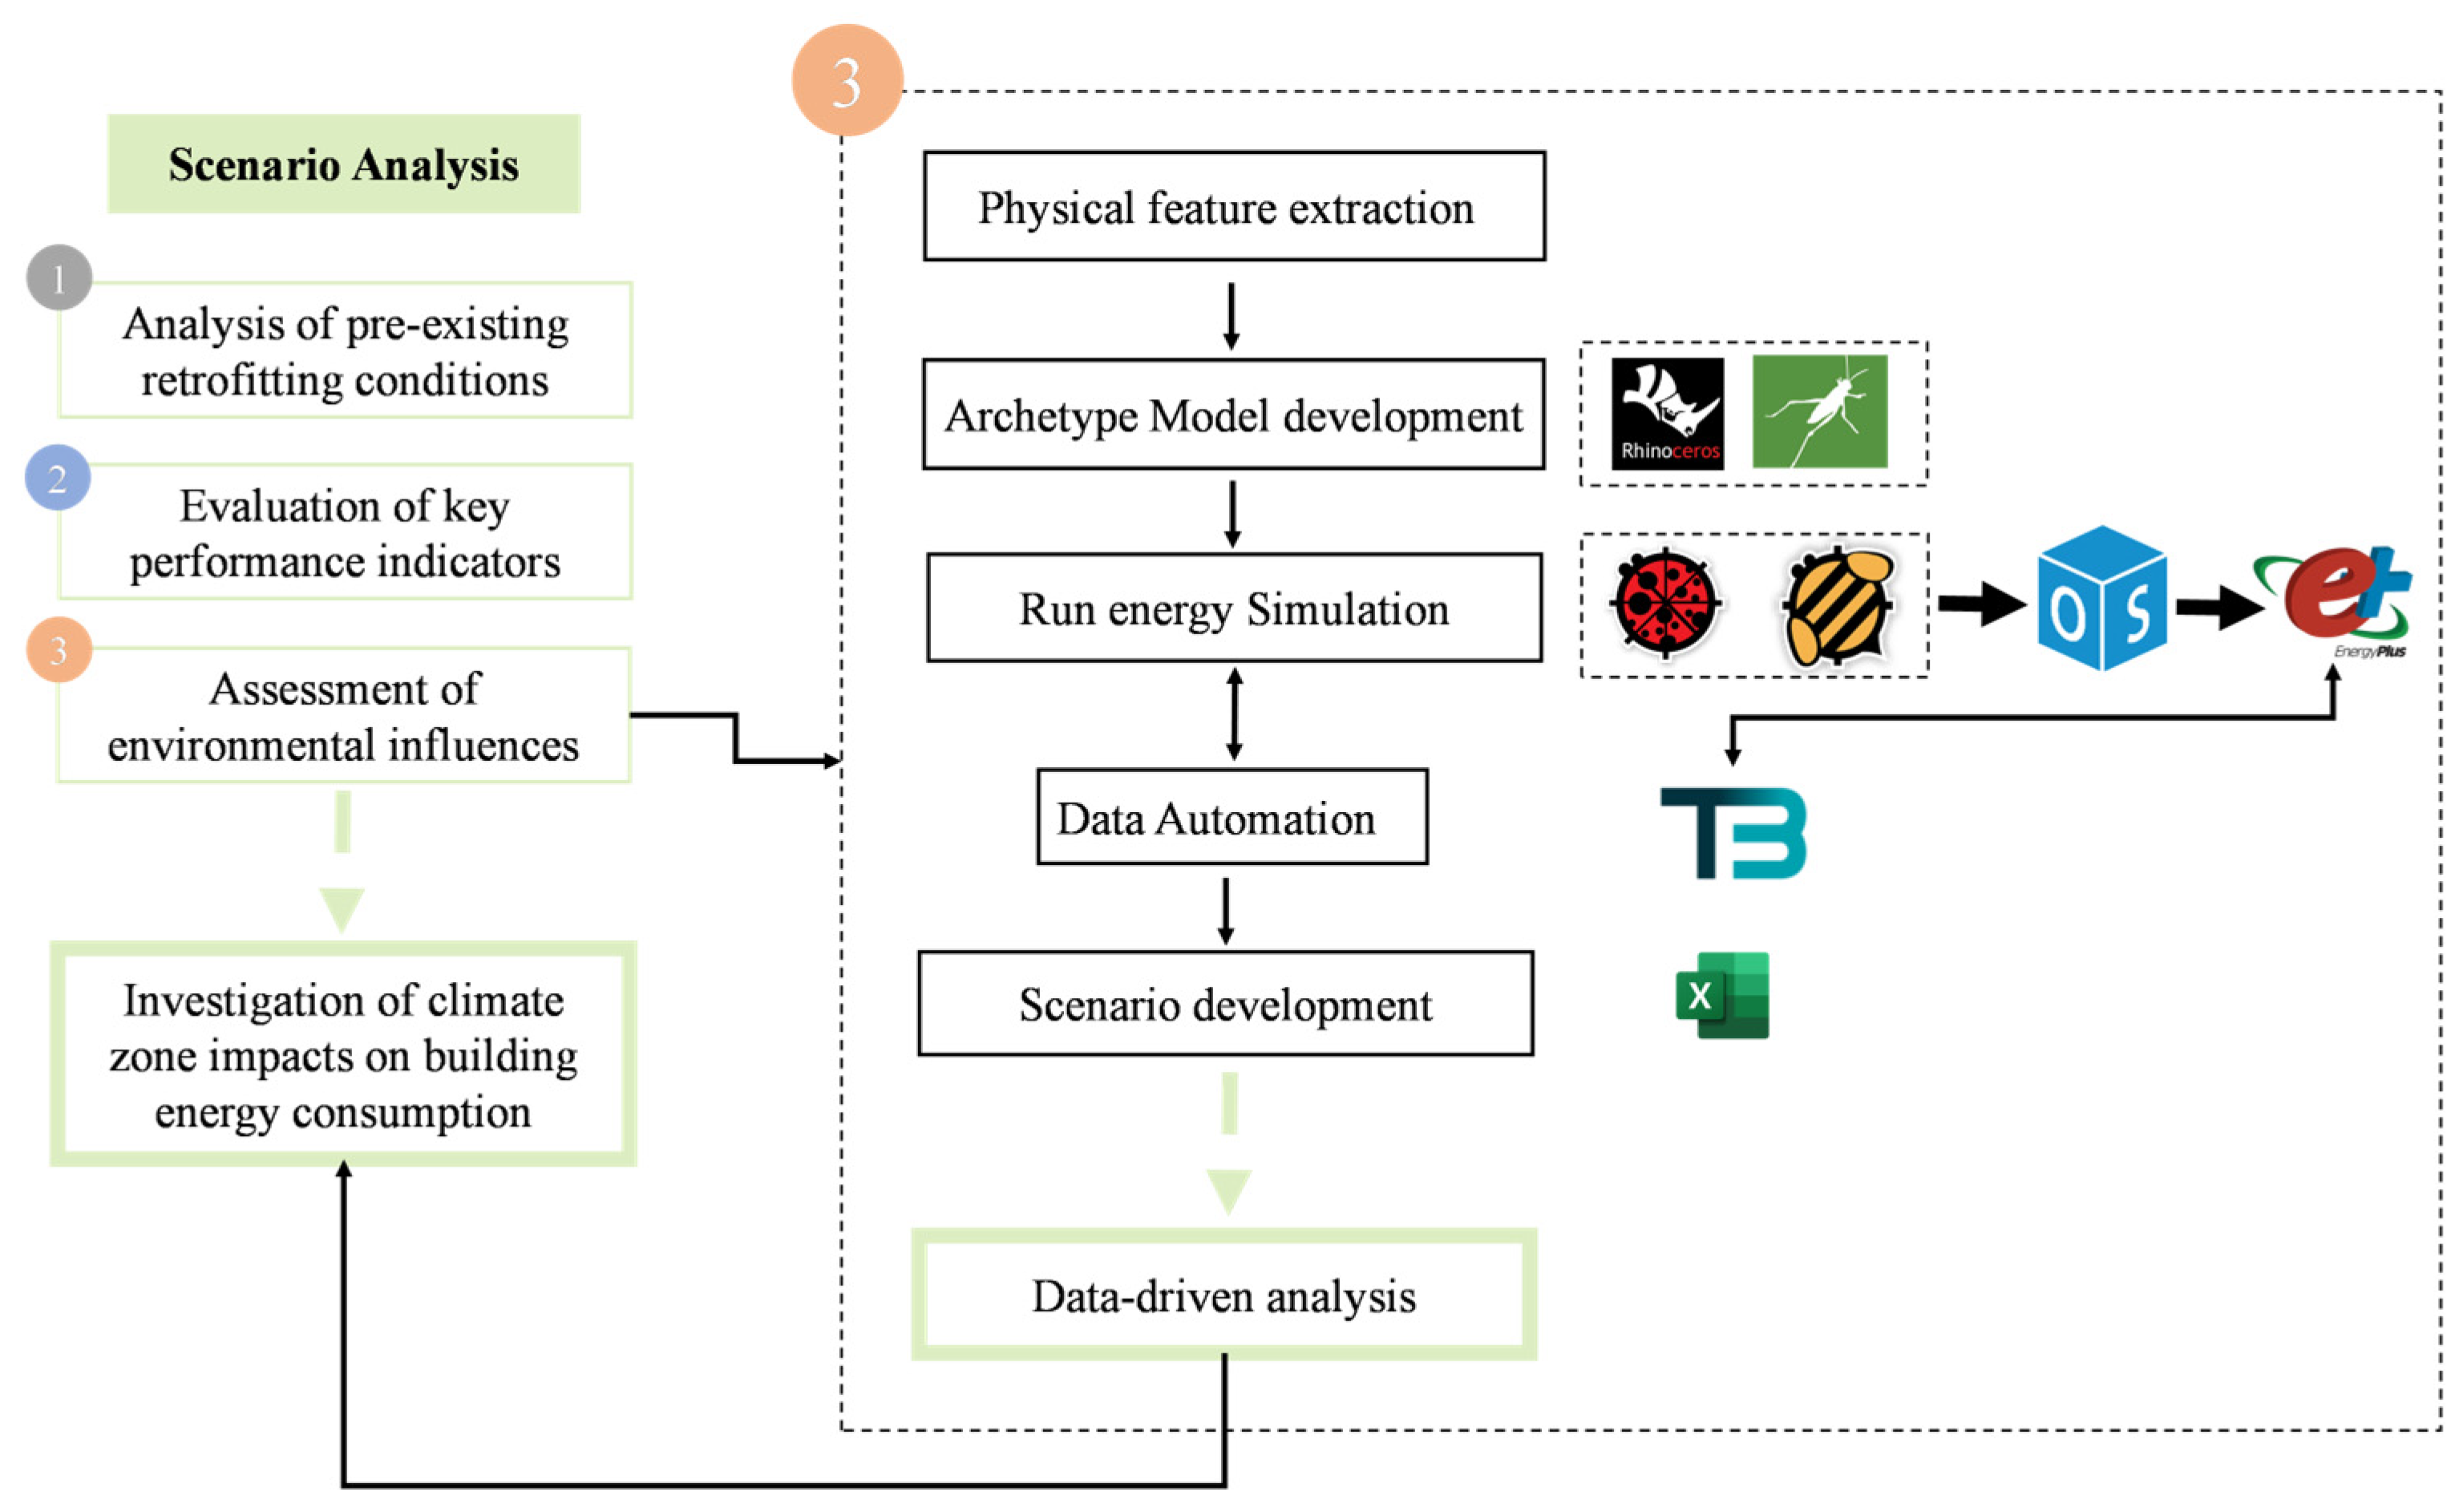
Training an accurate prediction model, particularly for retrofitting building areas, requires a large dataset to enhance the model and reduce errors. There is an energy performance gap; nevertheless, real-world situations rarely match energy performance simulations. This highlights the necessity of accurate data for effectively evaluating various building scenarios [25]. The proposed methodology aims to conduct a three-step methodology to automate a reliable dataset and validate it with real-time data, identifying an optimal retrofitting solution specific to each building’s features. Effective retrofitting solutions must be tailored not only to the physical characteristics of buildings but also to the specific climate zones in which they are located. This climate responsive approach ensures that retrofitting interventions are efficient in terms of both energy consumption and thermal comfort and addresses the unique performance requirements of each building type [26]. The main objective of this study is to identify and propose the most effective retrofitting strategies for residential buildings within various climate conditions across the UK. To achieve this goal, a comprehensive methodology has been developed with three correlated steps designed to systematically analyse, optimise and validate retrofitting solutions. These steps include a (1) physics-based analysis, (2) data automation and a data-driven analysis and (3) IoT-based validation of simulation results (Figure 1).
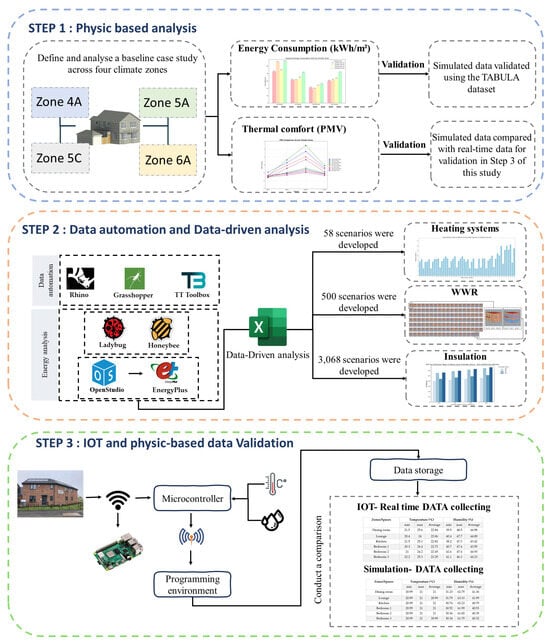
Figure 1.
Schematic overview of proposed methodology.
2.1. Step 1: Physics-Based Analysis
The first step of the methodology focuses on a physics-based analysis. In architectural design practice, physics-based models are generated and integrated with parametric design tools to analyse and optimise the energy performance of buildings. Parametric design enables architects and decision-makers to modify parameters and analyse various scenarios for each building by considering both its form and function. This process facilitates a more efficient energy analysis and supports optimised decision making [27]. A parametric model in this study is developed using advanced tools, such as Rhinoceros (Rhino) for detailed 3D modelling, and Grasshopper, integrated as a plug-in with Rhino, enabling the application of parametric algorithms that update designs interactively based on updated data. For the energy analysis, Ladybug, Honeybee and EnergyPlus have been used. Ladybug and Honeybee manage environmental data and connect the geometric model to EnergyPlus, which performs detailed energy simulations. The energy modelling is based on weather data from EnergyPlus Weather (EPW) files, providing detailed hourly weather information essential for accurate simulations [28]. This step integrates an energy performance simulation and thermal comfort assessment to evaluate the baseline case study across multiple climate zones in the UK. This building is analysed across four different ASHRAE climate zones defined in the UK as 4A (Mixed–Humid), 5A (Cool–Humid), 5C (Cool–Marine) and 6A (Cold–Humid) to understand the influence of climatic variations on building energy consumption and thermal comfort.
2.1.1. Energy Consumption Analysis
A key metric for evaluating and benchmarking building energy performance is the Energy Use Intensity (EUI). The EUI measures a building’s energy efficiency by dividing its total annual energy consumption by its total floor area, and the unit typically used for measurements is kilowatt-hours per square metre per year (kWh/m2/year). This metric allows for a comparison of different buildings against benchmarks, such as ASHRAE 90.1 [29] and other standards [30]. The EUI is particularly valuable for identifying areas that need improvement and evaluating the effectiveness of retrofitting strategies.
2.1.2. Thermal Comfort Analysis
Predicted Mean Vote (PMV) is an accurate model for measuring the level of thermal comfort in indoor environments. This model has become an essential tool in building design and the operation of retrofitting strategies, providing a reliable method for balancing thermal comfort with energy efficiency [31]. This method is widely used by international standards, such as ASHRAE 55 [32] and ISO 7730 [33]. PMV, by bridging the gap between subjective perceptions of comfort and measurable environmental parameters, acts as a fundamental basis for thermal comfort assessments [34].
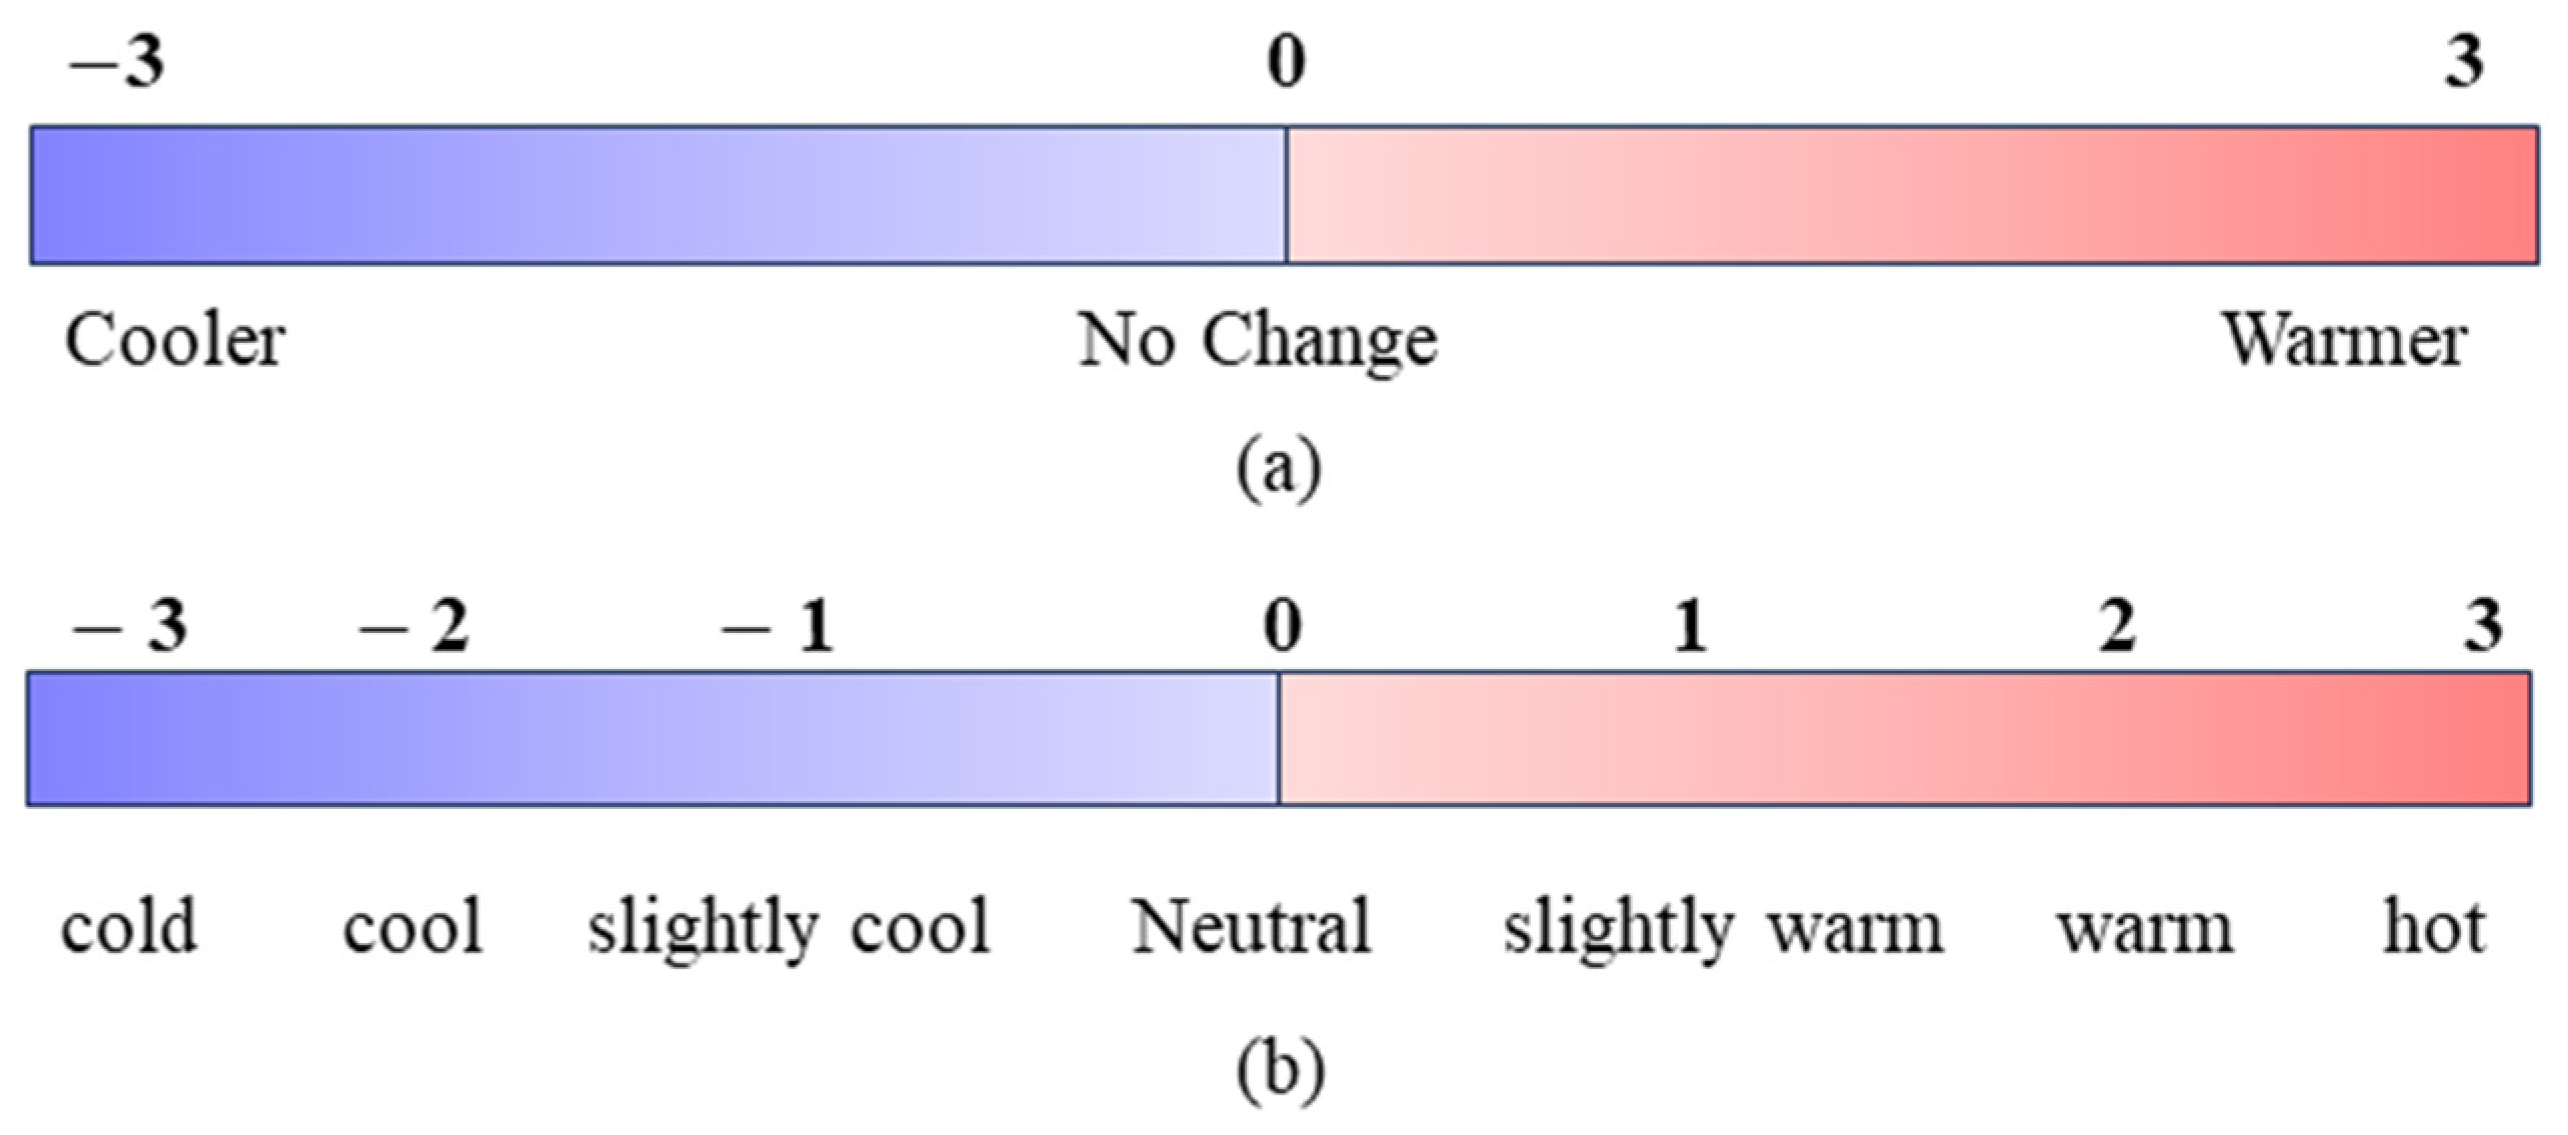
The PMV model predicts the average thermal sensation of people. This scale measures how people perceive the indoor environment and provides a consistent framework for evaluating thermal comfort. The PMV is calculated using Fanger’s heat balance equation, which establishes the relationship between the heat generated by the human body and the heat exchanged with the surrounding environment [35]. This calculation considers six key factors: air temperature, mean radiant temperature, relative humidity, air velocity, metabolic rate and clothing insulation. To provide a practical understanding of thermal sensations, PMV is often paired with sensation scales, such as the ASHRAE seven-point scale and the McIntyre Index (MCI). The ASHRAE scale captures a full range of thermal sensations from “cold” (−3) to “hot” (+3), where 0 represents a neutral thermal state. In contrast, the MCI consists of three categories for evaluation: “Cooler”, “No change” and “Warmer” [34]. These scales enhance the relevance of the PMV by contextualising calculated values within actual occupant feedback (Figure 2).
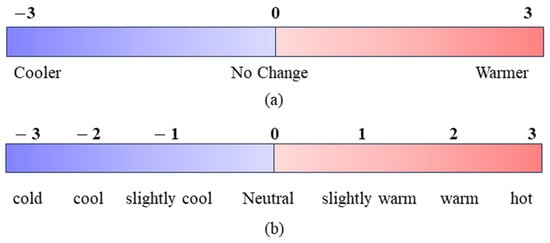
Figure 2.
(a) Thermal sensation scale MCI (McIntyre Index); (b) PMV scale [34].
With the aid of the building physics-based method, PMV performs as an essential evaluative tool for improving thermal comfort while achieving energy efficiency. It helps analyse how buildings perform thermally under different weather conditions and operational scenarios. For instance, in various environmental conditions, PMV can pinpoint times when occupants might feel too hot or too cold in the building regardless of the building’s energy consumption. This information allows for optimum actions, such as improving HVAC systems, insulation or other retrofitting solutions.
2.2. Step 2: Data Automation and Data-Driven Analysis
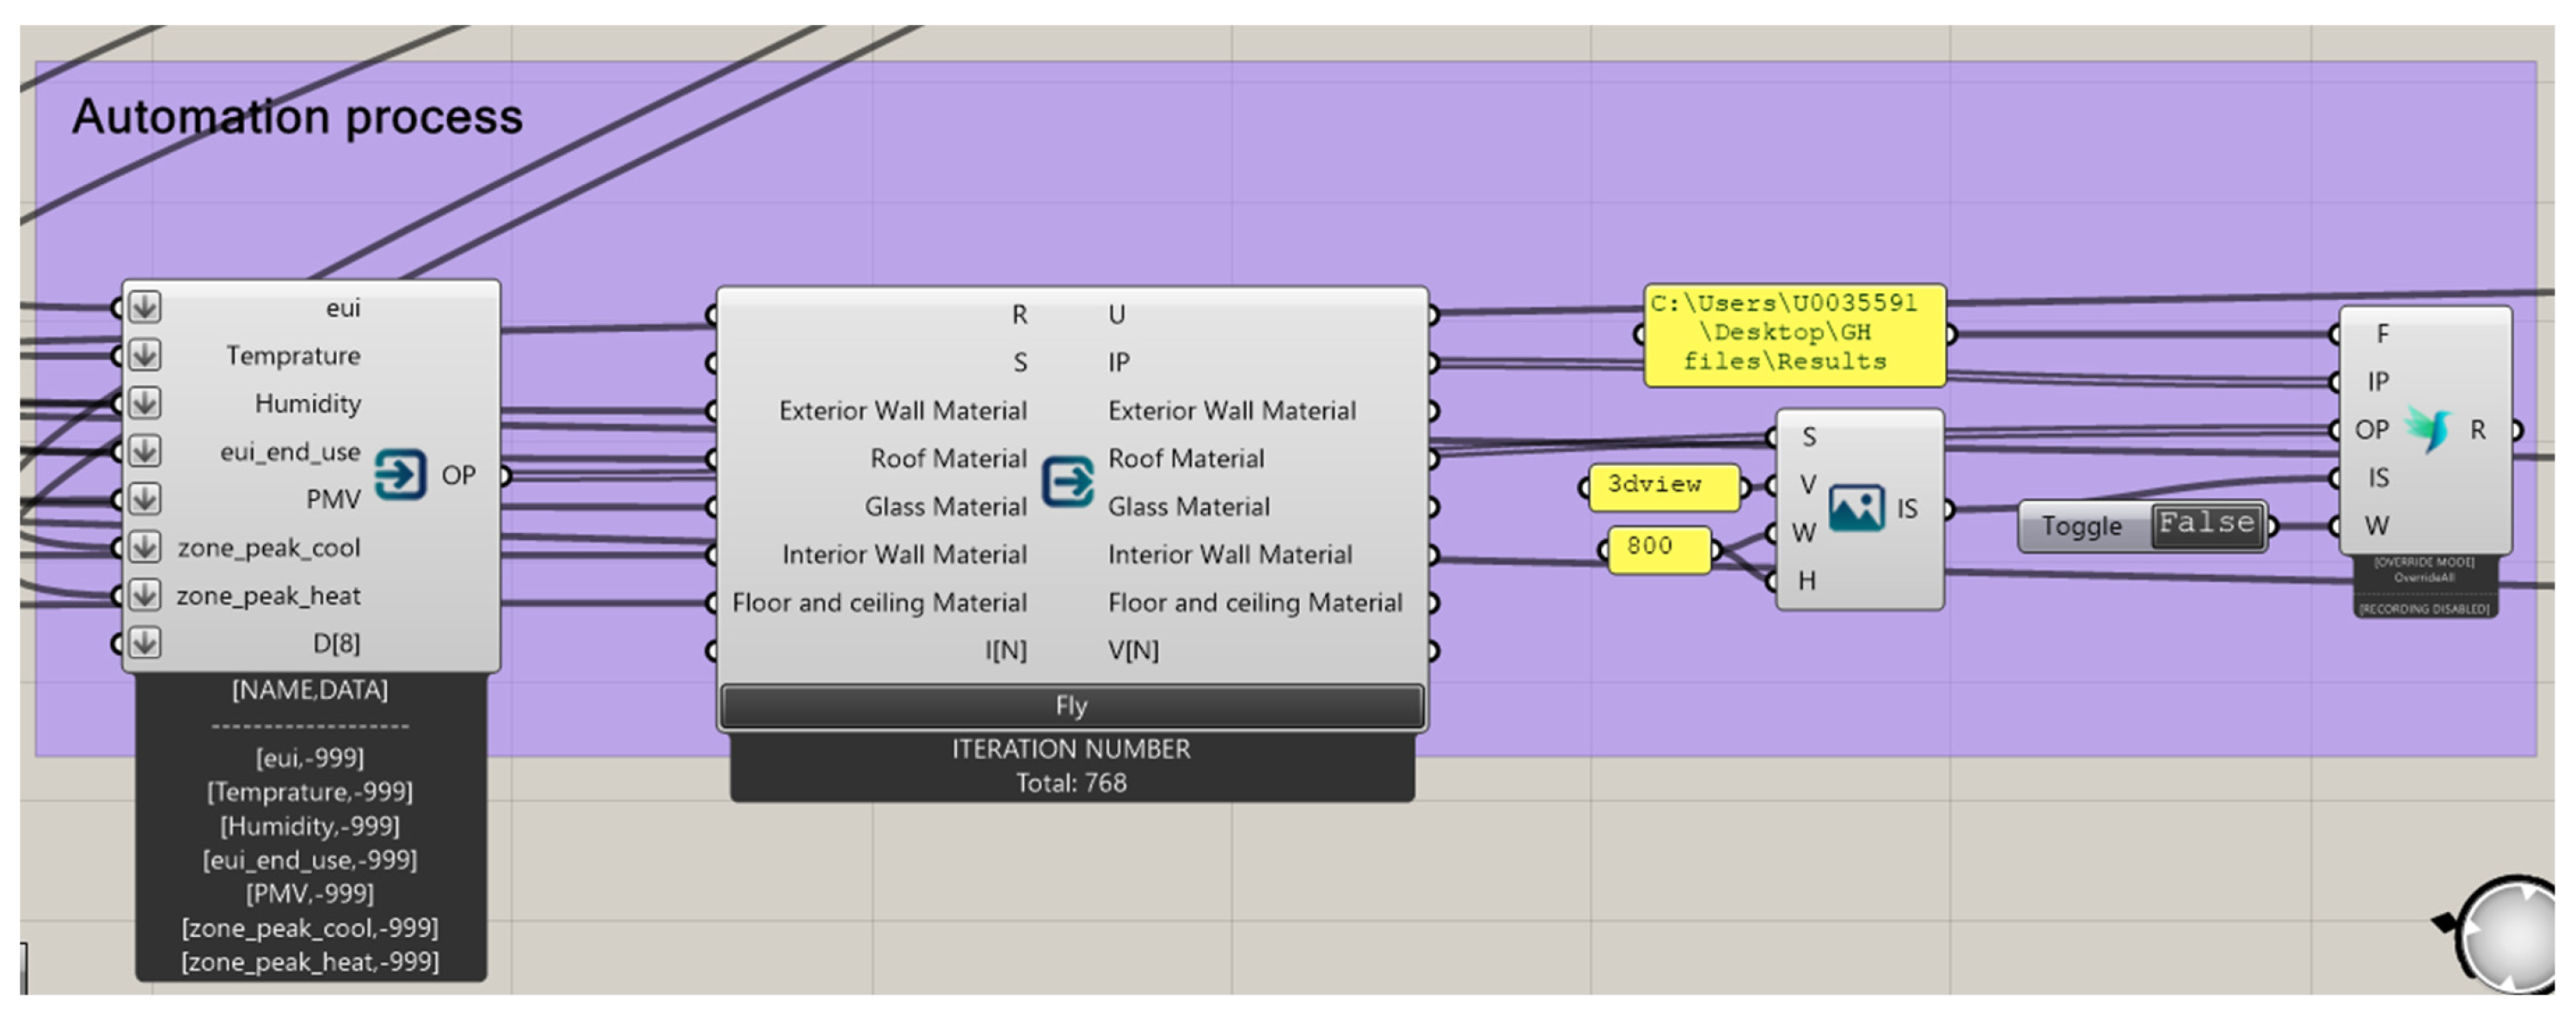
Step 2 of this study uses a part of the methodology presented by Imani et al. (2024) and focuses on two stages: data automation and data-driven analysis, to evaluate the performance of various retrofitting strategies [26]. This step uses the latest parametric design tools to generate data and applies data-driven analysis to assess the impact of different retrofitting interventions on building energy performance, as well as thermal comfort. After evaluating the baseline case study across various climate zones in Step 1, scenario analysis is conducted, and an algorithmic script is created in Grasshopper using the primary plug-ins Honeybee, Ladybug and TT Toolbox (Figure 3). Data automation was applied using TT Toolbox to systematically generate scenarios under potential retrofitting conversions. All the parameter ranges defined at this stage are aligned with the UK’s Building Regulations Part L [36]. Figure 4 illustrates the workflow of TT Toolbox and how it is used to automate data. The outputs, which are collected seasonally, are crucial for documenting how different climatic conditions and seasonal energy demands interact with retrofitting conversions. This automation process generated 3808 scenario observations (WWR, heating system, façade insulation) in total. By conducting a data-driven analysis, this step aims to evaluate the relative performance of retrofitting solutions across all four climate zones by enabling a comprehensive assessment of retrofitting options.
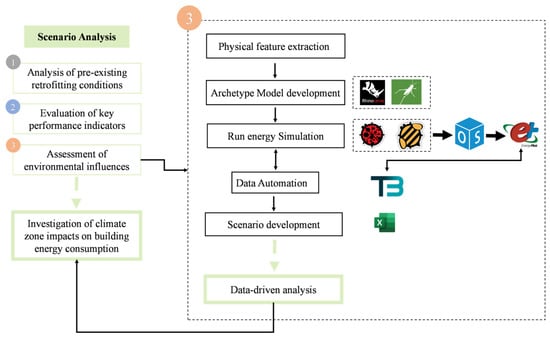
Figure 3.
Methodology for data automation.
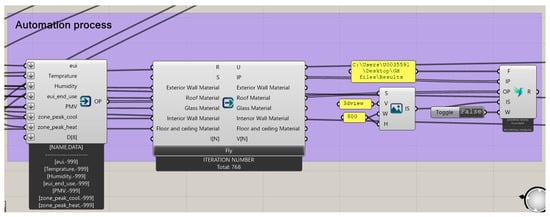
Figure 4.
Automation workflow with TT Toolbox.
The validation of this stage was performed previously by [37]. This study used the Typology Approach for Building Stock Energy Assessment (TABULA) dataset to validate energy consumption and CO2 emissions for Terraced House building typologies. According to this study, the energy needs for the baseline case study range from 61.9 to 155.2 kWh/m2 and CO2 emissions from 37.6 to 76.7 kg/m2. The calculated energy needs for this model were 152.924 kWh/m2 and CO2 emissions of 45.13502 kg/m2. The alignment of these measurements with the TABULA dataset confirms the accuracy of our simulated data.
2.3. Step 3: IOT and Physics-Based Data Validation
This study focuses on the validation of data-driven analysis results using real-time data collected through an Internet of Things (IoT) system. This step is critical for assessing the reliability and accuracy of the simulation models and allows for their comparison with empirical data collected under real-world conditions.
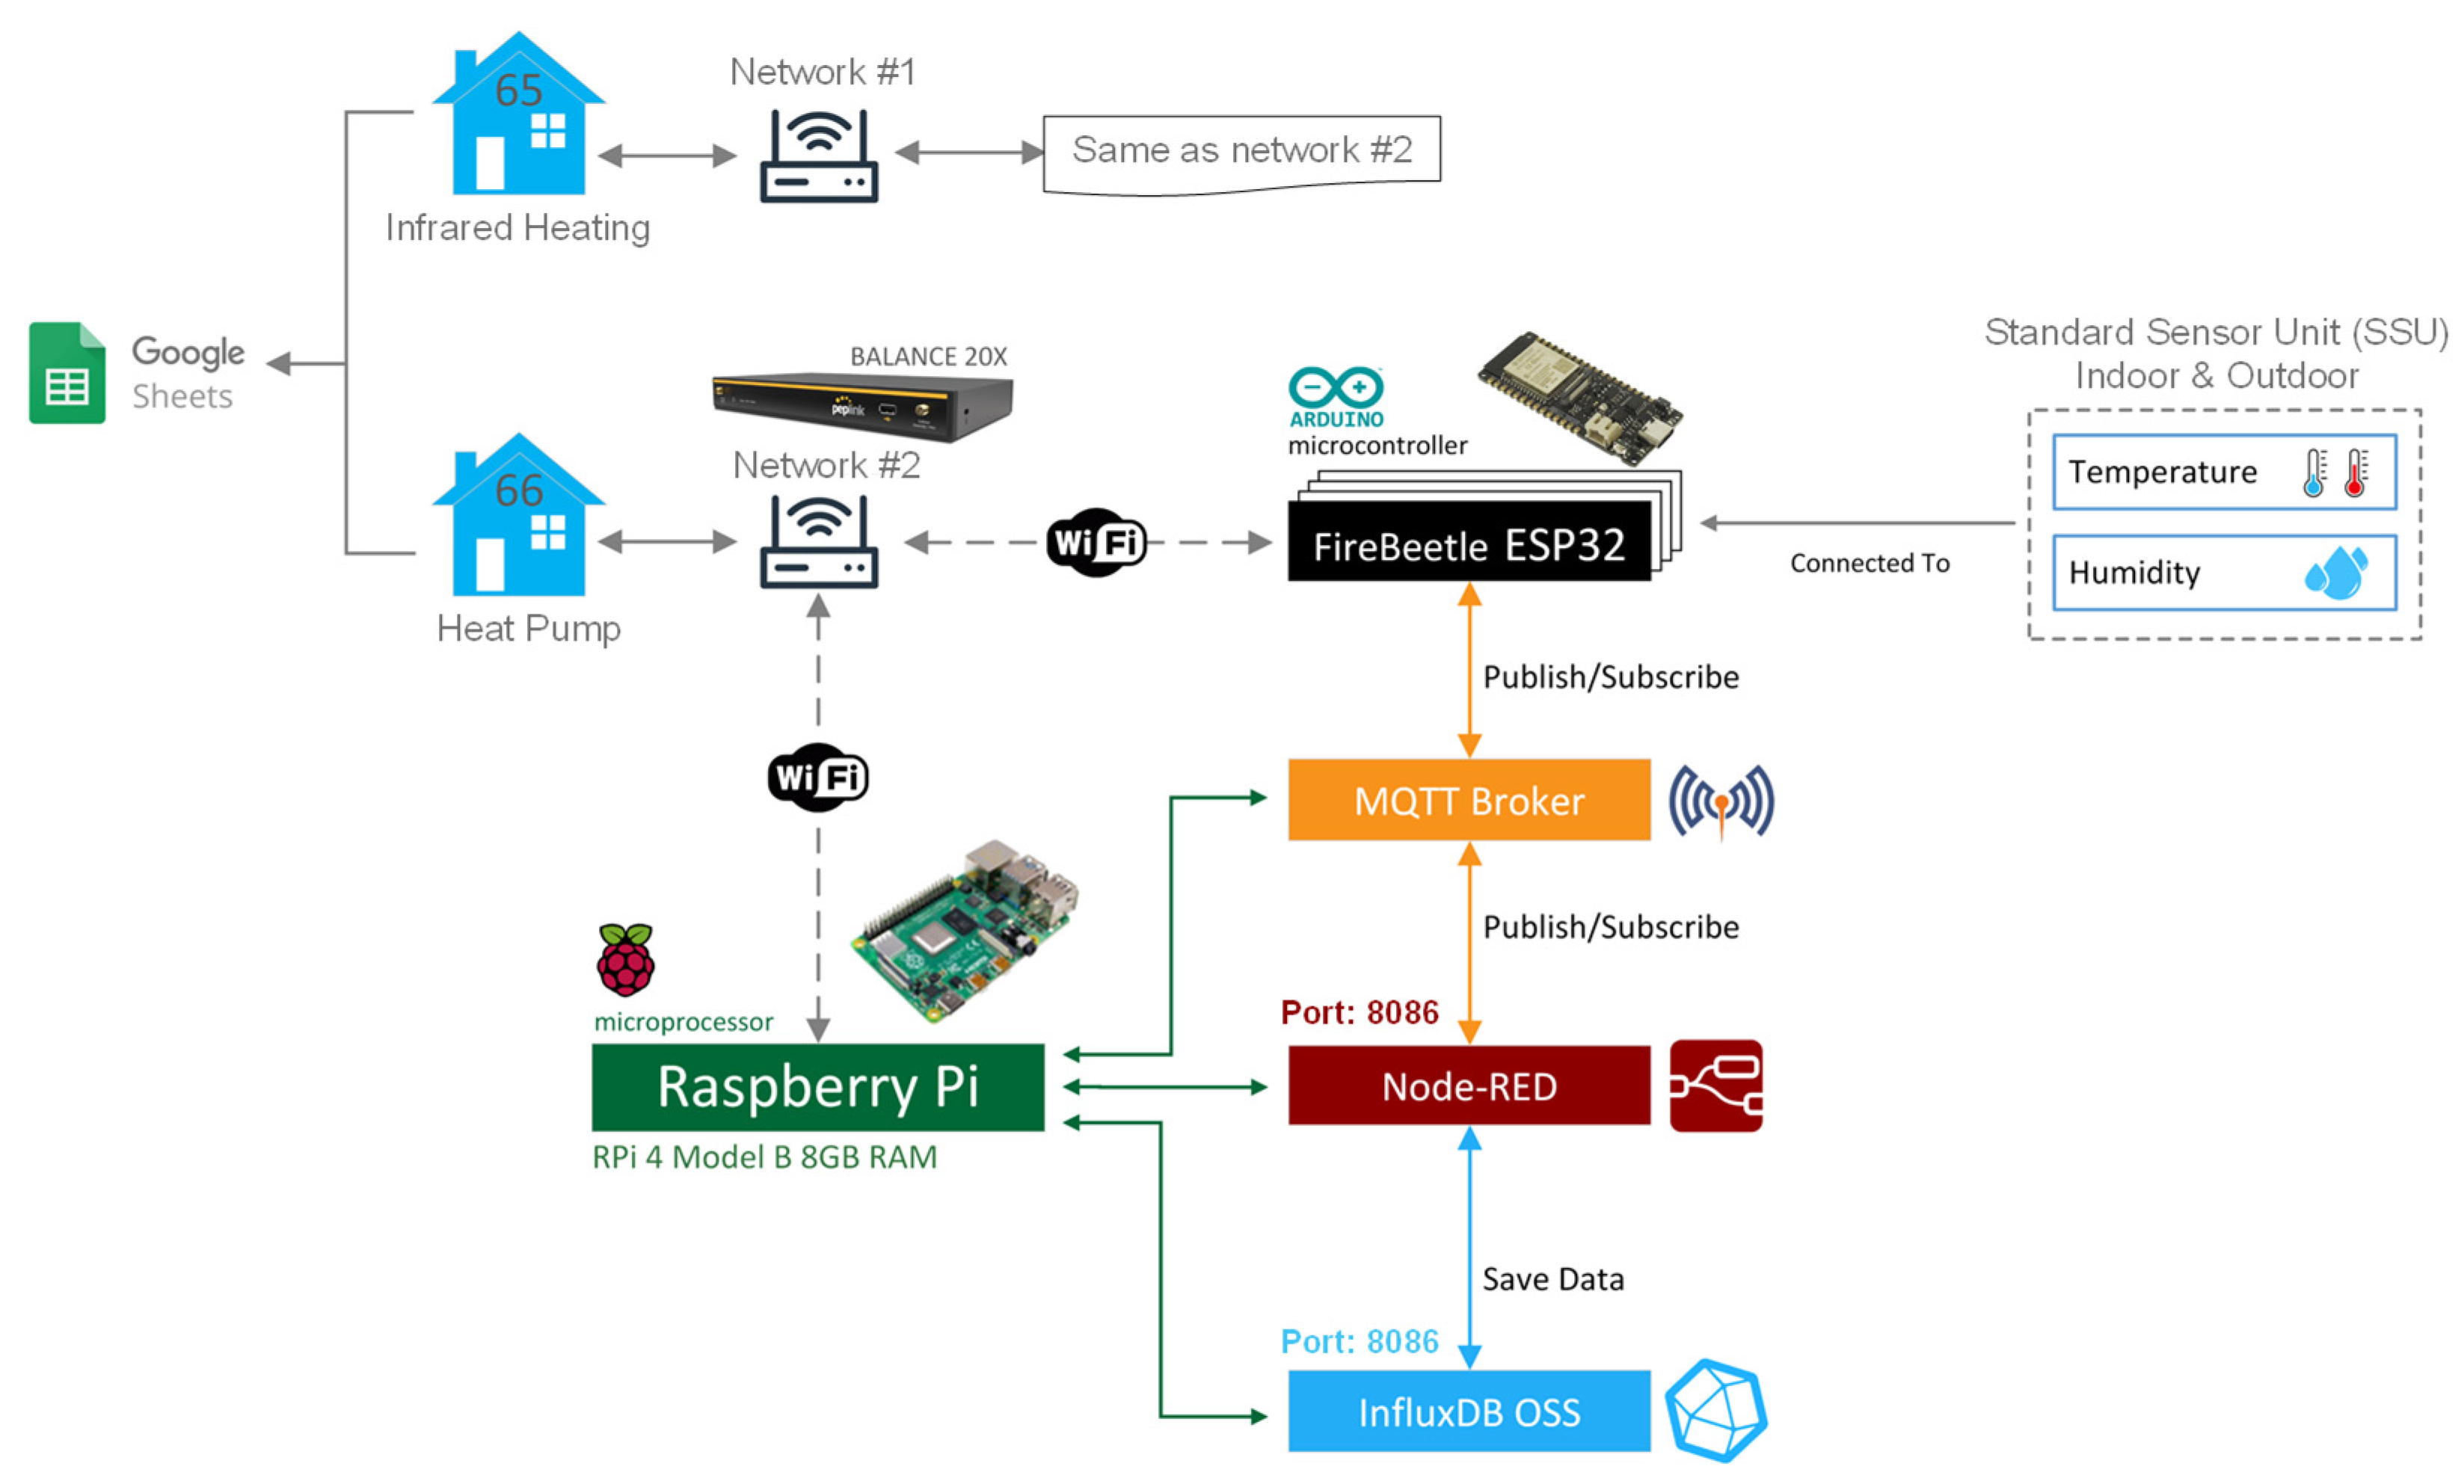
To monitor thermal comfort in buildings, this study employs a robust IoT framework inspired by [38], as illustrated in Figure 5. At the core of this system is the Raspberry Pi 4 Model B (RPi4B), which performs as a local server and collects data from various sensors. The FireBeetle ESP32 microcontrollers are programmed using Arduino IDE (version 1.8.19), an open-source platform known for its adaptability and being user friendly in hardware projects [39]. The combination of Raspberry Pi and ESP32 was selected due to their flexibility and suitability for diverse programming applications [40].

Figure 5.
Experimental setup of sensors.
For data transfer, the system integrates the FireBeetle ESP32, which has both Bluetooth and Wi-Fi capabilities. DHT22 sensors are used for collecting temperature and humidity data, which is transmitted via the MQTT protocol. This lightweight messaging protocol is optimised for secure and efficient data transmission in IoT environments. The data flow is managed by Node-RED, an open-source programming tool designed for visualising and processing IoT data outputs. In the last stage, the data are stored in InfluxDB (v2.7.1), a high-performance time-series database designed for rapid data storage and analysis [38].
3. Case Study
3.1. Simulation Case Study Description
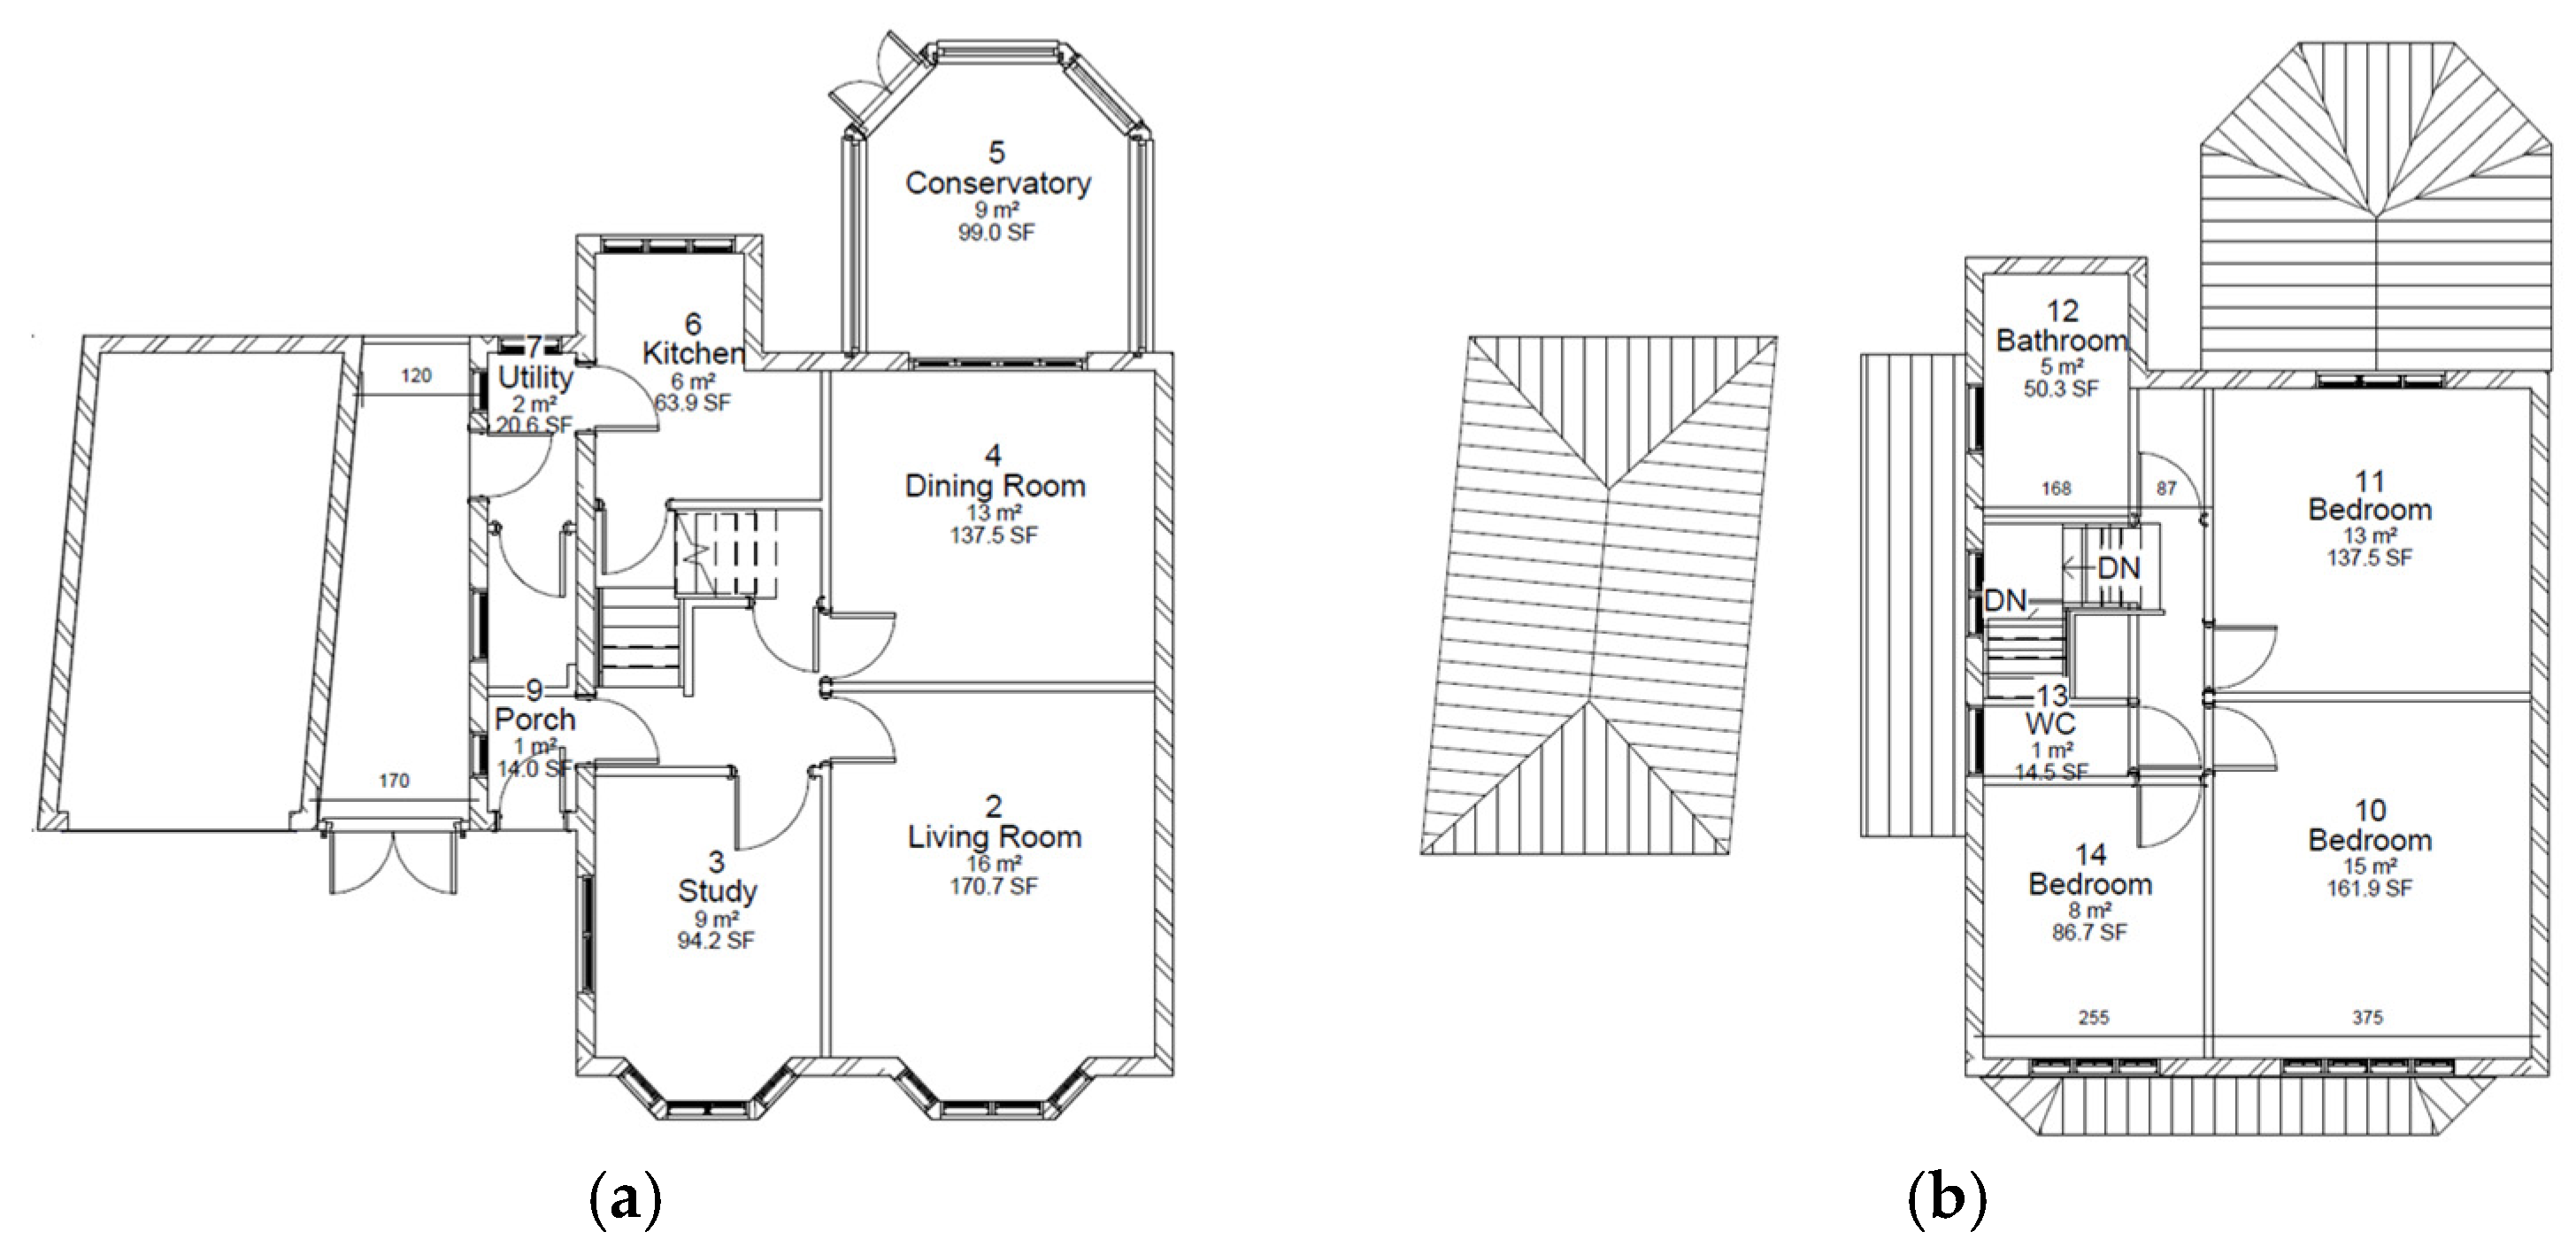
For this study, a semi-detached house was selected based on its prevalence in the UK housing stock. According to UK Government Official Statistics, semi-detached houses account for approximately 6.36 million properties, which makes them one of the most common residential building types in England and Wales. The selected house was constructed between 1981 and 1990 and aligns with a significant portion of the existing UK housing stock within this typology [41]. The house is located in London and consists of two floors, comprising a total of 14 zones (Figure 6). It has a floor space area of 65.50 m2 and a total floor area of 102.17 m2. The building’s height is 5.12 m, and it is equipped with a traditional gas boiler heating system.
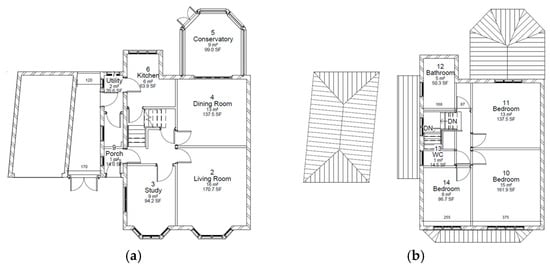
Figure 6.
Floor plans of the case study house: (a) ground floor plan; (b) first floor plan.
Based on the existing building features, the window-to-wall ratio (WWR) in the building is 0.4 on the north side, 0.3 on the south side, and 0.3 on the west side. Since model simplification is a widely accepted practice in building energy performance simulations, minor modifications were applied to the energy model in this study to reduce the simulation complexity and time. For this scenario, the roof was defined as a flat roof instead of a gable roof. Chatzivasileiadi et al. (2018) demonstrated that reducing geometric complexity by up to 50% can have negligible effects on energy simulation accuracy, provided that key thermal and energy properties are maintained [42].
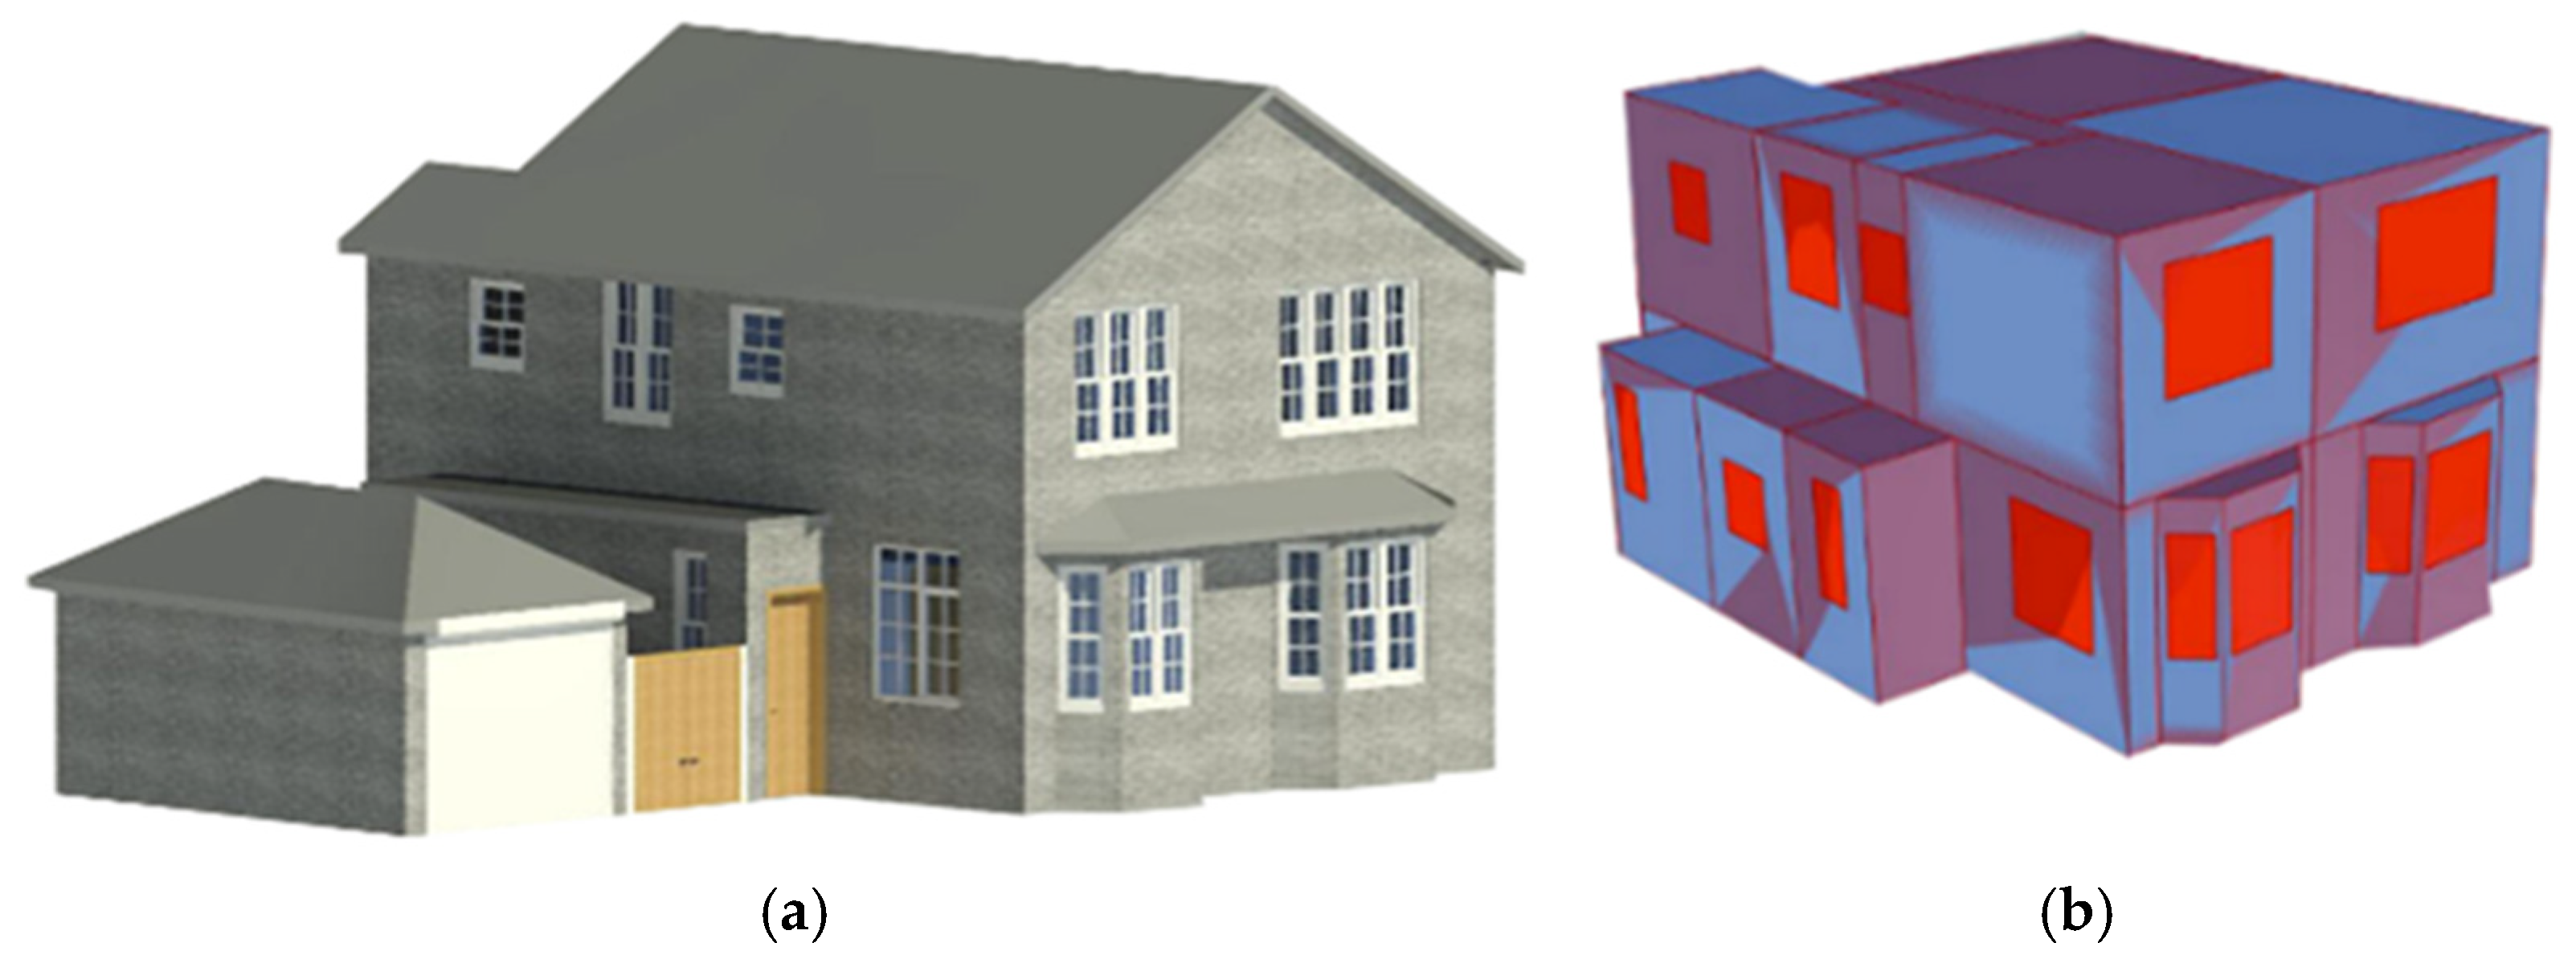
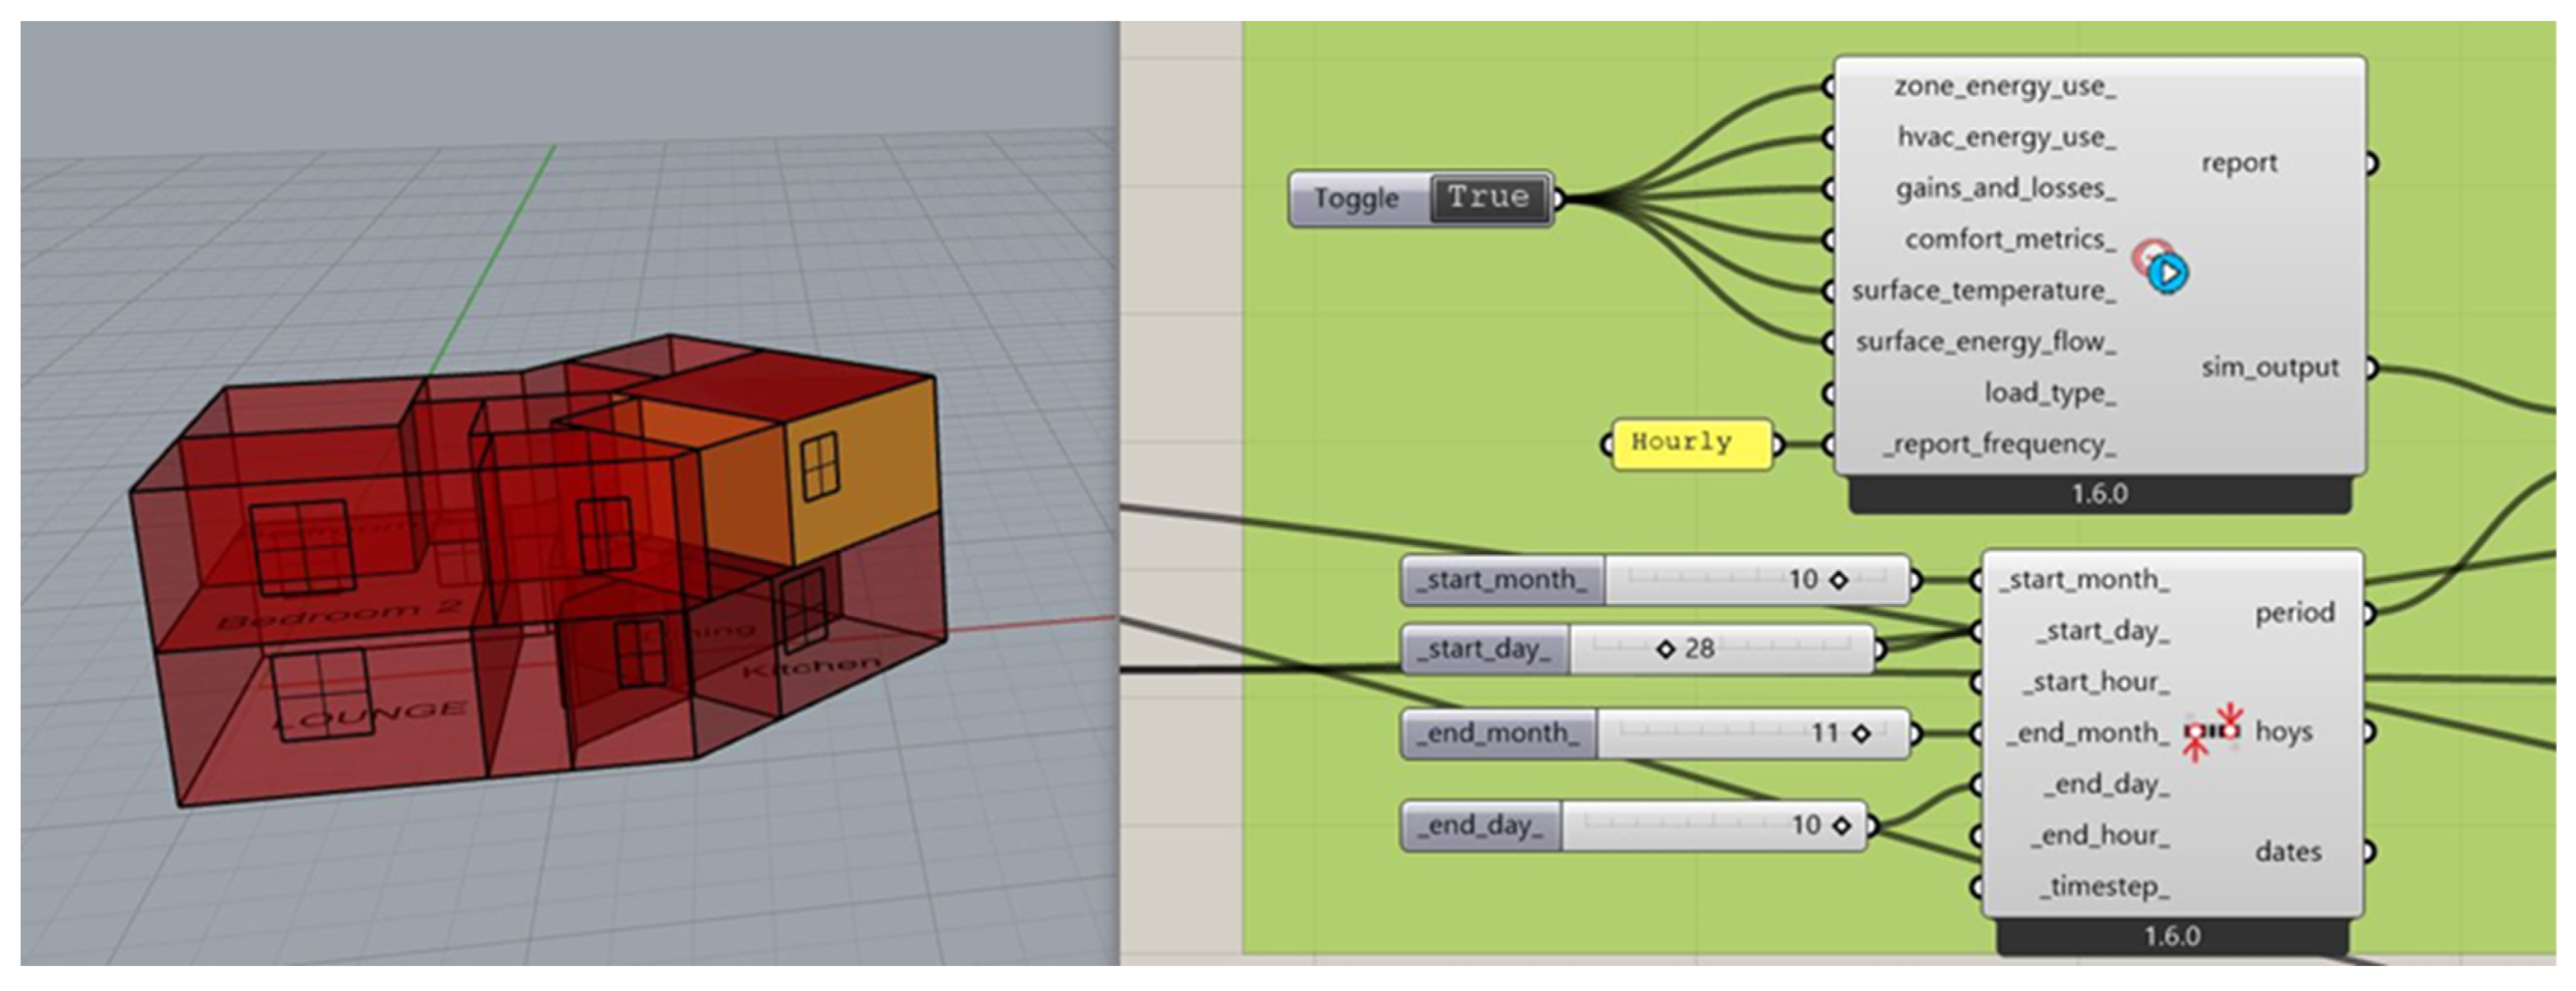
All physical features were extracted and used to generate a 3D model of the building in the Rhino (Version 7 SR29) environment. Subsequently, the parametric energy model of the building was generated using advanced tools, such as Grasshopper (Version 1.0.0007) for parametric algorithms and Ladybug (1.7.26), Honeybee (1.6.0) and EnergyPlus (Version 23.2.0) for an environmental analysis and energy simulations (Figure 7).

Figure 7.
(a) Revit model of the case study; (b) the energy model of case study, where red shades represent windows, and blue shades indicate the façade and external walls of the building.
Detailed weather data specific to the building’s location was imported from EnergyPlus weather files (EPW). These files provide accurate climatic parameters, such as the temperature, humidity, solar radiation and wind patterns, which are critical for accurate energy performance simulations. The weather data were analysed and incorporated into the simulation framework to reflect the microclimatic conditions of the building’s location, ensuring a realistic representation of its energy needs and thermal comfort performance. The thermal performance of the simulated building facade presented in Table 1.

Table 1.
Thermal performance of building facade materials.
3.2. Weather Conditions for Case Study Simulation
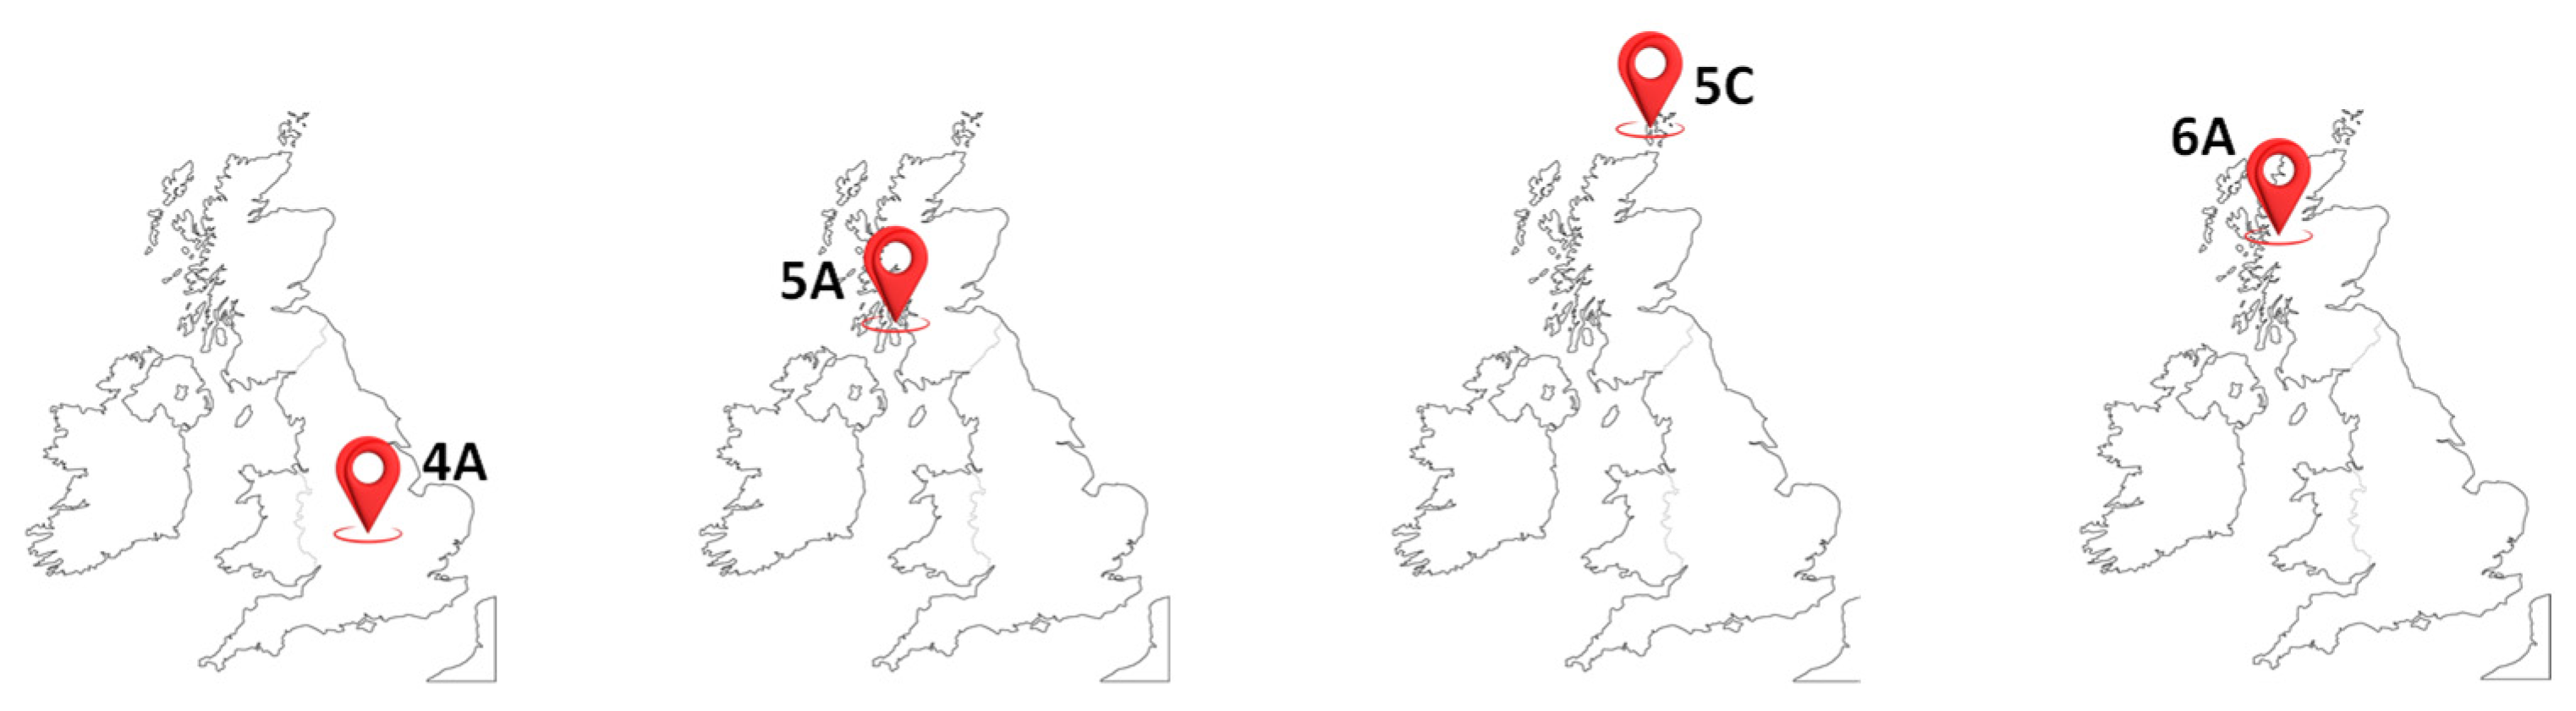
The main objective of this study is to investigate and analyse building energy performance and thermal comfort across diverse climate zones within the UK. The aim is to understand whether various climate conditions in the UK influence the energy performance of buildings and how this helps in conducting effective and climate-responsive retrofitting solutions. A climate zone analysis is a key factor in understanding the interaction between buildings and their environment. Buildings in different climate zones have varying energy needs in terms of heating and cooling demands, as well as differing thermal performances. Adapting retrofitting solutions to each climate zone is essential for improving energy efficiency and thermal comfort. According to the ASHRAE report, the UK has six different climate zones. The most common is Climate Zone 5A (Cool–Humid), covering 136 regions, mostly in Scotland and Northern England. Climate Zone 4A (Mixed–Humid) is also widespread, covering 94 regions, primarily in Southern England and Wales. Climate Zone 5C (Cool–Marine) is found in 13 regions, mainly offshore and in some residential regions. Climate Zone 6A (Cold–Humid) is present in three regions in northern Scotland and indicates areas with colder conditions (Figure 8). Additionally, Climate Zones 3A (Warm–Humid) and 7 (Very Cold) are found in some offshore and non-residential areas; therefore, these two climate zones will not be considered for evaluation in this study [43].
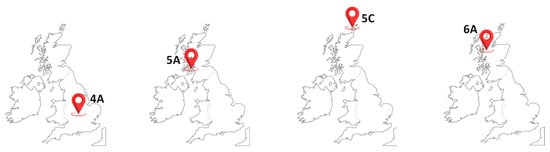
Figure 8.
Selected climate zones in the UK for analysis.
3.3. Simulation Period and Seasonal Breakdown
Energy data were collected for the case study building to support a detailed performance analysis. Simulations were conducted separately for each season to record the seasonal variations in energy consumption and thermal performance. The seasons were defined as follows: spring (March to May), summer (June to August), autumn (September to November) and winter (December to February). This approach aims to understand how the building behaves in various climatic conditions throughout the year. The results of this analysis help to establish a solid baseline and identify the necessary interventions. They also help to determine the seasonal changes that require retrofitting to enhance performance in each specific condition.
4. Results and Discussion
4.1. Energy Performance Analysis
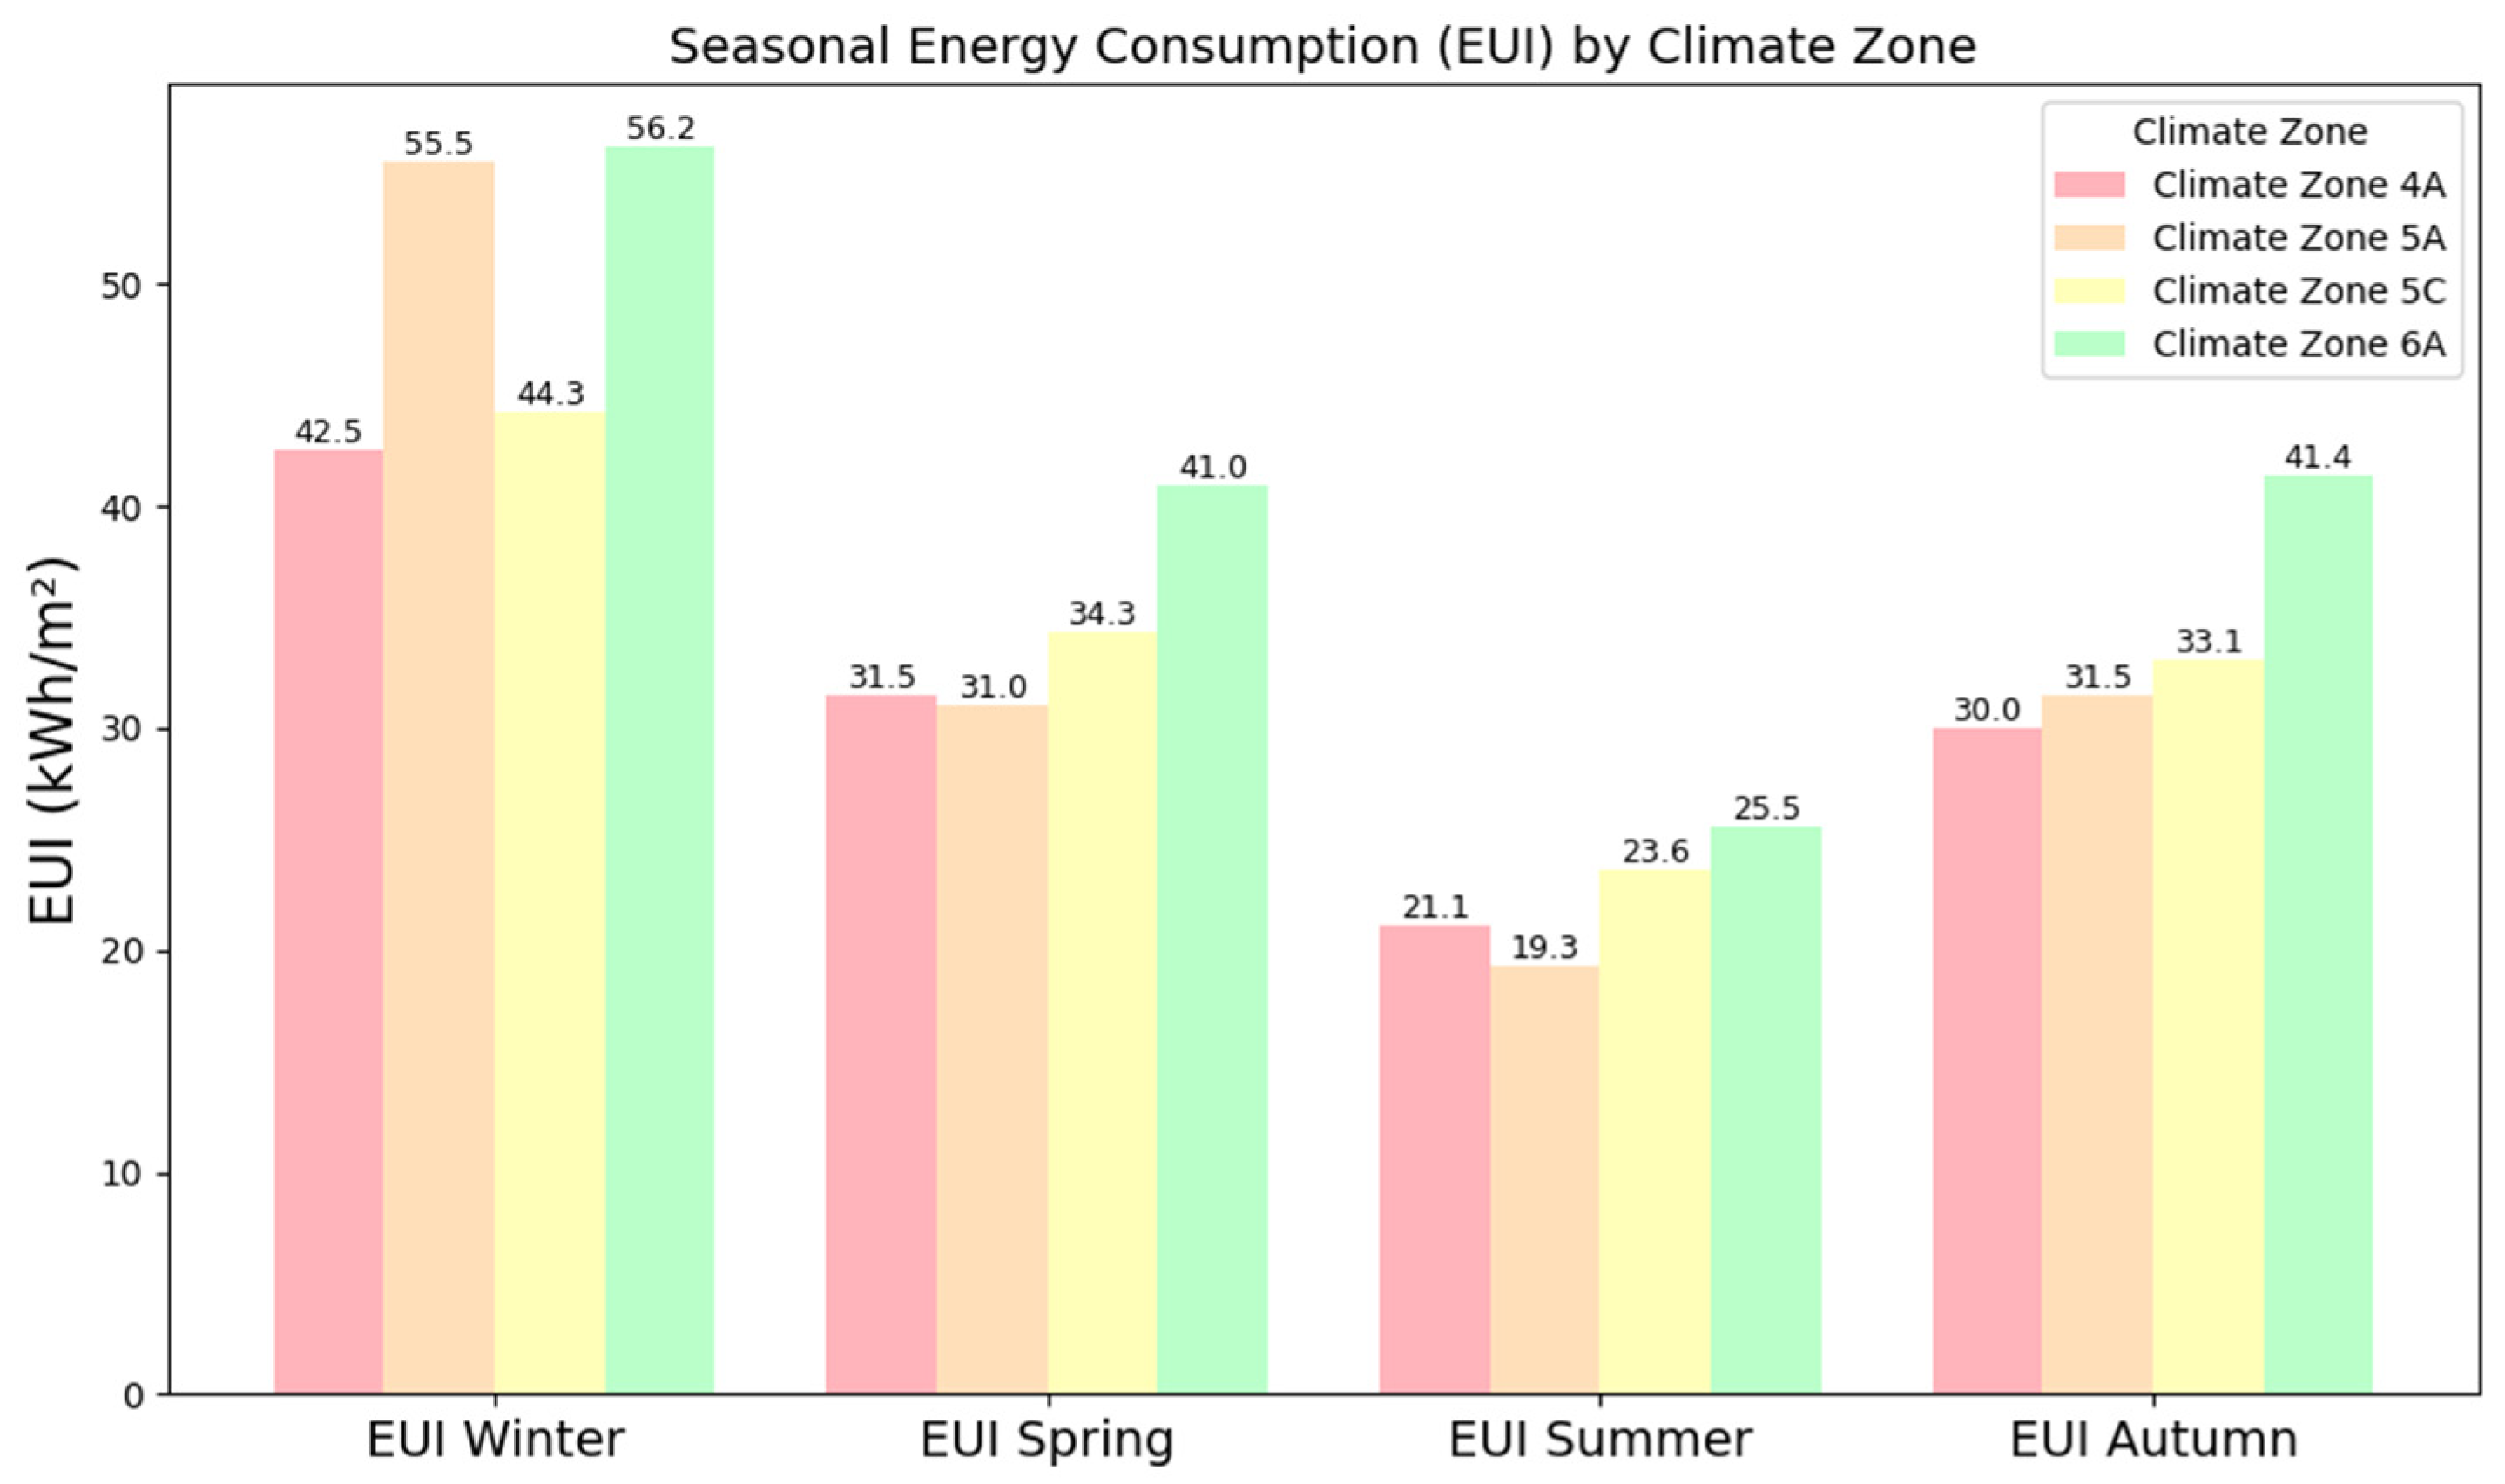
The energy performance analysis of the baseline case study was conducted across four UK climate zones: 4A (Mixed–Humid), 5A (Cool–Humid), 5C (Cool–Marine) and 6A (Cold–Humid). The analysis shows significant seasonal variations and highlights the impact of climatic conditions on the energy behaviour of the buildings. The Energy Use Intensity (EUI) in each region emphasises how the building’s performance depends on the climate and seasonal conditions (Figure 9).
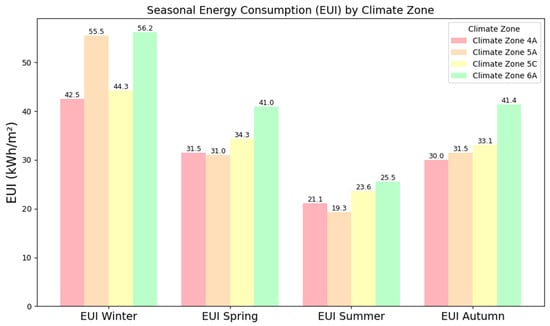
Figure 9.
Seasonal EUI across various climate zones.
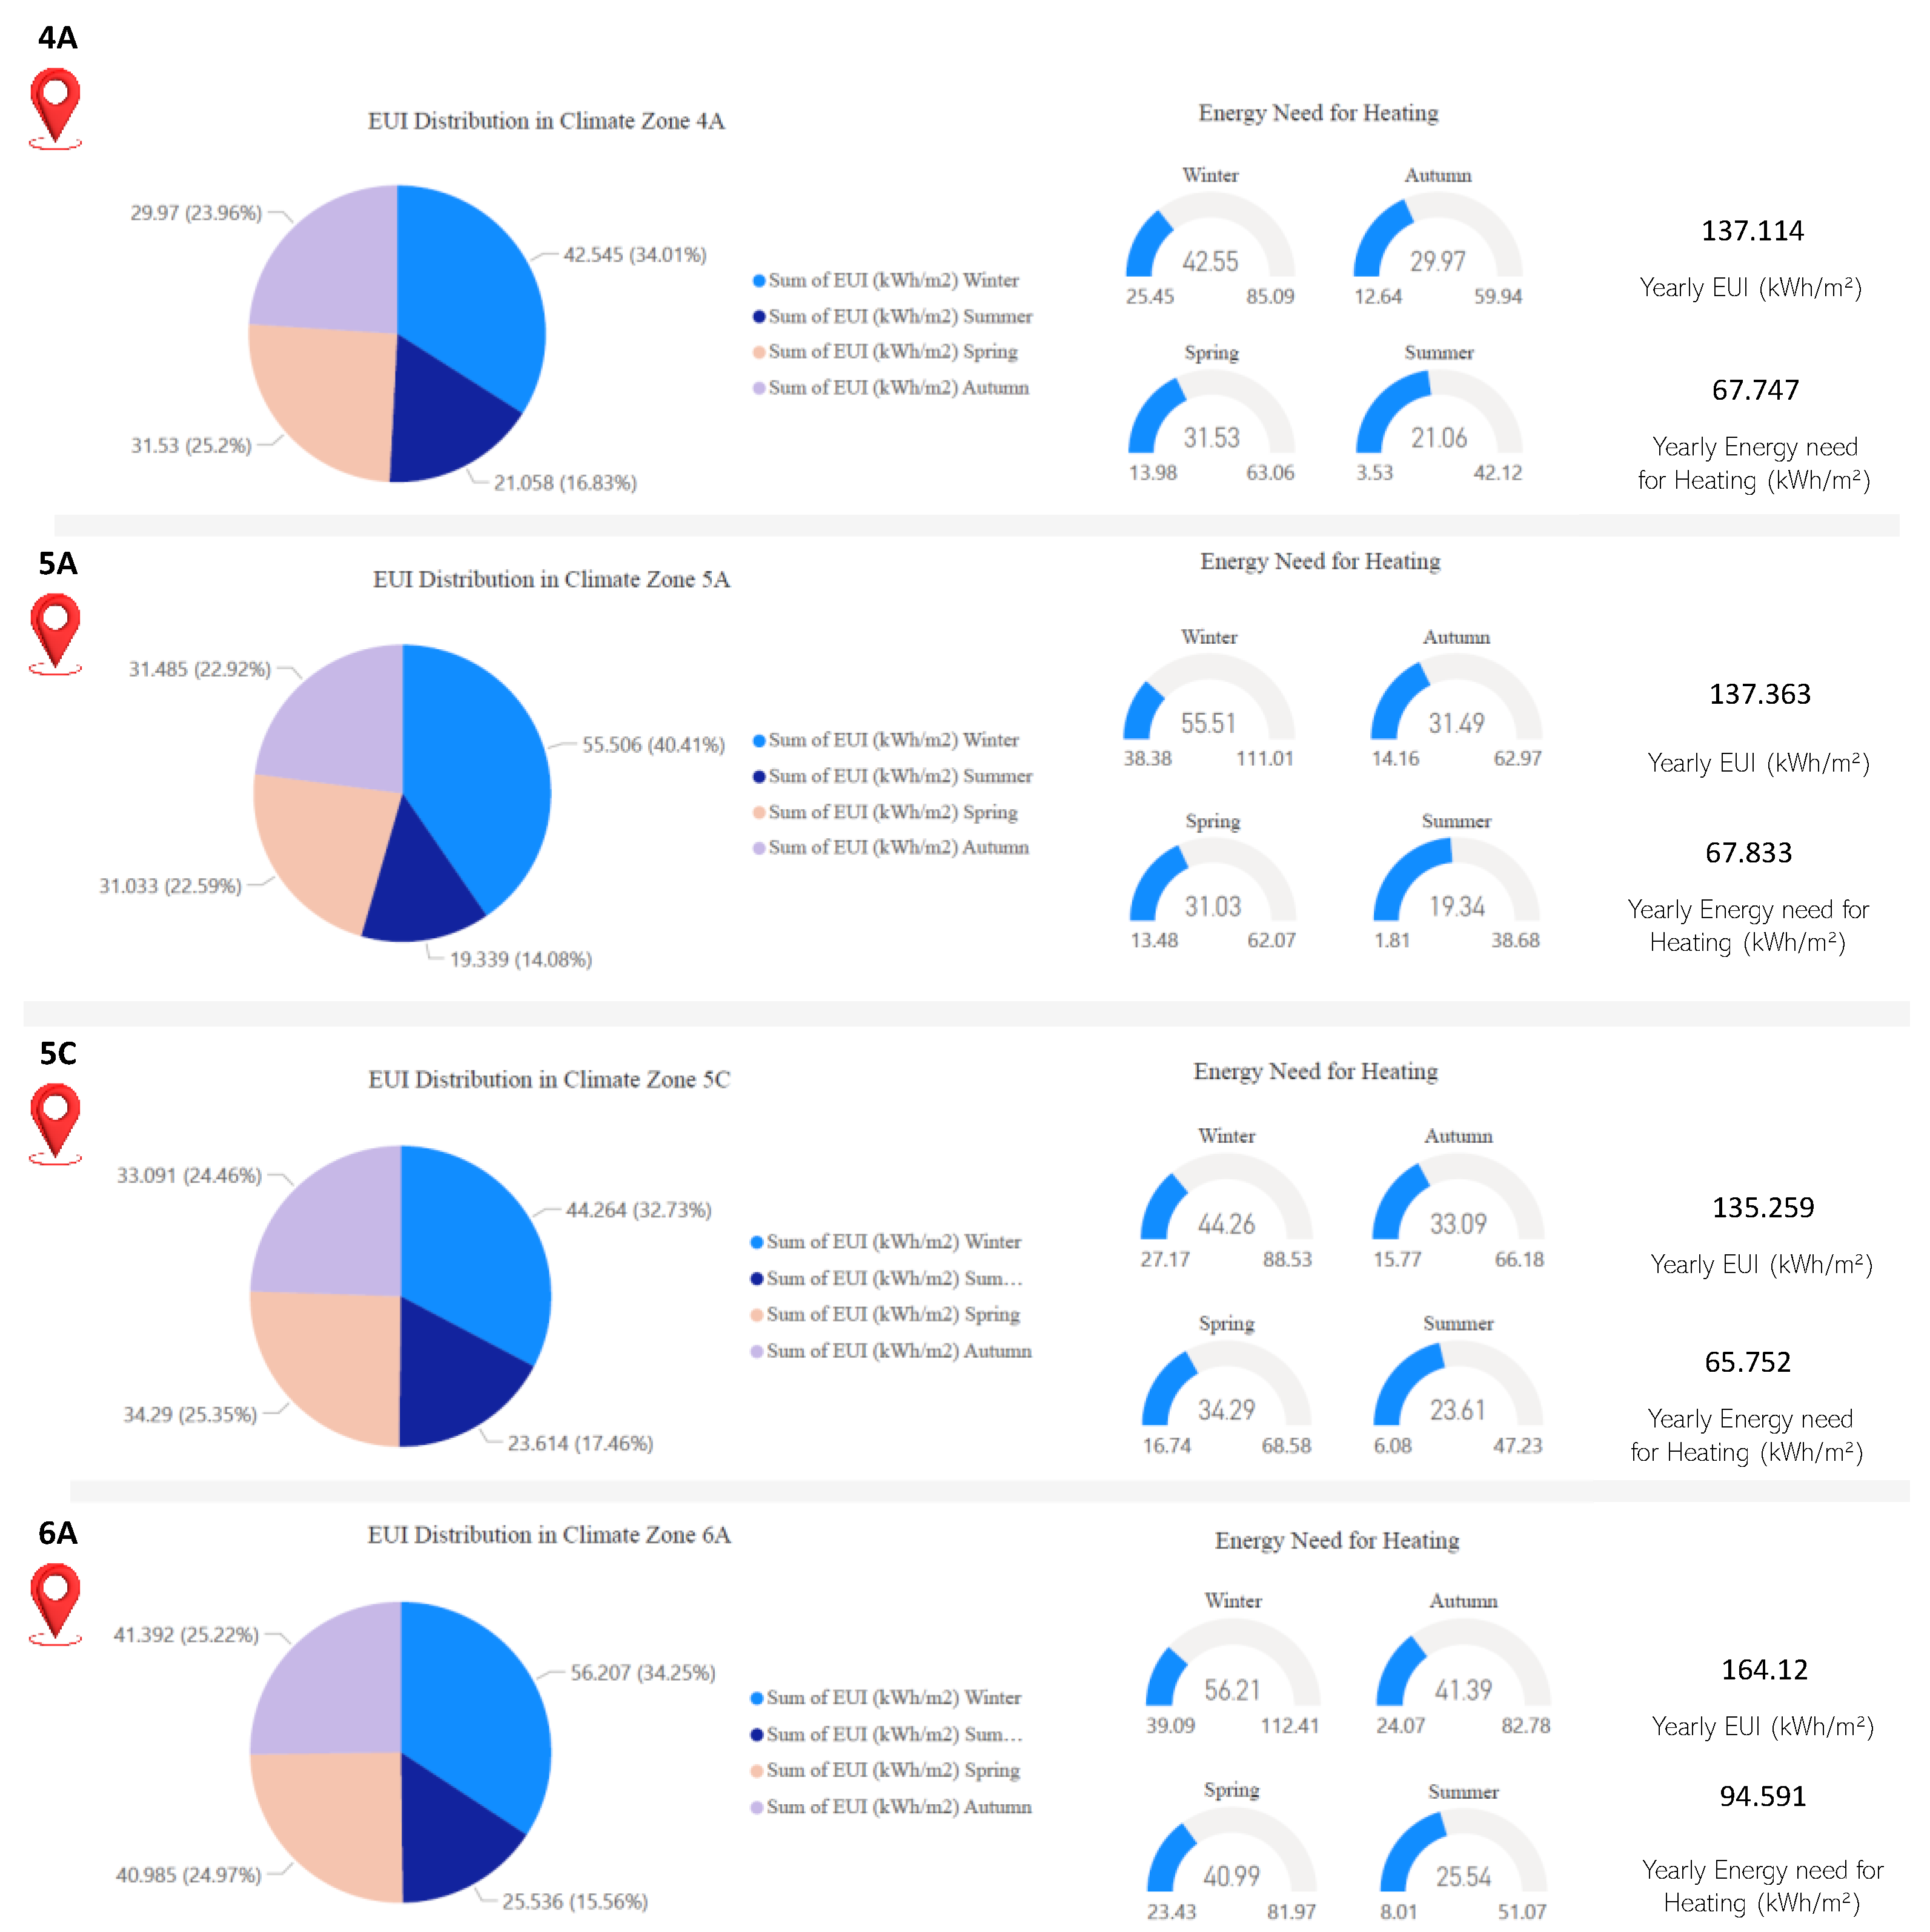
As illustrated in Figure 10, climate Zone 4A is the mildest among the studied zones and shows a balanced energy profile. During winter, heating accounts for nearly 60% of the seasonal EUI, which is relatively low at 42.54 kWh/m2. During spring and autumn, energy consumption decreases even more, with heating accounting for 44% in spring and 42% in autumn of the seasonal energy use. Summer energy consumption is minimal, with EUI at 21.05 kWh/m2, and negligible heating or cooling demands. In contrast, Zone 5A has higher winter energy consumption with heating accounting for about 69% of the winter energy use, at approximately 55.51 kWh/m2. Spring and autumn energy use is slightly lower than in Zone 6A, with heating accounting for 43% and 45% of the seasonal EUI. The summer energy demand is significantly reduced, with an EUI of 19.34 kWh/m2, and heating contributes only 9%, reflecting the zone’s milder summer conditions. Zone 5C, with maritime conditions, shows a moderated energy profile. In winter, heating contributes 61% of the seasonal EUI, which is 44.26 kWh/m2. Energy use in spring and autumn is relatively consistent with heating, accounting for 49% and 48% of the seasonal EUI, respectively. During summer, the energy demand is low with an EUI of 23.61 kWh/m2. This shows the zone’s balanced seasonal behaviour due to smaller temperature changes. In comparison, Zone 6A as a cold and humid climate, has the highest energy demand in winter, with heating contributing to 69.5% with the peak EUI of 56.21 kWh/m2. Heating needs remain high in spring and autumn with 58% and 59% of the seasonal EUIs, which are 40.99 kWh/m2 and 41.39 kWh/m2, respectively. Even in summer, heating contributes 31% to the EUI of 25.54 kWh/m2 and shows the year-round reliance on heating in this colder climate.

Figure 10.
EUI and energy needs for heating analysis for climate zones.
The findings clearly show how the EUI and energy demand for heating differ across the various climate zones. Zone 6A has the highest annual demand for heating, with nearly 70% of its seasonal energy use. Similarly, Zone 5A also experiences high heating needs during winter; however, heating in summer is very low. In contrast, Zone 5C, due to its coastal location, experiences a more steady pattern of energy use throughout the year because of milder seasonal changes. Compared to all other climate zones, Zone 4A has the mildest climate and demands the lowest amount of heating in all seasons. With colder zones relying more on heating than milder regions, these differences demonstrate how regional temperature variations affect energy consumption.
4.2. Thermal Comfort Evaluation
The PMV chart presented in Section 2.1.2 is used as a comprehensive evaluation of thermal comfort levels for the baseline case study in this section. This analysis is conducted using a physics-based simulation model that is applied separately to each season and climate zone. The model incorporates a range of environmental and occupant-related- factors to assess the indoor thermal conditions. To simulate actual occupant conditions, the analysis uses specific parameter ranges for clothing insulation (0.5–1.5 clo) and the metabolic rate (1.0–1.3 MET). These parameters ensure the accuracy and relevance of the results and align with international standards.
A typical outfit, such as a long-sleeved shirt and pants, which is appropriate for moderate indoor environments, is represented by the clothing parameter of 0.7 clo in this study. The metabolic rate is defined as 1.2 MET, which is defined as an individual engaged in light activity, such as standing. These parameters reflect realistic occupant behaviours and ensure that the PMV analysis remains contextually accurate. Given that the baseline case study lacks a mechanical ventilation system, the air velocity is defined as 0.1 m/s, simulating a low-air-speed environment typical of naturally ventilated or minimally ventilated buildings. This assumption is critical in capturing the building’s thermal performance under passive conditions, as it mirrors the real-world limitations of buildings without advanced HVAC systems. Air temperature and relative humidity data are collected hourly for each season. These data provide detailed insights into how the building responds to various climatic conditions. Additionally, the analysis separately examines the thermal performance of the ground floor and the first floor to provide a comparative perspective on how different levels within the same building respond to the same external conditions. For analysing thermal comfort, the yearly average of the air temperature and relative humidity was calculated for each climate zone.
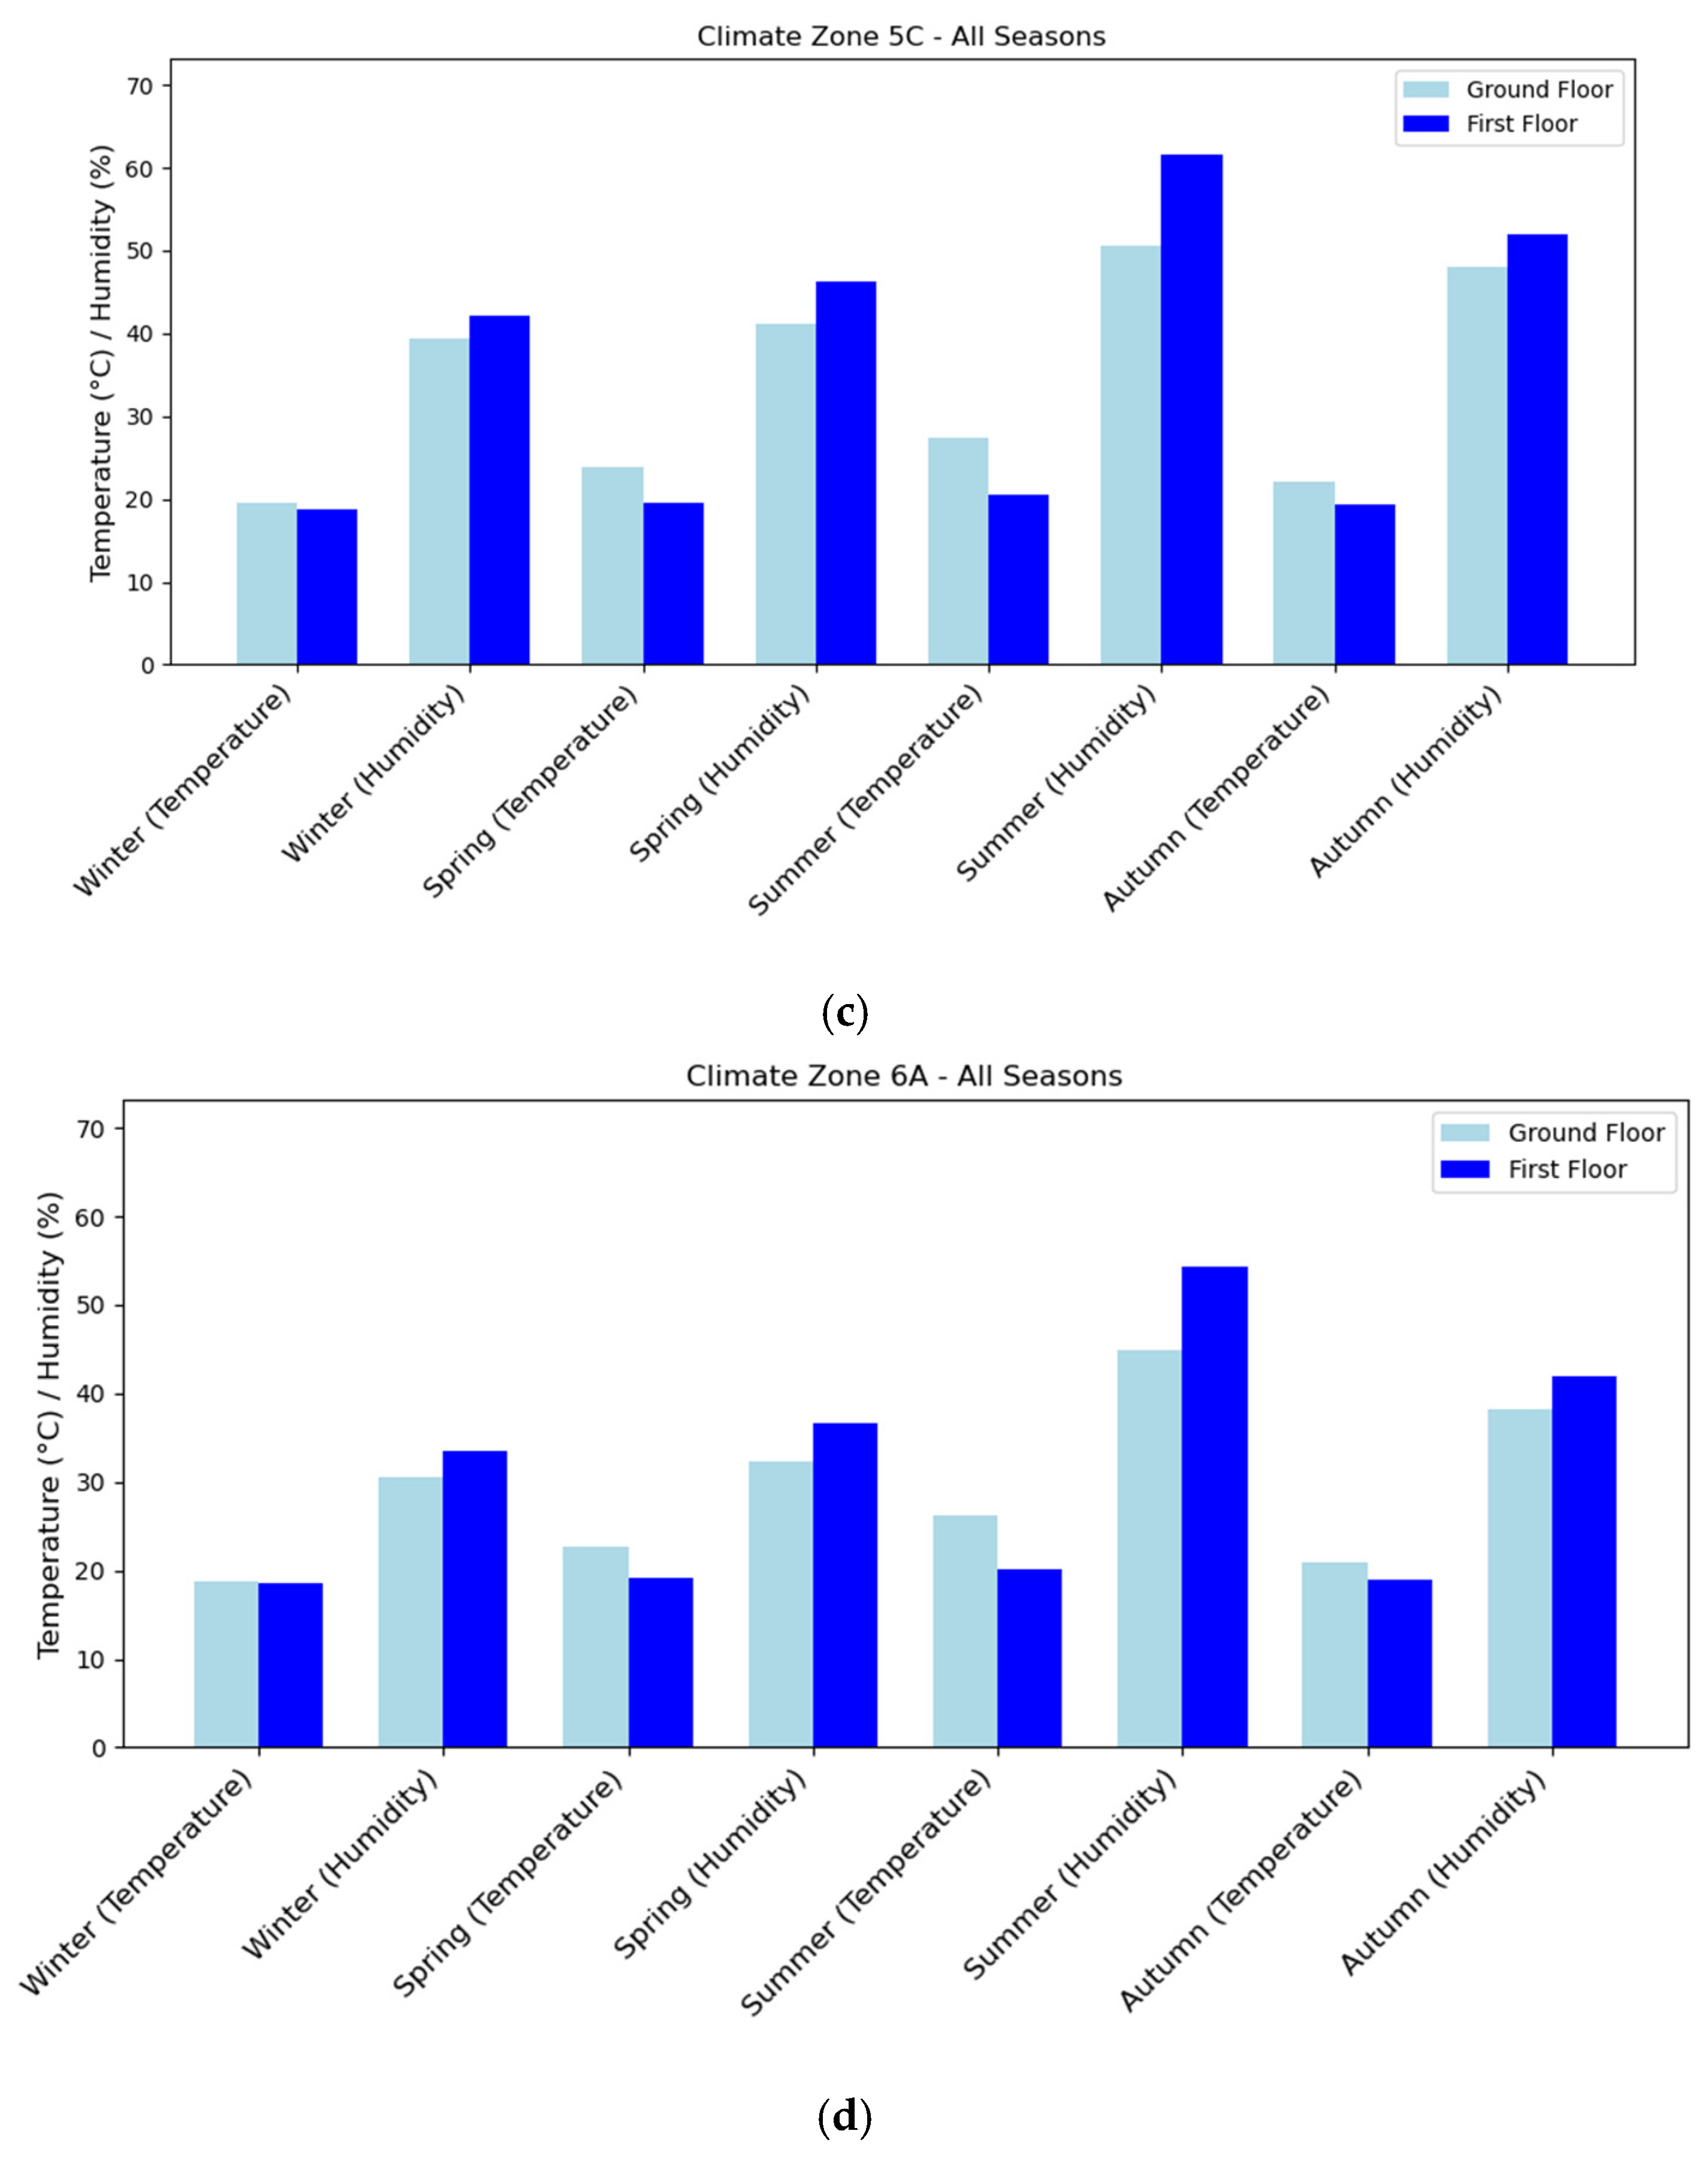
The analysis of the baseline case study across four climate zones (4A, 5A, 5C and 6A), as illustrated in Figure 11, highlights substantial variations in the temperature, humidity and consequently, their effects on thermal comfort throughout the year. Temperature and humidity levels vary significantly across the climate zones, with extreme seasonal differences.
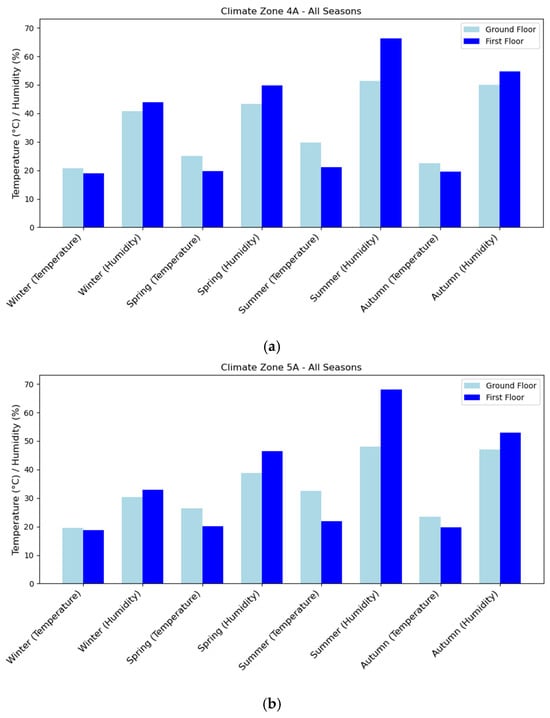
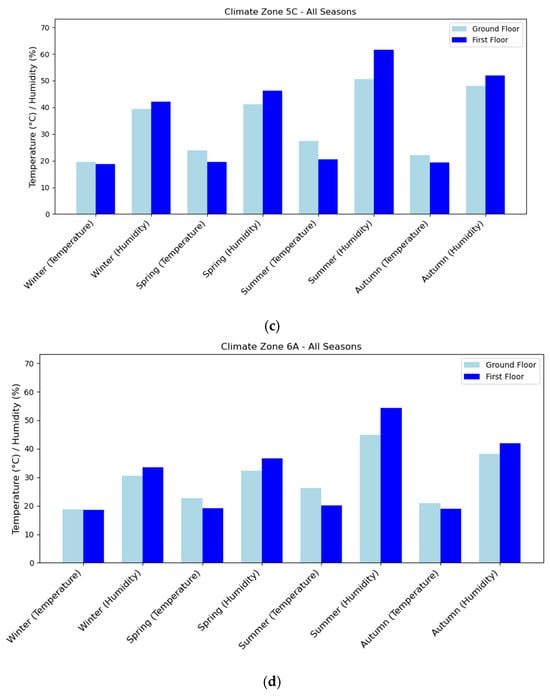
Figure 11.
Seasonal temperature and humidity variations in Climate Zone 4A (a), Climate Zone 5A (b), Climate Zone 5C (c) and Climate Zone 6A (d). The vertical axis represents temperature (°C) and humidity (%).
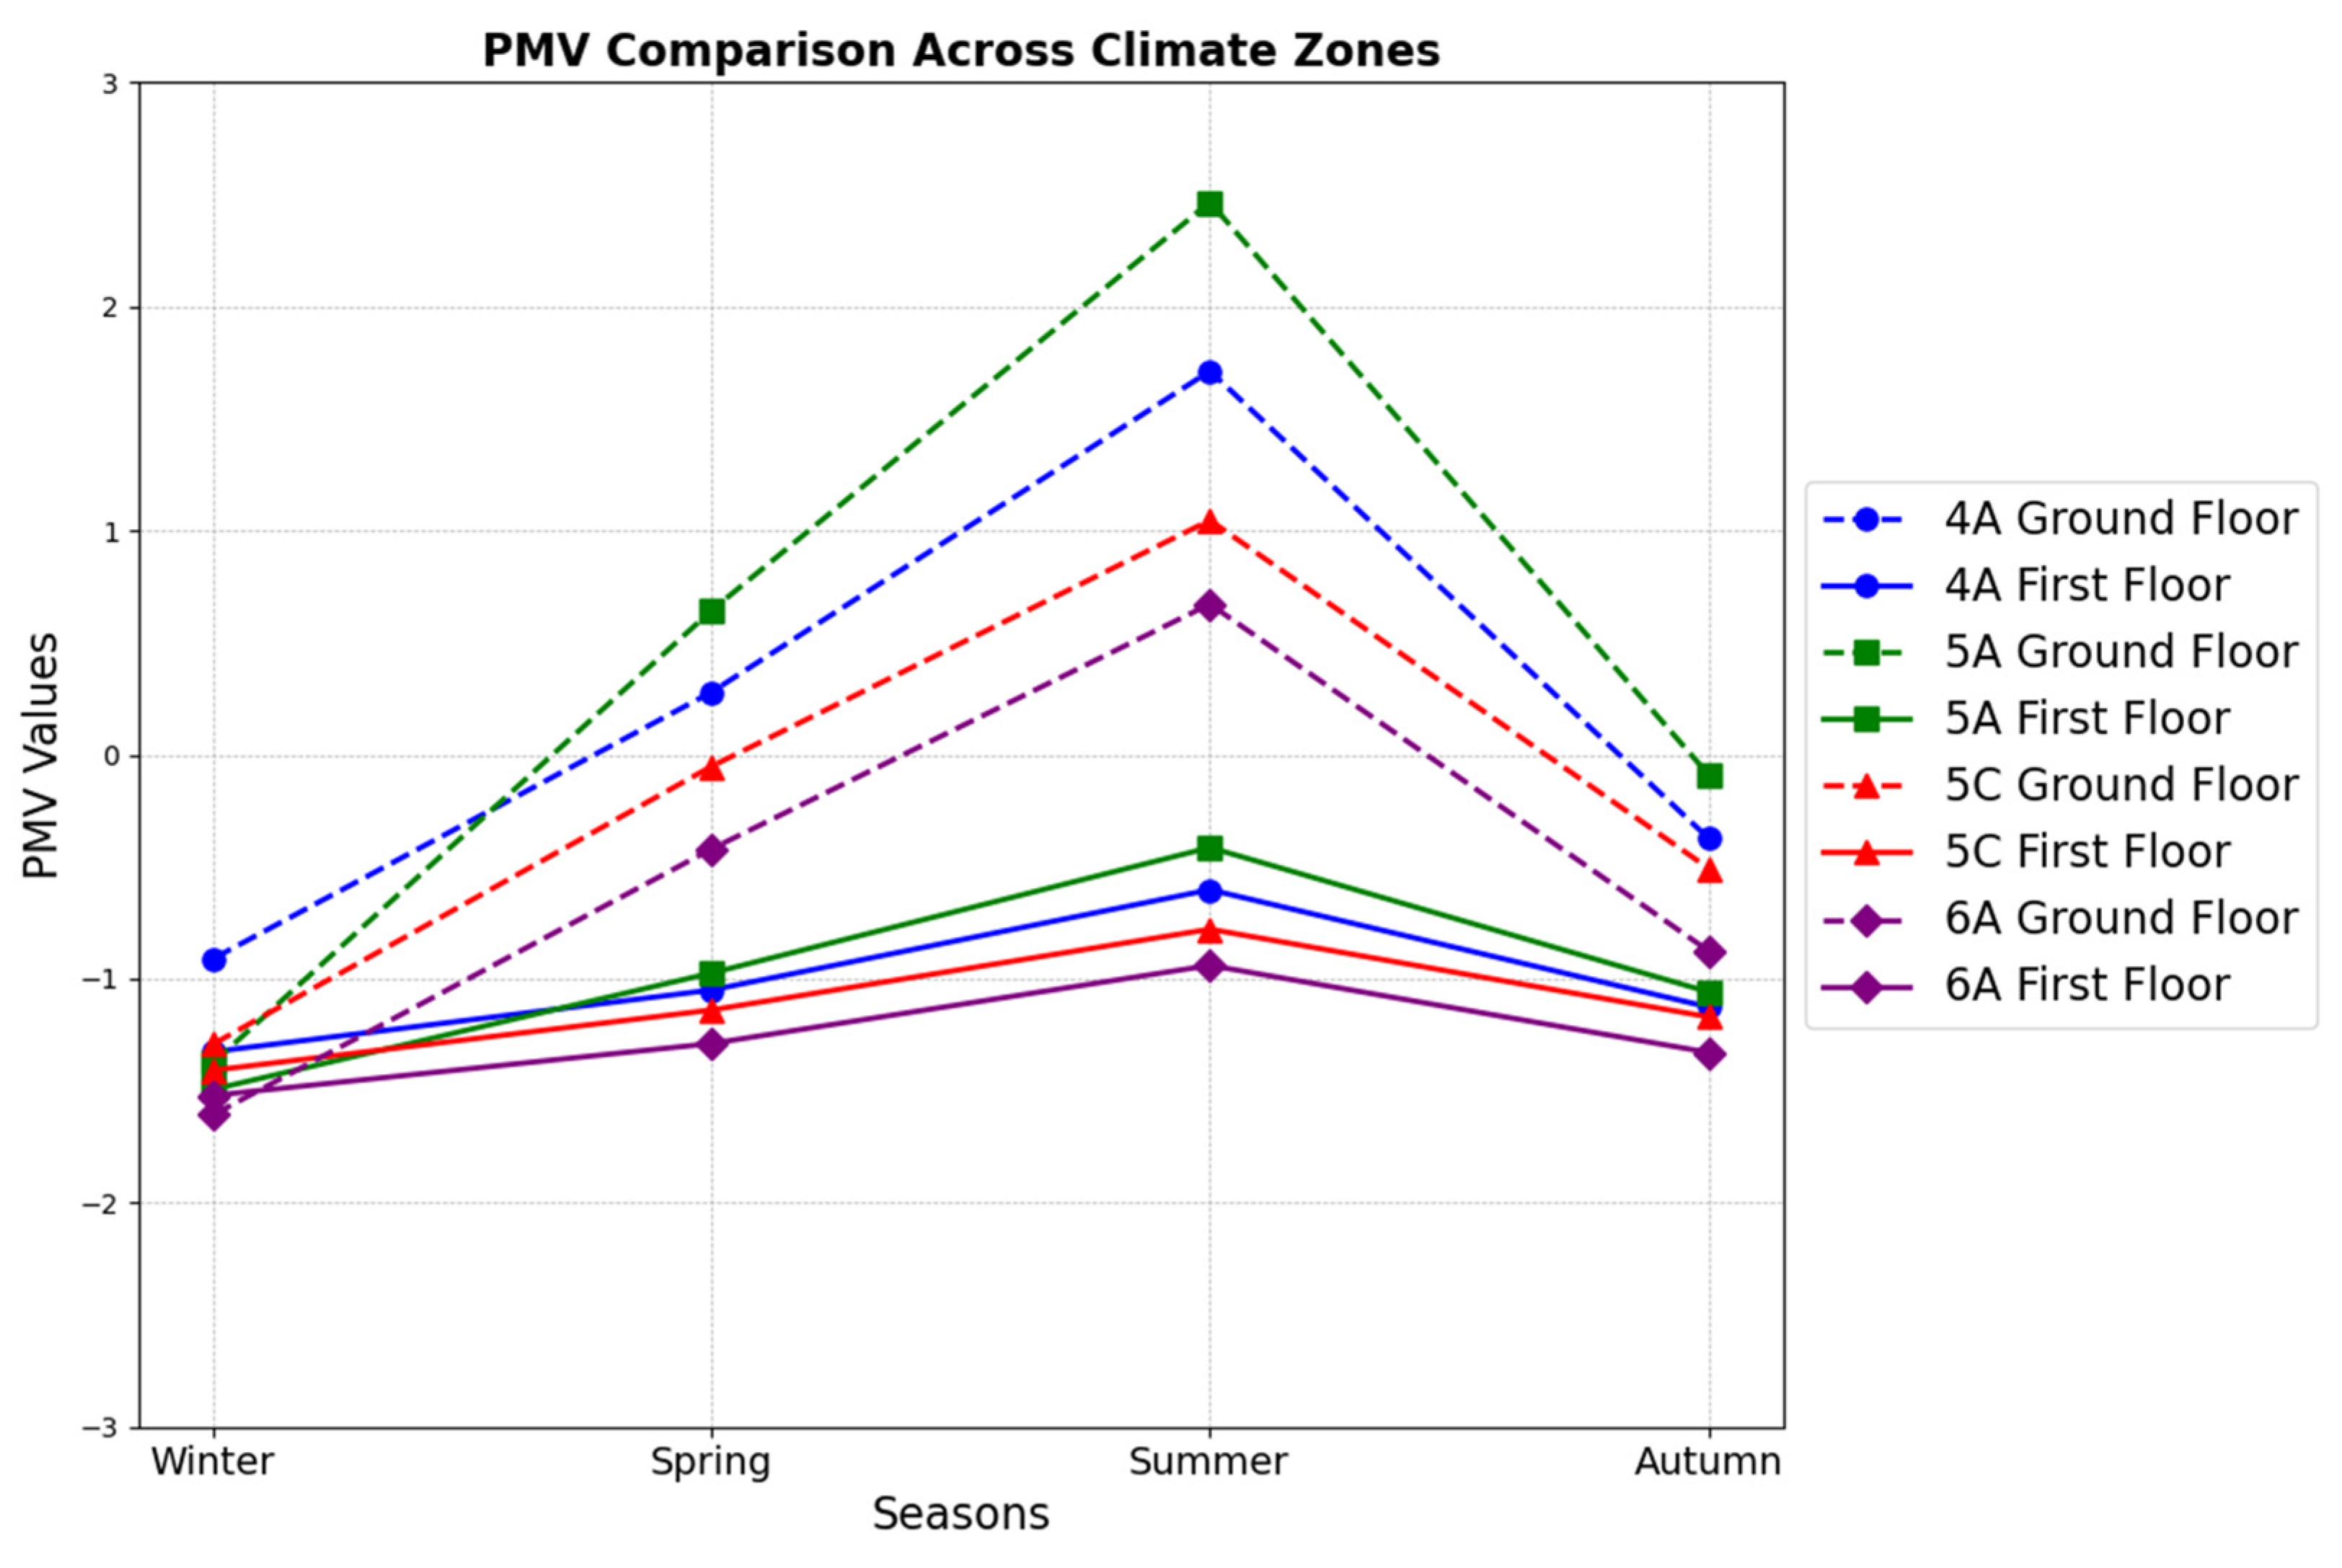
In Climate Zone 4A, which experiences a mixed-humid climate, summer temperatures on the first floor peak at around 37 °C, which could be considered an extreme condition in the UK climate, coupled with humidity levels exceeding 50%. These conditions create notable thermal discomfort during summer, as indicated by positive PMV values (Figure 12). In contrast, winter in Zone 4A records much lower temperatures, with an average of around 20 °C, and low humidity levels of 20%. In winter, low humidity levels result in negative PMV values and a sensation of cool-to-cold discomfort. In the case study, during wintertime, the gas boiler heating system does not address thermal discomfort in Zone 4A. In summer, there is a need to reduce both the temperatures and humidity. In this regard, discomfort can be reduced by upgrading insulation and using materials that regulate temperature and humidity.
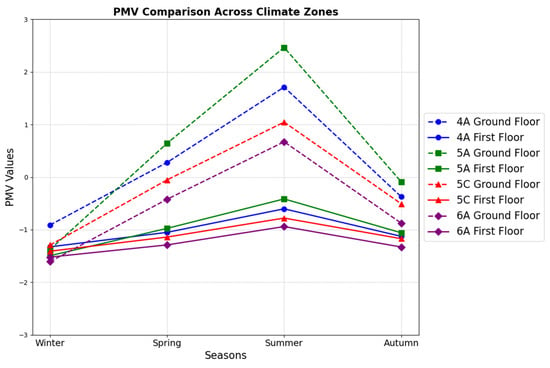
Figure 12.
Seasonal PMV variation for all climate zones.
In Climate Zone 6A, with cold–humid weather, winter temperatures drop even further, with average values as low as 15 °C, and humidity levels reaching above 40%. The PMV values for this zone in winter are the most negative among the four zones and indicate extreme cold discomfort. Conversely, summers in Zone 6A are milder compared to Zone 4A, with peak temperatures around 28 °C and humidity levels of 40%. These milder conditions result in PMV values closer to neutral, which indicate relatively better thermal comfort during summer. Therefore, upgrading the heating system could reduce energy consumption and improve thermal comfort in winter. Climate Zone 5A, as a cool–humid zone, demonstrates intermediate conditions. Winters are cold, with average temperatures of 18 °C and humidity levels of 30%. This climate has negative PMV values, similar to Zone 6A, but slightly less severe. In Zone 5A, summer temperatures on the first floor reach 34 °C, with humidity levels at 50%, which leads to moderate thermal discomfort. For Climate Zone 5A, the case study suggests improving the window-to-wall ratio (WWR) and adding better insulation to reduce summer thermal discomfort. For the effective management of winter conditions, an updated heating system is also required. The most stable temperature and humidity levels are found in Climate Zone 5C throughout the year, which is dominated by maritime conditions. With an average temperature of 20 °C and humidity levels of 30%, winters are moderate. This condition leads to less extreme negative PMV values. Similarly, summers in Zone 5C are cooler than in other zones, with peak temperatures reaching 30 °C and humidity levels under 45%. This leads to PMV values that are closer to thermal neutrality. As a result, the case study building is more suitable for Climate Zone 5C among all climate zones due to its relatively mild winters, cooler summers, and balanced temperature and humidity.
As a conclusion, summer in Zones 4A and 5A exhibits the highest thermal discomfort because of high temperatures and humidity levels, especially on the first floor. This confirms the impact of solar heat gain and the lack of ventilation in the baseline building. In contrast, Zone 5C has more consistent conditions, with PMV values staying close to neutral all year round. This suggests that buildings in Zone 5C may require less improvement in thermal comfort compared to other zones. Winter conditions in Zone 6A create the toughest situation, with the lowest PMV values, which indicate the need for significant heating. The ground floor in this zone is particularly affected, as it tends to retain less heat compared to the first floor.
4.3. Data-Driven Analysis
4.3.1. Data Automation and Scenario Development
According to the findings from the previous section, which mentioned the importance of optimising the window-to-wall ratio, improving HVAC system efficiency and enhancing material insulation in the mentioned climate zones, the inputs and outputs are clearly defined and form the foundation of this analysis. As illustrated in Table 2, input parameters, including the façade thermal performance metric, which is defined as corresponding U-values for external walls, floors, roofs and windows, as well as window-to-wall ratios (WWRs) and heating system configurations, were systematically varied across a range of values. For instance, U-values for external walls were simulated within a range of 0.2–0.7 W/(m2·K), simulating different levels of insulation. The performance of 58 different heating systems was evaluated. Similarly, WWR values for different orientations, which varied in the range of 0.3–0.7, were adjusted to evaluate their effects on energy performance, PMV and other targets seasonally. This robust input framework ensures that all critical building components are assessed in the context of the retrofitting potential.
Table 2.
List of input features, frequency and parameter ranges for automated data.
The outputs of this process, such as the Energy Use Intensity (EUI), heating energy requirements, Predicted Mean Vote (PMV) values, seasonal temperature and humidity metrics for the ground floor and first floor, provide a comprehensive overview of building performance, as shown in Table 3. The outputs, which are collected seasonally, are crucial for documenting how different climatic conditions and seasonal energy demands interact with retrofitting conversions. This automation process generated 3808 scenario observations in total. This extensive dataset analyses the relative performance of retrofitting solutions throughout all four climate zones, allowing for a thorough assessment of retrofitting options. As a result, the automation process provides a comprehensive dataset that supports evidence based decision-making and making it feasible to investigate a variety of retrofitting strategies. This study emphasises the significance of climate-responsive retrofitting approaches by systematically evaluating how various conversions function across various climate zones. The assessment of the window-to-wall ratio (WWR) was previously conducted and is detailed in [37] (Imani et al., forthcoming), while an in-depth analysis of insulation performance will be presented in a subsequent publication. This study focuses on the efficiency of heating systems across all climate zones.
Table 3.
List of features and seasonal output variations generated through automation.
4.3.2. Evaluation of Heating System Efficiency Across Diverse Scenarios
The evaluation of HVAC system efficiency across 58 automated scenarios for each climate zone (232 scenarios in total) offers valuable insights into energy performance and thermal comfort. By analysing EUI and PMV values, the results reveal substantial variations in system performance and highlight the need for climate-specific HVAC solutions to optimise building energy efficiency. HVAC systems consist of both heating systems, primarily suitable for colder seasons, and cooling systems, which are more effective in warmer conditions. To ensure an accurate analysis, this section incorporates the findings of seasonal evaluations, focusing on heating systems analysed during winter across all climate zones while excluding systems that only provide cooling. This approach prevents confusion and provides a logical and focused comparison of system performance, ensuring that the results offer meaningful and actionable insights for different climatic conditions. After evaluating EUI variation across various climate zones, the heating systems were systematically sorted based on their EUI performance. This method was conducted by ranking each system according to its seasonal energy efficiency within the respective climate zones. The analysis aimed to identify the systems with the lowest EUI, which indicates higher efficiency. Table 4 ranks five heating systems based on their balance of thermal comfort and low Energy Use Intensity (EUI) during winter in all climate zones. This ranking methodology was consistently applied across all climate zones. Some systems, for example, provided better thermal comfort but resulted in higher energy consumption.
Table 4.
Winter EUI performance ranking of heating systems across climate zones.
According to the results presented in Table 4, in Climate Zone 4A (Mixed–Humid), residential heat pumps and Water Source Heat Pumps (WSHP) performed as the most energy-efficient systems. The Residential Heat Pump with No Cooling achieved the lowest EUI at 36.25 kWh/m2, while WSHP systems recorded a close 36.82 kWh/m2. However, these HVAC systems have better thermal comfort levels compared to others, with PMV values ranging from −1.64 to −1.67, but further improvements in thermal comfort are still needed. According to the findings from the baseline case study, lower humidity during winter contributed to dissatisfaction. The moderate conditions in this zone help lower extreme heating needs and allow HVAC systems to work efficiently without using too much energy. In Climate Zone 5A (Cool–Humid), colder winters cause higher energy consumption compared to Zone 4A. WSHP systems performed the best, with an EUI of 44.80 kWh/m2, and residential heat pumps, with an EUI of 46.52 kWh/m2, placed as the second option. However, thermal comfort was affected, with PMV values between −1.83 and −1.89, indicating a colder sensation. Systems like Variable Refrigerant Flow (VRF) had even higher energy consumption at 50.89 kWh/m2, confirming the need for systems that address higher heating demands in this zone. Climate Zone 5C (Marine), with moderate winter conditions, has lower energy demands. Residential heat pumps and WSHPs performed best in this region. Residential heat pumps had the lowest EUI of 37.90 kWh/m2, while WSHP systems had an EUI of 38.13 kWh/m2. The corresponding PMV values for these systems ranged from −1.70 to −1.72, respectively, and indicate a cool environment. In Climate Zone 6A (Cold–Humid), extreme winter conditions cause higher energy demands. WSHP systems perform the most efficiently, with an EUI of 44.96 kWh/m2, followed by residential heat pumps with an EUI of 47.02 kWh/m2. However, thermal comfort, with PMV values between −1.87 and −1.95, indicates a cold sensation. VRF and Fan Coil Chillers had significantly higher energy demands, reaching 52 kWh/m2, which indicates the need for highly efficient heating systems and better insulation strategies to address the high heating loads in this zone.
According to the results, zone-specific HVAC systems are crucial to optimise an occupant’s thermal comfort and energy efficiency. Highly efficient systems, like WSHPs, should be preferred in Zones 5A and 6A, which have high heating demands. Residential heat pumps are the most energy-efficient option for areas with moderate temperatures, such as Zones 4A and 5C. Even though these systems are more energy-efficient than others, they still need to be improved in terms of achieving optimum thermal comfort.
5. IOT-Based Data Validation
5.1. Validation Case Study Description
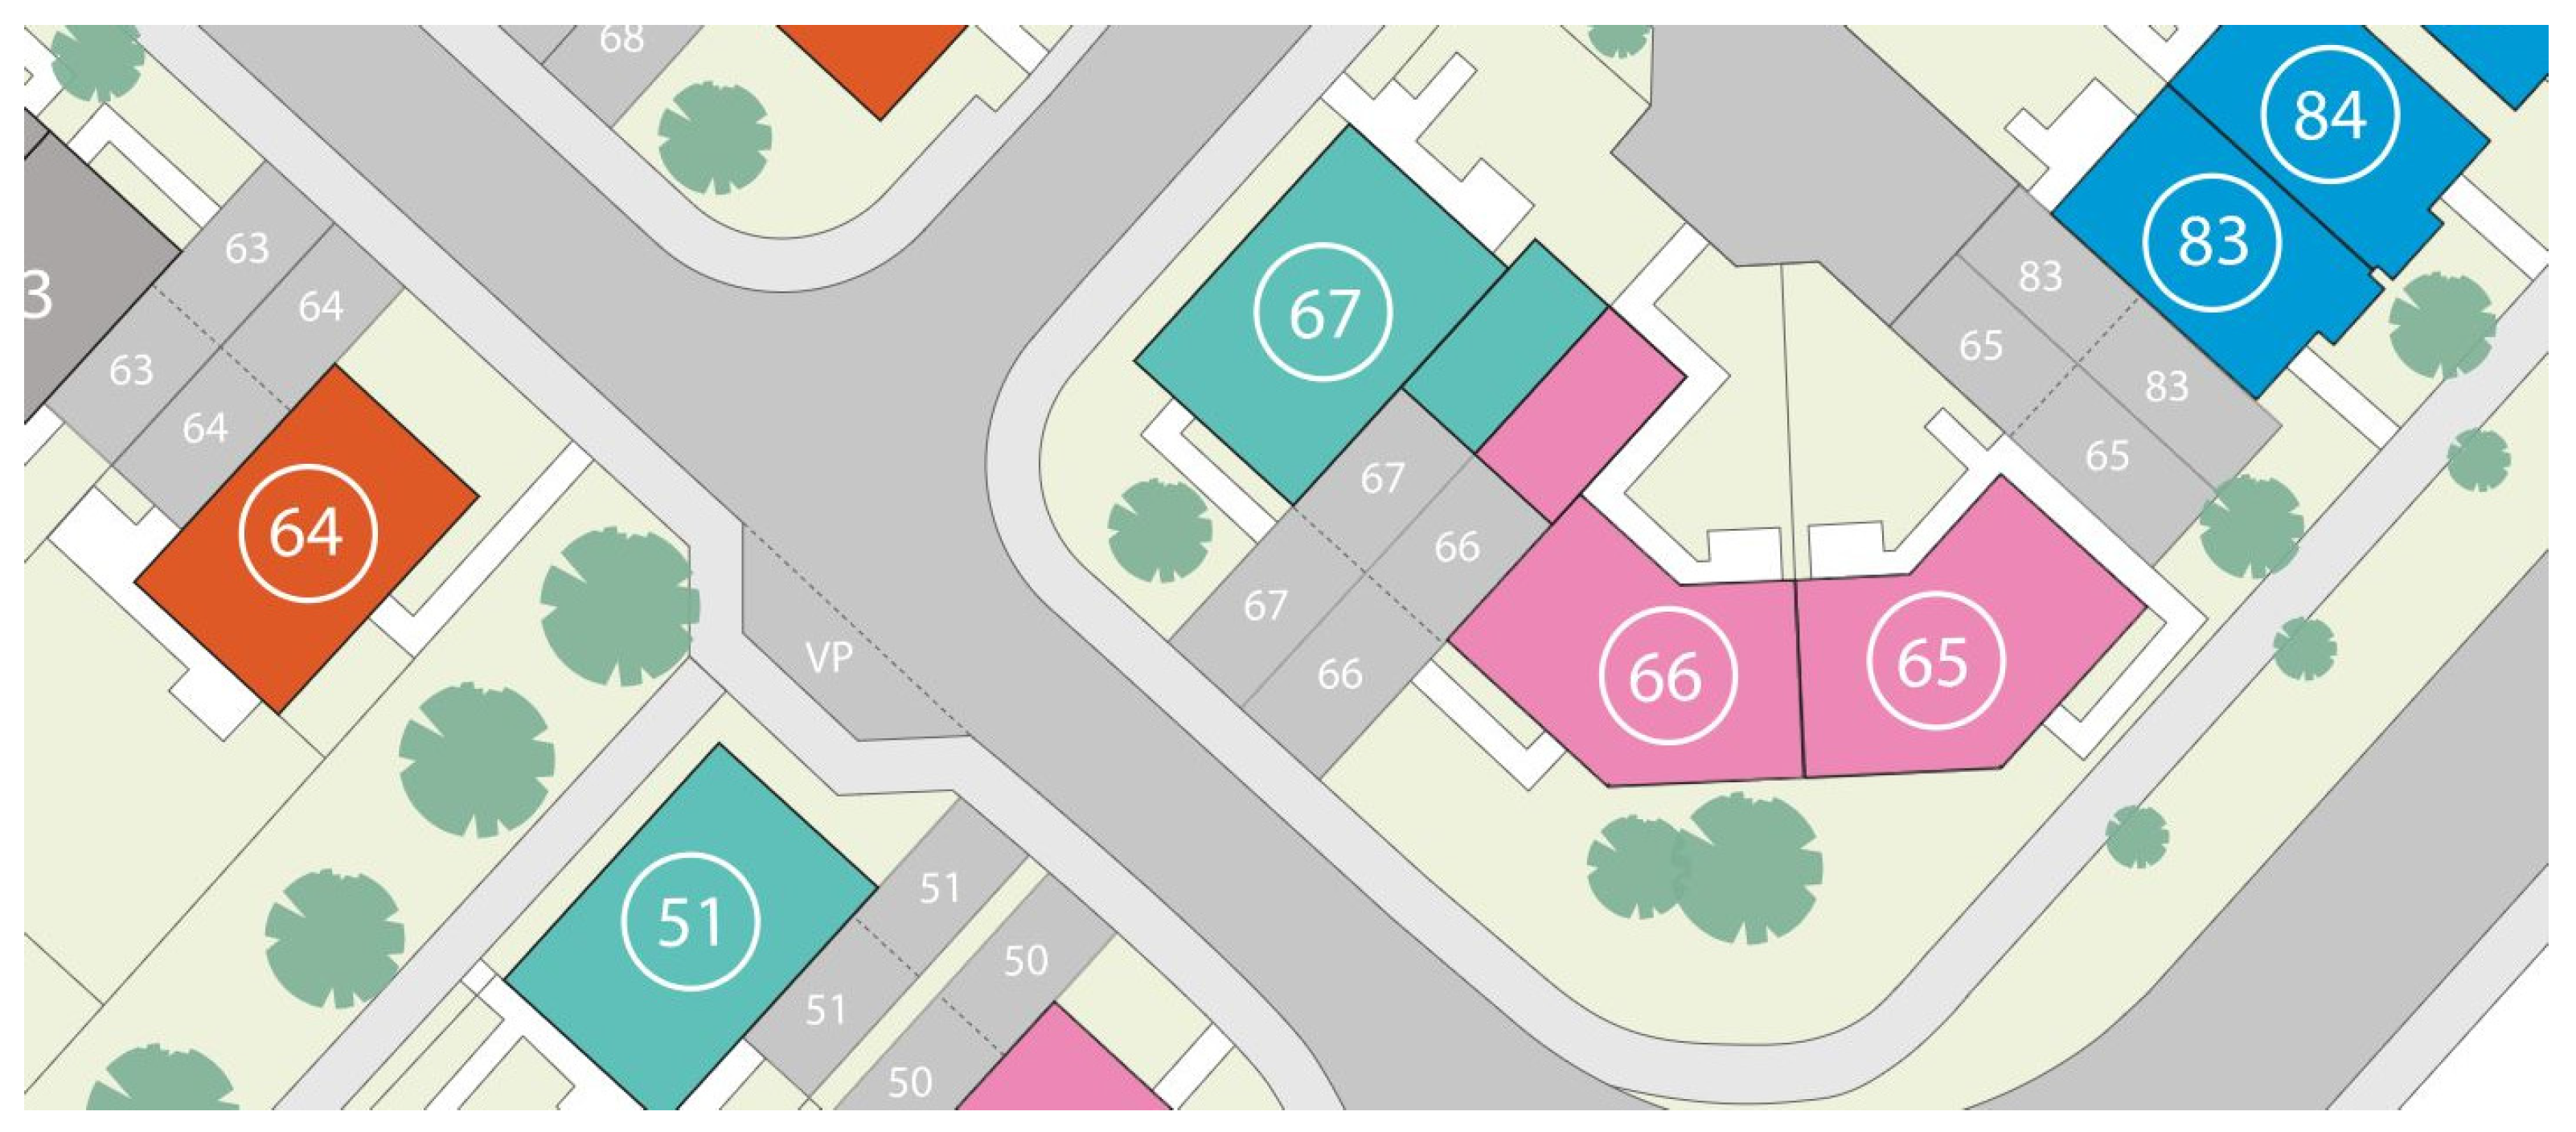
For validating the simulation data, two buildings have been selected as case studies. Plot 66 and Plot 65 from a development, are located in Spennymoor, UK (Figure 13). This location falls under Climate Zone 5A (Cool–Humid) of the ASHRAE classification, which makes it an ideal setting for a comparative analysis of heating system performance in real-world conditions. As shown in Figure 14, Plot 66 and Plot 65 are semi-detached houses with the same physical and geometrical features. This creates a controlled environment to isolate the effects of different heating systems. Both buildings have the same thermal performance to ensure consistency in the comparative data analysis. This similarity reduces external variables and allows the heating system efficiency to be the main identifier in energy performance and thermal comfort outcomes. Each building has a total floor area of 109.6 m2 with a height of 5.025 m. The window-to-wall ratio (WWR) for both the north and east is 0.1, which contributes to a uniform thermal envelope across both plots. Table 5 summarises the thermal specifications of the case study buildings.

Figure 13.
Site plan of case study locations: Plot 66 and Plot 65. These plots are highlighted in pink.
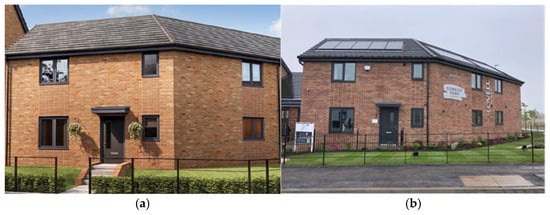
Figure 14.
Exterior view of the building; (a) Plot 65 and (b) Plot 66.
Table 5.
Thermal specification of the case study.
Plot 66, equipped with an air source heat pump (ASHP), is known for its energy efficiency and environmental benefits in moderate climate zones like 5A, based on the findings from the previous section. An infrared heating system is installed in Plot 65, which operates on a different principle by emitting radiation to directly heat objects and surfaces in a room, unlike conventional systems that heat the air directly.
5.2. Methodology for IoT-Based Thermal Comfort Monitoring
The IoT system designed for this study is shown in Figure 15. The system integrates temperature and humidity sensors (DHT22) in both buildings to collect real-time environmental data and validate thermal comfort models effectively. As Plot 65 and Plot 66 are identical in structure and material specifications, the sensor installation strategy was the same.
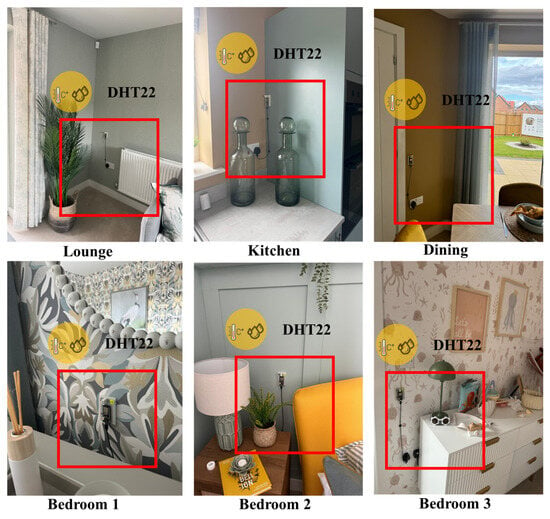
Figure 15.
IOT set up in Plot 66. The red boxes indicate the locations of DHT22 sensors, which are used to measure temperature and humidity within the indoor environment.
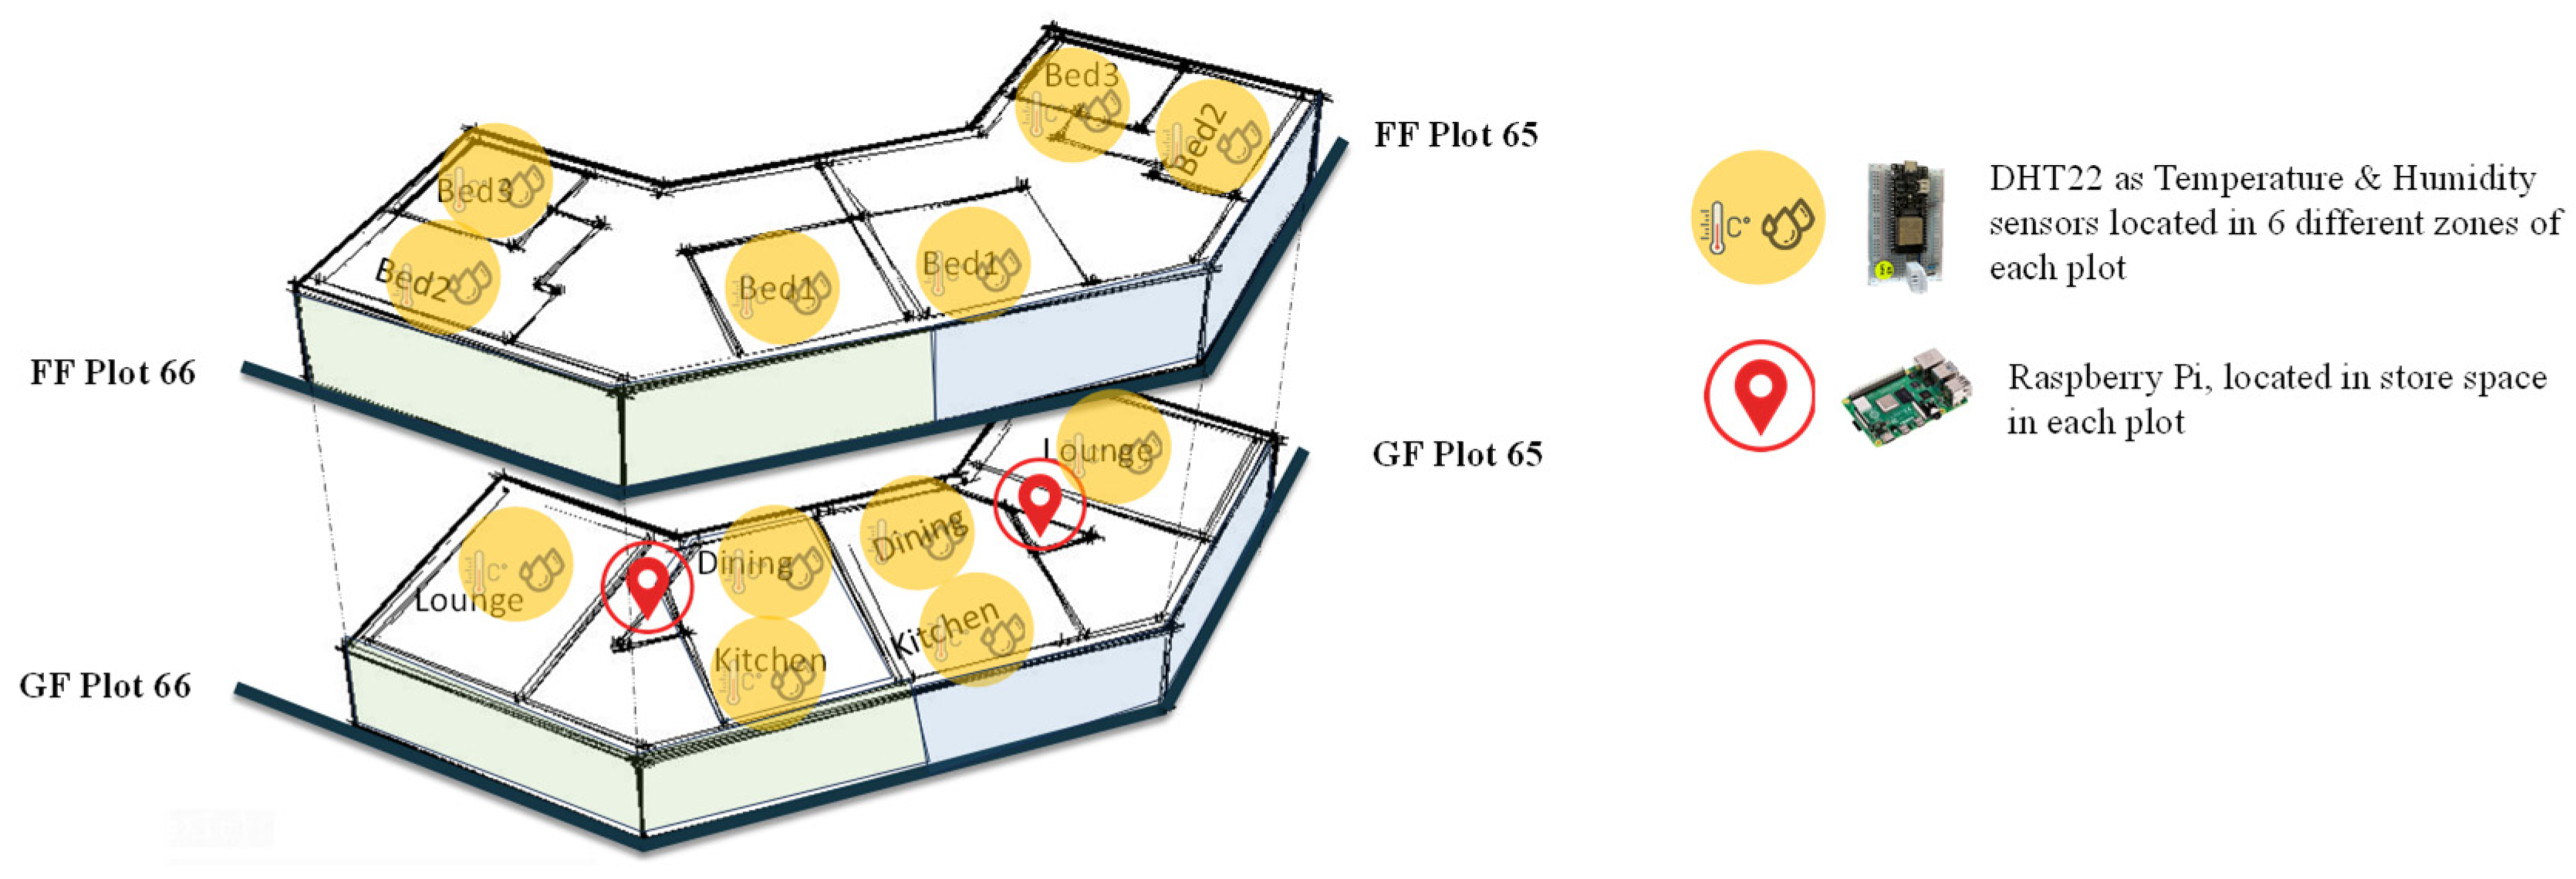
Temperature and humidity sensors are strategically installed in six key zones in each building: three zones on the ground floor (lounge, dining and kitchen) and three on the first floor (bedroom 1, bedroom 2 and bedroom 3) (Figure 16). This distribution allows for the comprehensive monitoring of indoor environmental conditions and captures variations across different living spaces. Air temperature and relative humidity data are collected every 10 min for each season.
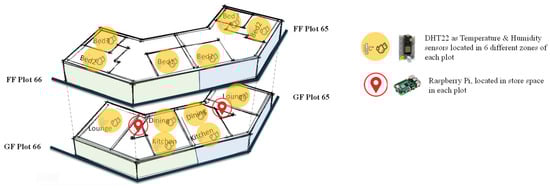
Figure 16.
IOT set up in the proposed buildings.
The choice of these specific monitoring locations was driven by their distinct occupancy patterns, usage characteristics and potential thermal variations. The ground floor areas are frequently used spaces, where occupants engage in various activities, including cooking, dining and social interactions. Similarly, the first-floor zones, consisting of three bedrooms, were selected to analyse temperature and humidity variations in private, lower-activity spaces.
5.3. IoT-Based Data Collection and Results Analysis
To validate the simulation results for Plot 66, IoT-collected data were compared with the simulation outputs for temperature and humidity across six zones: the dining room, lounge, kitchen 1, bedroom 1, bedroom 2 and bedroom 3. The collection of both IoT and simulation data was conducted for Plot 66 with heat pumps and is presented in Table 6 and Table 7, respectively. IoT data were collected from 28 October 2024 to 10 November 2024. The simulation data were conducted for the same period to enable a direct comparison (Figure 17).
Table 6.
IoT-collected temperature and humidity data in Plot 66.
Table 7.
Simulation-collected temperature and humidity data in Plot 66.
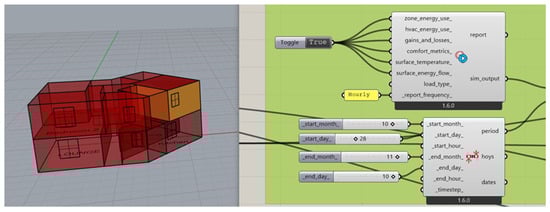
Figure 17.
Selected time periods for the energy simulation.
The validation process involved calculating statistical metrics, such as the Mean Bias Error (MBE) based on the average values for both temperature and humidity [44]. The MBE is widely utilised in predictive modelling to quantify systematic bias by measuring the average deviation between simulated and observed values [45]. This method indicates the average bias between the simulated and observed data. A negative value shows underestimation and a positive value indicates overestimation. The table below summarises the average temperature and humidity values from both IoT and simulation data with the calculated MBE for each zone. The results are illustrated in Table 8.
Table 8.
Mean Bias Error (MBE) between simulated data and IoT-collected data.
The calculated Mean Bias Error (MBE) values for temperature and humidity are based on the average temperature and humidity values recorded in Table 6 and Table 7. The simulation results demonstrate an acceptable level of accuracy, as evaluated using the Mean Bias Error (MBE) expressed as a percentage. The MBE values indicate a slight underestimation of the temperature in internal zones, with a range from −4.85% to −8.05% for temperature and from −6.05% to −10.19% for humidity. To justify the accuracy of this calibration, ASHRAE Guideline 14 provides threshold limits for acceptable model accuracy. According to Monetti et al. (2015), “For evaluating model accuracy, the Mean Bias Error (MBE) is calculated and verified to be consistent with the ASHRAE Guideline 14 limits of ±10% on an hourly basis” [46]. Given that the MBE values in this study mostly fall within the ±10% threshold, the simulation results can be considered reasonably accurate. However, certain factors must be considered when comparing the simulation results with real-time data, as they can influence temperature and humidity variations. The building simulation, equipped with a heat pump, was set with a constant temperature set point of 21 °C, which directly impacted the simulation results by maintaining consistent maximum values. In contrast, the real-time data were collected from a show home that remained unoccupied. This lack of occupancy affected both the temperature and humidity due to the absence of internal heat gains from occupants and appliances. Moreover, the intermittent operation of HVAC systems, caused by issues, such as battery depletion, contributed to fluctuations in the real-time data and led to discrepancies when compared with the simulation results.
5.4. Results
The IoT-based data collected from two residential plots, Plot 66 and Plot 65, in climate Zone 5A provide critical insights into the performance of different heating systems (residential heat pumps and infrared heating system). The data presented in Table 9 highlight key differences in indoor temperature and humidity levels, as well as energy consumption data collected from building energy bills, providing a comprehensive comparison of energy efficiency.
Table 9.
IoT-Based comparison of temperature and humidity for Plot 65 and Plot 66.
As presented in Section 4.3.2, Evaluation of Heating System Efficiency Across Diverse Scenarios, the heat pump was identified as one of the most energy-efficient HVAC options for climate Zone 5A, demonstrating lower energy consumption. However, as indicated in Table 4, this system also resulted in a slight increase in cold discomfort during winter. Energy consumption data collected from building energy bills for the period between 30 June 2024 and 18 October 2024 demonstrates a noticeable difference between the two heating systems. Plot 66 with a heat pump consumed only 10 kWh, while Plot 65 with an infrared heating system consumed 61 kWh during the same period. In addition, based on IoT-based data collection, in Plot 66 with a heat pump, the average ground floor temperature was recorded at 22.5 °C with an upper floor temperature of 22.81 °C. Humidity levels were recorded at 44.43% on the ground floor and 44.25% on the first floor. In contrast, Plot 65 with an infrared heating system showed lower average temperatures of 20.47 °C on the ground floor and 21.65 °C on the first floor. The higher humidity levels varied from 51.47% to 48.06% on the ground floor and first floors, respectively. These significant differences highlight the efficiency of residential heat pumps compared to infrared heating systems in Climate Zone 5A and confirm the previous simulation-based findings of this study. According to these findings, Plot 66’s higher temperatures and more stable humidity levels show that the heat pump preserves the internal temperature more stably and comfortably for the occupants. Even though the humidity levels in both setups remained within acceptable ranges, further optimisation may be needed to enhance thermal comfort.
6. Limitations and Future Study
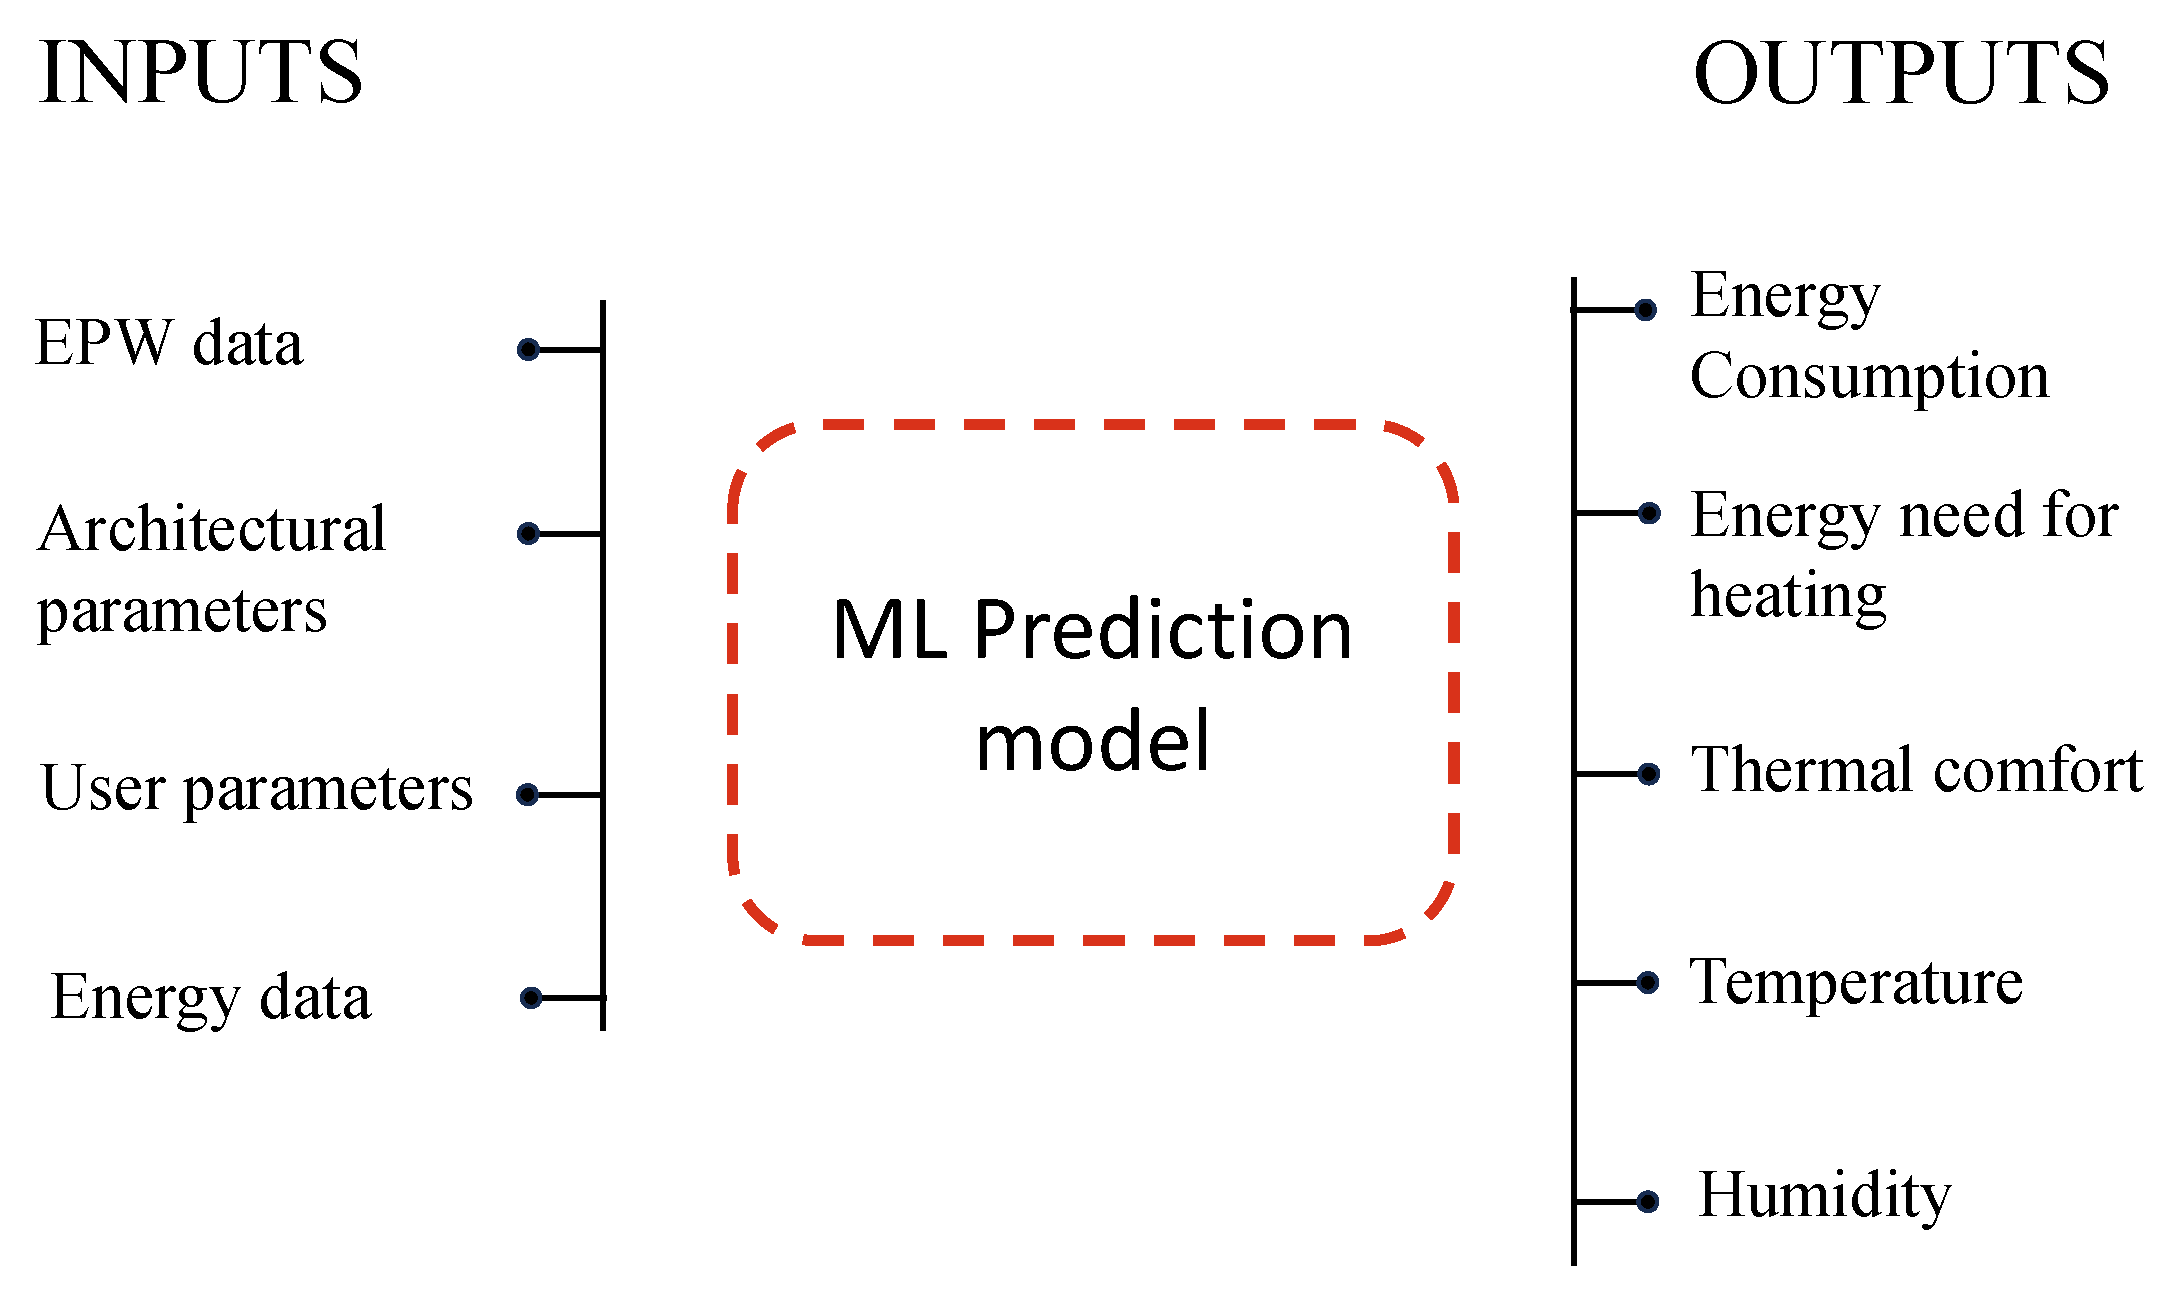
Due to the high simulation time required for physics-based simulations, the study could not evaluate all possible retrofitting scenarios for the case study. This limitation restricted the simulation of a wider range of parameters. For instance, at the time that this research was conducted, the latest version of the building regulations was the 2021 edition incorporating the 2023 amendments [36]. This regulation specifies acceptable wall U-values of 0.26 W/m2K for new buildings and 0.18 W/m2K for existing buildings. However, the parameter range variation used in this automation was constrained between 0.2 and 0.7 W/m2K. Consequently, the automation process explores a significant range of retrofitting scenarios, but it did not cover all possible values. Moreover, the study’s thermal comfort evaluation was applied to unoccupied plots. Therefore, this study considered only environmental factors, and critical human-related variables were not included in the evaluation. Key factors, such as the user profile and occupancy patterns, were not considered, which could significantly influence thermal comfort outcomes in real-world settings. Additionally, Tomorad et al. (2018) mention that the operative temperature is a more comprehensive measure of thermal comfort as it accounts for the air temperature, mean radiant temperature and air velocity [47]. They suggest that relying solely on air temperature can lead to inaccurate assessments of thermal comfort [47]. However, a limitation of this study is that the DT22 device used only measures the air temperature, without incorporating the mean radiant temperature component directly. In addition, the infrared heating system was relatively new technology for residential buildings. Therefore, this system was not fully defined within the simulation software used in this study. As a result, thermal comfort metrics specific to infrared heating systems could not be accurately simulated. This limitation restricts the ability to evaluate the performance and comfort implications of infrared heating systems. Future research should aim to address the identified limitations. In addition, based on the findings of this research, as illustrated in Figure 18, the automated dataset can serve as a foundation for future machine learning applications.
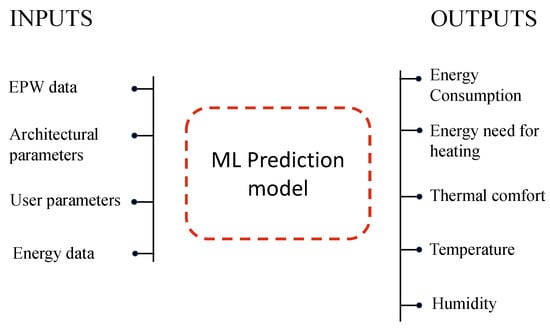
Figure 18.
Framework for future research in energy efficiency and thermal comfort optimisation.
Future studies will concentrate on developing predictive models for energy consumption and thermal comfort in residential buildings. Using machine learning algorithms and training the model with validated simulation data can significantly improve the predictive accuracy. This approach supports data-driven decision-making in building retrofitting projects. Additionally, it would offer tailored recommendations based on specific building characteristics and environmental conditions.
7. Conclusions
This study presented an integrated approach to enhancing energy efficiency and thermal comfort in residential buildings through a hybrid method of physics-based simulations and data-driven analysis and validated with IoT-based real time data. This study evaluated 232 retrofitting scenarios focusing on heating system across different climate zones in the UK. The findings have provided valuable insights into optimising the building performance in response to both environmental conditions and regulatory standards. The study’s findings reveal distinct seasonal and climate-specific challenges, underscoring the need for targeted retrofitting interventions. The energy performance analysis revealed significant variations in the Energy Use Intensity (EUI) across climate zones. Zone 6A exhibited the highest heating demand, with a yearly EUI of 164.12 kWh/m2. In contrast, the mildest zone, 4A, recorded the lowest annual EUI of 137.11 kWh/m2. These results emphasise the necessity of climate-adaptive retrofitting strategies to address region-specific heating needs effectively. The seasonal analysis highlighted that summer conditions in climate Zones 4A and 5A exhibited the highest thermal discomfort, whereas winter dissatisfaction was primarily due to low temperatures and humidity levels, especially on the first floor. Conversely, Zone 5C demonstrated more stable thermal comfort, with PMV values closer to neutral throughout the year, which suggests that fewer thermal comfort interventions may be needed in this zone. In Zone 6A, winter conditions led to the lowest PMV values and indicates severe thermal discomfort, especially on the ground floor. The ground floor retains less heat than upper floors and necessitates a significant demand for heating. The evaluation of heating system efficiency across 58 scenarios revealed that Water Source Heat Pumps (WSHPs) and Residential Heat Pumps provided the ideal balance of energy efficiency and thermal comfort. In Climate Zone 5A, WSHPs achieved the lowest EUI at 44.80 kWh/m2, while in Zone 4A, Residential Heat Pumps had an EUI of 36.25 kWh/m2. However, despite their efficiency, these systems exhibited slightly negative PMV values (−1.64 to −1.95), which indicate a mildly cool indoor environment and suggest that further refinements are needed to improve thermal comfort while maintaining energy efficiency. The IoT-based data validation further supported these findings. Real-time data collected from Plot 66 with a heat pump and Plot 65 with an infrared heating system demonstrated significant differences in energy consumption and indoor conditions. Over a four month period, Plot 66 consumed only 10 kWh, whereas Plot 65 required 61 kWh. Additionally, the heat pump maintained a higher indoor temperature (22.81 °C first floor, 22.5 °C ground floor) and lower humidity (44.25% first floor, 44.43% ground floor) compared to the infrared heating system, which resulted in lower temperatures (21.65 °C, 20.47 °C) and higher humidity (51.47%, 48.06%). The validation process confirmed the accuracy of the simulations, with Mean Bias Error (MBE) values mostly falling within ASHRAE Guideline 14’s ±10% threshold. The MBE for temperature ranged from −4.85% to −8.05%, while for humidity, they ranged from −6.05% to −10.19%. This confirms that the simulation model provides a reliable framework for assessing retrofitting solutions. Furthermore, according to the study, zone-specific HVAC techniques are essential for optimising thermal comfort and energy efficiency. In colder zones, such as 5A and 6A, where heating demands are most influential, highly efficient systems like Water Source Heat Pumps (WSHPs) should be prioritized to enhance energy efficiency. For moderate climates, such as Zones 4A and 5C, air source heat pumps offer an energy-efficient solution. However, considering the temperature and humidity levels, these systems still need to be improved to provide acceptable thermal comfort, even with better energy performance. In conclusion, this study makes a substantial contribution to our knowledge of climate-responsive retrofitting strategies that include seasonal interventions. It emphasises how crucial adaptive retrofitting options are for various climate zones. The findings also established the foundation for future research that would concentrate on improving predictive models, integrating them with occupant behaviour, and creating cutting-edge technology to promote energy efficiency, sustainability and comfortable living spaces.
Author Contributions
Conceptualization, E.I.; Methodology, E.I. and S.W.; Writing—original draft, E.I.; Supervision, H.D. and N.D. All authors have read and agreed to the published version of the manuscript.
Funding
This research received no external funding.
Data Availability Statement
The data presented in this study are available on request from the corresponding author. Restrictions apply to the availability of these data. Real time building’s Data were obtained from a third party and are available from the authors with the permission of the data provider.
Acknowledgments
This article is a revised and expanded version of a paper entitled “A Hybrid Framework for Optimising Energy Efficiency and CO2 Reduction Using Data-Driven and Physics-Based Scenario Analysis”, which was presented at presented at the 24th International Conference on Construction Applications of Virtual Reality (CONVR 2024), Sydney, Australia.
Conflicts of Interest
The authors declare no conflict of interest.
References
- Kisku, N.; Joshi, H.; Ansari, M.; Panda, S.K.; Nayak, S.; Dutta, S.C. A Critical Review and Assessment for Usage of Recycled Aggregate as Sustainable Construction Material. Constr. Build. Mater. 2017, 131, 721–740. [Google Scholar] [CrossRef]
- Economidou, M.; Todeschi, V.; Bertoldi, P.; D’Agostino, D.; Zangheri, P.; Castellazzi, L. Review of 50 years of EU Energy Efficiency Policies for Buildings. Energy Build. 2020, 225, 110322. [Google Scholar]
- Pungercar, V.; Zhan, Q.; Xiao, Y.; Musso, F.; Dinkel, A.; Pflug, T. A New Retrofitting Strategy for the Improvement of Indoor Environment Quality and Energy Efficiency in Residential Buildings in Temperate Climate Using Prefabricated Elements. Energy Build. 2021, 241, 110951. [Google Scholar] [CrossRef]
- Ma, J.J.; Du, G.; Zhang, Z.K.; Wang, P.X.; Xie, B.C. Life Cycle Analysis of Energy Consumption and CO2 Emissions from a Typical Large Office Building in Tianjin, China. Build. Environ. 2017, 117, 36–48. [Google Scholar] [CrossRef]
- Abdulgader, M.; Lashhab, F. Energy-Efficient Thermal Comfort Control in Smart Buildings. In Proceedings of the 2021 IEEE 11th Annual Computing and Communication Workshop and Conference, CCWC 2021, Las Vegas, NV, USA, 27–30 January 2021; Institute of Electrical and Electronics Engineers Inc.: New York, NY, USA, 2021; pp. 22–26. [Google Scholar]
- Seyedzadeh, S.; Glesk, I.; Roper, M. Machine Learning for Estimation of Building Energy Consumption and Performance: A Review. Vis. Eng. 2018, 6, 5. [Google Scholar] [CrossRef]
- Lu, Y.; Li, P.; Lee, Y.P.; Song, X. An Integrated Decision-Making Framework for Existing Building Retrofits Based on Energy Simulation and Cost-Benefit Analysis. J. Build. Eng. 2021, 43, 103200. [Google Scholar] [CrossRef]
- Krstić, H.; Teni, M. Review of Methods for Buildings Energy Performance Modelling. IOP Conf. Ser. Mater. Sci. Eng. 2017, 245, 042049. [Google Scholar] [CrossRef]
- Yang, M.; Jiang, P.; Zang, T.; Liu, Y. Data-Driven Intelligent Computational Design for Products: Method, Techniques, and Applications. J. Comput. Des. Eng. 2023, 10, 1561–1578. [Google Scholar] [CrossRef]
- Bakmohammadi, P.; Noorzai, E. Optimization of the Design of the Primary School Classrooms in Terms of Energy and Daylight Performance Considering Occupants’ Thermal and Visual Comfort. Energy Rep. 2020, 6, 1590–1607. [Google Scholar] [CrossRef]
- Khan, H. Microclimatic Architectural Design by Interfacing Grasshoppers and Dynamo with Rhino and Revit. Meas. Sens. 2024, 33, 101143. [Google Scholar] [CrossRef]
- Jurizat, A.; Surahman, U.; Tedjawinata, G.K. Operational Energy Analysis of an Educational Building Design; A Case Study of Center of Excellent (CoE) Building at Universitas Pendidikan Indonesia (UPI). IOP Conf. Ser. Earth Environ. Sci. 2021, 738, 012018. [Google Scholar] [CrossRef]
- Razzaghmanesh, D.; Aksoy, M. The Effect of Parametric Design on Designing Performative Facades. In Proceedings of the 41st IAHS World Congress Sustainability and Innovation for the Future, Albufeira, Portugal, 13–16 September 2016. [Google Scholar]
- Medjeldi, Z.; Kirati, A.; Dechaicha, A.; Alkama, D. Parametric Design of a Residential Building System through Solar Energy Potential: The Case of Guelma, Algeria. J. Phys. Conf. Ser. 2023, 2600, 042012. [Google Scholar]
- Xue, Y.; Liu, W. A Study on Parametric Design Method for Optimization of Daylight in Commercial Building’s Atrium in Cold Regions. Sustainability 2022, 14, 7667. [Google Scholar] [CrossRef]
- Waibel, C.; Thomas, D.; Elesawy, A.; Hischier, I.; Walker, L.; Schlueter, A. Integrating Energy Systems into Building Design with Hive: Features, User Survey and Comparison with Ladybug and Honeybee Tools. In Proceedings of the 17th IBPSA Conference, Bruges, Belgium, 1–3 September 2021; Building Simulation Conference Proceedings. International Building Performance Simulation Association: Britton, SD, USA, 2022; pp. 1695–1702. [Google Scholar]
- Ibrahim, Y.; Kershaw, T.; Shepherd, P. A Methodology For Modelling Microclimates: A Ladybug-Tools and ENVI-Met Verification Study. In Proceedings of the 35th PLEA Conference Sustainable Architecture and Urban Design, A Coruna, Spain, 1–3 September 2020. [Google Scholar]
- Jalali, Z.; Noorzai, E.; Heidari, S. Design and Optimization of Form and Facade of an Office Building Using the Genetic Algorithm. Sci. Technol. Built Environ. 2020, 26, 128–140. [Google Scholar] [CrossRef]
- Zocchi, G.; Hosseini, M.; Triantafyllidis, G. Exploring the Synergy of Advanced Lighting Controls, Building Information Modelling and Internet of Things for Sustainable and Energy-Efficient Buildings: A Systematic Literature Review. Sustainability 2024, 16, 10937. [Google Scholar] [CrossRef]
- Far, C.; Far, H. Improving Energy Efficiency of Existing Residential Buildings Using Effective Thermal Retrofit of Building Envelope. Indoor Built Environ. 2019, 28, 744–760. [Google Scholar] [CrossRef]
- Neves-Silva, R.; Camarinha-Matos, L.M. Simulation-Based Decision Support System for Energy Efficiency in Buildings Retrofitting. Sustainability 2022, 14, 12216. [Google Scholar] [CrossRef]
- Luo, D.; Wu, T.; Wang, J.; Wagner, T. Informed Building Retrofit Based on Simulation and Data Analysis. In Proceedings of the 3rd International High Performance Buildings Conference, West Lafayette, IN, USA, 14–17 July 2014. [Google Scholar]
- Nutkiewicz, A.; Jain, R.K. Exploring the Integration of Simulation and Deep Learning Models for Urban Building Energy Modelling and Retrofit Analysis. In Proceedings of the Building Simulation Conference Proceedings; International Building Performance Simulation Association: Britton, SD, USA, 2019; Volume 5, pp. 3209–3216. [Google Scholar]
- Imani, E.; Dawood, H.; Dawood, N.; Occhipinti, A. Retrofitting of Buildings to Improve Energy Efficiency: A Comprehensive Systematic Literature Review and Future Research Directions. In CONVR 2023—Proceedings of the 23rd International Conference on Construction Applications of Virtual Reality, Florence, Italy, 13–16 November 2023; Firenze University Press: Firenze, Italy, 2023. [Google Scholar] [CrossRef]
- Cuerda, E.; Guerra-Santin, O.; Sendra, J.J.; Neila, F.J. Understanding the Performance Gap in Energy Retrofitting: Measured Input Data for Adjusting Building Simulation Models. Energy Build. 2020, 209, 26. [Google Scholar] [CrossRef]
- Imani, E.; Dawood, H.; Dawood, N.; Occhipinti, A. Enhancing building sustainability: A comprehensive review and methodological roadmap for retrofit strategies. J. Inf. Technol. Constr. 2024, 29, 1275–1292. [Google Scholar]
- Elshanshoury, W.; Lila, A.; Lavaf-Pour, Y.; Lamond, J.; Marco, E. Urban Building Energy Modelling and Generative Design—An Integration for Energy-Optimised Urban Design: A Systematic Review. In Building Simulation Conference Proceedings; International Building Performance Simulation Association: Britton, SD, USA, 2023; Volume 18, pp. 1643–1650. [Google Scholar]
- Roudsari, M.S.; Pak, M. Ladybug: A Parametric Environmental Plugin for Grasshopper to Help Designers Create an Environmentally-Conscious Design. In Proceedings of the BS2013: 13th Conference of International Building Performance Simulation Association, Chambery, France, 26–28 August 2013. [Google Scholar]
- ANSI/ASHRAE/IES Standard 90.1; Energy Standard for Buildings Except Low-Rise Residential Buildings. ASHRAE: Peachtree Corners, GA, USA, 2022.
- Kelly, S.; Crawford-Brown, D.; Pollitt, M.G. Building Performance Evaluation and Certification in the UK: Is SAP Fit for Purpose? Renew. Sustain. Energy Rev. 2012, 16, 6861–6878. [Google Scholar] [CrossRef]
- Fanger, P.O. Thermal Comfort. Analysis and Applications in Environmental Engineering; Danish Technical Press: Copenhagen, Denmark, 1970. [Google Scholar]
- ANSI/ASHRAE 55-2020; Thermal Environmental Conditions for Human Occupancy. ASHRAE: Atlanta, GA, USA, 2020.
- ISO-7730, 2005(E); Ergonomics of the Thermal Environment—Analytical Determination and Interpretation of Thermal Comfort Using Calculation of the PMV and PPD Indices and Local Thermal Comfort Criteria, 3rd ed. ISO: Geneva, Switzerland, 2005.
- Gilani, S.I.U.H.; Khan, M.H.; Pao, W. Thermal Comfort Analysis of PMV Model Prediction in Air Conditioned and Naturally Ventilated Buildings. In Proceedings of the Energy Procedia; Elsevier Ltd.: Amsterdam, The Netherlands, 2015; Volume 75, pp. 1373–1379. [Google Scholar]
- Laouadi, A. A New General Formulation for the PMV Thermal Comfort Index. Buildings 2022, 12, 1572. [Google Scholar] [CrossRef]
- The Building Regulations 2010. 2010 No. 2214; Building and Buildings, England and Wales; UK Statutory Instruments, UK Parliament: London, UK, 2010. [Google Scholar]
- Imani, E.; Dawood, H.; Dawood, N.; Occhipinti, A. A Hybrid Framework for Optimizing Energy Efficiency and CO2 Reduction Using Data-Driven and Physics-Based Scenario Analysis. In Proceedings of the 24rd International Conference on Construction Applications of Virtual Reality (CONVR 2024), Sydney, Australia, 4–6 November 2024. [Google Scholar]
- Williams, S.; Short, M.; Selvakumar, A. An Internet of Things Development Framework for Smart Cities Pilot Study. In Proceedings of the 4th International Conference on Robotics, Intelligent Automation and Control Technologies, RIACT 2023, Chennai, India, 20–22 October 2023. [Google Scholar]
- Ferdoush, S.; Li, X. Wireless Sensor Network System Design Using Raspberry Pi and Arduino for Environmental Monitoring Applications. In Proceedings of the Procedia Computer Science; Elsevier B.V.: Amsterdam, The Netherlands, 2014; Volume 34, pp. 103–110. [Google Scholar]
- Bečkovskỳ, D.; Vajkay, F.; Tichomirov, V. Computer Tools to Determine Physical Parameters in Wooden Houses. Mater. Tehnol. 2016, 50, 607–610. [Google Scholar] [CrossRef]
- UK Government. Council Tax: Stock of Properties, 2023—Statistical Commentary. Available online: https://www.gov.uk/government/statistics/council-tax-stock-of-properties-2023/council-tax-stock-of-properties-statistical-commentary (accessed on 22 March 2025).
- Chatzivasileiadi, A.; Lila, A.M.H.; Lannon, S.; Jabi, W. The Effect of Reducing Geometry Complexity on Energy Simulation Results. In Proceedings of the 36th Annual Education and Research in Computer Aided Architectural Design in Europe (eCAADe) 2018, Lodz, Poland, 17–21 September 2018. [Google Scholar]
- Ashrae ANSI/ASHRAF. Addendum a to ANSI/ASHRAE Standard 169-2020; Climatic Data for Building Design Standards; ASHRAE: Peachtree Corners, GA, USA, 2021. [Google Scholar]
- Jacovides, C.P.; Kontoyiannis, H. Statistical Procedures for the Evaluation of Evapotranspiration Computing Models. In Agricultural Water Management; Elsevier: Amsterdam, The Netherlands, 1995; Volume 27. [Google Scholar]
- Suaib, R.M.; Nuha, H.H.; Fathoni, M.F. Monitoring and Prediction of Temperature and Humidity at Telkom University Landmark Tower (TULT) Using Generalized Additive Model (GAM) and Internet of Things (IoT). In Proceedings of the 2023 International Conference on Data Science and Its Applications, ICoDSA 2023, Bandung, Indonesia, 9–10 August 2023; Institute of Electrical and Electronics Engineers Inc.: New York, NY, USA, 2023; pp. 465–470. [Google Scholar]
- Monetti, V.; Davin, E.; Fabrizio, E.; André, P.; Filippi, M. Calibration of Building Energy Simulation Models Based on Optimization: A Case Study. In Proceedings of the Energy Procedia; Elsevier Ltd.: Amsterdam, The Netherlands, 2015; Volume 78, pp. 2971–2976. [Google Scholar]
- Tomorad, J.; Horvat, I.; Dović, D. Study of Operative Temperature Using the Novel Detail Approach in Determining Mean Radiant Temperature—Comparison between Wall-Mounted Convector and Conventional Radiator. Trans. Famena 2018, 42, 27–38. [Google Scholar]


Disclaimer/Publisher’s Note: The statements, opinions and data contained in all publications are solely those of the individual author(s) and contributor(s) and not of MDPI and/or the editor(s). MDPI and/or the editor(s) disclaim responsibility for any injury to people or property resulting from any ideas, methods, instructions or products referred to in the content. |
© 2025 by the authors. Licensee MDPI, Basel, Switzerland. This article is an open access article distributed under the terms and conditions of the Creative Commons Attribution (CC BY) license (https://creativecommons.org/licenses/by/4.0/).