Article

Research on the Coupling of Public Space Morphology and Summer Wind Environment in Qingdao’s Urban Villages

College of Civil Engineering and Architecture, Shandong University of Science and Technology, Qingdao 266590, China
*
Author to whom correspondence should be addressed.
Buildings 2025, 15(7), 1066; https://doi.org/10.3390/buildings15071066
Submission received: 27 February 2025 / Revised: 14 March 2025 / Accepted: 25 March 2025 / Published: 26 March 2025
(This article belongs to the Section Architectural Design, Urban Science, and Real Estate)

Abstract

:
With the development of modern cities, people’s living environment requirements are constantly improving. Urban villages in the Qingdao area, as a key area for urban renewal, are affected by the sea breeze and have a warm and humid climate in summer, which, together with their problems of irrational layout and the poor ventilation of outdoor public space, seriously reduce the quality of public space. In order to improve the outdoor comfort and living quality of urban village residents, this study uses CFD numerical simulation and SPSS25 software analysis to investigate the coupled relationship between outdoor public space morphology and the summer wind environment in urban villages, and derives a range of values for public space morphology indexes to meet the needs of human comfort. The study found the following conclusions: a. The average wind speed ratio is negatively correlated with household profile density and enclosure and positively correlated with dispersion, and the degree of influence is in the order of enclosure > dispersion > household profile density. b. When household profile density is less than 0.5328, enclosure is less than 0.8228, and dispersion is less than 17.21, the percentage of comfort zone area in the urban villages increases significantly. The renewal and transformation of urban villages should be based on the interaction mechanism between public space morphology and wind environment in the urban villages, which provides a reference basis for improving the spatial quality of urban villages.

1. Introduction

Urban villages constitute the original villages that have been left behind as a result of rapid urbanization in the built-up areas of cities. These villages have retained some of their rural characteristics, yet they generally face challenges such as a dense population, complex social structure, crowded spatial layout, underdeveloped infrastructure, and limited green cover. The substandard ventilation of outdoor areas, imbalanced wind speed distribution, exacerbated urban heat island effect, and diminished self-cleaning capacity of air resulting from these issues have had a profound impact on the quality of outdoor air in urban villages, particularly during the summer months. This has significantly diminished the residents’ perception of human comfort and their frequency of outdoor activities. Consequently, elucidating the interplay between the morphology of outdoor public spaces and the summer wind environment in urban villages emerges as a pivotal strategy to enhance residents’ comfort and overall quality of life in these settings.
As an important work of urban renewal at the present stage, the transformation of urban villages is no longer a simple matter of demolition and relocation, but a combination of “retention, reform and demolition”, which retains the use of existing buildings, maintains the scale of the old urban pattern, continues the urban features and styles, strengthens urban ecological restoration, and actively and steadily implements urban renewal activities [1]. Under the policy background of preventing large-scale demolition and construction, most of the previous studies on urban villages have focused on the development and utilization of urban villages [2], land reuse in urban villages [3], the coordination of stakeholders’ interests [4], transformation modes and strategies for urban villages [5], lessons learned from successful utilization cases [6], comparative studies on the transformation of urban villages in China and other countries in the context of rapid urbanization [7,8], and the post-transformation assessment of urban villages [9]. In this latter stage, scholars direct their attention to the quality of the living environment in urban villages [10] and endeavor to enhance its attractiveness in order to effect a change in the public’s perception of urban villages as “dirty and poor” [11]. Moreover, studies have emphasized public participation [12,13], advocated for multi-party collaborative governance [14,15], and focused on the feelings and needs of specific individuals in the transformation process, reflecting the concept of people-centeredness [16]. In contrast, the focus of foreign scholars has been on the logic of informal settlement formation [17], the morphogenesis of urban villages [18,19], the relationship between the regional location of urban villages and the community economy [20], the experience of village urbanization [21], land use and resource allocation [22], and the sustainable development of villages [23]. In wind environment research, computational fluid dynamics (CFD) simulation has been widely and maturely applied to study the physical environments of indoor and outdoor spaces of various types and scales, including urban neighborhoods, residential areas, rural settlements, plazas, indoor spaces, etc. Existing studies have shown that CFD simulation can effectively analyze the wind, temperature, and air quality inside and outside of buildings. WU et al. used CFD simulation to study the wind environment conditions of a community atrium space, explored the relationship between the building volume, atrium openings, and wind direction, and proposed that CFD simulation be used to study the wind environment in the early stages of design to support the design [24]. Zhang et al. employed CFD simulation to explore the wind environment of the outdoor areas of traditional villages in northeast Sichuan; with the aim of enhancing the wind environment, they put forward the optimization of the size and orientation of architectural courtyards [25]. In the context of foreign applications of CFD simulations, Hågbo et al. employed CFD simulations to investigate pedestrian wind comfort and safety in urban forms with varying degrees of urbanization. Their findings indicated that urban complexity did not exert a substantial influence on the number of wind directions necessary for a reliable assessment [26]; K.E. et al. employed a combination of wind tunnel tests and CFD simulations to ascertain that the dispersion of air pollutants around a building is predominantly dictated by the interaction between wind and the structure. This interaction, in turn, is contingent on the building’s cross-sectional geometry [27]. In recent years, with the emphasis on building an ecological civilization and improving rural habitats, the study of village wind environments has not been limited to the scale relationship between village street space and architectural courtyards, etc. [28], and researchers have begun to pay more attention to the influence of space morphology, layout characteristics, topography, and environment on the village wind environment and comfort: Teng et al. analyzed the characteristics of thermal comfort patterns in urban informal settlements using the Modified Temperature and Humidity Index (MTHI) and used spatial regression analysis to explore the relationship between thermal comfort and various spatial environmental factors [29]; Wang et al. investigated the thermal environment and thermal comfort of coastal villages in a cold region and obtained information on the thermal demand of the local residents through a resident survey in order to evaluate and improve the thermal environment of the region [30]; Fang et al. conducted a simulation of the physical environment of an urban village in Guangzhou and proceeded to analyze existing problems in the area and formulate corresponding strategies to improve the living environment of such villages and contribute to their transformation and upgrading [31]. Xiong et al. investigated the impact of landscape form on the spatial configuration of villages. Utilizing a multifaceted approach, the researchers examined the impact of village spatial form on microclimate conditions and human comfort level. This investigation was conducted through meticulous measurements and numerical simulation, thereby offering a nuanced and quantitative perspective on the subject [32,33]. In the domain of urban wind environments, research has been conducted on the influence of the thermal environment on comfort levels in urban residential areas, neighborhoods, and urban villages through numerical simulation. Research on the relationship between spatial form and wind environment in urban residential areas, districts, and neighborhoods can also serve as a valuable reference for wind environment research in urban villages [34,35,36,37,38]. The majority of foreign scholars who have conducted research on the relationship between buildings and wind environments have focused on the relationship between wind environments and urban built-up areas, as well as the use of wind energy in built-up environments [39,40]. These studies can provide references for perspectives and methodologies for subsequent research on urban villages.
Existing studies on the relationship between the morphology of public space in urban villages and the wind environment are inadequate for two reasons. Firstly, the existing regional climate research has focused predominantly on hot and humid regions in the south and cold regions in the north, neglecting a targeted analysis of northern coastal cities characterized by both an oceanic climate and high density. Secondly, the research on the dynamic coupling mechanism is deficient, with the majority of studies adopting a static descriptive approach. There is a paucity of research on the dynamic correlation between morphology indices and the numerical simulation of CFD and statistical analysis. Finally, the comfort threshold standard of spatial parameters has not been established, resulting in a lack of quantitative bases for planning practices. To address this knowledge gap, this study utilizes CFD simulation and mathematical statistics to reveal the dynamic coupling law between outdoor public space morphology and summer wind environment in urban villages. The study quantitatively determines the threshold range of spatial morphology indices to enhance wind comfort. The numerical range required of outdoor public space indicators in order for urban villages to meet the demand for comfort is determined. The research results provide a basis for optimizing the design of spatial forms for urban village renovation in Qingdao and for providing a paradigm for climate-adaptive updating in other coastal cities.

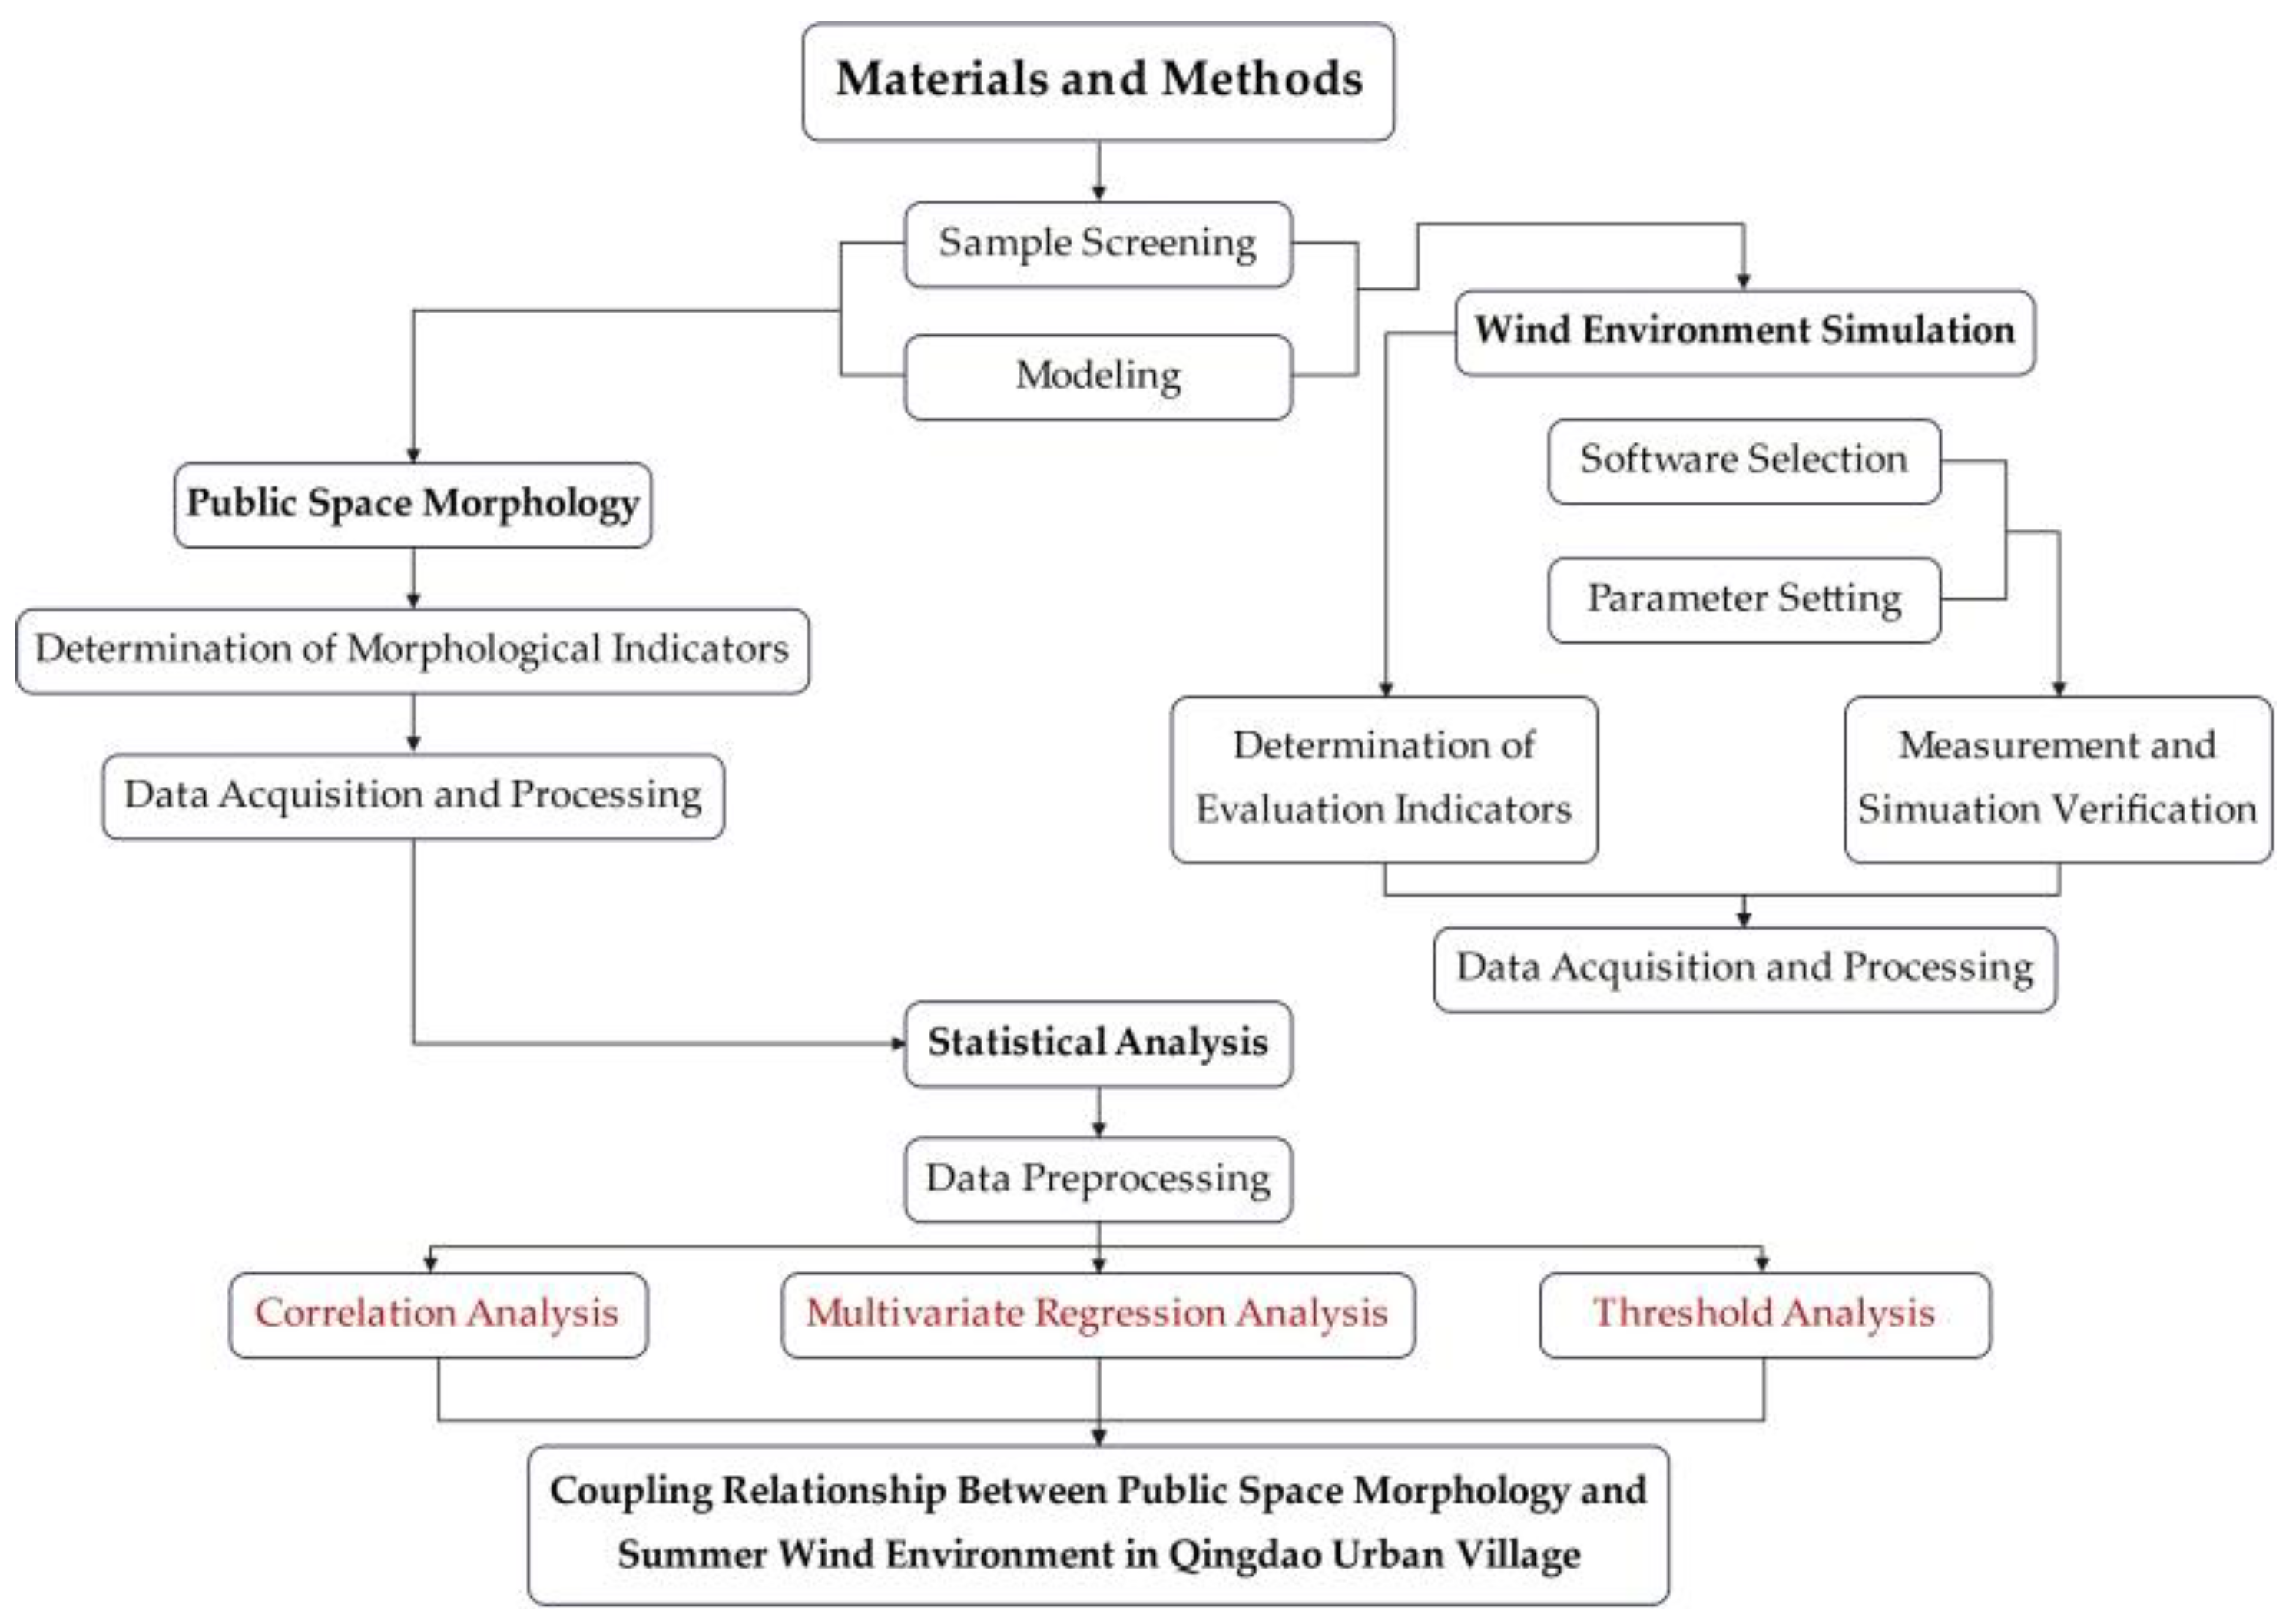
2. Materials and Methods

This study explores the coupling relationship between public space morphology and summer wind environment in urban villages in the Qingdao region. The research methodology included screening sample urban villages, constructing an urban village model, extracting spatial morphology indicators, conducting CFD wind environment simulation, and conducting statistical analysis. The research process is shown in Figure 1.

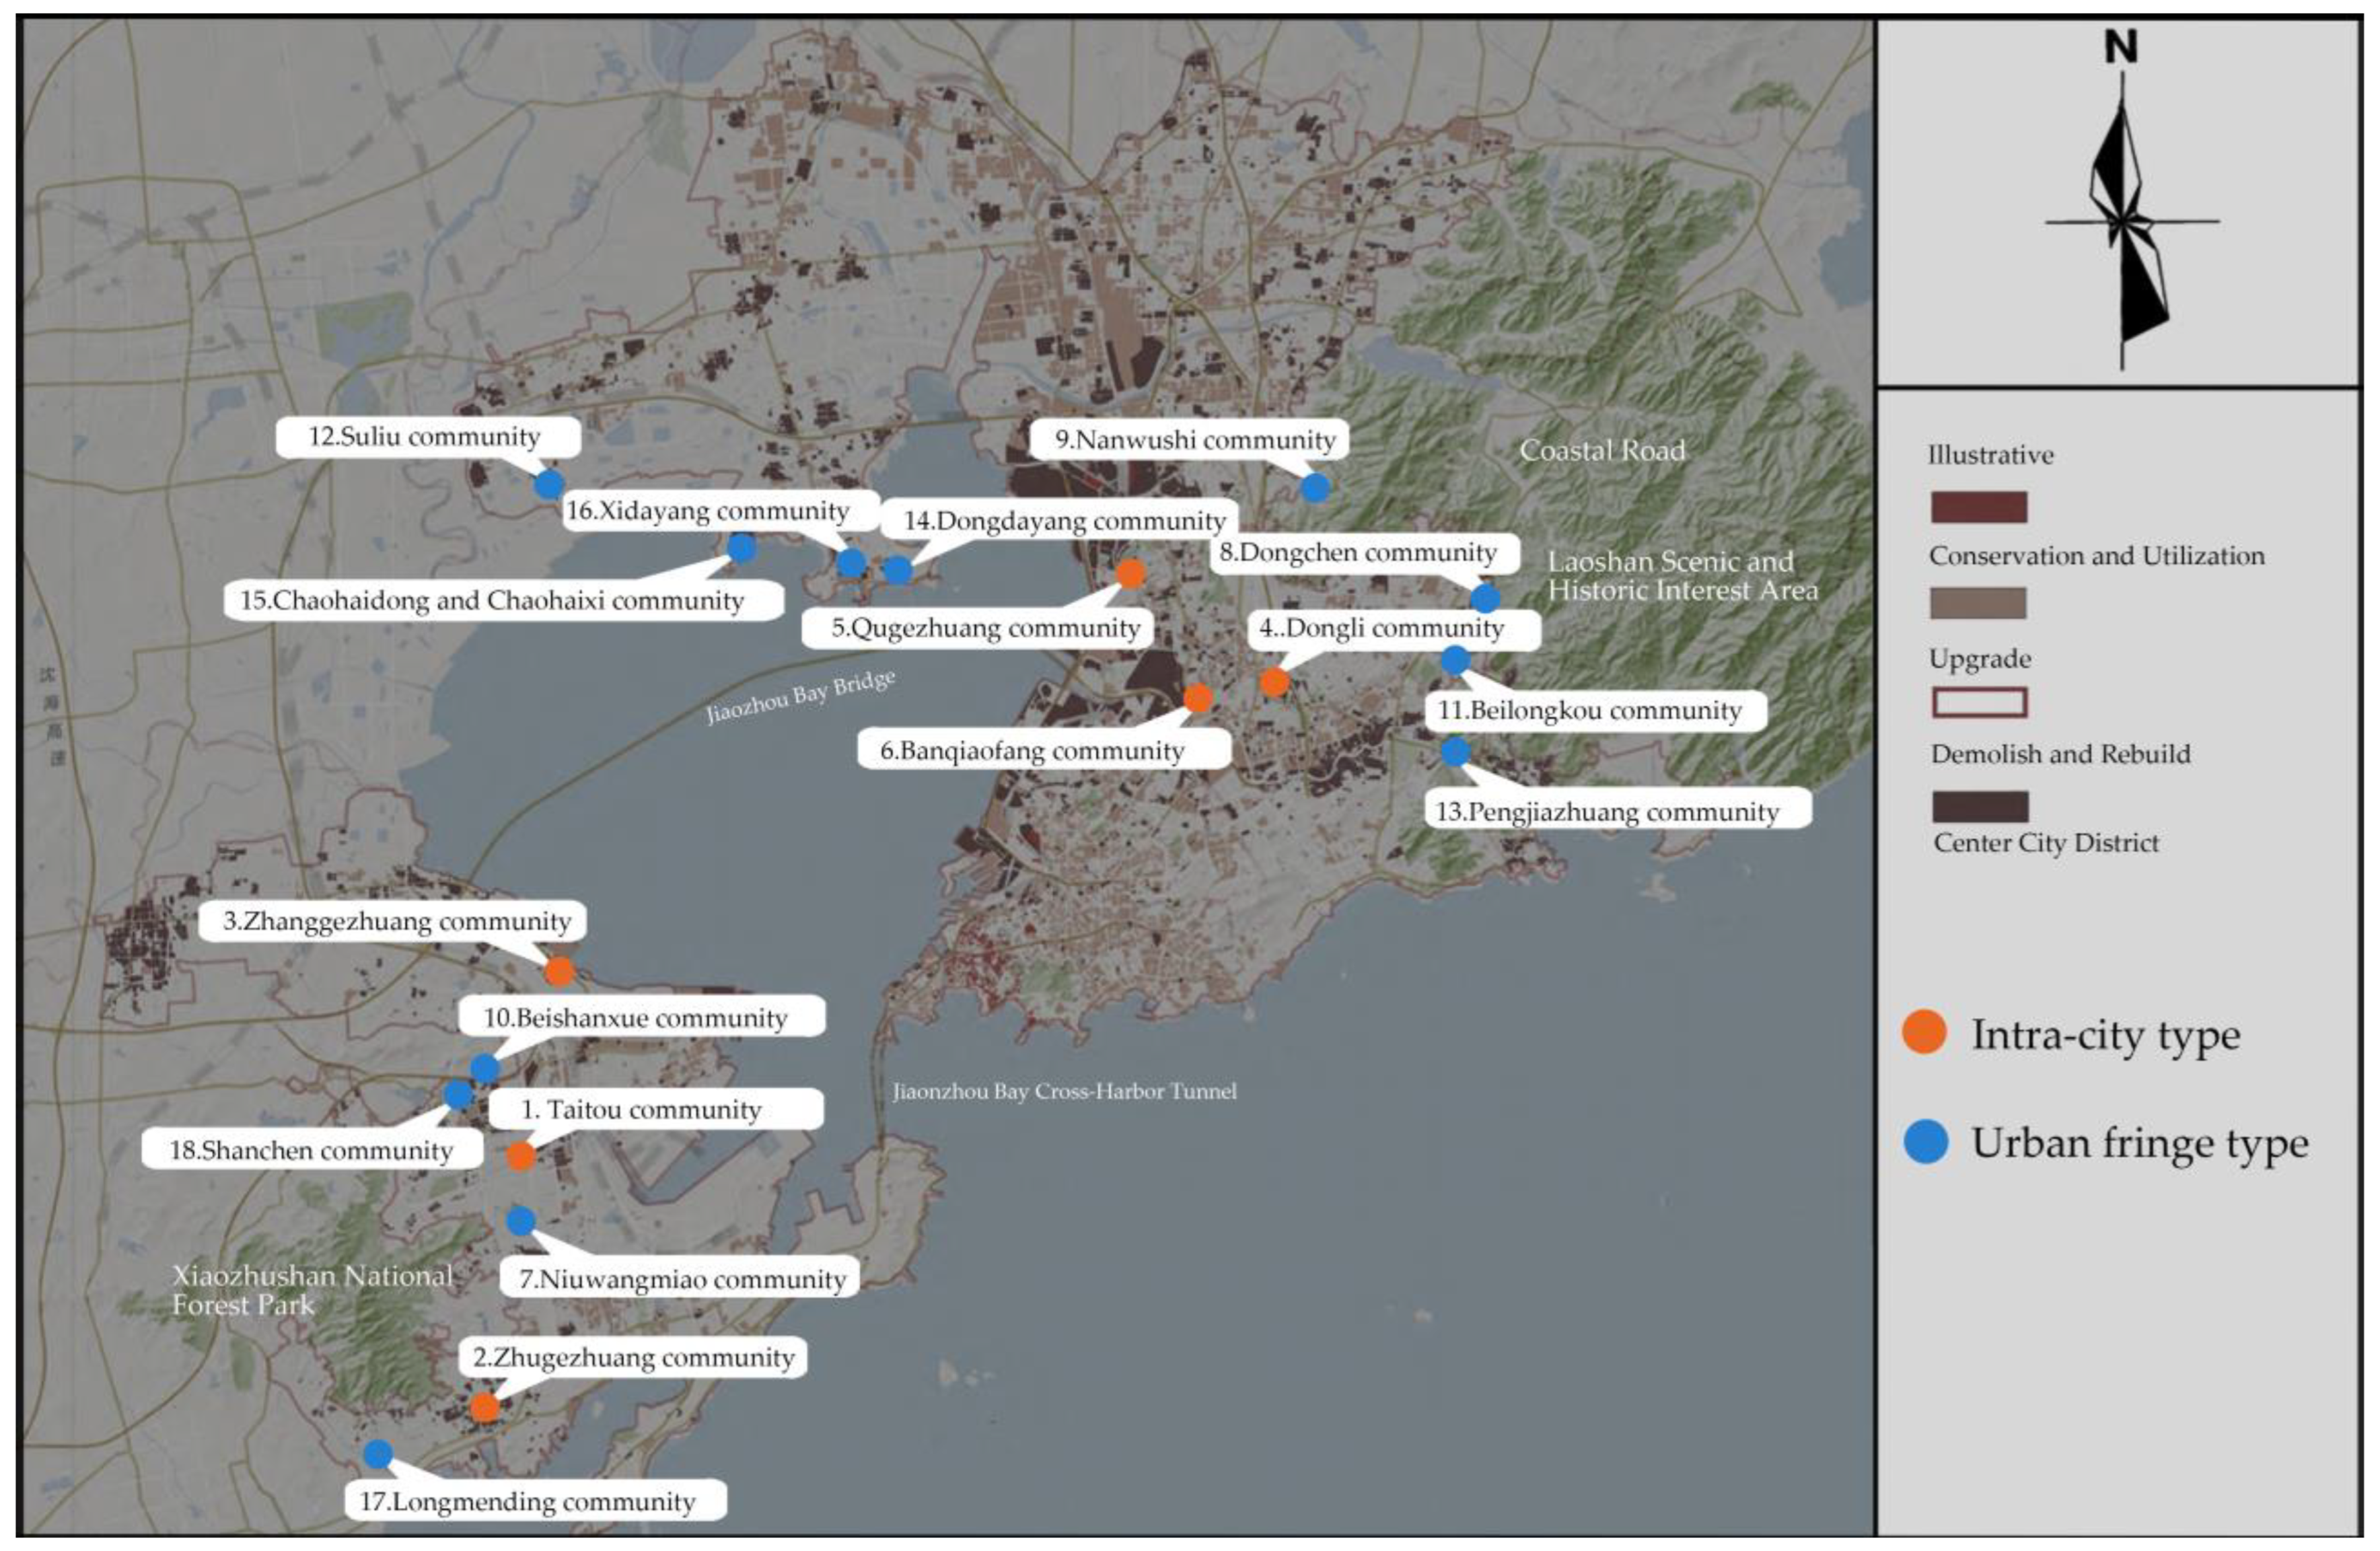
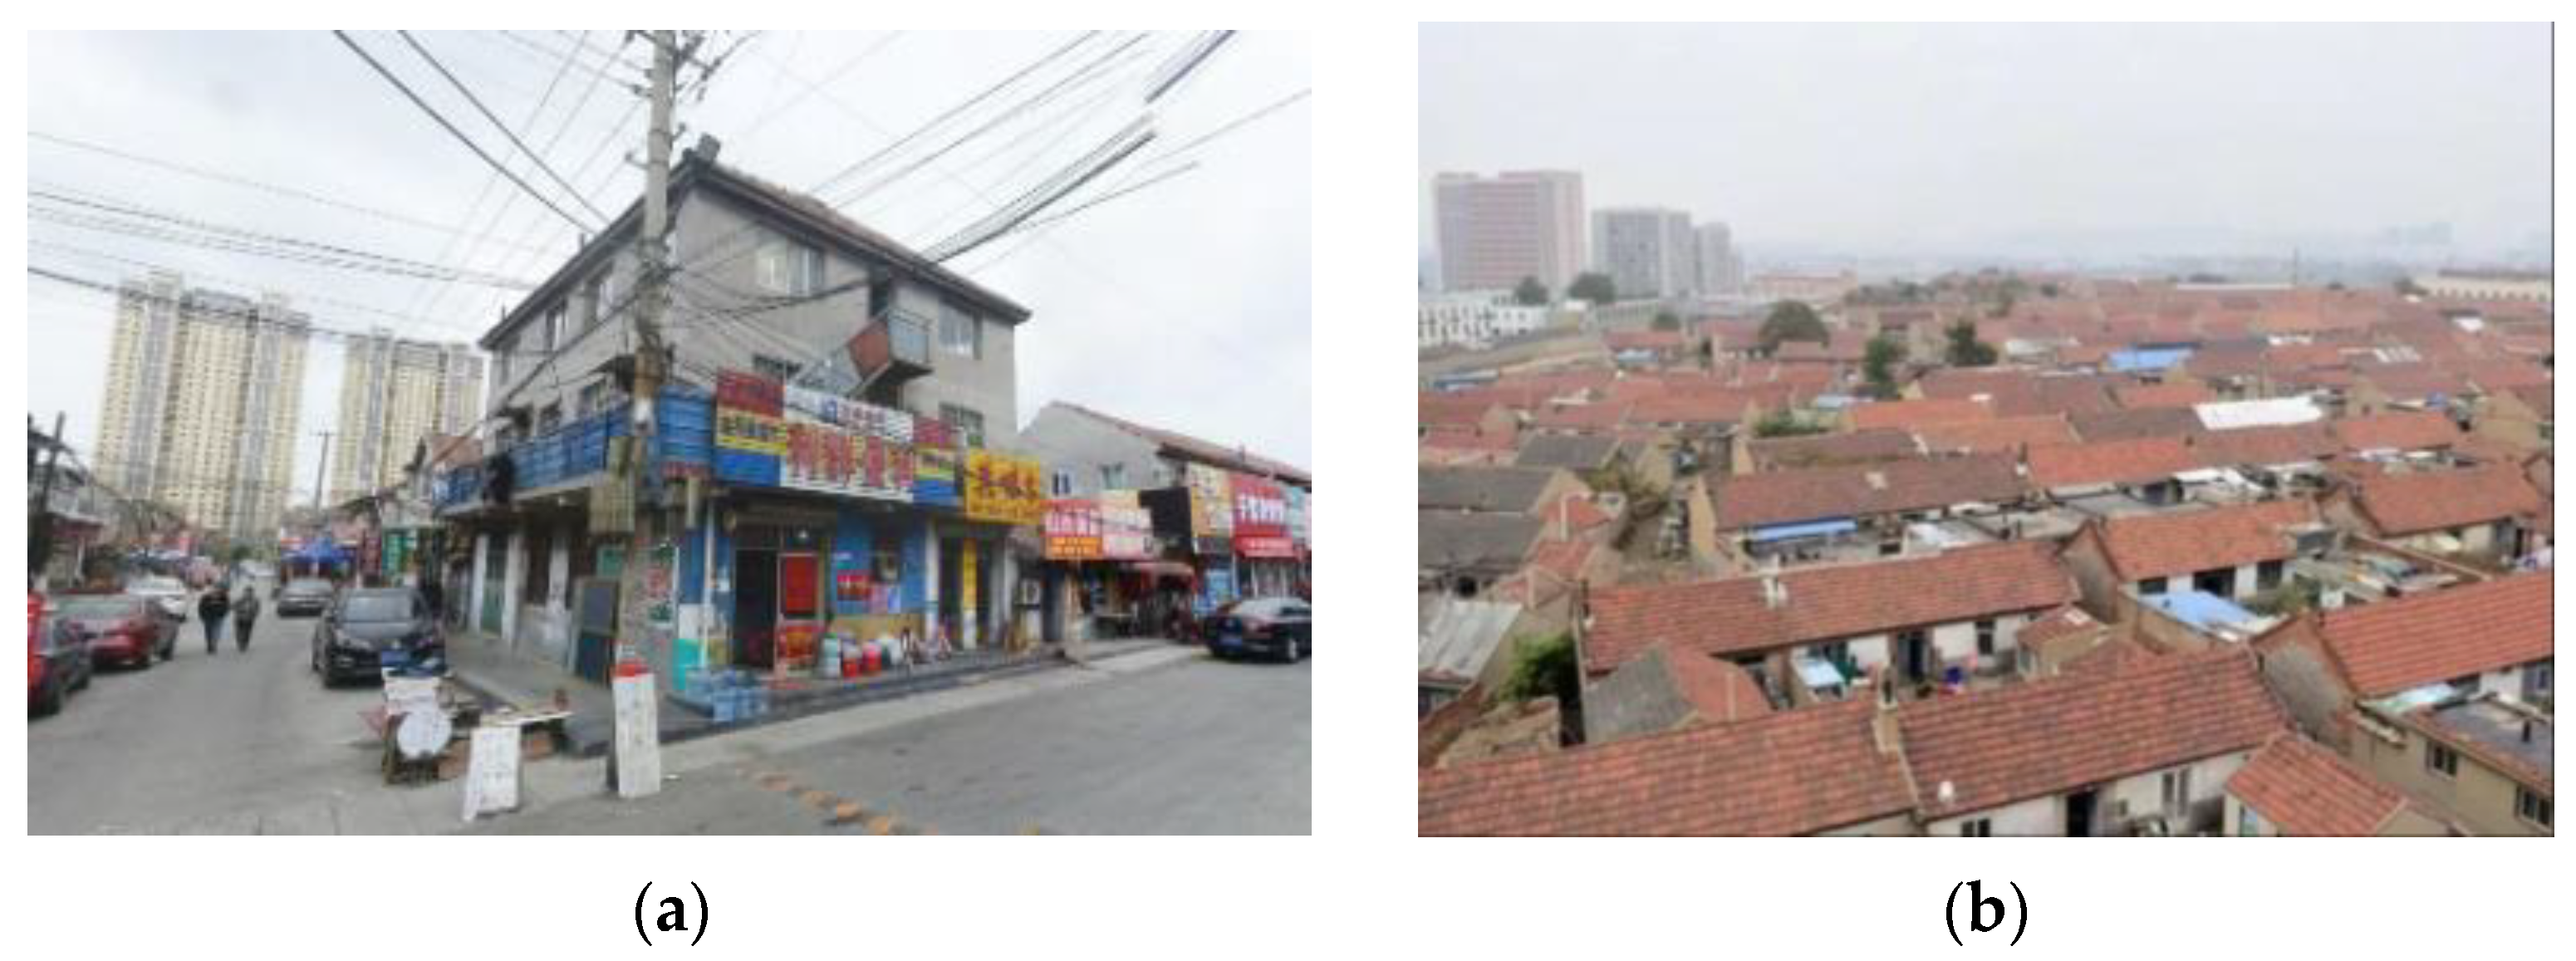
2.1. Study Area Profile

The topography and geomorphology of the Qingdao area are characterized by a combination of mountainous regions, plains, and a coastline. The year-round wind environment is influenced by two major factors: the northwest monsoon and the southeast sea breeze. During summer months, the marine environment exerts a direct influence on the Qingdao area, characterized by elevated temperatures and humidity levels. The sea breeze is characterized by substantial wind speeds, with an average velocity of 4.6 m per second, and the predominant wind directions are from the south and southeast. The urban villages of Qingdao can be categorized into two distinct types, namely downtown and the outskirts, based on their geographical proximity to the city center. The configuration of urban villages within the city is contingent on the urban area’s development, and the majority of their boundary patterns exhibit greater regularity. The building orientation is predominantly consistent with the prevailing wind direction in Qingdao. In contrast, the layouts of the urban villages on the outskirts of the city are more aligned with the topography and geomorphology, resulting in more varied boundary patterns. The similarity of street layout and building orientation in urban villages leads to differences in public space, primarily reflected in space morphology indicators. In this study, 18 samples of urban villages were selected as research objects by reviewing the descriptions of urban village transformation areas in the document “Qingdao Urban Renewal Special Plan (2021–2035)”, local records, and field research (Figure 2).

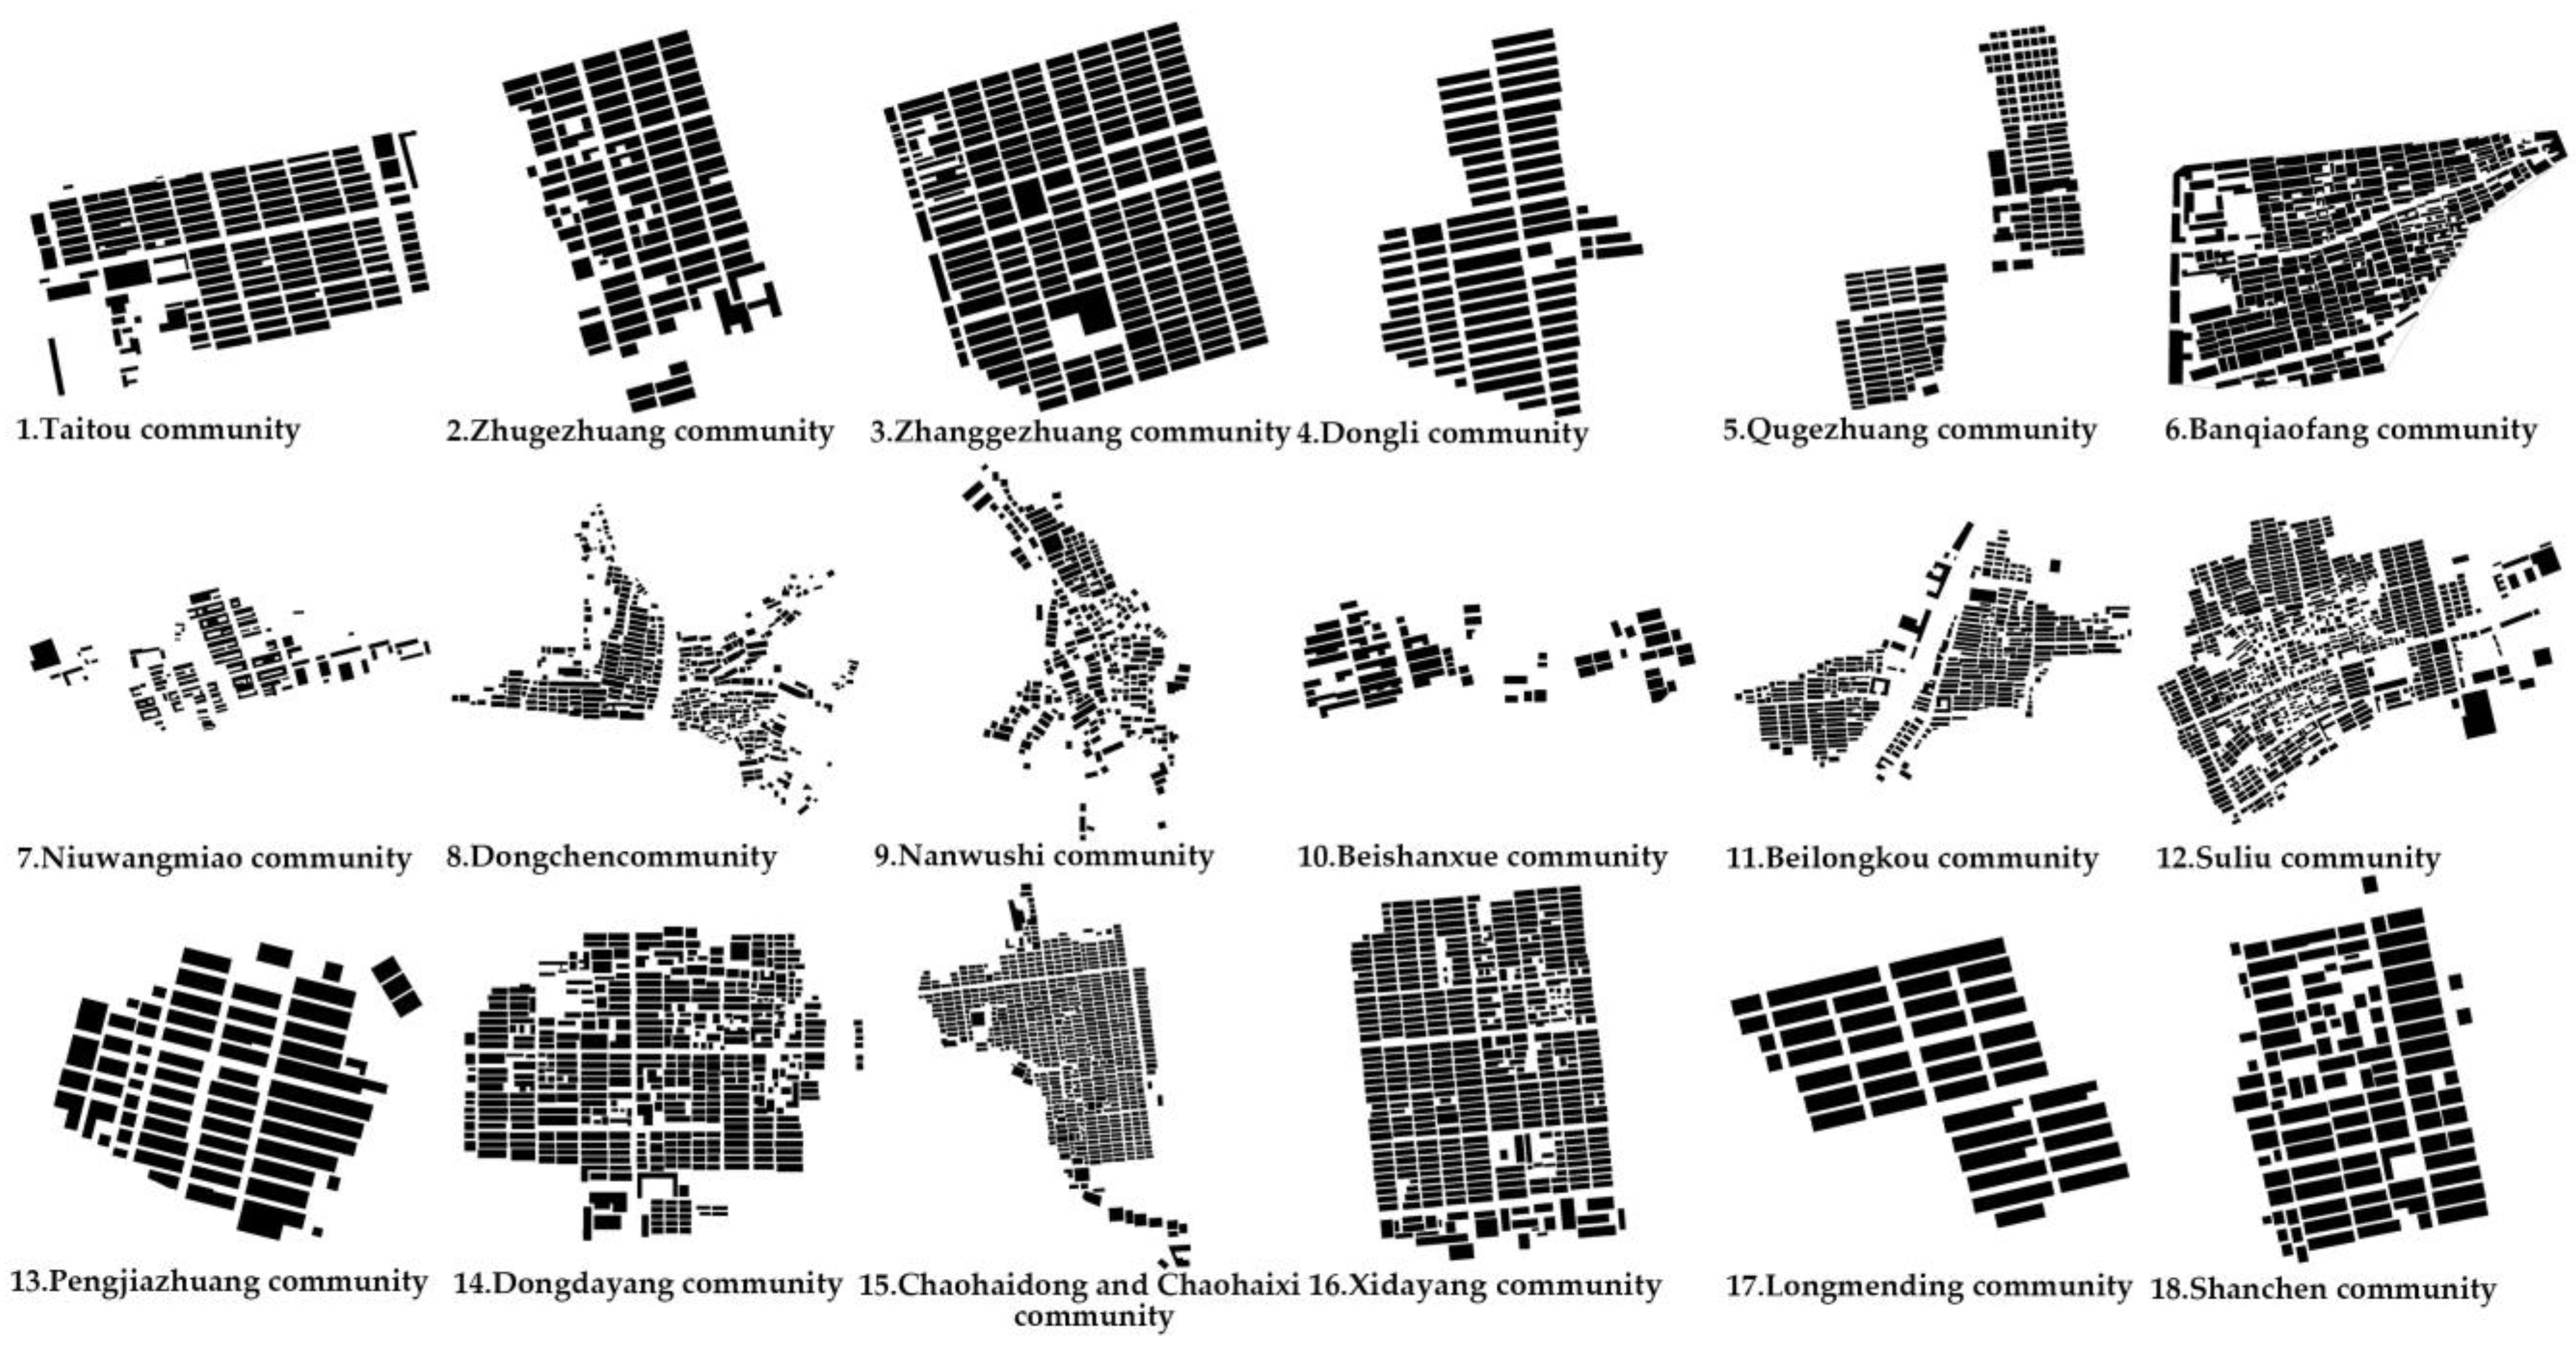
2.2. Urban Village Modeling

This study explores the correlation between public open space and the summer wind environment in urban villages, examining it from the perspective of spatial form. The modeling process disregarded the effects of slope, vegetation, and subsurface characteristics, as the study’s primary focus was on the interaction between spatial morphology and the wind environment. Field research revealed that the sample urban villages were dominated by two-story buildings with pitched roofs and an average height of 8–10 m (Figure 3). In light of these observations, the model was simplified by uniformly reducing the buildings to regular cubic blocks with a height of 9 m. The townhouses were considered as integral blocks (Figure 4).

2.3. Urban Village Public Space Morphology Study

2.3.1. Determination and Acquisition of Public Space Morphology Indicators

A growing body of research has demonstrated that spatial morphology indicators, such as building density, floor area ratio, enclosure, dispersion, staggering, average building height, and windward area ratio, are pivotal factors influencing the wind environment. These indicators have been extensively employed in analyses and research aimed at quantifying the morphology of public spaces and the physical environment [41,42,43,44,45,46,47,48,49]. However, our field research revealed that the building heights of the sampled urban villages were similar and generally low and the house orientations were relatively uniform. These findings limit the applicability of morphology indicators such as average building height, building orientation, street height-to-width ratio, and staggering in this study. Concurrently, the majority of urban villages are distinguished by their high density, compact layout, and irregular boundaries, which are the focal point and the challenge of future urban village transformation. Consequently, this study prioritizes the selection of spatial morphology indicators that reflect the sparseness, openness, and distribution characteristics of space (Table 1).
In the context of assessing public space morphology, it is imperative to consider both the physical and imaginary boundaries of urban villages, given the irregularity and uncertainty that characterize their boundaries [52]. In this study, the imaginary boundaries of the urban villages were established based on the corner vertex connection line of the building units at the periphery of the village. The boundary range of the imaginary boundary was defined as the land area of the urban village (Figure 5d).

2.3.2. Data Acquisition and Processing

In this study, the fundamental information (i.e., floor area, building perimeter, land area, etc.) of urban village building clusters was extracted. This was accomplished by organizing the base map data of the urban villages, obtained from the field survey and the sky map. In addition, public space morphology indicator data for the urban villages were obtained (Table 2).

2.4. Wind Environment Simulation Studies

2.4.1. CFD Simulation Steps and Parameter Settings

In the domain of wind environment research, computational fluid dynamics (CFD) numerical simulation boasts several advantages, including ease of operation, cost-effectiveness, intuitive results, and high simulation accuracy when compared with wind tunnel test methods and field measurement methods. Among the numerous CFD simulation software options, PHOENICS stands out as the most comprehensive, highly accurate, and scalable software. For the present study, PHOENICS was selected to perform the numerical CFD simulation, and the simulation process included the following steps: first, the model of the urban village was imported; second, the computational surface and the position of the model were adjusted; third, the parameters of the wind environment were set; fourth, the mesh was divided; fifth, the number of iterations and convergence control were set; sixth, the simulation results were obtained (Table 3).

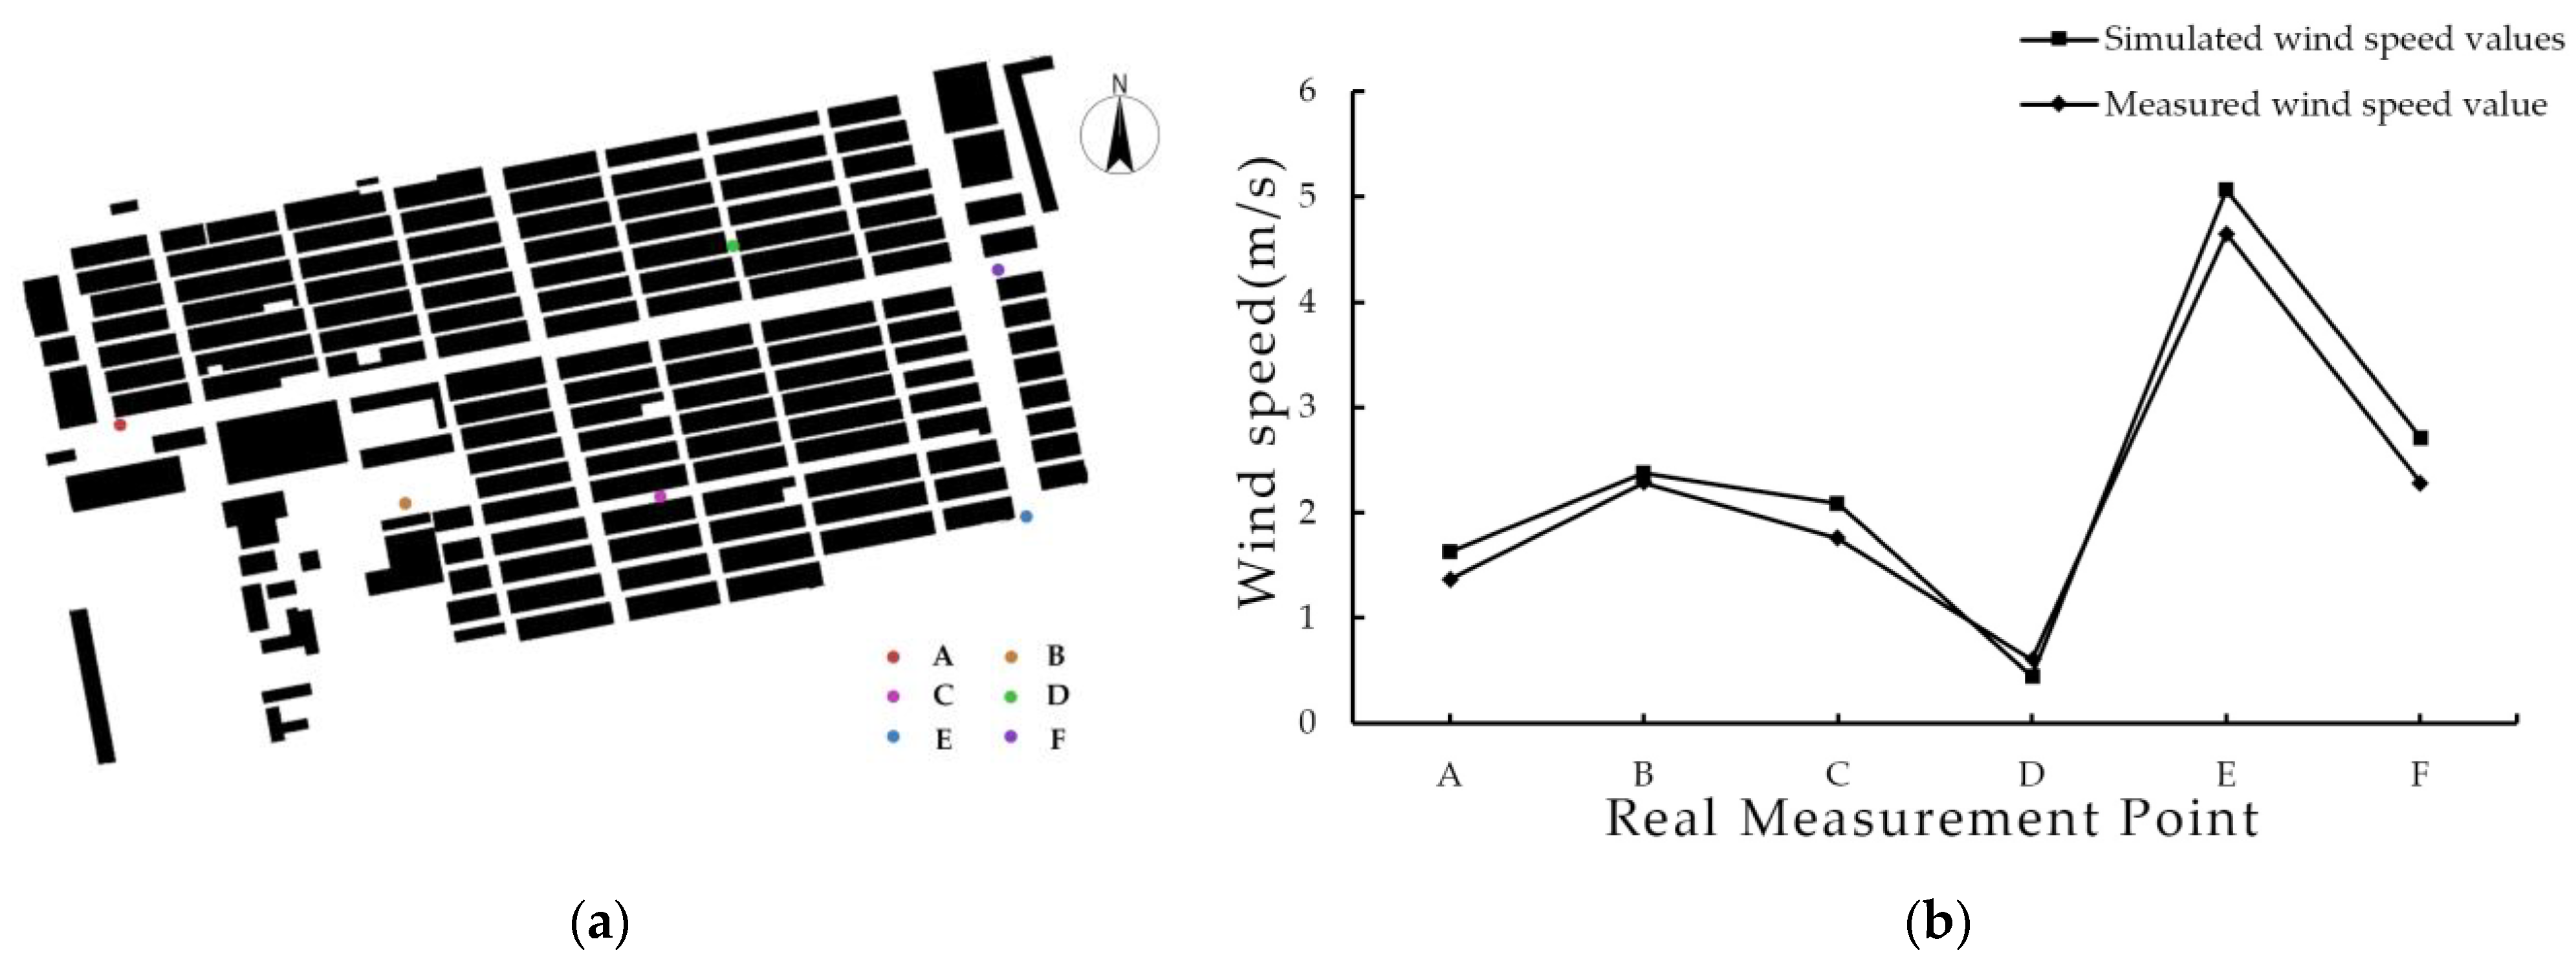
2.4.2. CFD Software Simulation Verification and Real Measurement Analysis

This study utilized field measurements of the wind environment in the Taitou neighborhood, employing a typical summer meteorological day as a real sample. A total of six measurement points were established at 1.5 m pedestrian height in the inner streets of the urban village (Figure 6a). A comparison and analysis of the field measurement data with the simulation results of the PHOENICS2019 software was conducted (Figure 6b). The results demonstrate a high degree of consistency in the wind speed trends at each measurement point. While the measured average wind speed exhibited a slight decrease compared to the simulation results, the observed deviation remained within acceptable limits. This result demonstrates the urban village model constructed in this paper’s capacity to reflect the characteristics of the actual wind field with good accuracy. Furthermore, it provides substantial evidence in support of the reliability of the PHOENICS software in simulating the wind environment in outdoor public spaces in urban villages. In light of this validation, the present study utilized the software to methodically simulate and analyze the wind environment in urban villages.

2.4.3. Wind Environment Evaluation Criteria

At present, the focus of wind environment research is on the evaluation of the wind environment, which utilizes meteorological data, including wind speed, wind direction, wind pressure, and other meteorological data, to reflect the basic characteristics of wind. This evaluation also explores the effect of wind on human feelings, based on the principle of comfort. The present study utilized the average wind speed values at 1.5 m pedestrian height as its research basis. The average wind speed ratio was selected as the reflecting index of the wind environment condition, and the comfort zone area ratio was employed as the evaluation criterion for human outdoor comfort (Table 4).
According to the “Green Building Evaluation Standard” [55] and the “China Eco-housing Technology Evaluation Manual,” wind speed should be less than 5 m per second at 1.5 m above the ground level in the pedestrian zones surrounding outdoor buildings. The “Thermal Environment Design Standard for Urban Residential Areas” states that the human body’s perception of wind is weaker when the average outdoor wind speed is less than 1 m/s, and that wind speeds of <1 m/s are not conducive to the dispersion of urban pollutants. Furthermore, extant studies on the outdoor wind environment in Qingdao have predominantly defined the comfort zone of the wind environment as 1–5 m/s [56,57,58,59,60]. Consequently, in this study, the area ratio of the area where the average wind speed falls within the range of 1–5 m/s was employed as an evaluation criterion for a comfortable wind environment.

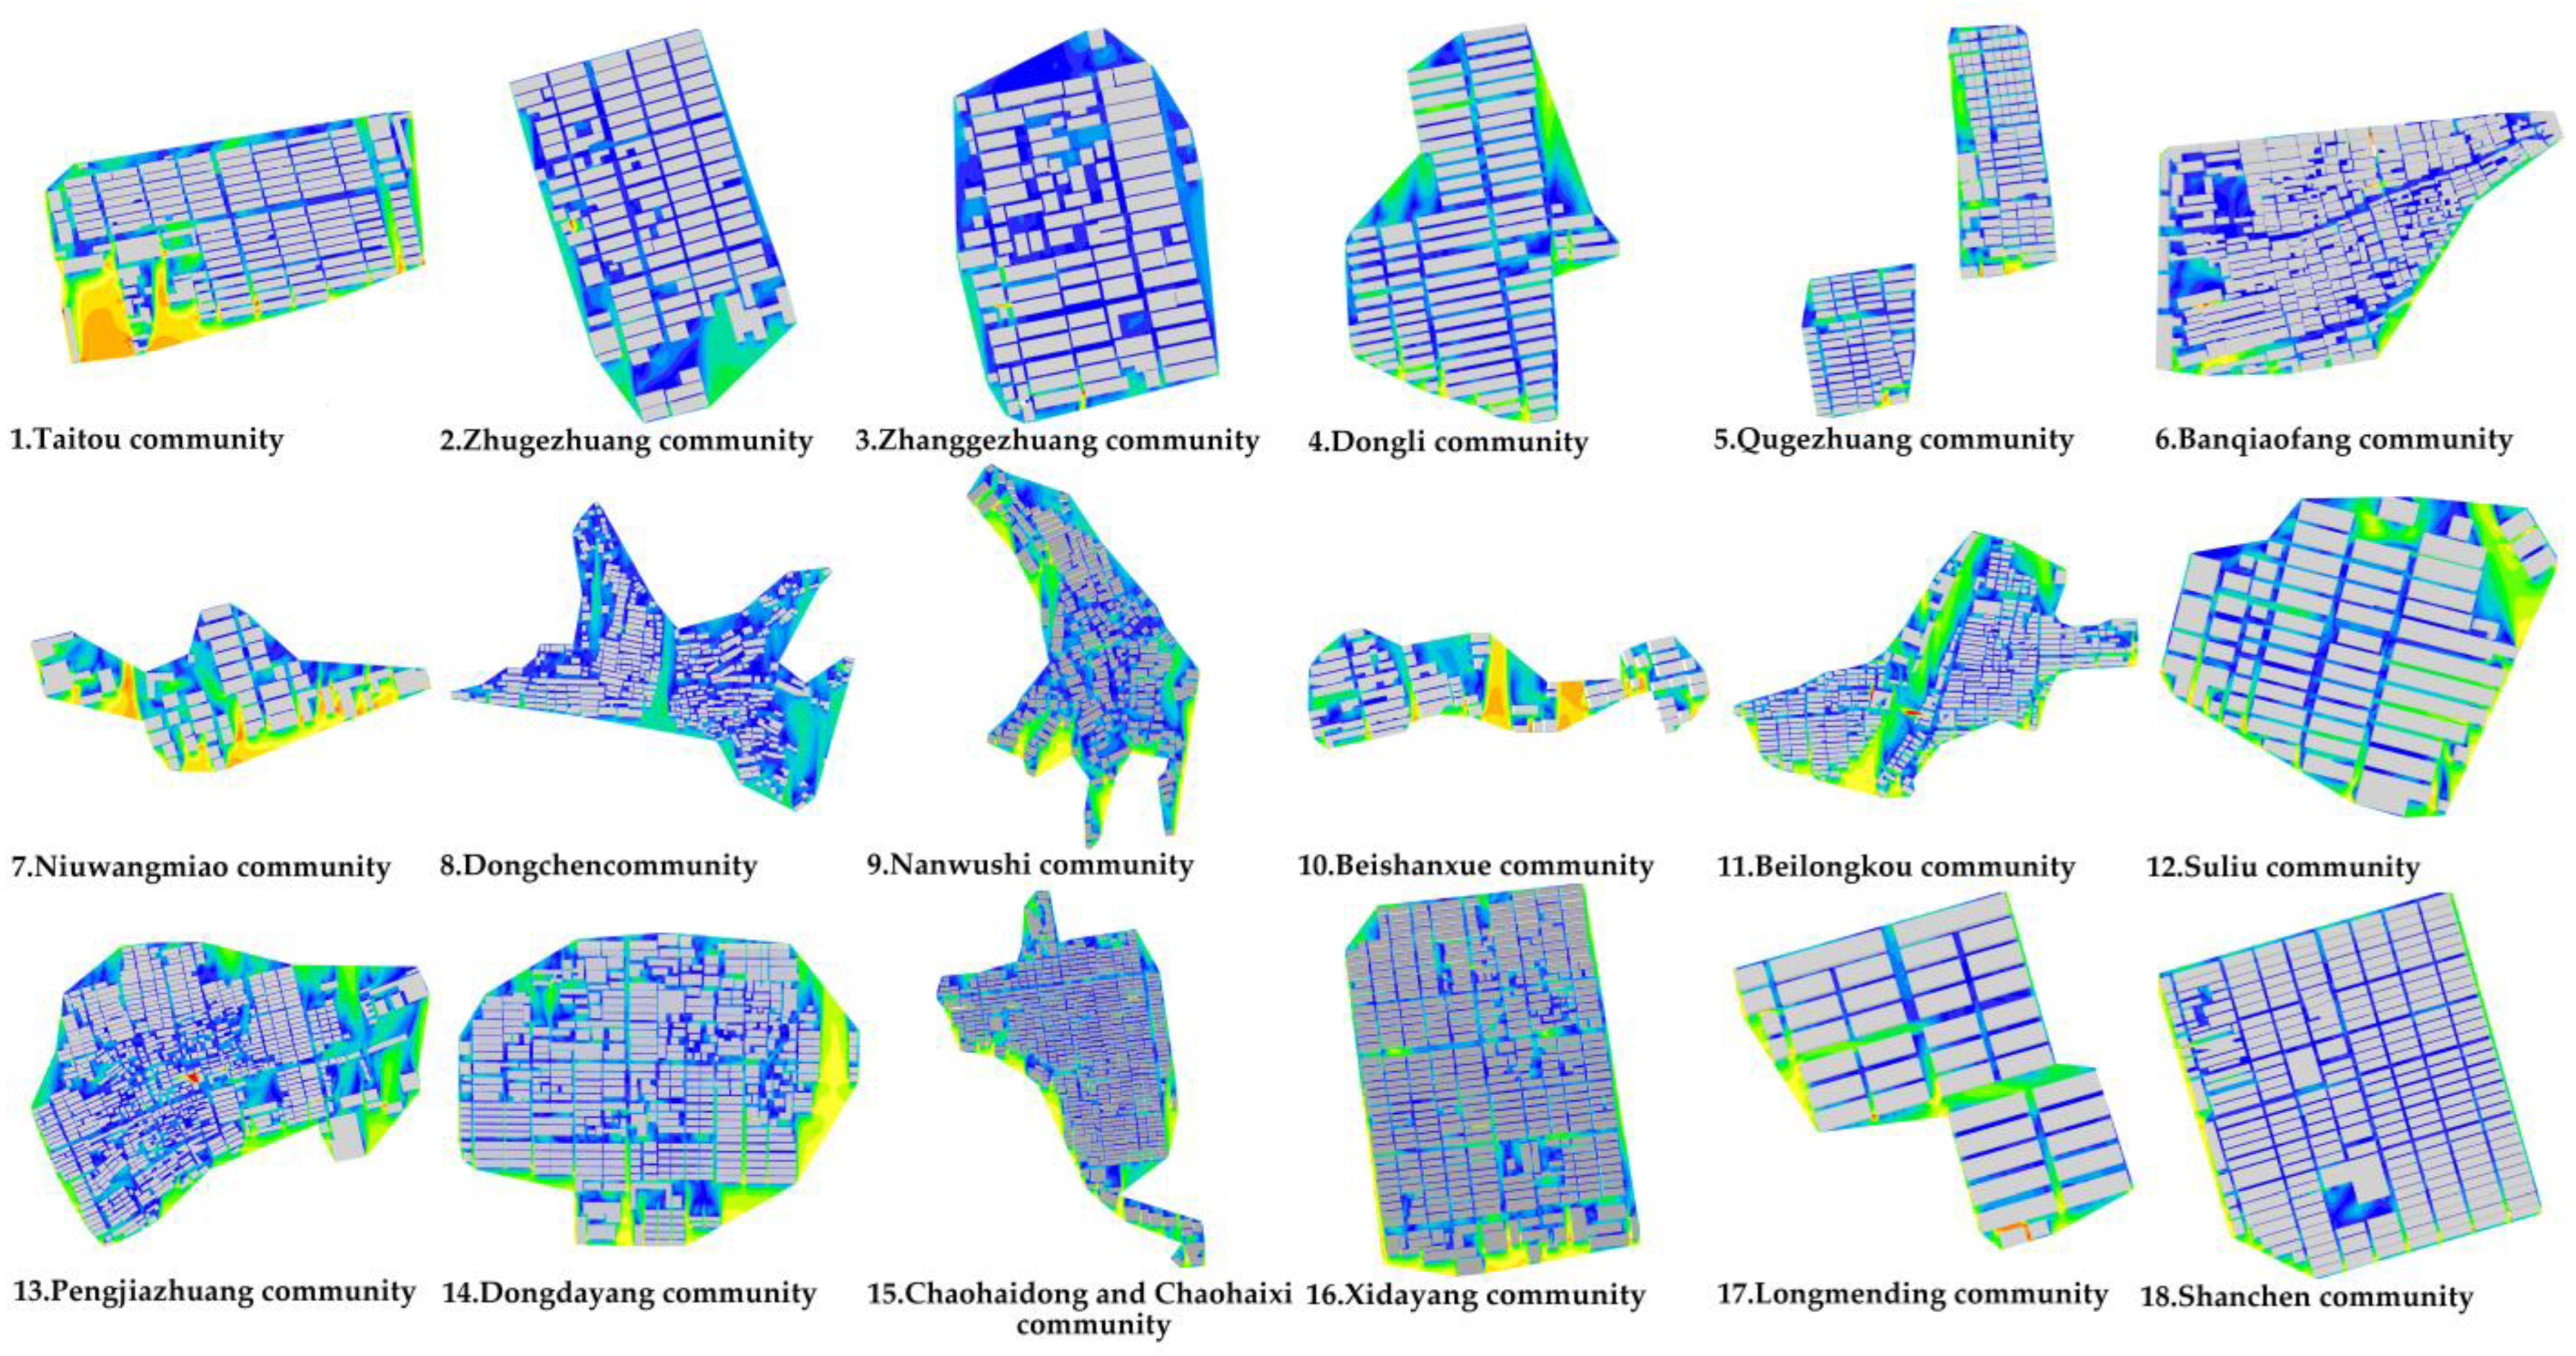
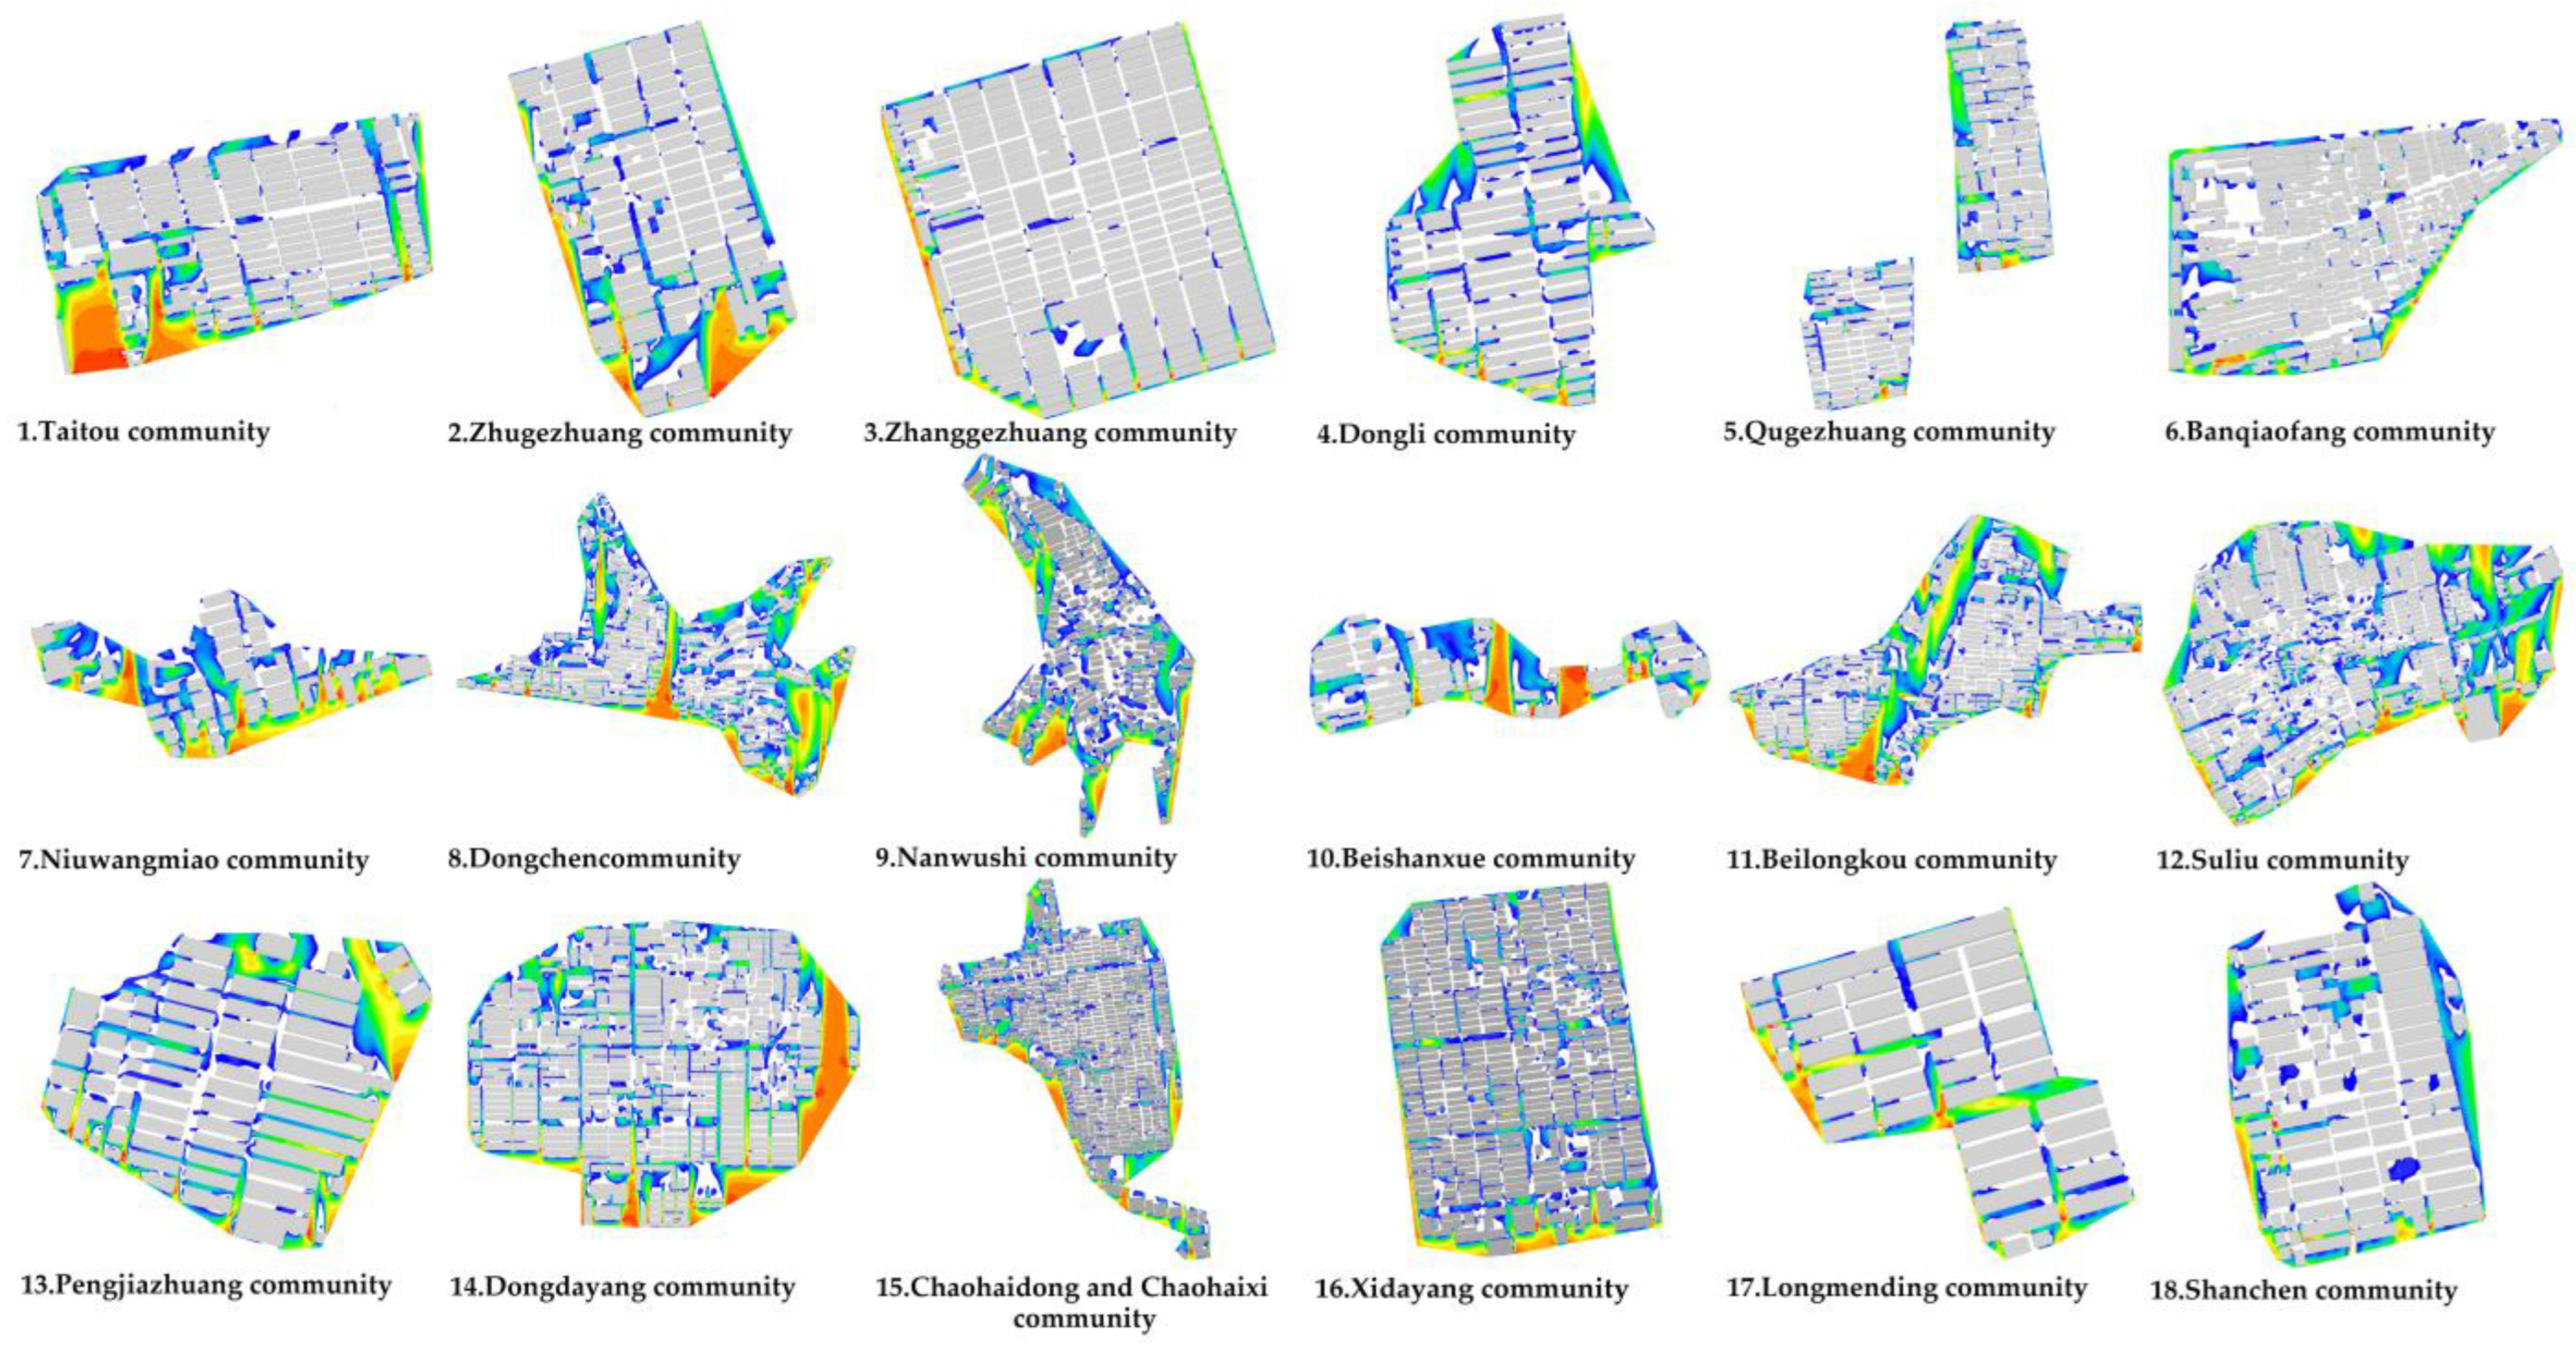
2.4.4. Data Analysis

The wind speed cloud maps at 1.5 m pedestrian height in the outdoor public spaces of 18 urban villages were obtained by PHOENICS simulation (Figure 7). The mean wind speeds at 1.5 m pedestrian height in the urban villages were then calculated, and the mean wind speed ratio at 1.5 m pedestrian height in each sample urban village was calculated by Equation (4) (Table 5).
The prevalence of wind speeds of 1–5 m/s at 1.5 m pedestrian height in the outdoor public spaces of 18 urban villages was obtained by PHOENICS simulation (Figure 8). The cloud maps were processed using Photoshop to obtain the area of the comfort zone and the area of the study area. The percentage of the area of the comfort zone of each sample urban village was then obtained by calculating Equation (5) (Table 6).

2.5. Statistical Analysis Method

2.5.1. Data Preprocessing

A normality test for the ratio of the morphology (via the public space morphology indicators) to the average wind speed was carried out to confirm that it met the conditions of the parameter test. Due to the substantial difference in the order of magnitude of the parameters analyzed, this study adopted the minimum–maximum standardization method to transform the public space morphology indicators. This was employed to eliminate the effect of the order of magnitude of the parameters on the results of the calculations and to ensure that the regression coefficients were comparable. This is demonstrated in Equation (6), where the variables are defined as follows: D’ is the standardized data, D is the original data, Dmax is the maximum value in the data set, and Dmin is the minimum value in the data set.
  D = D     D min D max   D min ,

2.5.2. Correlation Analysis

Pearson correlation analysis was utilized in this study to assess the linear relationship between the variables. The correlation coefficients between the variables were calculated using SPSS software to determine which variables had a significant linear relationship with each other. The findings from this correlation analysis were then employed for the preliminary screening of the variables to be incorporated into the regression model. Pearson’s correlation coefficient was employed to evaluate the strength of the linear relationship between the morphological parameters and wind speed ratio.

2.5.3. Multivariate Regression Analysis

In order to quantify the influence weights of each morphological indicator on the wind speed ratio, multiple linear regression models were developed in this study. Multiple linear regression analyses were performed using SPSS software, with all independent variables entered into the model using the enter method. The goodness of fit of the model was assessed by the coefficient of determination R2 and the adjustment coefficient of determination R2. Additionally, multicollinearity was diagnosed using the variance inflation factor (VIF < 5), and residual independence was tested (Durbin–Watson statistic close to 2).

2.5.4. Threshold Analysis

The objective of this study was to determine the critical values of the morphological indicators of public space in satisfying the demand for outdoor comfort in urban villages. To this end, we first revealed the distribution law of the morphological indicators and the ratio of the area of the comfort zone through the division of intervals. Then, we performed a linear regression analysis using SPSS software to analyze the relationships among the variables in a quantitative way. Finally, we obtained the range of values of the morphological indicators through the inverse deduction of the threshold values.

3. Results

3.1. Coupled Analysis of Outdoor Public Space Morphology Indicators and Summer Wind Environment in Urban Village

3.1.1. Correlation Analysis Between Public Space Morphology Indicators and Average Wind Speed Ratio

The objective of this study is to investigate the existence of a significant linear relationship between the household profile density, enclosure, and dispersion of urban villages and the mean wind speed ratio. To this end, SPSS25 software was utilized to perform a correlation analysis of a sample of urban villages. The analysis results, as presented in Table 7, indicate that the absolute values of the Pearson correlation coefficients between the average wind speed ratio and the household profile density, enclosure, and dispersion of the urban village complex are 0.539, 0.608, and 0.475, respectively. These coefficients are all significantly correlated. Among these indicators, household profile density and enclosure exhibit a negative correlation with the mean wind speed ratio, while dispersion demonstrates a positive correlation. Notably, no significant correlation is observed between the morphological indicators, thereby satisfying the fundamental criteria for regression analysis.

3.1.2. Multiple Linear Regression Analysis of Public Space Morphology Indicators and Mean Wind Speed Ratio

To quantify the influence weight of the public space morphology indicators on the mean wind speed ratio, multiple linear regression analyses were performed on the mean wind speed ratios at pedestrian height in urban villages with standardized household profile density, enclosure, and dispersion. These analyses were carried out using SPSS25 software. The resulting standardized regression equation is shown in Equation (7).
Y = 0.734 0.257 X 1 0.443 X 2 + 0.306 X 3 ,
The dependent variable Y is the mean wind speed ratio, and the independent variables X1, X2, and X3 are the household profile density, enclosure, and dispersion, respectively. The results of the analysis showed that the coefficient of determination of the multiple linear regression R2 = 0.607 indicated that the regression equation was well fitted; DW (Durbin-Watson) = 1.904 indicated that the data conformed to the independence; and the tolerance in the diagnostics of covariance > 0.1 and VIF < 5 indicated that there was no multicollinearity between the independent variables.
In order to present the coupling effect more intuitively, the standardized household profile density, enclosure, and dispersion were calculated by substituting them into the regression equation (Equation (7)) to derive the mean wind speed ratio. The two mean wind speed ratio values were then compared (Figure 9a) by taking the absolute value of the difference between the two values in the same urban village (Figure 9b). The smaller the value obtained, the higher the degree of coupling, indicating a closer interaction between public space morphology and the mean wind speed ratio. As illustrated in Figure 9b, the discrepancy between the mean wind speed ratios calculated from the regression equation and those after the initial standardization is minimal, indicating a robust fit. This finding lends credence to the regression model’s accuracy and reliability in predicting the relationship between public space morphology and mean wind speed ratio in urban villages.

3.2. Study on Numerical Range of Outdoor Public Space Morphology Indicators in Urban Villages Based on Comfort Needs

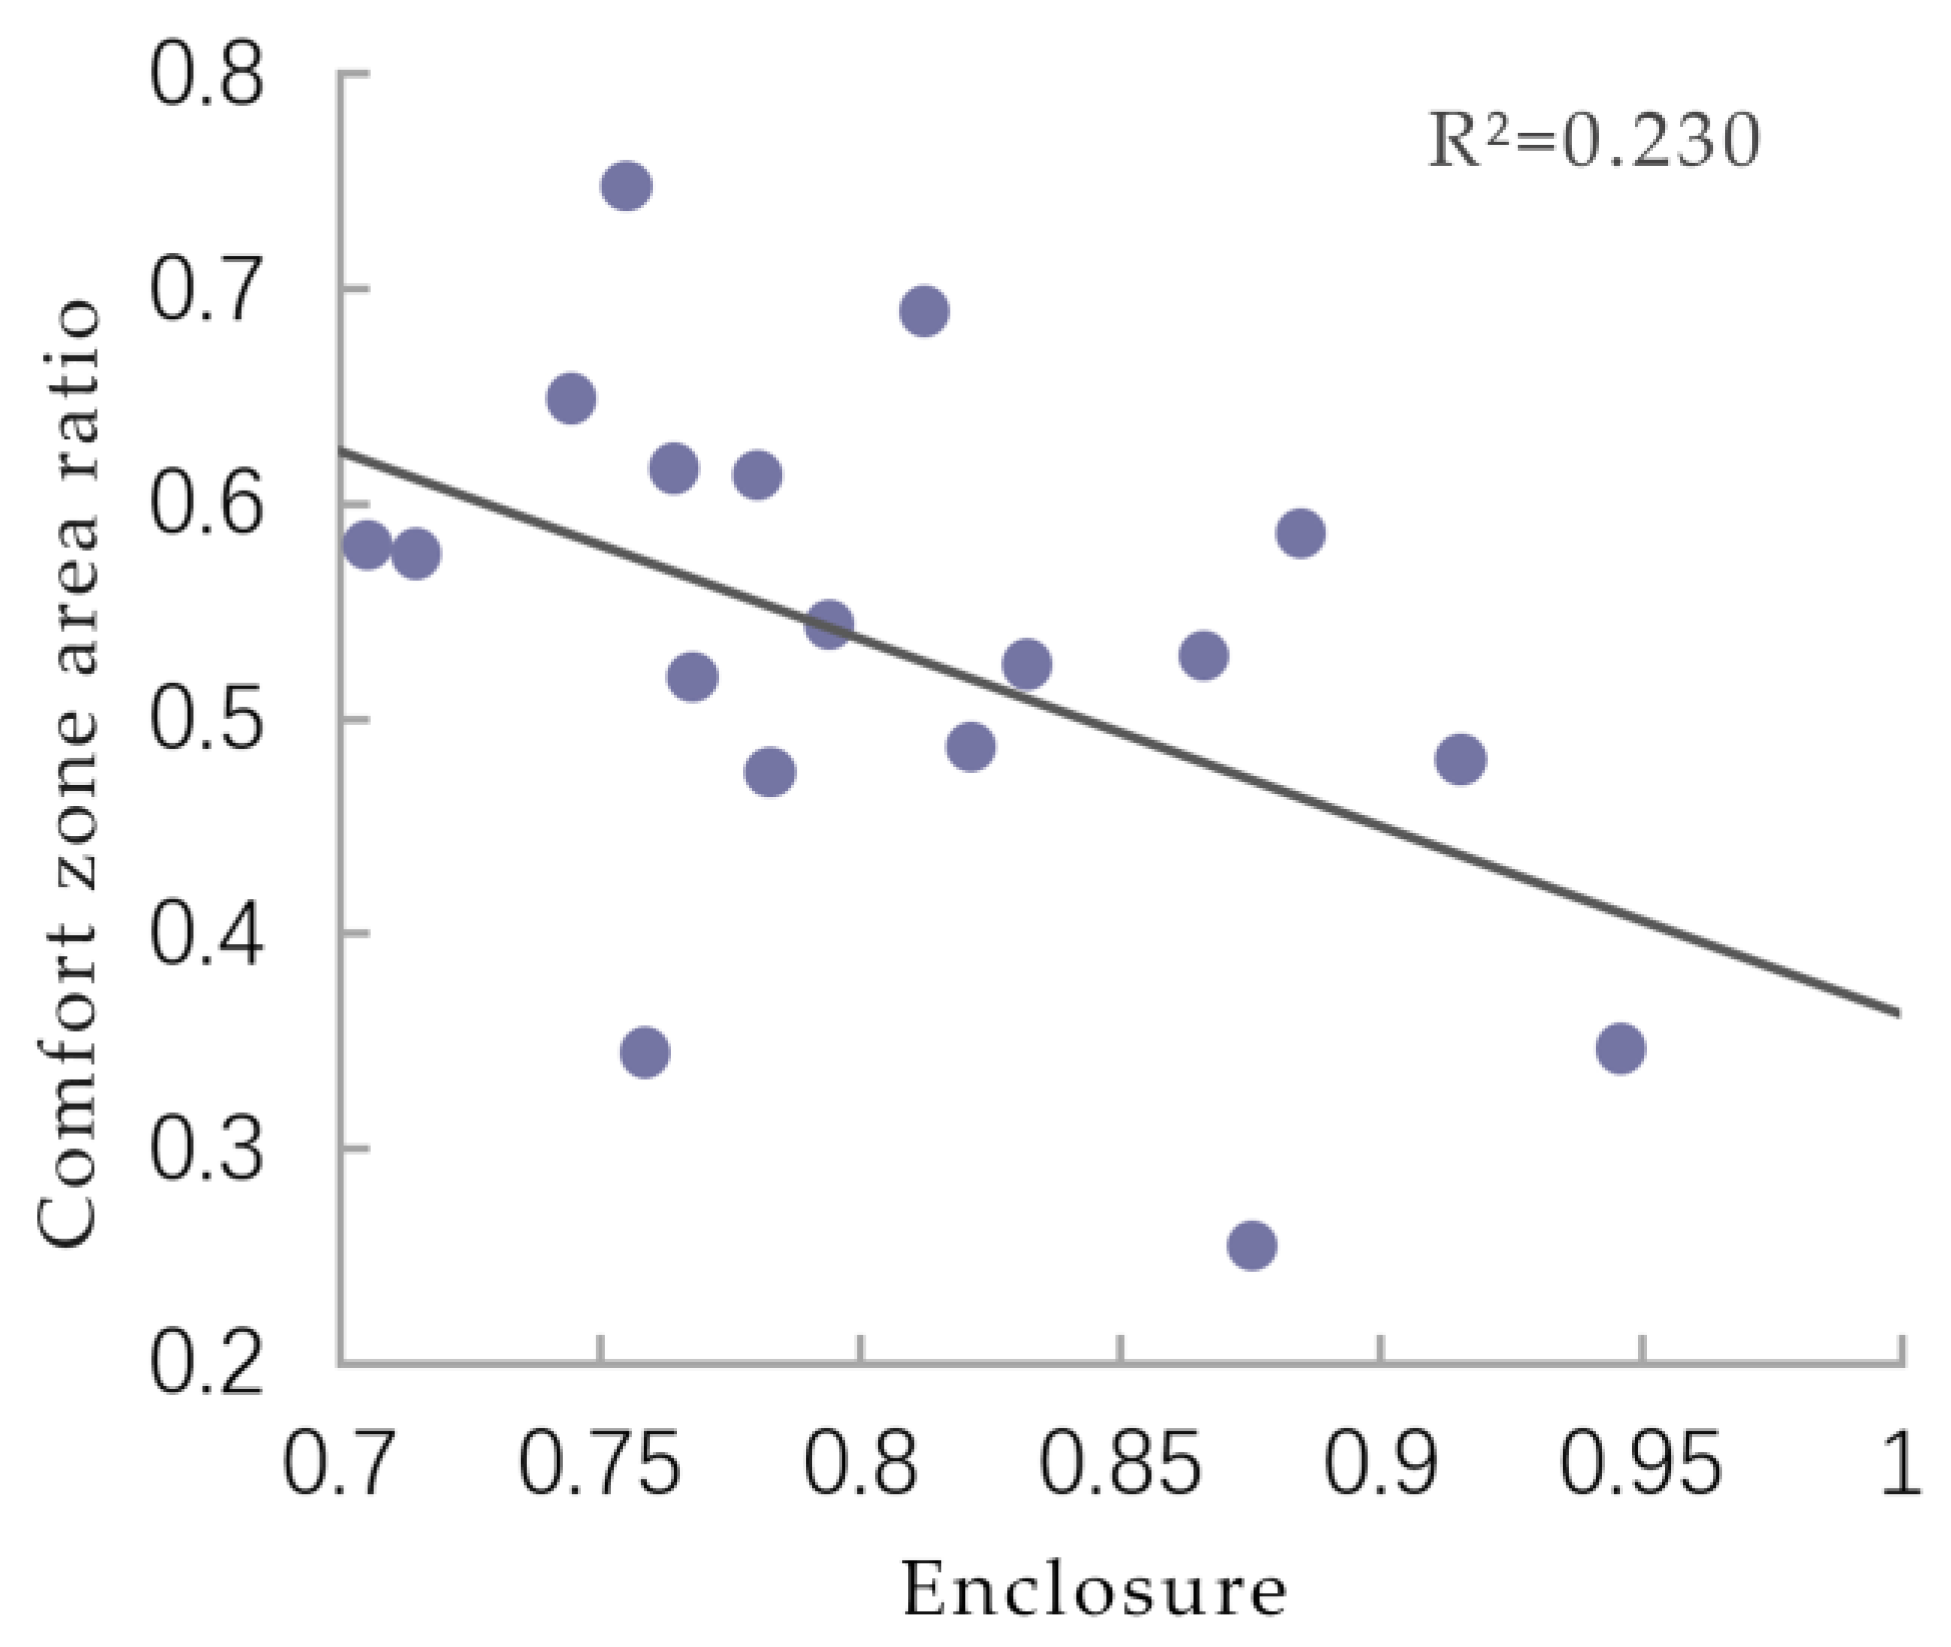
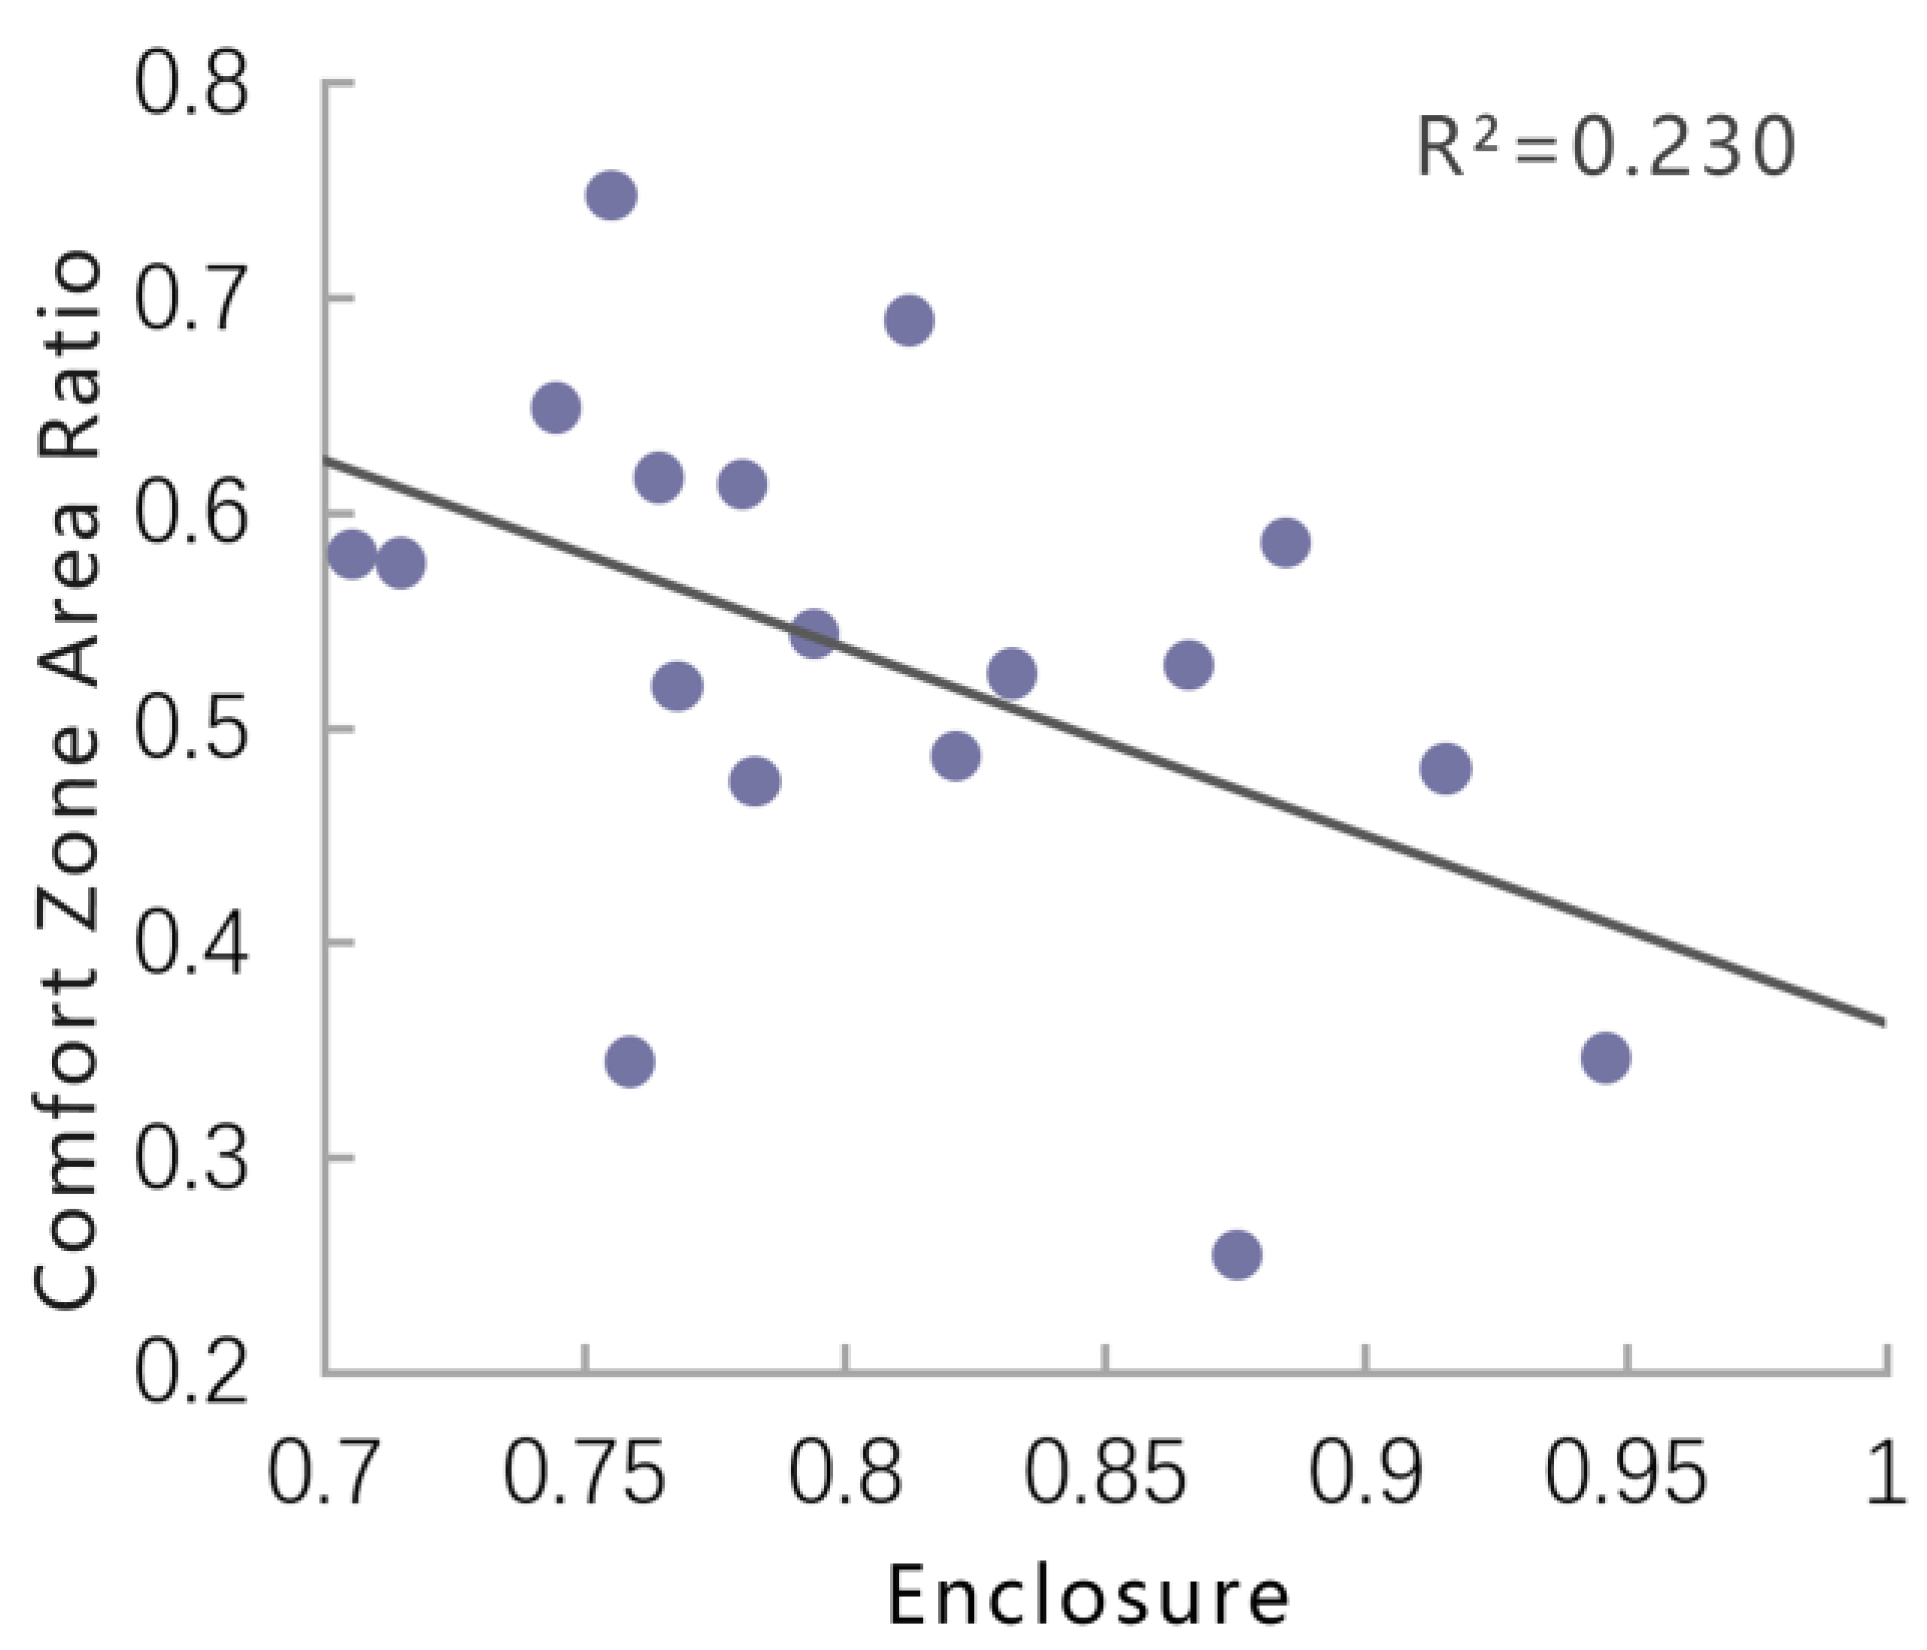
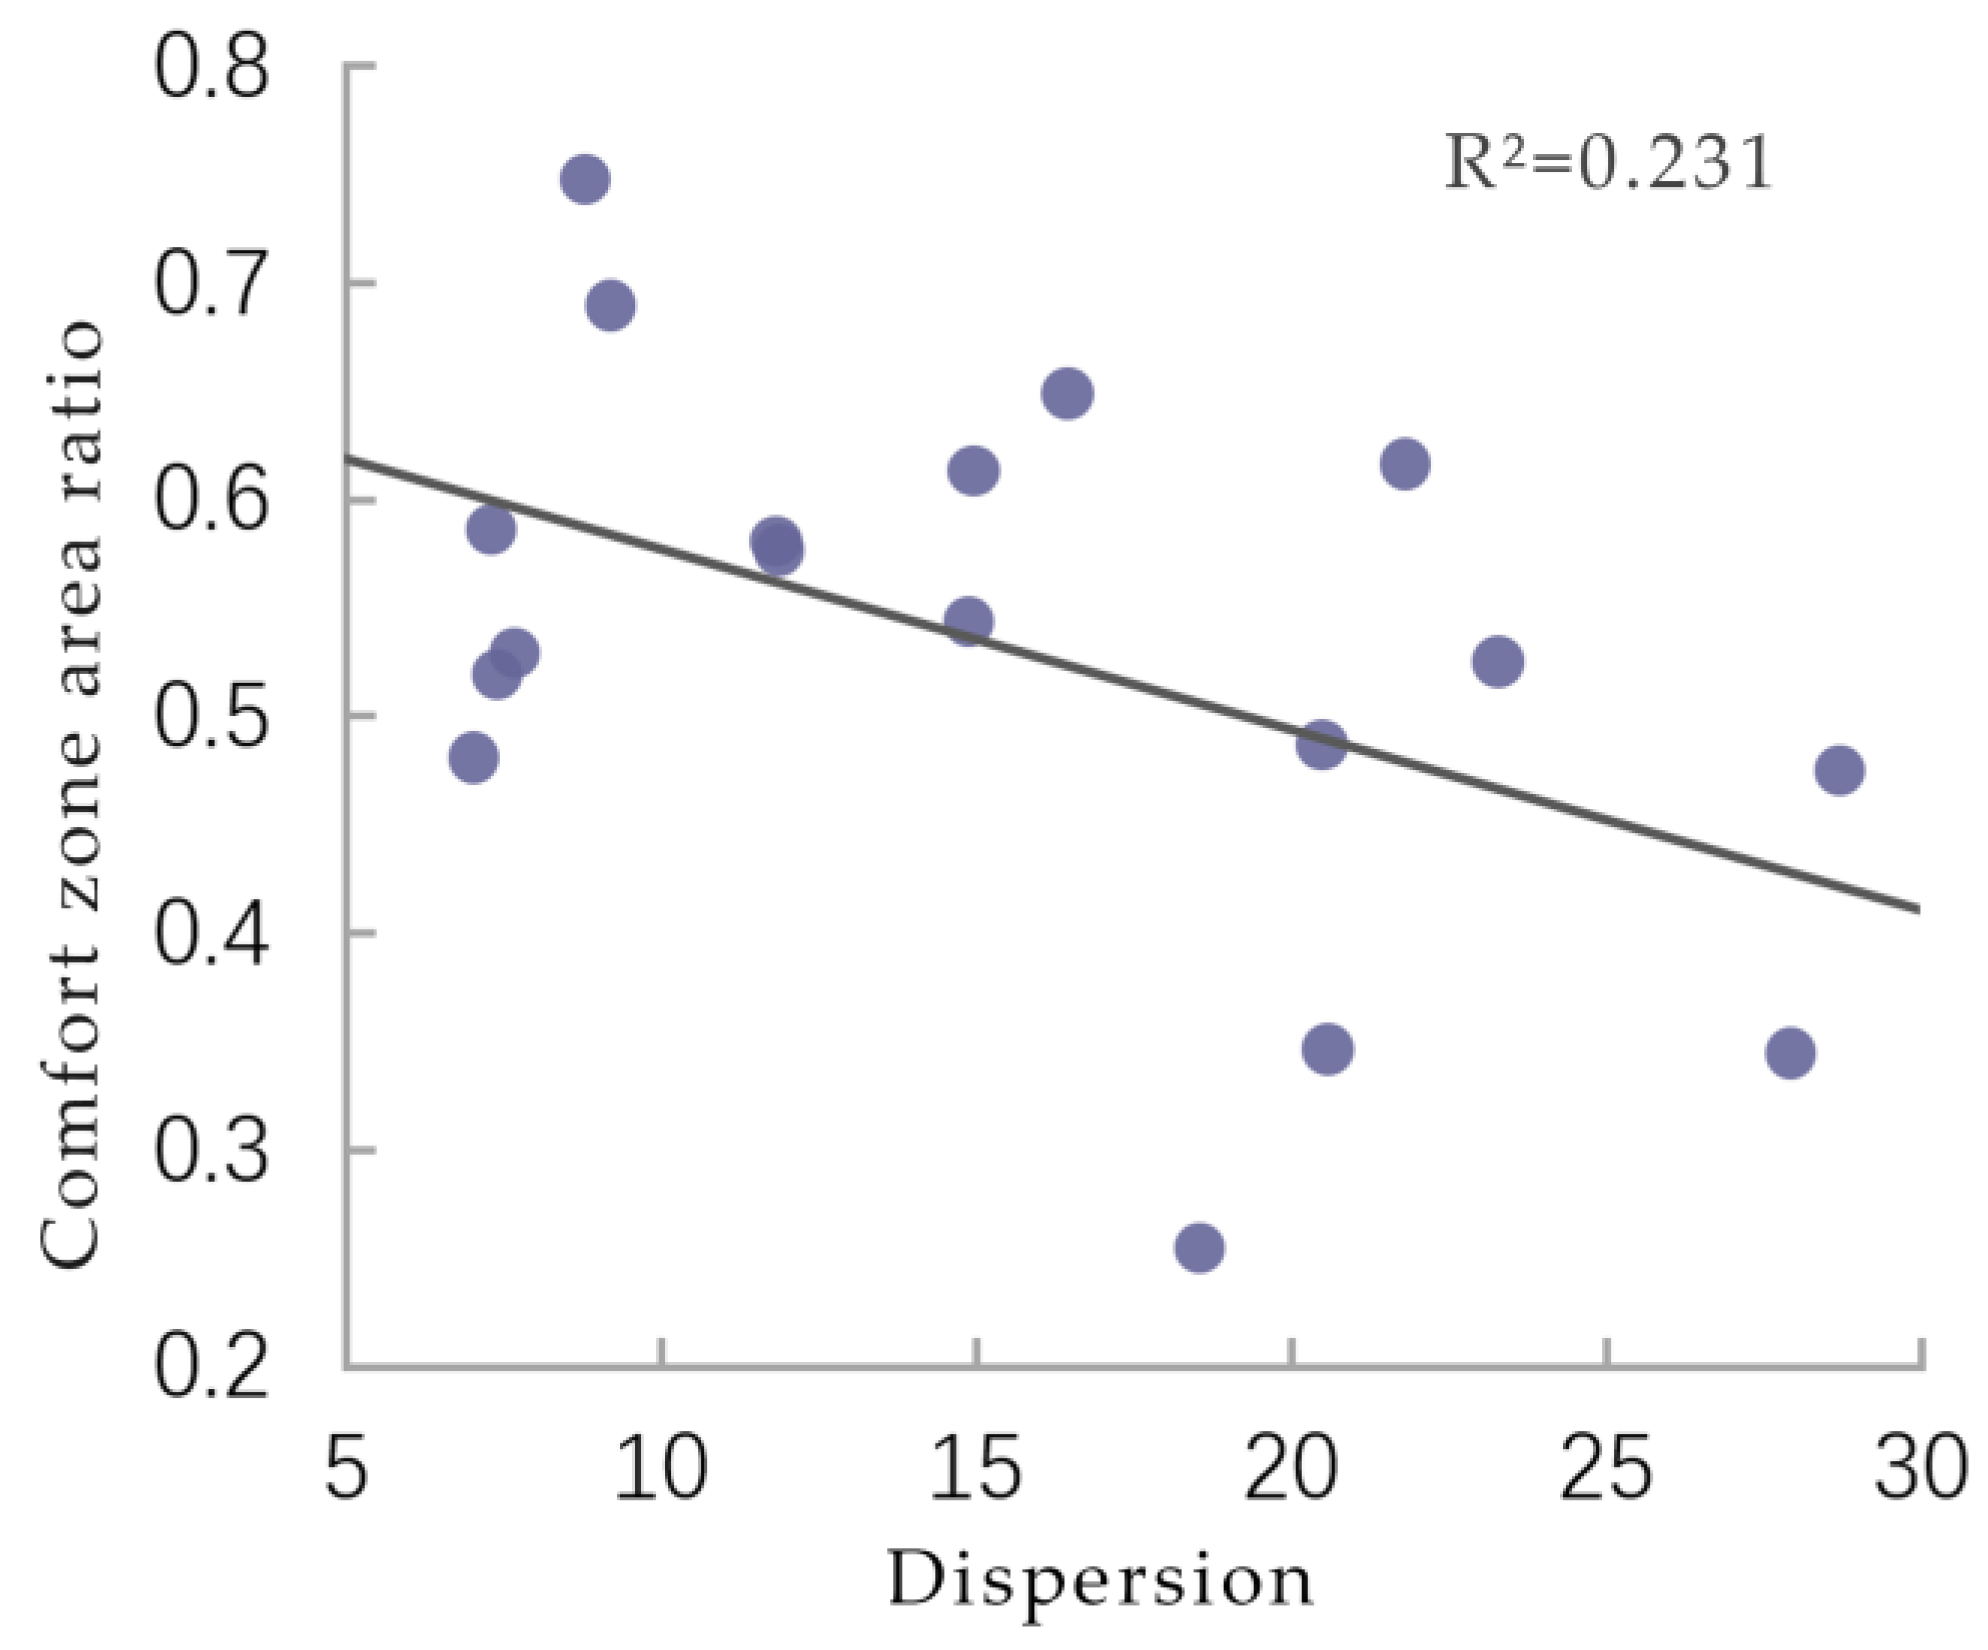
3.2.1. Correlation Analysis Between Public Space Morphology Indicators and Comfort Zone Area Ratio

In order to investigate the existence of a significant linear relationship between household profile density, enclosure, dispersion, and comfort zone area ratio in urban villages, this study employed SPSS25 software to conduct a correlation analysis of a sample of urban villages. The results of the analysis are presented in Table 8. The absolute values of the Pearson correlation coefficients between the comfort zone area ratio of the urban villages and the household profile density, enclosure, and dispersion are 0.482, 0.479, and 0.480, respectively. All of these coefficients have significant negative correlations. Furthermore, the absence of a substantial correlation between the morphological indicators aligns with the fundamental principles of regression analysis. A statistical analysis of the comfort zone area ratio of the sampled urban villages reveals that the mean value of the comfort zone area ratio in the sample is 53.10%, and the standard deviation is 12.03%. Given the relatively low standard deviation, this study utilizes the mean value of the comfort zone area ratio of the sample as the basis for evaluating the strengths and weaknesses of the sample wind environment.

3.2.2. Study on Numerical Range of Outdoor Public Space Morphology Indicators in Urban Villages

The normal distribution test was conducted on the public space morphology indicators of the sample urban villages, and the public space morphology indicators were divided into intervals based on the values of the upper and lower limits of the mean confidence intervals described by the group of data. Subsequently, regression analysis was employed to investigate the relationship between public space morphology indicators and comfort zone area ratio. This analysis utilized a linear regression equation to ascertain the range of values for the public space morphology indicators that satisfy the demand for comfort zone area ratio.
  • Range of Household Profile Density Values for Urban Villages
A statistical analysis of the comfort zone area ratio and the corresponding sample size of urban villages completing the household profile density interval classification reveals that when the household profile density is high (greater than 0.563), the outdoor space comfort zone area ratio is the smallest at 44.63%. Conversely, when the household profile density is in the medium range (0.456 to 0.563) or low (less than 0.456), the outdoor space comfort zone area ratio increases significantly to 52.53% or 58.51%, respectively. These findings are illustrated in Table 9.
The regression analysis indicates a negative correlation between household profile density and comfort zone area ratio, thereby satisfying the condition for linear regression. The regression analysis of household profile density and comfort zone area ratio yielded a coefficient of determination of linear regression, R2, which was equal to 0.232. The regression equation after standardization is presented in Equation (8):
Y = 0.748 0.415 X ,
In the aforementioned equation, Y denotes the comfort zone area ratio and X represents the household profile density. As illustrated in Figure 10, the household profile density and the comfort zone area ratio of the wind environment exhibit a satisfactory fitting effect. The effect of a single variable is demonstrated in the figure, where, as the household profile density decreases, the comfort zone area ratio of the outdoor public space in the urban village increases and the comfort level increases. The calculation of the comfort zone area share, as outlined in Equation (8), indicates that a 53.10% share can be achieved. This result can be de-normalized to determine that the household profile density in urban villages should be 0.5358.
  • Range of Enclosure Values for Urban Villages
A statistical analysis of the comfort zone area ratio of urban villages, as well as the division of enclosure intervals and the number of samples from the corresponding urban villages, was conducted (see Table 10). The results indicate that when the enclosure is high (greater than 0.840), the outdoor space comfort zone area ratio is the smallest at 43.97%. Conversely, when the enclosure is in the middle range (0.773 to 0.840) or lower (less than 0.773), the outdoor space comfort zone area ratio increases significantly to 55.41% or 57.65%, respectively.
The conditions for linear regression were met, given the negative correlation between enclosure and comfort zone area ratio. Subsequently, a regression analysis was performed on the enclosure and comfort zone area ratio, yielding a coefficient of determination of linear regression of R2 = 0.230. The standardized regression equation is presented in Equation (9):
Y = 0.739 0.426 X ,
In the aforementioned equation, Y denotes the comfort zone area ratio and X represents the degree of enclosure. As illustrated in Figure 11, the degree of enclosure and the comfort zone area ratio of the wind environment exhibit a satisfactory fitting effect. The findings reveal that, as the degree of enclosure diminishes, the comfort zone area ratio of the outdoor public space in the urban villages experiences an increase, concurrently enhancing the comfort level. The calculation of the comfort zone area share, as outlined in Equation (9), indicates that a degree of enclosure of 0.8228 is necessary to achieve a comfort zone area share of 53.10%.
  • Range of Values for Urban Village Dispersion
A statistical analysis of the comfort zone area ratio and the corresponding sample size of urban villages completing the dispersion interval classification demonstrated that, as illustrated in Table 11, when the dispersion is high (greater than 19.036), the comfort zone area ratio of outdoor space is the smallest at 46.59%. Conversely, when the dispersion falls within the medium interval (11.931–19.036), the comfort zone area ratio of outdoor space exhibits a marked increase, to 51.27% or 58.90%.
Pursuant to the established negative correlation between dispersion and comfort zone area ratio, the conditions for linear regression were met. Subsequently, regression analysis was conducted on the dispersion and comfort zone area ratios, yielding a coefficient of determination (R2) of 0.231 for the linear regression model. The standardized regression equation is presented in Equation (10):
Y = 0.703 0.366 X ,
In the equation, Y is the comfort zone area ratio and X is the degree of dispersion, and, as illustrated in Figure 12, the fitting diagram demonstrates a strong correlation between dispersion and the comfort zone area ratio of the wind environment. It is evident that the comfort zone area ratio of outdoor public space in urban villages exhibits an increase in conjunction with a decrease in dispersion, leading to an enhancement in the comfort level. The calculation of the comfort zone area share, as outlined in Equation (10), indicates that achieving a 53.10% comfort zone area share is contingent upon a dispersion level of 17.21, subsequent to the normalization of the results.

4. Discussion

4.1. Mechanisms for Coupling Public Morphological Indicators with Wind Environment

This study reveals significant relationships between the morphological indicators of public space (household profile density, enclosure, and dispersion) and the summer wind environment in urban villages in Qingdao. The correlation analysis yielded a negative relationship between household density (correlation coefficient −0.543) and enclosure (correlation coefficient −0.590) with mean wind speed ratio. This suggests that high-density buildings and closed interfaces impede ventilation. This finding is consistent with the conclusion of the study by WU et al. on the effect of neighborhood morphology on the pedestrian wind environment. In this study, site wind speed was found to be negatively correlated with building coverage and frontal area density. That is to say, interface continuity and building density were determined to be important factors affecting the wind environment [61]. Conversely, dispersion (correlation coefficient of 0.488) exhibited a positive correlation with mean wind speed ratio, indicating that the discrete layout of the buildings enhances the mobility of the wind field. This finding is consistent with the conclusions of HU’s study of the effect of dispersion on the site wind environment in their study on the coupling of spatial form and the outdoor wind environment on university campuses [51]. However, the findings of our study indicated that enclosure exhibited the most significant influence on the mean wind speed ratio. This phenomenon may be attributed to the “alley effect”, a unique characteristic of urban villages. The confluence of narrow streets and alleys in these environments leads to the exacerbation of wind blockage, underscoring the crucial role of interface openness in mitigating these effects.

4.2. Explanatory Power and Practical Implications of Regression Modeling

The multiple linear regression model (R2 = 0.607) demonstrates that morphological indicators can account for 60.7% of the variation in the mean wind speed ratio, thereby indicating a high degree of predictive capability for the model. However, the R2 value is less than 0.8, indicating that the morphological indicators of the outdoor public space studied in this paper are not the sole determining factors of the wind environment. Instead, they are influenced by additional factors not included in the study at this time. This limitation of the current study necessitates further exploration in future research on the wind environment in urban villages. The standardized equations indicate that enclosure has a higher priority than dispersion and household density. It is proposed that, in the adjustment of the outdoor spatial form of urban villages, the enclosure index can serve as a pivotal foundation for overall layout planning. Concurrently, household density and dispersion can contribute to the optimization of the transformation of the local areas of the villages. This, in turn, can facilitate a synergistic adjustment of the spatial form and the wind environment. For instance, the enclosure can be effectively mitigated by removing sections of boundary walls and incorporating green buffer zones, while the decentralization of building density can enhance local ventilation. These findings offer empirical validation for the urban village renovation initiative in Qingdao, addressing the existing lacuna in morphology–climate co-design parameters within prevailing urban design codes.

4.3. Threshold Effect of Comfort Zone Area Ratio

This study further explores how to optimize the comfort zone area ratio by adjusting public space morphological indicators. The utilization of univariate regression analysis has elucidated a negative correlation between the comfort zone area ratio and public space morphology indexes. And it is calculated that the comfort zone area ratio is significantly lower than the mean value (53.10%) when the household profile density > 0.5358, enclosure > 0.8228, or dispersion > 17.21, which verifies the necessity of threshold regulation. In light of these findings, this study puts forth the following optimization strategies:
  • Density Control Strategy: In response to the phenomenon of high building density in urban villages—wherein the household density exceeds the critical value of 0.5358—the density indicator should be reduced through building de-concentration and volume reduction. This reduction can improve the comfort level of outdoor public space in urban villages.
  • Boundary Opening Strategy: In the context of closed space patterns characterized by excessive enclosure, exceeding a threshold of 0.8228, measures such as interface infiltration and path connectivity have been shown to effectively enhance spatial accessibility and restore the comfort zone area ratio to an acceptable range.
  • Dispersion Compensation Strategy: In the overly discrete areas with a dispersion index > 17.21, micro-renewal measures such as implanting small pocket parks and adding community nodes can strengthen the spatial network correlation and achieve the synergy and optimization of comfort and spatial efficiency.

4.4. Practical Applications and Policy Recommendations

This study proposes systematic urban village transformation strategies and implementation paths: at the planning level, the spatial structure base should be optimized by designating ventilation corridors, strictly controlling the density of household profiles (≤0.5358), and prioritizing the de-concentration of highly enclosed areas with a degree of enclosure of >0.8228; at the design level, a composite model of “staggered layout + interface infiltration” is proposed. At the design level, we recommended the adoption of the composite mode of “staggered layout + interface infiltration”, through measures such as adding open corridors and embedding miniature green spaces, so as to precisely control the degree of enclosure to below 17.21 and achieve a dynamic balance between spatial efficiency and comfort. At the same time, a multidisciplinary synergistic mechanism should be established for planning, architecture, meteorology, and other disciplines in order to comprehensively consider environmental factors such as sunlight and noise and form a data-driven, scientifically updated paradigm.

5. Conclusions

A case study of 18 typical urban villages in the Qingdao area was conducted to reveal the regulatory mechanisms of morphological indicators on microclimatic environments. A data-driven spatial optimization framework was constructed based on the quantitative analysis of the coupling relationship between the morphological indicators of public space (household profile density, enclosure, and dispersion) and the summer wind environment (average wind speed ratio and comfort zone area ratio). The study’s primary conclusions are as follows.
  • The findings of the study indicated a significant negative correlation between house profile density and enclosure, on the one hand, and the average wind speed ratio, on the other hand. In contrast, a positive correlation was observed between dispersion and wind speed ratio. The order of their influence was determined to be enclosure > dispersion > house profile density. The findings of this study suggest that linear regression models can effectively predict the quality of wind environments and provide a quantitative tool for the planning of ventilation corridors.
  • Univariate regression analysis was employed to ascertain the optimization thresholds of key morphological indicators, yielding the following results: household profile density ≤ 0.5358, enclosure ≤ 0.8228, dispersion ≤ 17.21. The study proposes a graded control strategy, which is as follows: priority is given to building deconstruction for areas with excessive household profile density; interface infiltration design is adopted for areas with excessive enclosure; and spatial relevance is enhanced by implanting micro-greens in areas with high dispersion.
  • A three-dimensional “planning–design–policy” transformation path is proposed, which is outlined as follows: at the planning level, ventilation corridors are delineated and morphological indicators are strictly controlled; at the design level, staggered layouts and open corridors are adopted; and at the policy level, thresholds are incorporated into the technical standards for urban renewal.
Despite the validation of the model’s robustness through residual testing, the following limitations persist: Firstly, the sample coverage was confined to the hot and humid climate zone of Qingdao, and the universality of these thresholds must be verified in different climatic zones in the future. Secondly, the dynamic modulation of the wind field by seasonal changes in vegetation was not taken into account, and the microclimatic response under different vegetation coverage should be simulated with ENVI-met in the future. Thirdly, the univariate regression model is inadequate in addressing the interaction effect of morphological indicators. It is recommended that random forest or neural network algorithms be employed to investigate nonlinear relationships between parameters. Additionally, the study can be expanded to analyze the winter wind environment and establish a comprehensive assessment system for the entire year.

Author Contributions

H.F.: This author assumes responsibility for the following: conceptualization, original draft, and review and editing. T.Y.: This author is responsible for the conceptualization, original draft, and review and editing of the text. P.D.: This author is responsible for the review and editing of the manuscript and the acquisition of funding. All authors have read and agreed to the published version of the manuscript.

Funding

This paper was supported by the National Natural Science Foundation of China (Grant No. 51408344) and the Qingdao Philosophy and Social Science Planning Research Project (QDSKL2401104).

Data Availability Statement

The experimental data used to support the findings of this study are included in the article.

Conflicts of Interest

The authors declare no conflicts of interest.

References

  1. Tan, M.Q. Urban regeneration action ‘limit demolition order’ landing Ministry of Housing and Construction issued ‘on the implementation of urban regeneration action to prevent large-scale demolition and construction of the issue of notice’. China Eng. Consult. 2021, 10, 5. [Google Scholar]
  2. Hao, P.; Sliuzas, R.; Geertman, S. The development and redevelopment of urban villages in Shenzhen. Habitat Int. 2011, 35, 214–224. [Google Scholar]
  3. Lai, Y.; Tang, B.; Chen, X.; Zheng, X. Spatial determinants of land redevelopment in the urban renewal processes in Shenzhen, China. Land Use Policy 2021, 103, 12. [Google Scholar]
  4. Jiang, Y.; Mohabir, N.; Ma, R.; Wu, L.; Chen, M. Whose village? Stakeholder interests in the urban renewal of Hubei old village in Shenzhen. Land Use Policy 2020, 91, 9. [Google Scholar]
  5. Li, J.W.; Sun, S.J.; Li, J.G. The dawn of vulnerable groups: The inclusive reconstruction mode and strategies for urban villages in China. Habitat Int. 2021, 110, 8. [Google Scholar]
  6. Gao, Q.; Yin, D.; Zhu, H. Urban regeneration and emotional politics of place in Liede Village, Guangzhou, China. Habitat Int. 2020, 103, 8. [Google Scholar]
  7. Thinh, N.K.; Gao, Y.; Pitts, A. Villages-in-the-city in China and Vietnam: Comparative morphological transformation and incorporated process in Kunming and Hanoi. Cities 2024, 150, 17. [Google Scholar] [CrossRef]
  8. van Oostrum, M. Access, density and mix of informal settlement: Comparing urban villages in China and India. Cities 2021, 117, 12. [Google Scholar]
  9. Tan, Y.; He, J.; Han, H.; Zhang, W. Evaluating residents’ satisfaction with market-oriented urban village transformation: A case study of Yangji Village in Guangzhou, China. Cities 2019, 95, 12. [Google Scholar] [CrossRef]
  10. Li, X.; Wang, Z.; Yu, L.; Xie, B. Exploring the gap in people ’s travel behavior between urban villages and commercial housing: The role of built environment. Travel Behav. Soc. 2024, 36, 10. [Google Scholar]
  11. Rui, J.; Xu, Y.; Li, X. Destigmatizing urban villages by examining their attractiveness: Quantification evidence from Shenzhen. Habitat Int. 2024, 150, 20. [Google Scholar] [CrossRef]
  12. Gong, Y.; Li, B.; Tong, D.; Que, J.; Peng, H. Planner-led collaborative governance and the urban form of urban villages in redevelopment: The case of Yangji Village in Guangzhou, China. Cities 2023, 142, 14. [Google Scholar] [CrossRef]
  13. Li, X.; Zhang, F.; Hui, E.C.-M.; Lang, W. Collaborative workshop and community participation: A new approach to urban regeneration in China. Cities 2020, 102, 102743. [Google Scholar]
  14. Wang, M.; Zhang, J.; Zou, H.; Huang, Z.; Zhang, L. Constructing an ideal home: Affective atmosphere creation as a public participation strategy for urban village renovation. Cities 2024, 146, 104777. [Google Scholar]
  15. Zhou, Z. Towards collaborative approach? Investigating the regeneration of urban village in Guangzhou, China. Habitat Int. 2014, 44, 297–305. [Google Scholar] [CrossRef]
  16. Rui, J.; Li, X. Decoding vibrant neighborhoods: Disparities between formal neighborhoods and urban villages in eye-level perceptions and physical environment. Sustain. Cities Soc. 2024, 101, 32. [Google Scholar] [CrossRef]
  17. Margier, A. The institutionalization of ’tiny home’ villages in Portland: Innovative solution to address homelessness or preclusion of radical housing practices? Cities 2023, 137, 104333. [Google Scholar]
  18. Thinh, N.K.; Kamalipour, H. The morphogenesis of villages-in-the-city: Mapping incremental urbanism in Hanoi city. Habitat Int. 2022, 130, 102706. [Google Scholar] [CrossRef]
  19. Thinh, N.K.; Kamalipour, H.; Gao, Y. Mapping the emerging forms of informality: A comparative morphogenesis of villages-in-the-city in Vietnam. Habitat Int. 2023, 138, 102864. [Google Scholar] [CrossRef]
  20. DeHaan, J.M. Urban Village Zoning in San José, CA: Exploring Zoning Locations and Neighborhood Change. Ph.D. Thesis, University of Oregon, Eugene, OR, USA, 2024. [Google Scholar]
  21. Chaudhuri, M. Delhi and Its Urban Peripheries: Associational Life of the Village. South Asia-J. South Asian Stud. 2023, 46, 560–577. [Google Scholar] [CrossRef]
  22. Pinard, E. The Consolidation of ’Traditional Villages’ in Pikine, Senegal: Negotiating Legitimacy, Control and Access to Peri-Urban Land. Afr. Stud. 2021, 80, 172–189. [Google Scholar] [CrossRef]
  23. Mohajeri, N.; Perera, A.T.D.; Coccolo, S.; Mosca, L.; Le Guen, M.; Scartezzini, J.L. Integrating urban form and distributed energy systems: Assessment of sustainable development scenarios for a Swiss village to 2050. Renew. Energy 2019, 143, 810–826. [Google Scholar]
  24. Wu, K.L.; Hsieh, C.M. Computational fluid dynamics application for the evaluation of a community atrium open space design integrated with microclimate environment. Appl. Ecol. Environ. Res. 2017, 15, 1815–1831. [Google Scholar] [CrossRef]
  25. Zhang, L.; Hou, J.; Yu, Y.; Du, J.; Meng, X.; He, Q. Numerical simulation of outdoor wind environment of typical traditional village in the northeastern Sichuan Basin. In Proceedings of the 10th International Symposium on Heating, Ventilation and Air Conditioning (ISHVAC), Jinan, China, 19–22 October 2017; Elsevier Science Bv: Amsterdam, The Netherlands, 2017. [Google Scholar]
  26. Hågbo, T.-O.; Giljarhus, K.E.T. Sensitivity of urban morphology and the number of CFD simulated wind directions on pedestrian wind comfort and safety assessments. Build. Environ. 2024, 253, 111310. [Google Scholar] [CrossRef]
  27. Keshavarzian, E.; Jin, R.; Dong, K.; Kwok, K.C. Effect of building cross-section shape on air pollutant dispersion around buildings. Build. Environ. 2021, 197, 107861. [Google Scholar] [CrossRef]
  28. Zhao, J.J.; Hu, S.R. Study on Wind Environment of Streets and Lanes in Traditional Villages in Hot Summer and Cold Winter Areas: The Case of Shangfeng Village, Daye, Hubei Province. New Archit. 2021, 139–143. [Google Scholar]
  29. Yi, T.; Wang, H.; Liu, C.; Li, X.; Wu, J. Thermal comfort differences between urban villages and formal settlements in Chinese developing cities: A case study in Shenzhen. Sci. Total Environ. 2022, 853, 16. [Google Scholar] [CrossRef] [PubMed]
  30. Wang, H.; Shi, C.; Li, W.; Wang, L.; Wang, J.; Wang, G.; Hu, S. Field investigation on thermal environment and comfort of people in a coastal village of Qingdao (China) during winter. Build. Environ. 2021, 191, 14. [Google Scholar] [CrossRef]
  31. Fang, W.; Zhou, X.; Liu, Y.; Li, L. Analysis of Physics Environment in Urban Village Building. In Proceedings of the 10th International Symposium on Heating, Ventilation and Air Conditioning (ISHVAC), Jinan, China, 19–22 October 2017; Elsevier Science Bv: Amsterdam, The Netherlands, 2017. [Google Scholar]
  32. Xiong, Y.; Zhang, J.; Yan, Y.; Sun, S.; Xu, X.; Higueras, E. Effect of the spatial form of Jiangnan traditional villages on microclimate and human comfort. Sustain. Cities Soc. 2022, 87, 17. [Google Scholar] [CrossRef]
  33. Shen, X.; Wang, Y.; Xu, J.; Huang, T. A Study on Whether a ‘Maze’-like Layout Contributes to the Improvement of Wind Environments in Traditional Coastal Villages—A Validation Study Based on Numerical Simulation. Buildings 2024, 14, 2805. [Google Scholar] [CrossRef]
  34. Duan, G.; Nakamae, K.; Takemi, T. Impacts of urban morphometric indices on ventilation. Build. Environ. 2023, 229, 12. [Google Scholar] [CrossRef]
  35. Zhang, Q.; Dong, R.; Xu, D.; Zhou, D.; Rogora, A. Associations between summer wind environment and urban physical indicators in commercial blocks based on field measurement and simulation in Xi’an. Urban Clim. 2023, 49, 16. [Google Scholar] [CrossRef]
  36. Liu, W.; Miao, C.; Xiao, L.; Mai, J.; Wang, Y. Layout Optimization of Residential Buildings to Improve the Outdoor Microclimate of Neighborhoods Along an Urban Bay: A Case Study of Shantou’s Inner Bay, China. Buildings 2024, 14, 3912. [Google Scholar] [CrossRef]
  37. Xu, S.; Zhu, P.; Guo, F.; Yan, D.; Miao, S.; Zhang, H.; Dong, J.; Fan, X. Cold Coastal City Neighborhood Morphology Design Method Based on Multi-Objective Optimization Simulation Analysis. Buildings 2024, 14, 3176. [Google Scholar] [CrossRef]
  38. Zhao, Z.; Zhang, S.; Peng, Y. Analysis of Winter Environment Based on CFD Simulation: A Case Study of Long–Hu Sand Feng Shui Layout at Jiangxi Bailudong Academy Complex. Buildings 2023, 13, 1101. [Google Scholar] [CrossRef]
  39. Anbarsooz, M.; Amiri, M. Towards enhancing the wind energy potential at the built environment: Geometry effects of two adjacent buildings. Energy 2022, 239 Pt D, 122351. [Google Scholar] [CrossRef]
  40. Talwar, T.; Yuan, C. Impact of natural urban terrain on the pedestrian wind environment in neighborhoods: A CFD study with both wind and buoyancy-driven scenarios. Build. Environ. 2024, 261, 111746. [Google Scholar] [CrossRef]
  41. Han, B.L. Quantitative Research on Spatial Morphology of Urban Block Based on Wind Environment Evaluation; Shenyang Jianzhu University: Shenyang, China, 2020. [Google Scholar]
  42. Liu, S. Research on the Spatial Morphology of Urban Residential Block in Guangzhou, Based on Wind Environment Simulation; South China University of Technology: Guangzhou, China, 2018. [Google Scholar]
  43. Tan, L.W. Simulation of Outdoor Wind Environment in Residential Area Based on Reasonable Static Wind Rate. Building Energy Efficiency. Ph.D. Thesis, Chongqing University, Chongqing, China, 2017. [Google Scholar]
  44. Yang, J.Y.; Zang, T.; Fu, X.Z. Coupling Mechanism and Optimal Design of Wind Environment and Spatial Form in Urban Centres; Southeast University Press: Nanjing, China, 2016; p. 226. [Google Scholar]
  45. Zhang, T. Coupling Study the Wind Environment and Urban Spatial Morphology in Urban Central Area. Ph.D. Thesis, Southeast University, Nanjing, China, 2015. [Google Scholar]
  46. Zhou, X.Z. Study on the Evaluation System of Village Planning and Construction in Xuzhou Based on the Optimization of Wind Environment; China University of Mining and Technology: Wudaokou, China, 2022. [Google Scholar]
  47. Pang, Y.; Liang, Z.; Xie, P.; Li, L. Adaptive Optimization of Wind Environment in Coastal Village Spatial Forms of Western Guangdong. Buildings 2024, 14, 3721. [Google Scholar] [CrossRef]
  48. Zhang, Q.; Zhou, D.; Xu, D.; Rogora, A. Association between Wind Environment and Spatial Characteristics of High-Rise Residential Buildings in Cold Regions through Field Measurements in Xi’an. Buildings 2023, 13, 2007. [Google Scholar] [CrossRef]
  49. Yang, G.; Xuan, Y.; Zhou, Z. Influence of Building Density on Outdoor Thermal Environment of Residential Area in Cities with Different Climatic Zones in China—Taking Guangzhou, Wuhan, Beijing, and Harbin as Examples. Buildings 2022, 12, 370. [Google Scholar] [CrossRef]
  50. Huang, J.X.; Qi, Y.Z.; Yu, W.J.; Wang, Z.Q. Correlation between Public Space Form and Winter Monsoon Environment in Traditional Villages of Tumochuan Plain. Build. Energy Effic. 2023, 51, 123–131. [Google Scholar]
  51. Hu, W. Coupling Study of Spatial Morphology and Outdoor Wind Environment of University Campus in GuangZhou Based on Regression Analysis; South China University of Technology: Guangzhou, China, 2020. [Google Scholar]
  52. Pu, X.C. Quantitative Research on the Integrated Form of the Two-dimensional Plan to Traditional Rural Settlement; Zhejiang University: Hangzhou, China, 2012. [Google Scholar]
  53. GB 50736-2012; Design Code for Heating Ventilation and Air Conditioning of Civil Buildings. China Architecture & Building Press: Beijing, China, 2012.
  54. GB 50009-2012; Code for Structural Loading of Buildings. China Architecture & Building Press: Beijing, China, 2012.
  55. GB/T 50378-2019; Green Building Evaluation Standard. China Architecture & Building Press: Beijing, China, 2014.
  56. Liu, J. Analysis on the Evolution of Wind Environment at Pedestrian Height Based on Urbanization Development; China University of Petroleum (EastChina): Beijing, China, 2021. [Google Scholar]
  57. Yuan, H.M. Study on the Optimization of Business Neighborhood Morphology and Wind Environment Design in Coastal Cities-Qingdao City as an Example; Qingdao University of Technology: Qingdao, China, 2023. [Google Scholar]
  58. Chen, Y.; Que, L.J.; Ding, J.Y. Study on the Optimization of Coastal Residential Layout Based on Wind Environment Simulation:A Case of Qingdao. Urban. Archit. 2025, 22, 52–55. [Google Scholar]
  59. Ding, J.Y. Research on Lay Out Optimization Strategy of Qingdao Coastal Residential District Based on Wing Environment Evaluation; Qingdao University of Technology: Qingdao, China, 2021. [Google Scholar]
  60. Zhang, P.F.; Jia, B.B.; Gao, Y.; Cheng, Z. Simulation and Optimization of Summer Wind and Thermal Environments in Blocks Based on Building Heights and Layouts. J. Univ. Jinan (Sci. Technol.) 2025, 39, 63–70. [Google Scholar]
  61. Wu, Y.; Wang, M.; Kong, F.; Kong, J.; Liu, H. Synthesizing the quantitative impact of urban neighborhood morphology on pedestrian wind environment- A meta-analysis approach. Sustain. Cities Soc. 2025, 118, 106053. [Google Scholar] [CrossRef]
Figure 1. Research process.
Buildings 15 01066 g001
Figure 2. Distribution of sample urban villages (source of base map: Qingdao Urban Renewal Special Plan (2021–2035)).
Buildings 15 01066 g002
Figure 3. Actual photographs of sample urban villages. (a) Street photos; (b) panoramic pictures.
Buildings 15 01066 g003
Figure 4. Illustration of sample urban village models in Qingdao area.
Buildings 15 01066 g004
Figure 5. Urban village boundary and chart base relationships. (a) Urban village map bottom relationship; (b) exterior building boundary; (c) building footings; (d) urban village boundary.
Buildings 15 01066 g005
Figure 6. Simulated and measured analysis charts. (a) Distribution of measured points; (b) comparison of simulated and measured values.
Buildings 15 01066 g006
Figure 7. Wind speed cloud maps at pedestrian height (1.5 m) in outdoor spaces of sample urban villages.
Buildings 15 01066 g007
Figure 8. Wind speed cloud maps of comfort zone (1–5 m/s) at pedestrian height (1.5 m) in outdoor spaces of sample urban villages.
Buildings 15 01066 g008
Figure 9. Comparison of average wind speed ratio values. (a) Comparison of normalized mean wind speed ratios before and after calculations; (b) absolute values of differences in standardized mean wind speed ratios before and after calculation.
Buildings 15 01066 g009
Figure 10. Household profile density to comfort zone area ratio fit plot.
Buildings 15 01066 g010
Figure 11. Enclosure to comfort zone area ratio fit plot.
Buildings 15 01066 g011
Figure 12. Dispersion to comfort zone area ratio fit plot.
Buildings 15 01066 g012
Table 1. Selection and calculation table of morphological indicators of public space.
Indicator NameFormulaMeaning
Household density (P) P = S P / S N           (1)
SP: Total building footprint
SN: Site area
The ratio of total building footprint to site area [50], reflecting the degree of building sparsity (Figure 5a).
Enclosure degree (E) E = L i / L         (2)
Li: Length of peripheral building boundaries
L: Site perimeter
The ratio of the sum of the length of the peripheral building boundaries to the perimeter of the site, which measures the openness of the space [43] (Figure 5b).
Dispersion (T) T = L i 4 s p         (3)
LP: Sum of building boundary perimeters
SP: Total building footprint
The ratio of the sum of the perimeters of the building boundaries to the sum of the building footprints, which characterizes the uniformity of building distribution [51] (Figure 5c).
Table 2. Statistical table of public space morphological indicators of sample urban villages.
NumberingName of Urban VillagesHousehold DensityEnclosure DegreeDispersion
1Taitou community0.503040.7802814.96179
2Zhugezhuang community0.554930.7145311.87135
3Zhanggezhuang community0.711040.8751218.55153
4Dongli community0.533870.7053511.82582
5Qugezhuang community0.385040.7938914.88839
6Banqiaofang community0.586030.9459720.5778
7Niuwangmiao community0.429190.884567.29564
8Dongchencommunity0.343760.8212220.48606
9Nanwushi community0.360250.7444716.44933
10Beishanxue community0.423770.755068.80142
11Beilongkou community0.415240.7640921.80032
12Suliu community0.426060.7825328.69197
13Pengjiazhuang community0.548250.81229.19949
14Dongdayang community0.521270.8319223.28082
15Chaohaidong and Chaohaixi community0.52430.7585627.93014
16Xidayang community0.62490.865887.66968
17Longmending community0.657140.767717.40055
18Shanchen community0.626380.915267.03145
Table 3. PHOENICS parameter design sheet.
Parameter CategorySetting Instructions
Computational areaThe length, width, and height were 5 times the scale of the model, and the modeling tool was laid out.
GridThe grid division was 3 m in the village area and 5 m in the peripheral area, with a grid convergence ratio of 1.1.
Wind speed and directionThe initial wind speed was 4.6 m/s (at 10 m height) and the prevailing summer wind direction was used (south) [53].
Ground roughnessThe ground roughess was set to 0.15 (based on the Structural Load Code for Buildings [54]).
ModelThe turbulence was modeled by Chen–Kim K-ε, and radiation was modeled by IMMERSOL.
Iteration and convergenceThe number of iterations was 1000 and the convergence residual was 0.001%.
Table 4. Wind environment evaluation index selection and calculation table.
Indicator NameFormulaMeaning
Wind speed ratio (R) R = V / V 0       (4)
V: Simulated wind speed
V0: Initial wind speed (4.6 m/s)
The ratio of the average wind speed at the pedestrian height (1.5 m) to the initial wind speed, reflecting the magnitude of the average wind speed over the simulation range.
Comfort zone area ratio (C) C = S / S P         (5)
S: Comfort zone area
SP: Total building footprint
The ratio of the area of the comfort air velocity area to the total area, measuring ventilation efficiency and comfort.
Table 5. Statistics of average wind speed ratio at pedestrian height (1.5 m) in outdoor space of sample urban villages.
NumberingName of Urban VillageAverage Wind Speed RatioNumberingName of Urban VillageAverage Wind Speed Ratio
1Taitou community0.6034410Beishanxue community0.59267
2Zhugezhaung community0.6791611Beilongkou community0.71104
3Zhanggezhuang community0.6178112Suliu community0.64933
4Dongli community0.6308313Pengjiazhuang community0.57484
5Qugezhuang community0.7719314Dongdayang community0.59371
6Banqiaofang community0.570615Chaohaidong and Chaohaixi community0.75136
7Niuwangmiao community0.5975216Xidayang community0.49145
8Dongchen community0.7337117Longmending community0.67523
9Nanwushi community0.7002418Shanchen community0.46414
Table 6. Statistics on area ratios of comfort zone at pedestrian height (1.5 m) in outdoor spaces of sample urban villages.
NumberingName of Urban VillagesComfort Zone Area RatioNumberingName of Urban VillagesComfort Zone Area Ratio
1Taitou community61.32%10Beishanxue community74.79%
2Zhugezhaung community57.69%11Beilongkou community61.66%
3Zhanggezhuang community25.49%12Suliu community47.53%
4Dongli community58.10%13Pengjiazhuang community68.95%
5Qugezhuang community54.40%14Dongdayang community52.53%
6Banqiaofang community34.67%15Chaohaidong and Chaohaixi community34.48%
7Niuwangmiao community58.62%16Xidayang community52.96%
8Dongchen community48.70%17Longmending community51.97%
9Nanwushi community64.89%18Shanchen community48.10%
Table 7. The correlation matrix between the average wind speed ratio at pedestrian height (1.5 m) and the morphological indicators of each public space.
Public Space Parameters Average Wind Speed RatioHousehold DensityEnclosure DegreeDispersion
Average wind speed ratioPearson relevance1
Sig. (two-tailed)
Household densityPearson relevance−0.543 *1
Sig. (two-tailed)0.020
Enclosure degreePearson relevance−0.590 **0.3571
Sig. (two-tailed)0.0100.146
DispersionPearson relevance0.488 *−0.282−0.0881
Sig. (two-tailed)0.0400.2580.729
Note: * indicates a significant correlation at the 0.05 level (two-tailed). ** indicates a significant correlation at the 0.01 level (two-tailed).
Table 8. Correlation matrix between comfort zone area ratio and public space morphology indicators.
Public Space Parameters Comfort Zone Area RatioHousehold DensityEnclosure DegreeDispersion
Comfort zone area ratioPearson relevance1
Sig. (two-tailed)
Household densityPearson relevance−0.482 *1
Sig. (two-tailed)0.043
Enclosure degreePearson relevance−0.479 *0.3571
Sig. (two-tailed)0.0440.146
DispersionPearson relevance−0.480 *−0.282−0.0881
Sig. (two-tailed)0.0440.2580.729
Note: * indicates a significant correlation at the 0.05 level (two-tailed). ** indicates a significant correlation at the 0.01 level (two-tailed).
Table 9. Mean statistics of wind environment comfort area ratio in urban village household profile density division intervals.
Statistical TargetSample Size of Urban VillagesAverage Comfort Zone Area Ratio
Household profile density < 0.456758.51%
0.456 < household profile density < 0.563751.23%
0.563 < household profile density444.63%
Table 10. The statistics of the average wind environment comfort area ratio within the enclosure division intervals of the urban villages.
Statistical TargetSample Size of Urban VillagesAverage Comfort Zone Area Ratio
Enclosure < 0.773757.65%
0.773 < enclosure < 0.840655.41%
0.563 < enclosure543.97%
Table 11. Statistics of mean wind environment comfort area ratio in urban village dispersion delineation intervals.
Statistical TargetSample Size of Urban VillagesAverage Comfort Zone Area Ratio
Dispersion < 11.931757.65%
11.931 < dispersion < 19.036655.41%
19.036 < dispersion543.97%
Disclaimer/Publisher’s Note: The statements, opinions and data contained in all publications are solely those of the individual author(s) and contributor(s) and not of MDPI and/or the editor(s). MDPI and/or the editor(s) disclaim responsibility for any injury to people or property resulting from any ideas, methods, instructions or products referred to in the content.

