
Modeling Moisture Accumulation and Decay Potential in Cross-Laminated Timber Wall Assemblies Exposed During the Construction Phase


Abstract
:1. Introduction
2. Materials and Methods
- 1
- Determine the necessary grid size for moisture profiles:
- 1.a
- Define the extreme values and gradients of moisture contents in the CLT panel,
- 1.b
- Define the most coarse grid that is admissible;
- 2.
- Define moisture profile types:
- 2.a
- Determine which parameters have the highest influence on moisture contents,
- 2.b
- Define reference moisture profile types at the end of the construction phase;
- 3.
- Assess degradation risks for wall assemblies with the reference moisture profiles.
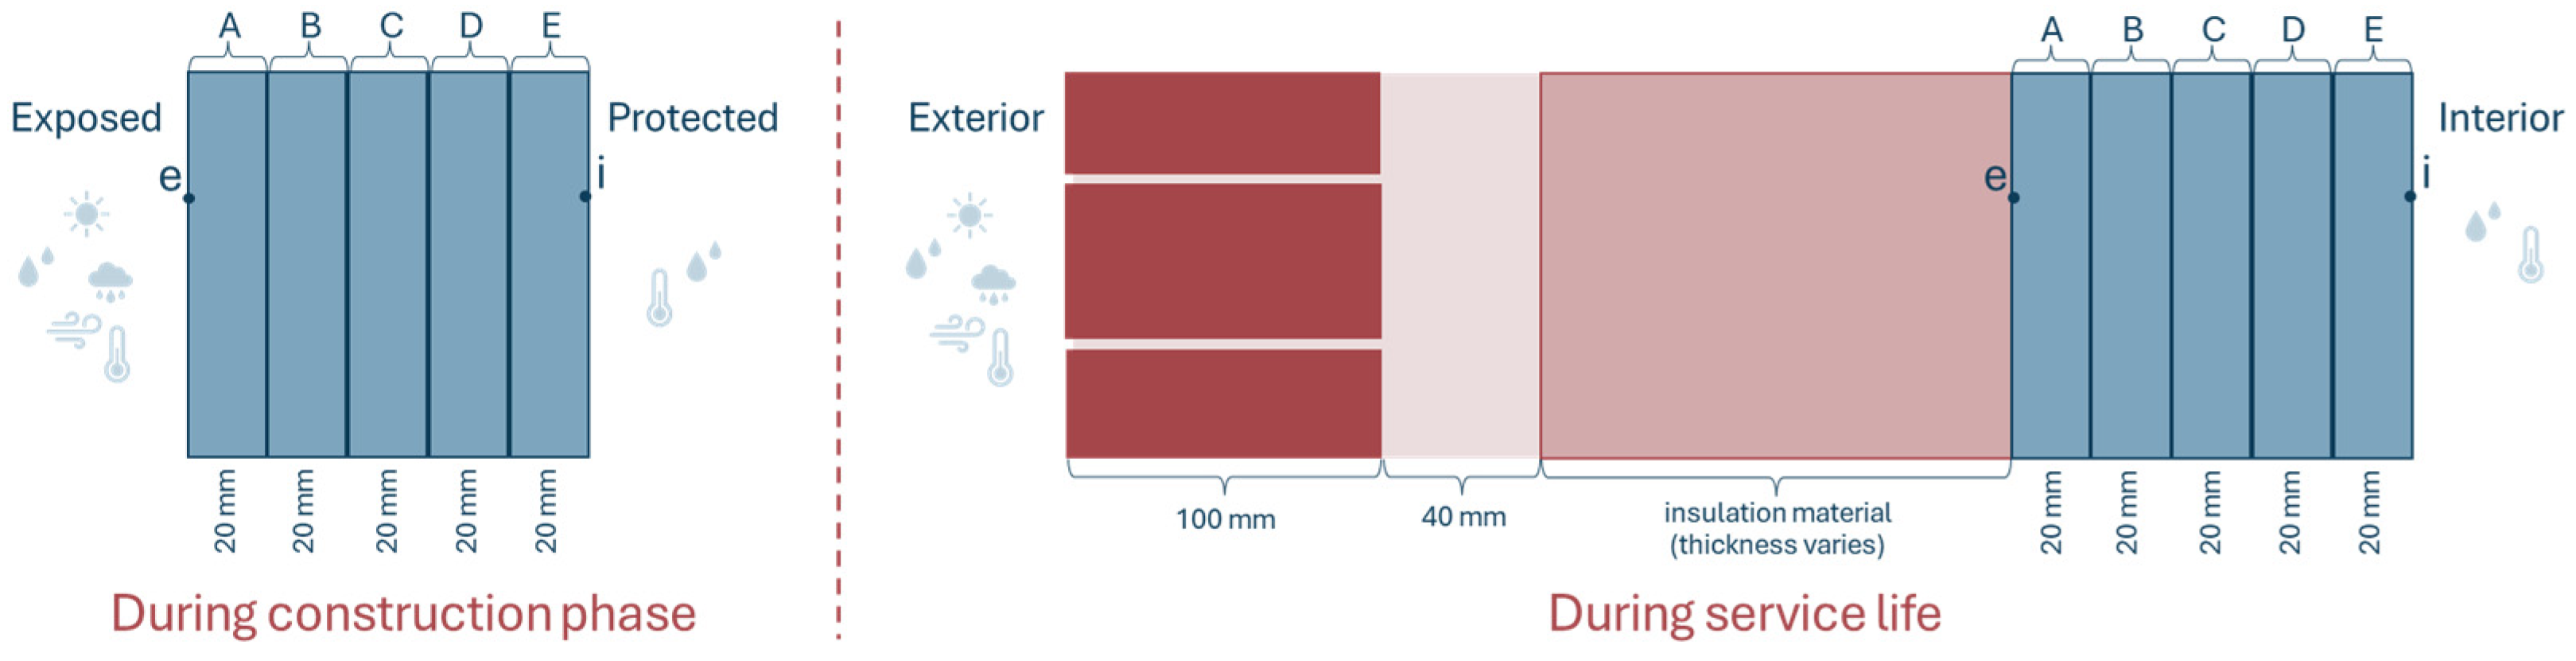
2.1. Determine the Necessary Grid Size for Moisture Profiles
- The moment with the greatest difference in moisture content between the maximum and minimum values within layer A (exterior layer of the CLT panel);
- The moment with the greatest difference in moisture content between the center of the CLT panel (i.e., the center of layer C) and the outer edge of the CLT panel;
- The moment with the greatest difference between the average moisture content of layer A (exterior layer of the CLT panel) and the average moisture content of layer C (middle layer of the CLT panel).
- Every millimeter in the CLT panel was assigned the moisture content output values from the first simulation;
- Every 5 mm in the CLT panel is grouped (creating 4 groups per layer of wood), and each group is assigned the average moisture content of these 5 mm groups;
- Every 10 mm in the CLT panel is grouped (creating 2 groups per layer of wood), and each group is assigned the average moisture content of these 10 mm groups;
- Every layer of wood in the CLT panel is assigned the average moisture content value of the layer;
- All the wood in the CLT panel is assigned the average moisture content values of all the wood in the CLT panel;
- Every layer of wood in the CLT panel is assigned the average moisture content values of this layer, with the exception of layer A, where the distinction is made between the outermost 5 mm and the other 15 mm.
2.2. Define Moisture Profile Types
2.2.1. Wood Type
2.2.2. Glue Type

| Glue Type | µdry [-] | µwet [-] | Sd,dry [m] | Sd,wet [m] |
|---|---|---|---|---|
| MUF simulated by altering the µ-value of the CLT panel 1,3 | 513.20 | 485.69 | ||
| MUF simulated by adding its resistance 2,3 | 0.104 | 0.842 | ||
| MUF simulated as an additional material with a thickness of 0.25 mm 3 | 3368 | 416 | ||
| MUF material 4 | 1993 | 357 | ||
| PUR material 4 | 1411 | 1020 | ||
| EPI material 4 | 7143 | 311 |
2.2.3. Delivery Moisture Content
2.2.4. Orientation
2.2.5. Rain Exposure Level
- CR = factor for terrain variations (0.665421, 0.771443 (fixed value), 1.00668, 1.174318);
- CT = factor for topography;
- O = obstacle factor (0.2, 0.3, 0.4, 0.5; 0.6, 0.7, 0.8 (fixed value), 0.9, 1);
- W = wall factor (mean values for a whole wall are 0.3 and 0.4 (fixed value), distribution over the entire wall also include factors such as 0.2 and 0.5.
2.2.6. Define Reference Moisture Profile Types at the End of the Construction Phase
2.3. Assess Degradation Risks for Wall Assemblies with the Reference Moisture Profiles
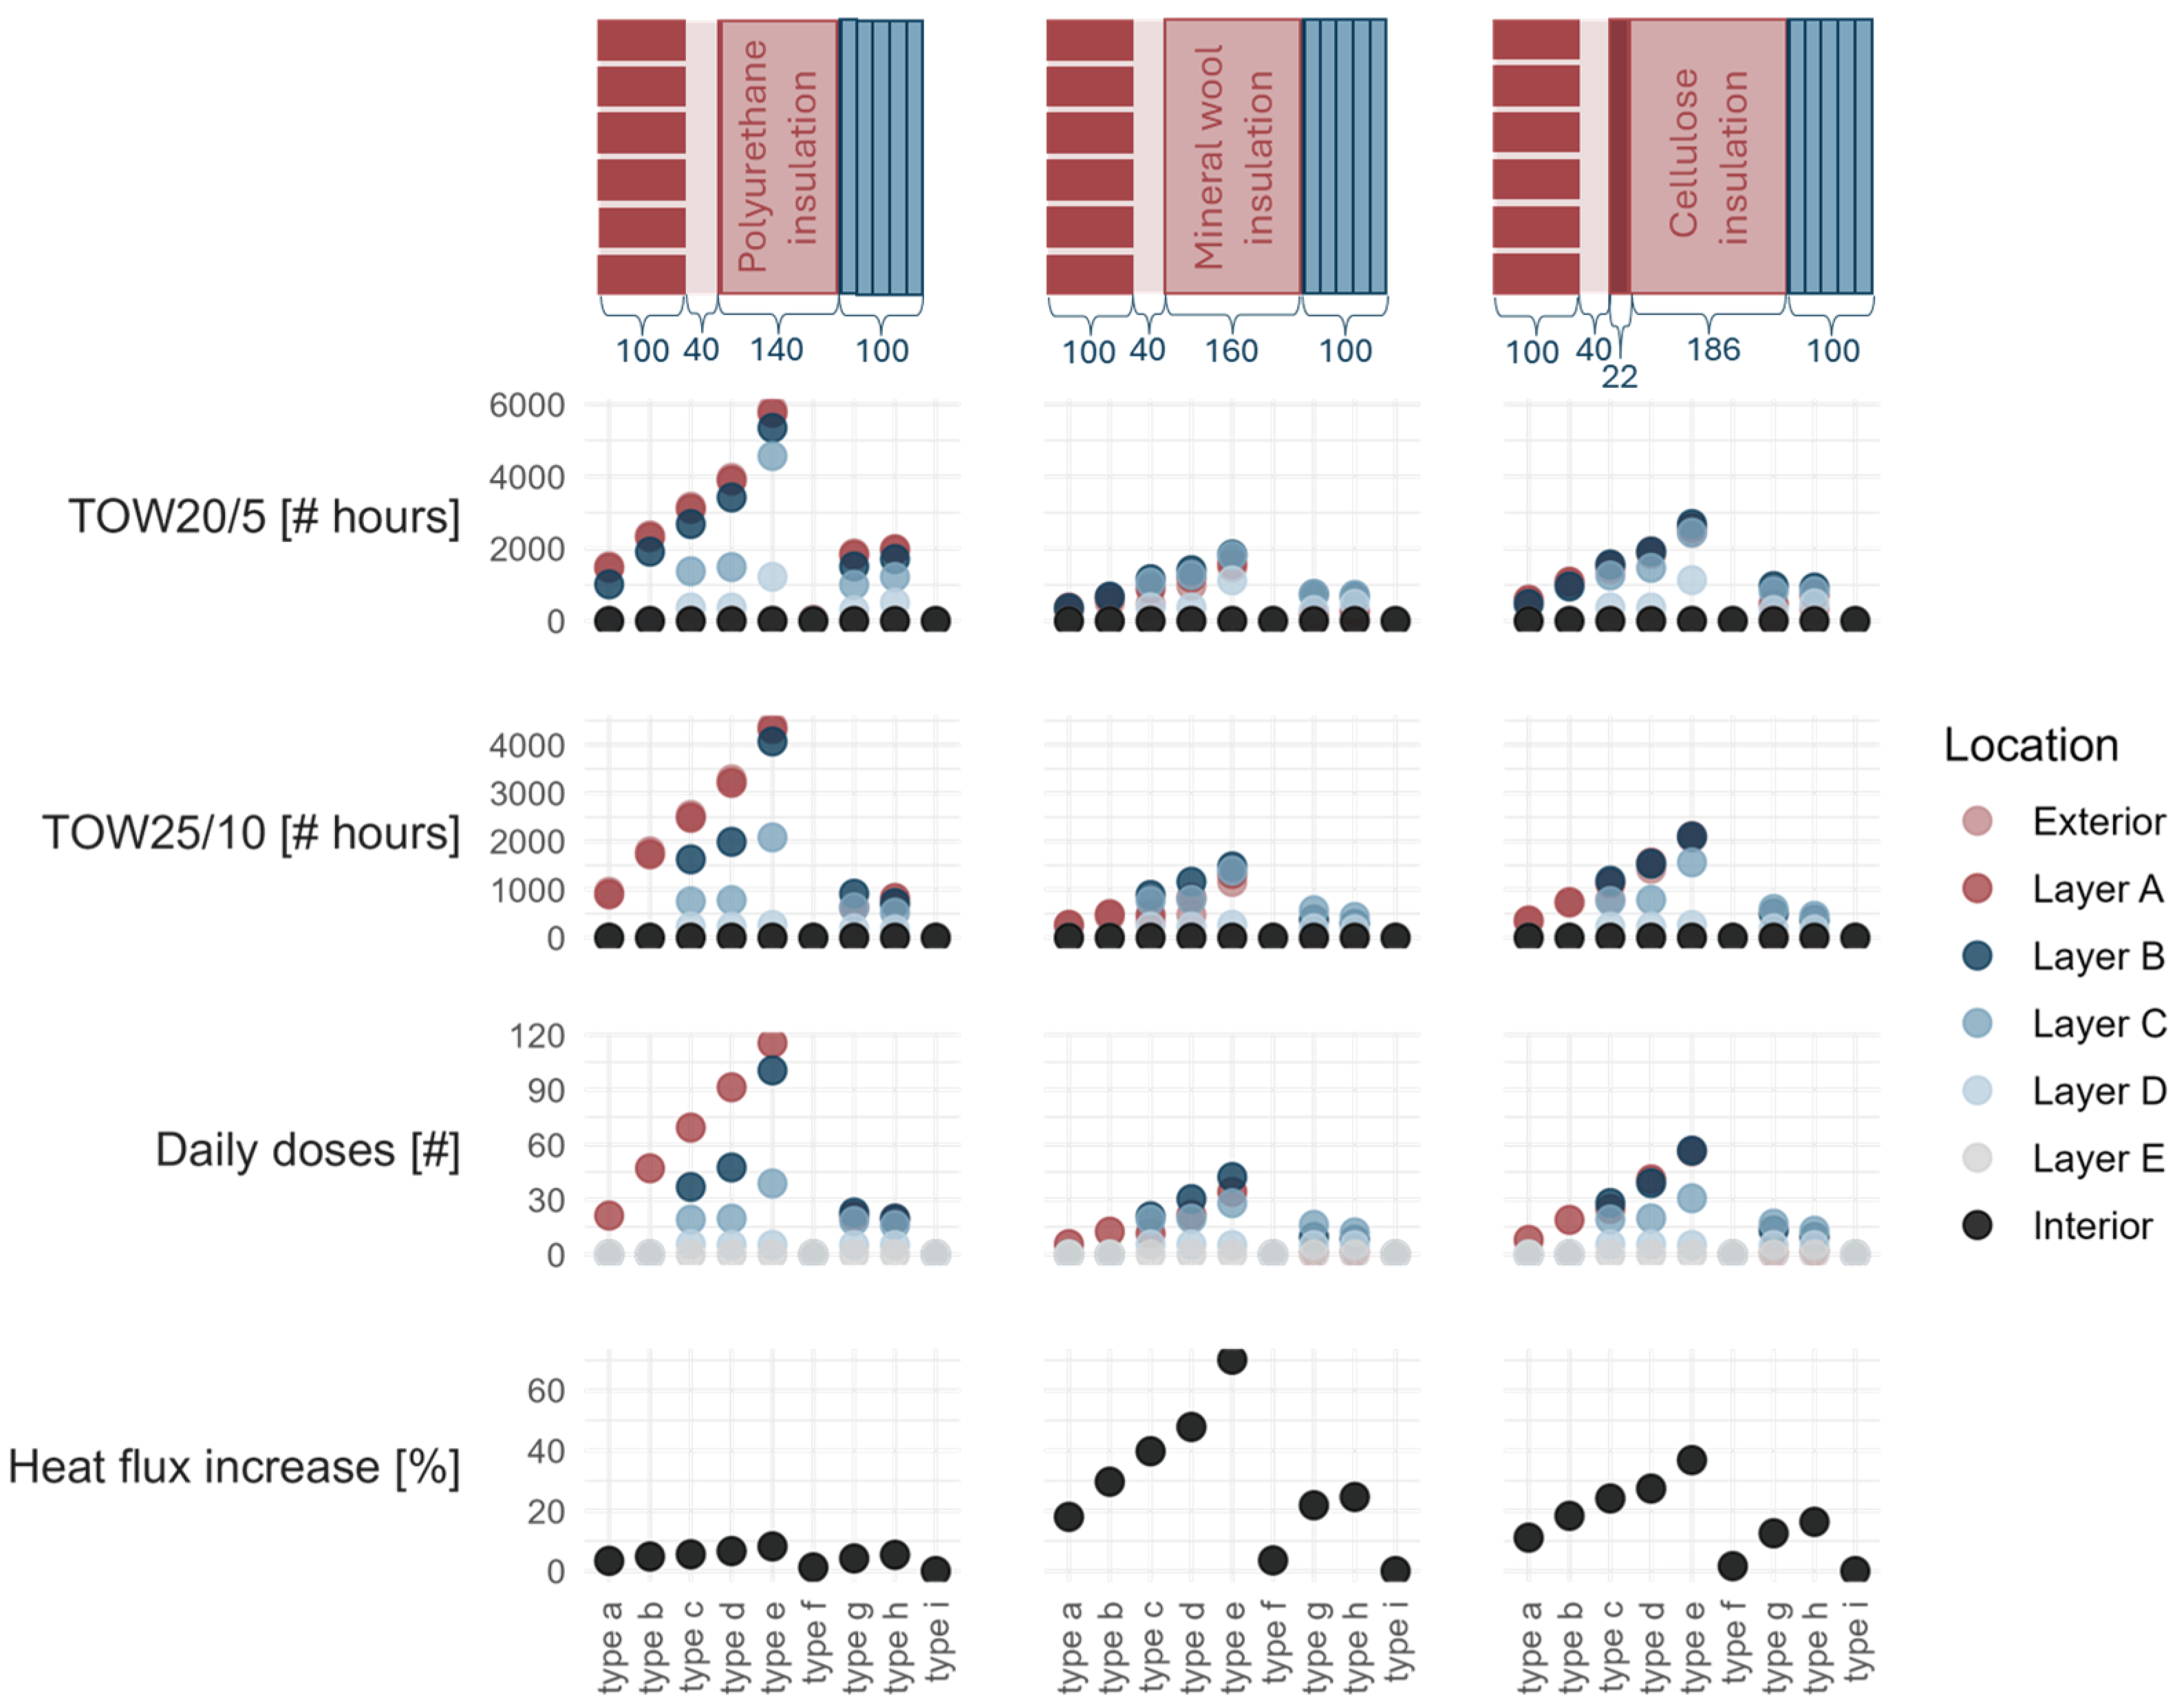
- The Time of Wetness with a moisture content higher than 20% during a period with a temperature higher than 5 °C (TOW20/5). This should be a maximum of 720 h (1 month) to avoid mold growth [6];
- The Time of Wetness with a moisture content higher than 25% during a period with a temperature higher than 10 °C (TOW25/10). This should be a maximum of 168 h (1 week) to avoid wood rot [6];
- Number of daily doses, calculated through the product of a moisture-induced component and a temperature-induced component. This calculation is based on the dose-response model and should remain below the limit of 451 doses to avoid white rot and below the limit of 229 doses to avoid brown rot [7,8].
- Heat flux increase of the wall assembly with built-in moisture compared to the same wall assembly with the least amount of built-in moisture during the first heating season (from the start of the simulation, which occurs from the beginning of winter, until the end of April).
- Heat flux increases in the wall assembly with built-in moisture compared to the same wall assembly with the least built-in moisture during the second heating season (about one year after the end of construction from the beginning of November until the end of April).
3. Results
3.1. Determine the Necessary Grid Size for Moisture Profiles
3.2. Define Moisture Profile Types
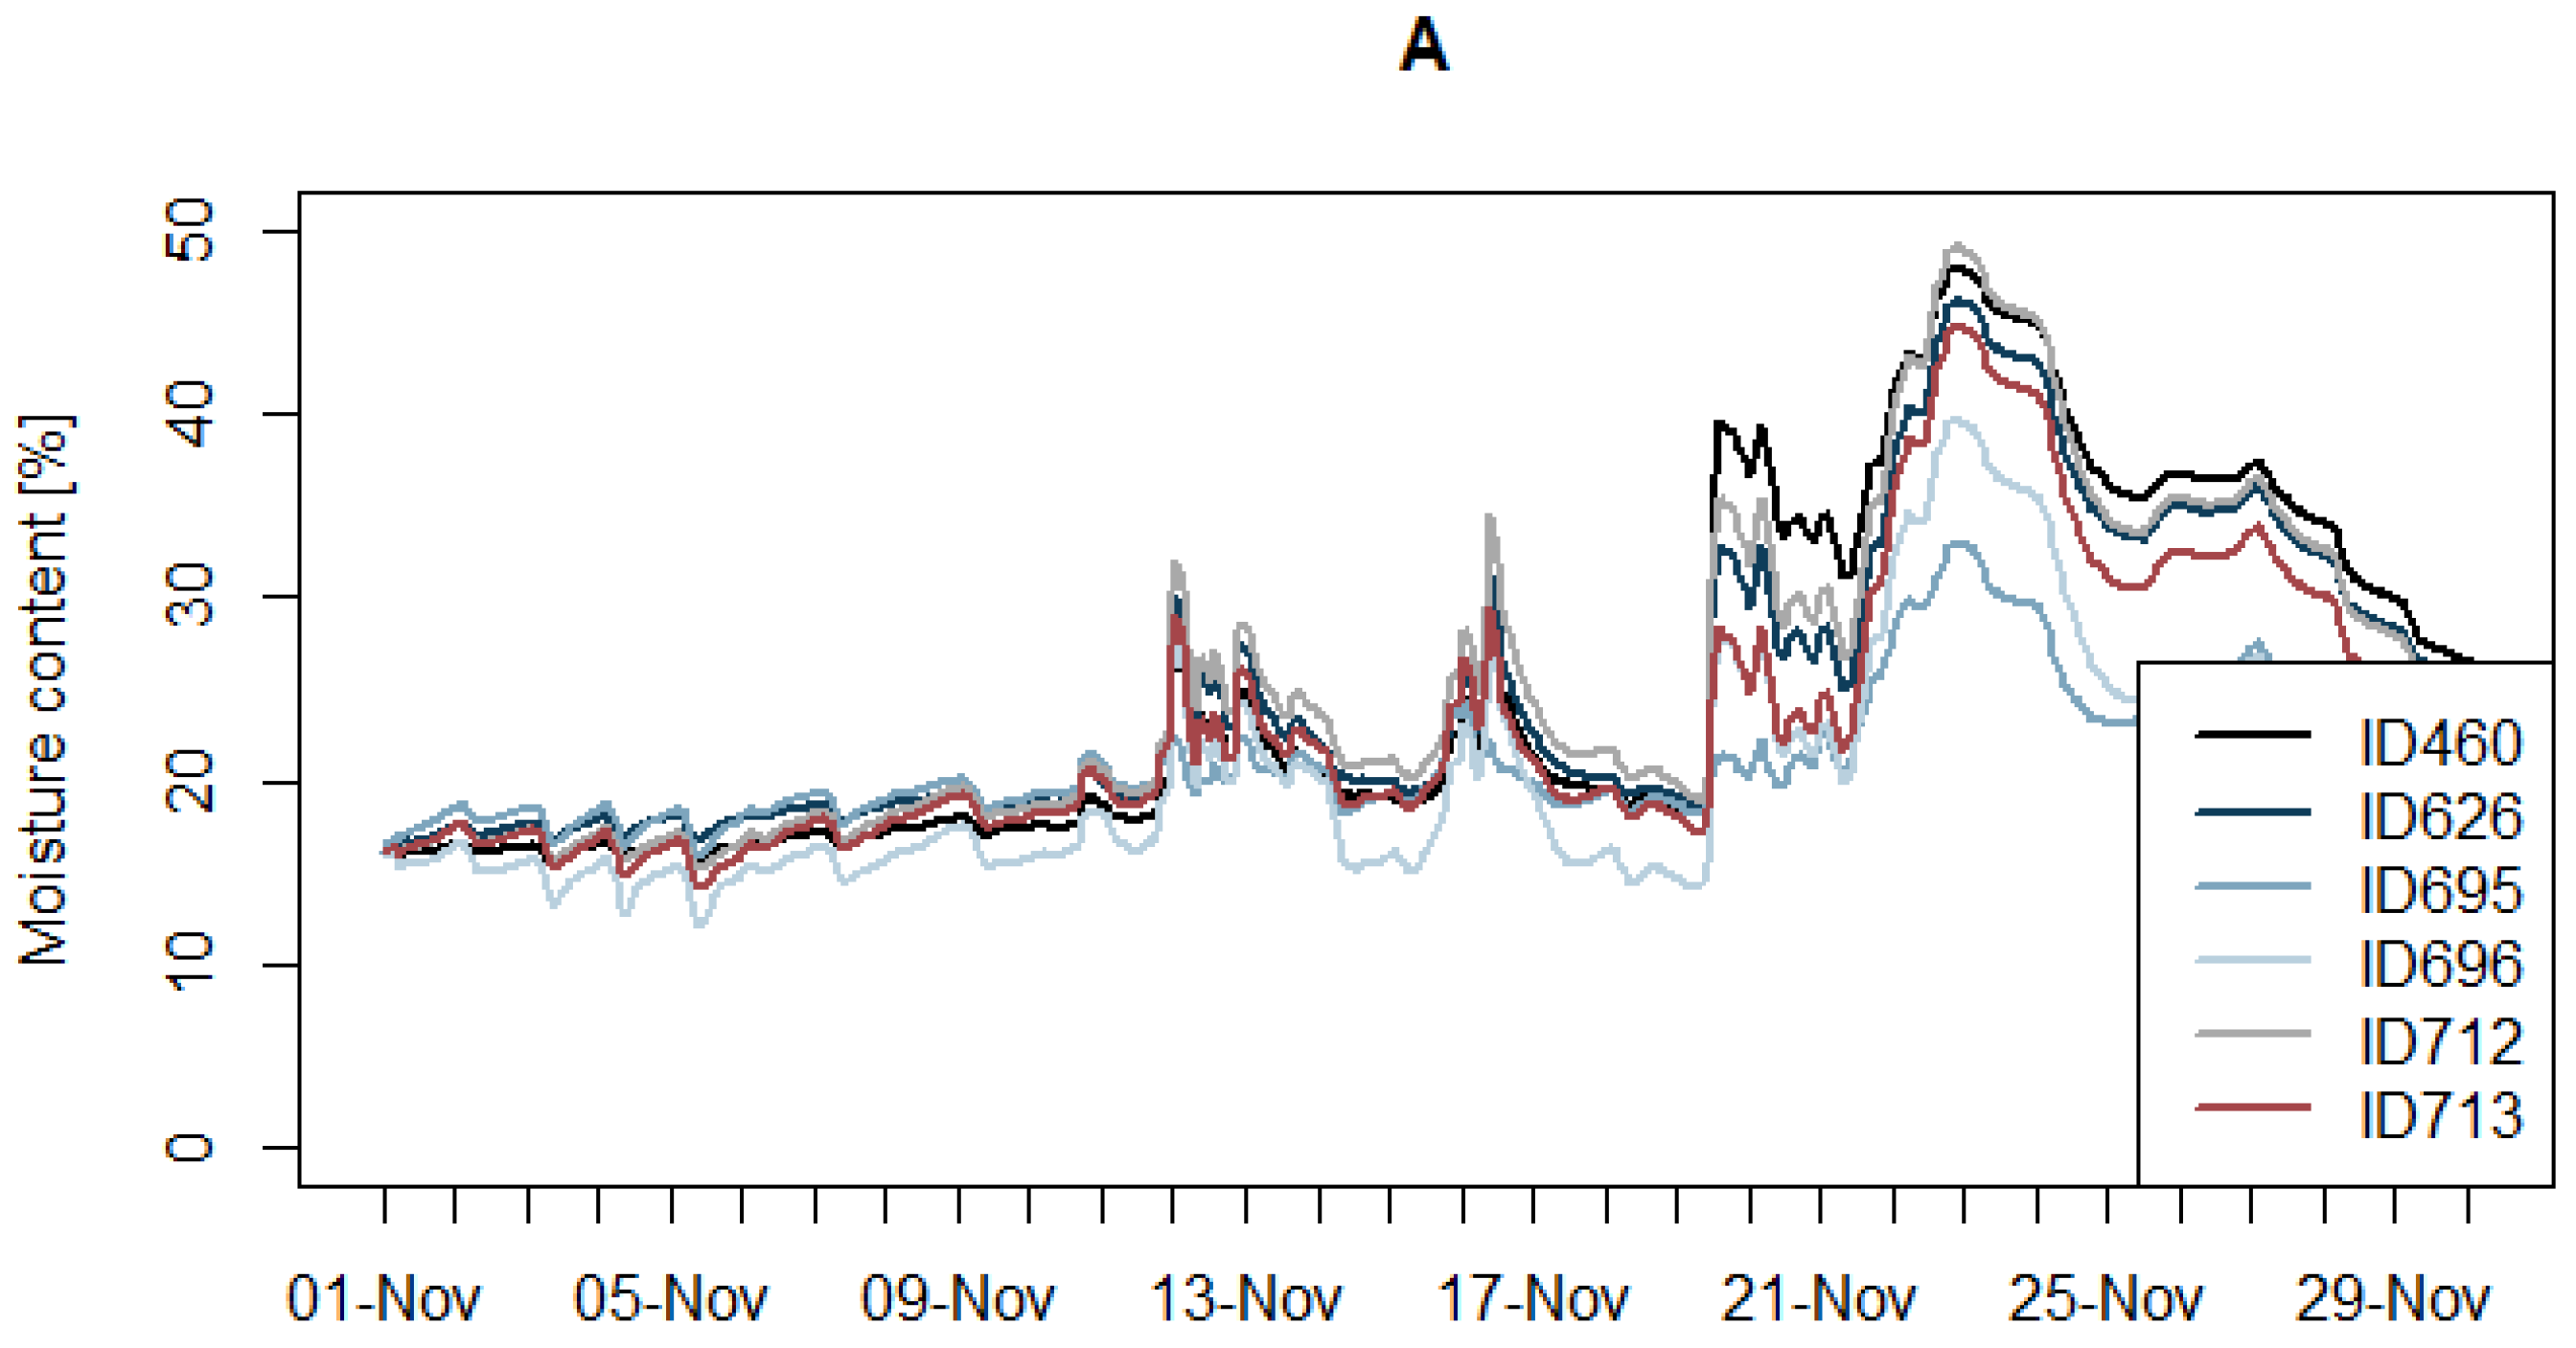
3.2.1. Wood Type
3.2.2. Glue Type
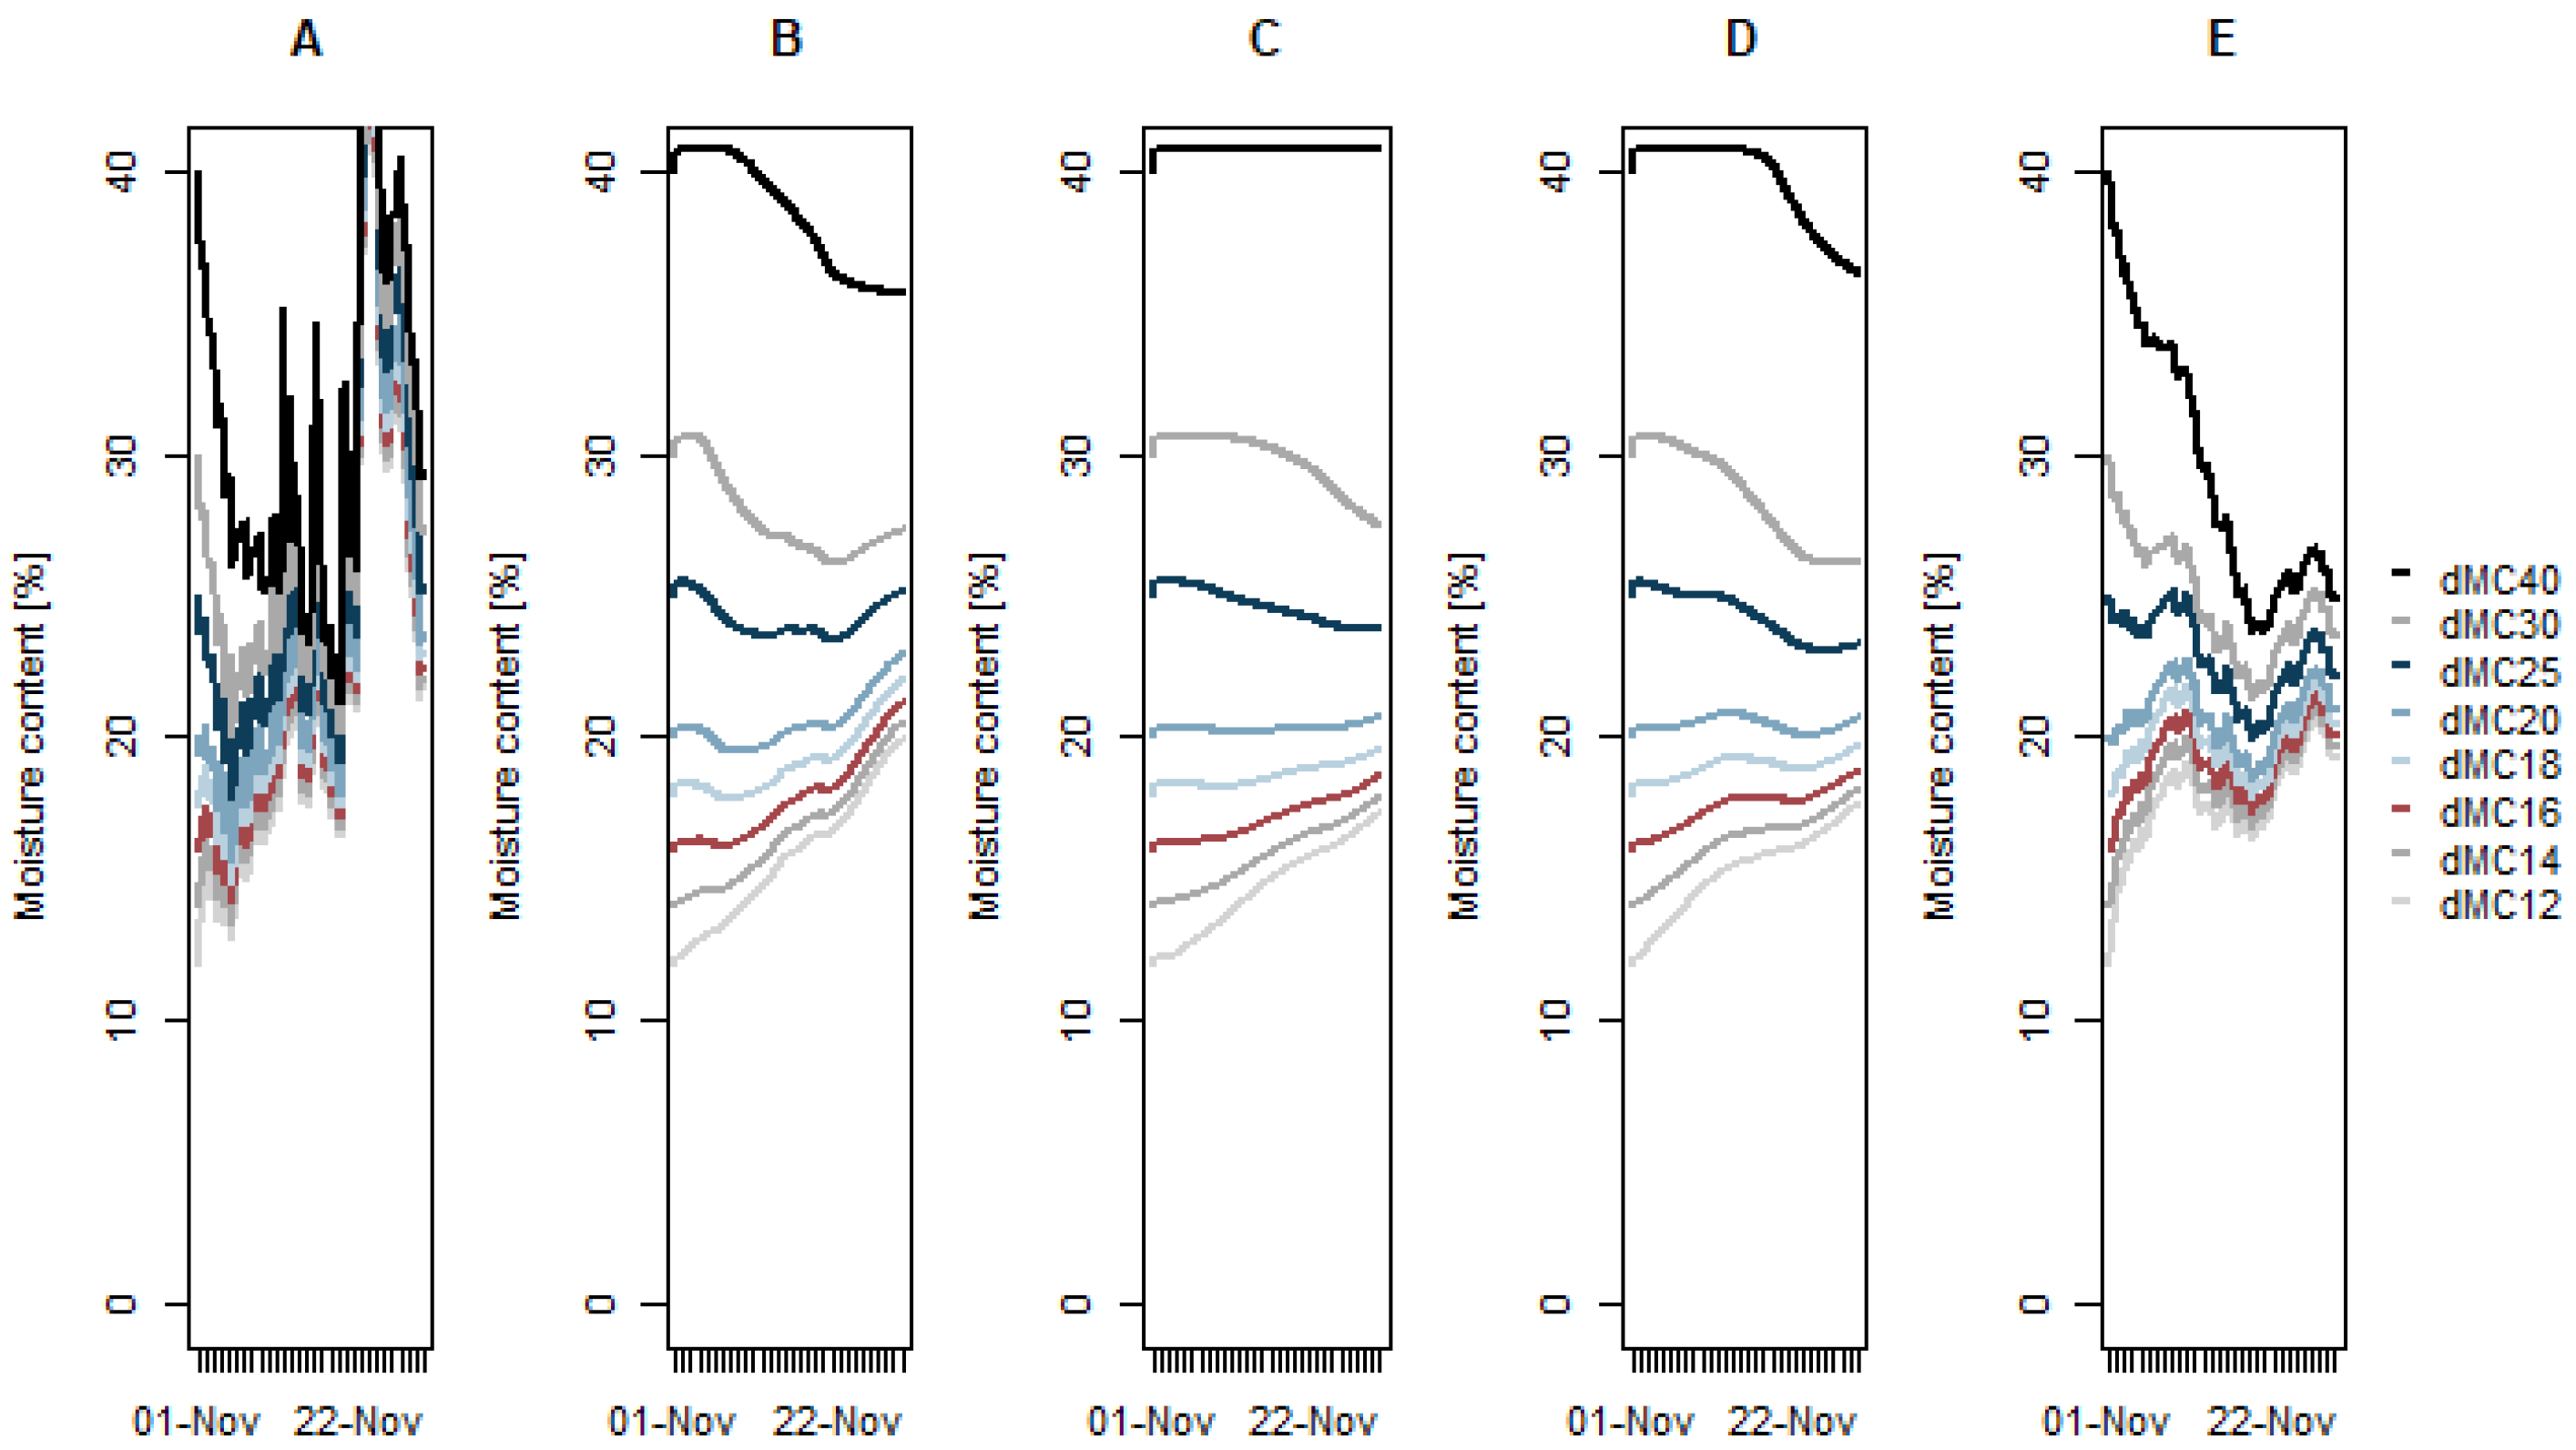
3.2.3. Delivery Moisture Content
3.2.4. Orientation
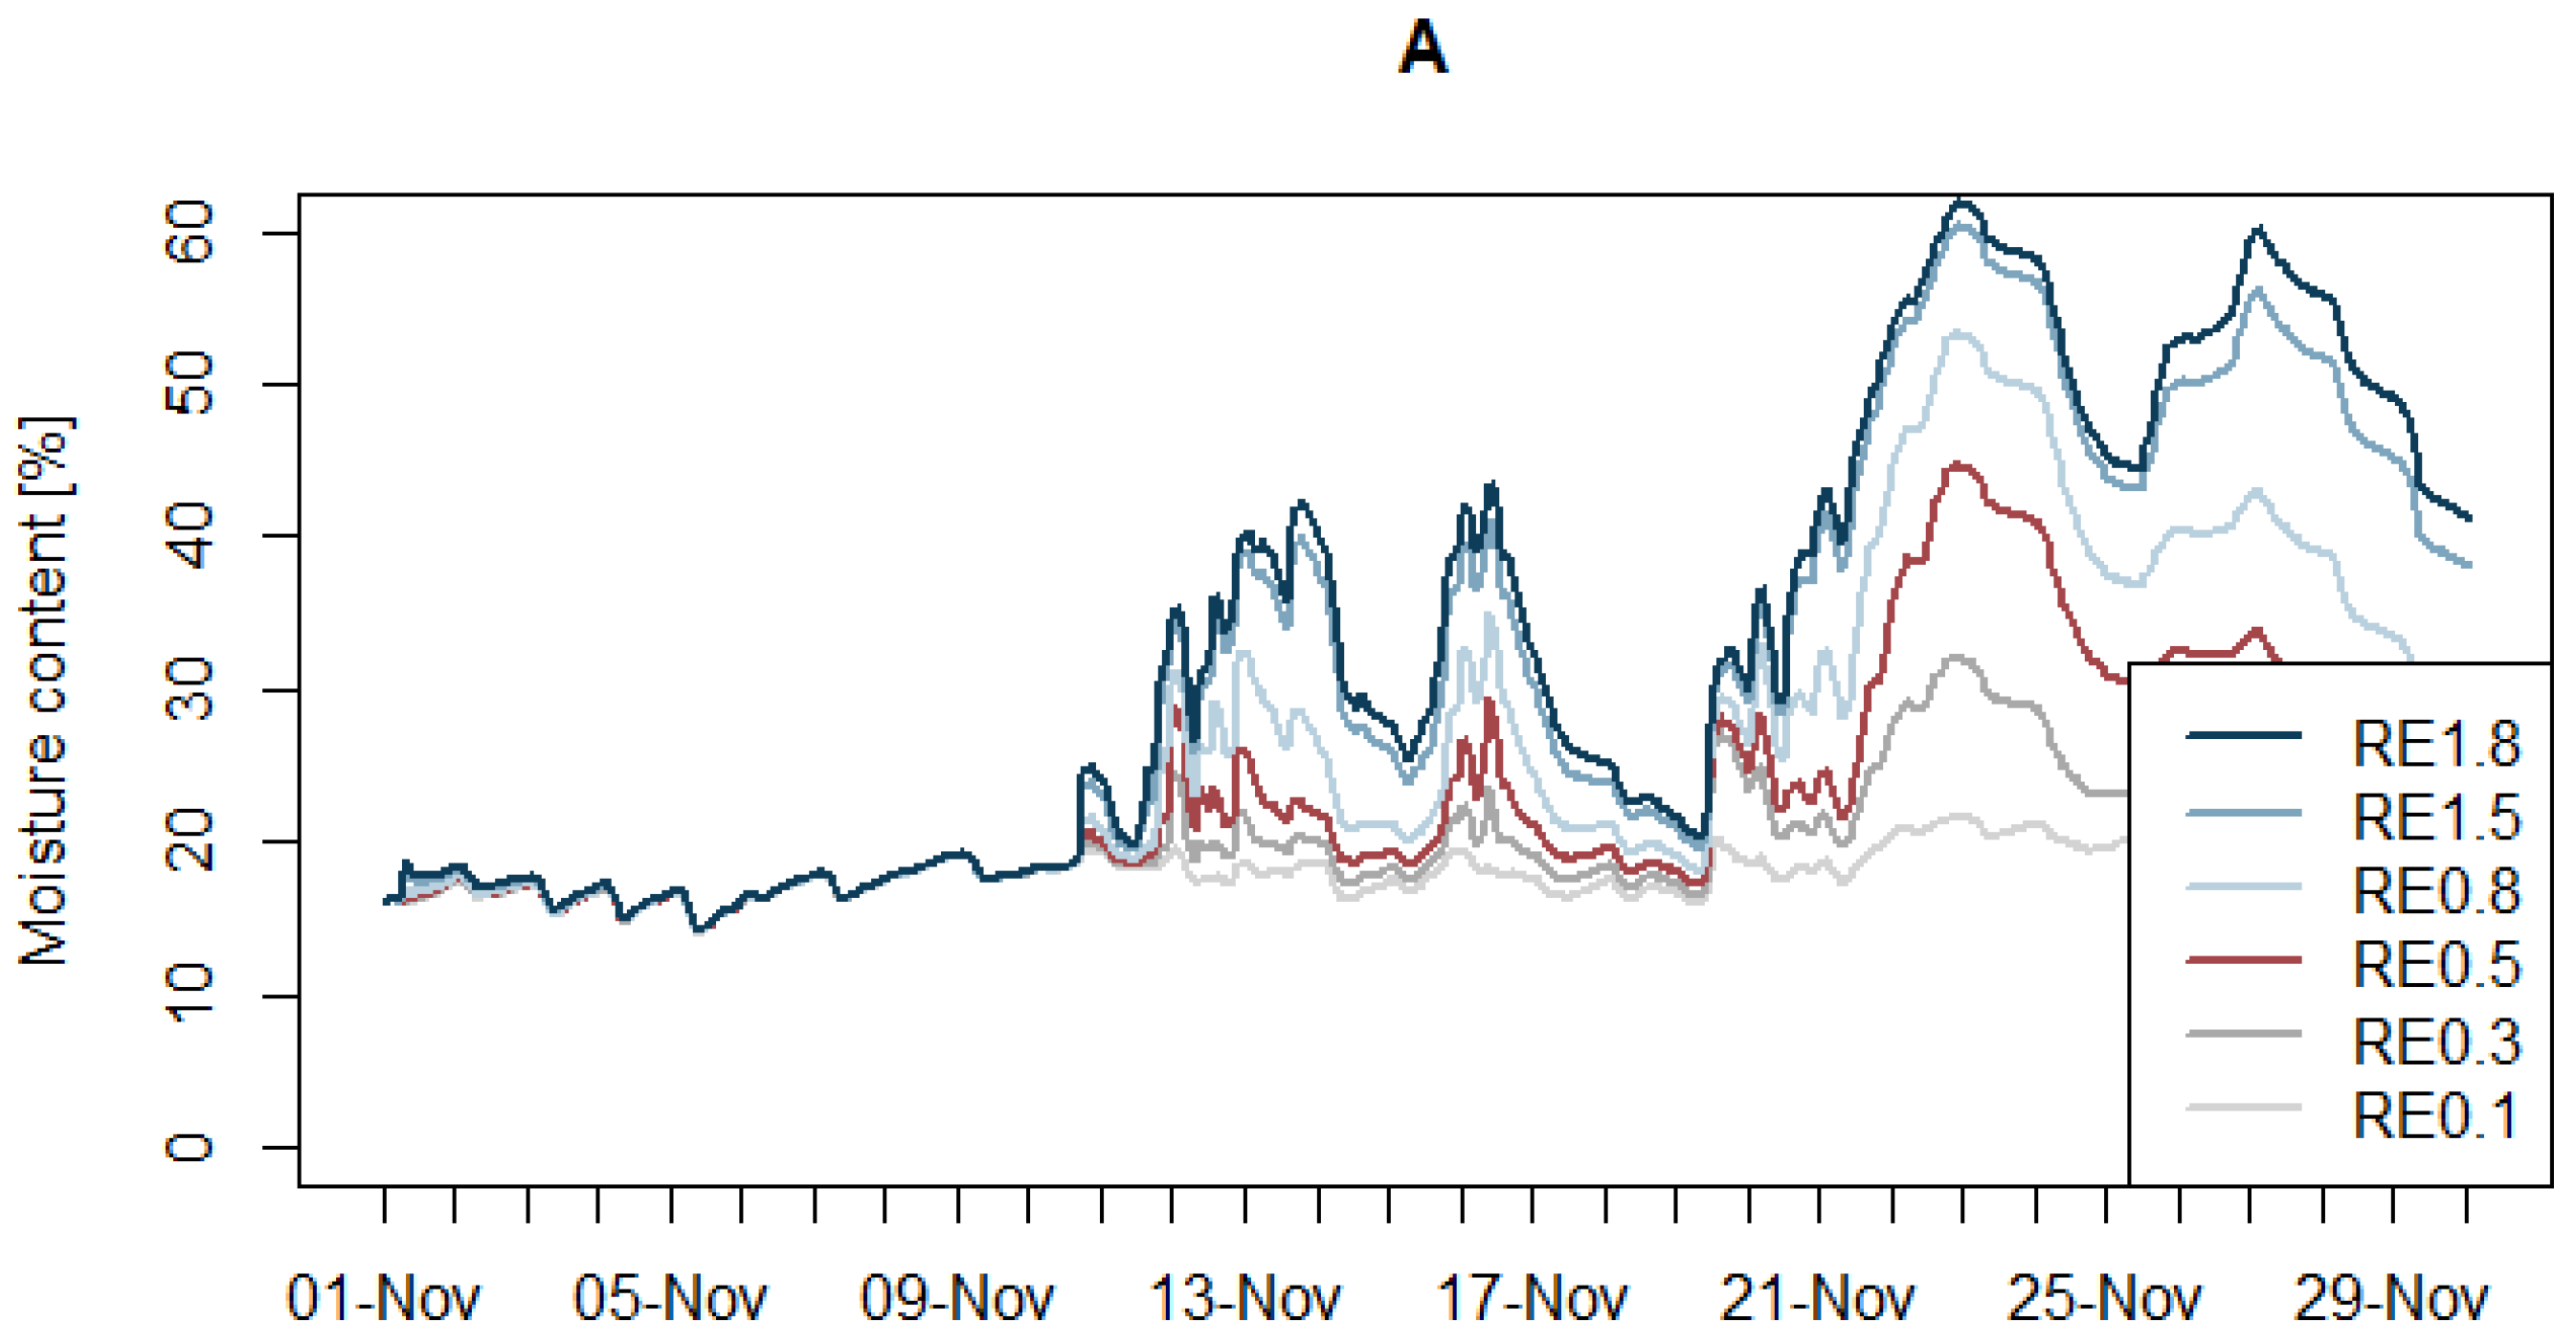
3.2.5. Rain Exposure Level
3.2.6. Define Reference Moisture Profile Types at the End of the Construction Phase
- Moisture content profile type a is based on the baseline scenario;
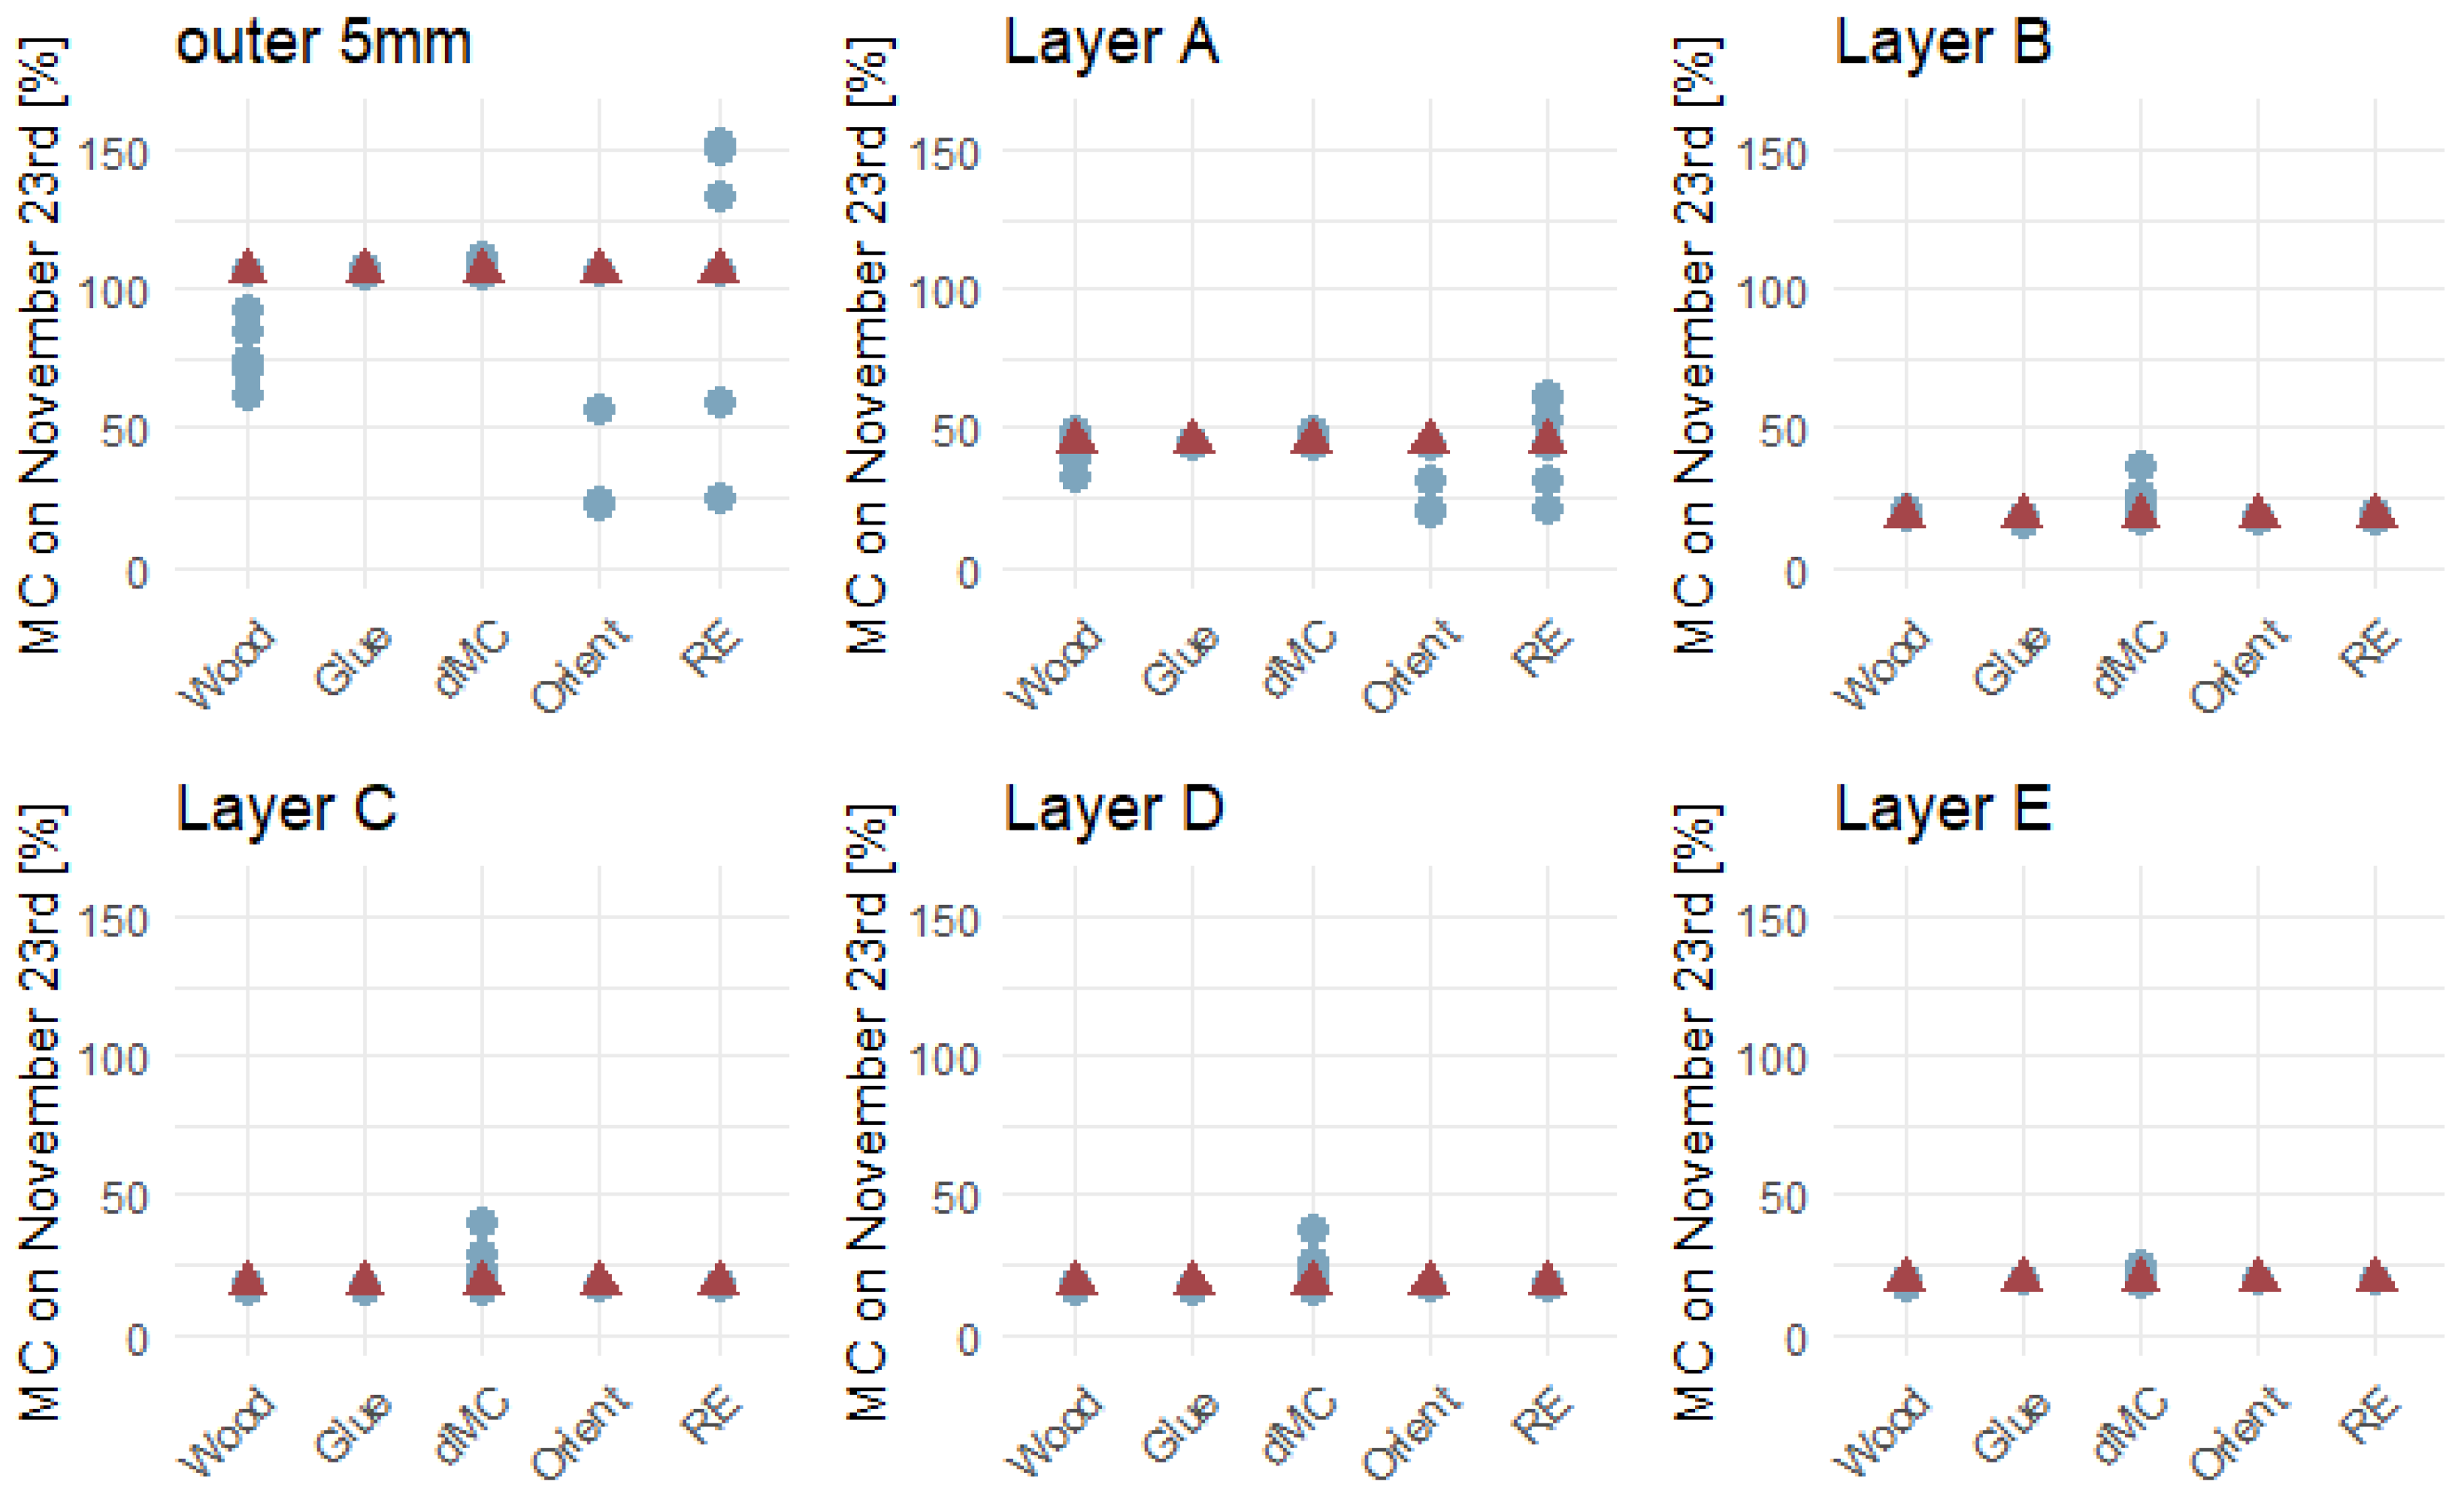
- Moisture content profile type b is the baseline scenario with an increased rain exposure level (RE = 1.8) since Figure 10 shows that this parameter has the highest influence on the moisture content in the outermost 5 mm and in layer A in general.
- Moisture content profile type c is the baseline scenario with an increased delivery moisture content (dMC = 40%) since Figure 10 shows that this parameter has the strongest influence on the moisture content in layers B, C, and D.
- Moisture content profile type d is based on the highest average moisture contents found for the outermost 5 mm.
- Moisture content profile type e is based on the highest average moisture content found for layer A.
- Moisture content profile type f is the baseline scenario with a decreased rain exposure level (RE = 0.1) since Figure 10 shows that this parameter has the highest influence on the moisture content in the outermost 5 mm and in layer A in general.
- Moisture content profile type g is based on the highest average moisture contents found for the outermost 5 mm, except the rain exposure level. A decreased rain exposure level (RE = 0.1) since Figure 10 showed that this parameter has the strongest influence on the moisture content in the outermost 5 mm and in layer A in general.
- Moisture content profile type h is based on the highest average moisture contents found for layer A, except the rain exposure level. A decreased rain exposure level (RE = 0.1) since Figure 10 showed that this parameter has the strongest influence on the moisture content in the outermost 5 mm and in layer A in general.
- Moisture content profile i is based on the lowest average moisture contents found for the outermost 5 mm and layer A in general.
3.3. Assess Degradation Risks for Wall Assemblies with the Reference Moisture Profiles
3.3.1. TOW20/5
3.3.2. TOW25/10
3.3.3. Daily Doses
3.3.4. Heat Flux Increase
4. Discussion
4.1. Determine the Necessary Grid Size for Moisture Profiles
4.2. Determination of Moisture Profiles Types
- Wood type: Significant variations in moisture content were observed in layer A (with a difference of 16 %points), especially in the outermost 5 mm (with a difference of 44 %points), indicating that material properties strongly affect how moisture is absorbed and retained.
- Glue type: Although differences were generally limited (with the highest difference of 2.7 %points found in layer B), the simulation showed that the way of simulating the glue layer (whether integrated or modeled separately) could influence the moisture dynamics in the CLT panel.
- Delivery moisture content: The initial moisture content had a diminishing impact over time, though its influence persisted longer in the middle layers compared to the surface. The delivery moisture content has little impact in the outside layers, especially when the delivery moisture content values only vary between 12 and 20%: the spread in average moisture content in layer C drops to 3.32 %points, the spread in average moisture content in layers B and D this drops to less than 3 %points and the spread in moisture content in layers A and E even drops to 1.58 %points after one month. When including the delivery moisture contents of 25, 30 and 40%, the spread in average moisture content in layers A and E drops to less than 7 %points; in layers B and D, the difference in average moisture content remains more than 15 %points, and in layer C this difference remains above 26 %points.
- Orientation: The orientation of the CLT panel had pronounced effects on the moisture content in layer A and the outermost 5 mm of the CLT panel. The highest average moisture content in the different layers is found in the West, South-West, and South orientations. A difference in average moisture contents in layer A was found to be about 24.83 %points between the different orientations. In the outer 5 mm, the difference is almost 84.26 %points. Both emphasize that exposure conditions during the construction phase critically affect the moisture profile. The difference between the different orientations in the other layers is limited to 1.75 %points.
- Rain Exposure: The rain exposure level had the strongest influence on the moisture content in the outermost 5 mm (with a difference of 128.05 %points) and in layer A in general (with a difference of 40.26 %points), underscoring the need for protection against the outdoor climate during the construction period. Only slight differences in moisture content in the other layers become noticeable after about 2 weeks (layer B), 3 weeks (layer C), or even later (layers D and E).
4.3. Degradation Assessment of Different Wall Assemblies with Reference Moisture Profiles
- TOW20/5:At the interior surface, all wall assemblies achieved a TOW20/5 value of zero, indicating effective moisture control in this zone. However, at the exterior surface, performance varied markedly with insulation type and moisture profile. For instance, all but two wall assemblies with PUR insulation exceeded the 720-h threshold in all cases (except for moisture profile types f and i), while those with mineral wool insulation breached the limit solely under the worst-case scenarios (moisture profile types d and type e). Wall assemblies with cellulose insulation did not exceed the 720-h threshold under the scenarios for the lowest rain exposure of 0.1 (moisture profile types f, g, h, and i) and in case of an average rain exposure of 0.5 in combination with a delivery moisture content of 16% (moisture profile type a).
- TOW25/10:The TOW25/10 metric remained below the critical 168-h threshold exclusively for wall assemblies under moisture profile types f and i. In all other configurations, at least one layer within the CLT panel experienced prolonged wetness. This shows wood decay (calculated through the TOW25/10 method) would only occur for moisture profiles for which the delivery moisture content is limited (dMC = 12 or 16% and not 40%) in combination with a decreased rain exposure level (RE = 0.1 and not 0.5 or 1.8).PUR-insulated assemblies with moisture profile type e exhibited a TOW25/10 of 4068 h—approximately 5.5 months—far exceeding the acceptable limit. Assemblies with mineral wool or cellulose insulation dried more rapidly (approximately 2 and 3 months, respectively). Although these durations still surpassed the one-week (168-h) guideline for preventing decay [6], all wall assemblies have dried out by mid-May at the latest.
- Daily doses:While the absolute number of daily doses remained below the critical thresholds for the development of white or brown rot, the highest doses were observed in wall assemblies with PUR insulation, suggesting a comparatively higher degradation risk while, however, still being considered “safe.”
- Heat flux increase:A noticeable trade-off was observed in thermal performance. Assemblies with mineral wool, although effective in reducing moisture retention, exhibited increased heat flux during the first heating season, compromising energy performance. On the other hand, PUR insulation provided the smallest increase in heat flow. However, this heat flux increase no longer exists as from the second heating season.
5. Conclusions
- A sufficiently detailed moisture profile grid—particularly one that distinguishes the outermost 5 mm and the wooden layer exposed to rain (layer A) from the rest of the panel—is necessary to accurately predict the evolution of moisture content and subsequent decay risk. Simplified profiles that use an overall average or even layer-specific averages are insufficient.
- Moisture content values in CLT assemblies are significantly affected by wood type, initial moisture levels, orientation, and rain exposure. Of these, the outer region of the panel (layer A) is most sensitive to these factors, highlighting the need for targeted mitigation strategies during the construction phase.
- The moisture content in layer A is mainly influenced by the rain exposure level (creating a range of 40.26 %points), followed by orientation (creating a range of 24.83 %points) and wood type (creating a range of 16 %points). The moisture content in layers B, C, and D is influenced by differences in delivery moisture content (with a range of 15.73 %points, 26.23 %points, and 18.32 %points, respectively). The moisture content in layer E is barely impacted by any of the variations of parameters.
- The degradation calculations reveal that all assemblies maintained a TOW20/5 of zero hours at the interior surface, confirming effective moisture control. However, at the exterior surface, only configurations with low rain exposure (RE = 0.1) and low delivery moisture content (12–16%) could keep the TOW25/10 below the critical 168-h threshold. The longest time of wetness was found for wall assemblies with PUR insulation, which dried in about 5.5 months. Wall assemblies with mineral wool dried in about 2 months and those with cellulose in about 3 months.
- Although the TOW calculations indicate a clear risk of decay, the accumulated degradation doses (a more detailed calculation approach) remained below the safety thresholds (451 doses for white rot and 229 for brown rot). Even though the number of doses remained below the thresholds PUR-insulated assemblies showed a comparatively higher number of doses.
- While mineral wool achieved superior moisture management, it also led to a heat flux increase during the first heating season (increase up to 70%). Built-in moisture in wall assemblies with cellulose insulation also led to a notable heat flux increase during the first heating season (increase up to 37%). Wall assemblies with PUR insulation suffer the least from an in-creased heat flow (increase up to 8%). This heat flux increase is nonexistent in the following heating seasons since the structure dried out sufficiently within the first year.
Author Contributions
Funding
Data Availability Statement
Conflicts of Interest
Abbreviations
| CLT | Cross laminated timber |
| HAM | Heat, Air, Moisture |
| MRY | Moisture Reference Year |
| dMC | Delivery moisture content |
| MC | Moisture content |
| OFAT | One Factor at a Time |
| PUR | polyurethane insulation board |
| MW | Mineral wool insulation |
| CEL | Cellulose insulation |
| U | Thermal transmittance (W/m2K) |
| ID | Identification code used in the Delphin 6.1.6 software material database |
| d | Thickness of the material |
| ρ | Density (kg/m3) |
| cp | Specific heat capacity (J/m3K) |
| λ | Thermal conductivity coefficient (W/mK) |
| µ | Water vapor resistance factor (−) |
| Sd | Water vapor diffusion resistance equivalent air layer thickness (m) |
| ϴ80 | Equilibrium moisture content at 80% relative humidity |
| Aw | Absorption coefficient |
| TOW20/05 | the number of hours where a moisture content higher than 20% occurs during a period with a temperature higher than 5 °C |
| TOW25/10 | the number of hours where a moisture content higher than 25% occurs during a period with a temperature higher than 10 °C |
References
- Lima, D.F.; Duarte, S.; Branco, J.M.; Nunes, L. Mass Timber Buildings: The Associated Risks of Rainwater Exposure during Construction in the Portuguese Climate. J. Build. Eng. 2024, 98, 111110. [Google Scholar] [CrossRef]
- Niklewski, J.; Fredriksson, M.; Isaksson, T. Moisture Content Prediction of Rain-Exposed Wood: Test and Evaluation of a Simple Numerical Model for Durability Applications. Build. Environ. 2016, 97, 126–136. [Google Scholar] [CrossRef]
- Habtie, K.; Vanderschelden, B.; Jiang, X.; De Ligne, L.; Van Der Bulcke, J.; Bossche, N. Hygrothermal Performance of CLT Subjected to Rain Loads during Construction in Belgium. In Proceedings of the 16th International Conference on Durability of Building Materials and Components CIMNE, Beijing, China, 10–13 October 2023. [Google Scholar]
- Vanderschelden, B.; Lacasse, M.A.; Moore, T. Methodological Framework for HAM-Simulations: The Litigation Case of a CLT-Balcony Subjected to Rain Loads during Construction. In Proceedings of the ASHRAE Buildings XV Conference, Clearwater Beach, FL, USA, 5–8 December 2022. [Google Scholar]
- McClung, R.; Ge, H.; Straube, J.; Wang, J. Hygrothermal Performance of Cross-Laminated Timber Wall Assemblies with Built-in Moisture: Field Measurements and Simulations. Build. Environ. 2014, 71, 95–110. [Google Scholar] [CrossRef]
- Viitanen, H.A. Factors Affecting the Development of Mould and Brown Rot Decay in Wooden Material and Wooden Structures: Effect of Humidity, Temperature and Exposure Time; The Swedish University of Agricultural Science: Uppsala, Sweden, 1996. [Google Scholar]
- Brischke, C.; Rapp, A.O. Dose–Response Relationships between Wood Moisture Content, Wood Temperature and Fungal Decay Determined for 23 European Field Test Sites. Wood Sci. Technol. 2008, 42, 507–518. [Google Scholar] [CrossRef]
- Brischke, C.; Meyer-Veltrup, L. Modelling Timber Decay Caused by Brown Rot Fungi. Mater. Struct. 2016, 49, 3281–3291. [Google Scholar] [CrossRef]
- Brandstätter, F.; Kalbe, K.; Autengruber, M.; Lukacevic, M.; Kalamees, T.; Ruus, A.; Annuk, A.; Füssl, J. Numerical Simulation of CLT Moisture Uptake and Dry-out Following Water Infiltration through End-Grain Surfaces. J. Build. Eng. 2023, 80, 108097. [Google Scholar] [CrossRef]
- Buck, D.; Wallentén, P.; Sehlstedt-Persson, M.; Öhman, M. Moisture- and Mould-Resistance: Multi-Modal Modelling Leveraging X-Ray Tomography in Edge-Sealed Cross-Laminated Timber. Mater. Des. 2023, 230, 111967. [Google Scholar] [CrossRef]
- Kalbe, K.; Kukk, V.; Kalamees, T. Identification and Improvement of Critical Joints in CLT Construction without Weather Protection. E3S Web Conf. 2020, 172, 10002. [Google Scholar] [CrossRef]
- Kalbe, K.; Kalamees, T.; Kukk, V.; Ruus, A.; Annuk, A. Wetting Circumstances, Expected Moisture Content, and Drying Performance of CLT End-Grain Edges Based on Field Measurements and Laboratory Analysis. Build. Environ. 2022, 221, 109245. [Google Scholar] [CrossRef]
- Kalbe, K.; Pärn, R.; Ruus, A.; Kalamees, T. Enhancing CLT Construction—Hygrothermal Modelling, Novel Performance Criterion, and Strategies for End-Grain Moisture Safety. J. Build. Eng. 2024, 98, 111411. [Google Scholar] [CrossRef]
- Johns, D.; Richman, R. Dry-out Behaviour of Cross-Laminated Timber (CLT) Edge Conditions in Roof Assemblies: A Field Study. Structures 2025, 72, 108210. [Google Scholar] [CrossRef]
- Johns, D.; Richman, R.; Lawrence, C. Assessing the Effectiveness of Cross-Laminated Timber (CLT) Roof Assembly Moisture Control and Mitigation Strategies: A Field Laboratory. Constr. Build. Mater. 2024, 457, 139409. [Google Scholar] [CrossRef]
- Schmidt, E.; Riggio, M. Monitoring Moisture Performance of Cross-Laminated Timber Building Elements during Construction. Buildings 2019, 9, 144. [Google Scholar] [CrossRef]
- Udele, K.E.; Sinha, A.; Morrell, J.J. Effects of Re-Drying on Properties of Cross Laminated Timber (CLT) Connections. J. Build. Eng. 2023, 76, 107298. [Google Scholar] [CrossRef]
- Udele, K.E.; Morrell, J.J.; Cappellazzi, J.; Sinha, A. Characterizing Properties of Fungal-Decayed Cross Laminated Timber (CLT) Connection Assemblies. Constr. Build. Mater. 2023, 409, 134080. [Google Scholar] [CrossRef]
- Olsson, L. CLT Construction without Weather Protection Requires Extensive Moisture Control. J. Build. Phys. 2021, 45, 5–35. [Google Scholar] [CrossRef]
- Fredriksson, M.; Wadsö, L.; Johansson, P. Methods for Determination of Duration of Surface Moisture and Presence of Water in Gaps in Wood Joints. Wood Sci. Technol. 2013, 47, 913–924. [Google Scholar] [CrossRef]
- Fredriksson, M. Moisture Conditions in Rain Exposed Wood Joints—Experimental Methods and Laboratory Measurements; Division of Building Materials, LTH, Lund University: Lund, Sweden, 2013. [Google Scholar]
- Kordziel, S.; Pei, S.; Glass, S.V.; Zelinka, S.; Tabares-Velasco, P.C. Structure Moisture Monitoring of an 8-Story Mass Timber Building in the Pacific Northwest. J. Archit. Eng. 2019, 25, 04019019. [Google Scholar] [CrossRef]
- Niklewski, J.; Fredriksson, M. The Effects of Joints on the Moisture Behaviour of Rain Exposed Wood: A Numerical Study with Experimental Validation. Wood Mater. Sci. Eng. 2021, 16, 1–11. [Google Scholar] [CrossRef]
- Kordziel, S. Moisture Monitoring and Modeling of Mass Timber Building Systems. In Proceedings of the WCTE 2018-World Conference on Timber Engineering, Seoul, Republic of Korea, 20–23 August 2018. [Google Scholar]
- Wang, L.; Wang, J.; Ge, H. Wetting and Drying Performance of Cross-Laminated Timber Related to on-Site Moisture Protections: Field Measurements and Hygrothermal Simulations. E3S Web Conf. 2020, 172, 10003. [Google Scholar] [CrossRef]
- Schmidt, E.L.; Riggio, M.; Barbosa, A.R.; Mugabo, I. Environmental Response of a CLT Floor Panel: Lessons for Moisture Management and Monitoring of Mass Timber Buildings. Build. Environ. 2019, 148, 609–622. [Google Scholar] [CrossRef]
- Kukk, V.; Kers, J.; Kalamees, T.; Wang, L.; Ge, H. Impact of Built-in Moisture on the Design of Hygrothermally Safe Cross-Laminated Timber External Walls: A Stochastic Approach. Build. Environ. 2022, 226, 109736. [Google Scholar] [CrossRef]
- Virta, J.; Koponen, S.; Absetz, I. Modelling Moisture Distribution in Wooden Cladding Board as a Result of Short-Term Single-Sided Water Soaking. Build. Environ. 2006, 41, 1593–1599. [Google Scholar] [CrossRef]
- Viitanen, H.; Toratti, T.; Makkonen, L.; Peuhkuri, R.; Ojanen, T.; Ruokolainen, L.; Räisänen, J. Towards Modelling of Decay Risk of Wooden Materials. Eur. J. Wood Wood Prod. 2010, 68, 303–313. [Google Scholar] [CrossRef]
- Akhavan Shams, S.; Ge, H.; Wang, L. Hygrothermal Modeling in Mass Timber Constructions: Recent Advances and Machine Learning Prospects. J. Build. Eng. 2024, 96, 110500. [Google Scholar] [CrossRef]
- Sontag, L.; Nicolai, A.; Vogelsang, S. Validierung Der Solverimplementierung Des Hygrothermischen Simulationsprogramms Delphin; Institut für Bauklimatik, Technische Universität Dresden: Dresden, Germany, 2013. [Google Scholar]
- Scheffler, G.A. Validation of Hygrothermal Material Modelling Under Consideration of the Hysteresis of Moisture Storage. Doctoral Thesis, Dresden University of Technology, Dresden, Germany, 2008. [Google Scholar]
- Vandemeulebroucke, I.; Caluwaerts, S.; Van Den Bossche, N. Climate Data for Hygrothermal Simulations of Brussels. Data Brief 2022, 44, 108491. [Google Scholar] [CrossRef]
- Van Linden, S.; Van Den Bossche, N. Review of Rainwater Infiltration Rates in Wall Assemblies. Build. Environ. 2022, 219, 109213. [Google Scholar] [CrossRef]
- Langmans, J.; Desta, T.Z.; Alderweireldt, L.; Roels, S. Experimental Analysis of Cavity Ventilation Behind Residential Rainscreen Cladding Systems. Energy Procedia 2015, 78, 1750–1755. [Google Scholar] [CrossRef]
- Brandner, R.; Flatscher, G.; Ringhofer, A.; Schickhofer, G.; Thiel, A. Cross Laminated Timber (CLT): Overview and Development. Eur. J. Wood Wood Prod. 2016, 74, 331–351. [Google Scholar] [CrossRef]
- Niemz, P.; Michel, F.; Kranitz, K. Untersuchungen zum Einfluss der Verklebung auf den Diffusionswiderstand bei Einsatz von glutinbasierten Klebstoffen. Bauphysik 2013, 35, 119–124. [Google Scholar] [CrossRef]
- Hass, P.; Wittel, F.K.; McDonald, S.A.; Marone, F.; Stampanoni, M.; Herrmann, H.J.; Niemz, P. Pore Space Analysis of Beech Wood: The Vessel Network. Holzforschung 2010, 64, 639–644. [Google Scholar] [CrossRef]
- RDH Building Science Inc. Moisture Risk Management Strategies for Mass Timber Buildings; RDH Building Science: Vancouver, BC, Canada, 2021. [Google Scholar]
- Gustafsson, A. The CLT Handbook; RISE Research Institutes of Sweden: Stockholm, Sweden, 2019. [Google Scholar]
- NBN EN ISO 15927-3; Hygrothermal Performance of Buildings—Calculation and Presentation of Climatic Data—Part 3: Calculation of a Driving Rain Index for Vertical Surfaces from Hourly Wind and Rain Data. NBN: Brussels, Belgium, 2009.


| Material | ID 1 | d mm | ρ kg m−3 | cp J kg−1 K−1 | λ W m−1 K−1 | µ - | ϴ80 kg m−3 | ϴsat kg m−3 | Aw kg m−2 s−1/2 |
|---|---|---|---|---|---|---|---|---|---|
| CLT panel | |||||||||
| Spruce tangential | 713 | 5 × 20 | 393.7 | 1843 | 0.106 | 487.7 | 59.8 | 728.1 | 0.005 |
| MUF adhesive 2 | 713 2 | 4 × 0.25 | 425.0 | 1245 | 0.079 | 36.5 | 0.00 | 72.6 | 590.2 |
| Insulation | |||||||||
| PUR | 194 | 140 | 37 | 1500 | 0.031 | 65.0 | 0.0001 | 0.001 | 945.0 |
| Aluminum facer 3 | 1763 | - | - | - | - | - | - | - | - |
| Façade cladding | |||||||||
| Air gap (vertical) | 17 | 40 | 1.3 | 1050 | 0.222 | 0.25 | 0.00 | 1000 | 0.00 |
| Brick | 512 | 100 | 1786.3 | 889 | 0.548 | 18.01 | 13.4 | 319.4 | 0.20 |
| Wood Type | ID 1 | ρ kg m−3 | cp J kg−1 K−1 | λ W m−1 K−1 | µ - | ϴ80 kg m−3 | ϴsat kg m−3 | Aw kg m−2 s−1/2 |
|---|---|---|---|---|---|---|---|---|
| Spruce tangential (from Saxony) | 713 | 393.7 | 1843 | 0.106 | 487.7 | 59.8 | 728.1 | 0.005 |
| Spruce radial (from Saxony) | 712 | 393.7 | 1843 | 0.112 | 487.7 | 59.8 | 728.1 | 0.012 |
| Spruce radial | 696 | 437.6 | 1391 | 0.122 | 474.7 | 62.6 | 445.1 | 0.013 |
| Spruce tangential | 695 | 393.7 | 1252 | 0.106 | 187.7 | 70.7 | 728.0 | 0.005 |
| Spruce radial/tangential | 626 | 425.0 | 1245 | 0.079 | 73.0 | 72.6 | 590.2 | 0.002 |
| Spuce SW Radial | 460 | 519.9 | 1189 | 0.130 | 236.2 | 67.6 | 692.0 | 0.058 |
| Rain Exposure Coefficient | |
|---|---|
| Minimum | 0.1 |
| Q1 | 0.3 |
| Median | 0.5 (baseline) |
| Q3 | 0.8 |
| Maximum 1 | 1.5 |
| Maximum 2 | 1.8 |
| Material | ID 1 | d mm | ρ kg m−3 | cp J kg−1 K−1 | λ W m−1 K−1 | µ - | ϴ80 kg m−3 | ϴsat kg m−3 | Aw kg m−2 s−1/2 |
|---|---|---|---|---|---|---|---|---|---|
| CLT panel | |||||||||
| Spruce tangential | 713 | 5 × 20 | 393.7 | 1843 | 0.106 | 487.7 | 59.8 | 728.1 | 0.005 |
| MUF adhesive 2 | 713 2 | 4 × 0.25 | 425.0 | 1245 | 0.079 | 36.5 | 0.00 | 72.6 | 590.2 |
| Insulation—PUR | |||||||||
| PUR | 194 | 140 | 37.0 | 1500 | 0.031 | 65.0 | 0.0001 | 0.001 | 945.0 |
| Aluminum facer 3 | - | - | - | - | - | - | - | - | - |
| Insulation—MW | |||||||||
| Mineral wool | 731 | 160 | 67.0 | 840 | 0.035 | 1.0 | 0.1 | 900.0 | 0.00 |
| Insulation—CEL | |||||||||
| Blown-in Cellulose | 580 | 186 | 55.2 | 2544 | 0.048 | 2.05 | 6.3 | 780.0 | 0.56 |
| Wood fiber board | 693 | 22 | 160.8 | 1662 | 0.039 | 3.45 | 17.9 | 550.0 | 0.00 |
| Façade cladding | |||||||||
| Air gap (vertical) | 17 | 40 | 1.3 | 1050 | 0.222 | 0.25 | 0.00 | 1000 | 0.00 |
| Brick | 512 | 100 | 1786.3 | 889 | 0.548 | 18.01 | 13.4 | 319.4 | 0.20 |
| Date and Time | Average MC [%] | Difference in MC [%points] | ||||
|---|---|---|---|---|---|---|
| Layer A | Layer C | Total | Layer A | Middle—Edge of CLT Panel | Avg Layer A—Avg Layer C | |
| 10 May 8:00 | 29.32 | 14.20 | 16.55 | 160.44 | 160.66 | 15.11 |
| 22 November 7:00 | 37.07 | 13.98 | 18.29 | 124.71 | 129.27 | 23.10 |
| Moisture Profile Type | Wood | dMC | Orient | RE | |
|---|---|---|---|---|---|
| a | Baseline | ID713 | 16 | W | 0.5 |
| b | Baseline with increased rain exposure | ID713 | 16 | W | 1.8 |
| c | Baseline with increased delivery MC | ID713 | 40 | W | 0.5 |
| d | Worst case for outer 5 mm 1 | ID713 | 40 | SW | 1.8 |
| e | Worst case for layer A 2 | ID712 | 40 | SW | 1.8 |
| f | Baseline with decreased rain exposure | ID713 | 16 | W | 0.1 |
| g | Worst case for outer 5 mm 1 with lowest rain exposure | ID713 | 40 | SW | 0.1 |
| h | Worst case for layer A 2 with lowest rain exposure | ID712 | 40 | SW | 0.1 |
| i | Best case | ID695 | 12 | E | 0.1 |
| Layer A Outer 5 mm | Layer A Inner 15 mm | Layer B | Layer C | Layer D | Layer E | |
|---|---|---|---|---|---|---|
| a | 106.20 | 23.99 | 18.70 | 17.78 | 17.80 | 19.62 |
| b | 153.21 | 31.33 | 20.43 | 18.34 | 17.97 | 19.72 |
| c | 112.43 | 28.26 | 35.16 | 40.87 | 38.35 | 25.38 |
| d | 143.43 | 38.10 | 37.92 | 40.87 | 38.17 | 25.35 |
| e | 157.08 | 76.66 | 39.80 | 40.31 | 33.84 | 25.51 |
| f | 25.16 | 20.33 | 17.42 | 17.36 | 17.64 | 19.45 |
| g | 28.11 | 24.98 | 32.94 | 40.87 | 37.90 | 25.02 |
| h | 28.76 | 26.61 | 30.02 | 39.98 | 33.50 | 25.23 |
| i | 21.64 | 19.84 | 18.49 | 18.49 | 18.48 | 19.92 |
Disclaimer/Publisher’s Note: The statements, opinions and data contained in all publications are solely those of the individual author(s) and contributor(s) and not of MDPI and/or the editor(s). MDPI and/or the editor(s) disclaim responsibility for any injury to people or property resulting from any ideas, methods, instructions or products referred to in the content. |
© 2025 by the authors. Licensee MDPI, Basel, Switzerland. This article is an open access article distributed under the terms and conditions of the Creative Commons Attribution (CC BY) license (https://creativecommons.org/licenses/by/4.0/).
Share and Cite
Blommaert, A.; Steeman, M.; Van Den Bossche, N. Modeling Moisture Accumulation and Decay Potential in Cross-Laminated Timber Wall Assemblies Exposed During the Construction Phase. Buildings 2025, 15, 1075. https://doi.org/10.3390/buildings15071075
Blommaert A, Steeman M, Van Den Bossche N. Modeling Moisture Accumulation and Decay Potential in Cross-Laminated Timber Wall Assemblies Exposed During the Construction Phase. Buildings. 2025; 15(7):1075. https://doi.org/10.3390/buildings15071075
Chicago/Turabian StyleBlommaert, Anke, Marijke Steeman, and Nathan Van Den Bossche. 2025. "Modeling Moisture Accumulation and Decay Potential in Cross-Laminated Timber Wall Assemblies Exposed During the Construction Phase" Buildings 15, no. 7: 1075. https://doi.org/10.3390/buildings15071075
APA StyleBlommaert, A., Steeman, M., & Van Den Bossche, N. (2025). Modeling Moisture Accumulation and Decay Potential in Cross-Laminated Timber Wall Assemblies Exposed During the Construction Phase. Buildings, 15(7), 1075. https://doi.org/10.3390/buildings15071075