Article

Impact of Moisture Migration on Heat Transfer Performance at Vertical Joints of ‘One-Line’ Sandwich Insulation Composite Exterior Walls

1
College of Hydraulic and Civil Engineering, Xinjiang Agricultural University, Urumqi 830052, China
2
College of Architectural Engineering, Jiaxing University, Jiaxing 314001, China
*
Author to whom correspondence should be addressed.
Buildings 2025, 15(7), 1084; https://doi.org/10.3390/buildings15071084
Submission received: 10 February 2025 / Revised: 22 March 2025 / Accepted: 24 March 2025 / Published: 27 March 2025
(This article belongs to the Section Building Energy, Physics, Environment, and Systems)

Abstract

:
Due to moisture migration effects, thermal and moisture bridges tend to form at building joints, thereby increasing the thermal conductivity coefficient of construction materials. To examine the influence of moisture transfer on the thermal performance of ‘one-line’ vertical joint walls, this study establishes a thermal–humidity coupling numerical model at the vertical joint of sandwich insulation composite walls. This model is employed to analyze the effects of various joint filling materials (aerated blocks, glass wool, concrete), insulation layer thicknesses, and environmental conditions on the thermal transfer properties of the wall joint. The results indicate that when filled with aerated blocks, the joint is most significantly affected by moisture transfer, exhibiting a heat flow loss rate of 8.08%. In high-temperature environments, the thermal transfer performance at the connection of the composite wall is particularly susceptible to humidity, with heat flow loss rates ranging from 6.17% to 8.74%. Furthermore, an increase in the thickness of the insulation layer leads to a reduction in the “heterogeneity” of the sandwich insulation wall, which reduces the wall’s effects to moisture transfer; however, this is accompanied by a rise in the heat loss rate at the connection. After accounting for the effects of hygrothermal bridging, the mean heat transfer corrected coefficient of the wall in areas with hot summers and cold winters ranges from 1.10 to 1.18 during the summer and from 1.12 to 1.16 during the winter. This finding holds significant relevance for aiding researchers in predicting thermal transfer analysis in scenarios involving wall moisture transfer.

1. Introduction

An assembled composite wall system is referred to as a PCW system. The prefabricated composite wall panels of this system are made of a longitudinal and transverse ribbed lattice, with an invisible outer frame as the skeleton, and are poured after filling the interior of the ribbed lattice with aerated concrete or other materials, which is a novel eco-friendly, energy-efficient, and prefabricated monolithic residential structural system that exhibits excellent shock absorption [1]. The system wall piece often adopts a sandwich insulation construction form, which is an integrated wall panel composed of a structural layer, insulation layer, and outer leaf layer, as shown in Figure 1. For assembled concrete buildings, its special construction method involves more connection nodes compared to traditional buildings, and this study points out that these joint nodes between the slabs of the exterior wall panels are the main source of thermal bridges generated in assembled buildings [2].
Studies on wall heat transfer mechanisms reveal that employing expanded polystyrene (EPS), glass wool, and rock wool as thermal insulation materials under optimal thickness conditions achieves lifecycle energy savings ranging from 132.12 to 153 kWh/m2 [3]. Nevertheless, thermal bridging effects in wall assemblies could induce localized enhancement of heat transfer coefficients, resulting in non-negligible influences on the holistic energy performance of building envelopes. For prefabricated buildings, Gocer Caner’s research found that the adverse thermal bridge effect brought about by the gaps in load-bearing components accounts for about 30% of the heating energy consumption in the entire lifecycle of the building [4]. Ge Hua found that after thermal insulation treatment of balcony nodes, the overall U-value of the enclosure structure increased by 9–18%, and heating energy consumption decreased by 5–13% [5]. Zedan’s research found that as the percentage of mortar joint area to building area increases, the proportion of energy consumption through mortar joints in the total building energy consumption also increases [6]. Deque’s research found that the correction rate of building energy consumption caused by thermal bridge effects increased by 5% [7]. For related heat transfer calculations, in order to enhance the accuracy of the calculation results, some scholars have compared and evaluated different calculation methods [8,9,10]. China’s “Thermal Design Code for Civil Buildings” GB50176-2016 and foreign thermal bridge calculation code ISO 10211 both give complete calculation methods for linear heat transfer coefficients to correct heat transfer through thermal bridges [11,12].
However, all of the above studies only consider heat transfer. As a region where moisture accumulation is relatively serious, moisture accumulation significantly impacts the heat transfer performance of thermal bridges. Ignoring the influence of moisture transfer when studying heat transfer at building nodes will lead to discrepancies between the results and the actual situation. As typical porous media, there are many studies on building materials showing that their thermal conductivity has a strong correlation with moisture content. Zoltan et al. found that at the same temperature of 24 °C, as the material moisture content increases, the thermal conductivity of natural fiber insulation materials rises faster compared to foam materials [13]; Jin et al. found that when the mass moisture content increases to 100%, the thermal conductivity of aerated concrete increases four times [14]. Therefore, the setting of thermal conductivity is very important in the research of coupled heat and moisture transfer. Most of the current studies on coupled heat and moisture transfer are based on one-dimensional flat walls. Qin et al. proposed a one-dimensional dynamic model to simulate the coupled heat and moisture migration of multilayer porous building materials [15]; Li investigated the influence of moisture transfer on the thermal transfer characteristics of walls through the HAM model and found that the overall heat transfer after taking into account the moisture transfer is 7.5% more in comparison to that when heat transfer is solely applied [16]. AD T Le studied the thermal performance of concrete walls and found that considering heat and moisture transfer had a significant effect on the prediction of energy consumption in buildings [17]. However, the above studies can only reflect one-way heat and moisture transfer, rendering them inappropriate for application in the study of building joints. Based on this, prior investigations have examined coupled heat and moisture transfer phenomena across thermal bridges within joints by establishing two-dimensional and three-dimensional models. Maliki [18] and Zhao et al. [19] studied the heat and moisture performance at the thermal bridge of wall corners and found that after considering moisture transfer, the thermal effect at the thermal bridge is amplified. Wang et al. [20,21] carried out three-dimensional analysis on this basis and studied the influence of moisture transfer at different types of wall corners on the internal surface thermal state and heat loss. At the same time, a new evaluation index for the thermal bridge effect was introduced [22]. It was found that enlarging the dimensions of structural columns and the height of beams can result in a correction factor of 55–77% and 59–63% for the overall thermal transmittance of joints when considering moisture transfer. Li et al. [23] studied the effect of the location and thickness of the insulation layer on the thermal and humidity performance of multilayer walls by establishing a coupled heat and humidity transfer model. The results show that the intermediate insulation wall has a more stable moisture distribution in summer and winter. Wang et al. [24] developed an assembled heterogeneous composite soil sandwich wall and used the finite element method and ANSYS software to simulate the composite soil sandwich wall. Combined with the results of the self-developed controllable heat–wet coupling test rig, the advantages of the composite soil sandwich wall were shown. However, in current research, few studies have been conducted on the heat and moisture characteristics at the joints of prefabricated walls. Based on this, this paper investigates a sandwich insulation composite exterior wall panel. We conduct three-dimensional analysis on the heat and moisture transfer at the ‘one-line’ splicing joints of its wet connection. The research focuses on the influence of moisture transfer on the thermal state of the inner surface and heat loss at the splicing joints using different filler materials, different environmental conditions, and different thicknesses of the insulation layer. On this basis, the heat transfer coefficient of the wall in hot summer and cold winter areas is corrected.

2. Model Description of Thermal–Humidity Coupling Transfer

2.1. Mathematical Model

Considering the impact of latent heat, Wang et al. established a three-dimensional heat and moisture balance equation based on Luikov’s theory and Kunzel’s theory to analyze the thermal and moisture characteristics of the roof–wall corner structure. This paper adopts the three-dimensional equation established by Wang et al. and, after further verifying the model’s accuracy, examines the heat and moisture coupling characteristics at the ‘one-line’ joint of the sandwich insulation composite wall.
Among them, the moisture transfer equation in Wang’s [21] formula is expressed as follows:
ξ φ t = ( δ v P s a t + K l ρ l R v T k φ ) φ + ( δ v φ d P s a t d T + K l ρ l R v ln ( φ ) ) T
In the formula, ξ is the slope of the moisture absorption equilibrium curve of the porous material, and φ is the relative humidity; δ v is the water vapor permeability coefficient, with a unit of kg/(m·s·Pa); P s a t is the saturated water vapor pressure, with a unit of Pa; K l is the liquid water permeability, with a unit of s; ρ l is the density of liquid water, with a value of 1000 kg/m3; R v is the water vapor gas constant, with a value of 461 J/(kg·K); and T k is the thermodynamic temperature, with a unit of K.
The heat transfer equation is expressed as follows:
( c 0 ρ 0 + ω c p , l ) T t = ( q c o n d + h l v j v ) = ( λ T h l v δ v P v ) = h l v δ v P s a t ϕ + ( λ + h l v δ v ϕ d P s a t d T ) T
Among them, c 0 is the specific heat capacity of the material, with a unit of J/(kg·K); ρ 0 is the density of the material, with a unit of kg/m3; ω is the moisture content of the material (in the form of water vapor and liquid water), with a unit of kg/m3; c p , l is the specific heat capacity of liquid water, with a value of 4200 J/(kg·K); q c o n d is the heat conduction flux, with a unit of W/m2; λ is the thermal conductivity of the material, with a unit of W/(m·K); h l v is the latent heat of vaporization of water vapor, with a unit of J/kg, and expressed as h l v = ( 2500 2.4 T ) × 10 3 .
For the boundary conditions selected in this paper, the contact surface between the sandwich insulated composite wall and the interior is set as the indoor boundary, and the contact surface with the exterior is set as the outdoor boundary. The four sides of the wall are set as adiabatic and moisture-proof surfaces. Among them, the heat and moisture flux through the inner surface is calculated as follows:
j n , i = h m i ( ρ v , s u r f i ρ v , i ) q n , i = h c i ( T s u r f i T i ) + h l v h m i ( ρ v , s u r f i ρ v , i )
where h m i is the mass transfer coefficient of the inner surface; ρ v , s u r f i is the water vapor density of the inner surface, with a unit of kg/m3; ρ v , i is the water vapor density of indoor air; h c i is the convective heat transfer coefficient of the inner surface, with a value of 8.7 W/(m2·K); T s u r f i is the temperature of the inner surface, with a unit of K; and T i is the indoor temperature, with a unit of K.
The heat and moisture flux on the outer surface of the wall is calculated as follows:
j n , e = h m e ( ρ v , s u r f e ρ v , e ) q n , e = h c e ( T s u r f e T e ) + h l v h m e ( ρ v , s u r f e ρ v , e )
where h m e is the mass transfer coefficient of the outer surface; ρ v , s u r f e is the water vapor density of the outer surface in kg/m3; ρ v , e is the water vapor density of outdoor air; h c e is the convective heat transfer coefficient of the outer surface, with a value of 23 W/(m2·K); T s u r f e is the temperature of the outer surface in K; and T e is the outdoor temperature in K.

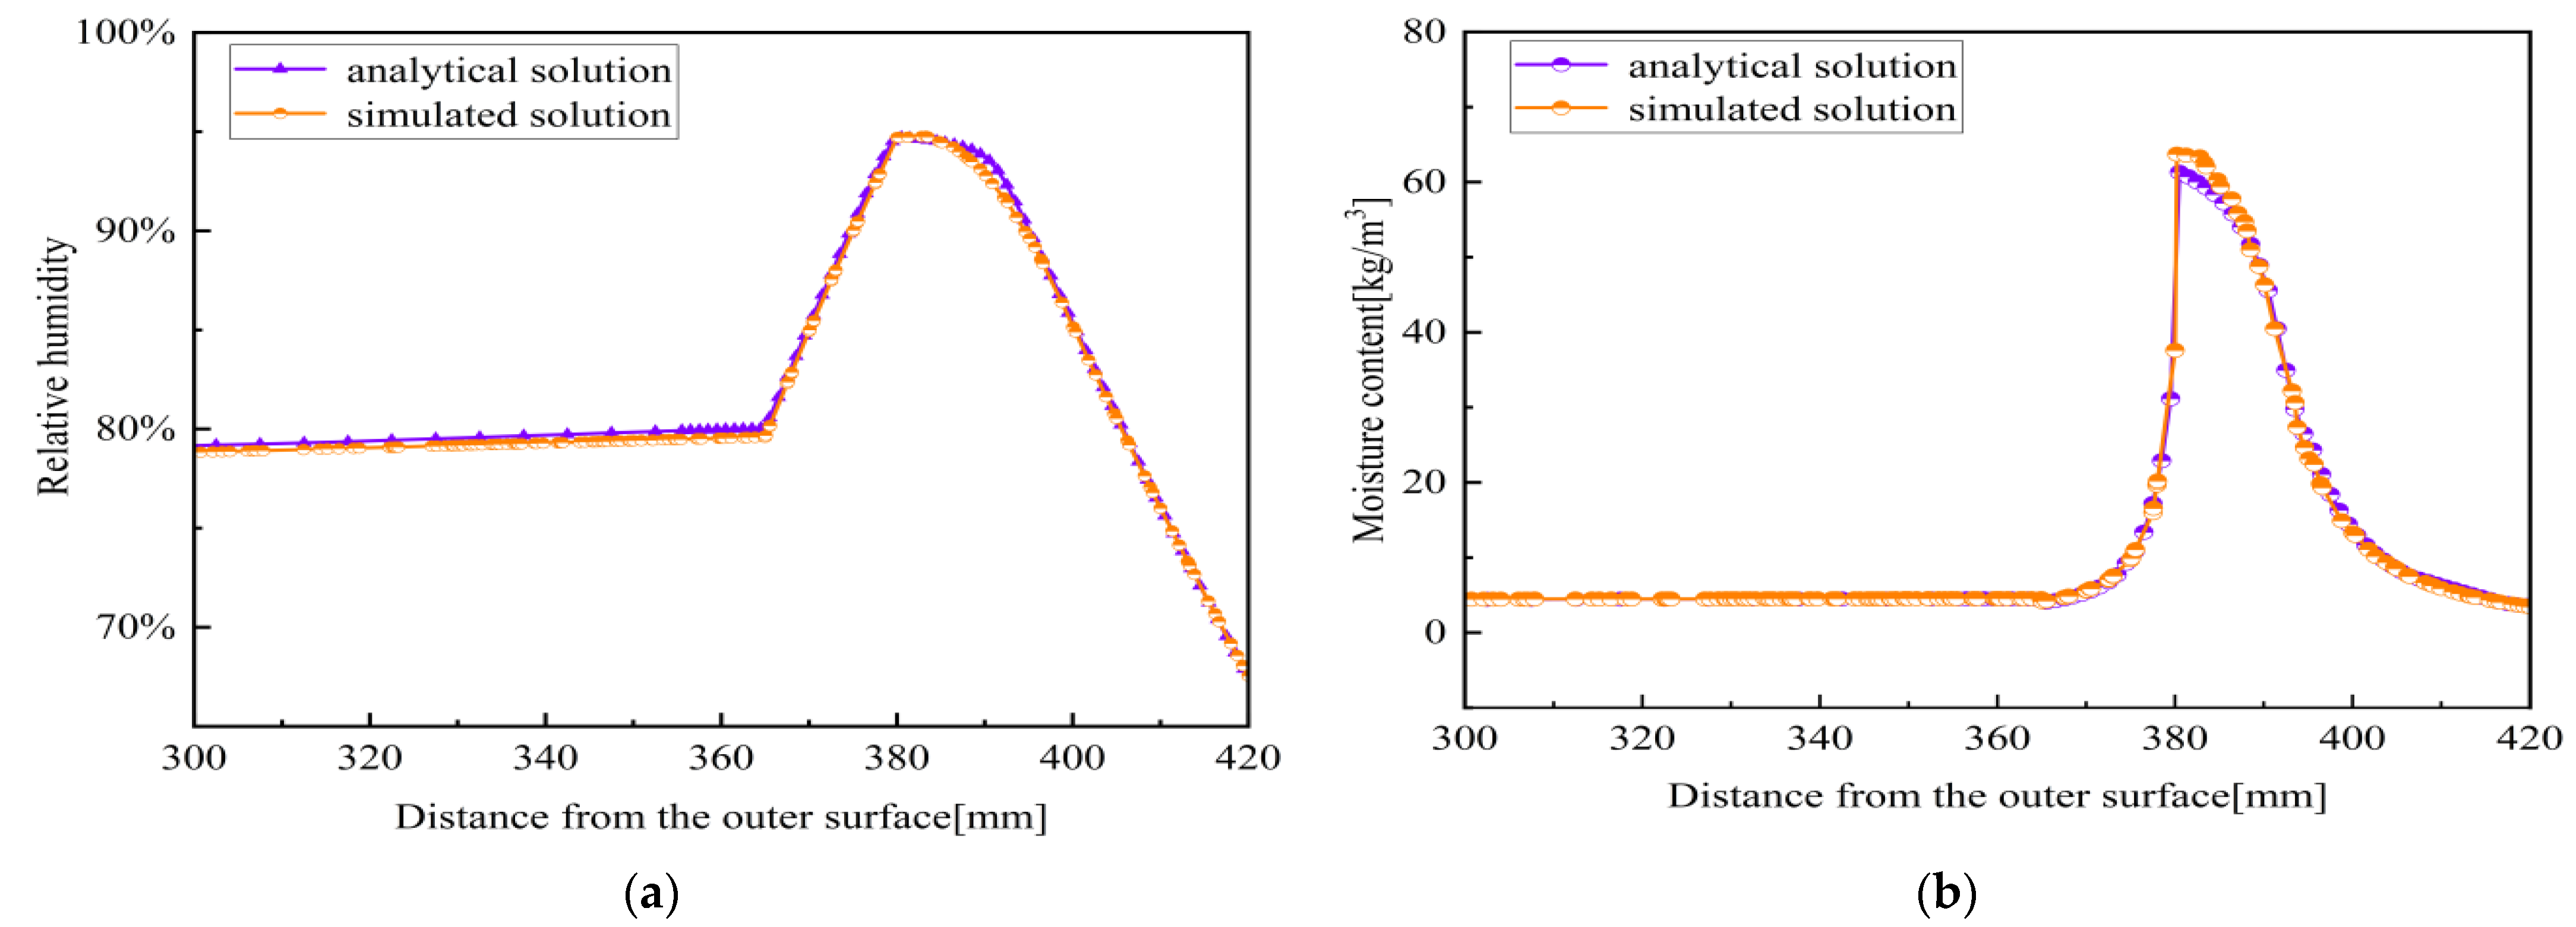
2.2. Model Verification
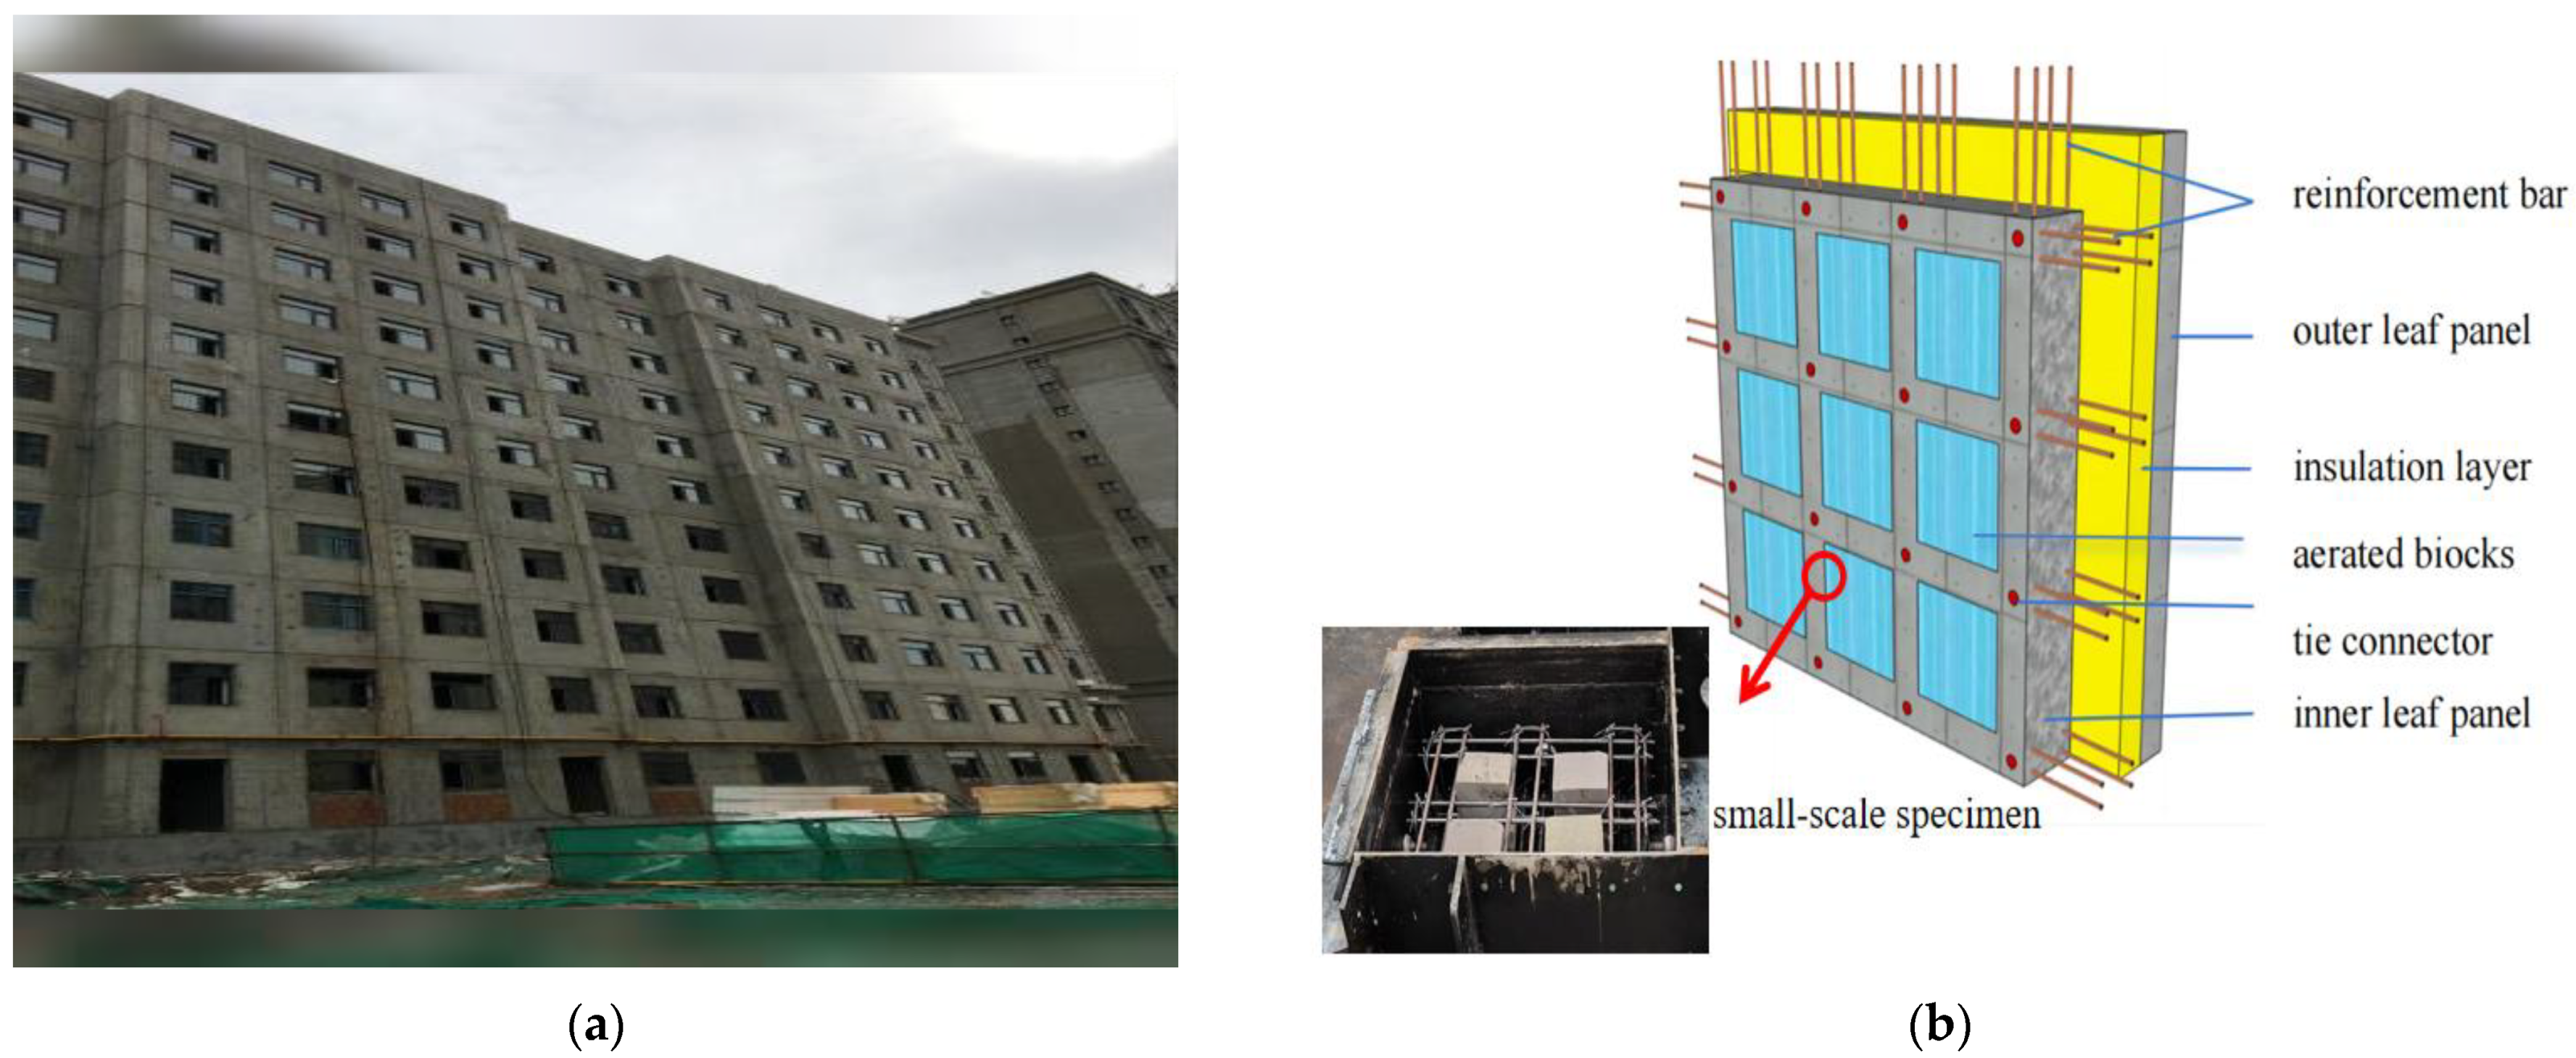
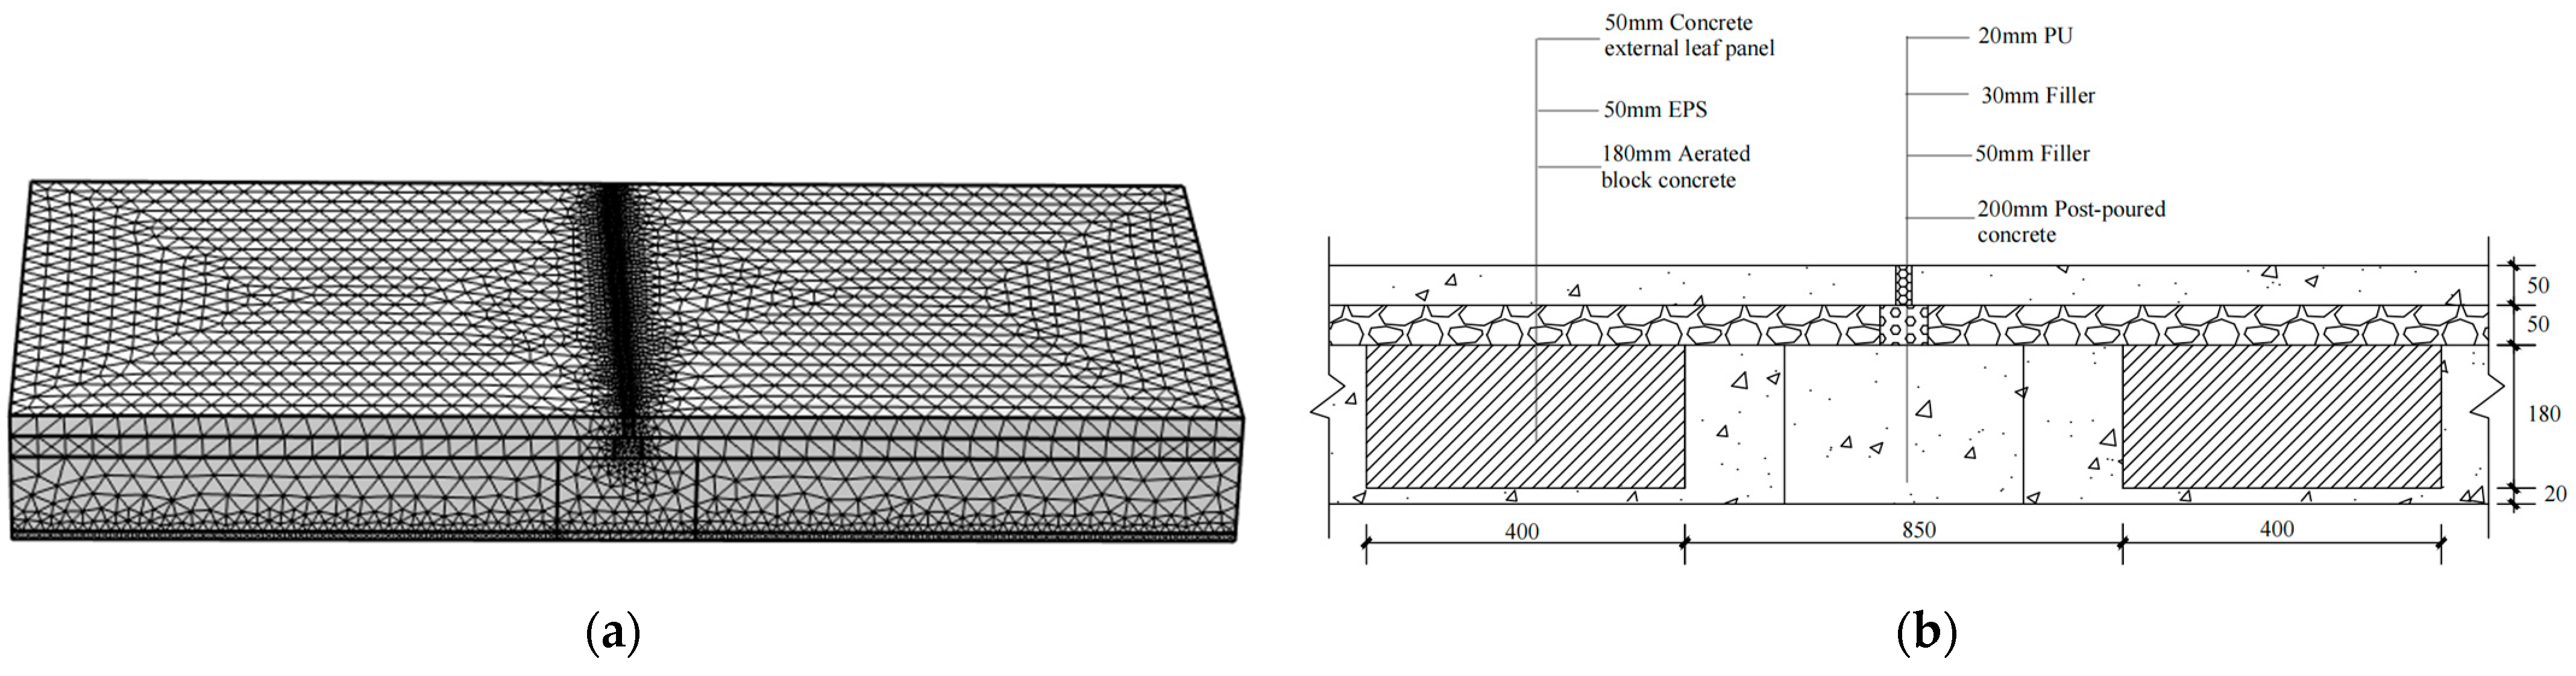
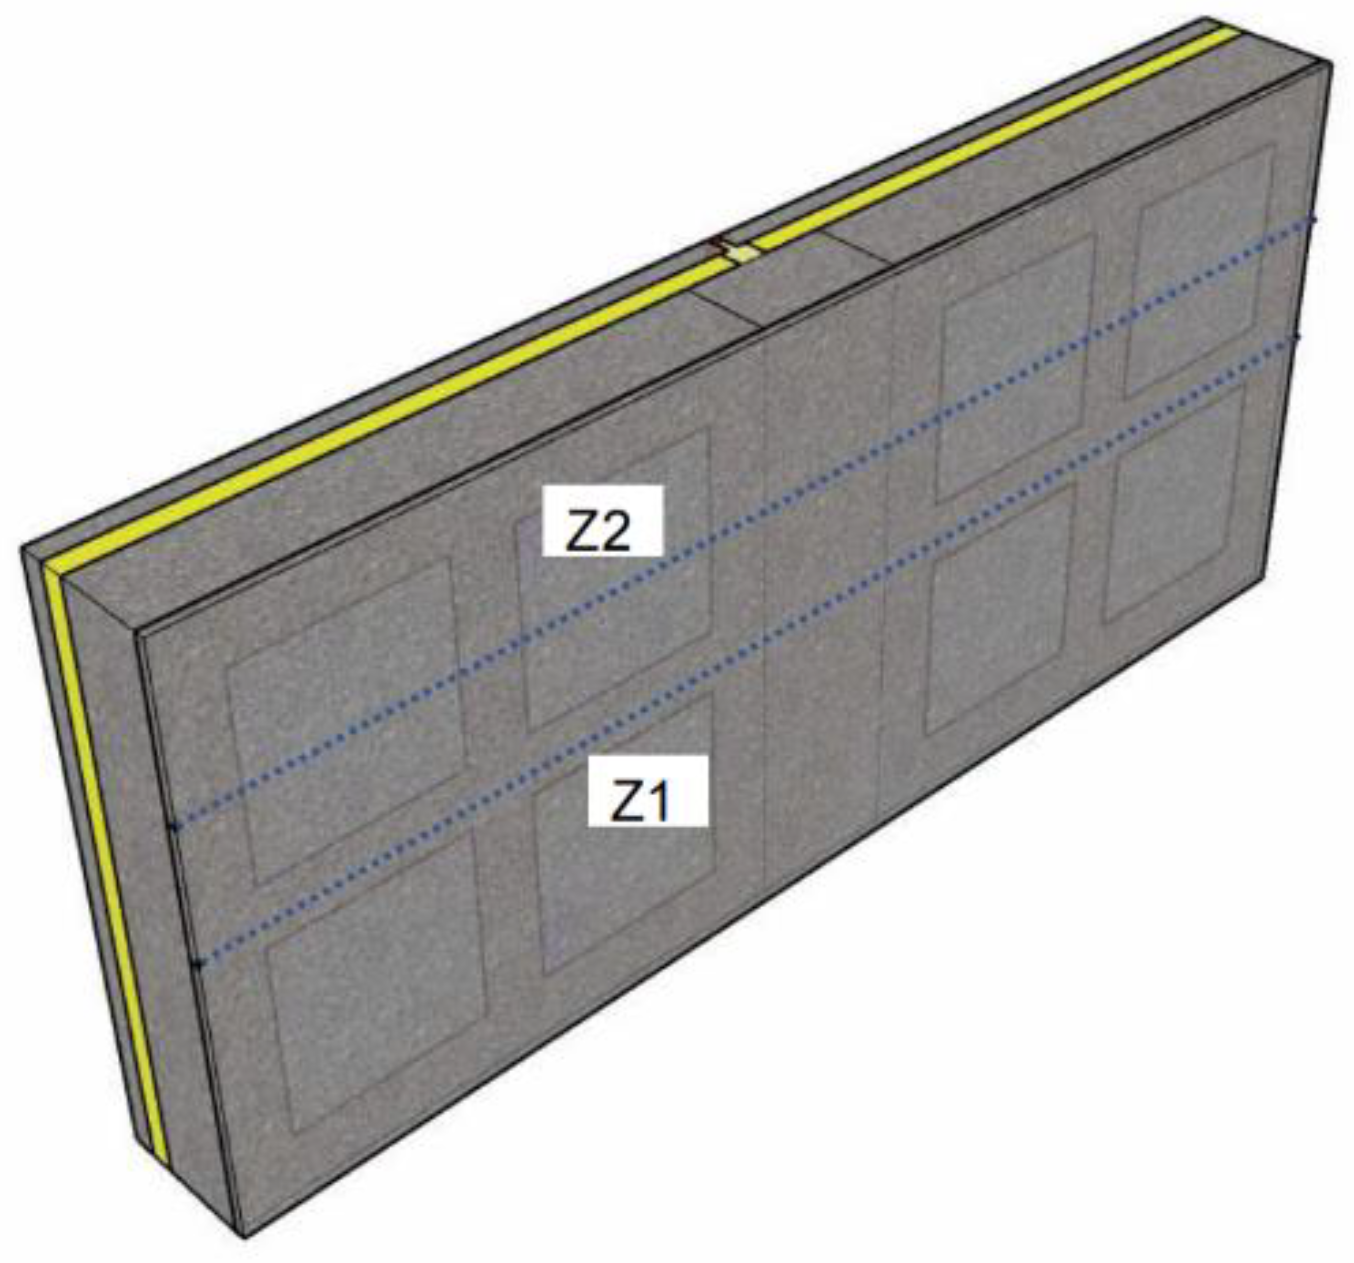
The accuracy of the model used in this paper was verified using a validation example5 from the benchmark test HAMSTAD. The example analyzes the wet changes within a three-layer composite wall. Based on this example, the mathematical model presented in this paper is validated. The wall structure depicted in Example 5 is illustrated in Figure 2. Detailed descriptions of the material parameters can be found in Reference [25]. The indoor and outdoor temperatures are 20 °C and 0 °C, respectively, while the relative humidities are 60% and 80%, respectively. The convective heat transfer coefficients are 8 W/(m2·K) and 25 W/(m2·K), while the convective mass transfer coefficients are 5.8823 × 10⁻⁸ W/(m2·K) and 1.8382 × 10⁻⁷ W/(m2·K). The initial temperature of the wall is set at 25 °C, and the humidity level is 60%. The total duration of the simulation is 60 days.
Figure 3 illustrates the model results alongside those of Example 5. The absolute error range for moisture content is −3.37 to 1.70, while the relative error range is −6.5% to 7.12%. The absolute error range for relative humidity is −0.15% to 1.01%, while the relative error range is −0.16% to 1.09%. The results of both analyses are comparable, indicating that the mathematical model employed in this paper is reasonable.

2.3. Physical Model

The ‘one-line’ joint structure of the wall selected in this study is illustrated in Figure 4. The dimensions of the sandwich composite exterior wall are 2650 mm × 1175 mm × 300 mm. The wall thickness is 300 mm, the insulation layer thickness is 50 mm, and the joint width is 20 mm. Table 1 presents the material parameters of the wall. Among them, the moisture equilibrium state of porous materials can be described by the isothermal moisture absorption and discharge equilibrium curve, which is drawn according to the equilibrium moisture content measured by different air relative humidities under isothermal conditions, reflecting the moisture content of the material in the equilibrium state. The calculation expression of the isothermal moisture absorption and discharge equilibrium curve is closely related to the relative humidity. The BET equation, which is more commonly used in the literature, is expressed in the following:
u = a 1 φ ( 1 + a 2 φ ) ( 1 a 3 φ )

3. The Effect of Moisture Transfer on the Thermal Efficiency of Joints in ‘One-Line’ Sandwich Insulation Composite Walls

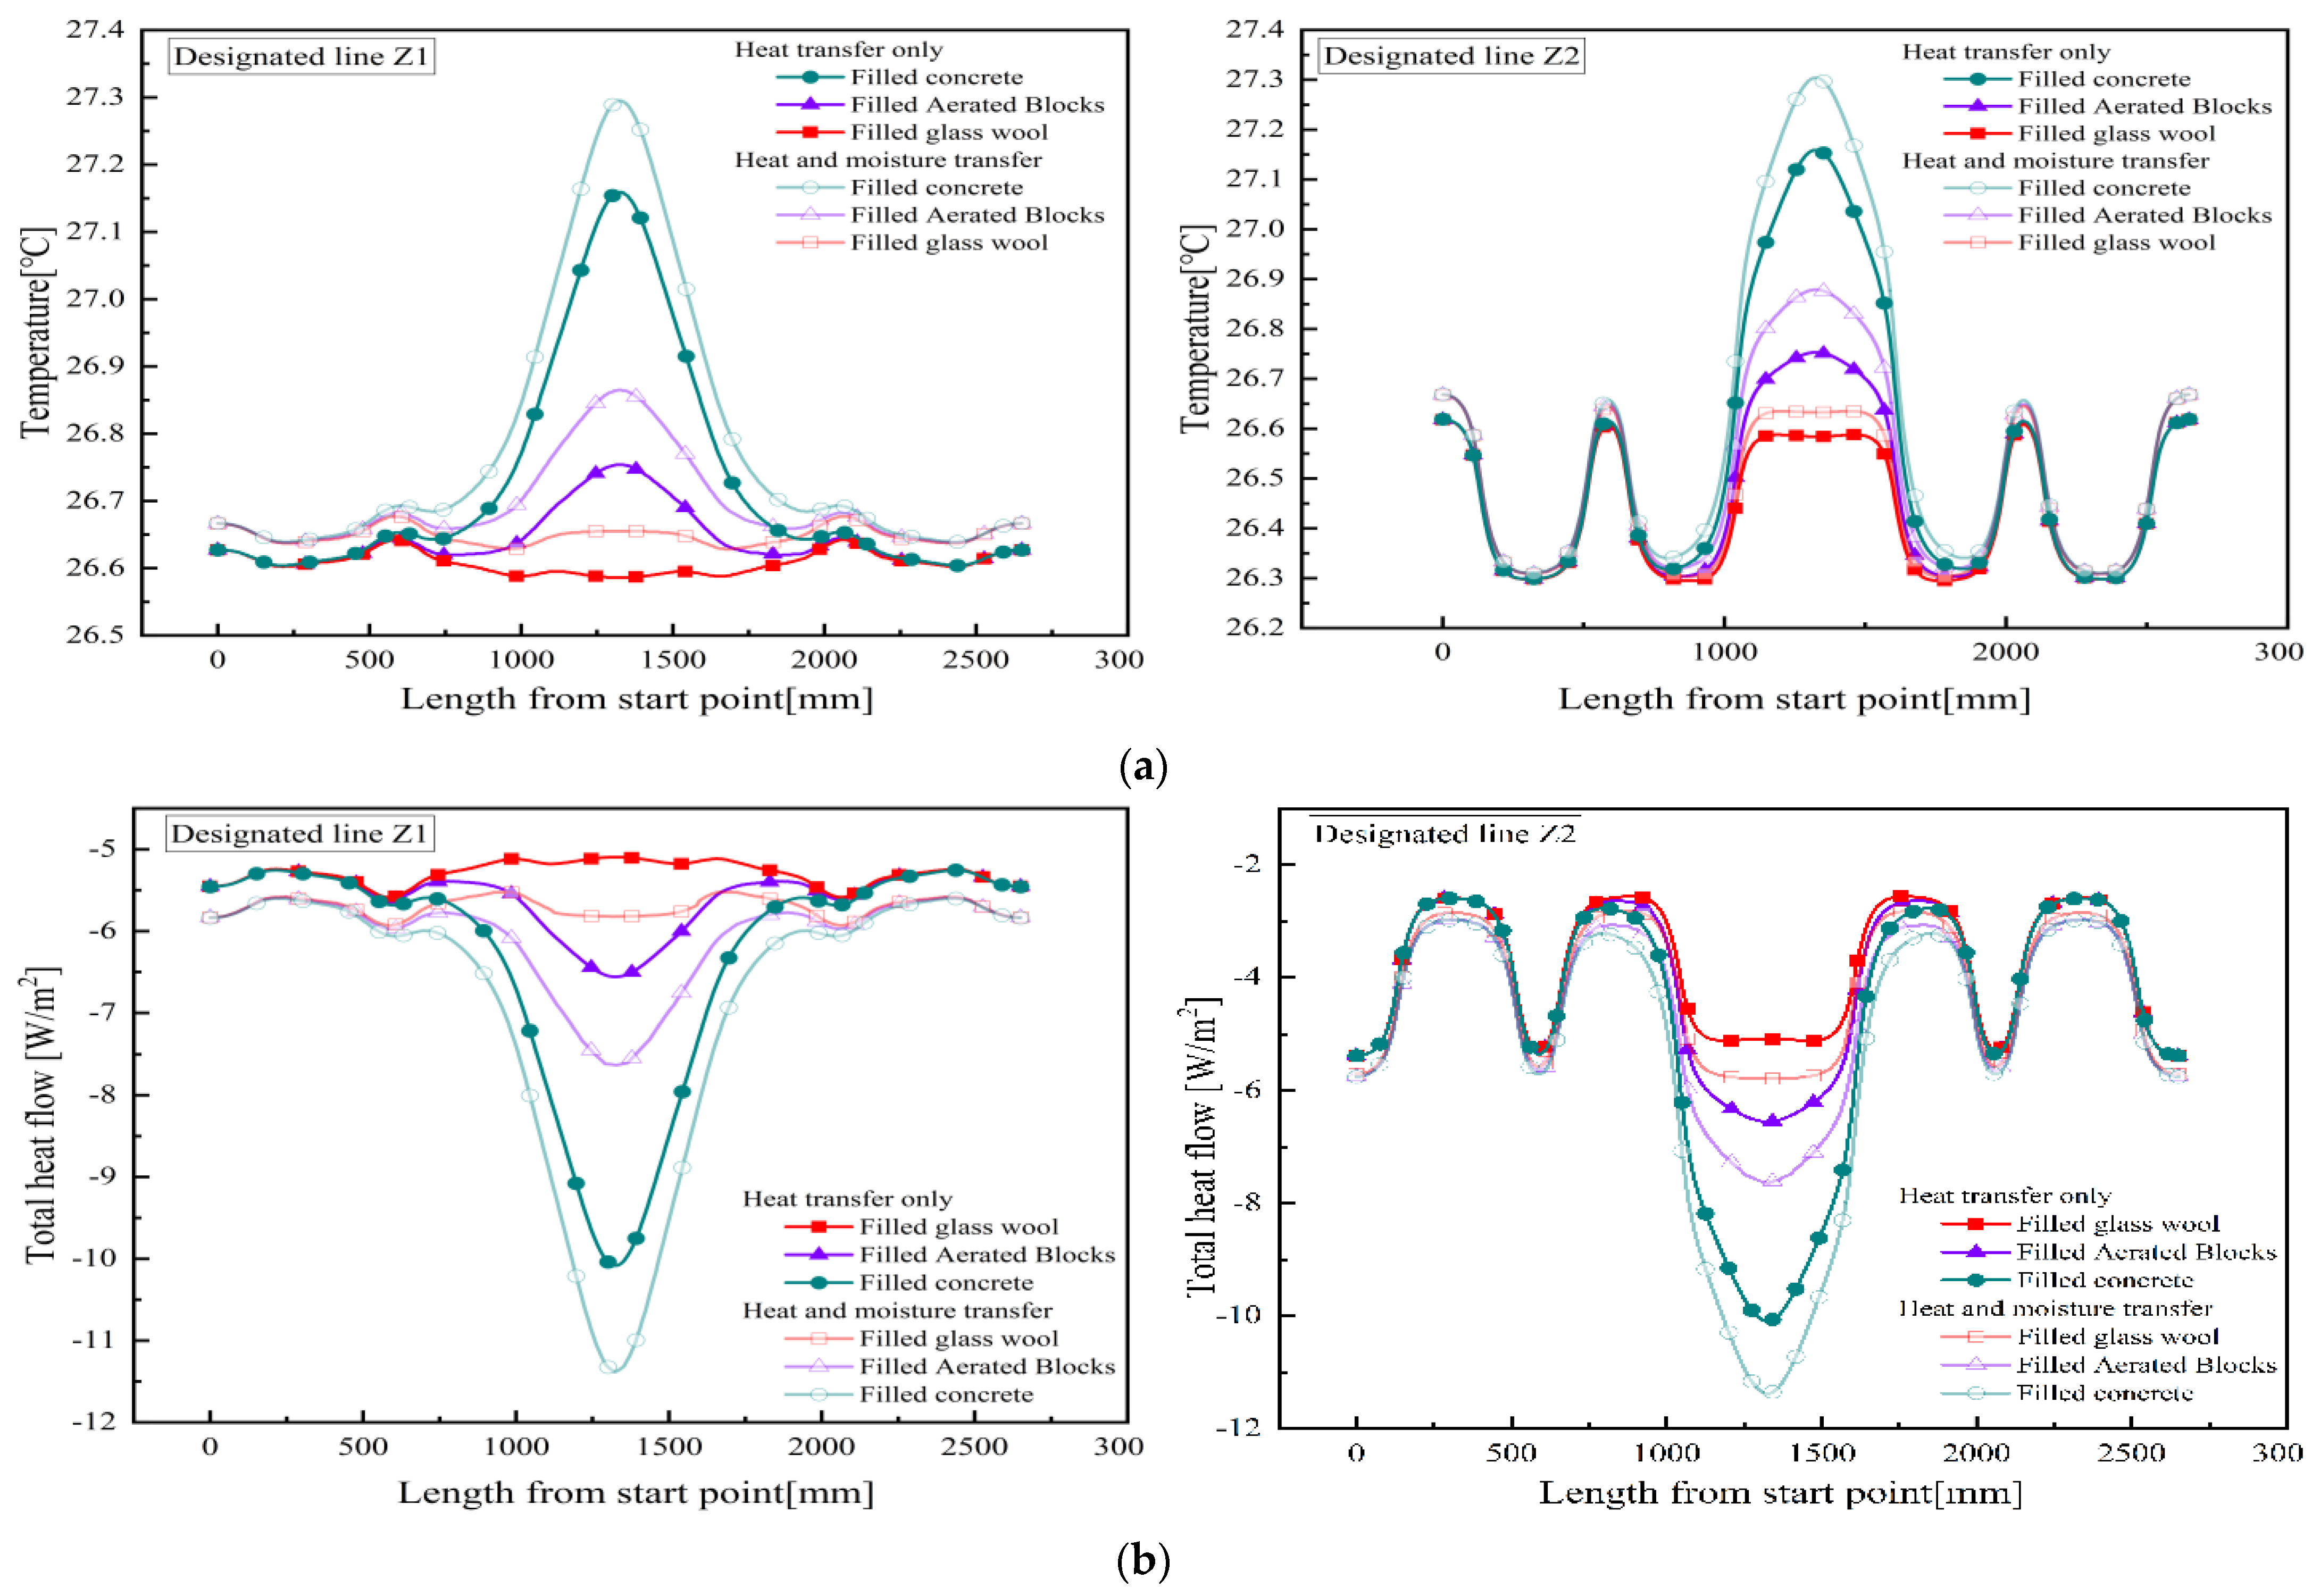
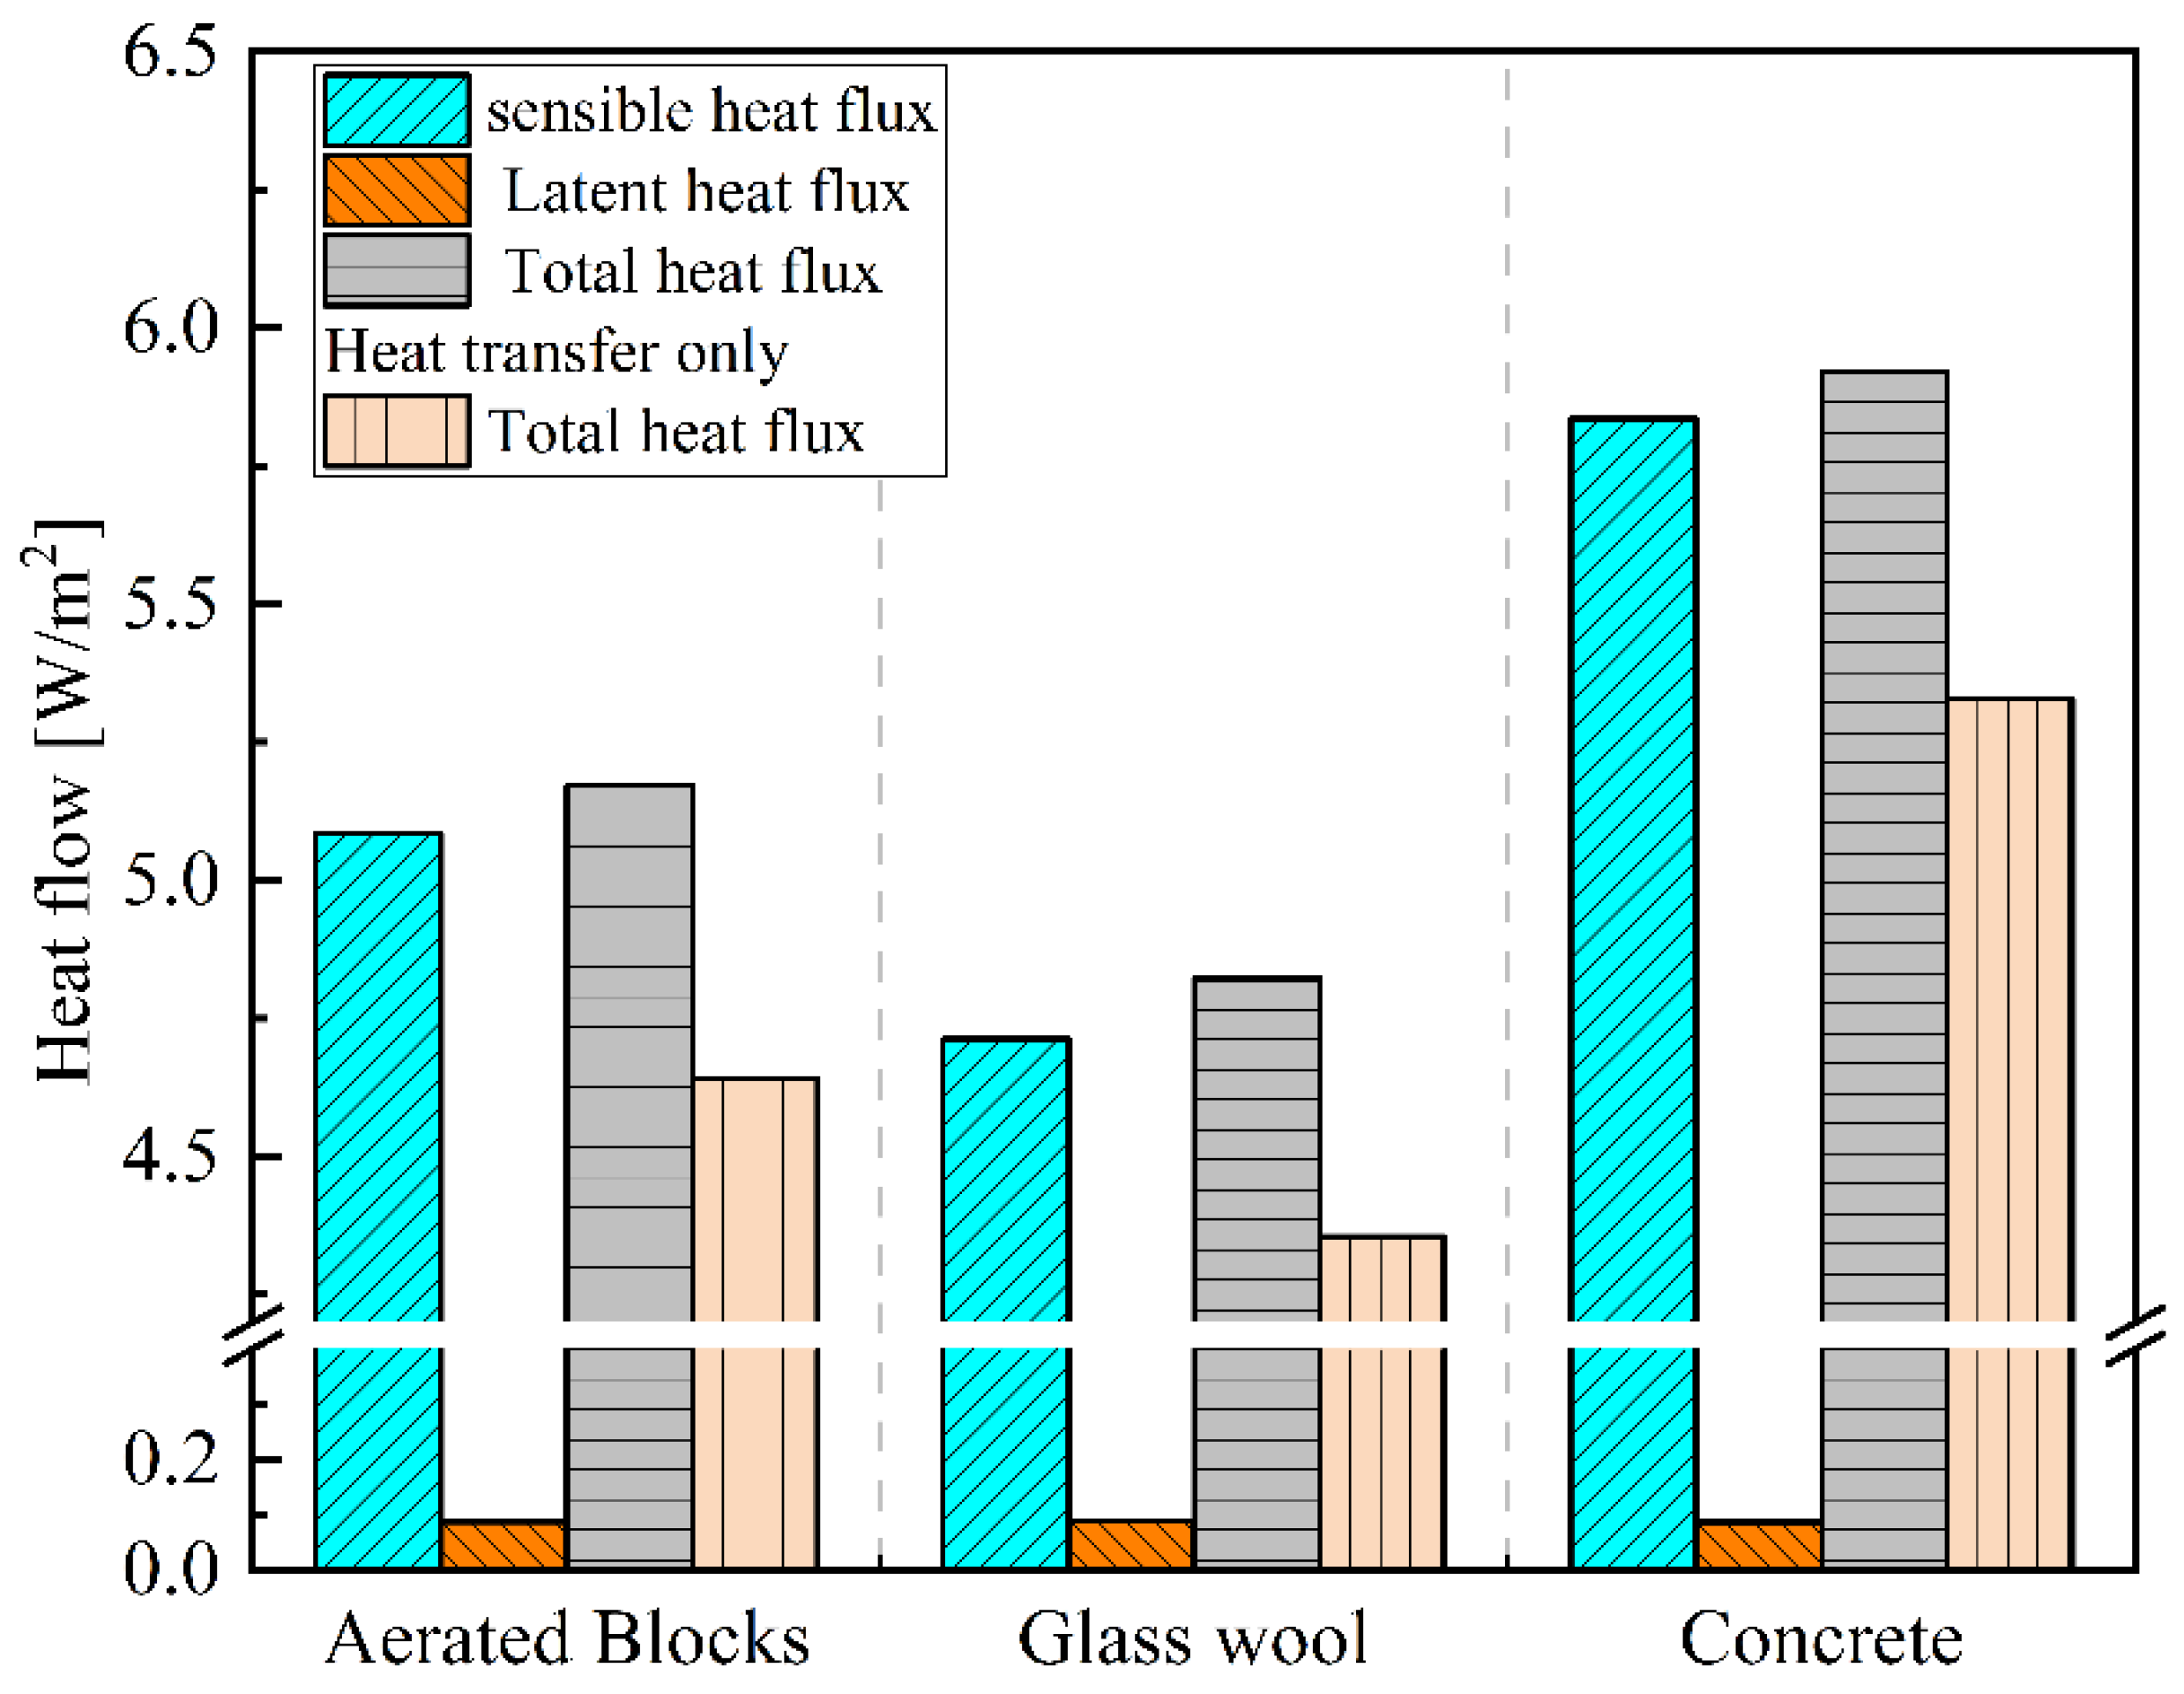
3.1. Effect of Wall Thermal Performance Using Different Fillers in Joints

To weaken the thermal bridge effect at the joint and achieve better insulation, material filling is typically applied at the joint of the prefabricated wall, with sealant used for the outer panel. This section focuses on walls with joint filling materials including concrete, aerated concrete, and glass wool for analysis. Concrete is chosen as the joint filling material because, in engineering practice, unfilled joints allow post-poured concrete to infiltrate this area.
During the simulation of heat transfer in the wall, two different working conditions were established. One working condition only simulated heat transfer, with the indoor and outdoor temperatures being 26 °C and 35 °C, respectively. The other working condition simulated heat and moisture transfer within the wall, with the indoor and outdoor heat–moisture conditions being 26 °C with 60% relative humidity and 35 °C with 90% relative humidity, respectively. We compared thermal parameters, such as the temperature on the inner surface of the wall filled with various materials at the joint, under both working conditions and analyzed the impact of moisture transfer on the thermal performance of the wall filled with different materials at the joint.
The temperatures of the wall sections with three different joint filling materials are presented in Figure 5.
Given the unique structural form of the sandwich insulation composite wall, we selected Z1 = 587.5 mm and Z2 = 912.5 mm along the inner height of the wall to draw the designated line, as illustrated in Figure 6. Specifically, Z1 is positioned at the rib grid of the multi-ribbed composite wall, while Z2 is situated at the midpoint of the wall block filling within the sandwich insulation composite wall.
Figure 7 illustrates the temperature and heat flux at Z1 and Z2 along the inner surface of the wall, considering various materials filled in the joints under different working conditions.
It is evident that, in the planar section of the sandwich insulation composite wall, the temperature and heat flux density curves for the designated lines Z1 and Z2 along the inner surface exhibit fluctuations. This phenomenon is attributed to the aerated blocks embedded within the inner leaf plate of the wall. In the joint region of the wall, when the insulation layer is filled with concrete, the variations in temperature and heat flux density at the joint are the most pronounced, followed by those with aerated blocks. When filled with glass wool, the temperature and heat flux density at the joint resemble those at the rib grid of the wall plane. At this point, the joint region is more favorable for insulation. This can be attributed to the limited ability of aerated blocks and glass wool to conduct heat; their thermal resistance is greater than that of concrete, making it difficult for heat flow to escape. In comparison to the other two materials, concrete exhibits the greatest disparity in thermal conductivity relative to that of the insulation layer material. When concrete is used to fill the joint, the thermal resistance at this joint is the lowest compared to the main section of the multi-ribbed wall. At this point, the joint is less favorable for insulation.
Compared to heat transfer alone, the case involving both heat and moisture transfer results in increases in both the temperature and heat flux density along the designated line. When the filling materials at the joints consist of aerated blocks, glass wool, and concrete, the average heat flux density along designated line Z1 increases by 8.95%, 7.35%, and 8.85%, respectively; the average heat flux density along designated line Z2 increases by 13.07%, 11.62%, and 12.45%, respectively. Notably, it becomes apparent that, irrespective of whether moisture migration is accounted for, the heat flux through the joint filled with concrete is significantly higher than that of aerated blocks and glass wool. After accounting for moisture transfer, the average heat flux along the designated line filled with aerated blocks at the joint increases more significantly compared to heat transfer alone. This occurs because aerated blocks possess strong moisture absorption capabilities, and their thermal conductivity varies more significantly with increasing humidity.
Given the differences in the thermal state and heat transfer rate density curves of designated lines Z1 and Z2, the average heat flow across the inner surface of the sandwich insulation composite wall has been computed and is shown in Figure 8.
It is observed that for the sandwich composite insulation wall, the latent heat flux under the three joint filling materials is minimal, approximately 0.1 W/m2. When comparing the total heat flux for joints filled with aerated blocks, glass wool, and concrete under heat transfer conditions, the values are 4.64 W/m2, 4.35 W/m2, and 5.33 W/m2, respectively. In the context of heat and moisture movement, the passing heat flux is 5.17 W/m2, 4.78 W/m2, and 5.92 W/m2. In comparison to heat transfer alone, the overall heat flow across the wall’s inner surface rises by 11.41%, 9.89%, and 11.14%, respectively.
To better comprehend the effects of the thermal bridge generated by the ‘one-line’ joint of the sandwich insulation composite wall under heat and moisture transfer conditions, this paper analyzes the rate of heat loss through flow at the joint, which serves as an assessment metric for the impact of the thermal bridge. Equations (6) and (7) present the calculation equations for this index.
Heat   flow   loss :             Δ Q = Q Z i = 1 N i U i A i Δ T
Heat   flow   loss   rate :                     β = Δ Q Q Z × 100
where Q Z represents the total heat flow at the inner surface (W); U i is the heat transfer coefficient of the wall (W/(m2·K)); A i is the wall area (m2); and ΔT is the temperature difference between indoors and outdoors (K).
Table 2 presents the heat loss generated at the ‘one-line’ joint when aerated blocks, glass wool, and concrete are used as filling materials in the joints of the sandwich insulation composite wall.
It is evident that when concrete is used as a filling material at the joint, the heat loss rate associated with the thermal bridge is the highest. This happens due to concrete’s thermal conductivity being higher than that of aerated blocks and glass wool, resulting in a reduction in the average thermal resistance at the thermal bridge, an elevation in the heat transfer coefficient, and a more significant concentration of heat along with a more noticeable thermal bridge effect. When moisture transfer is disregarded, using glass wool as a filling material at the joint can effectively mitigate the thermal bridge effect. At this point, no heat flow loss occurs at the joint. After accounting for heat and moisture transfer, the heat flow loss rates for joints filled with glass wool, aerated blocks, and concrete all increase. This occurs because the thermal conductivity of materials is dependent on humidity. The presence of moisture results in an increase in thermal conductivity. Simultaneously, when water vapor escapes from the wall, heat is lost along with the vapor, leading to an increase in the passing heat flow.

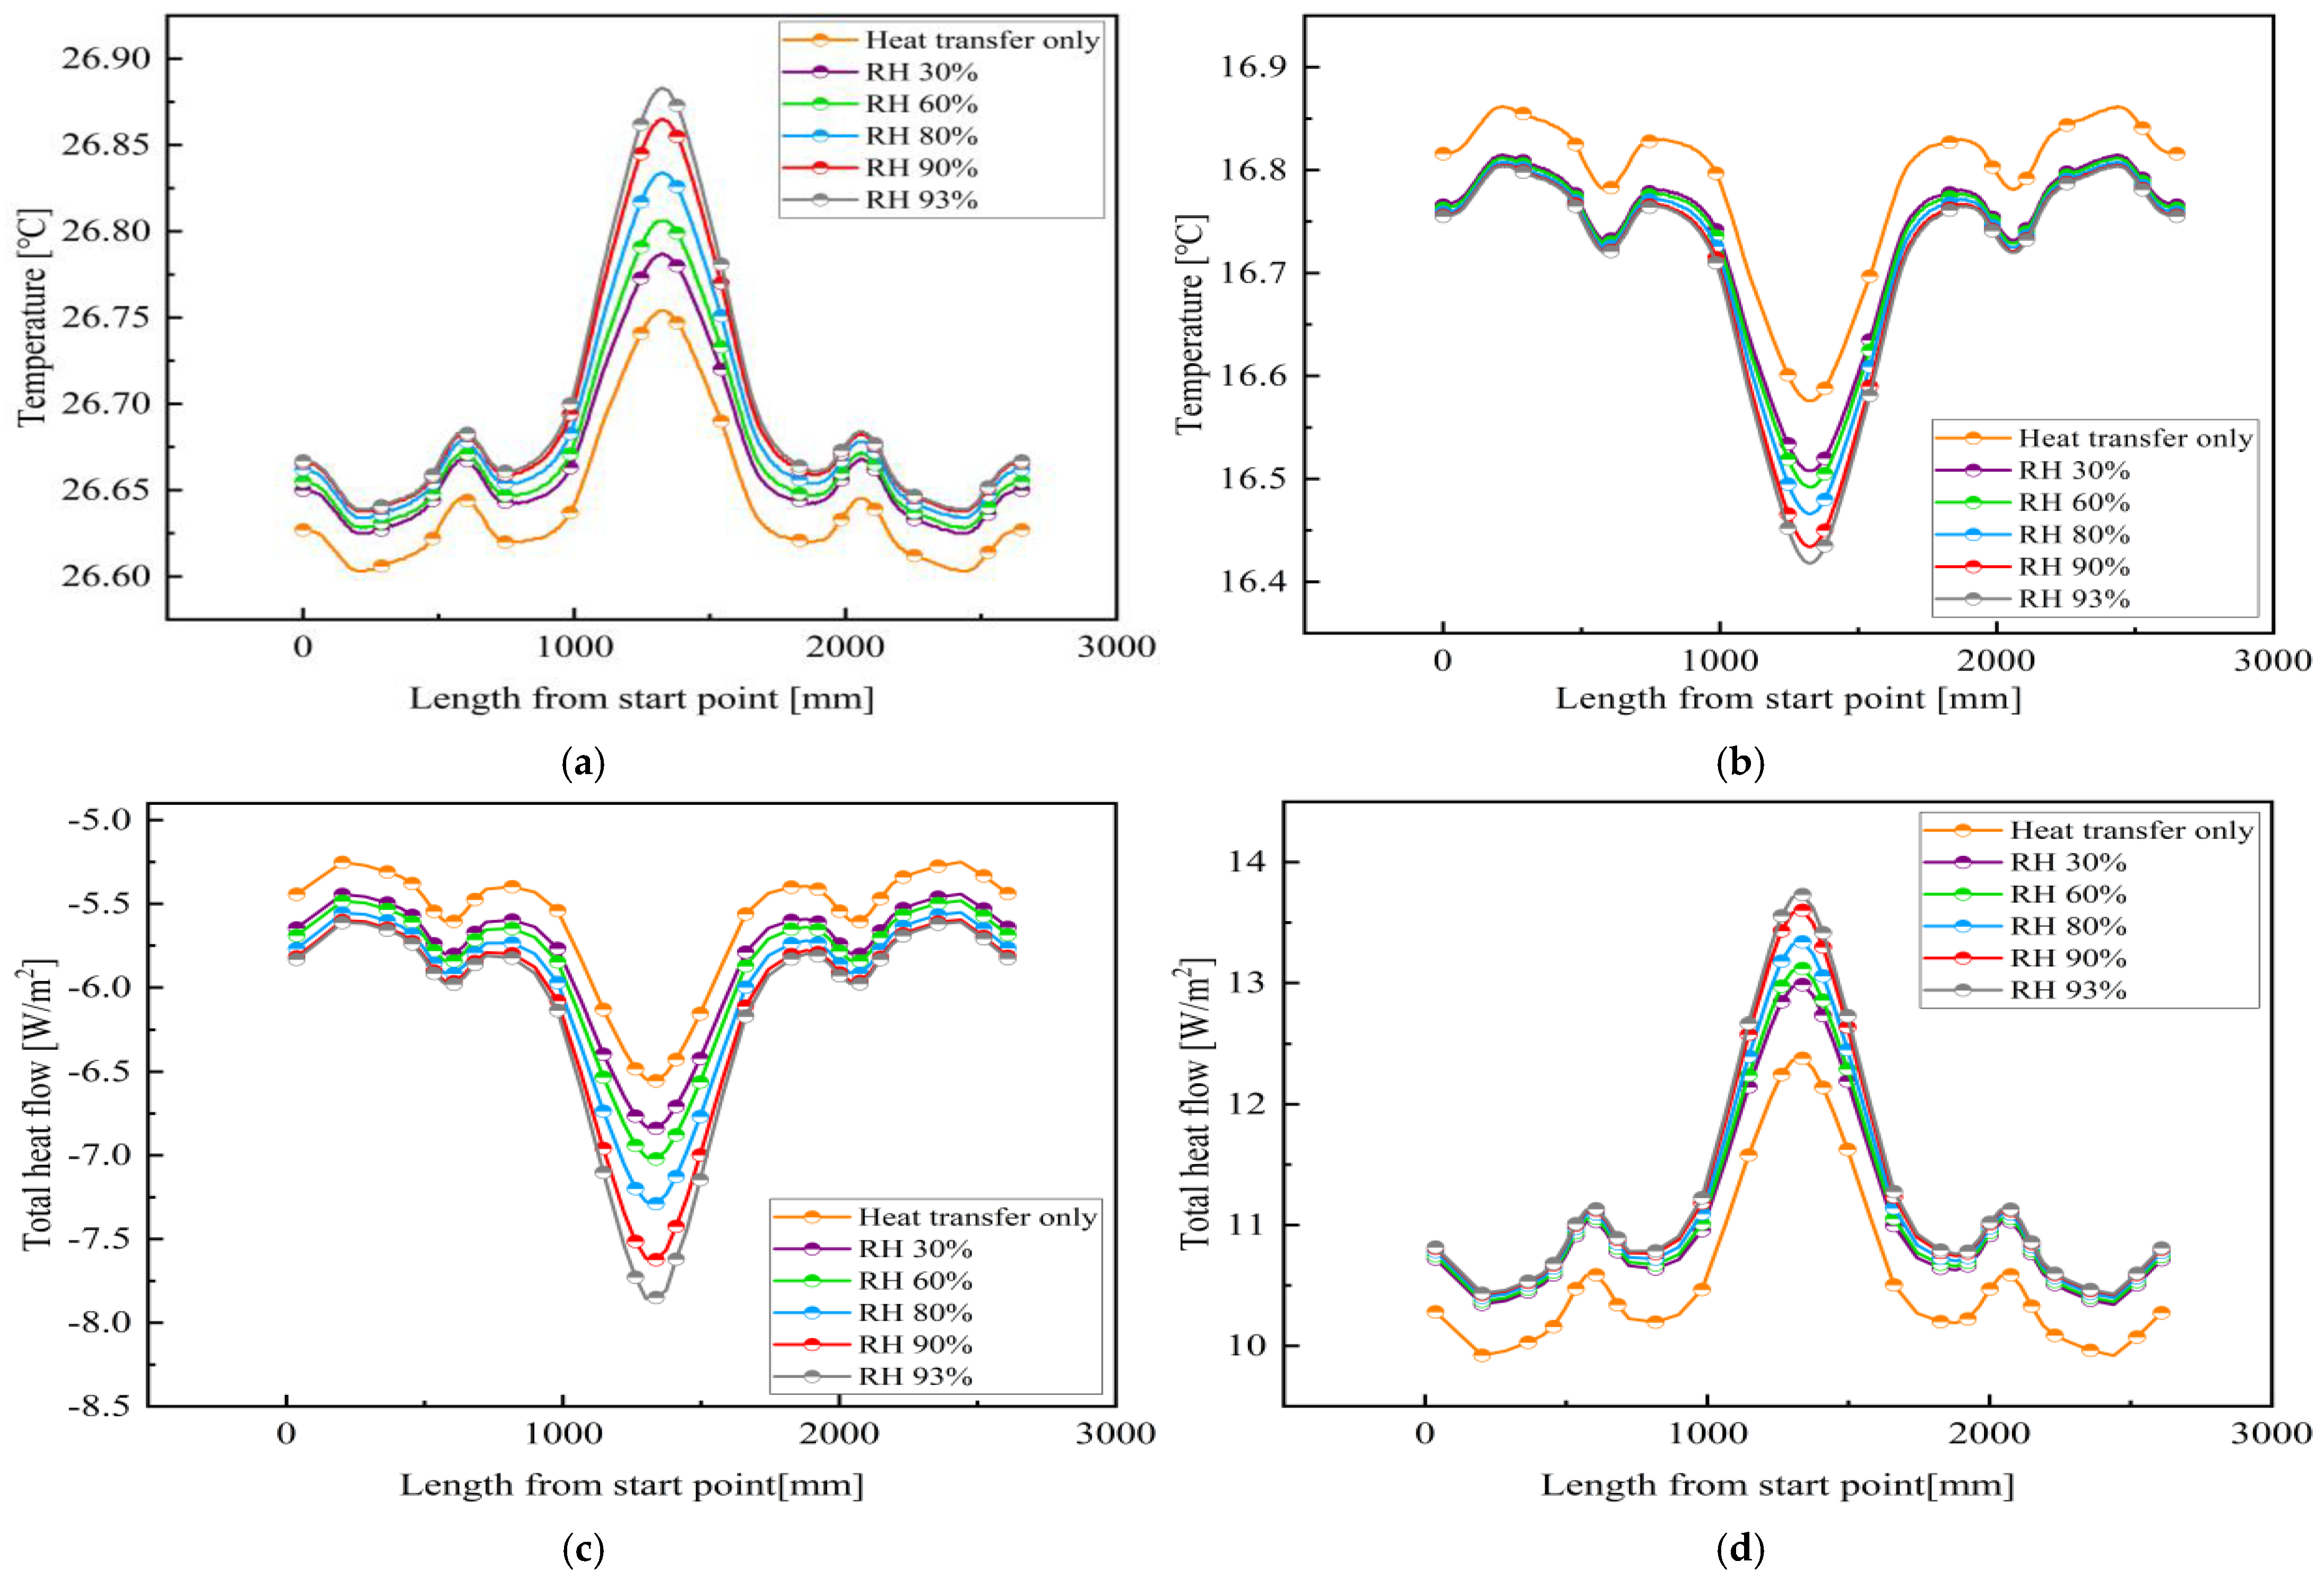
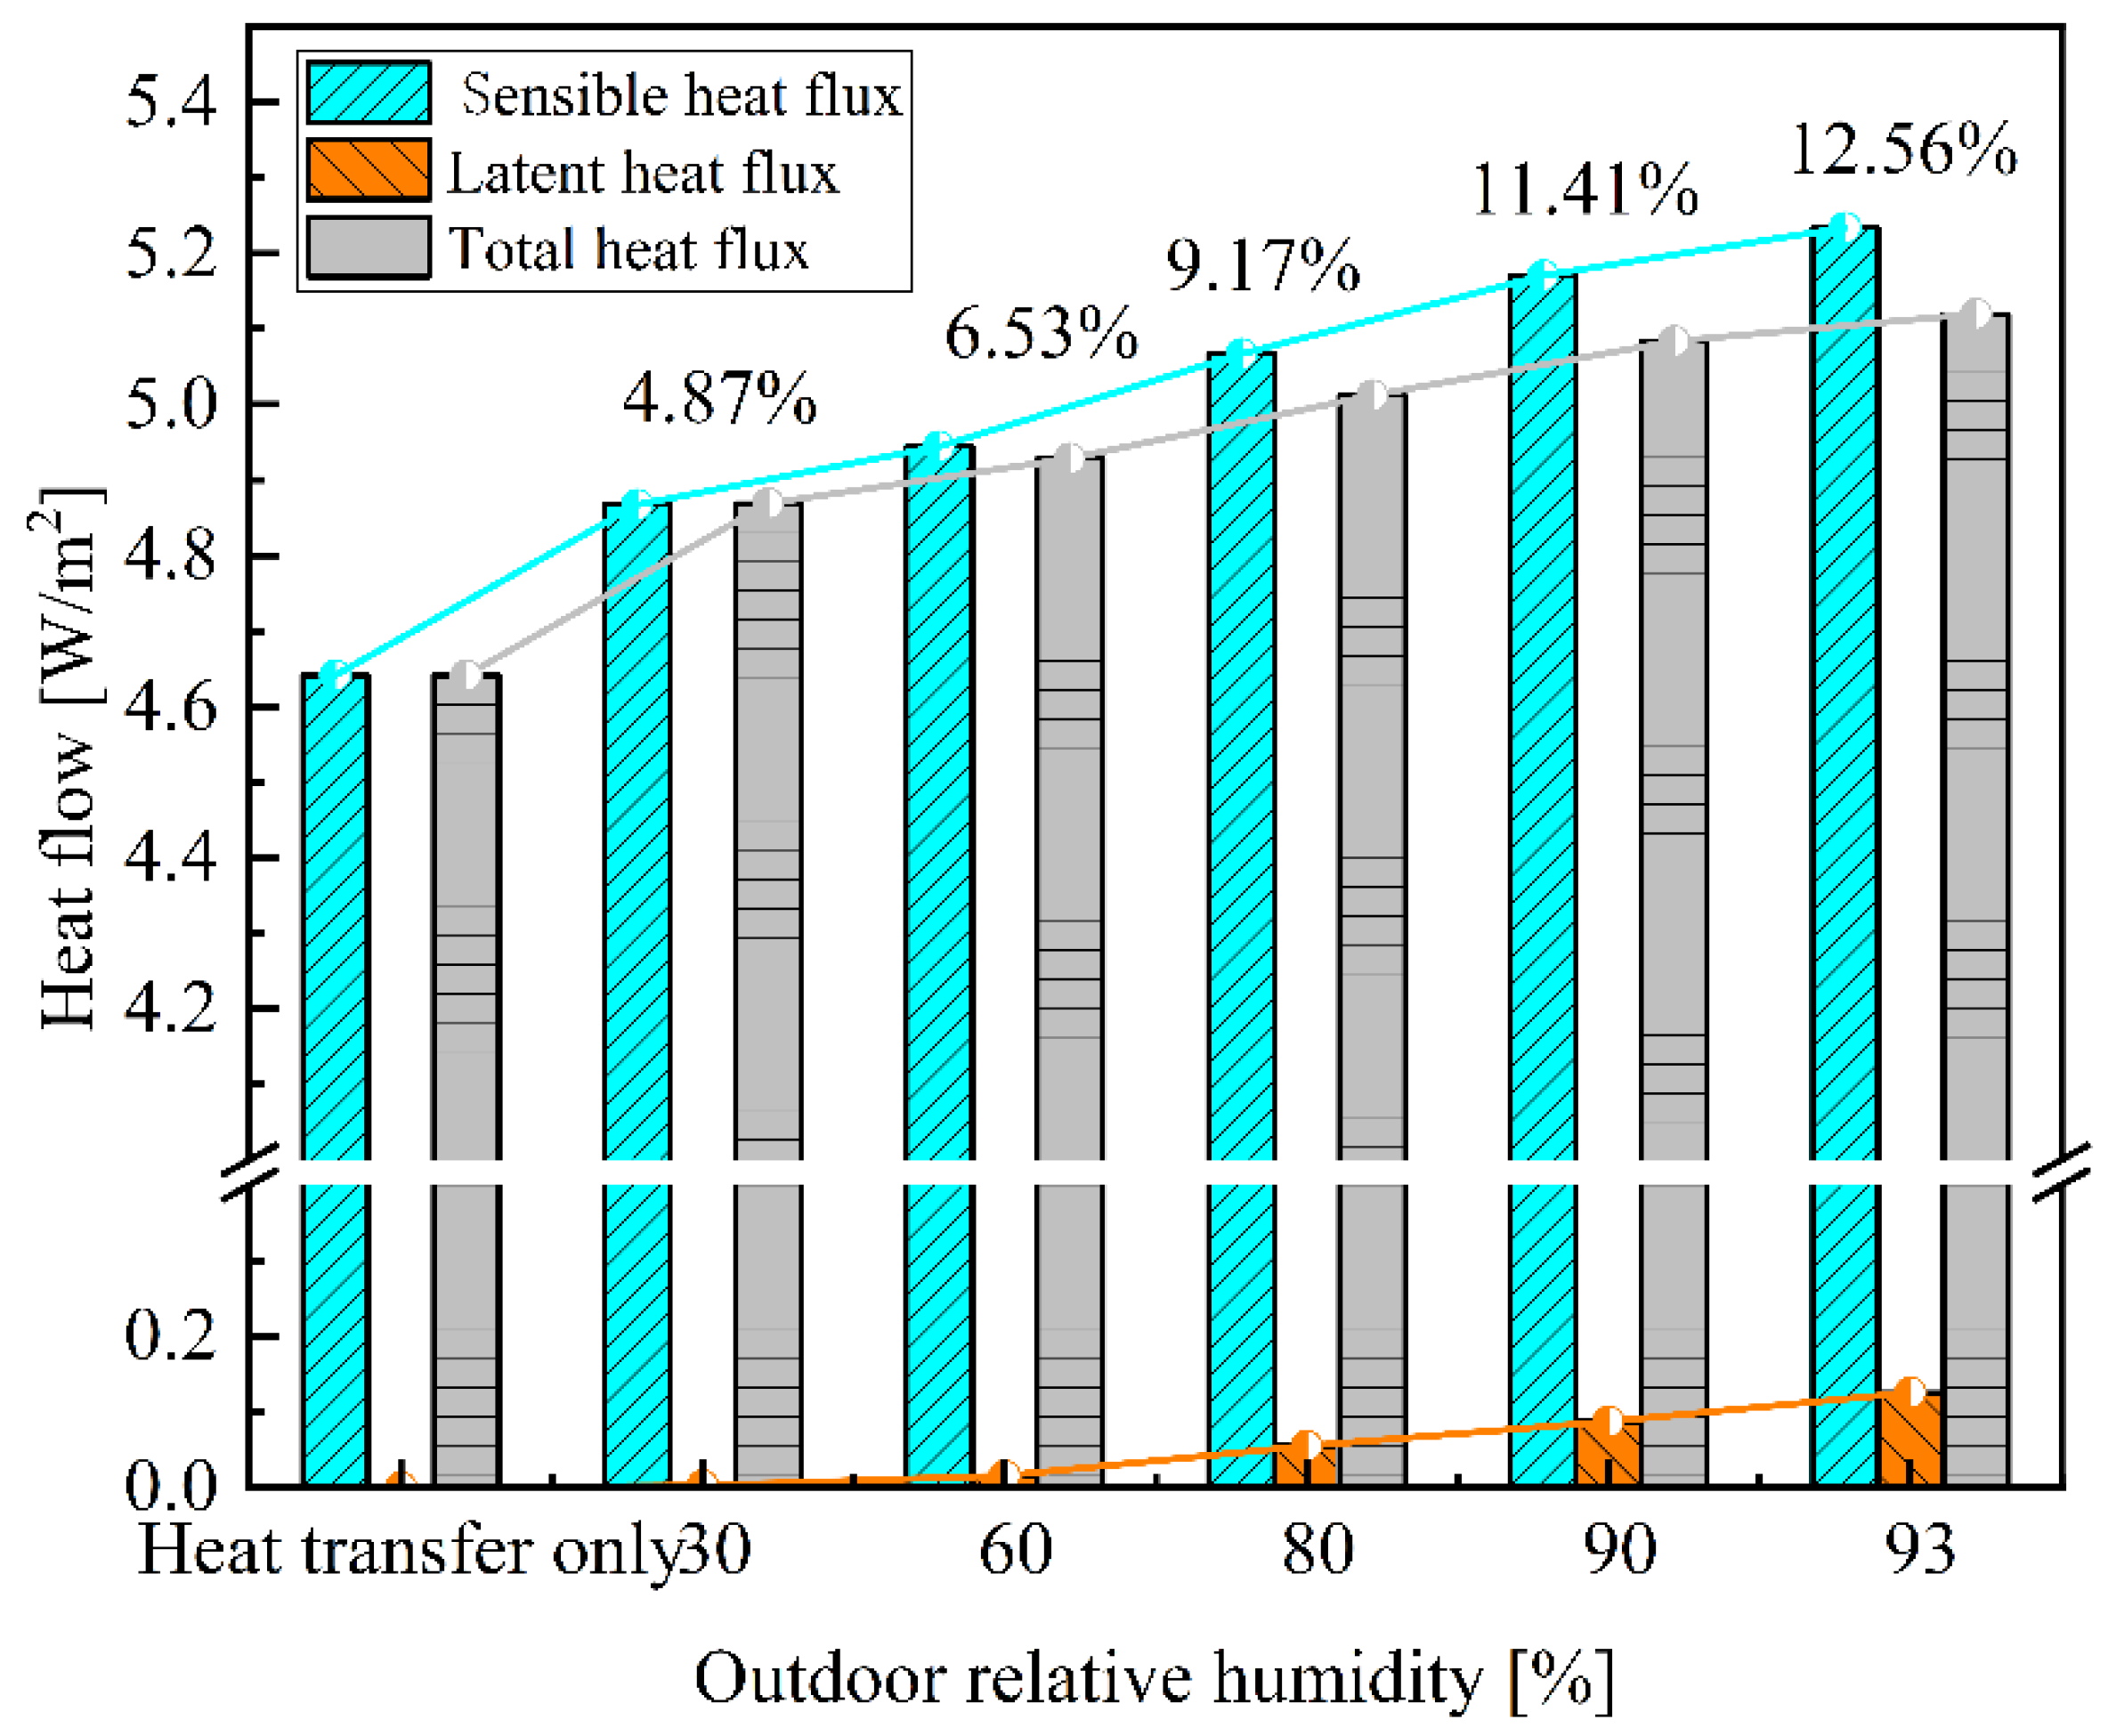
3.2. Impact of Outdoor Working Conditions on Wall Thermal Performance

Given that heat and moisture transfer are closely related to the external environment, steady boundary conditions with varying relative humidities and temperatures are established to investigate their impact on the heat and moisture characteristics at the joints of sandwich composite walls. The insulation layer of the wall has a thickness of 50 mm. Considering that the wall is most affected by humidity when aerated blocks are used as a filling material at the joints, aerated blocks will be employed in the subsequent research. The specific working conditions are defined as follows.
  • High temperature in summer:
Condition 1: The indoor temperature measures 26 °C, while the outdoor temperature is recorded at 35 °C.
Condition 2: The indoor temperature is 26 °C and indoor humidity is 60%; the outdoor temperature stands at 35 °C, with humidity levels varying between 30% and 93%.
B.
Low temperature in winter:
Condition 3: The indoor temperature is 18 °C, while the outdoor temperature is 1 °C.
Condition 4: The indoor temperature is 18 °C and indoor humidity is 60%; the outdoor temperature stands at 1 °C, with humidity levels varying between 30% and 93%.
Figure 9 illustrates the temperature and heat flux at Z1 on the inner side of the sandwich insulation composite wall under various environmental working conditions.
During high summer temperatures, as outdoor humidity increases, the temperature along the specified line on the interior surface of the sandwich composite wall also rises, with the most significant change occurring at the joint. In comparison to heat transfer by itself, the temperature increase ranges from 0.03 °C to 0.15 °C. Higher humidity results in a greater temperature rise. This indicates that increased outdoor humidity more significantly affects the temperature on the inner surface of the wall due to moisture transfer. This is because the EPS insulation layer within the sandwich insulation composite wall results in relatively low latent heat of evaporation, carrying away less heat. Simultaneously, the rise in outdoor humidity leads to intensified water vapor diffusion into the wall. Water vapor diffusion carries some heat, and during this process, a considerable amount of moisture remains inside the wall, affecting the insulation properties of the material and increasing the thermal conductivity, thereby raising the temperature on the indoor side.
As outdoor humidity increases, the heat flux at the joint rises by approximately 0.3 to 1.32 W/m2 compared to heat transfer, while the heat flux at the starting point of Z1 increases by only 0.2 to 0.4 W/m2. This occurs due to a defect in the EPS insulation layer at the joint. The aerated block used in this position exhibits a significantly greater moisture absorption capacity compared to EPS. As outdoor humidity rises, both sensible heat and latent heat at the joint increase more significantly than at the starting point.
At low winter temperatures, as external humidity increases, the temperature at Z1 on the inner side of the sandwich insulation wall decreases, while the passing heat flux increases. Specifically, the heat flux at the joint increases by approximately 0.6 to 1.21 W/m2, while the heat flux at the starting point of Z1 increases by about 0.54 W/m2. In comparison to high summer temperatures, the impact of moisture transfer on wall heat transfer is diminished at low winter temperatures.
The mean thermal flux across the interior surface of the wall during high summer temperatures has been calculated. The results are presented in Figure 10.
In the scenario of heat and moisture transfer, heat flux through the inner surface at the joint of the composite wall increases. Specifically, as relative humidity increases, the growth trend of sensible heat gradually slows. This occurs because as outdoor humidity rises, the difference in water vapor partial pressure between the wall’s interior surface and the external environment rises, leading to a rise in latent heat flux. Additionally, latent heat evaporation removes some heat from the wall surface, inhibiting the growth of sensible heat. As outdoor humidity rises, the percentage increase in inner surface heat flux, compared to heat transfer alone, ranges from 4.87% to 12.56%. This indicates that in thermal calculations at the joint of the sandwich insulation composite wall, neglecting moisture transfer while studying heat transfer may result in calculation errors.
Table 3 presents the heat loss resulting from the ‘one-line’ joint of the sandwich insulation composite wall filled with aerated blocks during high summer temperatures and low winter temperatures.
It is evident that at high summer temperatures, heat loss at the joint is consistently lower than that at low winter temperatures, while the heat loss rate is higher than in winter. As outdoor relative humidity rises, both heat loss and the heat loss rate at the joint also increase. This indicates that under conditions of high temperature and humidity in summer, the sandwich composite wall is most significantly affected by the thermal bridge at the joint.

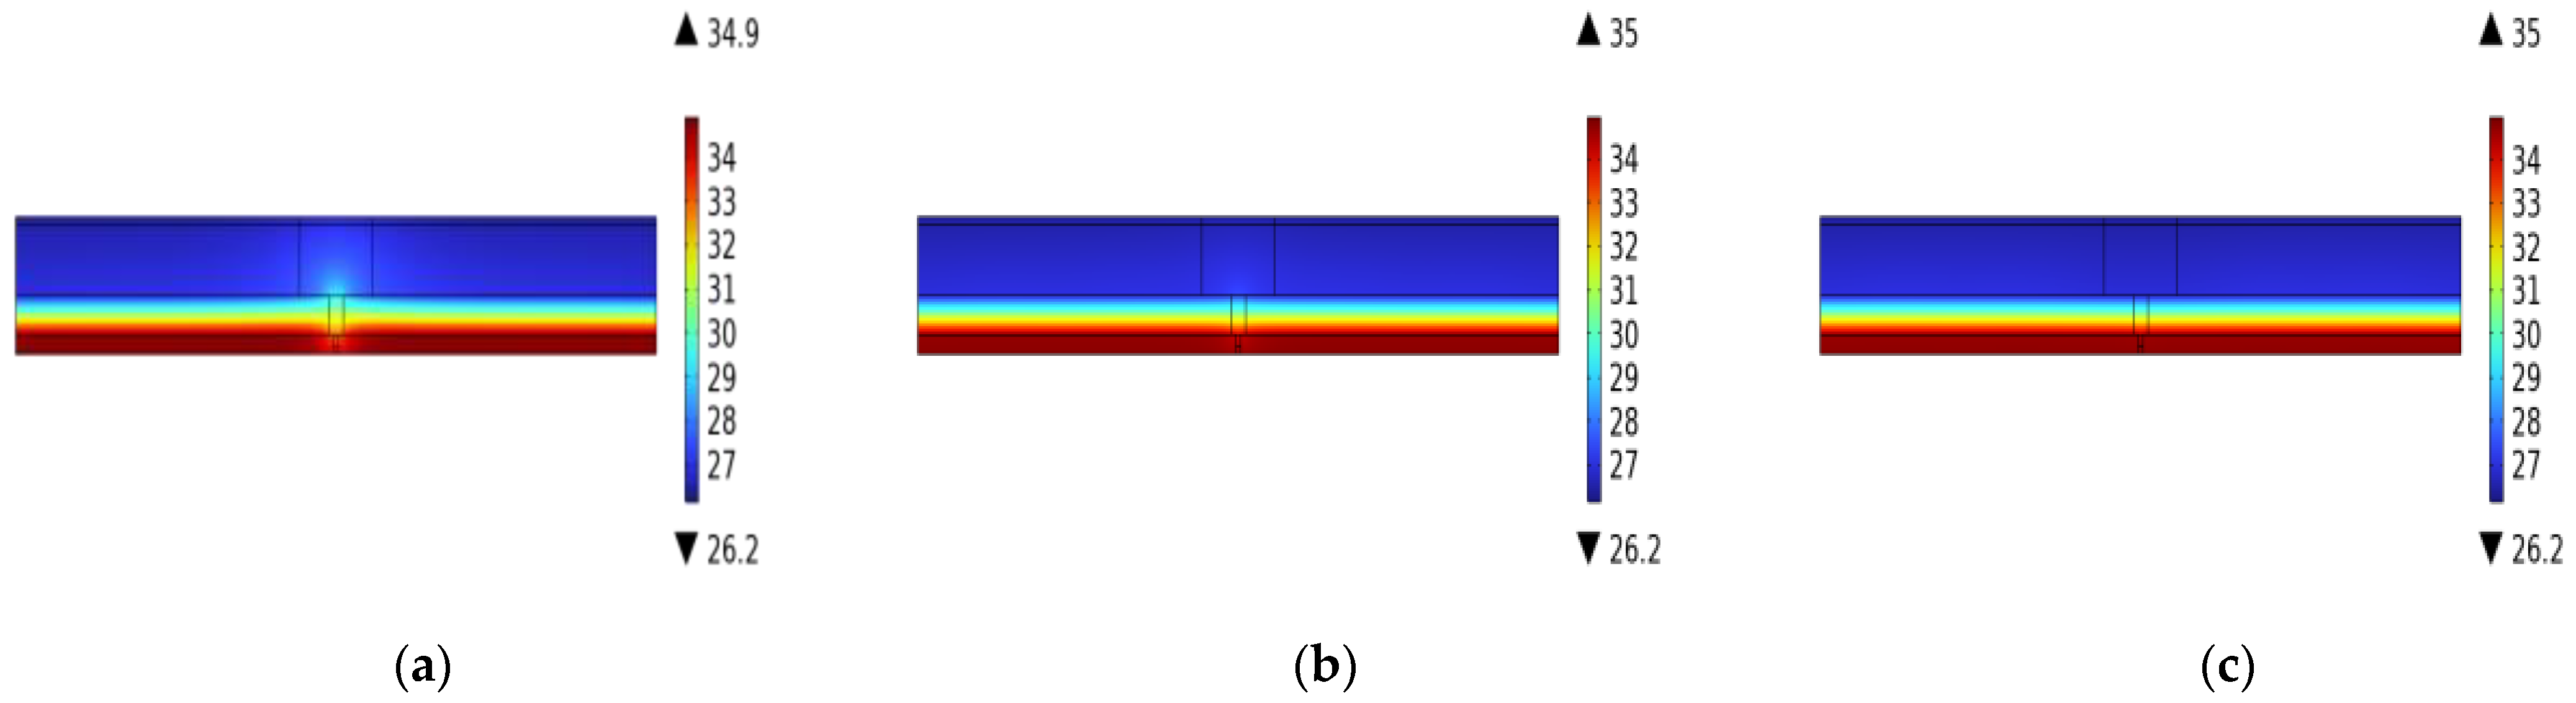
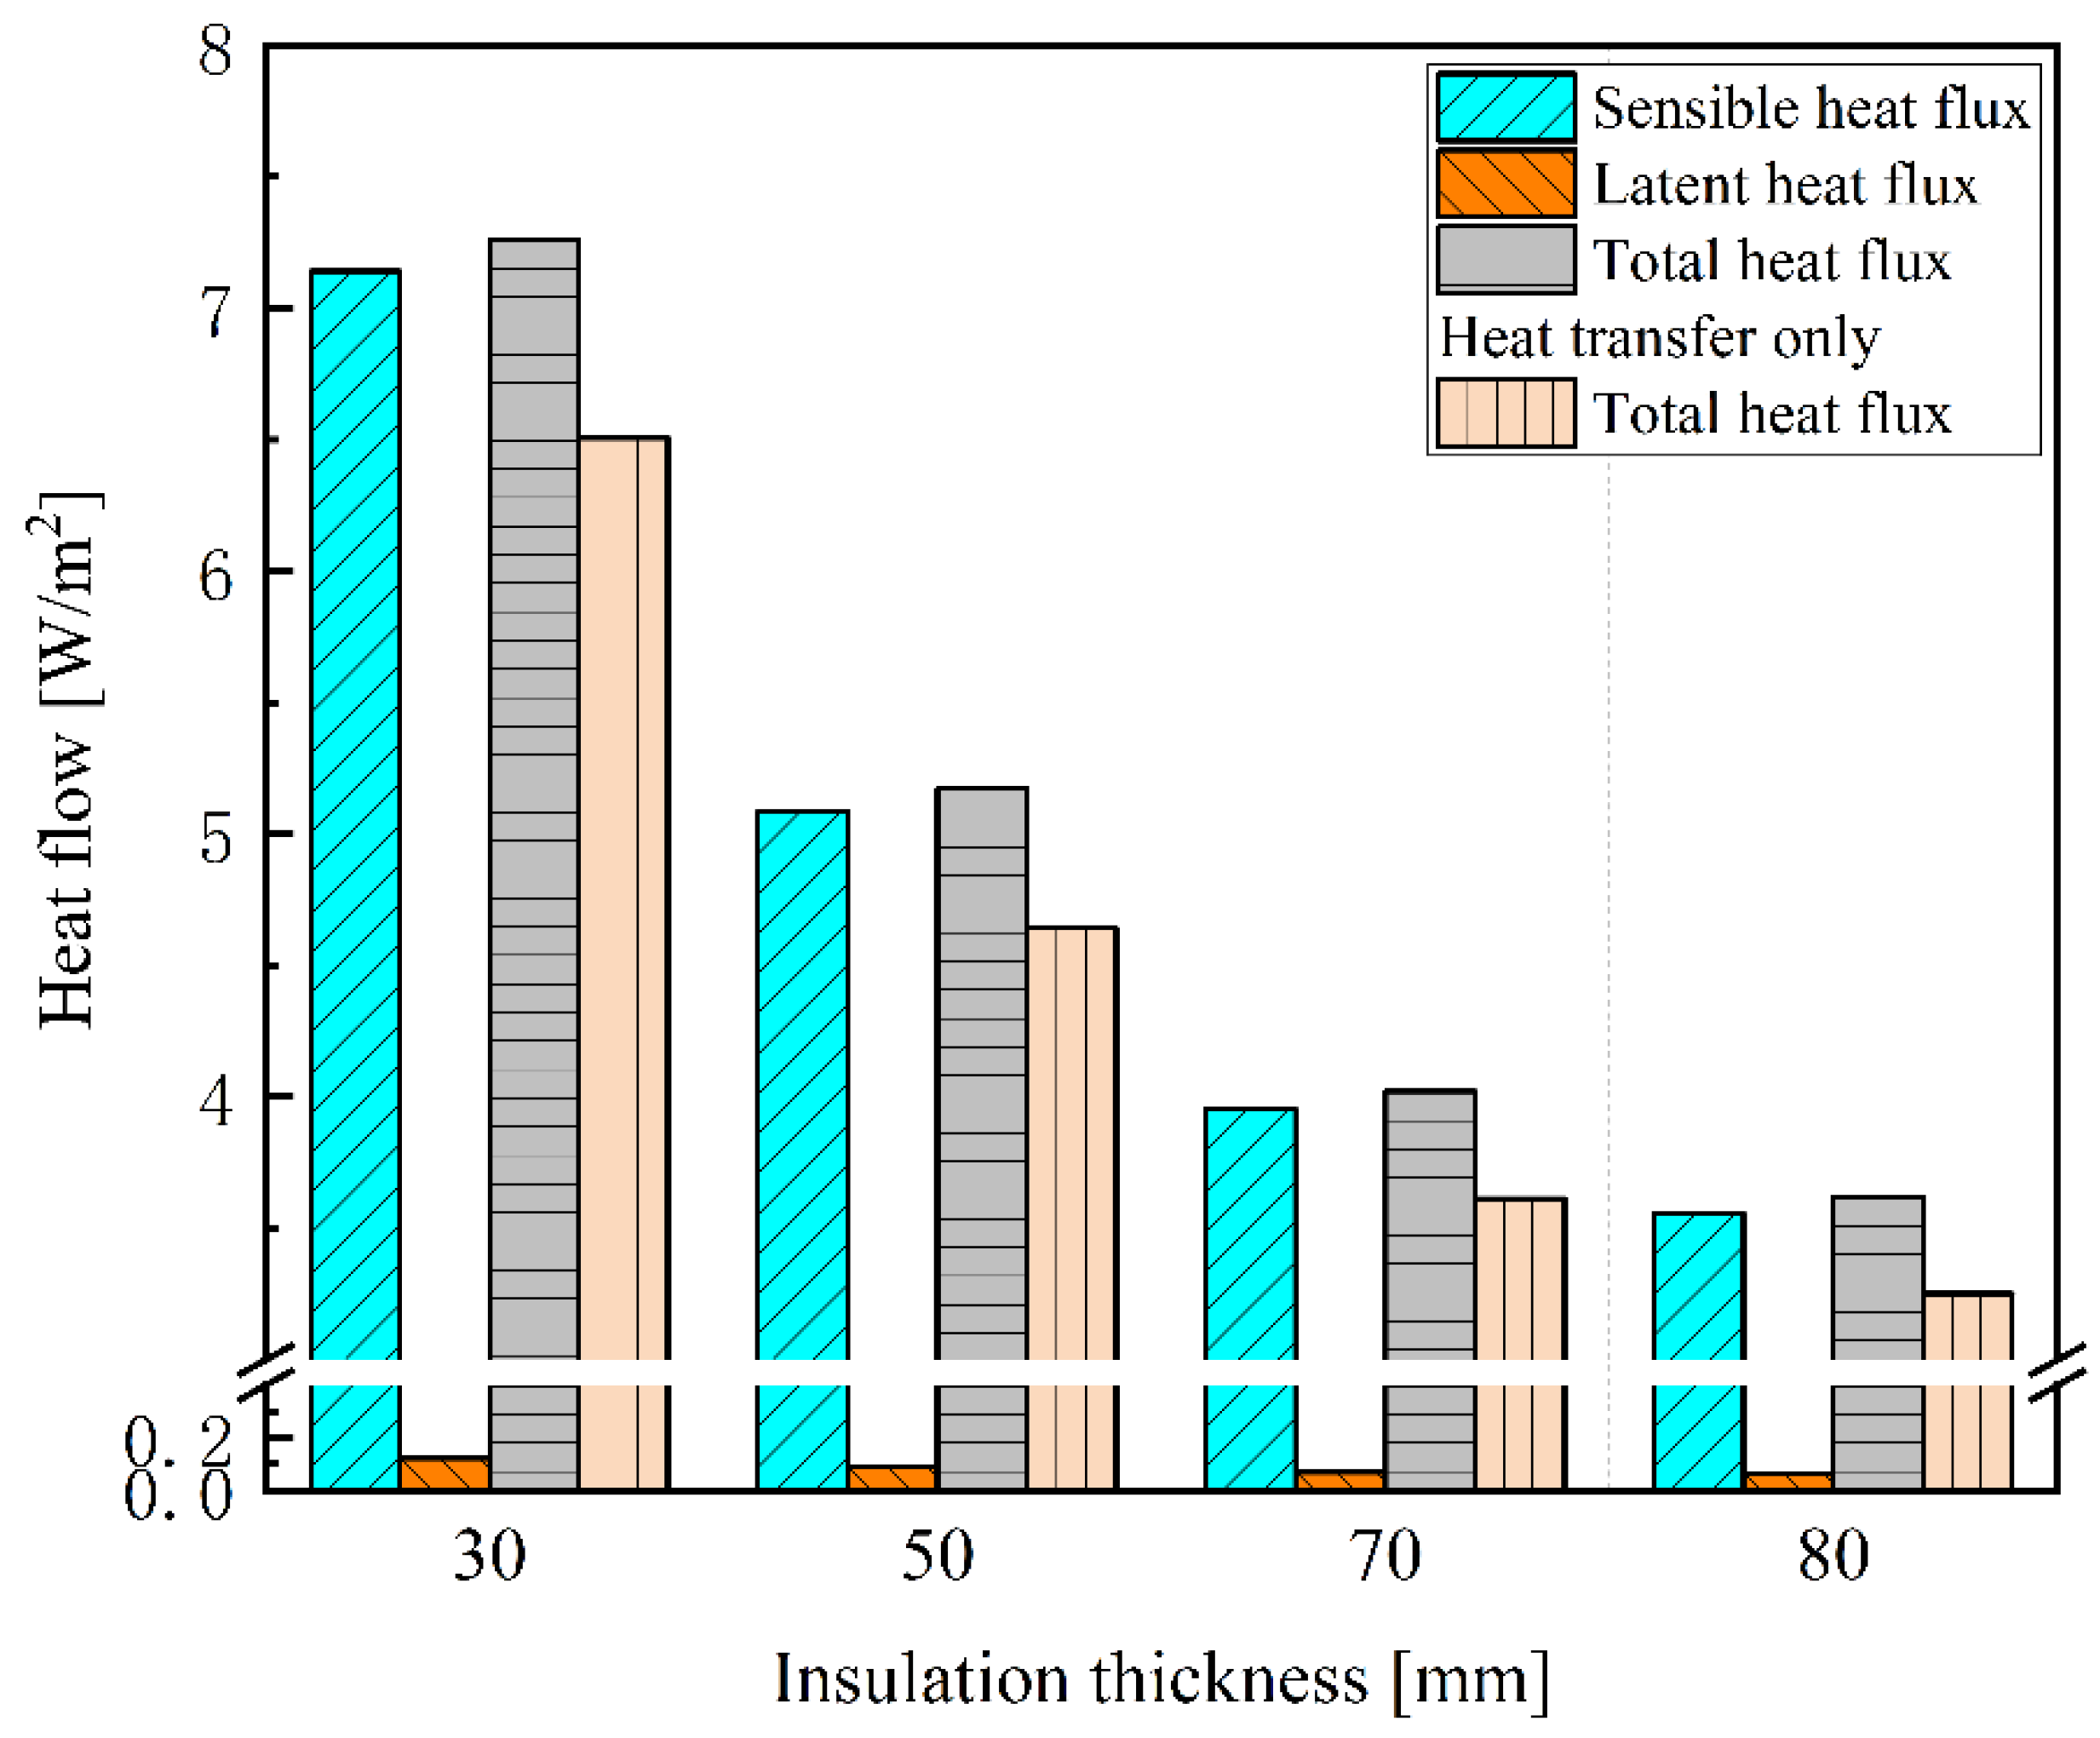
3.3. Impact of Insulation Layer Thickness on Wall Thermal Performance

Given that the thickness of the insulation layer in sandwich insulation composite walls varies across different regions, the thickness of the filling material at the joint also changes, affecting the heat and moisture transfer capacity of the wall. This section examines the impact of moisture transfer on heat transfer in four scenarios with insulation layer thicknesses of 30 mm, 50 mm, 70 mm, and 80 mm. The working condition is established as high summer temperatures. When considering humidity, the outdoor relative humidity is set at 90%, while the relative humidity indoors is kept at 60%.
The temperature variations of designated lines Z1 and Z2 with different insulation layer thicknesses are illustrated in Figure 11.
It is evident that with an increase in insulation layer thickness, the temperature along the characteristic lines of the inner surface decreases. When considering only heat transfer, as the thickness of the insulation layer changes, the average temperature of designated line Z1 is 26.90 °C, 26.65 °C, 26.50 °C, and 26.45 °C; the average temperature of designated line Z2 is 26.66 °C, 26.47 °C, 26.37 °C, and 26.33 °C. After accounting for moisture transfer, the average temperature of designated line Z1 is 26.98 °C, 26.70 °C, 26.54 °C, and 26.49 °C; the average temperature of designated line Z2 is 26.73 °C, 26.52 °C, 26.41 °C, and 26.37 °C. It can be observed that regardless of whether moisture transfer is considered, as the thickness of the insulation layer increases, the temperature difference between designated lines Z1 and Z2 decreases, with the temperature difference after accounting for moisture transfer being greater than that during pure heat transfer. This indicates that as the thickness of the insulation layer increases, the “heterogeneity” of the sandwich composite wall panel can be reduced, and this reduction is less pronounced when accounting for moisture transfer.
Figure 12 illustrates the calculated average heat flux on the inner surface of sandwich composite walls with varying thicknesses. Specifically, for insulation layer thicknesses of 30 mm, 50 mm, 70 mm, and 80 mm, the average heat flux through the surface, after accounting for moisture transfer, increases by 11.62%, 11.41%, 11.33%, and 11.30% compared to pure heat transfer. It can be noted that with an increase in the insulation layer thickness, the rate of growth of thermal flux on the interior surface after accounting for moisture transfer decreases. This occurs because as the thickness of the insulation layer increases, the heat transfer resistance of the sandwich insulation composite wall correspondingly increases, while the moisture permeability coefficient decreases, leading to a reduction in moisture migration.
Table 4 presents the heat loss associated with the ‘one-line’ joint when the sandwich insulation composite wall is filled with aerated blocks at varying insulation layer thicknesses.
With the increasing thickness of the insulation layer, the heat loss at the joint correspondingly increases. The consideration of moisture transfer further amplifies this effect. This occurs because as the thickness of the insulation layer increases, the quantity of aerated blocks filled at the joint also increases. The insulation performance of aerated blocks is inferior to that of the EPS insulation layer and is more susceptible to moisture transfer. Consequently, the heat transfer path becomes more concentrated at the joint.

4. Average Heat Transfer Coefficient and Correction for ‘One-Line’ Sandwich Insulation Composite Wall

Considering the influence of outdoor humidity and insulation layer thickness on the thermal bridge of the ‘one-line’ joint, and referring to the climatic characteristics of hot summer and cold winter areas, boundary conditions are established for both summer and winter to adjust the average heat transfer coefficient of the ‘one-line’ joint wall across various thicknesses. Given that temperature has minimal impact on the thermal bridge effect at the joint under identical humidity conditions, the maximum and minimum temperatures within the average temperature range for summer and winter in hot summer and cold winter regions are selected, as specified in the “Code for Thermal Design of Civil Buildings” [12]. The outdoor relative humidity range is defined based on representative cities in this region, as shown in Table 5.
According to Equations (8) and (9), focusing solely on heat transfer, Table 6 presents the average values of thermal resistance and the heat transfer coefficient for the wall panel.
R ¯ = A ( T i T e ) Q = T i T e q ¯
K = 1 R i + R ¯ + R e
where T i , T e represents the average temperature on the inner and outer surfaces of the multi-ribbed wall, in K; q ¯ is the average heat flux flowing through the wall panel, in W/m2; R i is the heat transfer resistance on the inner surface, taken as 0.11 m2·K/W; R e is the heat transfer resistance on the outer surface, taken as 0.04 m2·K/W; R ¯ is the average heat transfer resistance of the wall, in m2·K/W; and K is the heat transfer coefficient, in W/(m2·K).
It is evident that as the thickness of the insulation layer increases, the heat transfer coefficient of the wall decreases. Furthermore, when considering only heat transfer, the influence of external temperature on the average heat transfer coefficient of the wall can be disregarded.
After accounting for moisture transfer, the values of the heat transfer coefficient and correction rates for ‘one-line’ wall panels of varying thicknesses are presented in Table 7 and Table 8.
After considering moisture transfer, it is observed that as the thickness of the insulation layer increases, the correction rate of the average heat transfer coefficient of the wall correspondingly increases. This phenomenon occurs due to the improved insulation performance of the wall, which consequently reduces heat flow. The reduction in heat transfer resulting from moisture migration is less significant than that caused by the decrease in the heat transfer coefficient. Consequently, the correction coefficient increases with the thickness of the insulation layer. In regions characterized by hot summers and cold winters, the correction rate of the heat transfer corrected coefficient for various wall thicknesses during winter ranges from 1.12 to 1.16, while in summer, it ranges from 1.10 to 1.18.

5. Conclusions

This paper investigates the heat transfer performance at the vertical joint of the ‘one-line’ sandwich insulation composite exterior wall, considering the influence of moisture transfer using the method of numerical simulation. It examines the extent to which moisture transfer affects wall heat transfer, considering various fillers at the joint, different insulation layer thicknesses, and diverse external environmental conditions. Finally, based on the climatic characteristics of regions with hot summers and cold winters, the heat transfer coefficient of the sandwich insulation composite wall is corrected to account for the effects of joints and moisture transfer.
  • In scenarios involving heat transfer alone, filling the joint with concrete results in the highest heat loss, with a rate of 18.65%. Conversely, when the joint is filled with glass wool, heat loss is negligible. When both heat and moisture transfer are considered, heat loss begins to occur with glass wool filling, resulting in a rate of 0.6%. Filling the joint with aerated blocks results in heat transfer being significantly influenced by moisture transfer, with a heat loss rate of 8.08%.
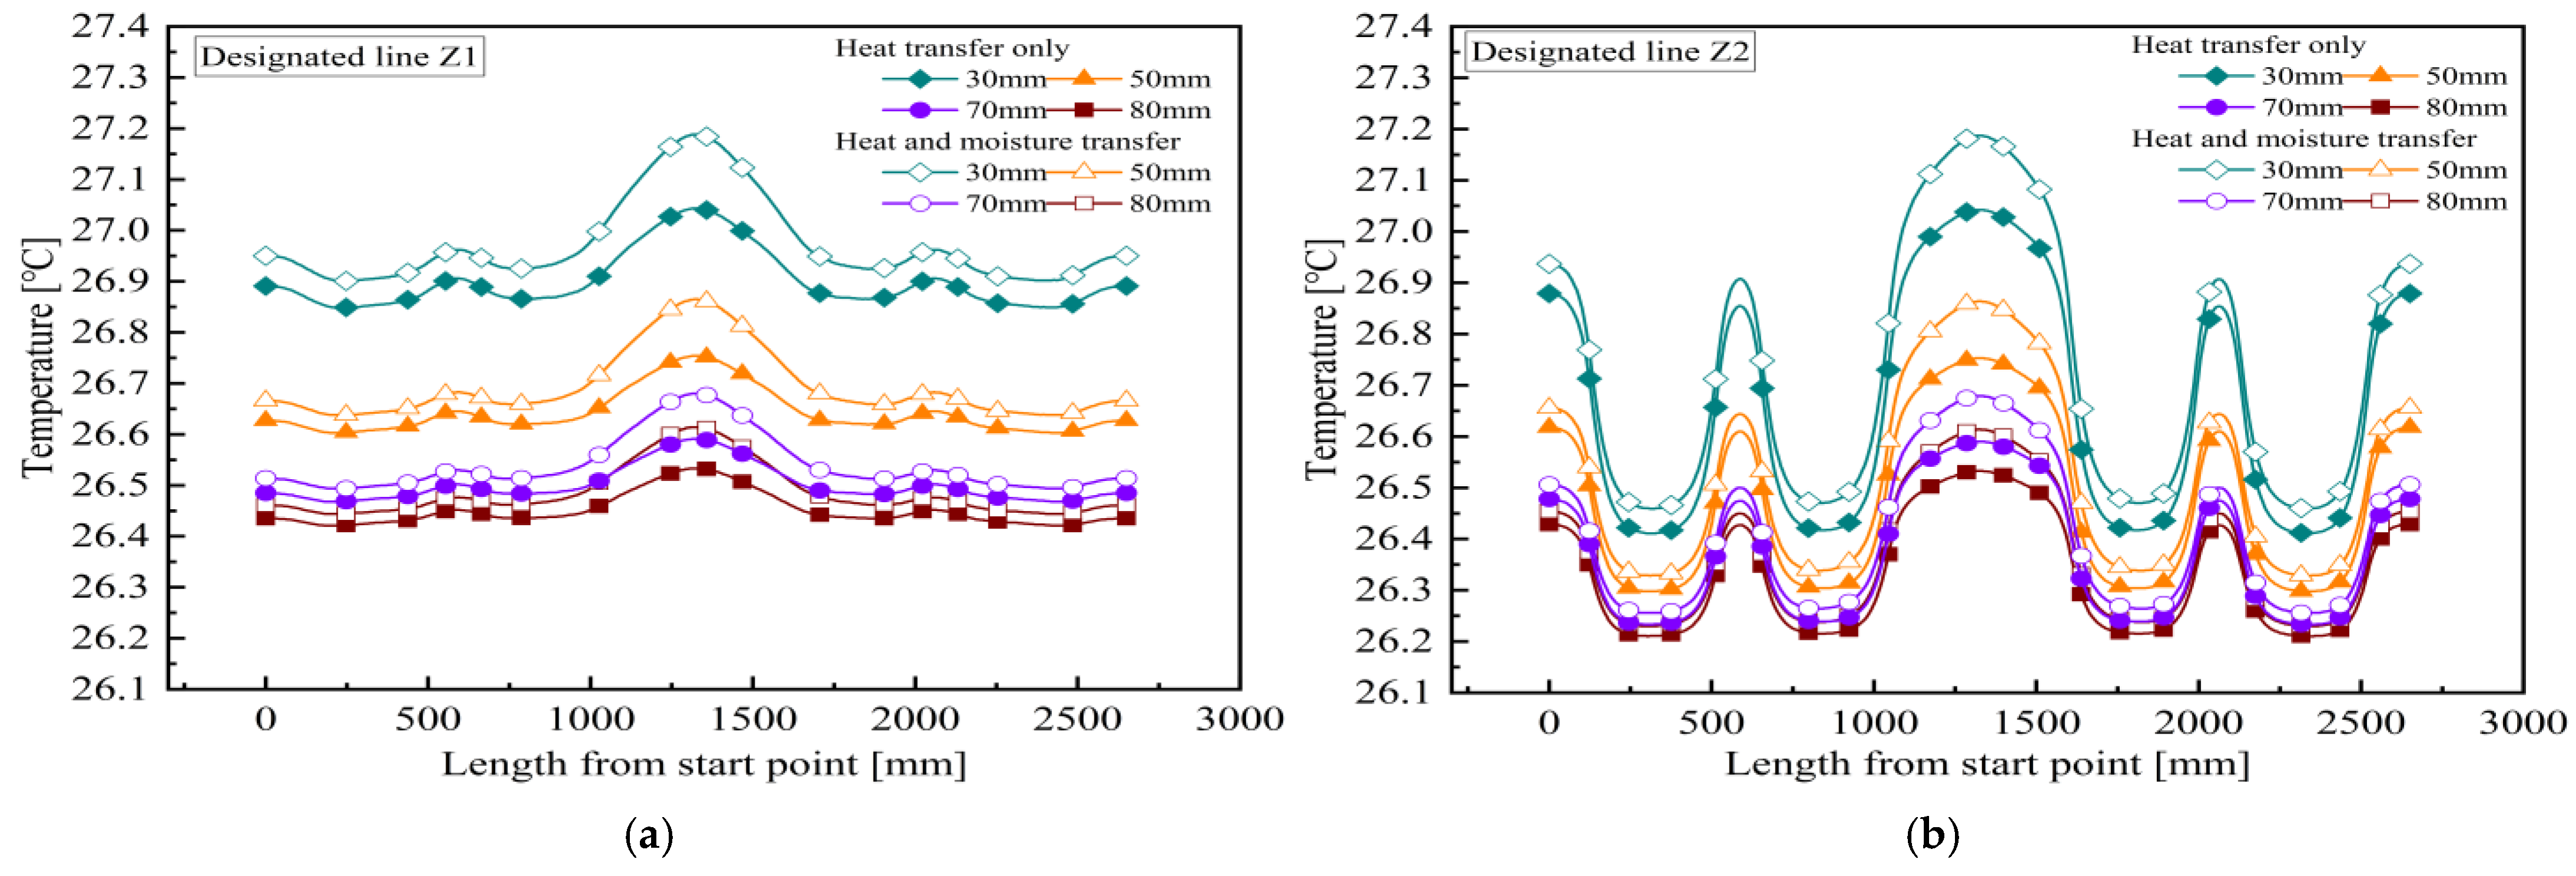
  • In a high-humidity summer environment, moisture transfer exerts the greatest influence on the heat transfer performance at the joint of the composite wall. As the insulation layer thickness increases, the rise in surface heat flux, compared to scenarios involving heat transfer alone, diminishes; however, heat loss at the joint increases with greater insulation layer thickness. Simultaneously, an increase in insulation layer thickness contributes to reducing the ‘heterogeneity’ of the sandwich insulation composite wall. However, after accounting for moisture transfer, this degree of reduction will diminish.
  • Taking into account the varying humidity conditions in summer and winter in regions characterized by hot summers and cold winters, the heat transfer coefficient of sandwich insulation composite walls with different thicknesses, filled with aerated blocks at the ‘one-line’ joint, is corrected. After accounting for the impact of the hot and humid bridge at the joint, the correction rate of the average heat transfer corrected of the wall in summer ranges from 1.10 to 1.18.
  • This framework provides valuable insights for predicting coupled heat and moisture transfer through building envelopes. In the future, it will be a new research direction to further verify the authenticity of our numerical simulation through real-world experiments, which will make the work more complete.

Author Contributions

All authors contributed to the study conception and design. Material preparation, data collection, and analysis were performed by Y.C., C.M., G.C. and Y.H. The first draft of the manuscript was written by C.M. and all authors commented on other versions of the manuscript. All authors have read and agreed to the published version of the manuscript.

Funding

This study was supported by the Jiaxing University Launches Fund Project (Grant No. CD70522018), A Project Supported by Scientific Research Fund of Jiaxing Science and Technology Bureau (Grant No. 2023AZ31007), and A Project Supported by Scientific Research Fund of Zhejiang Provincial Education Department (Y202352093).

Data Availability Statement

The original contributions presented in this study are included in the article. Further inquiries can be directed to the corresponding author.

Conflicts of Interest

The authors declare that they have no known competing financial interests or personal relationships that could have appeared to influence the work reported in this paper.

Nomenclature

c 0 specific heat capacity [J/(kg·K)] Q Z total heat flux on inner surface [W]
ρ 0 material density [kg/m3] U i planar heat transfer coefficient of wall [W/(m2·K)]
ω moisture content [kg/m3] A i wall plane area [m2]
h l v latent heat of vaporization of water vapor [J/kg]ΔTtemperature difference between indoor and outdoor [K]
δ v water vapor permeability coefficient [kg/(m·s·Pa)] β heat flow loss rate
ϕ relative humidity R ¯ average heat transfer resistance of wall [m2·K/W]
λ thermal conductivity coefficient [W/(m·K)] q ¯ average heat flow through wall panels [W/m2]
P s a t saturated water vapor pressure [Pa] T i average temperature of inner surface [K]
ξ slope of moisture absorption equilibrium curve T e average temperature of outer surface [K]
K l liquid water permeability [s] R i heat transfer resistance of inner surface [K/W]
ρ l density of liquid water [kg/m3] R e heat transfer resistance of outer surface [K/W]
R v gas constant for water vapor [J/(kg·K] K heat transfer coefficient [W/(m2·K)]
T k thermodynamic temperature [K] Ψ correction factor

References

  1. Chen, G.X.; Chen, Y.S.; Lv, X.M. Research on seismic performance and influencing factors of lateral stiffness of composite walls with door openings and stiffening ribs. Earthq. Resist. Eng. Retrofit. 2019, 41, 26–33. (In Chinese) [Google Scholar]
  2. You, Y.N.; Kang, Y.T.; Ma, J.; Xing, Y.R. Research and development of key technologies for passive ultra-low energy consumption prefabricated buildings in China. Build. Sci. 2019, 35, 137–142. (In Chinese) [Google Scholar]
  3. Omle, I.; Kovács, E.; Bolló, B. Applying recent efficient numerical methods for long-term simulations of heat transfer in walls to optimize thermal insulation. Results Eng. 2023, 20, 101476. [Google Scholar] [CrossRef]
  4. Caner, G. Evaluation of the problem points that form the thermal bridge in reinforced concrete prefabricated buildings in terms of heating energy cost. Int. J. Acad. Res. 2013, 5, 28–35. [Google Scholar]
  5. Ge, H.; McClung, V.R.; Zhang, S. Impact of balcony thermal bridges on the overall thermal performance of multi-unit residential buildings: A case study. Energy Build. 2013, 60, 163–173. [Google Scholar]
  6. Zedan, M.F.; Al-Sanea, S.; Al-Mujahid, A.; Al-Suhaibani, Z. Effect of thermal bridges in insulated walls on air-conditioning loads using whole building energy analysis. Sustainability 2016, 8, 560. [Google Scholar] [CrossRef]
  7. Déqué, F.; Ollivier, F.; Roux, J.J. Effect of 2D modelling of thermal bridges on the energy performance of buildings: Numerical application on the Matisse apartment. Energy Build. 2001, 33, 583–587. [Google Scholar]
  8. de Freitas, J.R.; da Cunha, E.G. Thermal bridges modeling in South Brazil climate: Three different approaches. Energy Build. 2018, 169, 271–282. [Google Scholar]
  9. Viot, H.; Sempey, A.; Pauly, M.; Mora, L. Comparison of different methods for calculating thermal bridges: Application to wood-frame buildings. Build. Environ. 2015, 93, 339–348. [Google Scholar]
  10. Quinten, J.; Feldheim, V. Dynamic modelling of multidimensional thermal bridges in building envelopes: Review of existing methods, application and new mixed method. Energy Build. 2016, 110, 284–293. [Google Scholar]
  11. ISO 10211:2007(en); Thermal Bridges in Building Construction—Heat Flows and Surface Temperatures—Detailed Calculations. ISO: Geneva, Switzerland, 2007.
  12. GB 50176-2016; Thermal Design Code for Civil Buildings. China Architecture & Building Press: Beijing, China, 2016.
  13. Pásztory, Z. An overview of factors influencing thermal conductivity of building insulation materials. J. Build. Eng. 2021, 44, 102604. [Google Scholar]
  14. Jin, H.Q.; Yao, X.L.; Fan, L.W.; Xu, X.; Yu, Z.T. Experimental determination and fractal modeling of the effective thermal conductivity of autoclaved aerated concrete: Effects of moisture content. Int. J. Heat Mass Transf. 2016, 92, 589–602. [Google Scholar] [CrossRef]
  15. Qin, M.; Belarbi, R.; Aït-Mokhtar, A.; Nilsson, L.-O. Coupled heat and moisture transfer in multi-layer building materials. Constr. Build. Mater. 2009, 23, 967–975. [Google Scholar]
  16. Li, W.; Liu, F.; Chen, B.M.; Wei, M.F.; Gao, K.K. Influence of moisture transfer on heat transfer performance of building walls. Build. Energy Effic. 2017, 45, 57–61. [Google Scholar]
  17. Le, A.T.; Maalouf, C.; Mai, T.H.; Wurtz, E.; Collet, F. Transient hygrothermal behaviour of a hemp concrete building envelope. Energy Build. 2010, 42, 1797–1806. [Google Scholar]
  18. Maliki, M.; Laredj, N.; Bendani, K.; Missoum, H. Two-dimensional transient modeling of energy and mass transfer in porous building components using COMSOL Multiphysics. J. Appl. Fluid Mech. 2017, 10, 319–328. [Google Scholar]
  19. Zhao, Z.J. Study on Heat and Moisture Transfer Characteristics at Building Exterior Wall Corners with Different Structural Forms of Corner Columns. Master’s Thesis, Xi’an University of Architecture and Technology, Xi’an, China, 2020. [Google Scholar]
  20. Wang, Y.; Liu, K.; Tian, Y.; Fan, Y.; Liu, Y. The effect of moisture transfer on heat transfer of roof-wall corner hygrothermal bridge structure. Indoor Built Environ. 2023, 32, 881–901. [Google Scholar]
  21. Wang, Y.; Fan, Y.; Wang, D.; Liu, Y.; Liu, J. The effect of moisture transfer on the inner surface thermal performance and the thermal transmittance of the roof-wall corner building node in high-temperature and high-humidity areas. J. Build. Eng. 2021, 44, 102949. [Google Scholar]
  22. Lu, J.; Xue, Y.; Wang, Z.; Fan, Y. Optimized mitigation of heat loss by avoiding wall-to-floor thermal bridges in reinforced concrete buildings. J. Build. Eng. 2020, 30, 101214. [Google Scholar]
  23. Li, Z.; Xing, W.; Jiang, F. Wet risk analysis on the external walls of ultra-low energy buildings in shanghai based on coupled heat and moisture transfer. J. BEE 2022, 35, 209–217. [Google Scholar]
  24. Wang, S.; Zhang, G.; Liu, X. Heat and moisture transfer and heat storage and release performance of assembled soil sandwich wall in solar greenhouse. Trans. Chin. Soc. Agric. Eng. 2019, 50, 100–106. [Google Scholar]
  25. Hagentoft, C.E. HAMSTAD–Final report: Methodology of HAM-modeling. Report R-02 2002, 8, 19–23. [Google Scholar]
  26. Fan, Y. Study on the Coupled Heat and Moisture Transfer Characteristics of Roof-External Wall Corner Building Nodes. Master’s Thesis, Xi’an University of Architecture and Technology, Xi’an, China, 2021. [Google Scholar]
  27. Wang, Y.Y. Research on the Relationship Between Moisture Migration in Enclosure Structures and Indoor Thermal Environment and Air Conditioning Load. Ph.D. Thesis, Xi’an University of Architecture and Technology, Xi’an, China, 2013. [Google Scholar]
  28. Wan, J.Y.; Yu, S.; Wei, J.S. The Impact of Air Layers on the Coupled Heat, Air, and Moisture Transfer Performance in Multi-Layered Walls. Energy Conserv. 2019, 42, 6–10. (In Chinese) [Google Scholar]
Figure 1. Sandwich insulation composite wall. (a) Joint seam of exterior wall panel. (b) Schematic diagram of wall panel structure form.
Buildings 15 01084 g001
Figure 2. Schematic diagram of structure.
Buildings 15 01084 g002
Figure 3. Comparison of mathematical model results with those of case 5. (a) Relative humidity inside wall. (b) Moisture content in wall.
Buildings 15 01084 g003
Figure 4. The ‘one-line’ joint seam of a sandwich insulation composite wall. (a) Physical modeling of the walls; (b) details of the wall structure.
Buildings 15 01084 g004
Figure 5. Internal temperature distribution diagram. (a) Filled concrete. (b) Filled aerated block. (c) Filled glass wool.
Buildings 15 01084 g005
Figure 6. The designated line along the inner surface of the wall.
Buildings 15 01084 g006
Figure 7. The temperature and heat flux at Z1 and Z2 of the wall with different filling materials. (a) The temperature variation of different filling materials; (b) heat flux changes of different filling materials.
Buildings 15 01084 g007
Figure 8. Average heat flow on inner surface of different filling materials.
Buildings 15 01084 g008
Figure 9. Temperature and heat flux at Z1 under various working conditions. (a) High temperatures; (b) low temperatures; (c) high-temperature heat flux; (d) low-temperature heat flux.
Buildings 15 01084 g009
Figure 10. Heat flow passing through inner surface under different humidities.
Buildings 15 01084 g010
Figure 11. Temperature changes along the characteristic lines of the inner surface. (a) Temperature changes along specified line Z1. (b)Temperature changes along specified line Z2.
Buildings 15 01084 g011
Figure 12. Average heat flux through wall surface for different insulation layer thicknesses.
Buildings 15 01084 g012
Table 1. Thermal and hygroscopic physical property parameters.

Density
ρ
[kg/m3]
Specific Heat Capacity
c
[J/(kg·K)]
Thermal Conductivity
λ
[W/(m·K)]
Moisture Content
w
[kg/m3]
Water Vapor Permeability Coefficient
δv
[s]
Concrete [26]1800840 1.16 + 0.0032 w 153.108 φ 1 + 6.32 φ 6.038 φ 2 4.52 × 10 12 ϕ 5.32 + 1.48 × 10 12
Aerated block [19]615950 0.17 + 0.00098 w ϕ ( 0.1196 ϕ 2 + 0.1226 ϕ + 0.0011 ) 3.47 × 10 11
PU [27]3013800.028 0.034 ϕ ( 1 + 6.69 ϕ ) ( 1 0.808 ϕ ) 9.85 × 10 11 φ 9.44 + 1.63 × 10 12
EPS [19]301470 0.0331 + 0.00123 w 0.055 φ ( 1 + 8.267 φ ) ( 1 0.6315 φ ) 1.1 × 10 11
Glass wool [28]73850 0.0035 × ( T 263.15 ) 30 + 0.0283 4.1 3.57 1 + e ( φ 0.88073 ) 0.025 1.5 × 10 12
Table 2. Nodal loss of heat flow and heat flow loss rate of different filling materials.
Filled Aerated BlocksFilled Glass WoolFilled Concrete
RH 90%Heat TransferRH 90%Heat TransferRH 90%Heat Transfer
Q Z [W]16.0814.4314.9913.518.4116.67
Δ Q [W]1.300.890.09-3.633.11
β8.08%6.17%0.60%-19.72%18.65%
Table 3. Node heat loss and the rate of heat flow loss under various external operating conditions.
Relative Humidity Heat Transfer
93%90%80%60%30%
High temperature in summer Q Z [W]16.2516.0815.7615.3815.1414.43
Δ Q [W]1.421.301.141.030.950.89
β8.74%8.08%7.23%6.70%6.28%6.17%
Low temperature in winter Q Z [W]29.4229.3229.1128.9128.7727.26
Δ Q [W]2.202.121.981.871.801.56
β7.48%7.23%6.80%6.47%6.25%5.72%
Table 4. Node heat loss and heat loss rate of different insulation layer thicknesses.
30 mm50 mm70 mm80 mm
RH 90%Heat TransferRH 90%Heat TransferRH 90%Heat TransferRH 90%Heat Transfer
Q Z [W]22.5820.2316.0814.4312.5111.2311.2610.11
Δ Q [W]1.501.001.300.891.120.751.040.71
β6.64%4.97%8.08%6.17%8.95%6.62%9.23%7.0%
Table 5. Indoor and outdoor working conditions in hot summer and cold winter areas.
SummerWinter
IndoorOutdoorIndoorOutdoor
T = 26   φ = 60 % T = 30   φ = 40 80 % T = 18   φ = 60 % T = 1   φ = 60 85 %
Table 6. Average thermal resistance and heat transfer coefficient values of wall panels with different thicknesses.
SummerWinter
Insulation Layer Thickness T i T e q ¯ R ¯ K T i T e q ¯ R ¯ K
30 mm3.562.751.290.69415.1511.681.300.690
40 mm3.642.271.60.57115.479.651.600.571
50 mm3.701.941.910.48515.698.231.900.488
60 mm3.741.692.210.42415.867.182.210.424
70 mm3.761.502.510.37615.996.362.510.376
80 mm3.791.342.820.33716.095.722.810.338
90 mm3.811.223.130.30516.175.193.120.306
Table 7. Summer thermal conductivity and correction rates.
RH 40%RH 50%RH 60%RH 70%RH 80%
Insulation Layer Thickness K Ψ K Ψ K Ψ K Ψ K Ψ
30 mm0.7651.100.7681.110.7731.110.7791.120.7931.14
40 mm0.6361.110.6391.120.6431.130.6501.140.6591.15
50 mm0.5441.120.5471.130.5521.140.5571.150.5641.16
60 mm0.4761.120.4791.130.4821.140.4861.150.4931.16
70 mm0.4221.120.4251.130.4291.140.4331.150.4391.17
80 mm0.3811.130.3841.140.3861.150.3901.160.3951.17
90 mm0.3461.130.3481.140.3511.150.3541.160.3591.18
Table 8. Winter thermal conductivity and correction rates.
RH 60%RH 70%RH 80%RH 85%
Insulation Layer Thickness K Ψ K Ψ K Ψ K Ψ
30 mm0.7721.120.7741.120.7771.130.7791.13
40 mm0.6411.120.6431.130.6451.130.6481.13
50 mm0.5491.130.5511.130.5531.130.5551.14
60 mm0.4801.130.4821.140.4841.140.4861.15
70 mm0.4271.140.4281.140.4301.140.4321.15
80 mm0.3841.140.3851.140.3871.140.3891.15
90 mm0.3491.140.3501.140.3521.150.3541.16
Notes: Ψ : correction factor.
Disclaimer/Publisher’s Note: The statements, opinions and data contained in all publications are solely those of the individual author(s) and contributor(s) and not of MDPI and/or the editor(s). MDPI and/or the editor(s) disclaim responsibility for any injury to people or property resulting from any ideas, methods, instructions or products referred to in the content.

