Article

Research on the Vibration Propagation Characteristics of Non-Uniform Speed Trains Entering and Leaving Stations Based on Field Measurements

1
Guangdong-Hongkong-Macao Joint Laboratory of Energy Saving and Intelligent Maintenance for Modern Transportations, Guangzhou Railway Polytechnic, Guangzhou 511300, China
2
Zhejiang Taicheng Environmental Technology Co., Ltd., Taizhou 318000, China
3
School of Civil Engineering and Transportation, South China University of Technology, Guangzhou 510641, China
*
Author to whom correspondence should be addressed.
Buildings 2025, 15(7), 1091; https://doi.org/10.3390/buildings15071091
Submission received: 19 February 2025 / Revised: 9 March 2025 / Accepted: 25 March 2025 / Published: 27 March 2025
(This article belongs to the Special Issue Vibration Prediction and Noise Assessment of Building Structures)

Abstract

:
Urban rail transit systems, while alleviating traffic congestion, generate environmental vibrations that impact adjacent structures and residents, particularly during train acceleration and deceleration near stations. Existing research predominantly focuses on constant-speed operations, leaving a gap in understanding vibration propagation during variable-speed phases. This study investigates vibration characteristics and propagation behaviors using field measurements from a subway station in Foshan, China. Wireless vibration sensors were deployed across nine measuring points at varying distances (15–35 m) from the subway station’s external wall, capturing time-domain and frequency-domain data during train operations. The analysis incorporated China’s JGJ/T 170-2009 standards, evaluating vibration acceleration levels (VAL) and 1/3 octave band spectra. Key findings revealed background vibrations (0–10 Hz) exhibited negligible interference, whereas vehicle-induced vibrations (40–60 Hz) demonstrated directional disparities: urban-bound trains produced higher accelerations (0.004–0.008 m/s2 vertically) than suburban-bound ones (0.001–0.005 m/s2) due to track damping measures and propagation distance. Vibration attenuation with distance was found to be non-linear, influenced by soil hardening and train speed. Vertical vibrations near the station (15 m) approached the 70 dB regulatory limit, emphasizing proximity risks. Doppler effects were observed during train acceleration/deceleration, though data limitations precluded precise quantification of speed impacts. This work supplements knowledge on non-uniform train-induced vibrations, offering insights for urban planning and mitigation strategies.

1. Introduction

In conjunction with the sustained momentum of China’s economic growth and urbanization, the urban rail transit system has experienced rapid development [1,2,3]. Characterized by substantial capacity and swift transit capabilities, this system serves as an efficacious solution to mitigate urban traffic congestion, thereby emerging as the preferred choice of urban transportation for the majority of the residents [4,5,6]. However, as cities expand vertically and horizontally, the environmental vibrations induced by subway operations have emerged as a critical concern. Particularly, when the subway trains enter and exit the station, vibrations are transmitted through the track bed and soil to adjacent commercial buildings and residential structures, resulting in floor vibrations [7,8]. These vibrations not only imperil the structural integrity of buildings but also disrupt the daily lives and work of nearby residents [9,10]. Moreover, such vibrations may precipitate damage to the buildings’ decorative layers, such as the fracturing or detachment of paint. Prolonged exposure to vibrations can also exert a variety of adverse effects on human health, including disturbances to vision, movement, and concentration, culminating in diminished work efficiency, fatigue, and even safety incidents [11,12,13]. Consequently, an in-depth investigation into the environmental vibrations caused by subway operation is of paramount importance [14,15,16].
Existing research predominantly focuses on vibration characteristics generated by constant-speed train operations. Researchers engage in the development of vibrational models of trains and track systems to study the vibration responses of trains traversing diverse tunnel tracks [17,18,19,20], focusing on the variations in the intensity of vibrational sources, the design of trains, and the types of tracks. For instance, Huang et al. delved into the vibrational characteristics of trains navigating through cured tracks [12], whereas Zhang conducted an exploration into the deformation resistance and seismic mitigation properties of various ballast bed configurations under the influence of train-induced vibrations [21]. Additionally, researchers have constructed comprehensive dynamic interaction models integrating wheel-track-soil systems and soil-pile-building structures, thereby elucidating the impact resultant from wheel–rail collisions instigated by vehicles [22,23,24]. For instance, Tao et al. developed semi-analytical models to predict train-induced vibrations in multi-layered soils [23]. Utilizing these analytical model analyses and field measurement data [15,16,25], as well as the numerical models to forecast the vibrational impact of train operations on buildings [26,27,28], researchers have also proposed a range of vibrational mitigation strategies [10,27,29,30]. For instance, Jin et al. demonstrated the efficacy of resonant floating slabs in mitigating structural responses [29].
In conclusion, most existing studies on environmental vibrations caused by subway trains focus on the impacts of trains traveling at constant speeds. Notably, there are few studies pertaining to the effects of trains during variable speed operations, especially during the acceleration and deceleration phases. The vibration characteristics and propagation mechanisms generated during these acceleration and deceleration phases significantly impact environmental vibrations during the startup and braking phases of subway trains [31,32]. Taking an existing railway station and a proposed construction project under construction as the background, this study adopts the computational method prescribed by extant normative standards to scrutinize the vibrational propagation patterns of subway trains in both the time and frequency domains, utilizing data from the experiment results. Specifically, the study examines three key aspects: the orientation of the route toward and away from the station, the acceleration or deceleration of the train during entry or exit of the station, and the distances from the subway station’s outer wall. By analyzing the vibration characteristics and propagation behaviors generated during the acceleration and deceleration processes of trains, the research fills a critical gap by providing an enhanced understanding of environmental vibrations caused by subway trains under non-uniform operational states, thereby furnishing a more robust scientific foundation for the investigation into the vibration characteristics resultant from subway operations.
Against the backdrop of an operational railway station and an ongoing construction project, this study employs the computational methodologies prescribed by current standards to investigate the vibration propagation rules of subway trains in both the time and frequency domains based on experimental results. The research examines three key aspects: the direction of the route to and from the station, the distance from the subway station’s outer wall, and others. By analyzing the vibration characteristics and propagation rules during train acceleration and deceleration, this study augments the research on environmental vibrations caused by subway trains in non-uniform operational states, thereby providing a more comprehensive scientific foundation for the investigation of vibration characteristics resulting from subway operations.

2. Materials and Methods

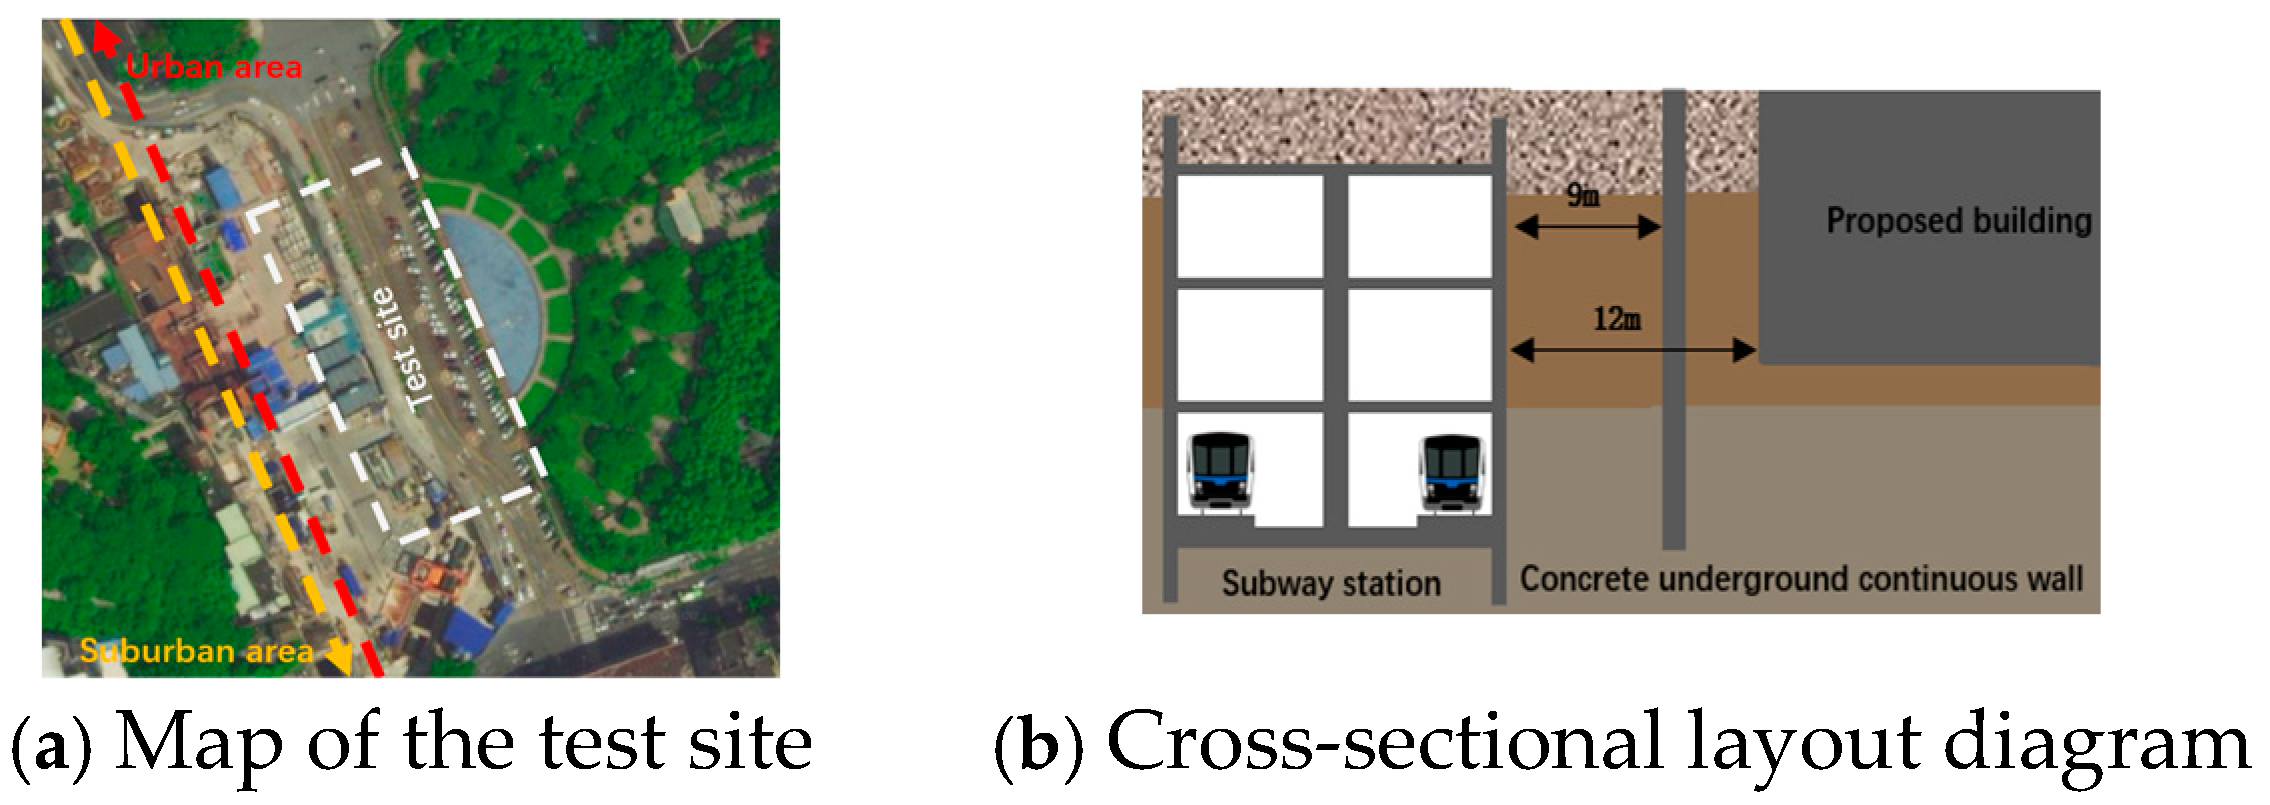
2.1. A Brief Review of the Experimental Site

The experimental site is located in a planning parking lot adjacent to a subway station in Foshan, Guangdong, China. During experiments, construction of the parking lot was underway, and the area had been smoothed over. The subway station, which commenced operations at the end of 2022, is an underground three-level island station with the first floor at a depth of 9.9 m, the second floor at 16.95 m, and the third floor at 24.1 m. The platform covers an area of 18,050 m2, spans 120 m in length, and 11 m in width, and features three entrances and exits. The testing line is served by a type B train. Due to the dynamics of acceleration and deceleration as trains enter and exit the subway station, the trains’ average speed ranges between 35 km/h and 45 km/h. No vibration mitigation measures are in place along the line segment leading from the station toward the urban area, whereas a medium level of vibration mitigation measures is applied in the direction of the suburbs. Specifically, no vibration reduction measures are implemented on the track adjacent to the experimental site. The map, and cross-sectional layouts of the test site are illustrated in Figure 1a and Figure 1b, respectively.

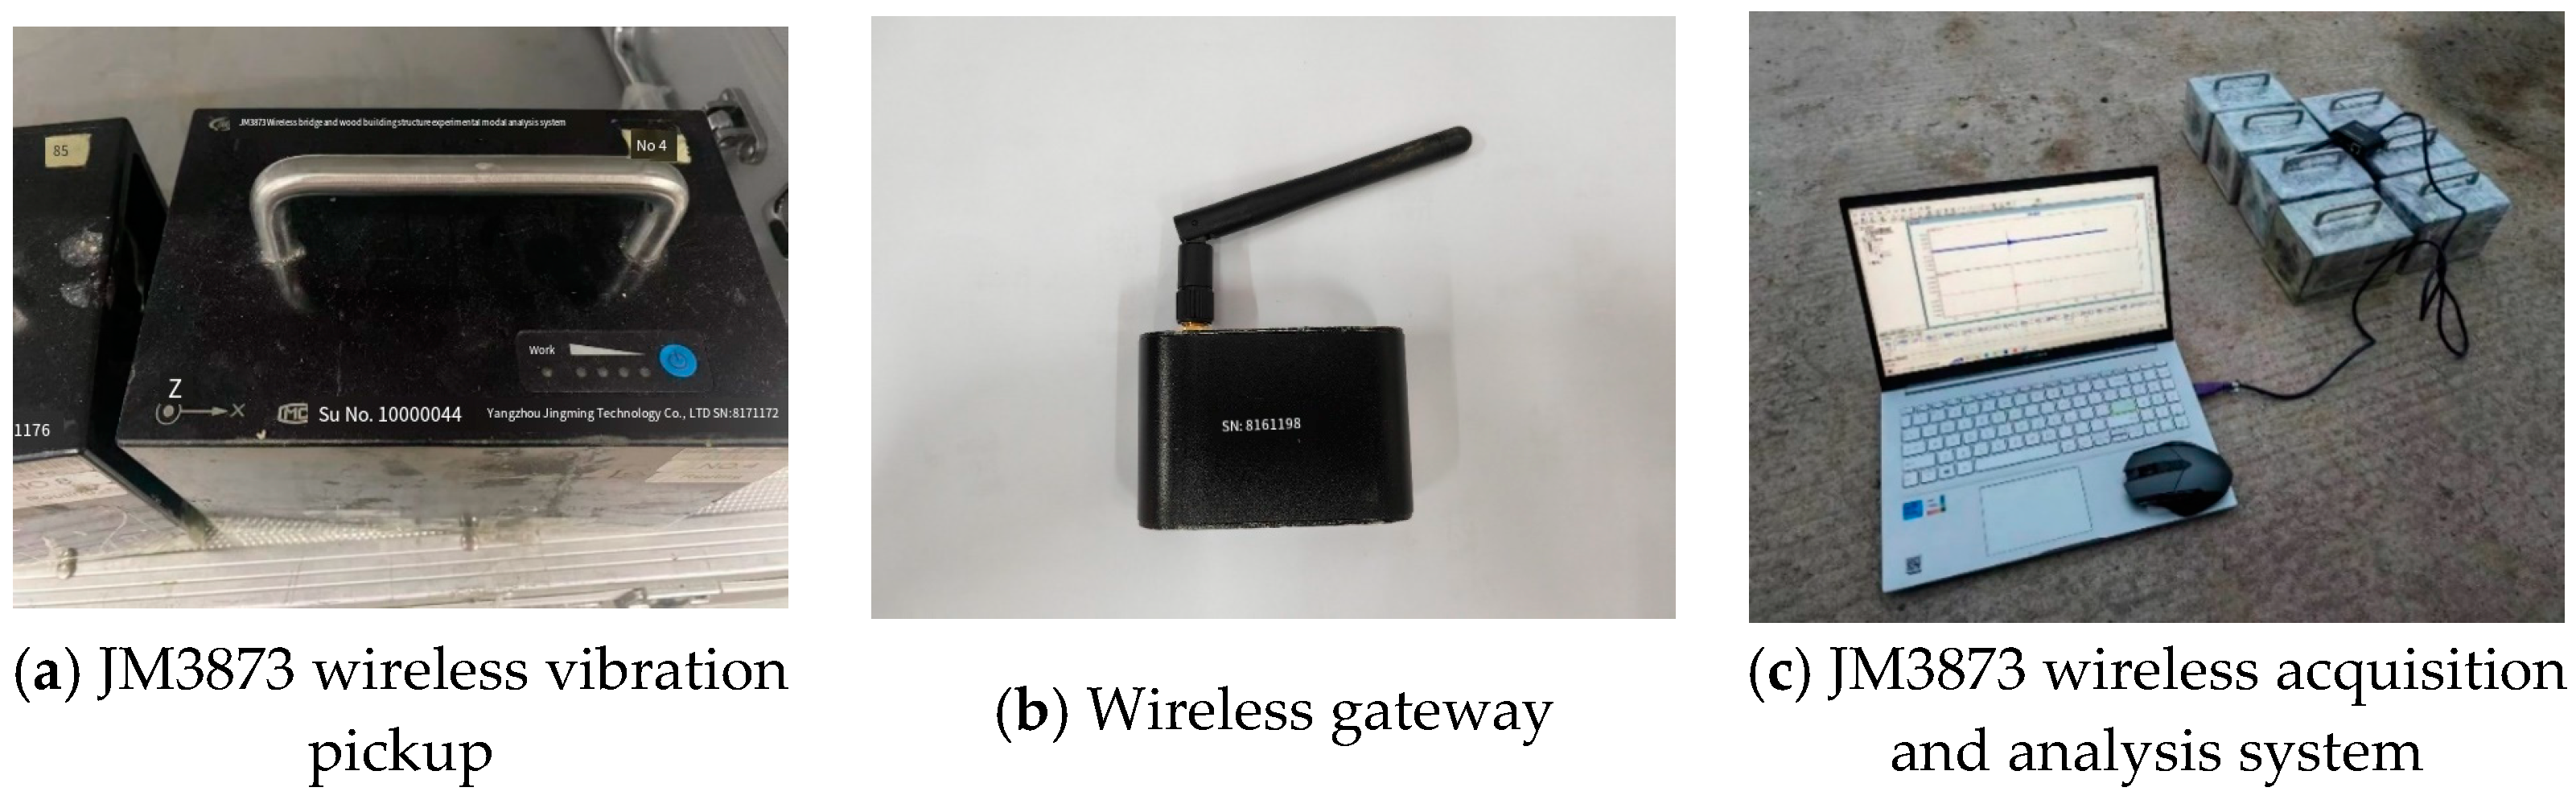
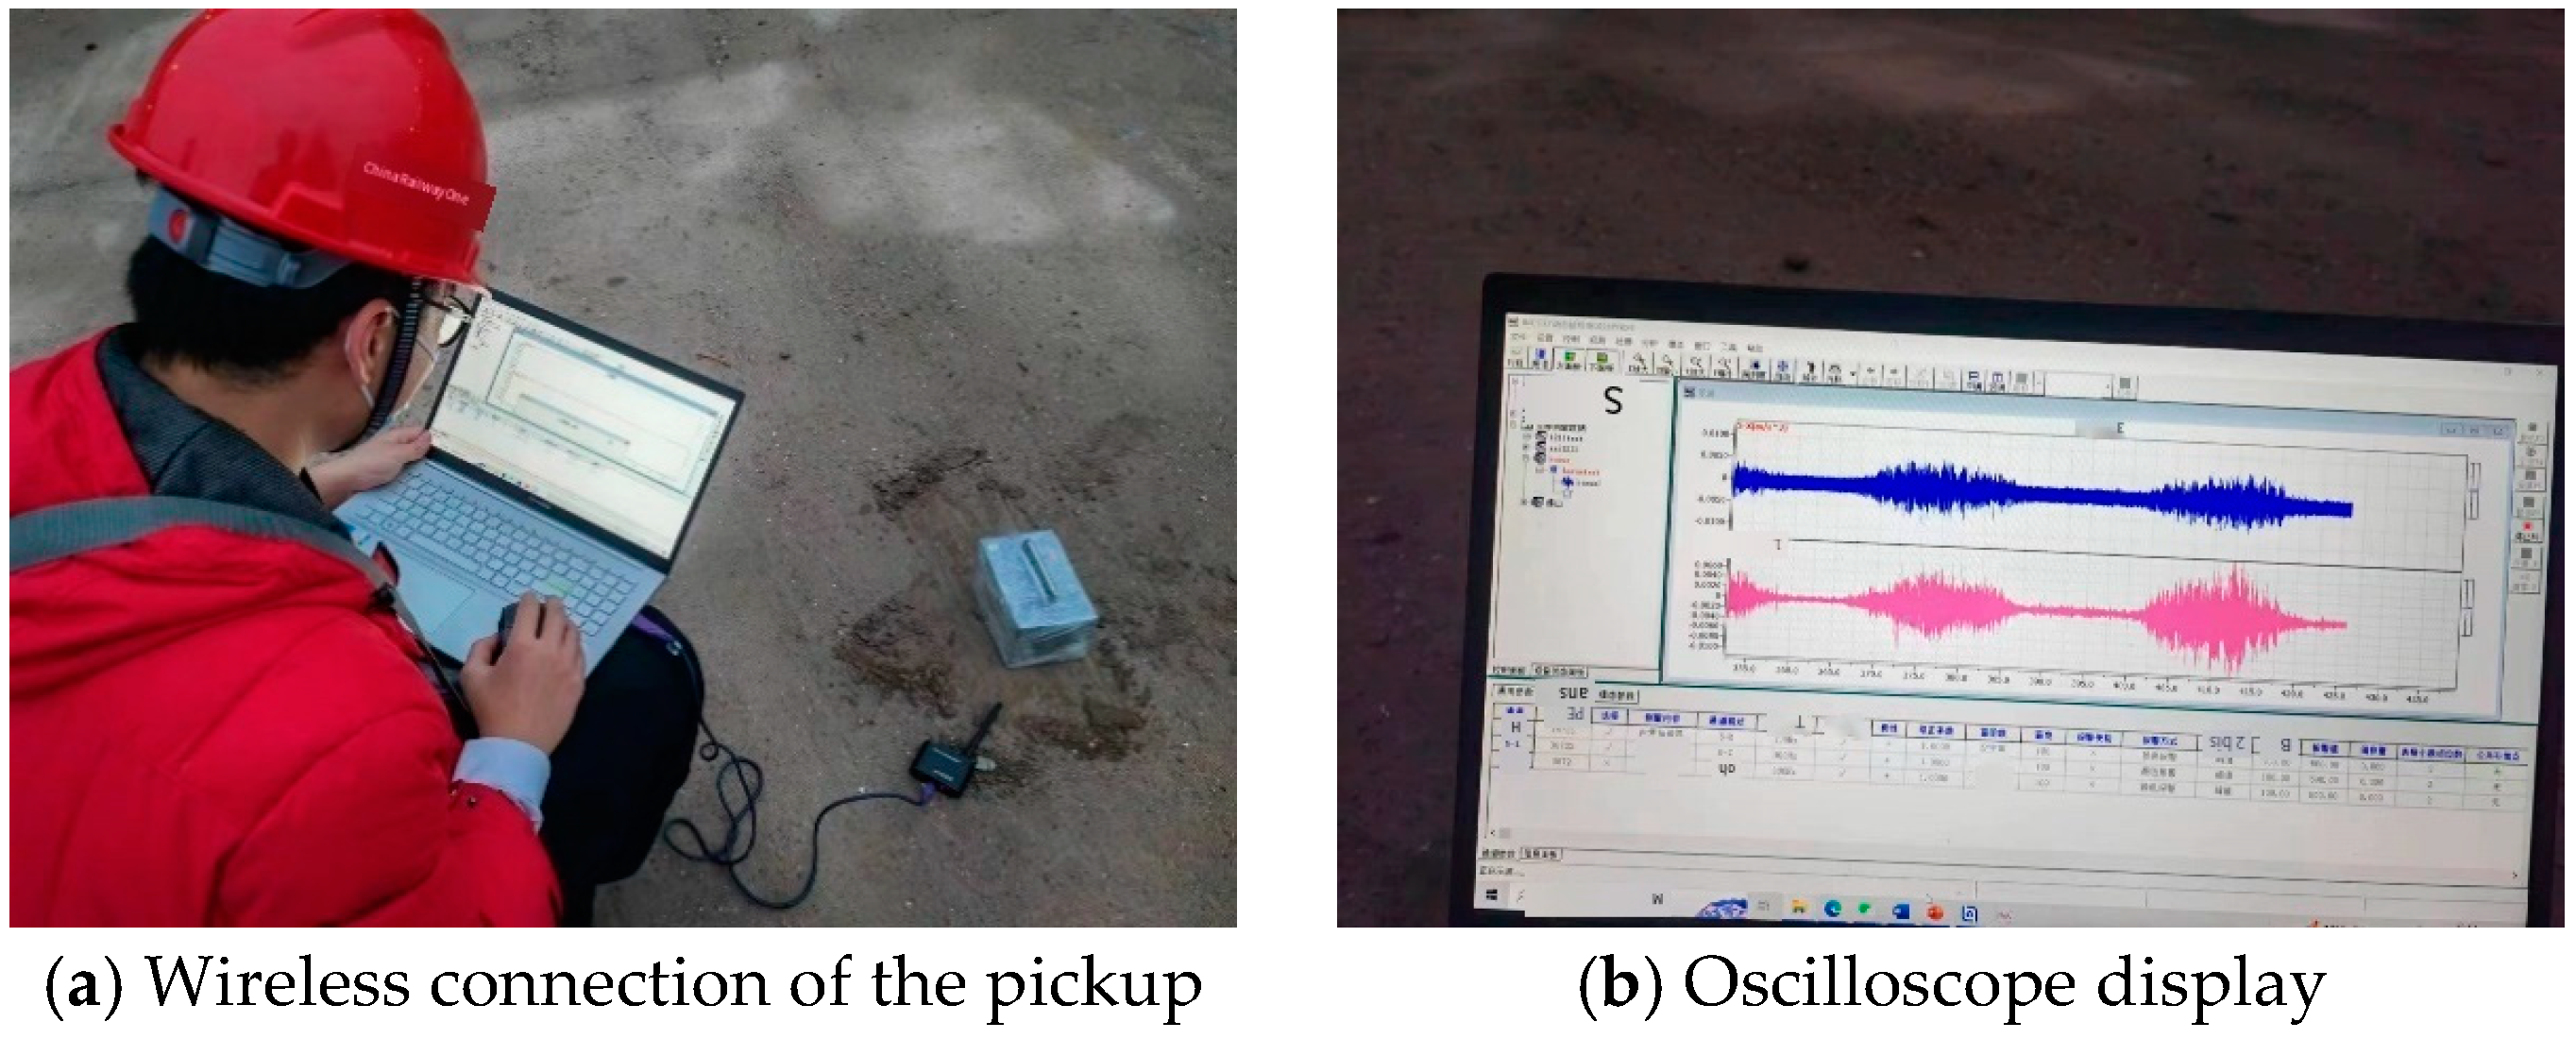
2.2. Experimental Instruments

In this research, the JM3873 wireless vibration pickup, wireless gateway, and JM3873 wireless acquisition and analysis system were utilized for the acquisition and recording of signals, as depicted in Figure 2. Wireless sensors offer continuous deformation monitoring, while their non-intrusive deployment ensures minimal interference [33]. The JM3873 wireless vibration pickup is equipped with integrated horizontal and vertical 941 B vibration pickers, while requiring pre-setting before operation.
By connecting all the vibration pickups to the computer via the wireless gateway, an oscilloscope was used to ascertain the suitable sampling range and frequency, as illustrated in Figure 3. To guarantee the integrity and reliability of the data, the vibration pickup’s horizontal and vertical range was set to −0.01~0.01 m/s2 for this test. The sampling frequency was set at 512 Hz, satisfying the Nyquist–Shannon criterion for frequencies up to 256 Hz. This ensured accurate capture of frequency components up to 256 Hz, as validated in similar studies. Continuous data acquisition was conducted during off-peak hours from 18:30 to 23:30 at night, encompassing a total duration of 5 h.

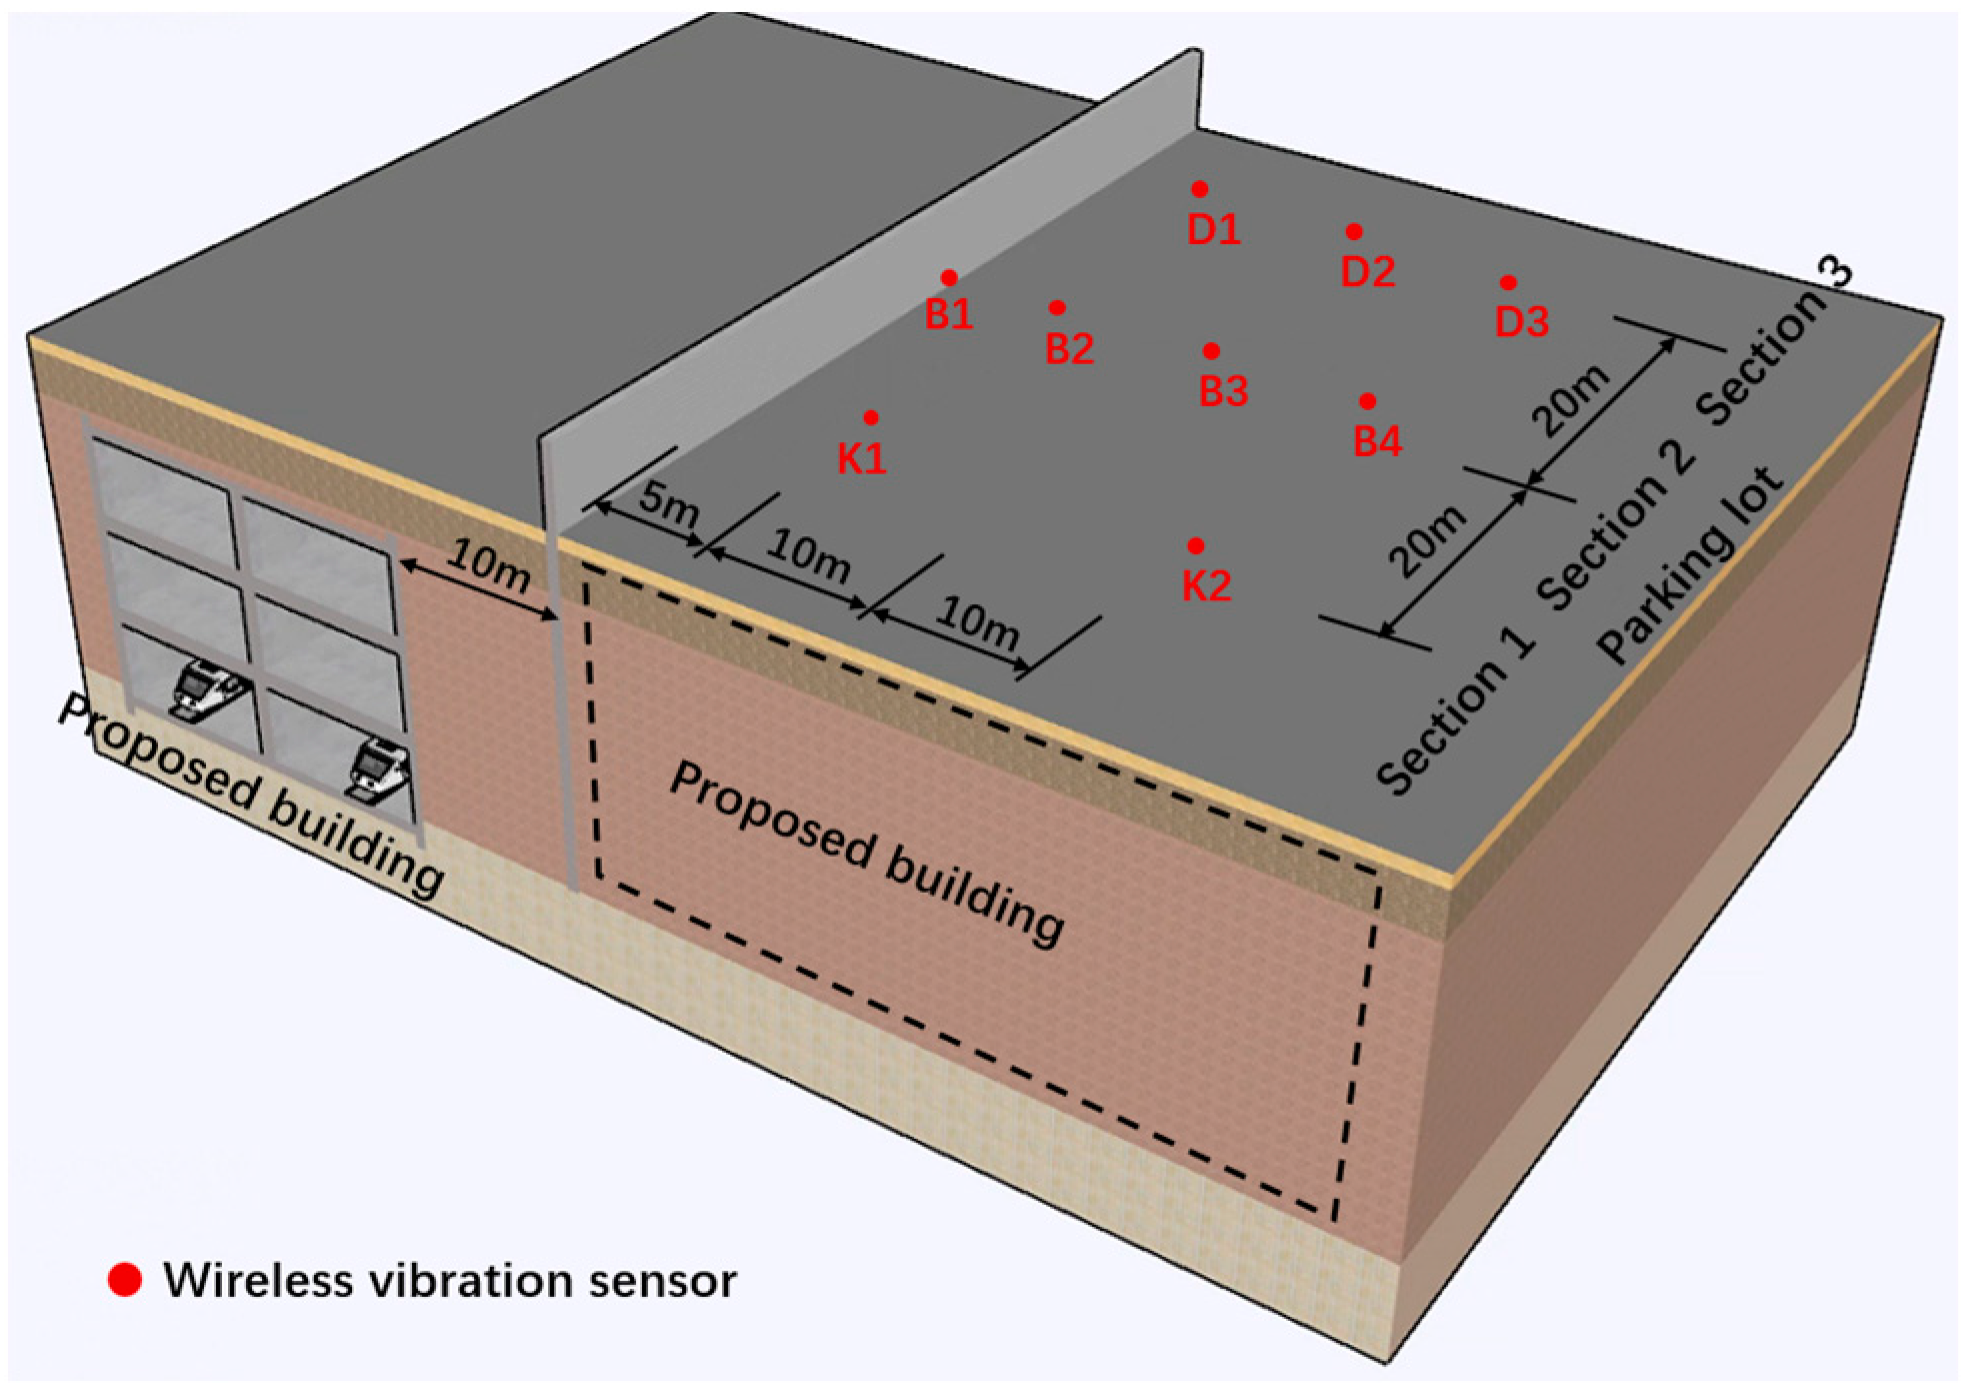
2.3. Layout of Measuring Points

In the field test, there were 9 measuring points in total, established at three cross-sectional transects along the axis of the railway. Each transect was positioned at intervals of 20 m, all situated on the existing ground surface of the proposed site, as depicted in Figure 4. The closest measuring points are 10 m away from the subway station’s enclosing structure, with the layout 1 m within the perimeter of the proposed site’s enclosing structure. Section 1 is located on the left side of the parking lot, with two measuring points, K1 and K2, perpendicular to the direction of the railway. K1 is 15 m away from the outer wall of the subway station, and K2 is 20 m away from K1. Section 2 is situated centrally within the parking lot, perpendicular to the railway direction, with 4 measuring points: B1, B2, B3, and B4. The measuring point B1, which is nearest to the parking lot’s outer wall, is set 10 m away from the subway station’s outer wall, with B2 located 5 m from B1, and B3 and B4 placed 10 m apart from B2 and B3, respectively. Section 3 is positioned on the right side of the parking lot, perpendicular to the railway direction, with 3 measuring points: D1, D2, and D3. The measuring point D1 is situated 15 m away from the subway wall, with D2 and D3 placed 10 m away from D1 and D2, respectively. The main purpose of setting three sections is to evaluate the influence of train acceleration and deceleration-induced vibrations across different transects.

2.4. Vibration Evaluation Index

The vibration generated by train operation comprises a combination of vibrations at various frequencies. For such a complex vibration signal, the energy level is commonly used as a metric for assessment. Therefore, through an analysis of the time domain and frequency domain, the maximum vibration level of frequency division in JGJ/T170-2009 is utilized to evaluate the vibration and the limits of secondary radiation noise in buildings resulting from urban rail transit.

2.4.1. Vibration Acceleration Level

The vibration acceleration level (VAL) is the fundamental metric for characterizing the overall vibration environment’s intensity, quantified in dB, as shown in Equation (1):
V A L = 20 log 10 ( a e a 0 )
where a e denotes the effective value of vibration acceleration, and a 0 represents the base acceleration, which is set to 10 6 m/s2. The effective value of vibration acceleration ( a e ) is defined, as shown in Equation (2):
a e = 1 T 0 T a i ( t ) d ( t )
where a i ( t ) is the acceleration value at a specific time ( t ), d ( t ) is the integration time, and T is the duration of the measuring time.

2.4.2. Maximum Vibration Level of Frequency Division

In the “Standard for limit and measuring method of building vibration and secondary noise caused by urban rail transit” (JGJ/T 170-2009) of China’s current industry standard, the maximum vibration level within specific frequency divisions, denoted as V L m a x , is used to access the environmental vibration of rail transit. This evaluation is determined through a 1/3 octave analysis of the vertical lead vibration acceleration, adjusted by a weight factor, as illustrated in Table 1. There are mainly three calculation methods: the linear average method, the peak-preserving method, and the maximum-preserving method [34,35,36]. Unlike root-mean-square (RMS)-based approaches, which average energy over time and may obscure short-duration peaks, the peak-preserving method retains maximum acceleration values within each 1/3 octave band. This is critical for assessing intermittent high-amplitude events, such as wheel–rail impacts during braking or startup, which are pivotal for structural fatigue analysis. The peak-preserving method was selected for vibration evaluation due to its efficacy in capturing transient vibration characteristics during train acceleration and deceleration. Based on comparative calculations of the Z-weighting factor for vibration acceleration across different algorithms, this study employs the peak-preserving method. For the experimental site, which is classified as a commercial mixed area, the vibration limit is set at 70 dB during daytime hours.

3. Results and Discussions

3.1. Analysis of Background Vibration Impact

To ensure that the interference from background vibration can be discounted, a comparative analysis of the background vibration and vehicle-induced vibration was conducted at each measuring point, both in the time domain and frequency domain. As all the measuring points were situated within the parking lot during the experiment, nighttime was chosen to ensure that no construction activities were taking place in the parking lot. During the analysis of background vibration, three measuring points located 15 m, 25 m, and 35 m from the subway station’s outer wall were selected from each of the three sections. The results for the other measuring points were consistent with the analyzed data, as shown in Figure 5 and Figure 6. The time-domain analysis revealed that the influence of background vibration was relatively insignificant in both the vertical and horizontal directions. Specifically, the amplitude of the background vibration acceleration remained below 3 × 10 4 m/s2 in both directions, suggesting that the background vibration had a negligible effect on the vibration caused by the train. Furthermore, in the frequency-domain analysis, the primary frequency distribution of background vibration was within 0~10 Hz, while the main frequency distribution of vehicle-induced vibration was within 40~60 Hz, indicating that the background vibration had minimal impact on the dominant frequency of the vehicle-induced vibration. In conclusion, the background vibration at the experimental site had a minor influence on the experiment results.

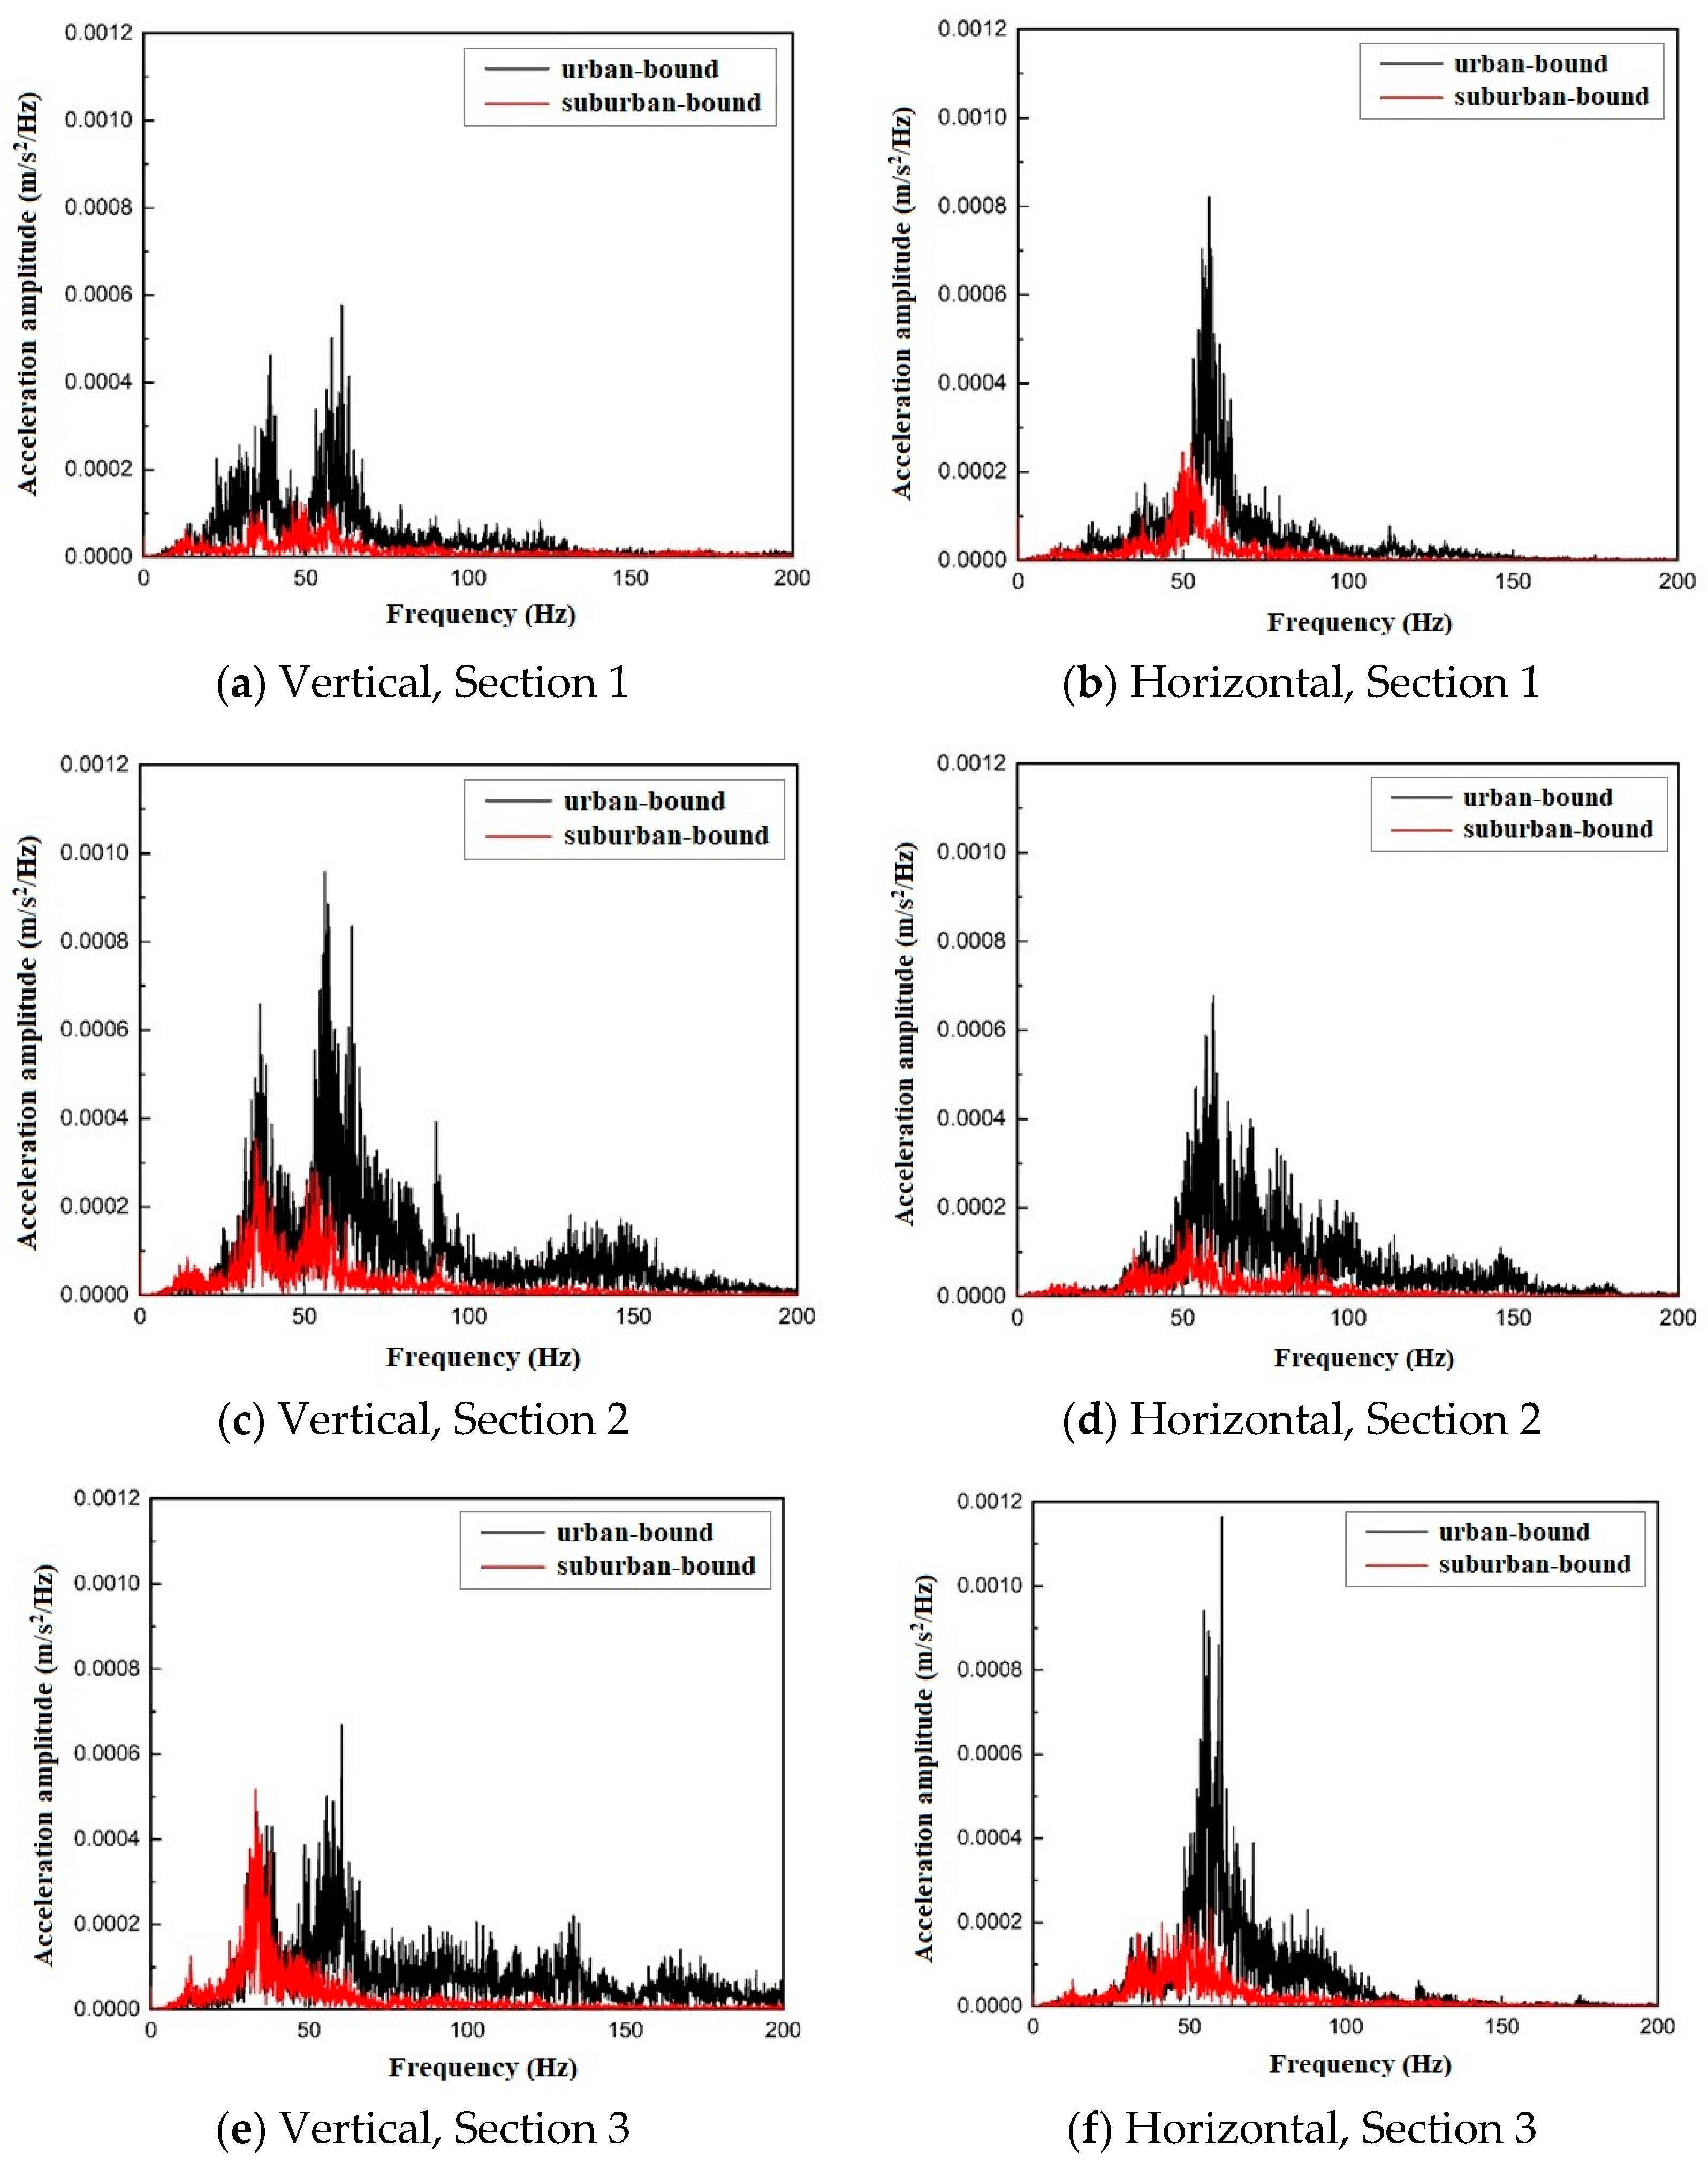
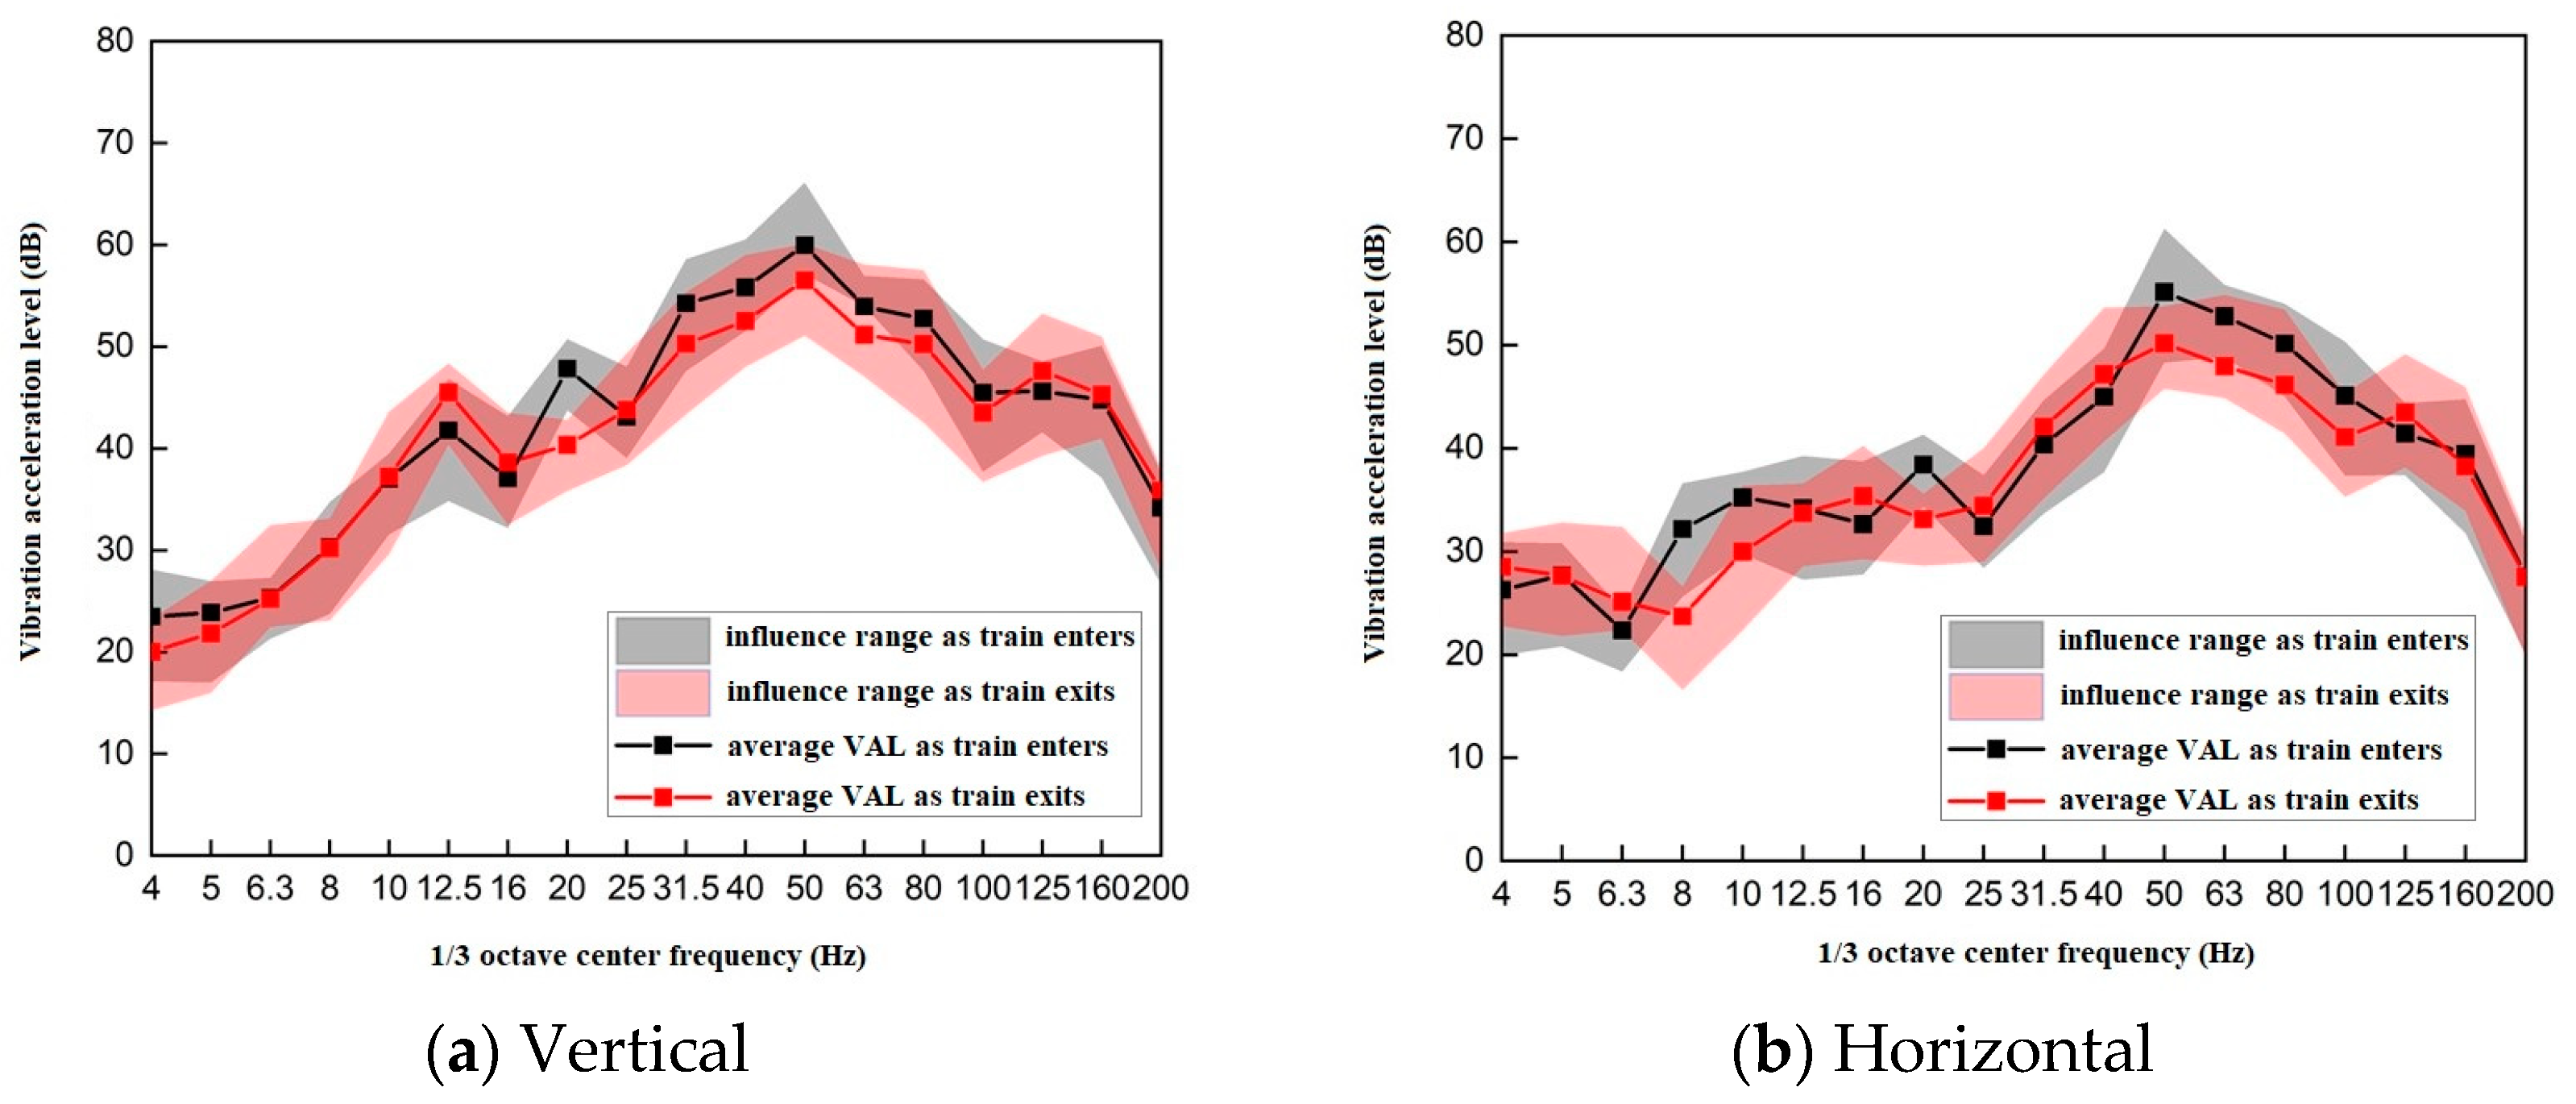
3.2. Vibration Propagation Rules of Trains Running in Different Line Directions

An analysis was conducted on the vibration propagation dynamics of trains traveling in different line orientations, viz. urban-bound and suburban-bound directions, through the examination of both time-domain and frequency-domain perspectives. Specifically, the vehicle-induced vibration signals captured at the measurement points 15 m away from the subway station’s outer wall across each test section were subjected to rigorous examination. The time-domain analysis examined the vibration signal amplitude changes with time, while the frequency-domain analysis employed the fast Fourier transform to transform the signal into a frequency-based representation, with the corresponding amplitude expressed as a functional dependency.
During the testing phase, a compendium of 99 vehicle-induced vibration signals was recorded, encompassing four types: inbound and outbound signals in the urban direction, as well as inbound and outbound signals in the suburban direction. Notably, the track structure oriented toward the urban district has not implemented vibration mitigation measures and is situated in close proximity to the proposed construction (proximate track). Conversely, the track structure directed toward the suburban district features an integrated track bed and utilizes medium vibration damping fasteners, positioning at a considerable distance from the proposed construction (distant track).

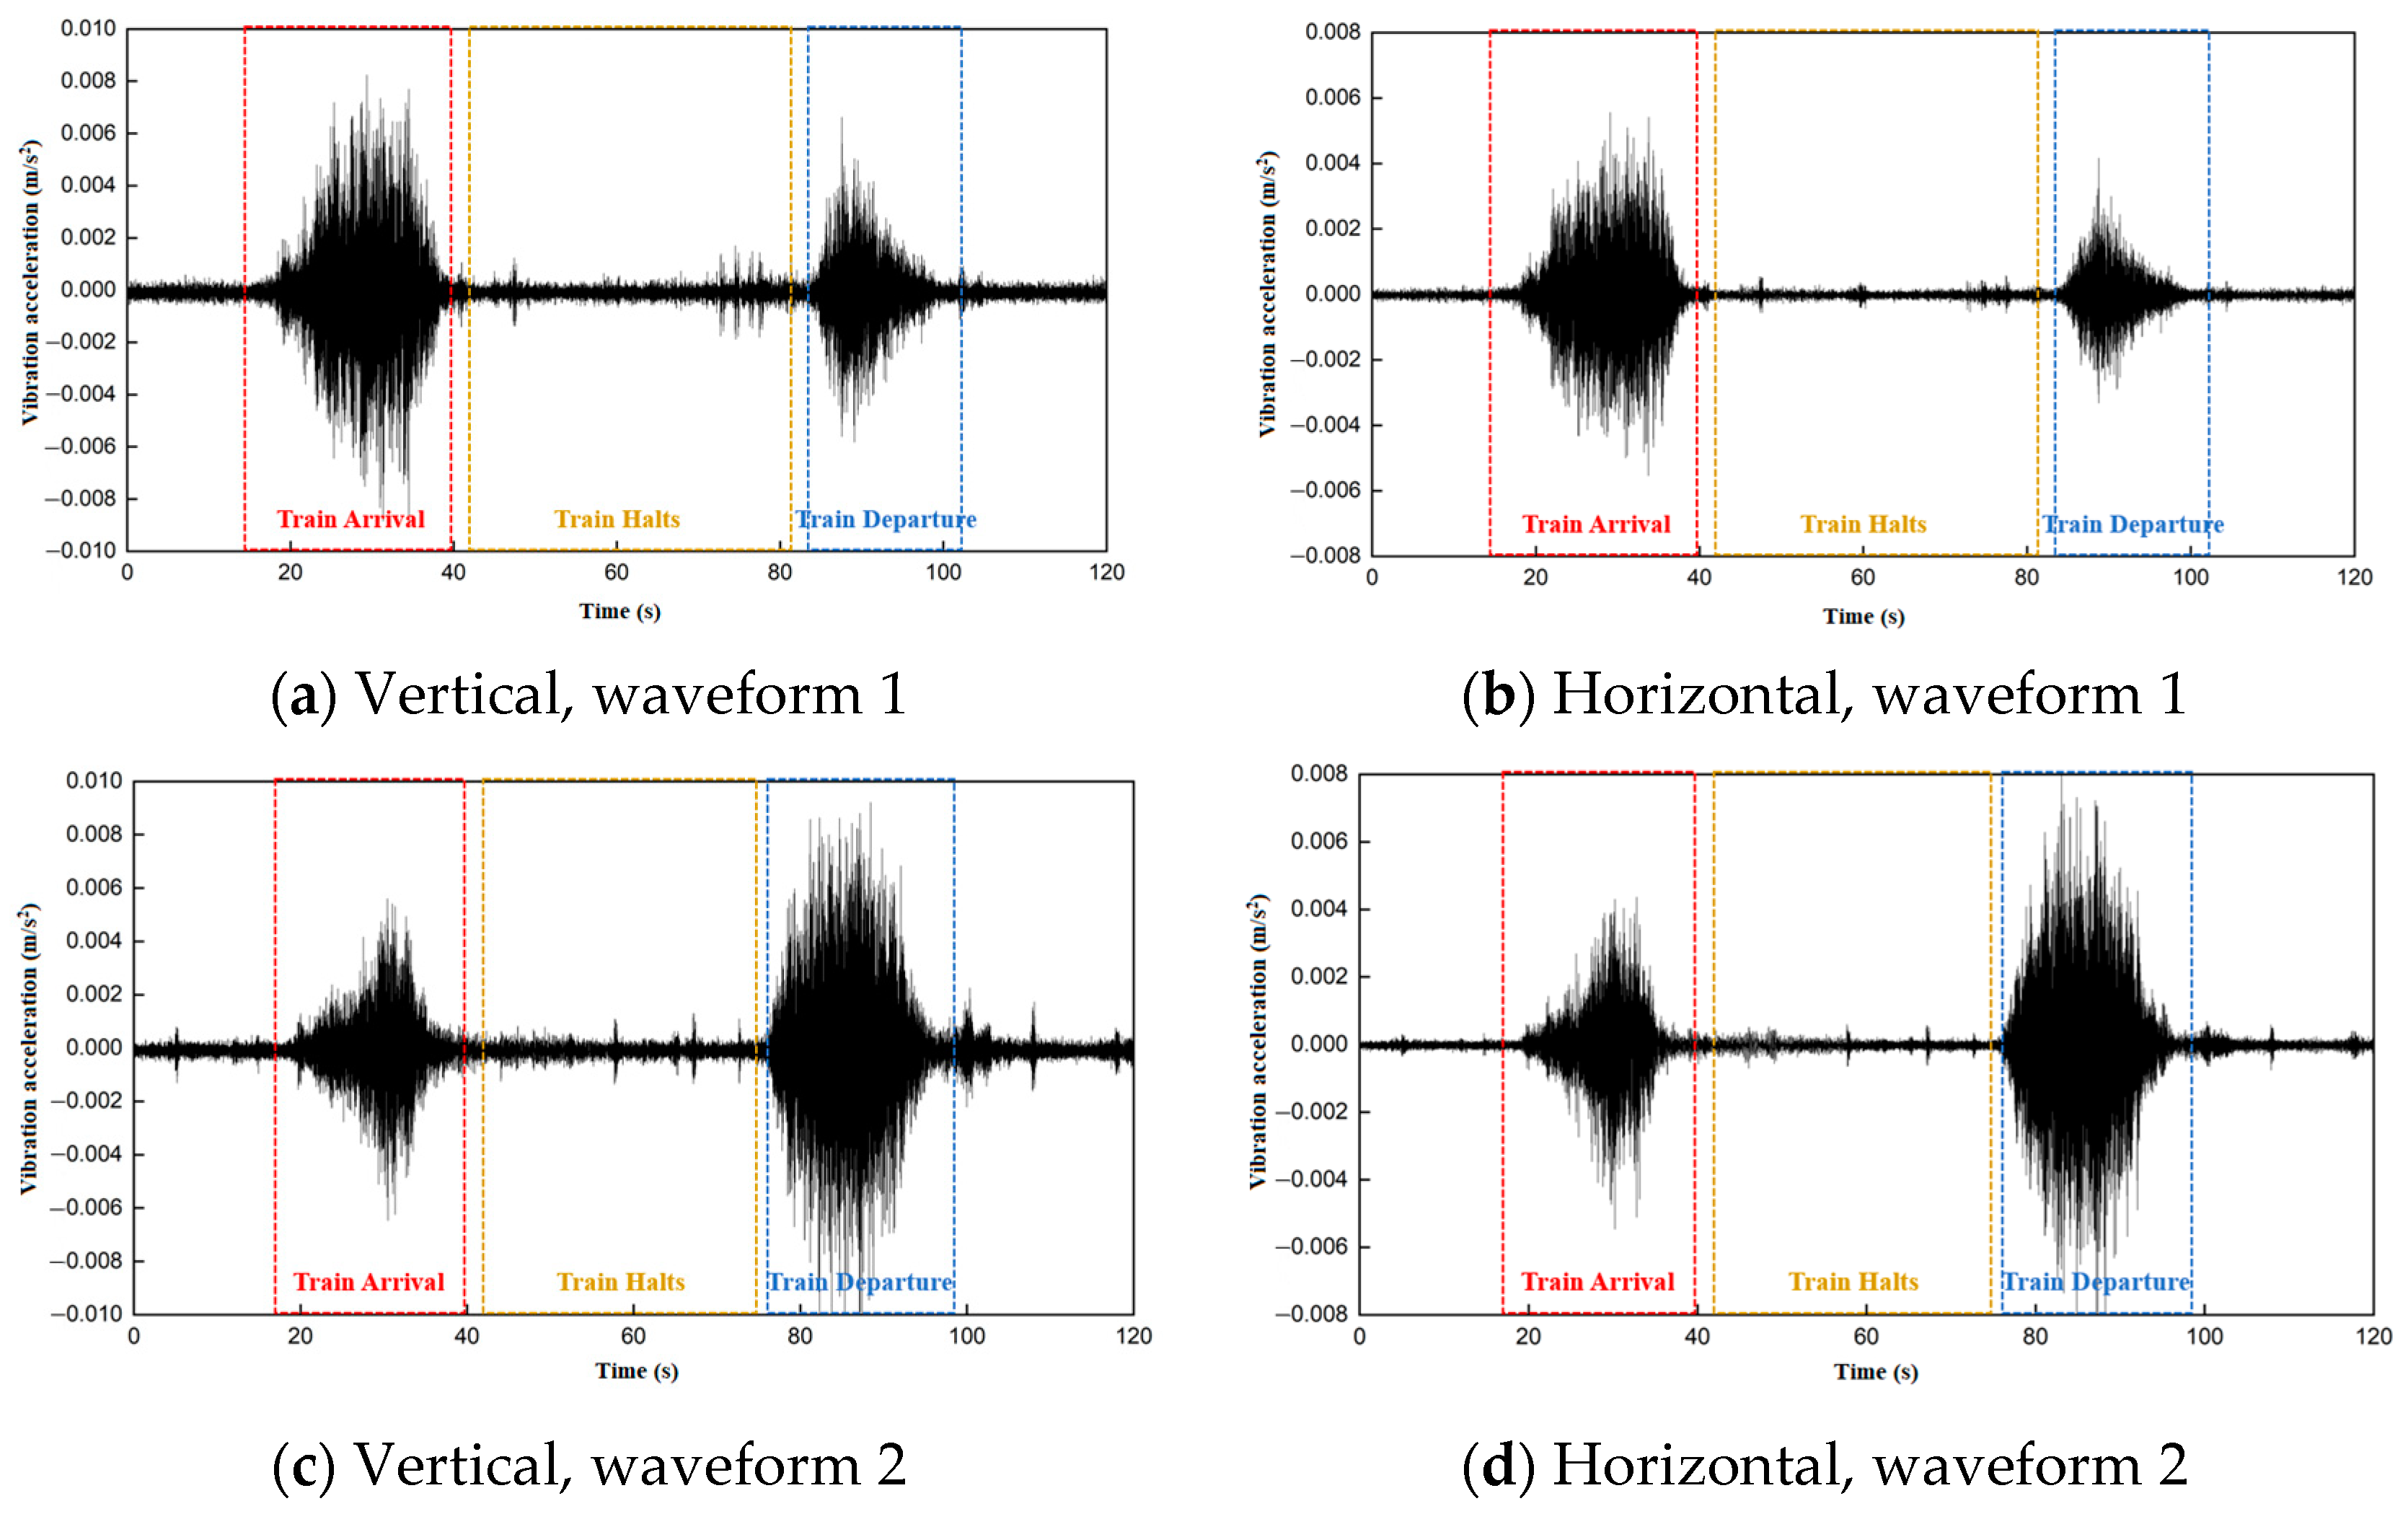
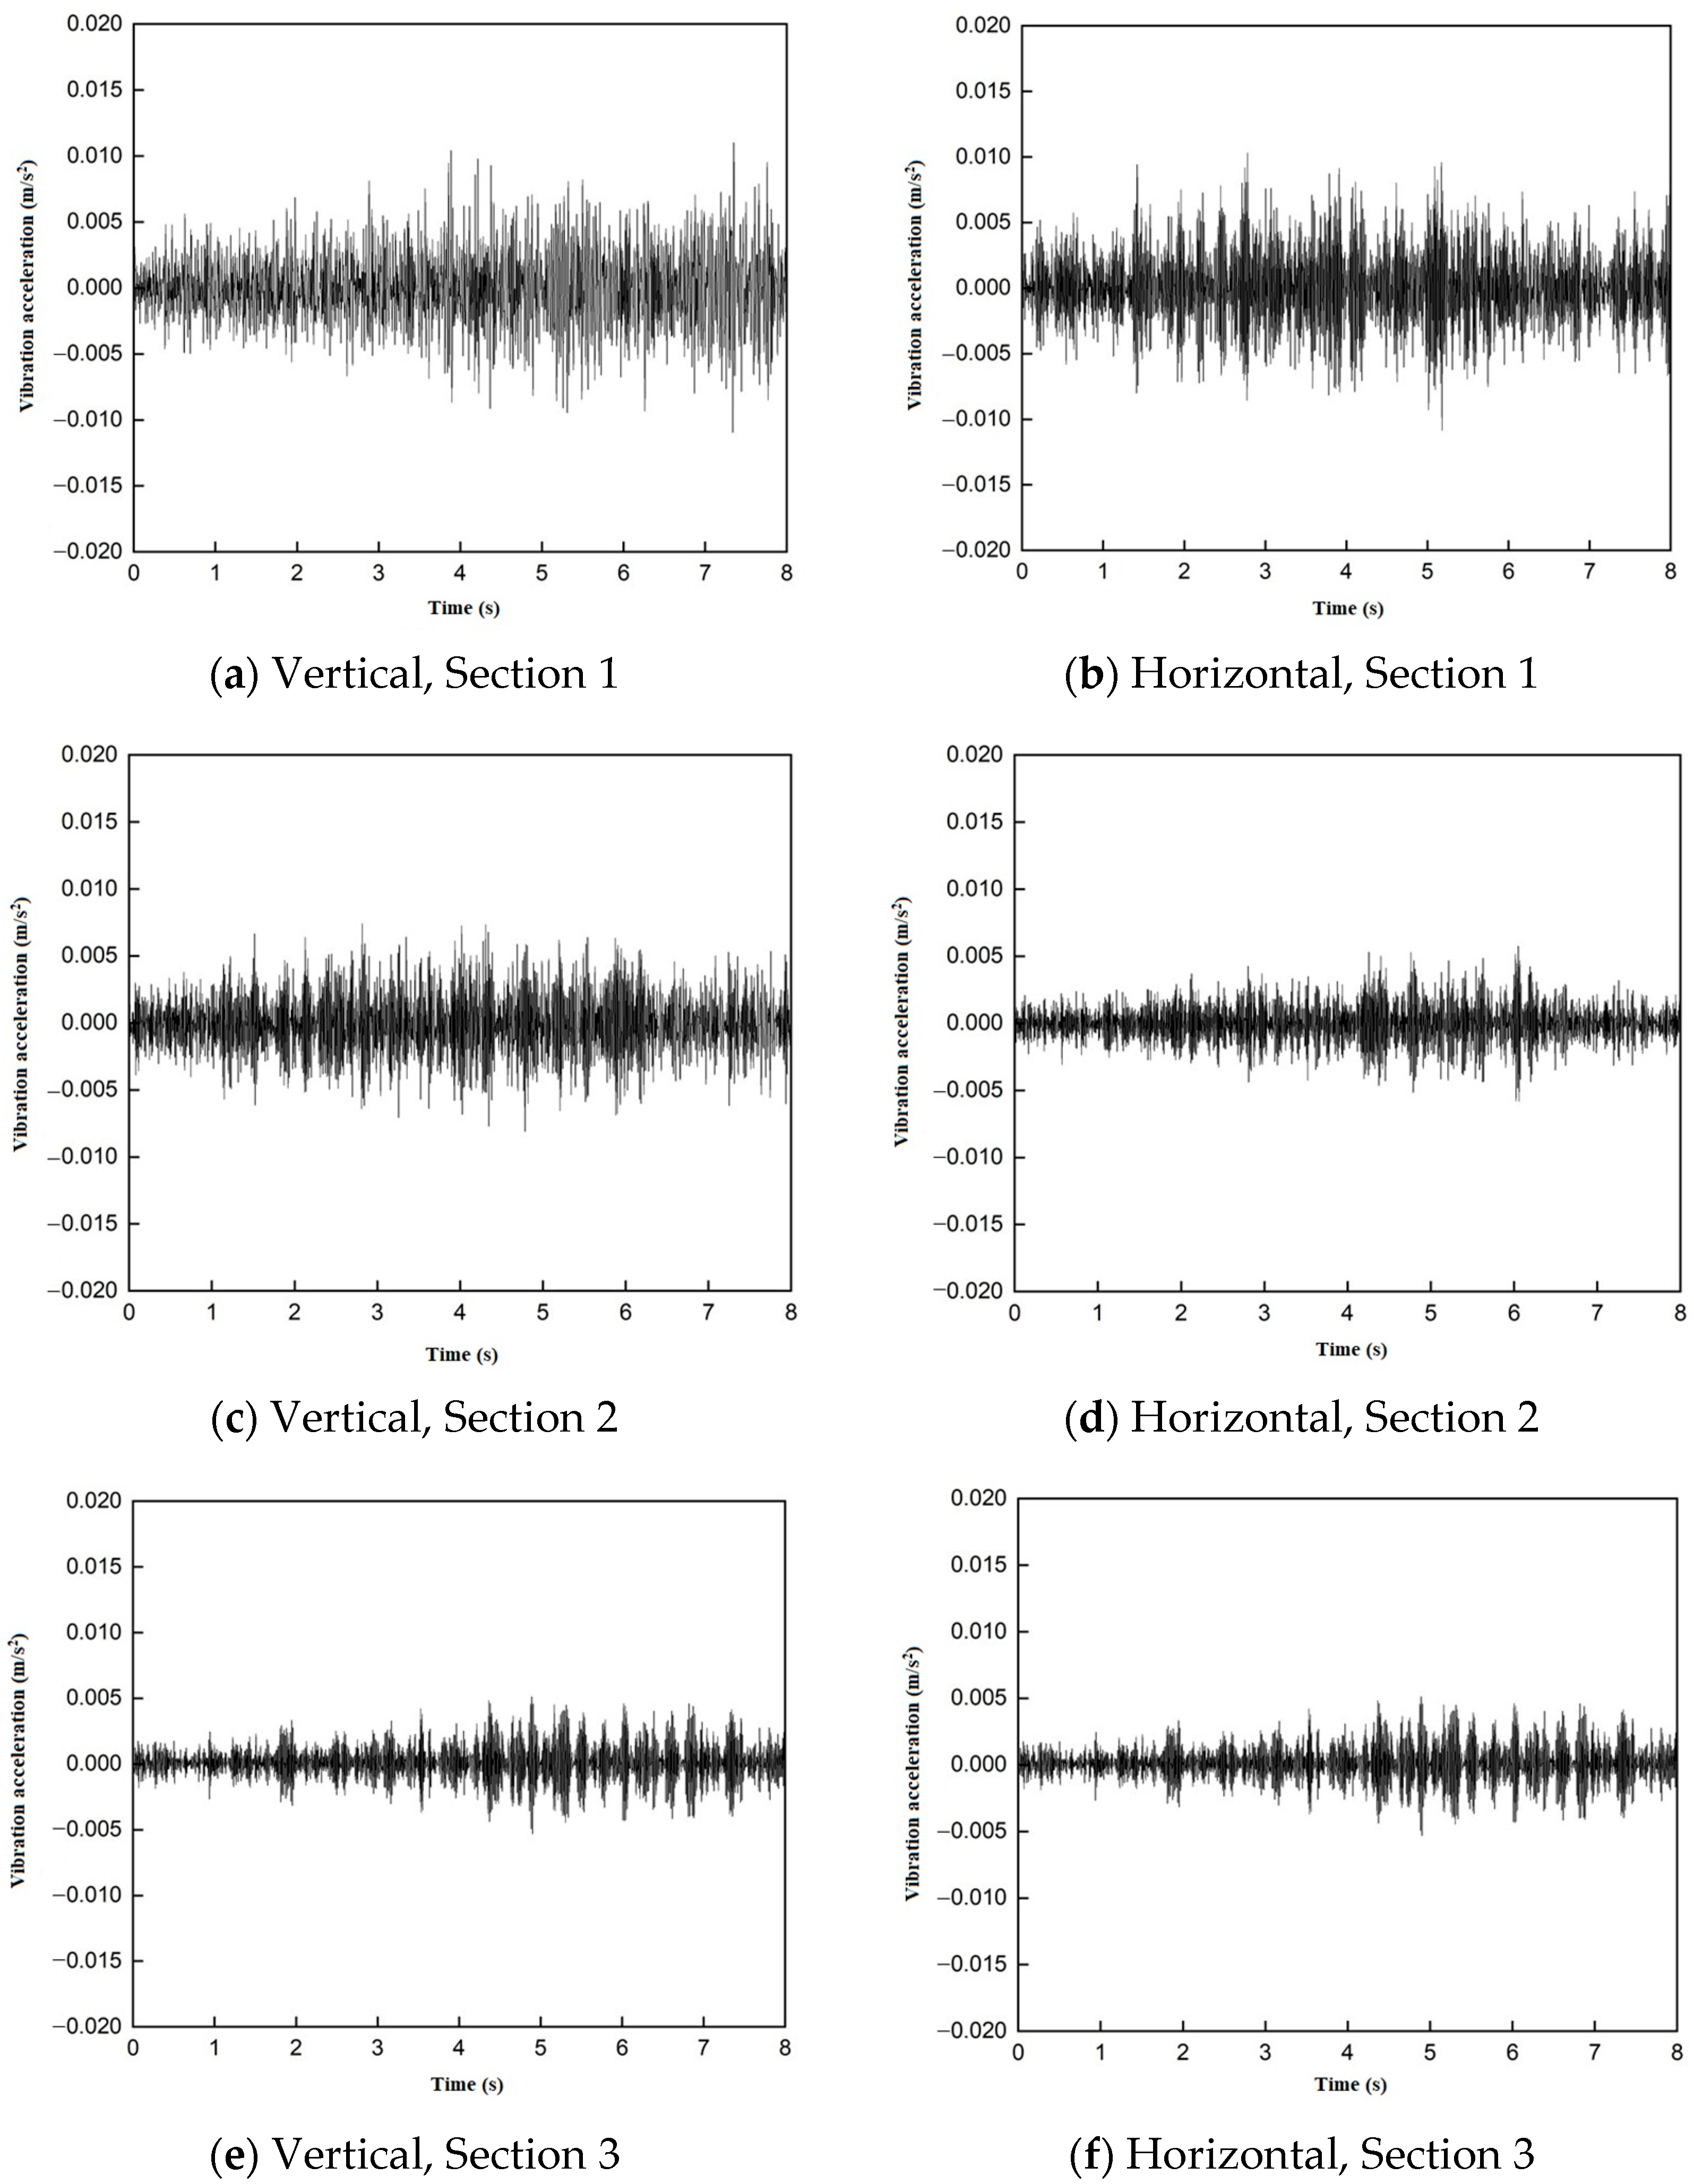
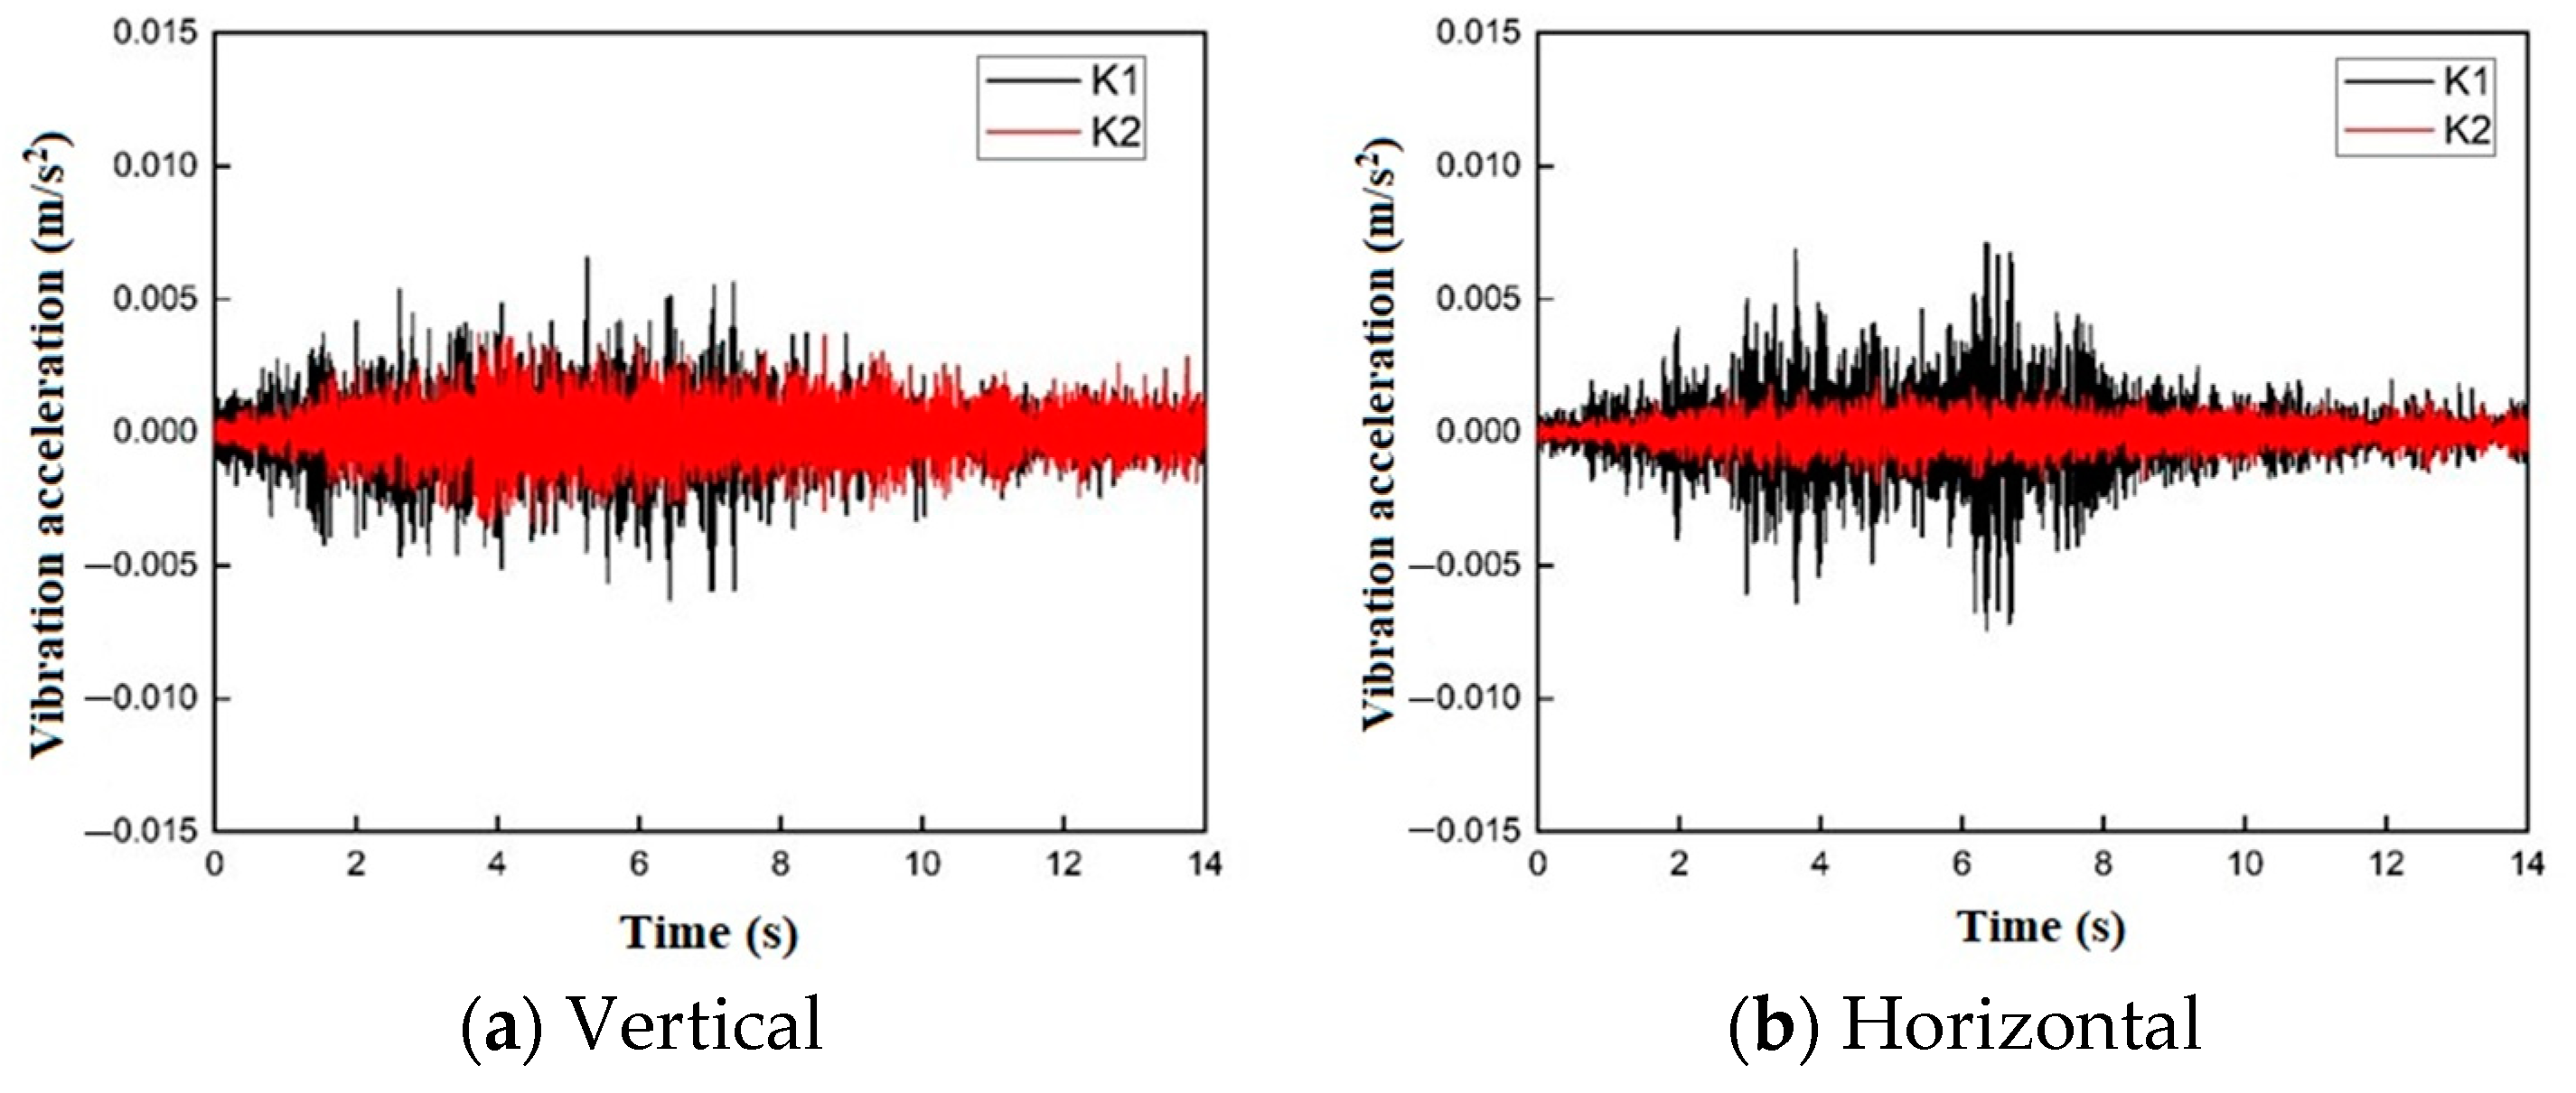
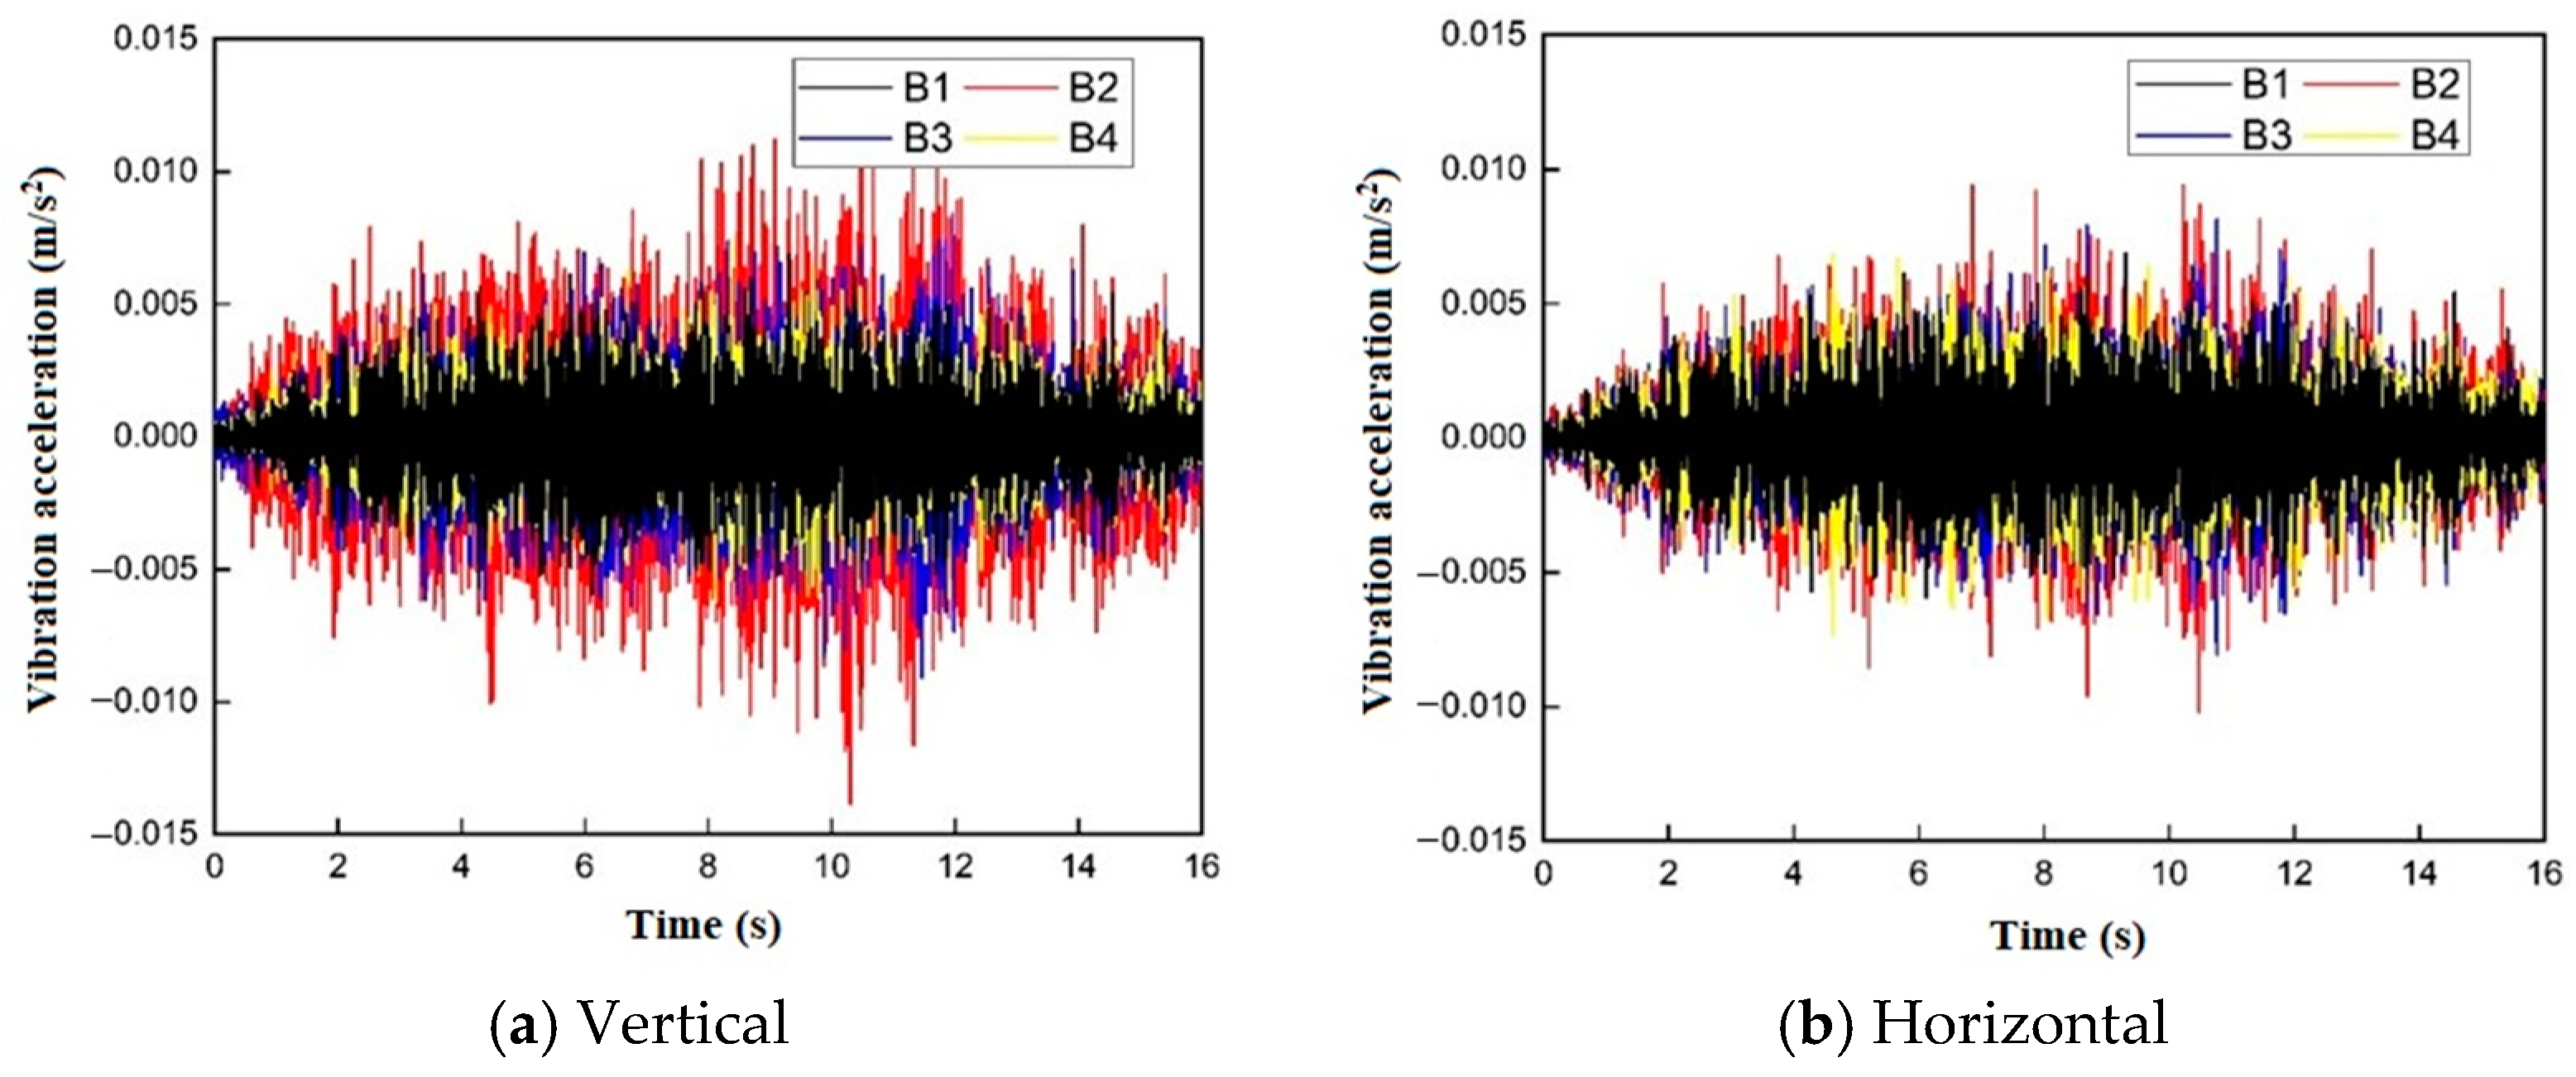
3.2.1. Time-Domain Analysis of Trains Running in Different Line Directions

A comparative analysis in the time domain of the characteristic ground vibration induced by trains proceeding in both urban and suburban directions is illustrated in Figure 7. For the urban-bound direction, the peak value of vertical vibration acceleration within Sections 1 to 3 varies between 0.004 m/s2 and 0.008 m/s2, whereas the peak horizontal vibration acceleration spans from 0.004 m/s2 to 0.015 m/s2. In contrast, for the suburban-bound direction, the peak vertical vibration acceleration for the same sections ranges from 0.001 m/s2 to 0.005 m/s2, and the peak horizontal vibration acceleration is between 0.003 m/s2 and 0.005 m/s2. Overall, irrespective of the orientation—vertical or horizontal—the vibration acceleration associated with the trains heading toward the urban direction exceeds that of trains heading toward the suburban direction. The principal factors contributing to this discrepancy include: (1) the suburban direction being situated on the far side of the rail, with a relatively farther distance that results in more significant vibration attenuation along the propagation path; (2) the installation of medium vibration-damping fasteners on the suburban track, adjacent to the residential buildings on the opposite side of the subway station, which serves to attenuate the vibration at the source to some extent. The combined effect of these two factors results in the vibration acceleration being higher in the urban direction compared to the suburban direction.

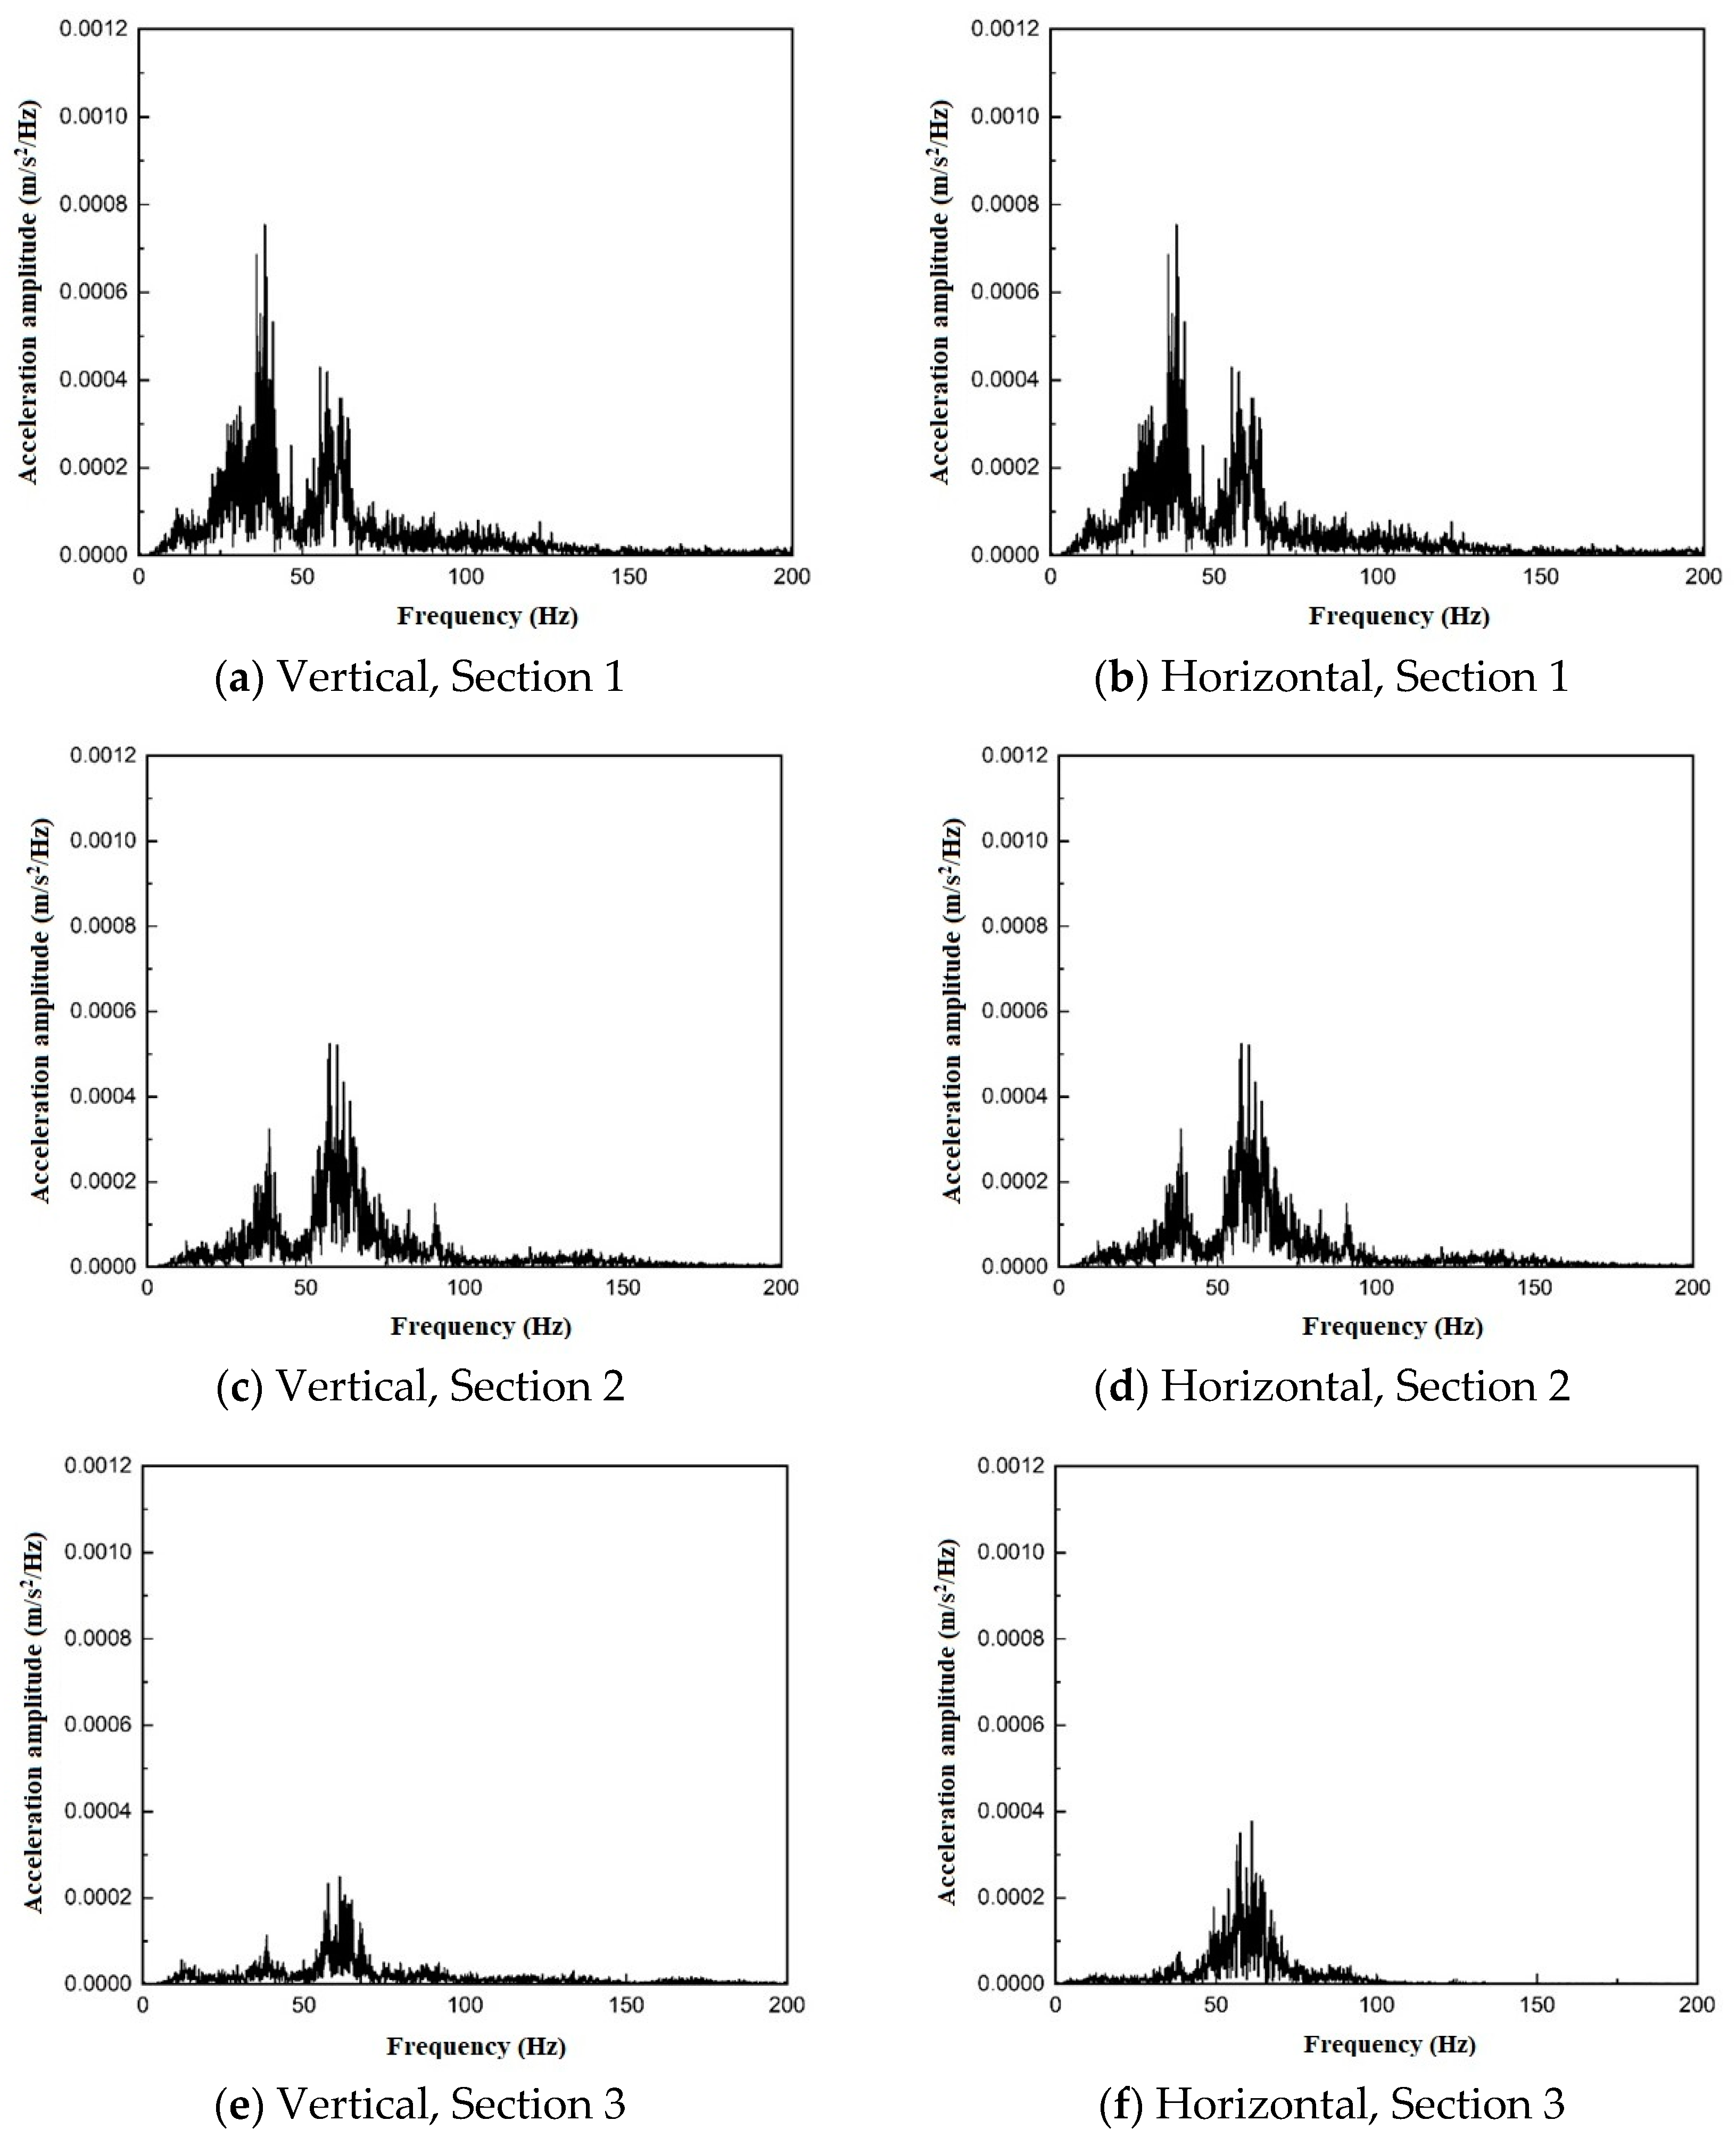
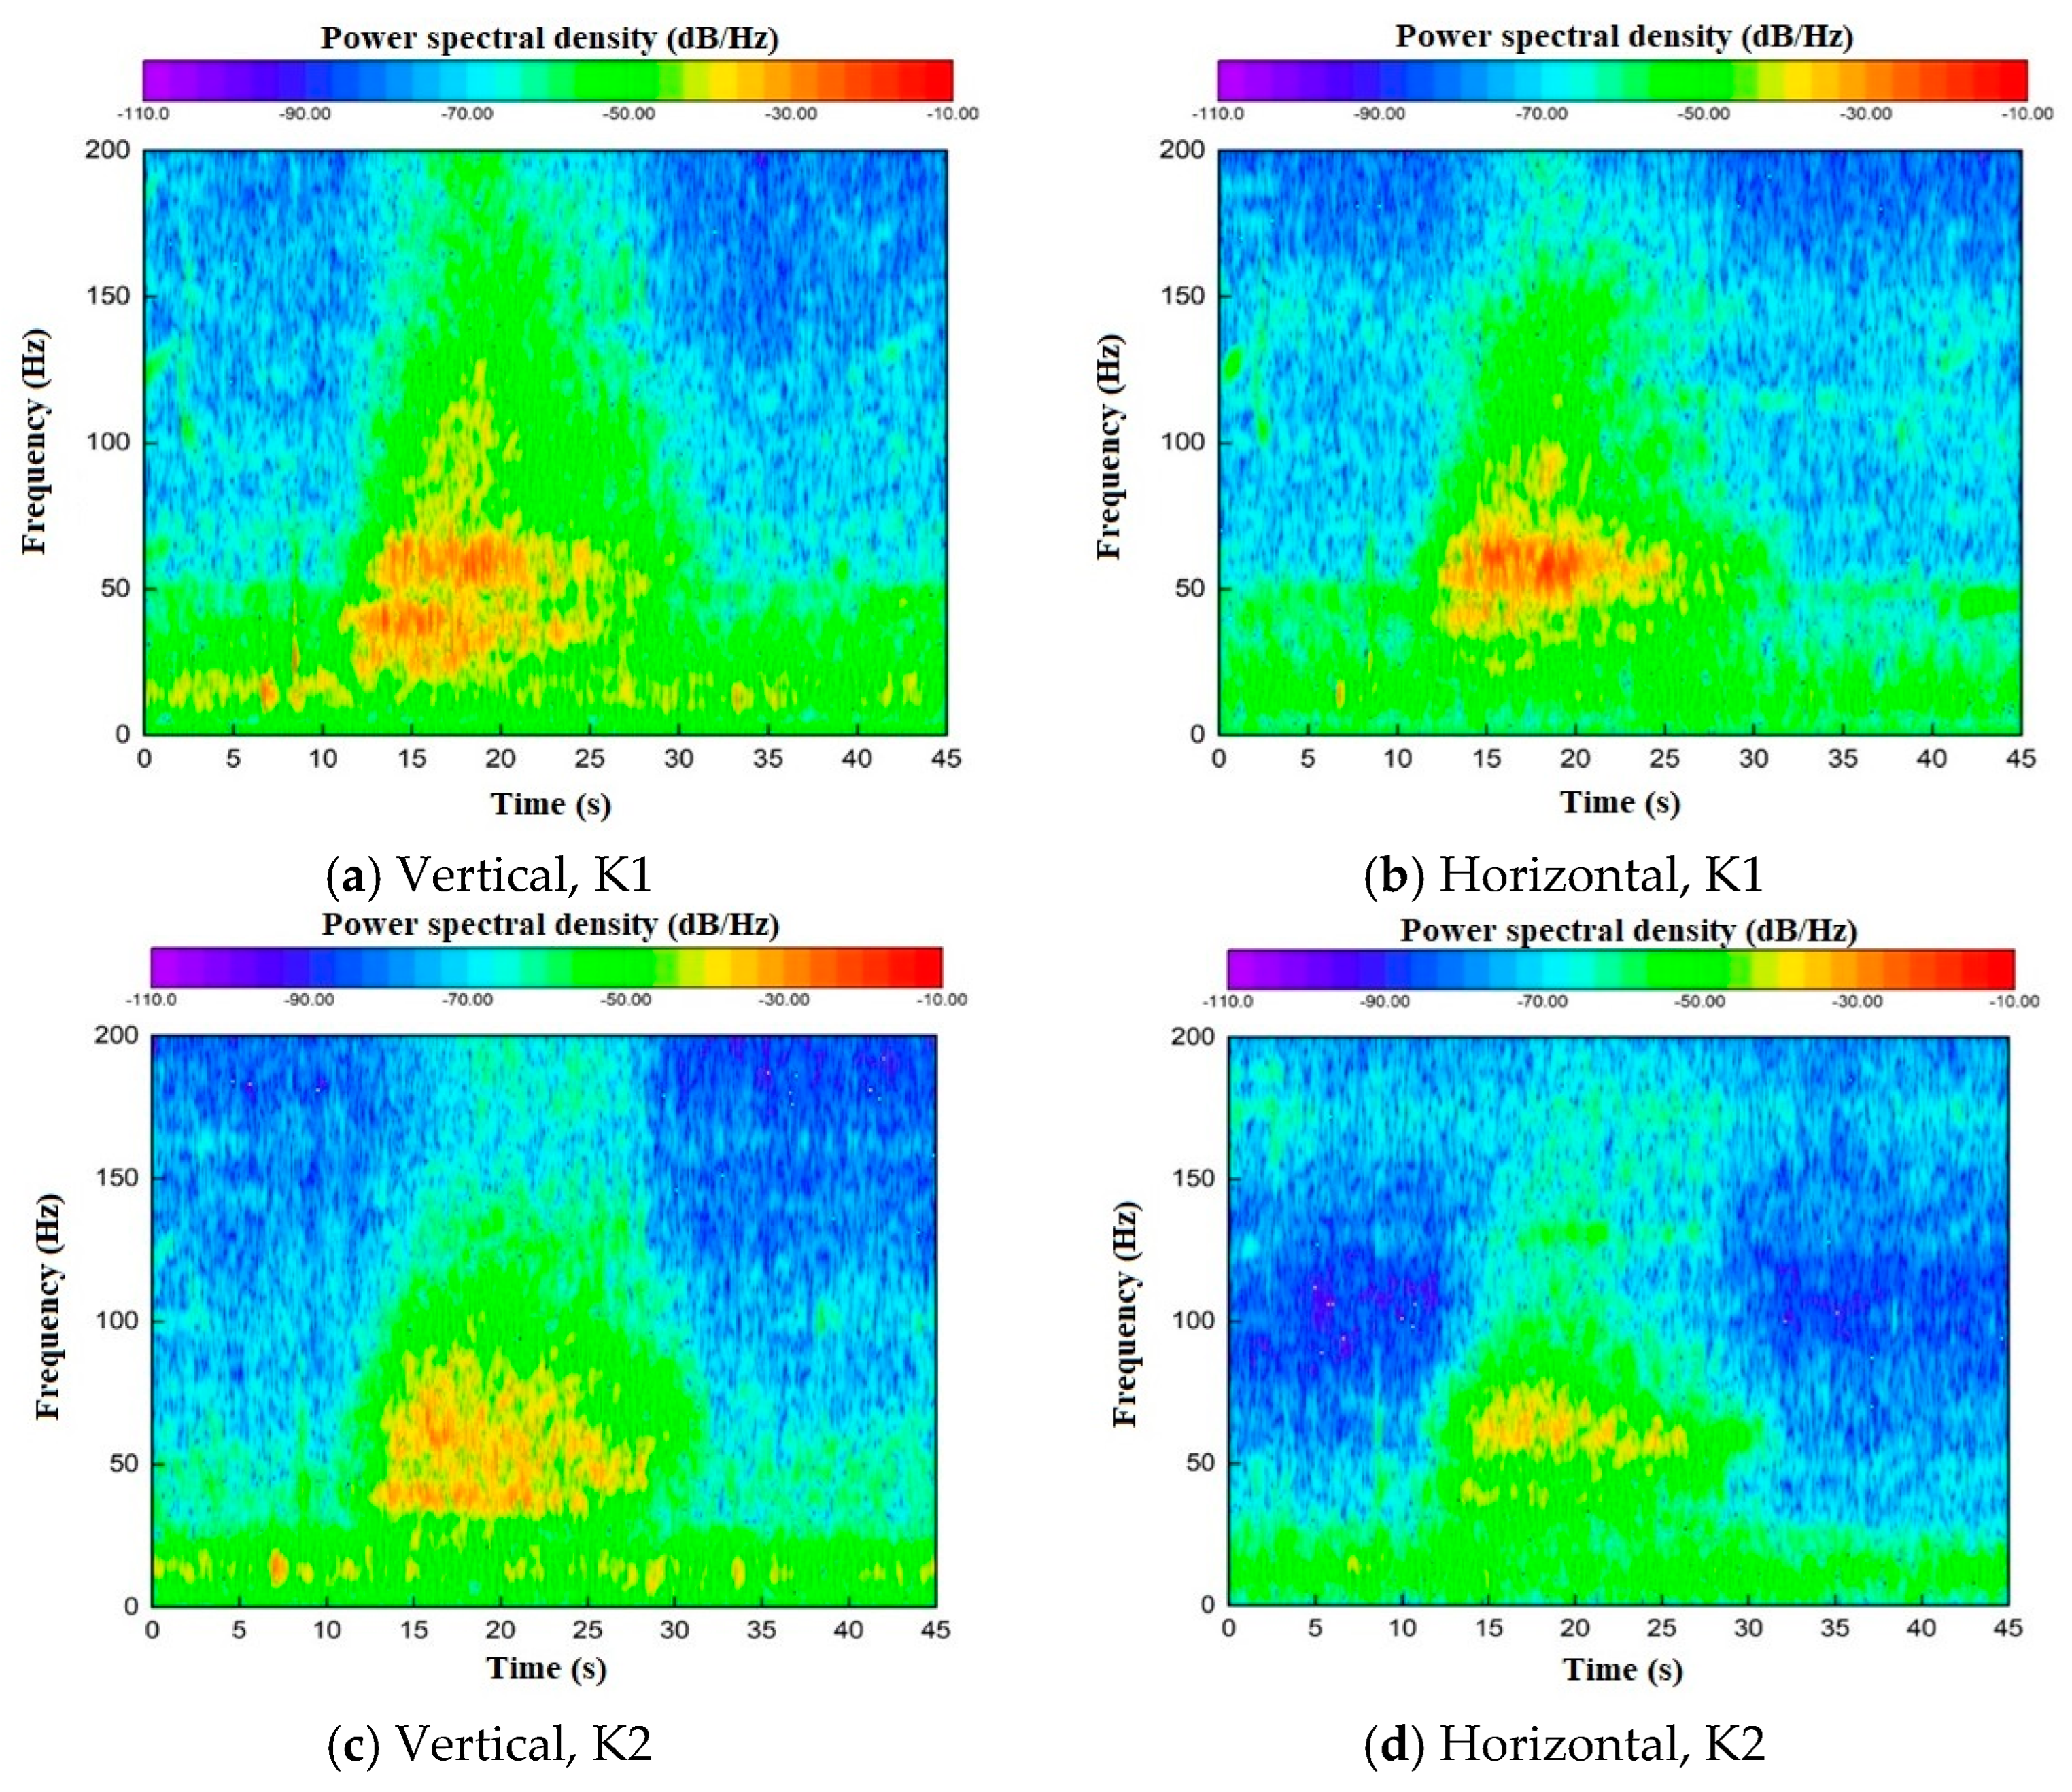
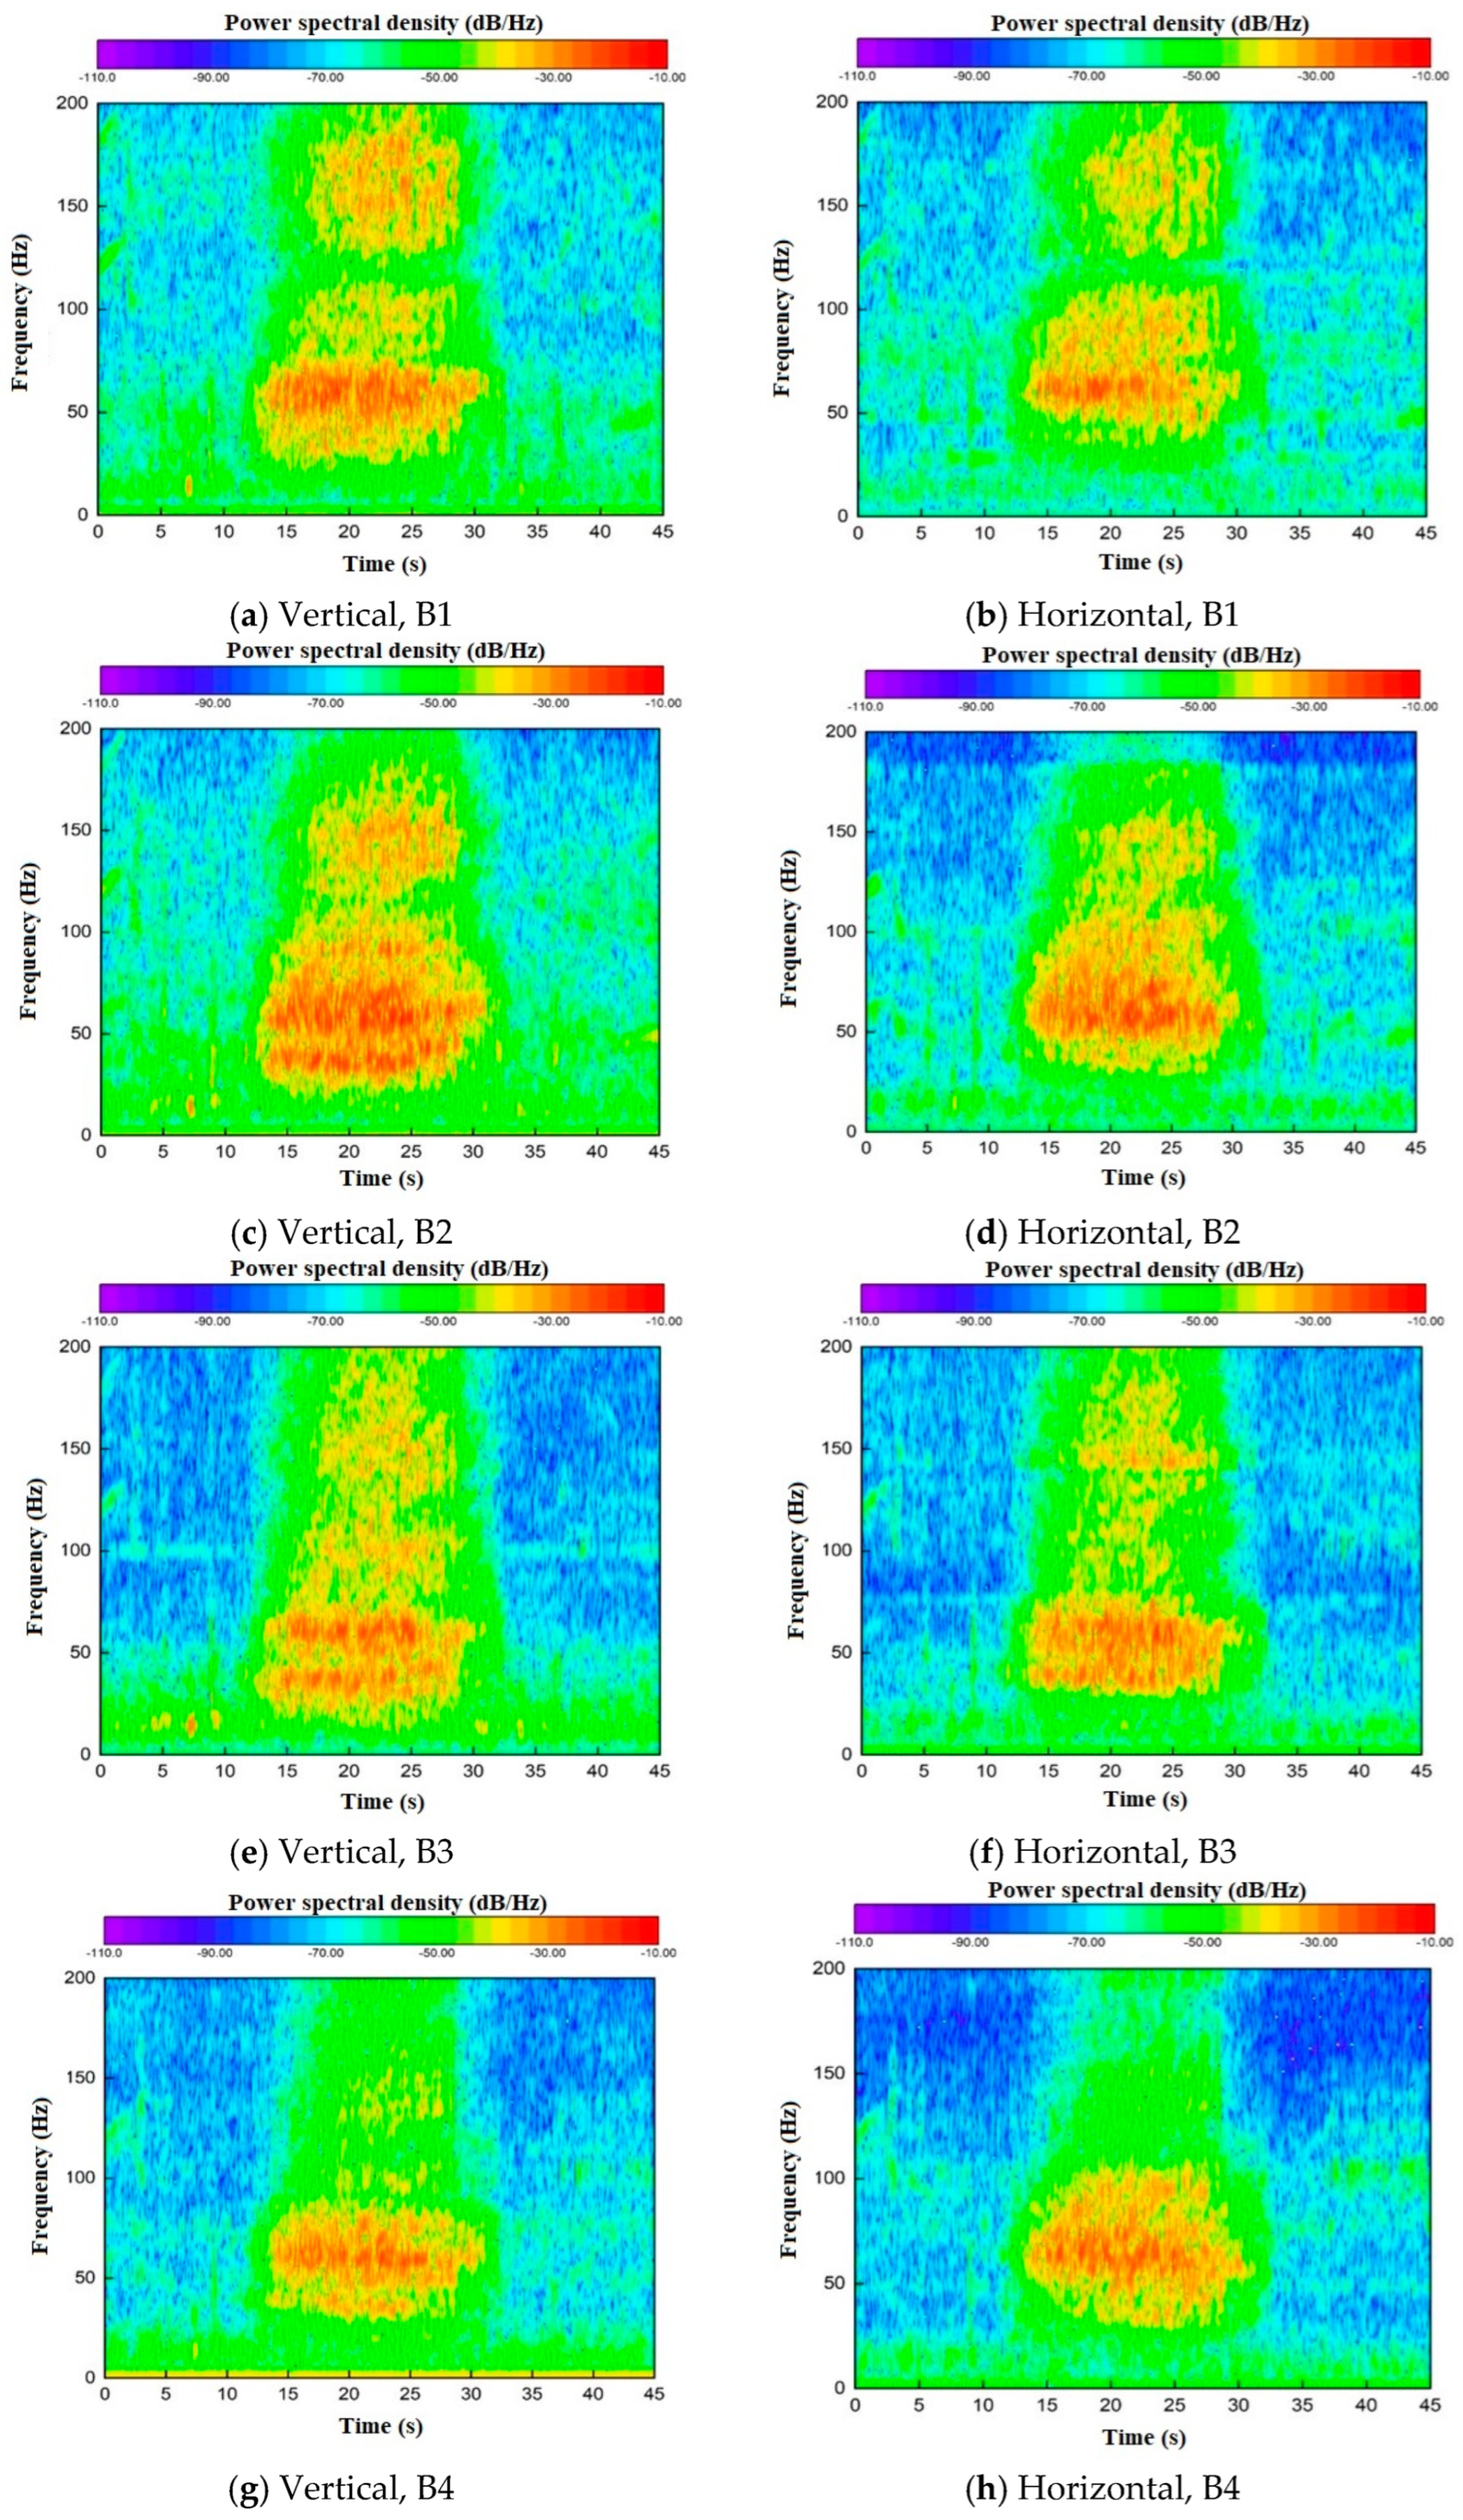
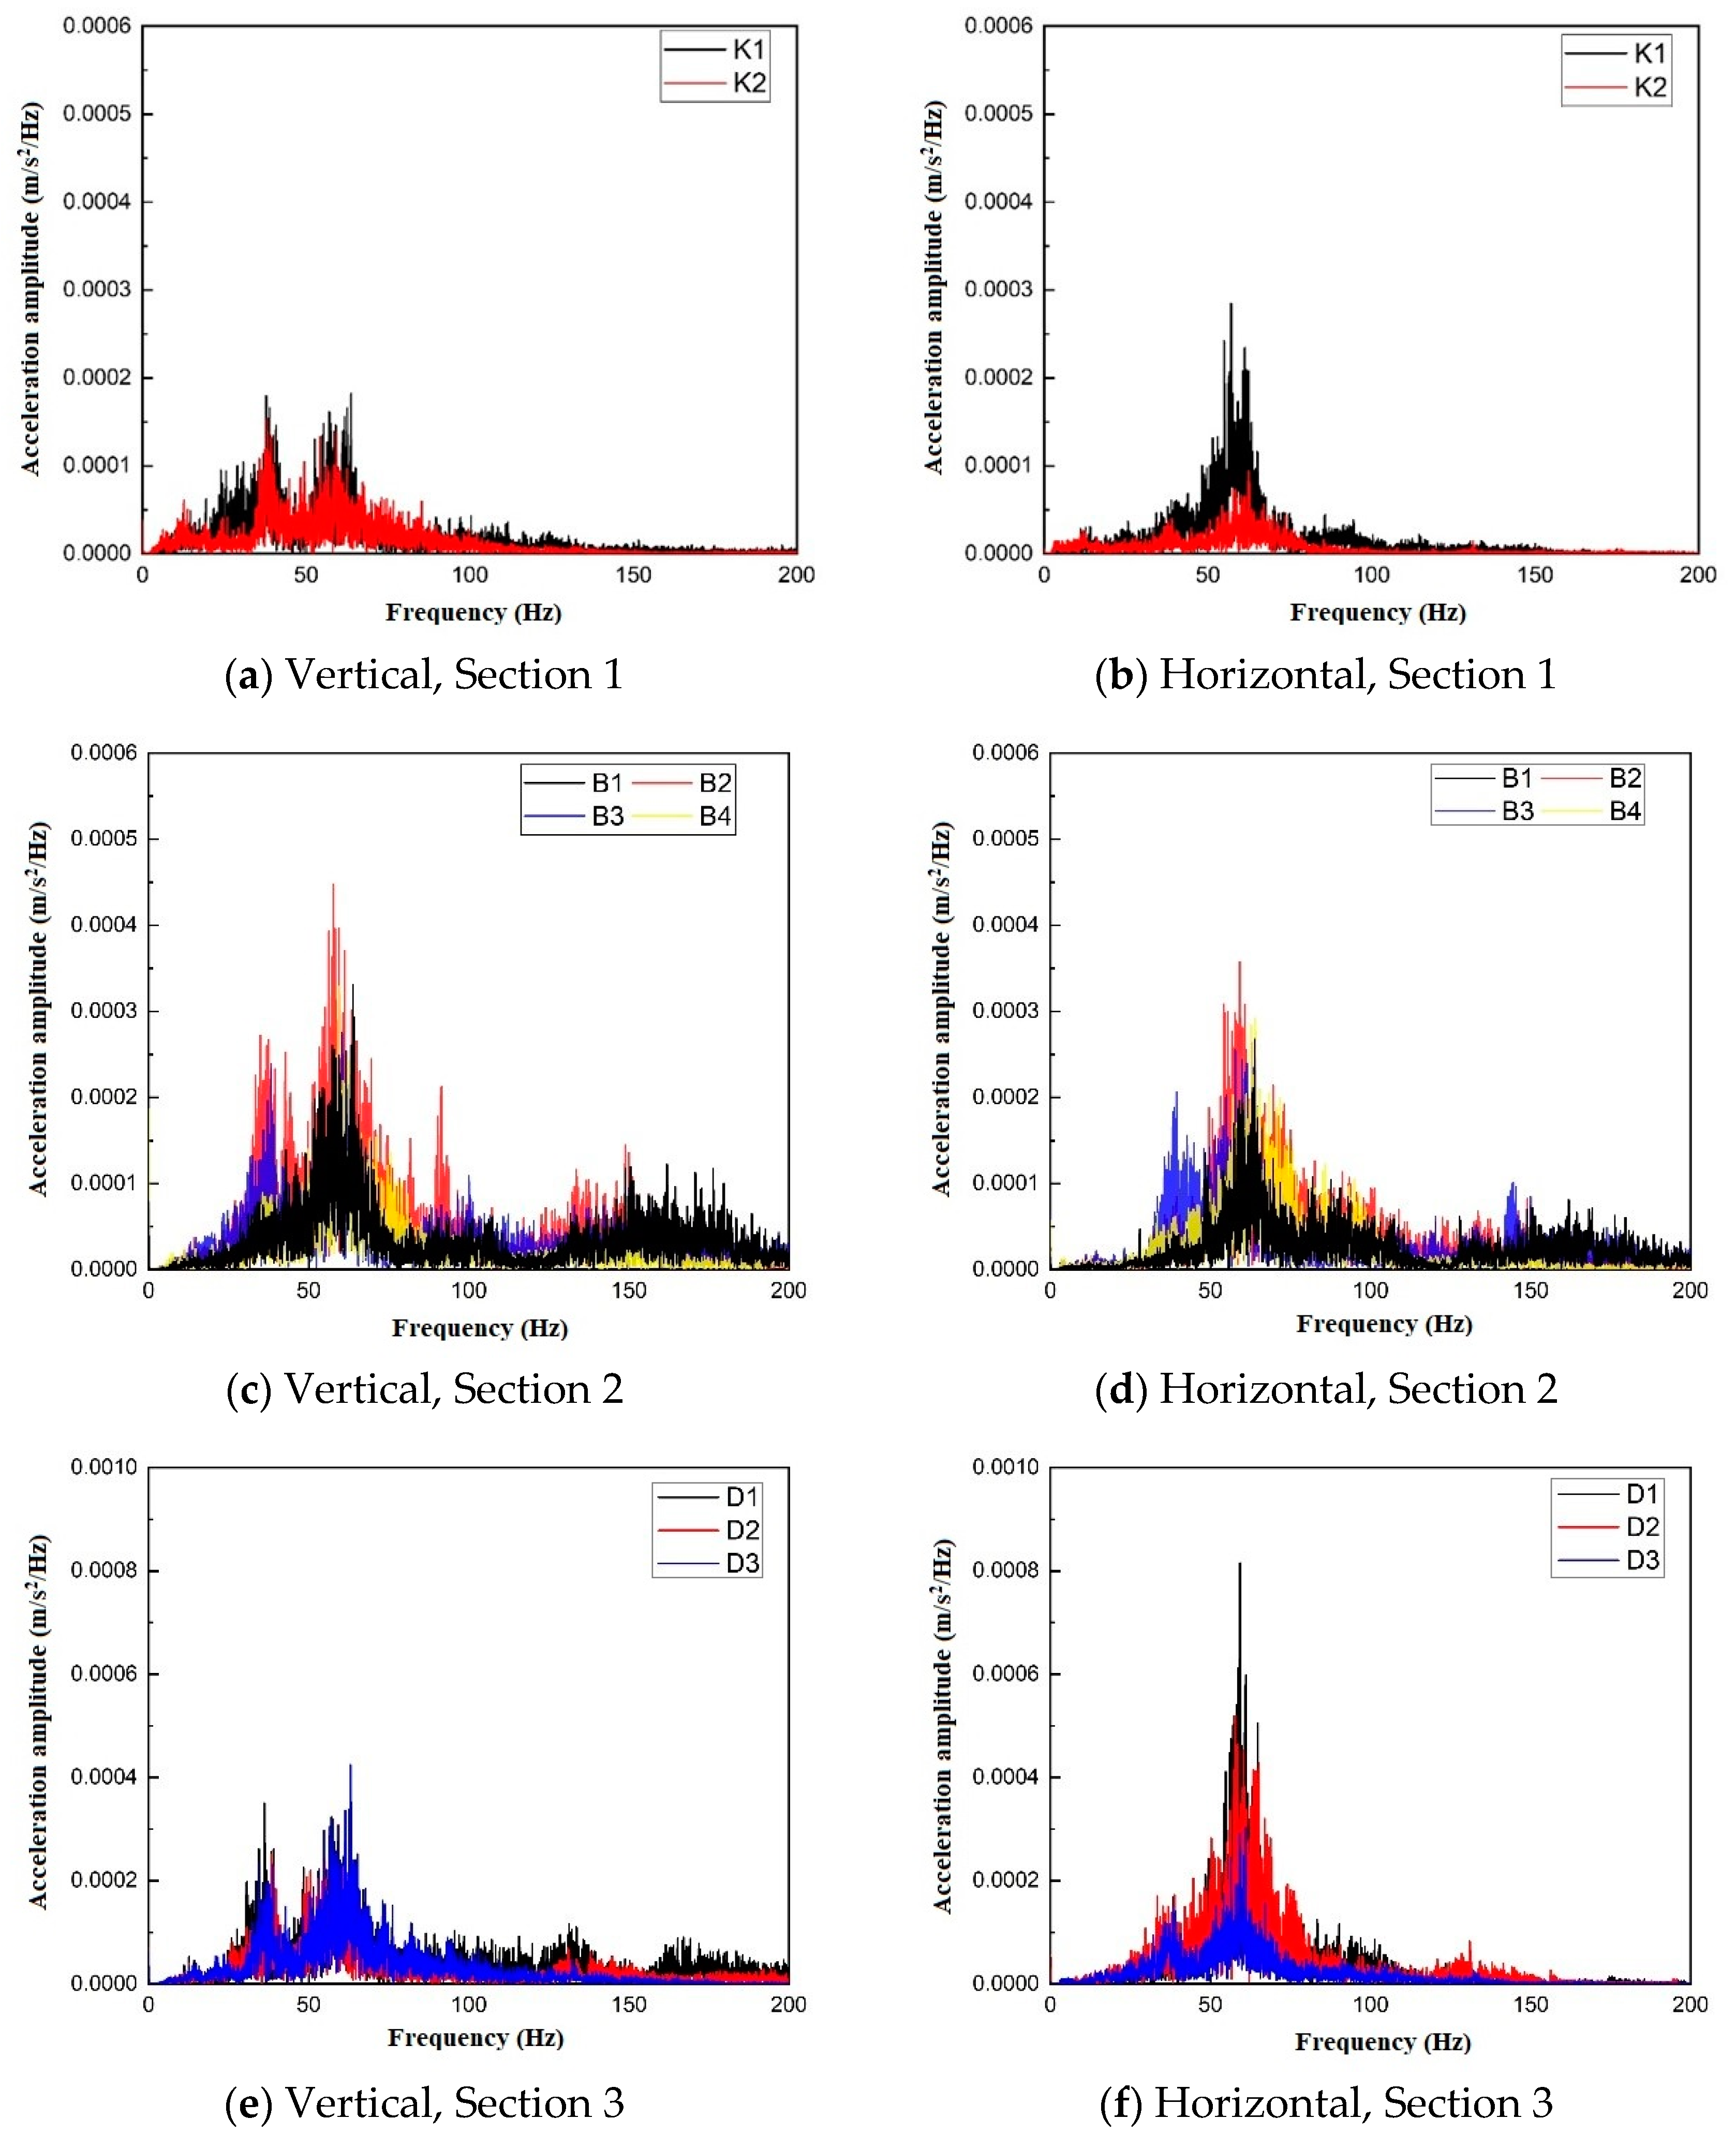
3.2.2. Frequency-Domain Analysis of Trains Running in Different Line Directions

Figure 8 illustrates the spectrogram of typical vehicle-induced vibration signals, caused by trains traveling in both urban and suburban directions, subsequent to the fast Fourier transform. This representation corresponds to the time-domain plot. Typically, the acceleration amplitude within the urban direction is higher than that in the suburban direction, with the predominant influence frequency band localized within the range of 40 to 60 Hz. To elaborate further, in the urban direction, two distinct peaks are observed in the vertical direction across three sections, situated at 40 Hz and 60 Hz, respectively. The peak frequency in the horizontal direction is predominantly at 60 Hz. Moreover, the frequency response bands for Sections 2 and 3 are broader in comparison to Section 1. While in the suburban direction, the vertical vibration frequencies for Sections 1 and 2 are distributed between 40 and 60 Hz, featuring multiple peaks, whereas the peak frequency for Section 3 is confined to 40 Hz. In comparison, the horizontal frequencies in the suburban direction for Sections 2 and 3 range from 40 to 60 Hz, with multiple peaks, and Section 1’s peak frequency is centered at 50 Hz.
The calculation of the 1/3 octave band vibration acceleration level for each train, in both urban and suburban directions of every section, has yielded insights into the influence range and average vibration values, as depicted in Figure 9. The analysis reveals that, in the vertical direction, the average peak vibration acceleration levels for the three sections in the urban direction are 65 dB, 64 dB, and 69 dB, with corresponding peak frequencies at 40 Hz, 40 Hz, and 63 Hz. In the suburban direction, the vibration acceleration levels range around 61 dB, with peak frequencies that are similarly aligned. For the horizontal direction, the average peak vibration acceleration levels for the three sections are 69 dB, 62 dB, and 72 dB, respectively, with peak frequencies at 63 Hz, 63 Hz, and 50 Hz. In the suburban direction, the average peak vibration acceleration levels for the three sections are 67 dB, 61 dB, and 65 dB, with peak frequencies at 63 Hz, 63 Hz, and 50 Hz. The comparison between urban and suburban directions indicates a higher peak vibration acceleration level in urban areas, aligning with the previously mentioned influencing factors. Specifically, the suburban direction exhibits a higher average vibration acceleration level at lower frequencies, whether in the vertical or horizontal direction. Conversely, at higher frequencies, the urban direction demonstrates elevated vibration acceleration levels. To mitigate vibration effects, the installation of vibration-reducing fasteners on the track in the suburban direction aims to lower the track’s natural frequency, thereby achieving a vibration reduction effect. This intervention, however, may result in amplified vibrations at lower frequencies, although the peak values are expected to decrease. Urban-bound trains exhibited vertical VALs ranging from 65 to 69 dB, whereas suburban-bound trains showed a 15–20% reduction (55–61 dB), attributable to medium-damping fasteners installed on suburban tracks.

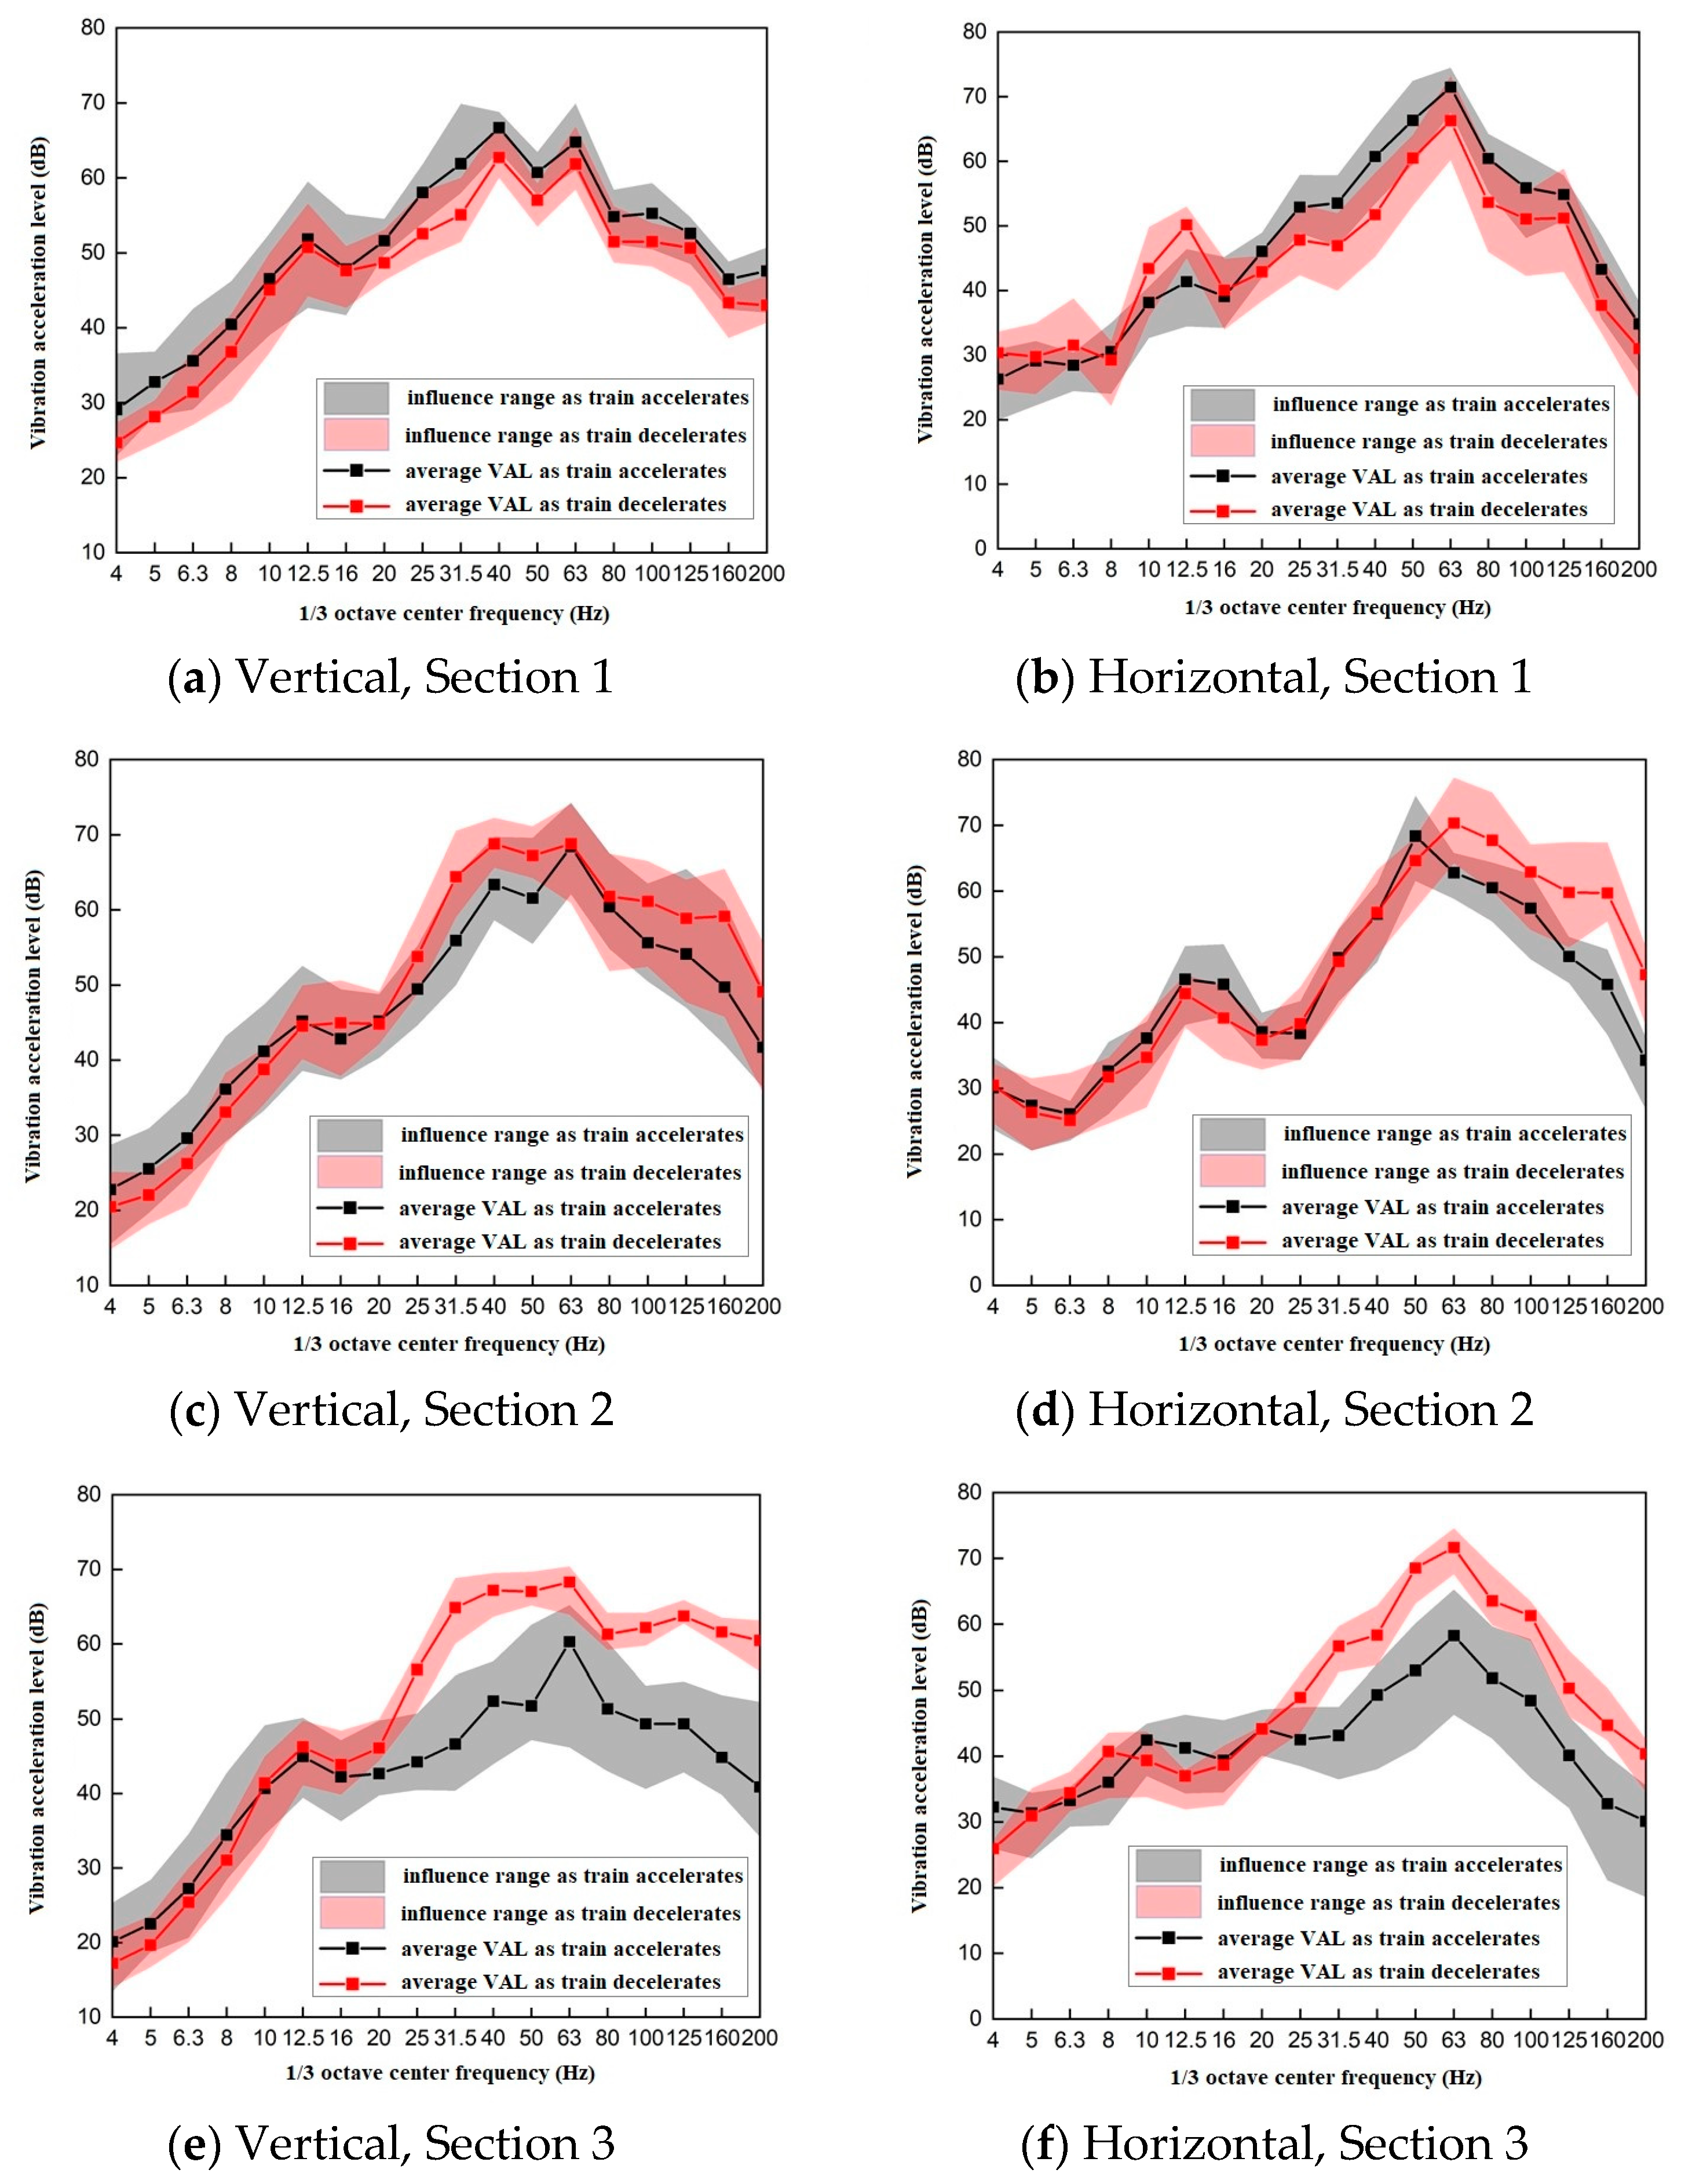
3.3. Influence of Acceleration and Deceleration in and out of Subway Station on Vibration Propagation Law

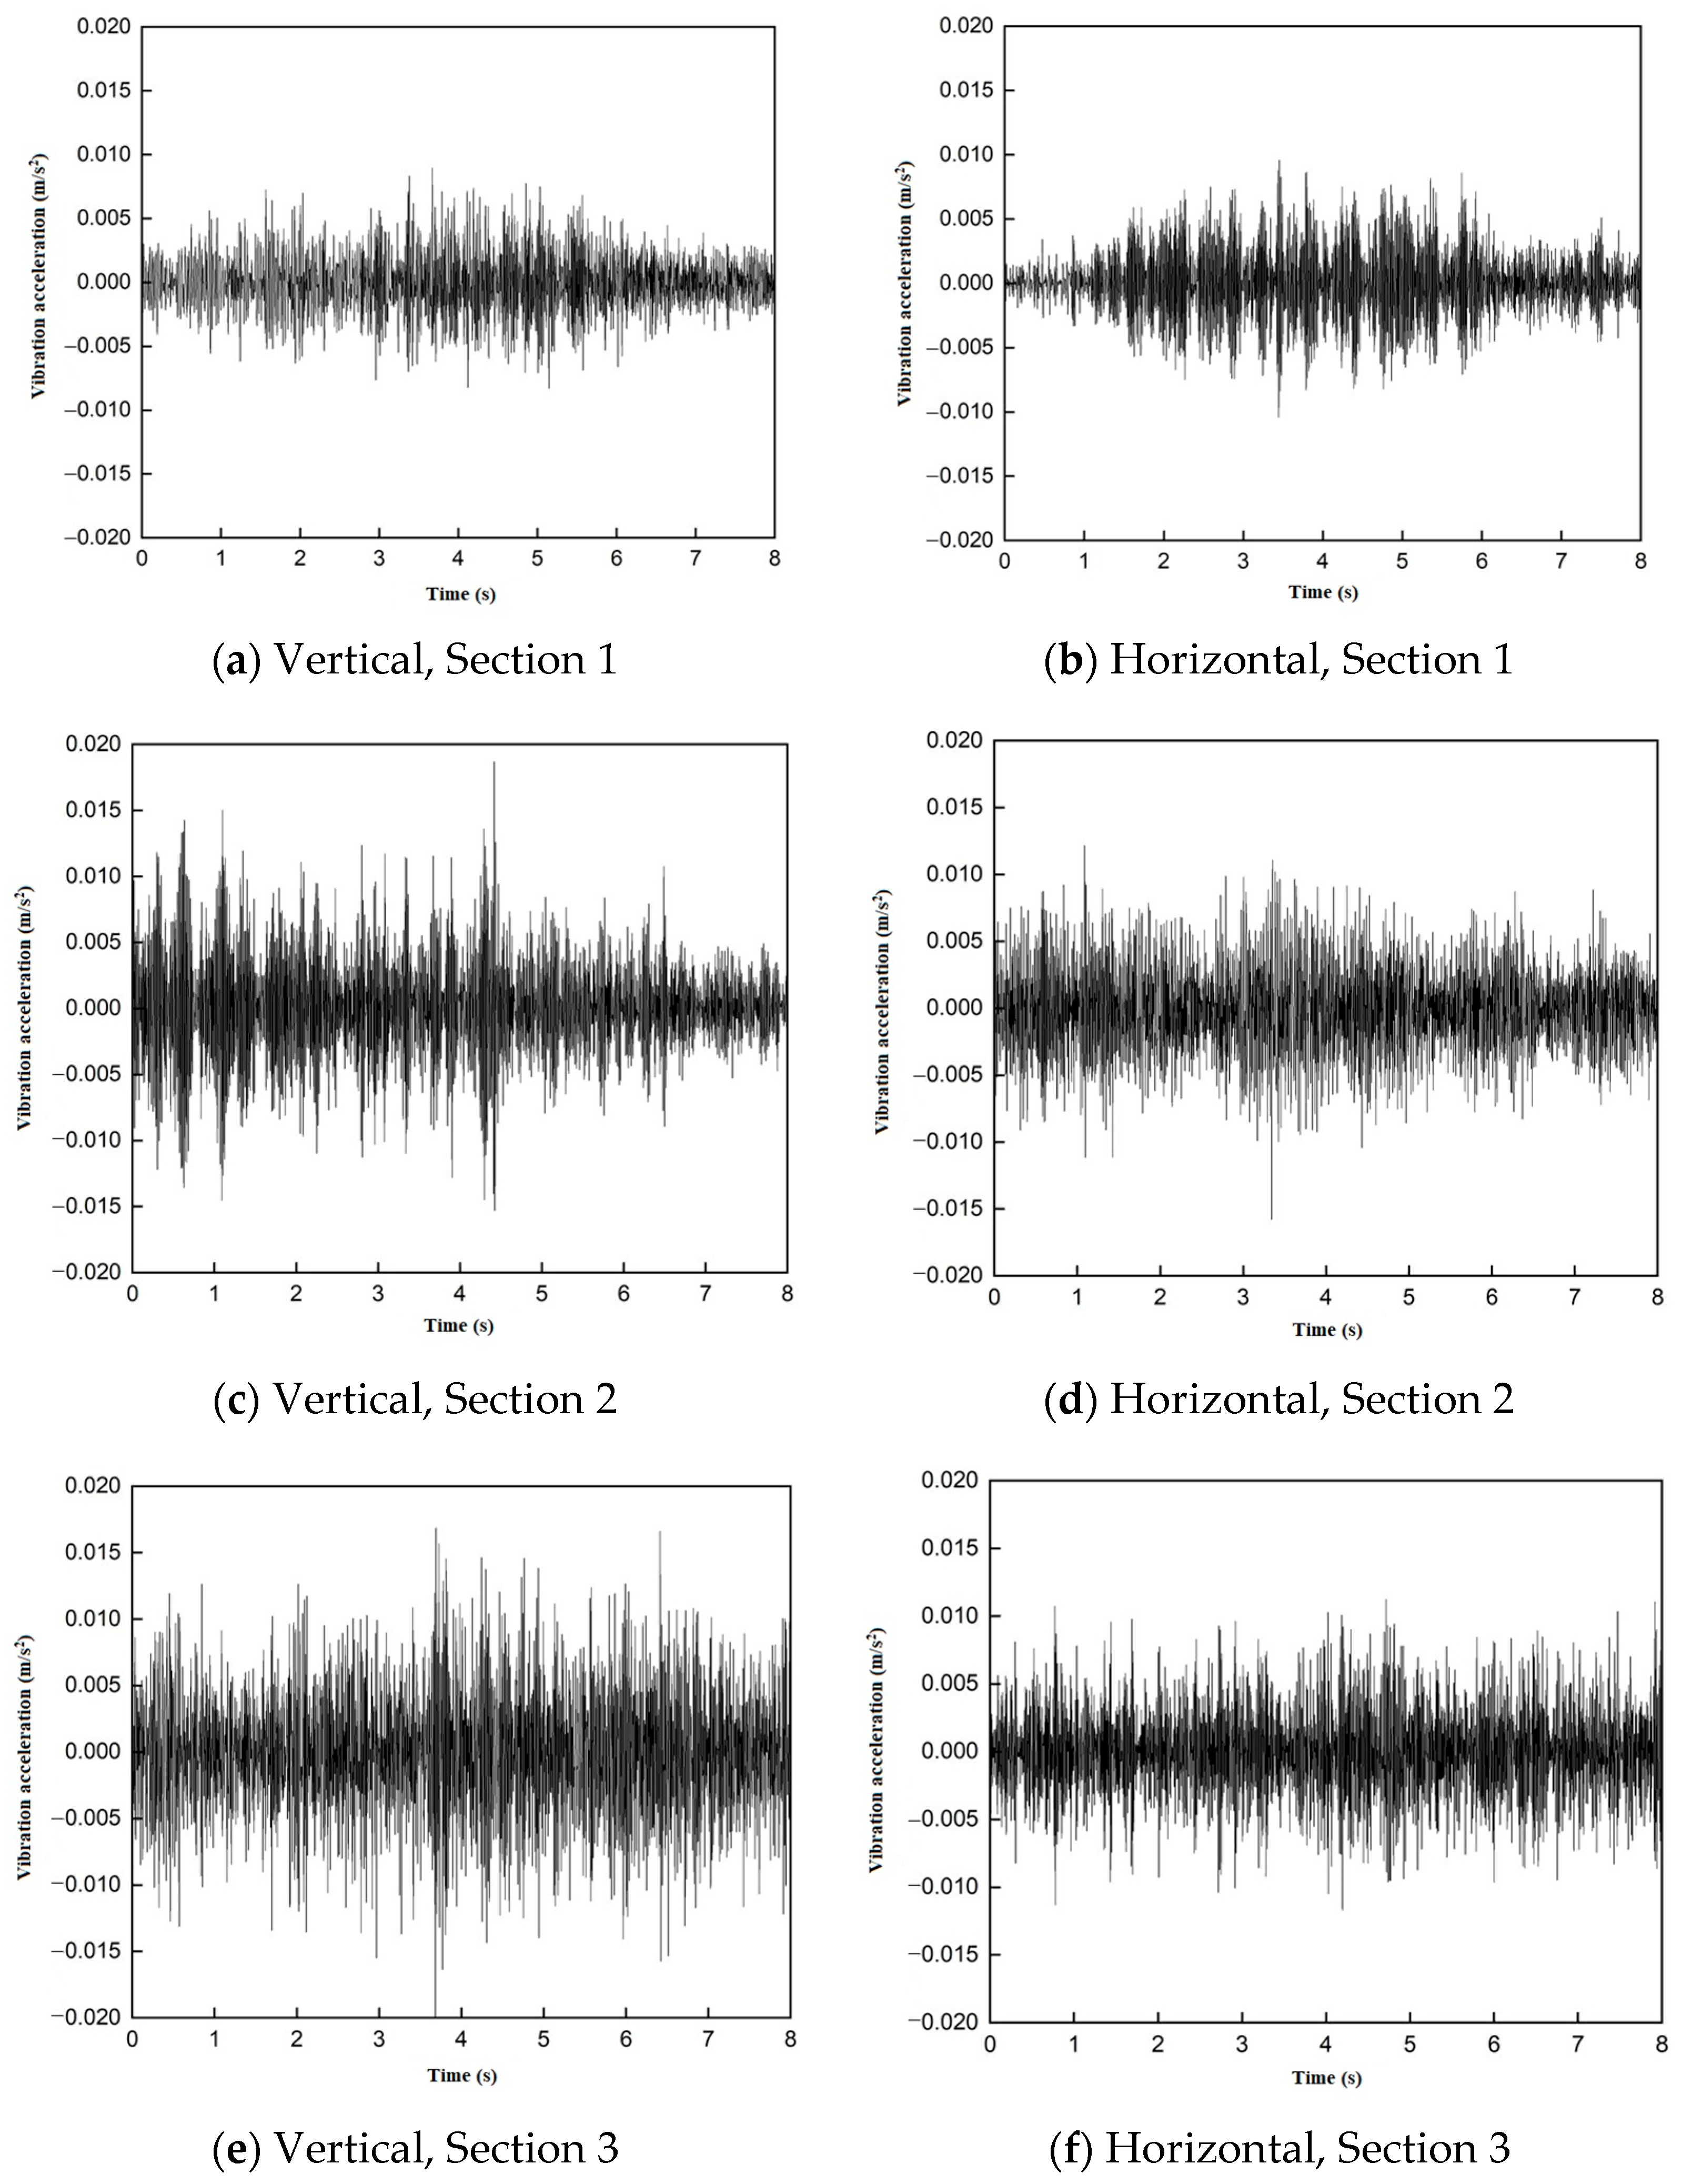
3.3.1. Time-Domain Analysis of Trains Entering and Leaving the Subway Station

Upon conducting time-domain analysis, it is observed that the vehicle-induced vibration signals of trains entering and leaving the station typically manifest in pairs. For a detailed examination, two representative sets of complete inbound and outbound vibration signals recorded at measuring point B2 are presented in Figure 10. The pairing of these signals arises from the fact that, as the train completely traverses the subway station, the vibration pickup initially captures the inbound signal, followed by the outbound signal after an interval of approximately 30 to 40 s subsequent to the train’s cessation. Correlation with the train schedule facilitates the identification of the former as the inbound train’s time-domain waveform and the latter as the outbound train’s time-domain waveform.
Moreover, waveform 1 discloses that the inbound train exhibits peak accelerations of approximately 0.007 m/s2 vertically and 0.004 m/s2 horizontally, whereas the outbound train demonstrates peak accelerations of around 0.005 m/s2 vertically and 0.002 m/s2 horizontally. This discrepancy is attributable to the fact that the experiment was carried out during the evening peak hours between 18:30 and 23:30, during which the volume of passengers fluctuates. After the train halts at the station, the number of alighting passengers exceeds that of boarding passengers, leading to a reduction in the train’s overall mass and a resultant attenuation of vibration at the train’s departure. In waveform 2, the inbound train’s peak acceleration is noted as approximately 0.004 m/s2 vertically and 0.003 m/s2 horizontally. Conversely, the outbound train’s peak acceleration escalates to roughly 0.008 m/s2 vertically and 0.006 m/s2 horizontally. During this time, the number of passengers disembarking is lower than those embarking, thus increasing the train’s overall mass and intensifying the vibration at the train’s departure.
Upon dissecting the independent complete time-domain waveform of the inbound train, it is segmented into three distinct phases, as illustrated in Figure 11. The initial phase pertains to the train’s approach to the measuring point, where the wheelset is nearing but has yet to surpass the measuring point, which is indicated by deceleration. It is evident from the figure that as the train approaches closer, the vibration collected by the sensor progressively intensifies. The second phase involves the train decelerating through the measuring point, with the waveform acceleration peaking as the wheelset passes. The third phase constitutes the braking segment, where the transition from deceleration to braking is discernible in the time domain, marked by an abrupt vibration due to the braked-induced impact load, followed by a rapid decay of the vibration.
The analysis of the independent complete time-domain waveform of the outbound train reveals a bipartite structure, as shown in Figure 12. The first part corresponds to the acceleration phase during the train’s startup, with the waveform acceleration reaching a peak in correlation with the wheelset’s passage. The second part represents the train’s departure, during which the wheelset moves away from the measuring point and the train accelerates. As depicted in the figure, the vibration recorded by the sensor progressively diminishes as the train departs.

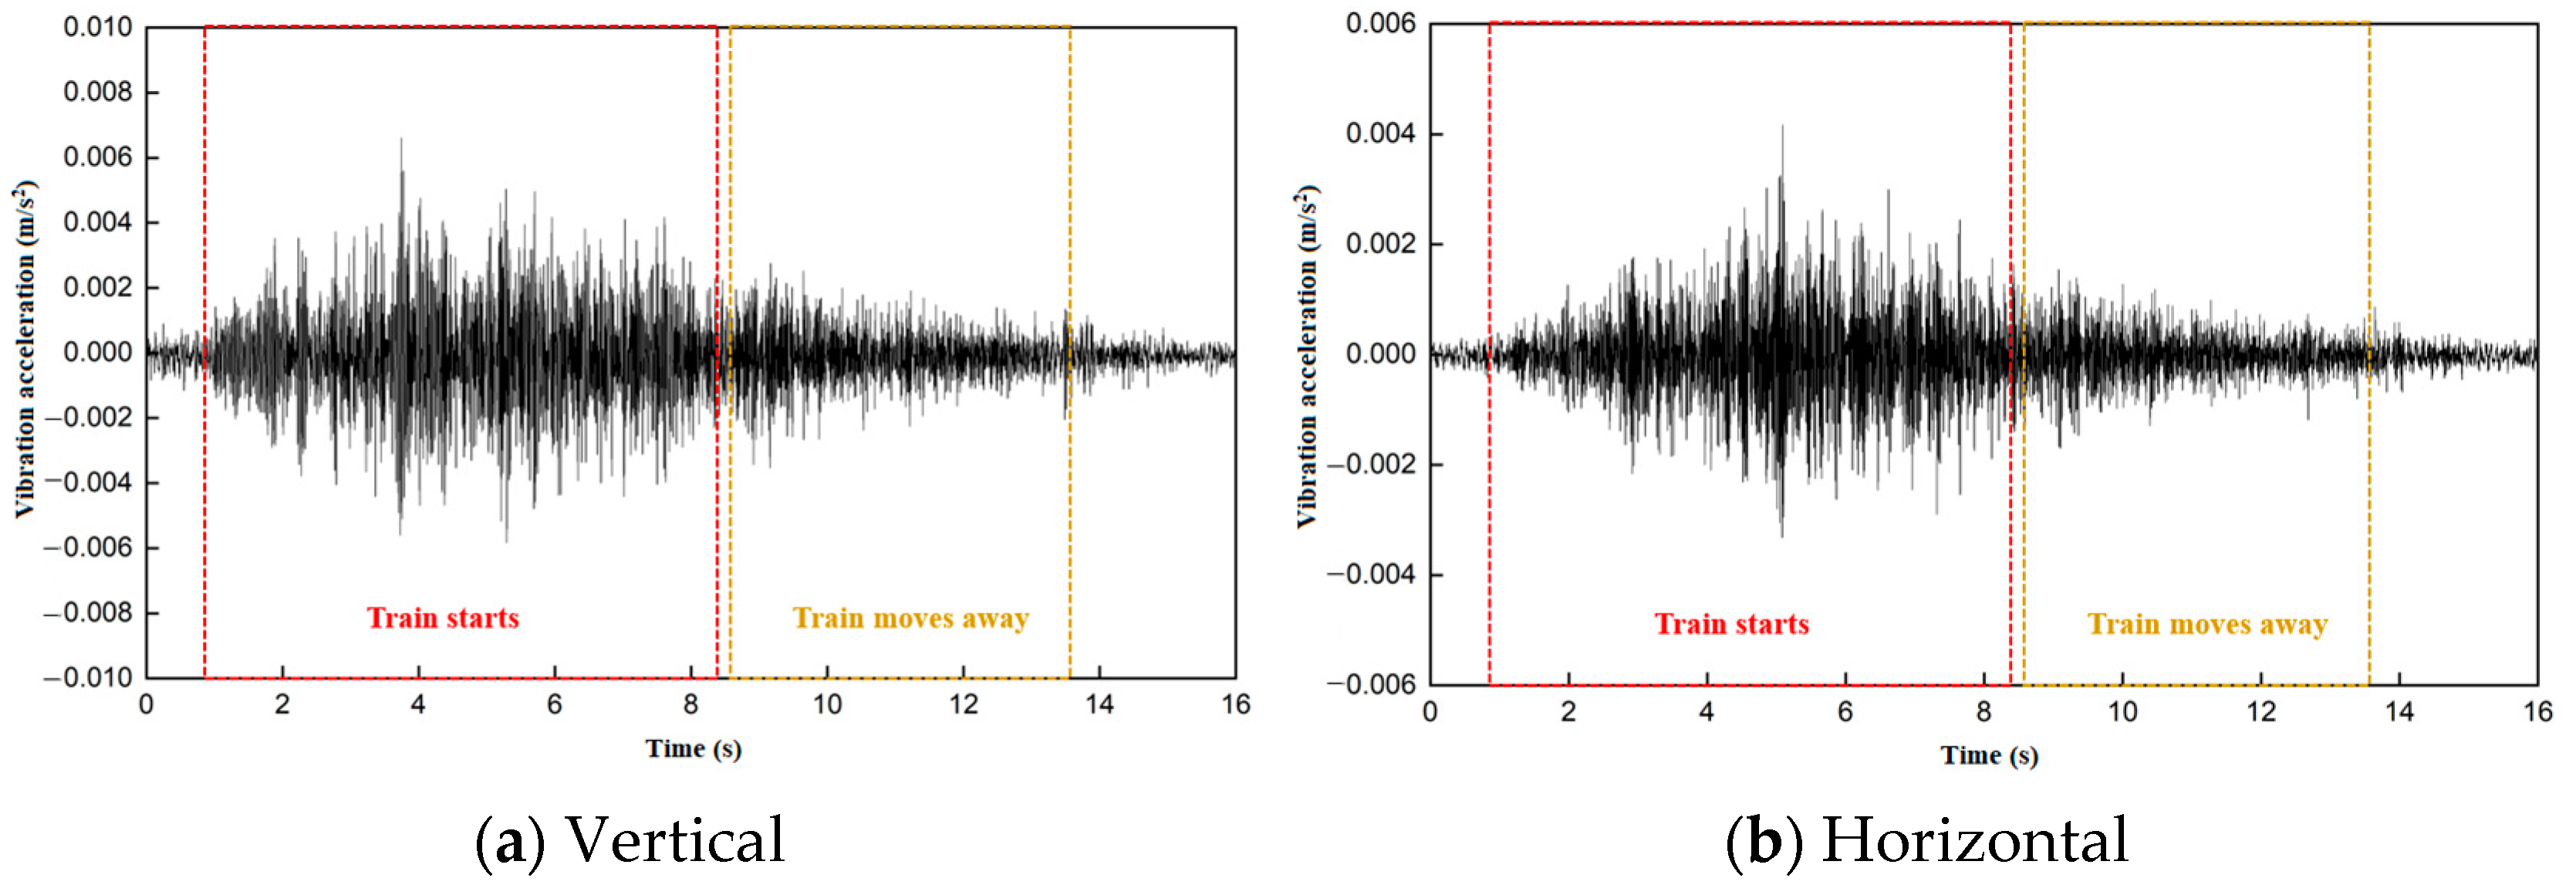
3.3.2. Time-Domain Analysis of Train Acceleration and Deceleration

Upon an initial examination of the inbound and outbound train vibration waveforms within the time domain, a subsequent analysis is conducted to assess the impact of velocity on vehicle-induced vibrations. Specifically, the characteristic vehicle-induced vibrations of trains inbound and outbound toward the urban area are delineated for examination, as illustrated in Figure 13 and Figure 14. Notably, the chosen measuring point is situated 15 m away from the subway station’s outer perimeter.
An analysis of the time-domain diagram of the train’s deceleration-induced vibration reveals that both the vertical and horizontal components of the train’s vibration acceleration diminish progressively from Sections 1 to 3. This decrement is attributed to the train’s deceleration phase, during which its velocity peaks as it traverses Section 1 before progressively diminishing. Consequently, the reduction in velocity correlates with a diminished vibration acceleration.
Conversely, the time-domain diagram of the train’s acceleration-induced vibration illustrates an incremental trend in vibration acceleration in both vertical and horizontal directions from Sections 1 to 3. During this interval, the train transitions from launching to an accelerated state, with the minimum velocity recorded at Section 1, and the maximum velocity at Section 3. The train’s vibration acceleration is observed to escalate in correlation with its increasing velocity.
A comparative examination of the train’s deceleration and acceleration phases discloses that the vibration acceleration is affected by the train’s mass, which fluctuates with the volume of passengers as the train enters and exits from the station. Furthermore, vibration acceleration is susceptible to the train’s velocity, with discrepancies in the magnitude of acceleration during deceleration and acceleration phases leading to inconsistent variations in train velocity. These two factors exert an influence on the vibration acceleration of the ground, precluding an accurate assessment of the train’s deceleration or acceleration impact on the ground vibration acceleration.

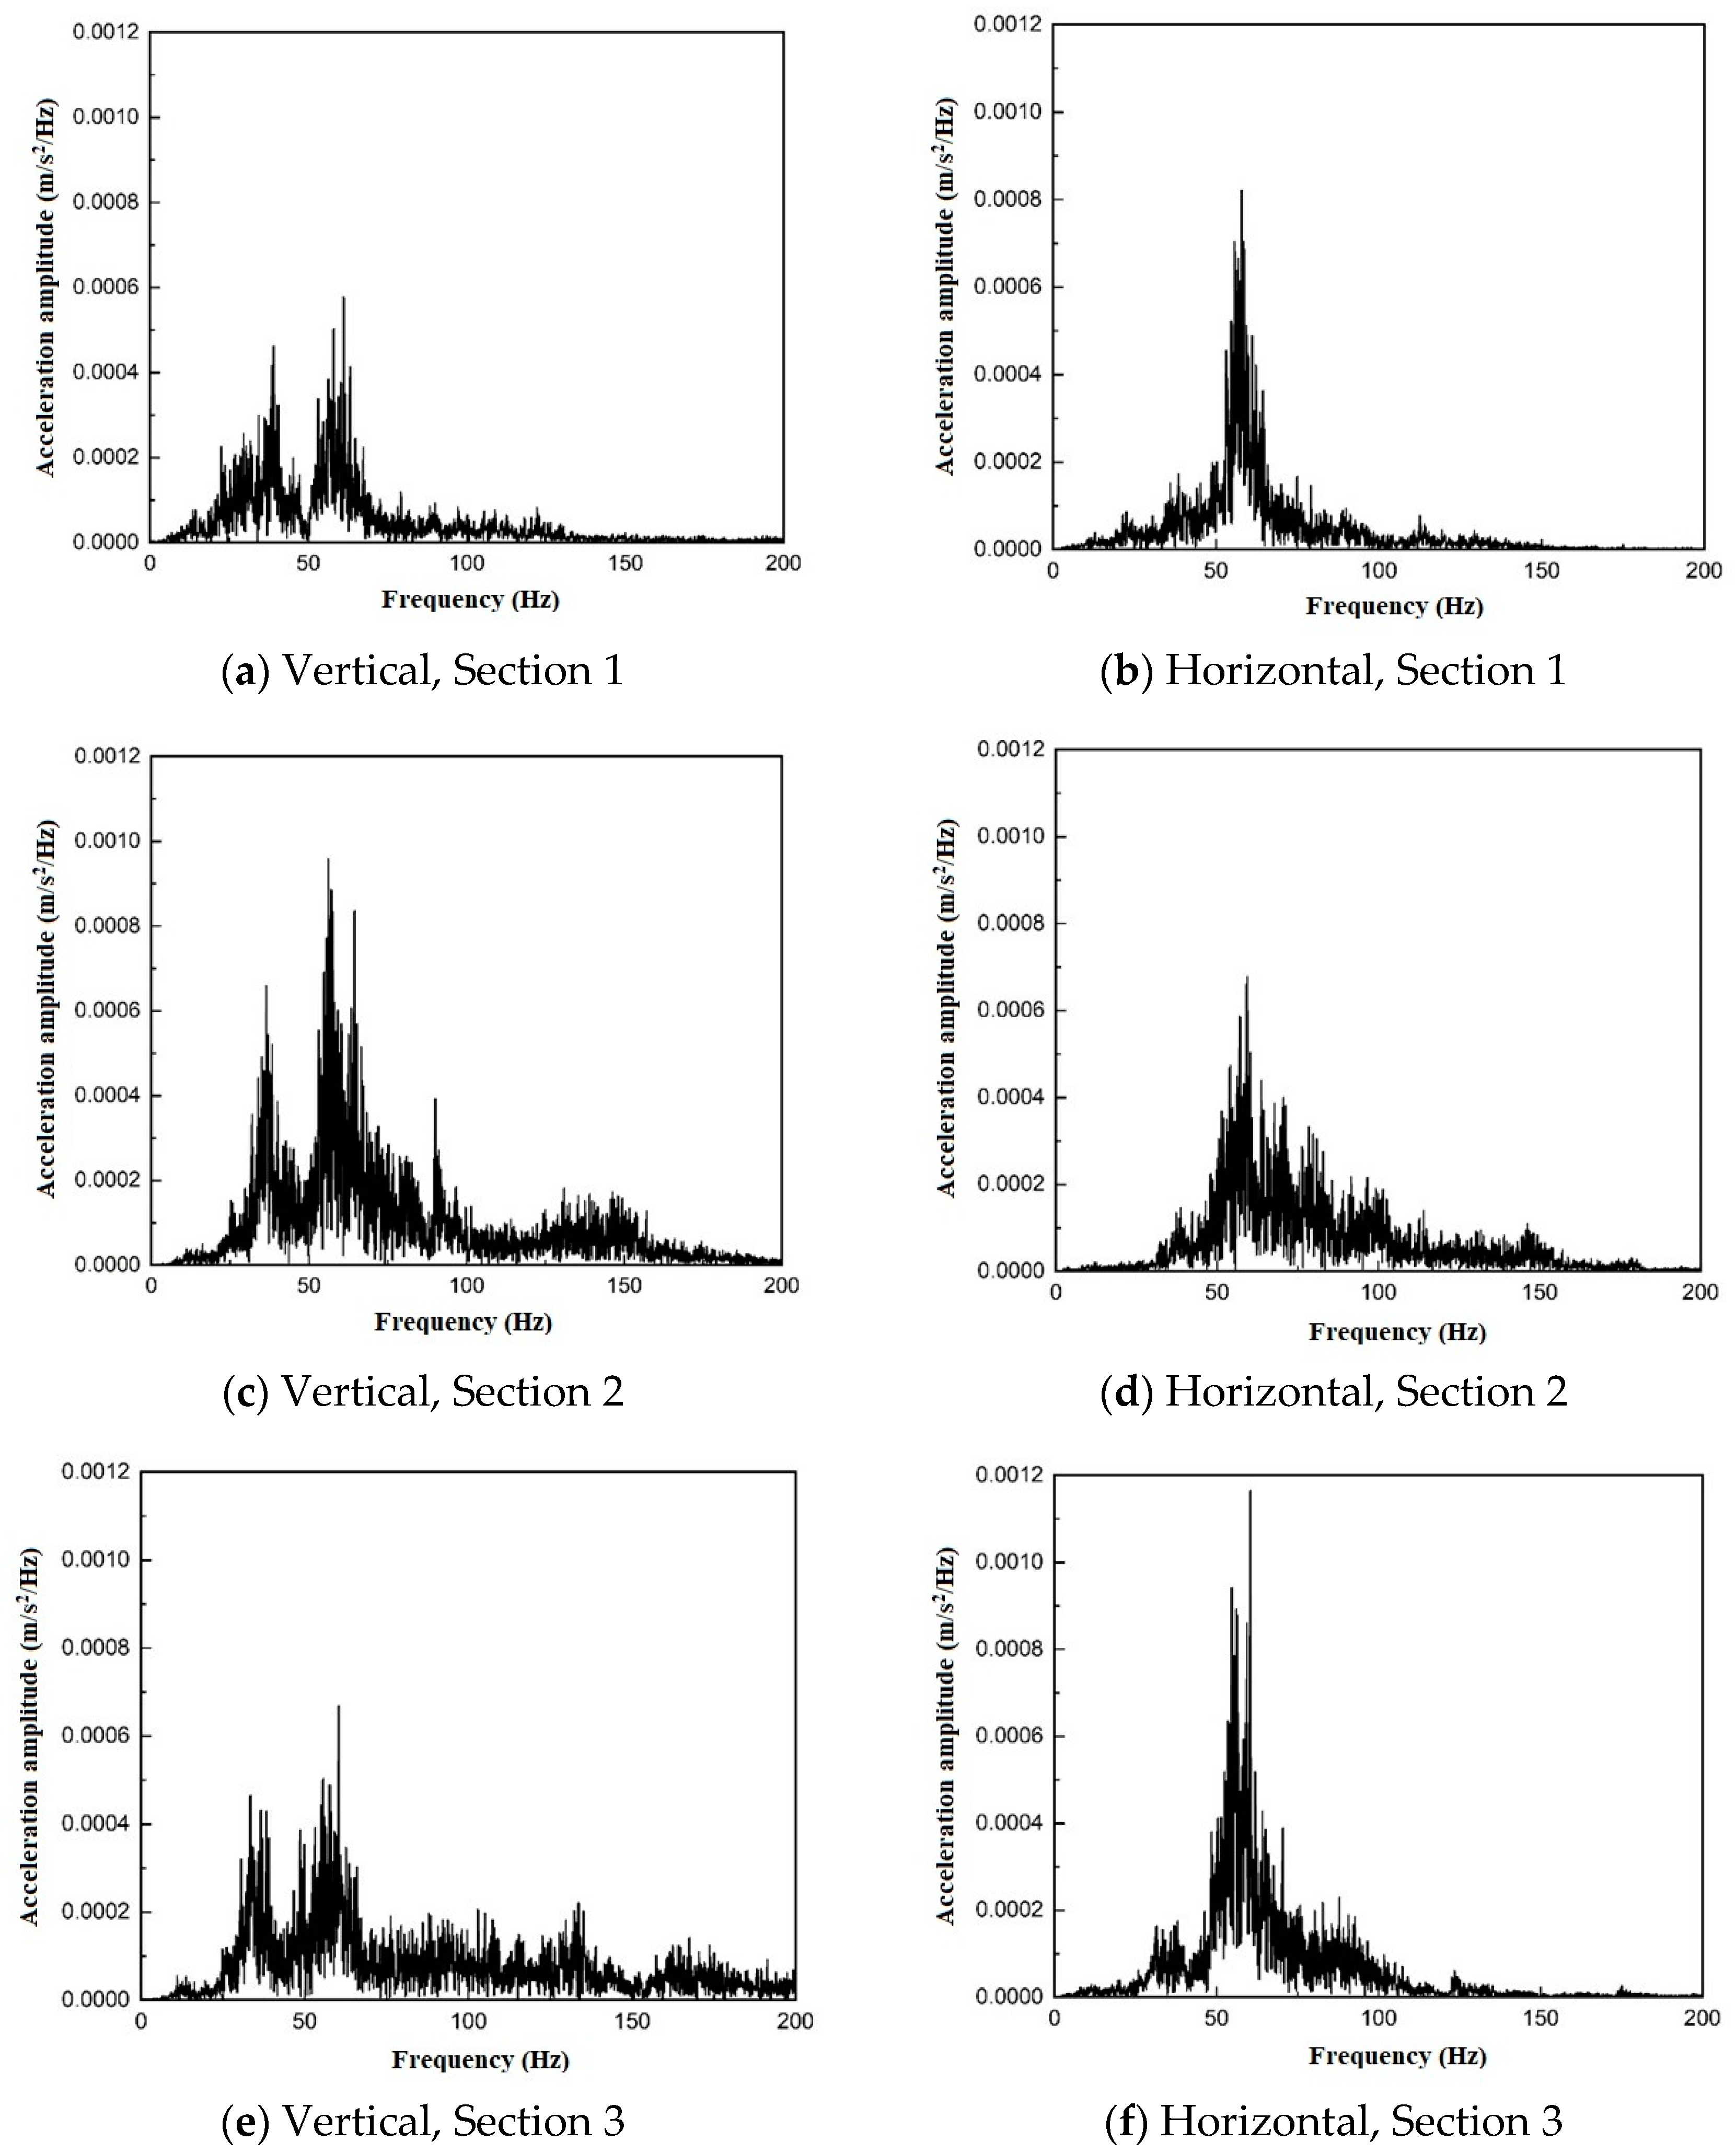
3.3.3. Frequency-Domain Analysis of Trains Acceleration and Deceleration

Upon analyzing the inbound and outbound train vibration spectra at urban stations, as depicted in Figure 15 and Figure 16, it is observed that as the train enters the station, Sections 1 and 2 exhibit vertical direction peaks at 40 Hz and 60 Hz, respectively, while Section 3 demonstrates a peak at 70 Hz. In the horizontal direction, all three sections peak at 60 Hz, with Section 1 exhibiting a broader response frequency band. When the train departs the station, all three sections in the vertical direction display two peak frequencies at 40 Hz and 60 Hz. Section 1 has an additional peak at 40 Hz. The peak frequency for all three sections in the horizontal direction remains at 60 Hz, with Sections 2 and 3 generally displaying a broader frequency band.
The 1/3 octave vibration acceleration level has been computed for the areas adjacent to the station as the train approaches and for those distant from the station as the train departs, with the average values and influence ranges illustrated in Figure 17. The peak value of the average vibration acceleration level for both vertical and horizontal directions is found at 50 Hz, with vertical direction peaks as the train approaches and departs at 59 dB and 56 dB, respectively, and horizontal peaks at 58 dB and 50 dB. Notably, at higher frequencies, the average vibration acceleration level of the train approaching the station is higher in both vertical and horizontal directions compared to that of the train departing, aligning with the Doppler effect. This effect posits that the receiving frequency of a wave increases as the wave source approaches the measuring point and decreases as it recedes. Consequently, the high-frequency vibration acceleration level near the measuring point for the train entering the station is higher than that for the train leaving the station. At lower frequencies, the difference between approaching and departing trains is negligible.
Figure 18 presents the 1/3 octave vibration acceleration level for the vibration caused by the train’s acceleration and deceleration in each section, with the influence range and average values obtained. In the vertical direction, the peak average vibration acceleration levels for the three sections during train deceleration are 66 dB, 68 dB, and 60 dB, respectively, with peak frequencies at 40 Hz, 63 Hz, and 63 Hz. For the train acceleration phases, the average peak vibration acceleration levels are 61 dB, 68 dB, and 60 dB, with peak frequencies at 40 Hz, 63 Hz, and 63 Hz, respectively. In the horizontal direction, the average peak vibration acceleration levels during train deceleration are 71 dB, 69 dB, and 60 dB, with peak frequencies at 63 Hz, 50 Hz, and 63 Hz, respectively. For the acceleration phases, the average peak values are 65 dB, 70 dB, and 71 dB, with peak frequencies consistently at 63 Hz.
When comparing the 1/3 octave vibration acceleration level diagrams for the urban and suburban directions, it is evident that the difference in vibration acceleration levels during train acceleration and deceleration across the three sections is not significant in the low-frequency range. However, in the high-frequency range, from Sections 1 to 3, the vibration acceleration level during train deceleration progressively decreases, while that during acceleration progressively increases. This is consistent with the earlier observation that train vibration is influenced by speed. Specifically, during deceleration, Section 1 is at the position of maximum operating speed, which then gradually decreases. Conversely, during acceleration, Section 1 is at the position of lowest operating speed when the train passes through it and then gradually increases. This indicates that train speed affects vibration, primarily within the high-frequency range, with minimal impact within the low-frequency range.

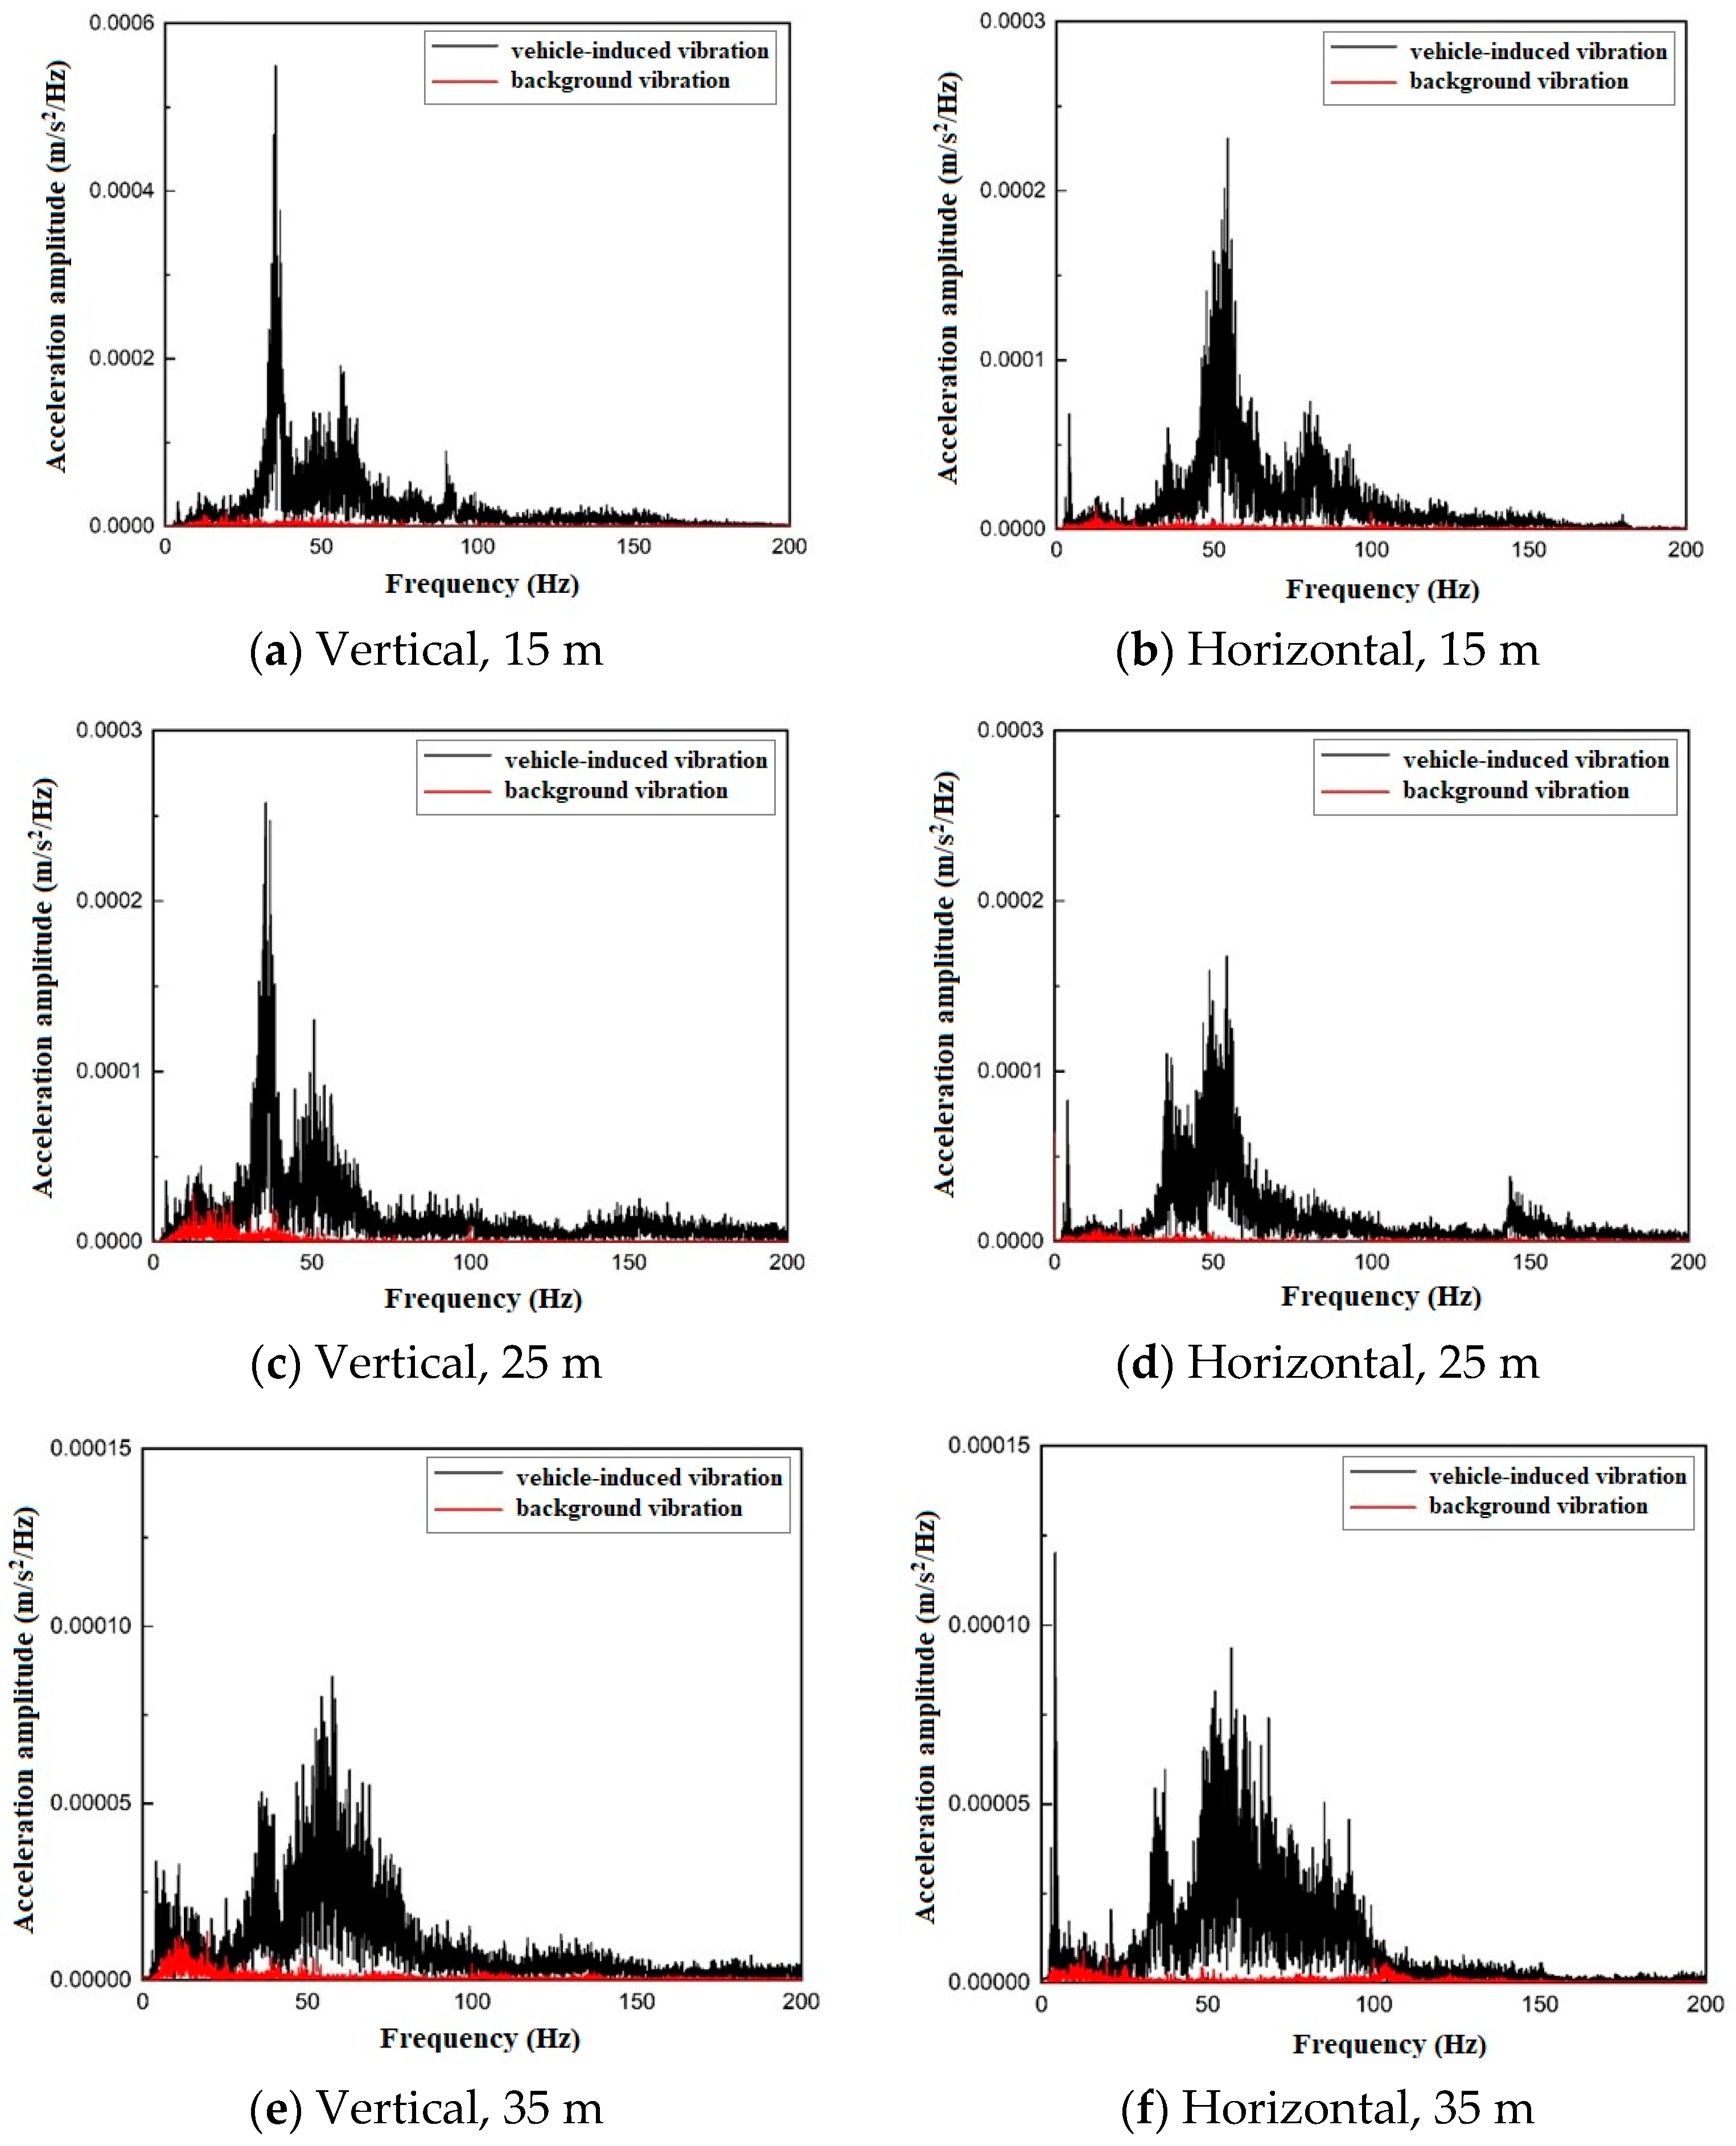
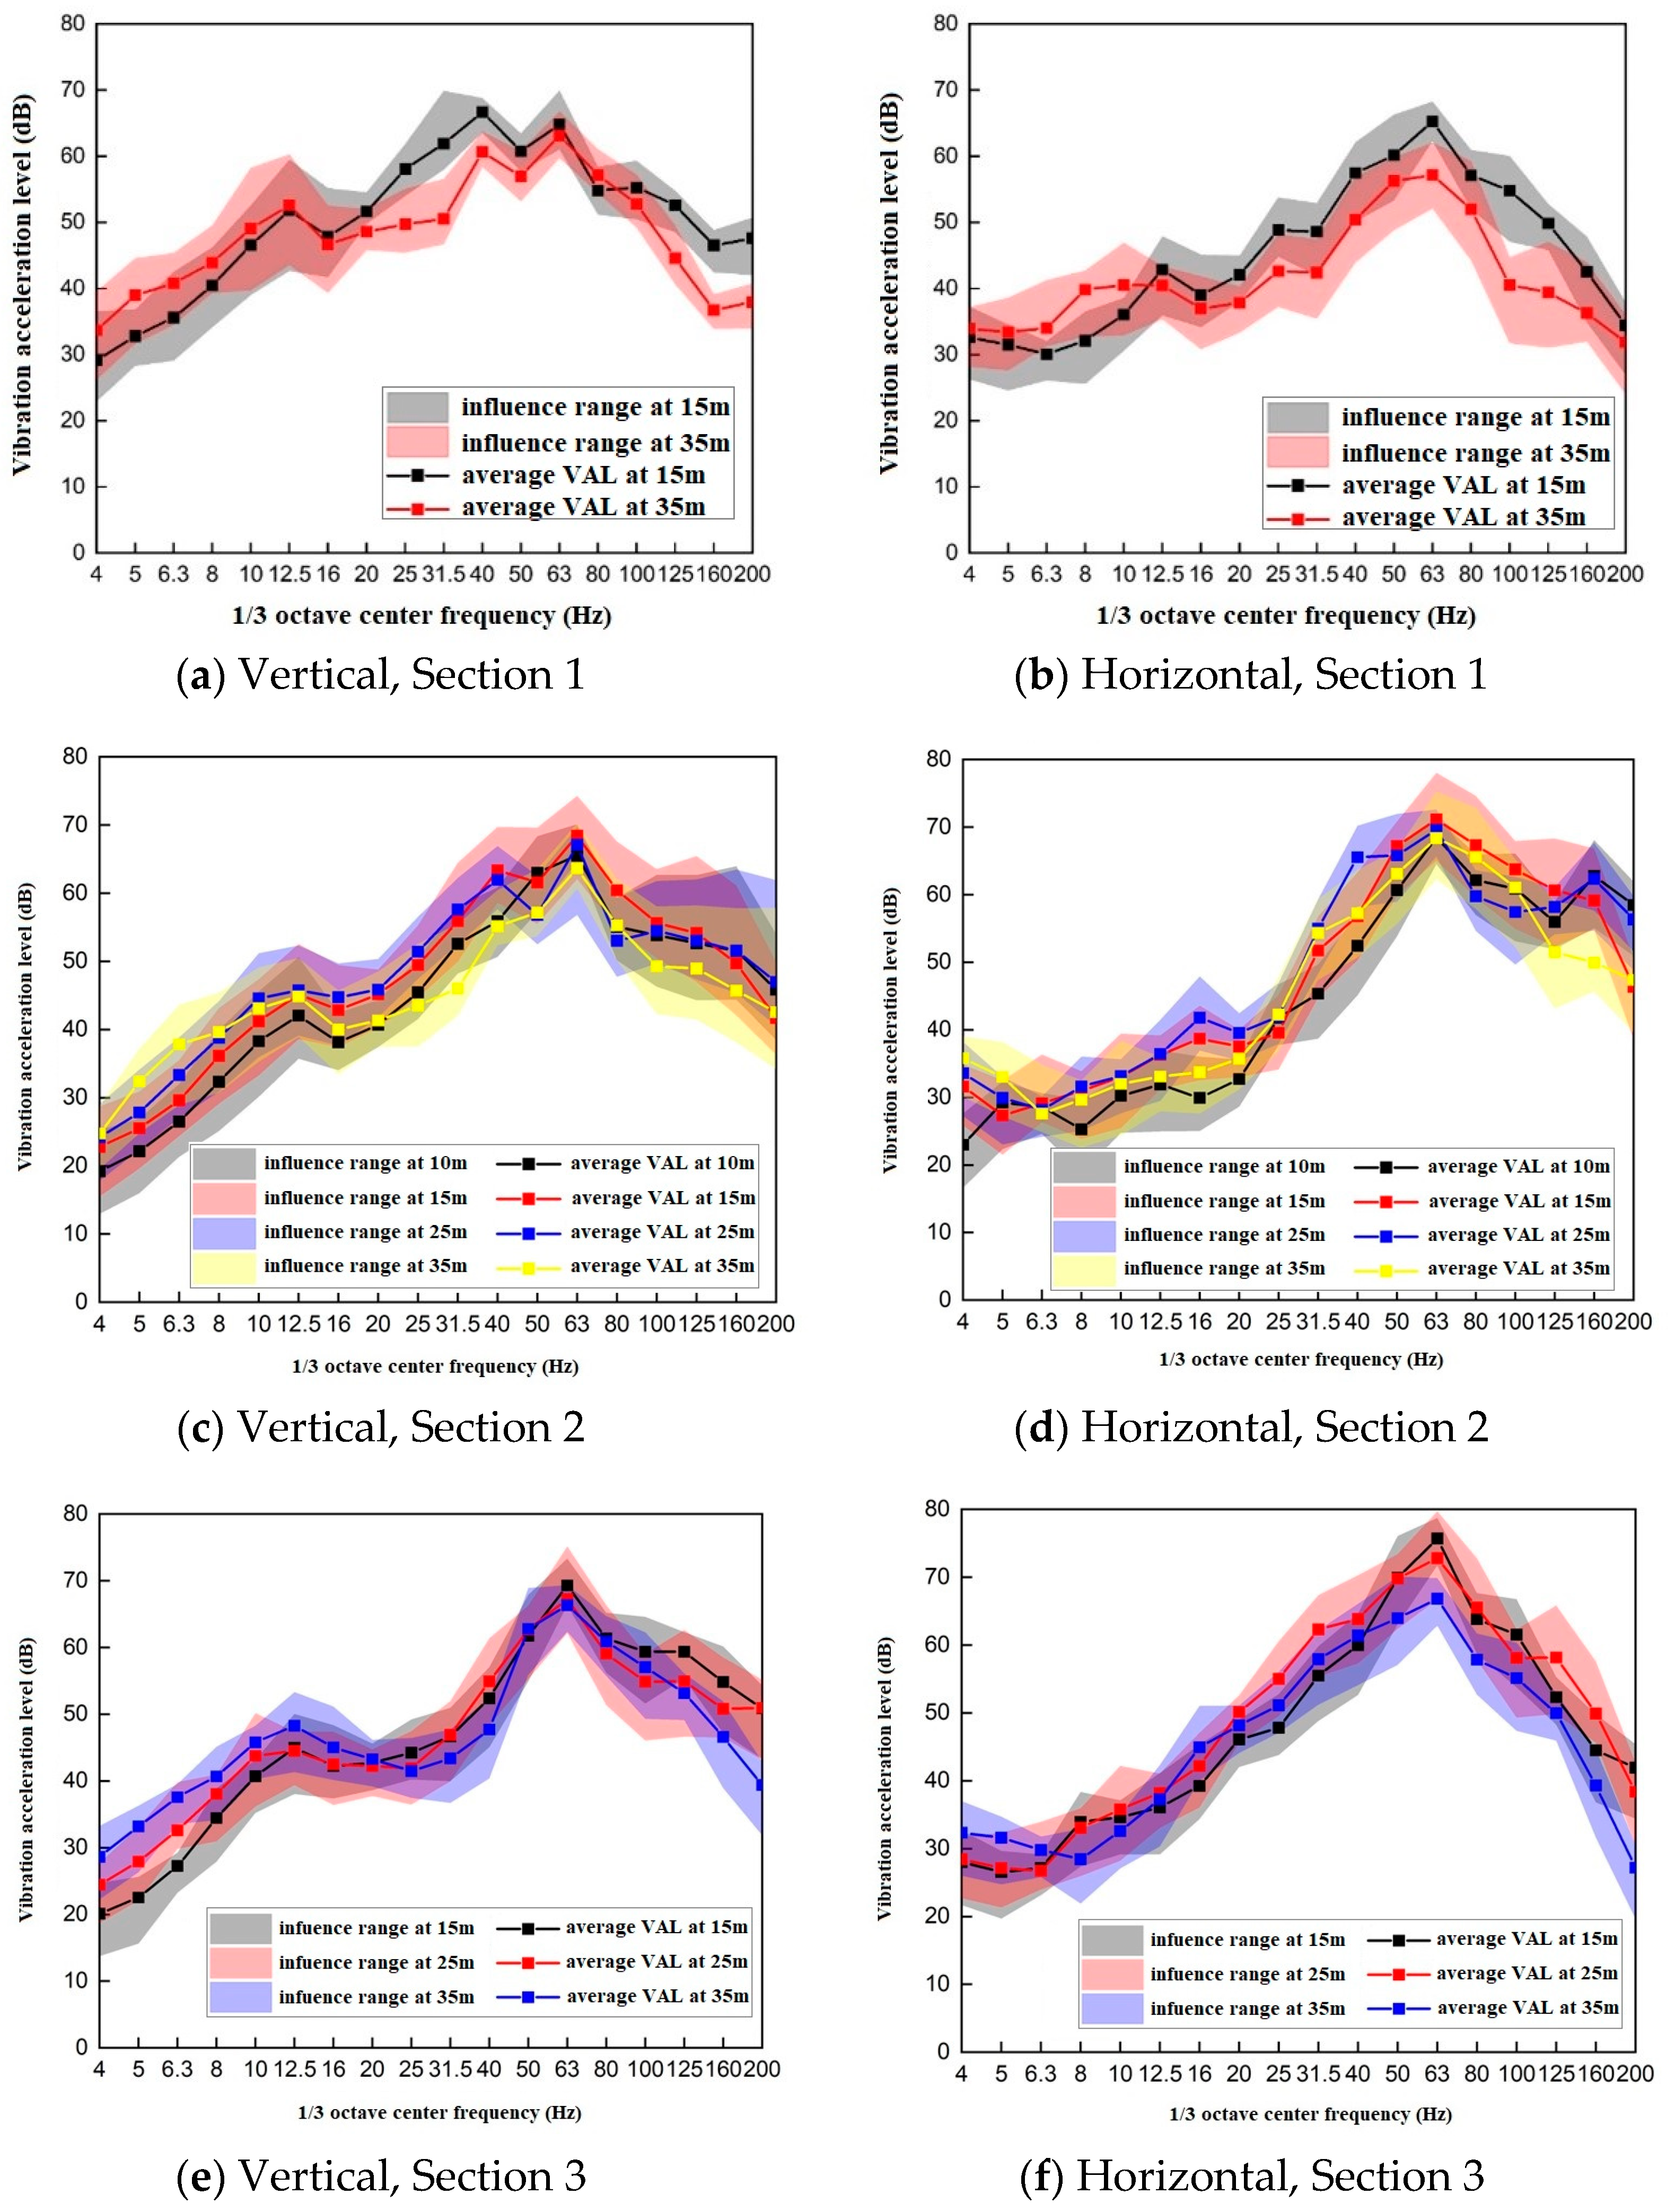
3.4. Characteristics of Vibration Propagation at Different Distances from the Outer Walls of Subway Stations

In order to explore the impact of the proximity to the vibration source on the dissemination of vibrations, this segment isolates a representative vehicle-induced vibration signal derived from the outbound train’s vibrations in the urban direction. Subsequently, the propagation dynamics are examined through a comprehensive analysis of the time-domain and frequency-domain characteristics, along with the proximity to the vibration source across three distinct sections.

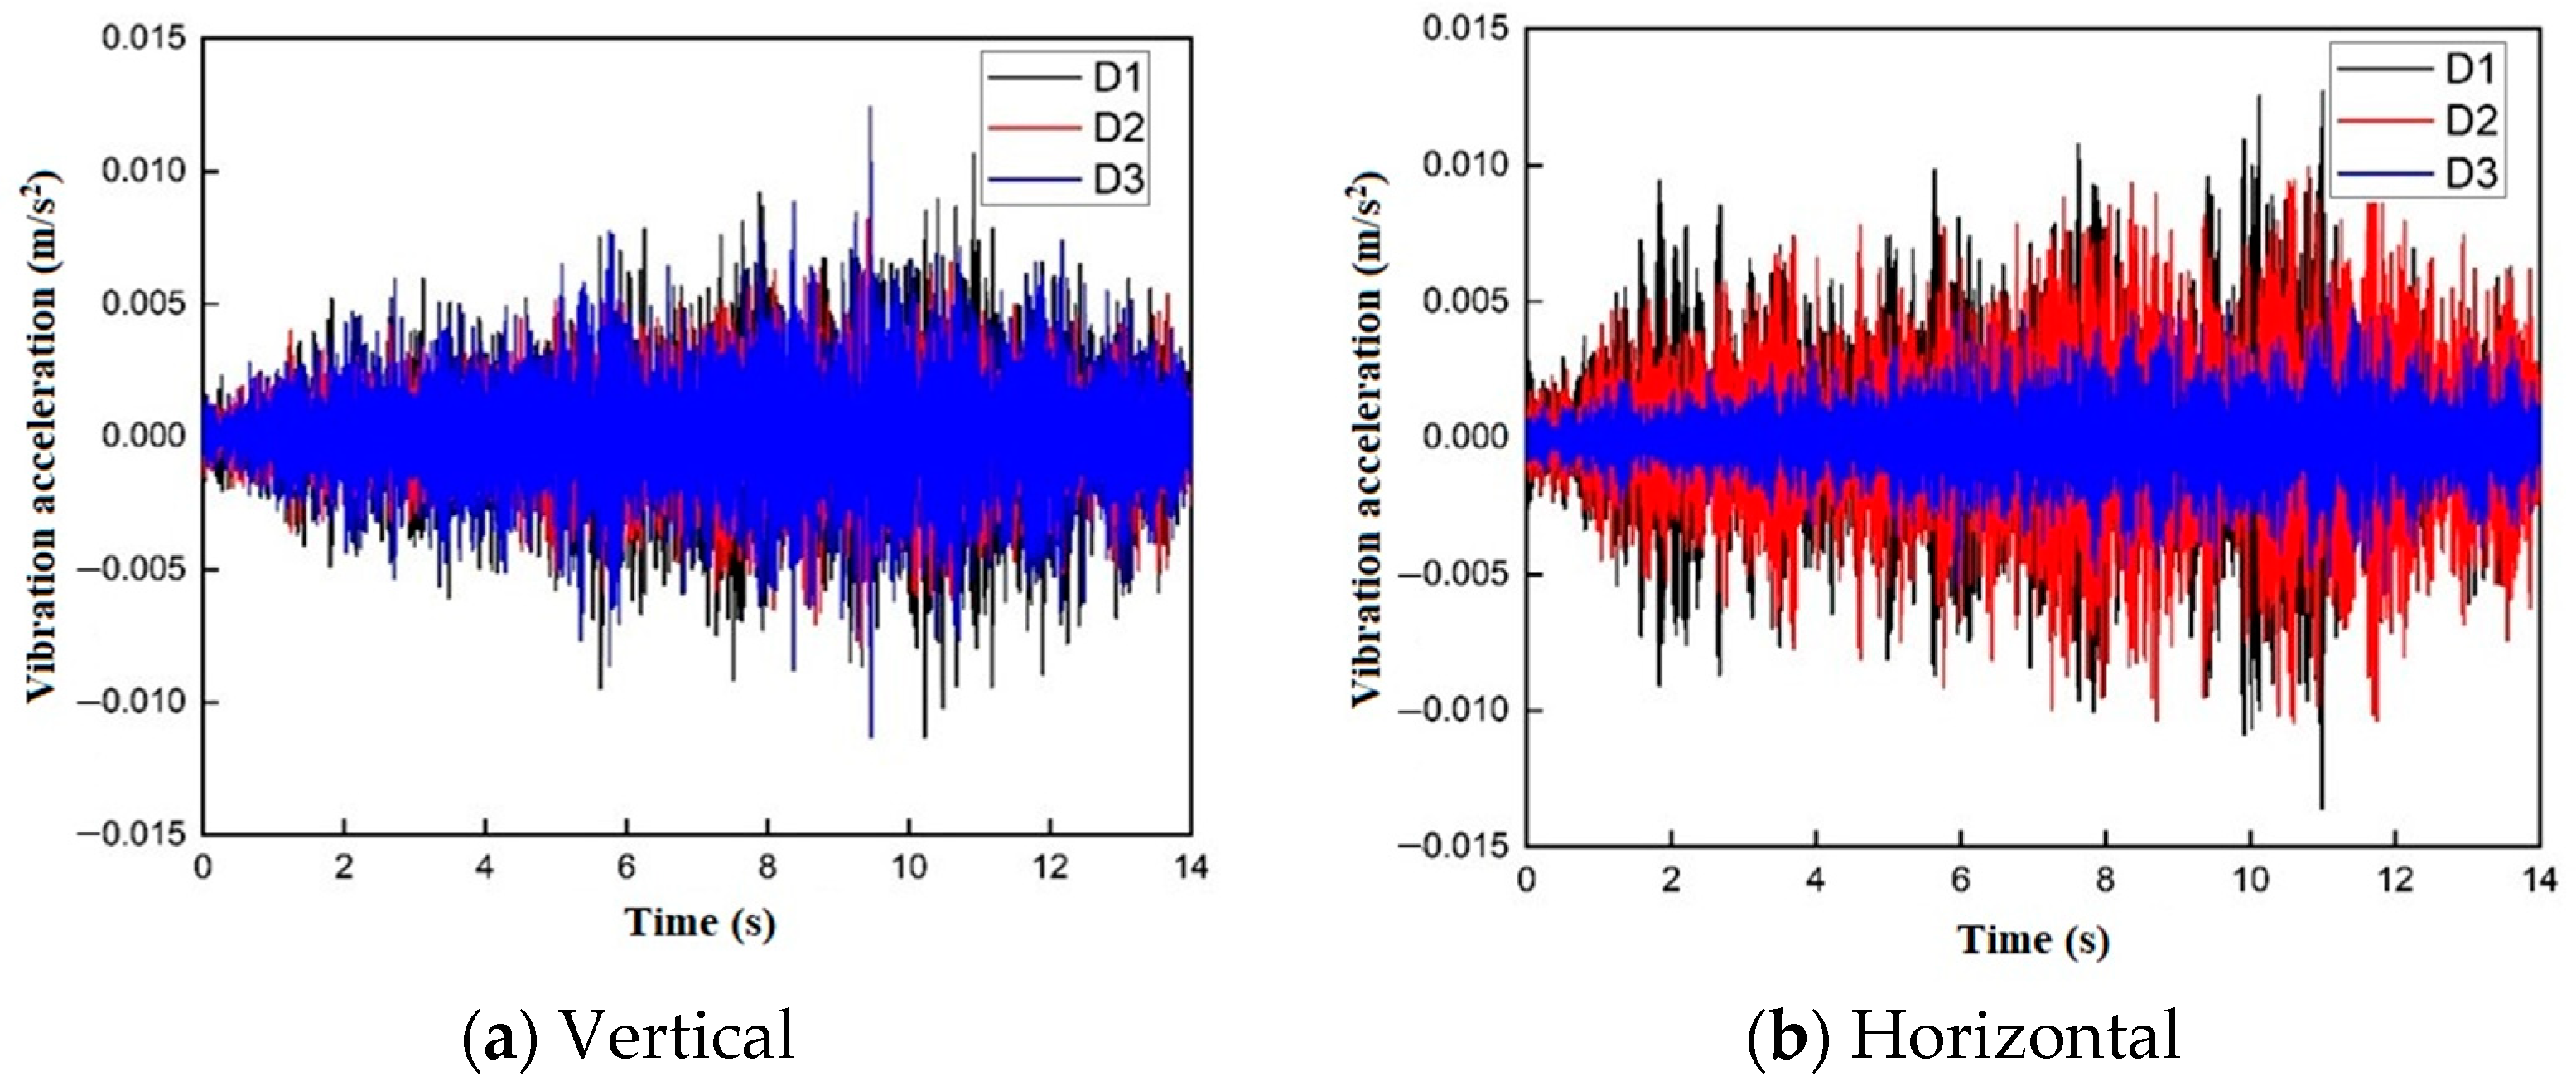
3.4.1. Time-Domain Analysis of Trains at Different Distances from the Outer Walls of Subway Stations

The integration of a time-frequency diagram into the time-domain analysis facilitates the examination of the time and frequency attributes of vibration signals at varying distances from the external walls of subway stations. The measuring points K1 and K2 within Section 1 are positioned 20 m apart. As depicted in Figure 19 and Figure 20, in the vertical direction, the peak acceleration diminishes from 0.005 m/s2 to 0.0025 m/s2, with the predominant frequency bands confined to 30~70 Hz, whereas in the horizontal direction, the peak acceleration decreases from 0.005 m/s2 to 0.001 m/s2, with the predominant frequency bands concentrated from 30 to 60 Hz. Generally, K1 exhibits a richer presence of both high- and low-frequency components compared to K2.
Within Section 2, the measuring points B1 and B2 are separated by 5 m, while B2, B3, and B4 are 10 m apart from each other. As illustrated in Figure 21 and Figure 22, in the vertical direction, the peak acceleration of B2, B3, and B4 diminishes from 0.008 m/s2 to 0.005 m/s2 and 0.004 m/s2, respectively. However, due to B1’s proximity to the parking lot’s external wall, its vibrations are restricted, resulting in a reduced peak acceleration. Consequently, despite being closer to the subway station’s external wall, B1’s peak acceleration is 0.005 m/s2, lower than B2. Horizontally, the peak acceleration of B2, B3, and B4 decays from 0.005 m/s2 to 0.004 m/s2. The principal frequency bands in both vertical and horizontal directions are concentrated within the range of 50 Hz to 60 Hz, with B1, B2, and B3 demonstrating a more copious high-frequency response than B4.
Within Section 3, the measuring points D1, D2, and D3 are each spaced 10 m apart. As depicted in Figure 23 and Figure 24, in the vertical direction, the peak acceleration of D1, D2, and D3 decreases from 0.006 m/s2 to 0.005 m/s2. The main frequency bands are all within the 40 Hz to 60 Hz spectrum, with the high-frequency component progressively diminishing. In the horizontal direction, the peak acceleration of D1, D2, and D3 falls from 0.009 m/s2 to 0.008 m/s2 and 0.003 m/s2, with the main frequency band ranging from 50 Hz to 60 Hz, and the high-frequency component also decreases progressively. Moreover, for measuring points D1 and D2 in the same section, the horizontal acceleration peak is higher than that in the vertical direction. This suggests that as the train traverses the section, the horizontal track irregularity exceeds that of the vertical, with the vibration attenuation in the horizontal direction occurring more rapidly beyond a 25 m distance, and the attenuation at D3 being particularly pronounced.
According to the analysis of these three sections, the vibration acceleration typically diminishes with increasing distance. At distances of 15 m and 35 m from the subway station’s external wall, the vibration attenuation in the vertical direction of Sections 1, 2, and 3 is 50%, 50%, and 16.7%, respectively, while in the horizontal direction, the attenuation is 80%, 20%, and 66.7%. It is observed that the horizontal vibration attenuation rate of Sections 1 and 3 exceeds that of the vertical direction, and the vibration attenuation rate in Section 1 is higher than that in Sections 2 and 3, which correlates with the characteristics of the soil layer beneath each section. At distances of 15 m and 25 m from the subway station’s external wall, Sections 2 and 3 exhibit vertical attenuation of 37.5% and 16.7%, and horizontal attenuation of 25% and 11.1%, respectively. At distances of 25 m and 35 m from the subway station’s external, Section 2 shows a 20% vertical attenuation, whereas Section 3 does not. In the horizontal direction, Section 2 shows no attenuation, while Section 3’s attenuation reaches 62.5%. The slow attenuation in the vertical direction at distances of 25 m to 35 m from the subway station’s external wall within both sections is attributed to the soil layer properties. Considering that the soil’s elastic modulus at this distance is affected by the surface layer’s hardening, it hinders vibration attenuation, indicating a non-linear relationship between vibration attenuation and increasing distances.

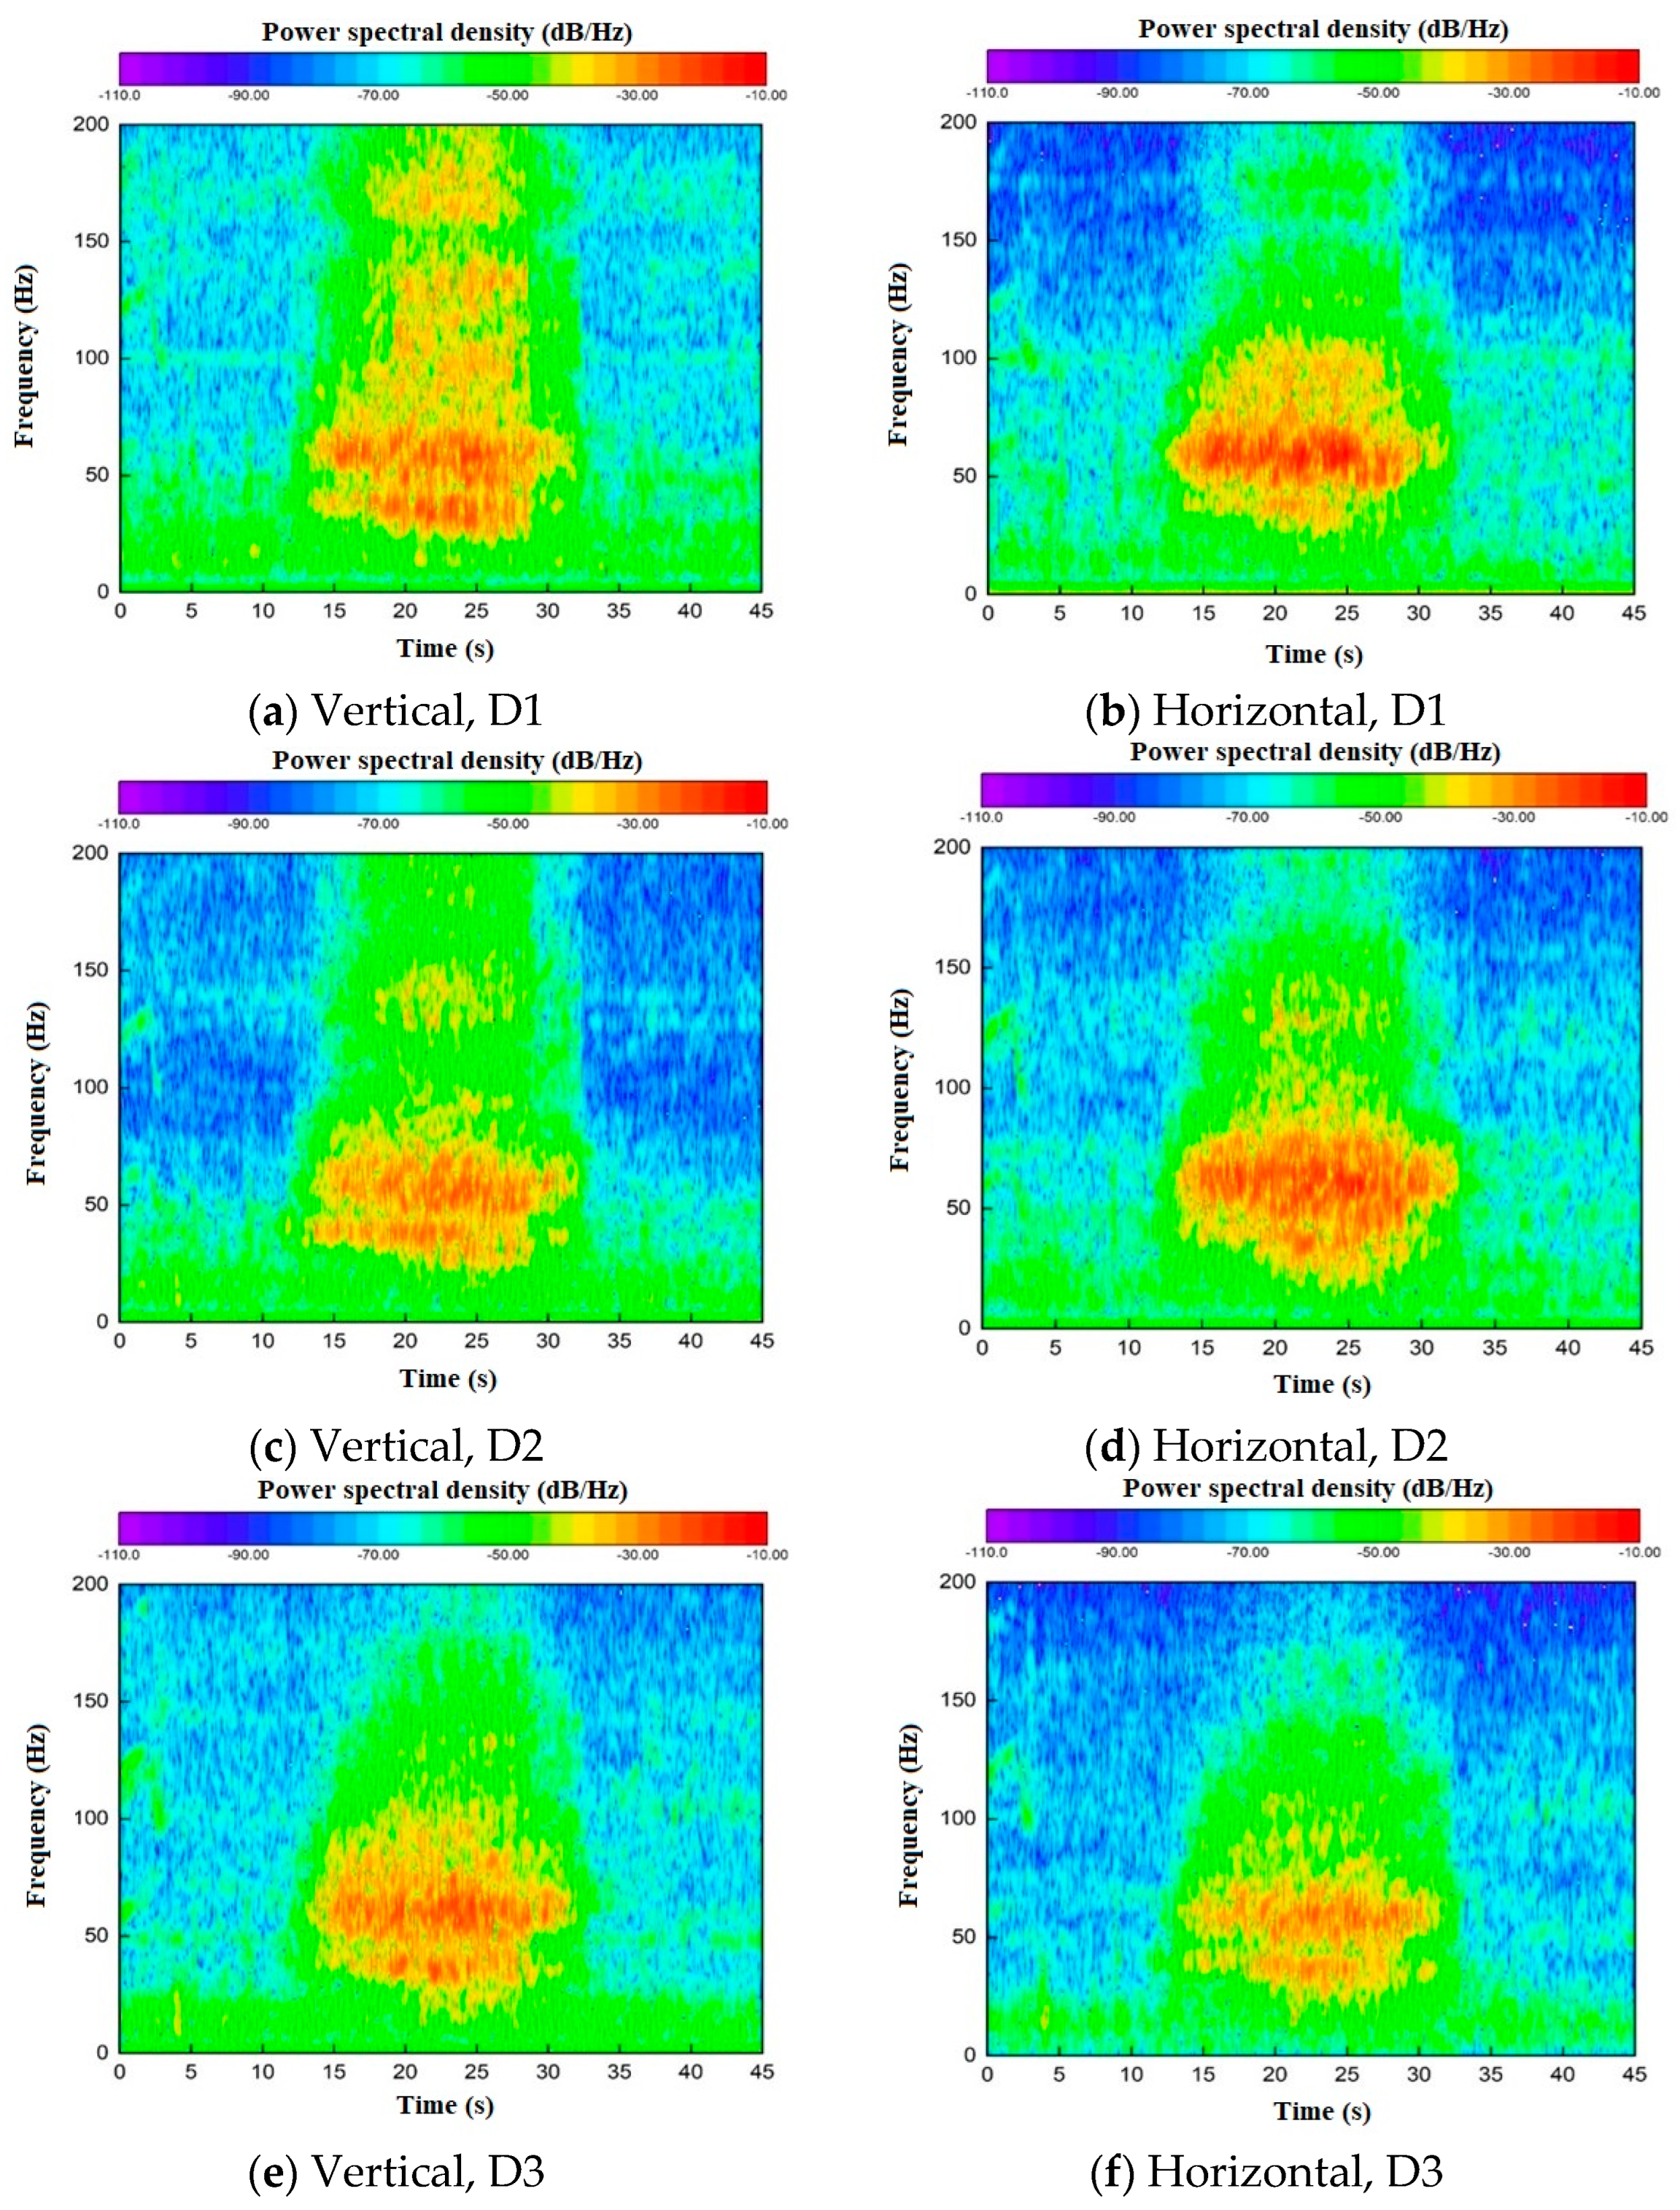
3.4.2. Frequency-Domain Analysis of Trains at Different Distances from the Outer Walls of Subway Stations

Figure 25 delineates the typical vehicle-induced vibration spectra at each measuring point across three sections along the urban departure direction. In the vertical direction of Section 1, the spectra for K1 and K2 exhibit dual peaks at 40 Hz and 60 Hz. Conversely, in the horizontal direction, a singular peak occurs at 60 Hz. As the distance from the source increases, the amplitude of acceleration diminishes, and this effect becomes more pronounced in the horizontal direction. Considering the characteristics of the soil layer in Section 1, the vibration in the horizontal direction is easier to propagate and be affected than that in the vertical direction, and the attenuation is obvious. The spectrum of Section 2 is close to each other in vertical and horizontal directions, and the frequency bands of B1, B2, B3, and B4 are wide. B3 has two peaks at 40 and 60 Hz, B1 and B4 have a peak at 60 Hz, and the main frequency band of B2 in the vertical direction ranges from 30 Hz to 90 Hz with multiple peaks. In the horizontal direction, the peak appears at 60 Hz. With the increase in distance, the number of small peaks in the high-frequency band gradually decreases, and the peak frequency gradually concentrates at 60 Hz. Because B1 is close to the wall, the wall is affected by train vibration, and its own vibration leads to the abundance of the B1 high-frequency band. Section 3 Spectrum in the vertical direction, D1, D2, and D3 each have two peaks at 40 and 60 Hz, as displayed in Figure 25. In the horizontal direction, the peak value appears at 60 Hz, and the peak value appears at 40 Hz, but the acceleration amplitude is small. With the increase in distance, there is little difference in the acceleration amplitude in the vertical direction, and D3 attenuates obviously when the distance of Section 3 is greater than 70 Hz. It is considered that the distance of Section 3 has little effect on the attenuation of vertical vibration, while the soil attenuates at a high frequency in a small amplitude. In the horizontal direction, the vibration attenuation is obvious.
Upon analyzing the vehicular-induced vibrations recorded at various measuring points across different sections, a dataset comprising 20 vehicle traversal instances was utilized to ascertain the 1/3 octave vibration acceleration levels. As depicted in Figure 26, the influence range and average vibration values were determined. Vertically for Section 1, the maximum average vibration acceleration level observed at 15 m from the subway station’s external wall was 65 dB, with a peak frequency of 40 Hz. At a distance of 35 m, the peak frequency decreases to 61 dB, with the peak frequency shifting to 63 Hz. In the horizontal direction, the maximum average vibration acceleration level was 62 dB at a distance of 15 m, with a peak frequency of 40 Hz, while at 35 m, it reduced to 55 dB, maintaining the same peak frequency. Vertically for Section 2, the maximum average vibration acceleration level was 68 dB at 15 m from the subway station’s outer wall, declining to 65 dB at 25 m, 62 dB at 35 m, and 63 dB at 10 m, with the peak frequency consistent at 63 Hz across all distances. Horizontally, the peak average vibration acceleration level was 70 dB at 15 m, decreasing to 68 dB at 25 m, and 67 dB at both 10 m and 35 m, with the peak frequency for all four distances also remaining at 63 Hz. In Section 3, vertically, the peak average vibration acceleration level was 69 dB at 15 m from the subway station’s external wall, decreasing to 67 dB at 25 m, and further to 66 dB at 35 m, with the peak frequency consistently at 63 Hz. In the horizontal direction, the peak vibration acceleration level was 76 dB at 15 m, with an attenuation of 72 dB at 25 m, and 65 dB at 35 m, with a peak frequency maintained at 63 Hz. At measuring points D1 and D2 within this section, the average horizontal vibration acceleration levels were found to be higher than those in the vertical direction, also with a higher peak frequency, which was influenced by the ground’s reflection and scattering, as well as the site wall structure, facilitating greater propagation of vibrations in the horizontal direction.
The former results of the three sections indicate that the vertical vibration levels at the nine measuring points, located at 15 m, 25 m, and 35 m from the subway station’s outer wall, do not exceed the specified daytime limit of 70 dB. Notably, measuring points in Sections 2 and 3, located 15 m from the subway station’s external wall, reach 69 dB, which is close to the specified threshold. At the distances of 15 m and 35 m from the subway station’s outer wall, the peak average vibration acceleration level in the vertical direction of all three sections experiences respective attenuations of 4 dB, 6 dB, and 3 dB, while the peak average vibration acceleration level in the horizontal direction attenuates by 7 dB, 3 dB, and 11 dB, respectively. When examining the attenuation from 15 m to 25 m and from 25 m to 35 m in Sections 2 and 3, it is evident that the vibration diminishes progressively within the range from 15 m to 35 m. In the vertical direction, the vibration attenuation observed in Sections 1 and 2 is more pronounced than that of cross-Section 3. The variation in vibration attenuation is correlated with the train’s speed and the duration of its passage. As the train accelerates out of the station, Section 3 experiences the longest exposure time, and the train’s speed upon exiting the section is also the largest, yielding a more comprehensive collection of vibration signals that reflect the train’s attenuation. Conversely, sections with shorter train passage time and slower speed upon exit result in greater attenuation of the collected vibration signals.

4. Conclusions

In this study, field measurements of soil vibration adjacent to an operational railway station in Foshan were conducted to investigate the propagation behavior of vibrations caused by subway train operations. The analysis focused on three key aspects: the direction of train travel, the acceleration and deceleration of trains as they enter and exit the station, and the distance from the subway station. The response characteristics of the vibration were examined in both the time and frequency domains for both vertical and horizontal directions. The principal findings are as follows:
In the time domain, the amplitude of background vibration acceleration remained below 3 × 10⁻⁴ m/s2, significantly lower than that of vehicle-induced vibration. In the frequency domain, the primary frequency of background vibration ranged from 0 to 10 Hz, which is inconsistent with the 40 to 60 Hz range of vehicle-induced vibration. Therefore, the background vibration at the experiment site minimally impacted the experiment results.
Due to the effect of vibration-damping fastenings, the low-frequency vibration of trains in the suburban direction was found to be greater than that in the urban direction. Moreover, as the suburban direction is located on the side farther from the rail, the peak vibration acceleration in the vertical direction within each section was within the range of 0.001 m/s2 to 0.005 m/s2, lower than that of the 0.004 m/s2 to 0.008 m/s2 range observed in the urban direction.
When the train decelerated to enter the station and accelerated to exit, the resulting vibration waves exhibited the Doppler effect. The ground soil vibration acceleration caused by the train was influenced by the train’s weight and speed, positively correlating with both. However, the currently available measured data were insufficient to accurately ascertain the impact of train deceleration or acceleration on ground vibration acceleration.
When compared with the daytime limit of 70 dB vertically in China’s current industry standard, the nine measuring points at distances of 15 m, 25 m, and 35 m from the subway station’s outer wall within the three sections did not surpass the limit. Specifically, Section 2 and 3 reached 69 dB at a distance of 15 m from the outer wall, which was close to the limit.
As the distance increased, the vibration at the measuring points progressively attenuated, although the attenuation pattern was non-linear. The attenuation rate was influenced by the hardening of the adjacent soil layer, with a higher elastic modulus after hardening resulting in a slower vibration attenuation rate. Vibration attenuation was also affected by factors such as train speed and passage time. Specifically, as the train spent a short time passing through a section and exiting at a low speed, fewer vibration signals were collected, leading to a perceived larger vibration attenuation.

5. Future Work

While this study provides critical insights into the vibration propagation behaviors of non-uniform speed subway trains, several limitations must be acknowledged. First, the experimental data were collected at a single site with a limited sample size over a short-term period. While the methodology aligns with localized vibration studies [15,24], site-specific geological and structural characteristics may limit the generalizability of conclusions. Future work should expand measurements to diverse geotechnical environments and structural configurations, as well as long-term monitoring to evaluate the universality of vibration propagation patterns.
Second, the analysis did not account for seasonal climatic impacts on geological properties, which may modulate vibration propagation pathways. Seasonal variations in soil properties—such as moisture content and temperature—could significantly alter wave propagation dynamics. Future research should incorporate year-round measurements to quantify these seasonal effects and validate the robustness of the proposed models.
Additionally, the current dataset lacks granularity to decouple speed-dependent effects during transient operational phases (acceleration/deceleration), as speed variations were conflated with confounding factors like passenger load fluctuations. Future work should integrate high-resolution train telemetry with vibration monitoring to isolate speed-dependent effects. In addition, a phased analysis framework would differentiate vibration characteristics between transient operational phases and steady-state operations, supported by numerical simulations validated against field data.

Author Contributions

Methodology, Y.S.; Investigation, Y.S. and N.C.; Writing—original draft, Y.S.; Writing—review and editing, N.C. and Y.C.; Supervision, Y.C.; Funding acquisition, Y.C. All authors have read and agreed to the published version of the manuscript.

Funding

This research was funded by the education bureau of Guangzhou municipality, grant number 2024312560, and Guangzhou Railway Polytechnic, grant number GTXYR2210.

Data Availability Statement

Dataset available on request from the authors.

Conflicts of Interest

Author Na Cai is employed by the company Zhejiang Taicheng Environmental Technology Co., Ltd. The authors declare that the research was conducted in the absence of any commercial or financial relationships that could be construed as a potential conflict of interest.

References

  1. Zhang, X. Forty years of highly synchronous development in China’s scientific research and economy. Natl. Sci. Rev. 2018, 5, 796–798. [Google Scholar]
  2. Sun, M.; Liu, Y. Economic growth and urban rail transit development: Evidence from China’s megacities. Transp. Policy 2021, 98, 62–72. [Google Scholar]
  3. Chen, J.; Xu, G. Urban rail transit systems in China: Current trends and future challenges. Cities 2023, 134, 104021. [Google Scholar]
  4. Wang, J.; Zhang, L. The impact of economic growth on the development of urban rail transit in China. J. Urban Plan. Dev. 2021, 147, 04021025. [Google Scholar]
  5. Zhang, Y.; Chen, Z. Urbanization and its impact on public transportation: Evidence from major Chinese cities. Transp. Res. Part A Policy Pract. 2022, 156, 262–274. [Google Scholar]
  6. Liu, W.; Lund, H.; Mathiesen, B.V. Modelling the transport system in China and evaluating the current strategies towards the sustainable transport development. Energy Policy 2013, 58, 347–357. [Google Scholar]
  7. Xu, Q.-Y.; Ou, X.; Au, F.; Lou, P.; Xiao, Z.-C. Effects of track irregularities on environmental vibration caused by underground railway. Eur. J. Mech.-A/Solids 2016, 59, 280–293. [Google Scholar]
  8. Tao, Z.; Wang, Y.; Sanayei, M.; Moore, J.A.; Zou, C. Experimental study of train-induced vibration in over-track buildings in a metro depot. Eng. Struct. 2019, 198, 109473. [Google Scholar] [CrossRef]
  9. Zou, C.; Li, X.; He, C.; Zhou, S. An efficient method for estimating building dynamic response due to train operations in tunnel considering transmission path from source to receiver. Comput. Struct. 2024, 305, 107555. [Google Scholar] [CrossRef]
  10. Liu, Q.; Li, X.; Zhang, X.; Zhou, Y.; Chen, Y.F. Applying constrained layer damping to reduce vibration and noise from a steel-concrete composite bridge. J. Sandw. Struct. Mater. 2020, 22, 1743–1769. [Google Scholar] [CrossRef]
  11. Li, X.; Chen, Y.; Zou, C.; Wang, H.; Zheng, B.; Chen, J. Building structure-borne noise measurements and estimation due to train operations in tunnel. Sci. Total Environ. 2024, 926, 172080. [Google Scholar] [CrossRef]
  12. Huang, S.; Chen, Y.; Zou, C.; Jian, S. Train-induced environmental vibrations by considering different building foundations along curved track. Transp. Geotech. 2022, 35, 100785. [Google Scholar] [CrossRef]
  13. Qu, S.; Yang, J.; Zhu, S.; Zhai, W.; Kouroussis, G.; Zhang, Q. Experimental study on ground vibration induced by double-line subway trains and road traffic. Transp. Geotech. 2021, 29, 100564. [Google Scholar]
  14. Gutowski, T.G.; Dym, C.L. Propagation of ground vibration: A review. J. Sound Vib. 1976, 49, 179–193. [Google Scholar]
  15. Zou, C.; Wang, Y.; Moore, J.A.; Sanayei, M. Train-induced field vibration measurements of ground and over-track buildings. Sci. Total Environ. 2017, 575, 1339–1351. [Google Scholar] [PubMed]
  16. Di, H.; Su, G.; Yu, J.; Xu, Y.; Xu, P.; Zhou, S. Field measurement and evaluation of vibrations inside buildings above metro tunnels. Soil Dyn. Earthq. Eng. 2023, 166, 107767. [Google Scholar]
  17. Forrest, J.A.; Hunt, H.E.M. A three-dimensional tunnel model for calculation of train-induced ground vibration. J. Sound Vib. 2006, 294, 678–705. [Google Scholar]
  18. He, C.; Jia, Y.; Zhou, S. Semi-analytical method for calculating ground vibrations from a tunnel in a homogeneous half-space with an irregular surface. J. Sound Vib. 2024, 591, 118615. [Google Scholar]
  19. He, C.; Zhou, S.; Guo, P.; Di, H.; Zhang, X. Analytical model for vibration prediction of two parallel tunnels in a full-space. J. Sound Vib. 2018, 423, 306–321. [Google Scholar]
  20. Qiu, Y.; Zou, C.; Hu, J.; Chen, J. Prediction and mitigation of building vibrations caused by train operations on concrete floors. Appl. Acoust. 2024, 219, 109941. [Google Scholar]
  21. Zhang, J.; Xi, C.; Sun, Y.; Li, G.; Liu, J.; Wang, M. Analysis of antideformation and antivibration effect of different track beds under subway train vibration. Shock Vib. 2022, 2022, 4814039. [Google Scholar]
  22. Tao, Z.Y.; Zou, C.; Yang, G.R.; Wang, Y.M. A semi-analytical method for predicting train-induced vibrations considering train-track-soil and soil-pile-building dynamic interactions. Soil Dyn. Earthq. Eng. 2023, 167, 107822. [Google Scholar]
  23. Hu, J.; Zou, C.; Liu, Q.; Li, X.; Tao, Z. Floor vibration predictions based on train-track-building coupling model. J. Build. Eng. 2024, 89, 109340. [Google Scholar]
  24. Shi, W.; Bai, L.; Han, J. Subway-induced vibration measurement and evaluation of the structure on a construction site at curved section of metro line. Shock Vib. 2018, 2018, 5763101. [Google Scholar]
  25. Huang, Q.; Li, P.; Zhang, D.; Huang, H.; Zhang, F. Field measurement and numerical simulation of train-induced vibration from a metro tunnel in soft deposits. Adv. Civ. Eng. 2021, 2021, 6688746. [Google Scholar]
  26. He, C.; Zhou, S.; Guo, P. An efficient three-dimensional method for the prediction of building vibrations from underground railway networks. Soil Dyn. Earthq. Eng. 2020, 139, 106269. [Google Scholar]
  27. Lei, X.; Jiang, C. Analysis of vibration reduction effect of steel spring floating slab track with finite elements. J. Vib. Control 2016, 22, 1462–1471. [Google Scholar]
  28. Zou, C.; A Moore, J.; Sanayei, M.; Wang, Y.; Tao, Z. Efficient impedance model for the estimation of train-induced vibrations in over-track buildings. J. Vib. Control 2021, 27, 924–942. [Google Scholar]
  29. Jin, H.; Wang, H.; Li, Z.; Zhou, X. Vibration-reduction optimization of the point-supporting floating-slab track based on local resonance mechanism. J. Vib. Control 2023, 29, 1176–1190. [Google Scholar]
  30. Kong, G.; Sun, G.; Liu, H.; Li, J. Dynamic Response of Ballastless Track XCC Pile-Raft Foundation under Train Axle Loads. J. Test. Eval. 2021, 49, 1691–1704. [Google Scholar]
  31. Tao, Z.; Zhang, D.; Tu, D.; He, L.; Zou, C. Prediction of train-induced ground-borne vibration transmission considering parametric uncertainties. Probabilistic Eng. Mech. 2025, 76, 103731. [Google Scholar] [CrossRef]
  32. Li, X.; Chen, Y.; Zou, C.; Chen, Y. Train-induced vibration mitigation based on foundation improvement. J. Build. Eng. 2023, 76, 107106. [Google Scholar] [CrossRef]
  33. Xu, D.S.; Zhao, Y.M.; Liu, H.B.; Zhu, H.H. Deformation Monitoring of Metro Tunnel with a New Ultrasonic-Based System. Sensors 2017, 17, 1758. [Google Scholar] [CrossRef] [PubMed]
  34. Zhou, S.; He, C.; Guo, P.; Yu, F.; Di, H. Dynamic response of a segmented tunnel in saturated soil using a 2.5-D FE-BE methodology. Soil Dyn. Earthq. Eng. 2019, 120, 386–397. [Google Scholar]
  35. Deng, L.; Liu, W.; Liu, W.; Meng, M. Computation and analysis of evaluation indicators of environmental vibration induced by urban rail transit. Urban Rapid Rail Transit 2017, 30, 40–45. [Google Scholar]
  36. Li, X.; Zheng, B.; Chen, Y.; Zou, C. A hybrid methodology for estimating train-induced rigid foundation building vibrations. Constr. Build. Mater. 2025, 460, 139852. [Google Scholar] [CrossRef]
Figure 1. Map, and cross-sectional layouts of the experimental site. (a) Map of the test site; (b) Cross-sectional layout diagram.
Buildings 15 01091 g001
Figure 2. Experimental instruments. (a) JM3873 wireless vibration pickup; (b) Wireless gateway; (c) JM3873 wireless acquisition and analysis system.
Buildings 15 01091 g002
Figure 3. Instruments setup. (a) Wireless connection of the pickup; (b) Oscilloscope display.
Buildings 15 01091 g003
Figure 4. Layout of measuring points.
Buildings 15 01091 g004
Figure 5. Time-domain comparison of vehicle-induced vibration and background vibration at various distances from the subway station’s exterior wall. (a) Vertical, 15 m; (b) Horizontal, 15 m; (c) Vertical, 25 m; (d) Horizontal, 25 m; (e) Vertical, 35 m; (f) Horizontal, 35 m.
Buildings 15 01091 g005
Figure 6. Frequency-domain comparison of vehicle-induced vibration and background vibration at various distances from the exterior wall of the subway station. (a) Vertical, 15 m; (b) Horizontal, 15 m; (c) Vertical, 25 m; (d) Horizontal, 25 m; (e) Vertical, 35 m; (f) Horizontal, 35 m.
Buildings 15 01091 g006
Figure 7. Time-domain plot of vehicle-induced vibration in urban-bound and suburban-bound directions. (a) Vertical, Section 1; (b) Horizontal, Section 1; (c) Vertical, Section 2; (d) Horizontal, Section 2; (e) Vertical, Section 3; (f) Horizontal, Section 3.
Buildings 15 01091 g007
Figure 8. Frequency-domain plot of vehicle-induced vibration in urban-bound and suburban-bound directions. (a) Vertical, Section 1; (b) Horizontal, Section 1; (c) Vertical, Section 2; (d) Horizontal, Section 2; (e) Vertical, Section 3; (f) Horizontal, Section 3.
Buildings 15 01091 g008
Figure 9. Train-induced soil vibration acceleration in 1/3 octave bands in urban-bound and suburban-bound directions. (a) Vertical, Section 1; (b) Horizontal, Section 1; (c) Vertical, Section 2; (d) Horizontal, Section 2; (e) Vertical, Section 3; (f) Horizontal, Section 3.
Buildings 15 01091 g009
Figure 10. Complete time-domain plot of a train passing through the subway station. (a) Vertical, waveform 1; (b) Horizontal, waveform 1; (c) Vertical, waveform 2; (d) Horizontal, waveform 2.
Buildings 15 01091 g010
Figure 11. Complete time-domain plot of train entering the subway station. (a) Vertical; (b) Horizontal.
Buildings 15 01091 g011
Figure 12. Complete time-domain plot of a train exiting the subway station. (a) Vertical; (b) Horizontal.
Buildings 15 01091 g012
Figure 13. Time-domain plot of trains deceleration. (a) Vertical, Section 1; (b) Horizontal, Section 1; (c) Vertical, Section 2; (d) Horizontal, Section 2; (e) Vertical, Section 3; (f) Horizontal, Section 3.
Buildings 15 01091 g013
Figure 14. Time-domain plot of train acceleration. (a) Vertical, Section 1; (b) Horizontal, Section 1; (c) Vertical, Section 2; (d) Horizontal, Section 2; (e) Vertical, Section 3; (f) Horizontal, Section 3.
Buildings 15 01091 g014
Figure 15. Frequency spectrum plot of vibration induced by incoming trains. (a) Vertical, Section 1; (b) Horizontal, Section 1; (c) Vertical, Section 2; (d) Horizontal, Section 2; (e) Vertical, Section 3; (f) Horizontal, Section 3.
Buildings 15 01091 g015
Figure 16. Frequency spectrum plot of vibration induced by outgoing trains. (a) Vertical, Section 1; (b) Horizontal, Section 1; (c) Vertical, Section 2; (d) Horizontal, Section 2; (e) Vertical, Section 3; (f) Horizontal, Section 3.
Buildings 15 01091 g016
Figure 17. Train approach/departure vibration acceleration in 1/3 octave bands. (a) Vertical; (b) Horizontal.
Buildings 15 01091 g017
Figure 18. Train acceleration/deceleration vibration levels in 1/3 octave bands. (a) Vertical, Section 1; (b) Horizontal, Section 1; (c) Vertical, Section 2; (d) Horizontal, Section 2; (e) Vertical, Section 3; (f) Horizontal, Section 3.
Buildings 15 01091 g018
Figure 19. Time-domain plot for Section 1 at varying distances from the subway station wall. (a) Vertical; (b) Horizontal.
Buildings 15 01091 g019
Figure 20. The frequency-domain plot of Section 1 at different distances from the exterior wall of the subway station. (a) Vertical, K1; (b) Horizontal, K1; (c) Vertical, K2; (d) Horizontal, K2.
Buildings 15 01091 g020
Figure 21. Time-domain plot for Section 2 at various distances from the subway station wall. (a) Vertical; (b) Horizontal.
Buildings 15 01091 g021
Figure 22. The frequency-domain plot of Section 2 at different distances from the subway station’s exterior wall. (a) Vertical, B1; (b) Horizontal, B1; (c) Vertical, B2; (d) Horizontal, B2; (e) Vertical, B3; (f) Horizontal, B3; (g) Vertical, B4; (h) Horizontal, B4.
Buildings 15 01091 g022
Figure 23. Time-domain plot of Section 3 at different distances from the exterior wall of the subway station. (a) Vertical; (b) Horizontal.
Buildings 15 01091 g023
Figure 24. The frequency-domain plot of Section 3 at different distances from the exterior wall of the subway station. (a) Vertical, D1; (b) Horizontal, D1; (c) Vertical, D2; (d) Horizontal, D2; (e) Vertical, D3; (f) Horizontal, D3.
Buildings 15 01091 g024
Figure 25. Frequency spectrum plot of vehicle-induced vibration at different distances from Section 1, 2, and 3, respectively. (a) Vertical, Section 1; (b) Horizontal, Section 1; (c) Vertical, Section 2; (d) Horizontal, Section 2; (e) Vertical, Section 3; (f) Horizontal, Section 3.
Buildings 15 01091 g025
Figure 26. Acceleration levels of vibration in 1/3 octave bands at different distances from Sections 1, 2, and 3, respectively. (a) Vertical, Section 1; (b) Horizontal, Section 1; (c) Vertical, Section 2; (d) Horizontal, Section 2; (e) Vertical, Section 3; (f) Horizontal, Section 3.
Buildings 15 01091 g026
Table 1. Z-weighting factors for vibration acceleration at the center frequency of 1/3 octave bands, as specified in JGJ/T 170—2009.
1/3 Octave Center Frequency/HzWeighting Factor/dB1/3 Octave Center Frequency/HzWeighting Factor/dB
4031.5−8
5040−10
6.3050−12
8063−14
10080−17
12.5−1100−21
16−2125−25
20−4160−30
25−6200−36
Disclaimer/Publisher’s Note: The statements, opinions and data contained in all publications are solely those of the individual author(s) and contributor(s) and not of MDPI and/or the editor(s). MDPI and/or the editor(s) disclaim responsibility for any injury to people or property resulting from any ideas, methods, instructions or products referred to in the content.

